Carbon Policy Office Update - oregon.gov · How Does Cap Decline Over Time? 2035, 31.2 2021, 52.2...
24
Carbon Policy Office Update Carbon Policy Office Presented to the Joint Legislative Committee on Carbon Reduction December 13, 2018
-
Upload
truongtuyen -
Category
Documents
-
view
216 -
download
0
Transcript of Carbon Policy Office Update - oregon.gov · How Does Cap Decline Over Time? 2035, 31.2 2021, 52.2...

Carbon Policy Office Update Carbon Policy Office
Presented to the Joint Legislative Committee on Carbon Reduction
December 13, 2018

Background
• HB 5201 created the Carbon Policy Office to conduct research and analysis to inform a legislative proposal for an Oregon cap-and-trade program.
• We have engaged in a process of discovery with stakeholders; consulted with experts and jurisdictions experienced with carbon pricing; collaborated with agencies; and commissioned research.
• Our goal is to provide additional information and details regarding the design of a cap-and-trade program specific to Oregon that can achieve the state’s climate goals while continuing to grow our economy.
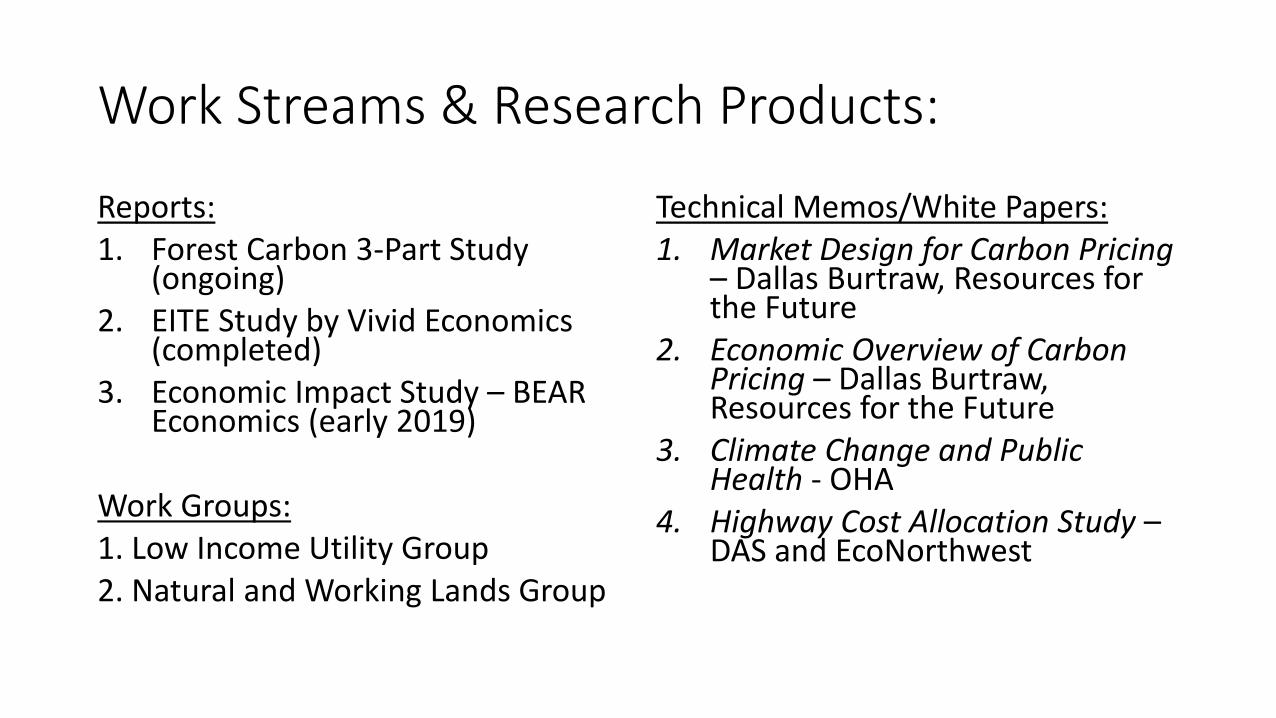
Work Streams & Research Products:
Reports: 1. Forest Carbon 3-Part Study
(ongoing)2. EITE Study by Vivid Economics
(completed) 3. Economic Impact Study – BEAR
Economics (early 2019)
Work Groups: 1. Low Income Utility Group 2. Natural and Working Lands Group
Technical Memos/White Papers:1. Market Design for Carbon Pricing
– Dallas Burtraw, Resources for the Future
2. Economic Overview of Carbon Pricing – Dallas Burtraw, Resources for the Future
3. Climate Change and Public Health - OHA
4. Highway Cost Allocation Study –DAS and EcoNorthwest
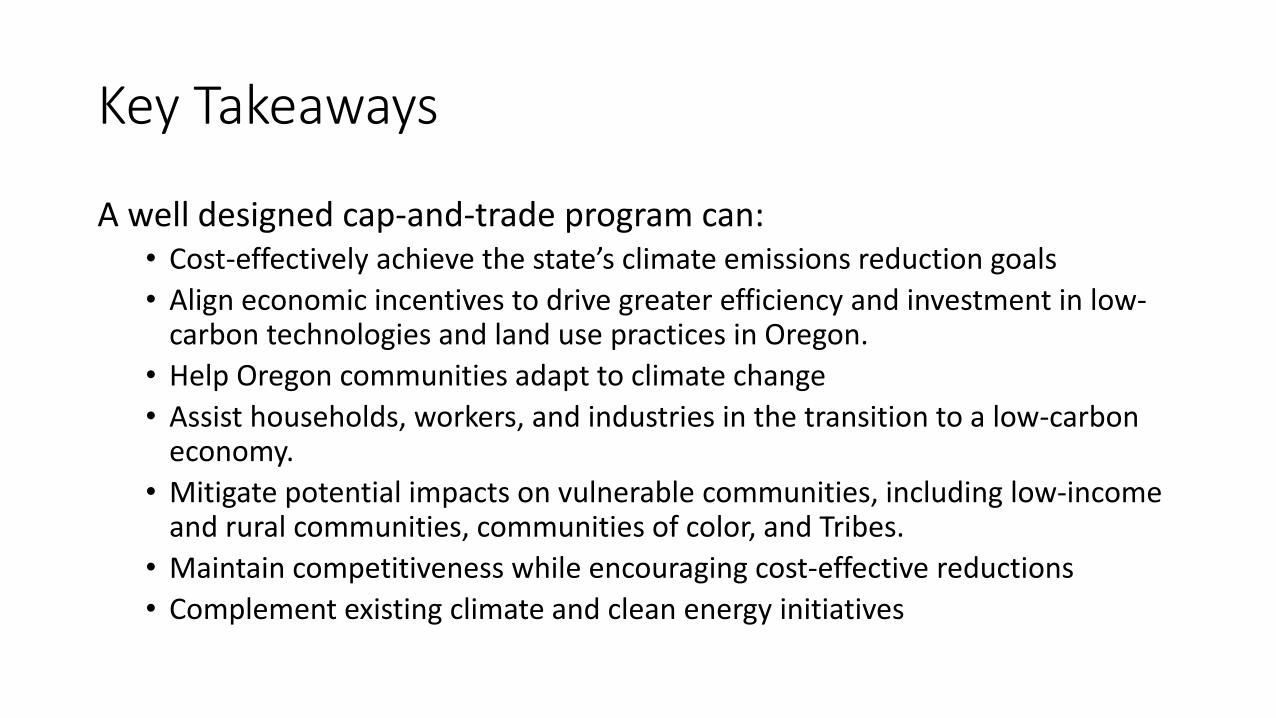
Key Takeaways
A well designed cap-and-trade program can: • Cost-effectively achieve the state’s climate emissions reduction goals
• Align economic incentives to drive greater efficiency and investment in low-carbon technologies and land use practices in Oregon.
• Help Oregon communities adapt to climate change
• Assist households, workers, and industries in the transition to a low-carbon economy.
• Mitigate potential impacts on vulnerable communities, including low-income and rural communities, communities of color, and Tribes.
• Maintain competitiveness while encouraging cost-effective reductions
• Complement existing climate and clean energy initiatives

Emissions Reduction Trends
64.9 million MTCO2e
Oregon Past and Projected Greenhouse Gas Emissions Compared to Goals
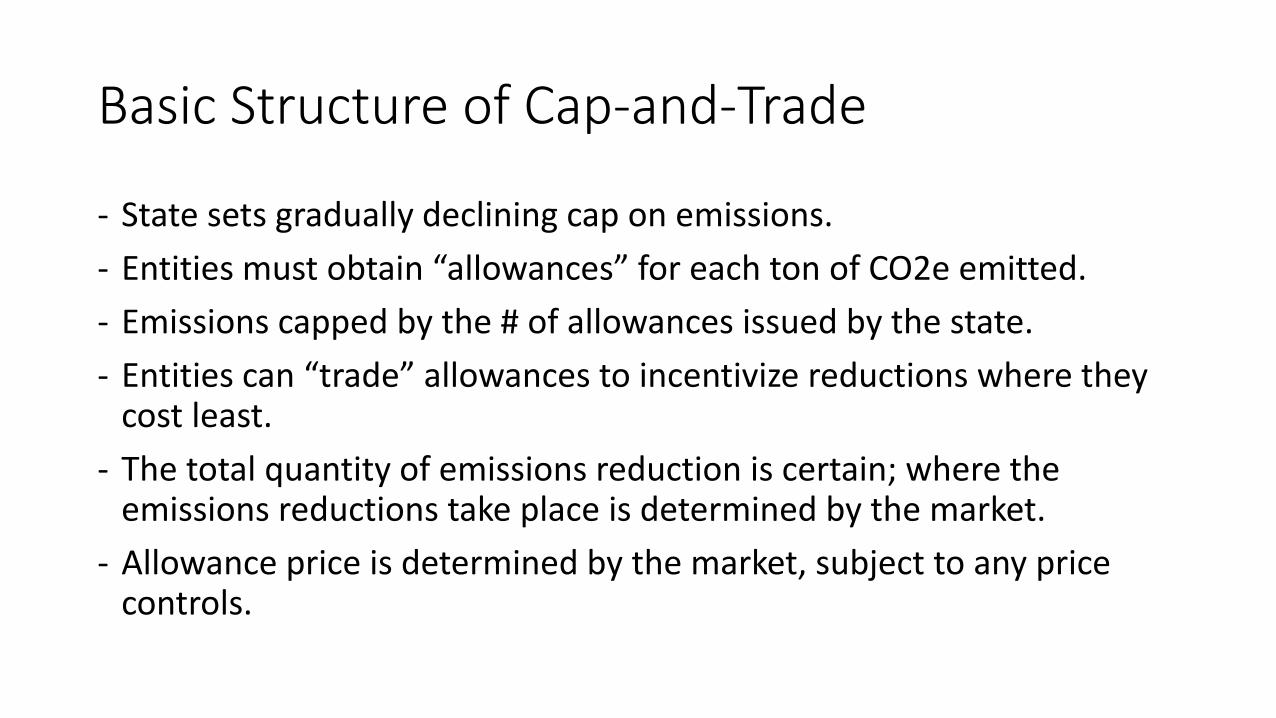
Basic Structure of Cap-and-Trade
- State sets gradually declining cap on emissions.
- Entities must obtain “allowances” for each ton of CO2e emitted.
- Emissions capped by the # of allowances issued by the state.
- Entities can “trade” allowances to incentivize reductions where they cost least.
- The total quantity of emissions reduction is certain; where the emissions reductions take place is determined by the market.
- Allowance price is determined by the market, subject to any price controls.

I. Establishing the Cap
1. What emissions are covered by the cap?
2. What is the point of regulation for each sector covered by the cap?
3. How does the cap decline over time?

Emissions Potentially Covered by Cap
Large Industrial Point Sources >25K 3.53
Other Fossil Fuels 4.24
Natural Gas Use 6.09
Electricity Generation
& Consumption
17.6
Transportation Fuels 20.73
Total (million MtCO2e) 52.19

Point of Regulation: Electricity
• In-state generators
• Entities that schedule imported power on the grid in Oregon:
- Investor Owned Utilities
- Energy Service Suppliers
- Bonneville Power Administration
- Large COUs purchasing power outside of BPA if >25K, or
entities that schedule that power for those large COUs.

Point of Regulation: Industry, Gas, Fuels
• Natural gas utilities for their residential and commercial sales customers (less emissions from directly regulated sources)
• Natural gas marketers for their commercial/industrial customers (less emissions from directly regulated sources)
• Large industrial sources > 25K regulated directly for both natural gas and process emissions
• Landfills >25K where emissions not otherwise captured to produce RNG or electricity
• Fuel suppliers at the point of import into Oregon.

How Does Cap Decline Over Time?
2035, 31.2
2021, 52.2
2035, 23.9 2050, 8.7
0
10
20
30
40
50
60
2021 2025 2030 2035 2040 2045 2050
An
nu
al a
llow
ance
bu
dge
t (m
illio
ns)
Paths to 2050 target
Straight decline to 2050 limit of 80% below 1990 2035 interim limit of 45% below 1990

II. The Carbon Market
An entity covered by the program must obtain and retire allowances equal to its reported emissions over a given compliance period.
- Acquire allowances issued by the state at state auction
- Acquire allowances from other entities in secondary market
- Receive a distribution of allowances from the state
Alternatively, the entity can acquire certified carbon offsets from projects in sectors outside of the cap for a portion of their compliance obligation.
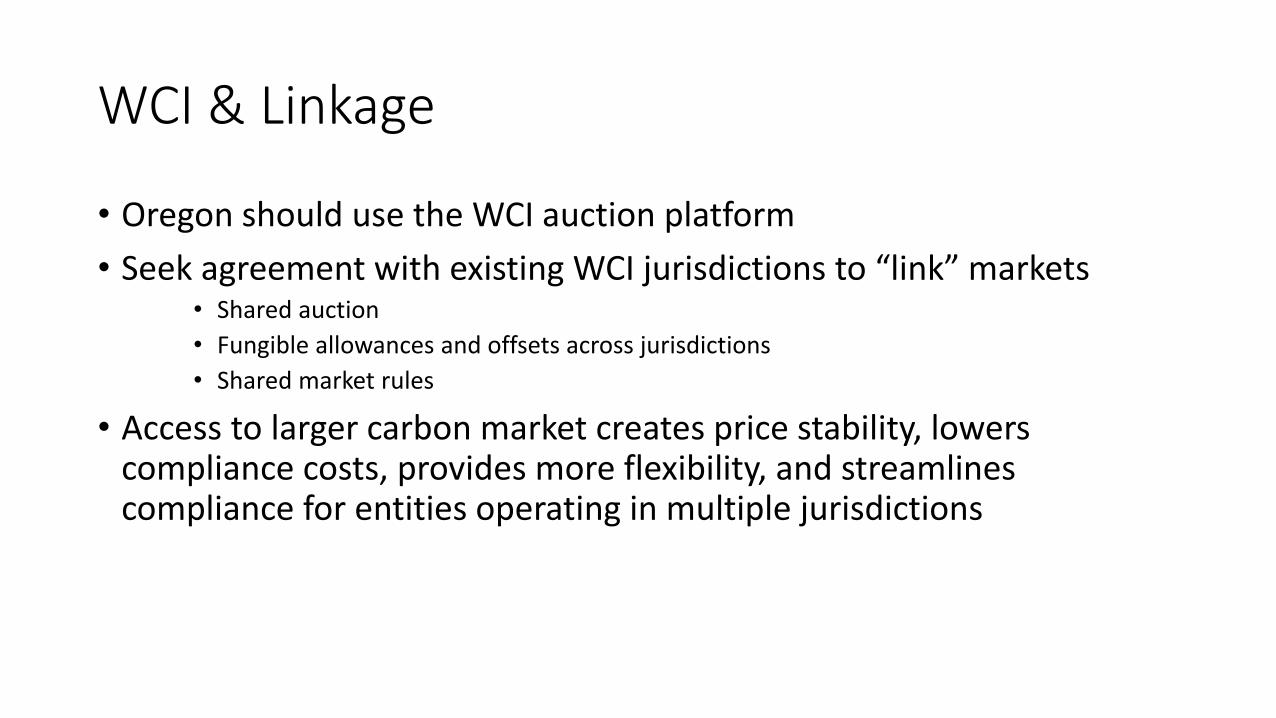
WCI & Linkage
• Oregon should use the WCI auction platform
• Seek agreement with existing WCI jurisdictions to “link” markets • Shared auction
• Fungible allowances and offsets across jurisdictions
• Shared market rules
• Access to larger carbon market creates price stability, lowers compliance costs, provides more flexibility, and streamlines compliance for entities operating in multiple jurisdictions
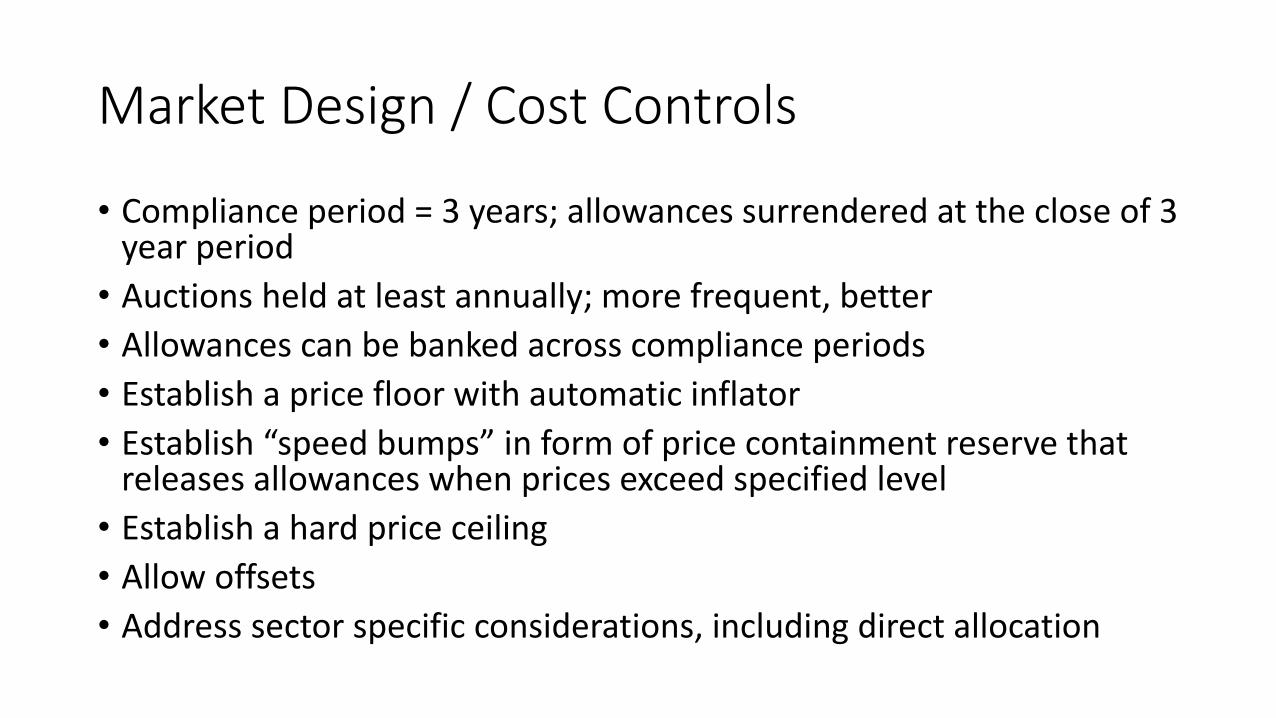
Market Design / Cost Controls
• Compliance period = 3 years; allowances surrendered at the close of 3 year period
• Auctions held at least annually; more frequent, better
• Allowances can be banked across compliance periods
• Establish a price floor with automatic inflator
• Establish “speed bumps” in form of price containment reserve that releases allowances when prices exceed specified level
• Establish a hard price ceiling
• Allow offsets
• Address sector specific considerations, including direct allocation

Offsets
• There is significant opportunity for offset projects in Oregon.
• Currently 19 certified projects selling into WCI or voluntary markets –roughly $84 million in revenue at current market prices to-date .
• Allow up to 8% of an entity’s compliance obligation to be met with certified offsets.
• Direct implementing agency to develop offset protocols subject to rigorous standards in consultation with the Environmental Justice Task Force, ODA, OWEB, and ODF.

Distribution of Allowance Value
Distribution of allowance value is a key design element; reflected in how allowances are initially distributed and how proceeds from auction are utilized.
Direct Distribution:
• Allowances can be distributed through auction or directly allocated.
• If directly allocated, an entity acquires an allowance without purchase, but still has an incentive to reduce emissions.
• Direct allocation of allowances does not affect the overall cap; only how entities acquire allowances under the cap.

Distribution of Allowance Value - Investment
• The value of allowances sold at auction can be distributed through direct investments or rebated to further programmatic aims.
• Allowance value can be returned to the economy via investments that further the program aims.
• The conversations in Oregon have focused on:
- Mitigation
- Adaptation
- Sequestration
- Assistance to households and businesses with a clean energy transition

3. Sector Specific Considerations – Electricity
To maintain affordable and competitive electricity rates:
- Maintain healthy hydropower system
- Drive electrification of transportation
- Provide clear signal for long term resource planning toward renewables, efficiency, storage
- Avoid duplication of costs with existing decarbonization efforts
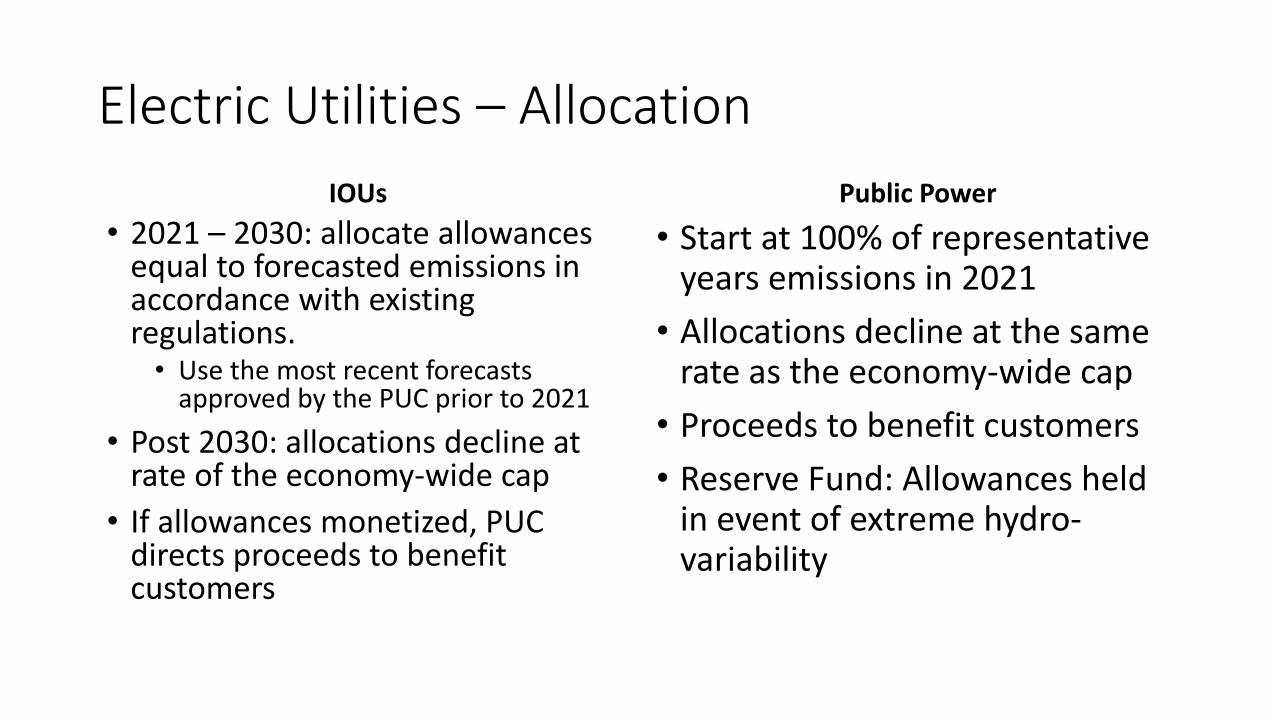
Electric Utilities – Allocation
IOUs
• 2021 – 2030: allocate allowances equal to forecasted emissions in accordance with existing regulations. • Use the most recent forecasts
approved by the PUC prior to 2021
• Post 2030: allocations decline at rate of the economy-wide cap
• If allowances monetized, PUC directs proceeds to benefit customers
Public Power
• Start at 100% of representative years emissions in 2021
• Allocations decline at the same rate as the economy-wide cap
• Proceeds to benefit customers
• Reserve Fund: Allowances held in event of extreme hydro-variability

Sector Specific Considerations – Natural Gas
Research and Conversations Suggest:
• Direct allocation for portion of natural gas residential customers; with direction to PUC to ensure benefits for low-income customers.
• Measures to decarbonize the natural gas grid; for example, addition of renewable natural gas.
• Early action credit for utility emissions reduction investments.
• Reserve some proceeds to be used for commercial and industrial energy efficiency.

Sector Specific Considerations -Manufacturing • HB 5201 called for a study of emissions intensity and leakage risk of
large industrial emitters with emissions >25K MtCO2e/year.
• The Oregon Sectoral Competitiveness Under Carbon Pricing Report.
• Oregon facilities in the following sectors were found to be at risk of leakage because they are emissions intensive, trade exposed (EITE):
• Cement• Pulp and Paper• Plywood and Wood Veneer• Food Manufacturing• Chemicals• Iron and Steel• Sawmills
• Gypsum• Glass• Mining• Plastics• Semiconductor manufacturing• Non-metallic mineral products

Allocation of Allowances to EITE Sectors
• The Oregon Sectoral Competitiveness under Carbon Pricing Report provided a detailed explanation of ways to approach allowance allocation to facilities in EITE sectors.
• For EITE facilities, the principal policy remedy for leakage risk is direct allocation of allowances.
• Allocation is typically based on a benchmark of emissions intensity per unit of output.
• Direct allocation can defray a portion of the costs from a carbon price and supports keeping the facility competitive, which supports the jobs and community economic impact of these facilities.
• Entities maintain incentives to reduce emissions even with direct allocation.
• Opt-in to EITE program for entities in EITE identified sectors that are below the 25K threshold.

Sector Specific Considerations -Transportation• Assume that proceeds from auction sales to transportation fuel
suppliers are legally designated to highway trust fund.
• Carbon proceeds within the highway trust fund should be invested in projects that reduce emissions or address adaptation in line with programmatic goals and trust fund limitations.
• Implementation of cap-and-trade should not interfere with HB 2017
• Need to consider the interactions with the highway trust fund and implications for cost-responsibility provisions of Constitution.

Next Steps:
Economic modeling:
• Modeling effort can examine different policy design options.
• Previous economic impact studies of carbon pricing in Oregon identified pathways for carbon pricing that could have neglible to positive economic impacts for the state economy.
Governance:
• Governor Brown proposed new Oregon Climate Authority to implement the cap-and-trade program.
• More conversation with Legislature to determine governance and implementation of the program.