CO2 abatement, competitiveness and leakage in the European ...

Carbon leakage:
beyond competitiveness
Philippe Quirion(CIRED and Öko-Institut)
Berlin Seminar on Energy and Climate Policy 2 July 2010

Synthesis
• The heavy industry (and policy-makers?) view: – Unilateral climate policy (in the EU, US or Annex I)
would reduce industry competitiveness, hence create leakage
• My conclusions:– Influence of Annex I climate policies on non-Annex I
emissions not to be neglected
– Competitiveness not biggest leakage channel
– Net leakage may well be negative (positive spillovers)
– Leakage & spillovers depend on climate policy design

Outline
1. Competitiveness and leakage: definitions
2. How to minimise leakage & maximise positive spillovers
3. CCS & leakage: a CGE simulation
4. A significant leakage from coal?

1. Competitiveness and leakage:
definitions

1. Competitiveness and carbon leakage:
definitions (1)
• Carbon leakage: increase in emissions in the rest of the world following a climate policy in a part of the world (e.g. the EU), compared to a reference situation without climate policy
• Leakage ratio or (better) leakage-to-reduction ratio:
• Literature reviews by Gerlagh and Kuik (2007) & Dröge et al. (2009):
2% to 23%, plus one outlier (Babiker, 2005): >100%
RoW UEE E∆ −∆
5

1. Competitiveness and carbon leakage:
definitions (2)
• For a sector or a firm, “competitiveness” has 2 main meanings (Alexeeva-Talebi et al., 2007) :– ability to sell � net imports (imports – exports) or variants (revealed
comparative advantage…) � problem for workers + leakage
– ability to earn � profits, firm value � problem for shareholders
Approbation of Rhodia CDM project
in Korea
“[...] operating rates for the last three months of 2008 will fall by between 30 and 50 % in the US and Europe [...]. Meanwhile, factories in Asia and Brazil, four of which will earn carbon credits, will keep production rates of above 80 % of capacity. "
Andrew Allan, "Carbon credits linked to product dumping", Point Carbon, 20 Nov 2008
6

Competitiveness and leakage:
related but different
Competitiveness as ability to earn
Competitiveness as ability to sell
Carbon leakage, competitiveness
channel
Carbon leakage, int’l fossil fuel price channel
Carbon leakageCompetitiveness
Carbon leakage, int’l
GHG-saving goods price channel

2. How to minimise leakage &
maximise positive spillovers?
8

Options likely to generate leakage
• CDM in manufacture of internationally traded goods
• Imports of biofuels, imports of steel and aluminium scrap
• Coal-to gas switch

Options likely to generate spillovers
• Technical progress in GHG-saving techniques– Gerlagh & Kuik (2007): technology spillovers likely > leakage
• Examples of successful climate policies– E.g. European energy-efficiency label (A-G)
• Taxes on consumption of GHG-intensive goods– Similar to border adjustments
• Taxes on domestic extraction of fossil fuels– Reduces greatly the cost of climate policies in Annex I (Light, Kolstad &
Rutherford, 1999)
• Limits on domestic extraction of fossil fuels– Offshore drilling, tar sands...
• Sectoral crediting mechanism – Especially if intensity targets for power generation in DCs (Hamdi-Cherif,
Guivarch and Quirion, Climate Policy, forthcoming)
• CCS (energy penalty ~ 8%)

3. CCS & leakage: a CGE simulation
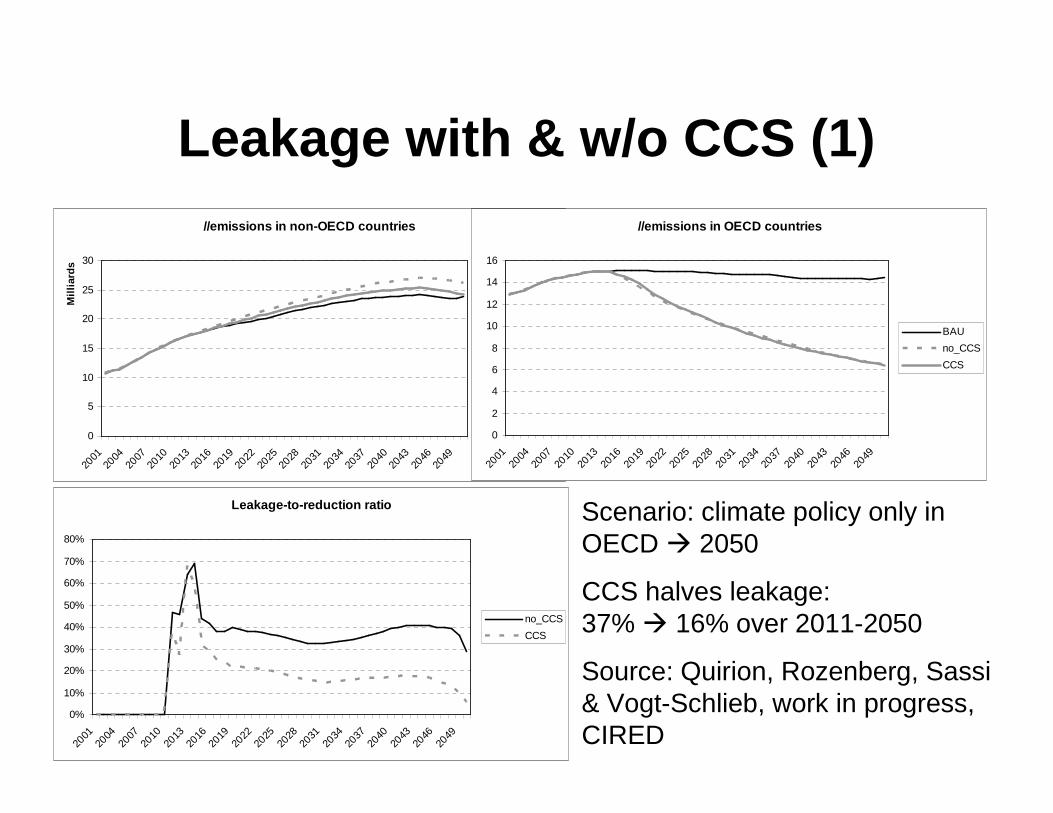
Leakage with & w/o CCS (1)
Scenario: climate policy only in OECD � 2050
CCS halves leakage: 37% � 16% over 2011-2050
Source: Quirion, Rozenberg, Sassi & Vogt-Schlieb, work in progress, CIRED
//emissions in non-OECD countries
0
5
10
15
20
25
30
2001
2004
2007
2010
2013
2016
2019
2022
2025
2028
2031
2034
2037
2040
2043
2046
2049
Mil
liar
ds
BAU
no_CCS
CCS
Leakage-to-reduction ratio
0%
10%
20%
30%
40%
50%
60%
70%
80%
2001
2004
2007
2010
2013
2016
2019
2022
2025
2028
2031
2034
2037
2040
2043
2046
2049
no_CCS
CCS
//emissions in OECD countries
0
2
4
6
8
10
12
14
16
2001
2004
2007
2010
2013
2016
2019
2022
2025
2028
2031
2034
2037
2040
2043
2046
2049
BAU
no_CCS
CCS

Leakage with & w/o CCS (2)
//OECD cost of emission reduction 10^9$2001
-600
-400
-200
0
200
400
600
800
1000
1200
2001
2004
2007
2010
2013
2016
2019
2022
2025
2028
2031
2034
2037
2040
2043
2046
2049
no_CCS
CCS
//carbon price $/tCO2
0
100
200
300
400
500
600
2001
2004
2007
2010
2013
2016
2019
2022
2025
2028
2031
2034
2037
2040
2043
2046
2049
BAU
no_CCS
CCS
//coal production
0
500
1000
1500
2000
2500
3000
3500
4000
4500
5000
2001
2004
2007
2010
2013
2016
2019
2022
2025
2028
2031
2034
2037
2040
2043
2046
2049
BAU
no_CCS
CCS
//coal price
0
50
100
150
200
250
2001
2004
2007
2010
2013
2016
2019
2022
2025
2028
2031
2034
2037
2040
2043
2046
2049
BAU
no_CCS
CCS

4. A significant leakage from coal?

Leakage depends on supply elasticity and substituability
• Light, Kolstad and Rutherford (1999): « a reasonable range for the coal supply elasticity is between 0.4 and 2.0 »
• International trade in coal = 16% of global production � low Armington elasticity unlikely
• A fresh (and naive) look at the supply elasticity

• Data: Edis (2010). Cost curves produced by several energy analyst groups which have estimates of cost structure for each individual coal mine:– Wood Mackenzie
(http://www.woodmacresearch.com)– AME Mineral Economics
(http://www.ame.com.au)
• Result of simple polynomial fits: Pacific-basin coal supply elasticity > 1 & < 8
• Supply elasticity increases with abatement
• Are models supply elasticity in this range?
55 60 65 70 75 80$�t
2
4
6
8
�
A fresh (and naive) look at the supply
elasticity

• Gerlagh and Kuik (2007, p. 9) – LR: leakage rate – psy: supply elasticity
of fossil fuels – ve: Armington
elasticity of energy goods
• Most models do not seem to overestimate leakage from coal price channel

Conclusions
• If the EU is serious about leakage, it should:– Take into account the other leakage channels,
beyond competitiveness
– Maximise spillovers from climate policies
• CCS reduces leakage greatly... but has many other pros and cons, possibly more important!

References• Alexeeva-Talebi, V., C. Böhringer and U. Moslener, 2007. Climate and
competitiveness: an economic impact assessment of EU leadership in emission control policies. Mannheim, ZEW.
• Babiker, M.H., 2005. "Climate change policy, market structure, and carbon leakage" Journal of International Economics 65: 421-445.
• Dröge, S., 2009. Tackling Leakage in a World of Unequal Carbon Prices. Climate Strategies.
• Edis, T., 2010. Restructuring the Australian economy to emit less carbon. Grattan Institute, May. Climate Strategies workshop, Berlin, 18 May.
• Gerlagh, R. and O. Kuik, 2007. Carbon Leakage with International Technology Spillovers. FEEM Nota Di Lavoro 33.2007.
• Hamdi-Cherif, M., C. Guivarch and P. Quirion, 2010. Sectoral targets for developing countries: Combining "Common but differentiated responsibilities" with "Meaningful participation", forthcoming in Climate Policy.
• Light, M.K., C.D. Kolstad and T.F. Rutherford, 1999. Coal Markets, Carbon Leakage and the Kyoto Protocol. Working Paper No. 99-23. Center for Economic Analysis. University of Colorado at Boulder.
• Quirion, P., Climate Change Policies, Competitiveness and Leakage. in Cerdá, E. and Labandeira, X. (eds.), 2010. Climate Change Policies: Global Challenges and Future Prospects. Edward Elgar