
Capitalizing on Machine Reading to Engage Bigger Data
103
Capitalizing on Machine Reading to Engage “Big(ger) Data” FOUR USE CASES FROM HIGHER ED Summer Institute on Distance Learning and Instructional Technology (SIDLIT 2016) August 4 - 5, 2016
-
Upload
shalin-hai-jew -
Category
Data & Analytics
-
view
294 -
download
0
Transcript of Capitalizing on Machine Reading to Engage Bigger Data

Capitalizing on Machine Reading to Engage “Big(ger) Data”FOUR USE CASES FROM HIGHER ED
Summer Institute on Distance Learning and Instructional Technology (SIDLIT 2016)August 4 - 5, 2016
OverviewWhat are some ways to select, say, 200 research articles to “close read” from a set of 2,000 PDF articles* gleaned from library databases and Google Scholar? How can a researcher make sense of a trending issue in the flood of Tweets and RT based on a particular hashtag (#) or keyword search or an especially lively Tweetstream based on a particular social media account? People are dealing with ever more prodigious amounts of information—from a number of sources. Those who are savvy to the uses of computers to aid their reading (through “distant reading” or “not-reading”) may find that they are able to cover much more ground. This presentation introduces the use of NVivo 11 Plus (matrix queries, word frequency counts, text searches and dendrograms, cluster analyses, topic modeling, and others) for multiple cases of distant reading to aid in academic and research work.
*Note: In NVivo 11 Plus, it seems easier to process .docx and .txt textual data than .PDF, so some file transcoding may be necessary for smoother processing.
2
Presentation Topic Headings What is Big(ger) Data?
What is Machine Reading?
Some Machine Reading Sequences
Four “Use Cases” from Higher Education ◦ Use Case #1: Topic Modeling and Article Histograms (latent structure in documents and document sets)◦ Use Case #2: Engaging with Social Media (Microblogging and Social Network) Data ◦ Use Case #3: Exploring Manual and Machine Coding ◦ Use Case #4: Machine Reading for Sentiment Analysis
3
What is Big(ger) Data?
4
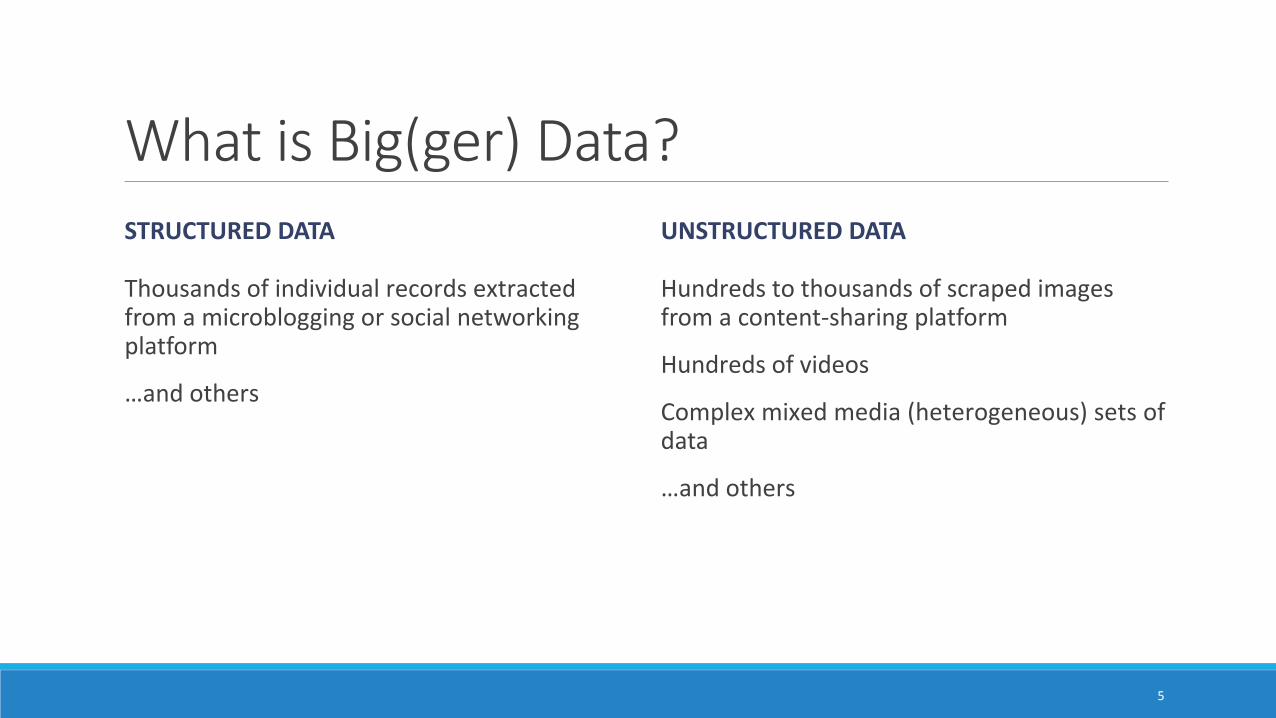
What is Big(ger) Data? STRUCTURED DATA
Thousands of individual records extracted from a microblogging or social networking platform
…and others
UNSTRUCTURED DATA
Hundreds to thousands of scraped images from a content-sharing platform
Hundreds of videos
Complex mixed media (heterogeneous) sets of data
…and others
5
Where Does the “Bigger Data” Come From?Social media platforms (crowd-sourced encyclopedias, social networking sites, microblogging sites, blogging sites, image sharing sites, video sharing sites, email sites, collaborative work sites, and others)
Databases of published contents
World Wide Web (WWW) and Internet
Synthetic data from various software tools or sites or other processes,
…and others
6

What is Machine Reading?
7

What is Machine Reading? Use of computers to decode text (which generally was created from natural language processes)◦ Also sometimes called “distant reading” (Moretti, 2000) or “not-reading”
Capturing of quantitative measures of a text ◦ Reliable and consistent, reproducible / repeatable ◦ Patterned ◦ May be generalizable and transferable to other contexts
8
What is Machine Reading? (cont.)
Some common types of machine-based text analytics include the following: ◦ Linguistic analysis (based on word counts of function words, punctuation, and other parts of written
and spoken language) ◦ Style / stylometry◦ Sentiment analysis ◦ Emotion analysis◦ Cognitive analysis ◦ Social standing analysis ◦ Deception analysis, and others
9
What is Machine Reading? (cont.)
◦ Word frequency counts (and resulting word clouds) ◦ Word searches (and resulting word trees) ◦ Word network analysis (and resulting network graphs) ◦ Word similarity clustering (and resulting 2D and 3D word clusters) ◦ Word proximity clustering (and resulting 2D and 3D word clusters) ◦ Topic modeling or theme/subtheme extraction through unsupervised machine learning
10
A Brief History of Machine Reading Technologies originated in 1960s ◦ Assistive technology track (Haskins Laboratories, 1970s; Kurzweil Computer Products, 1975; and others)◦ Natural language processing track (Bobrow, 1964; Weizenbaum, 1965; Schank, 1969; Woods, 1970;
Winograd, 1971; Hendrix, 1982; and others)
Recently ◦ applied to Web and Internet scale texts ◦ popularizing to individual academic researcher-level applications
11
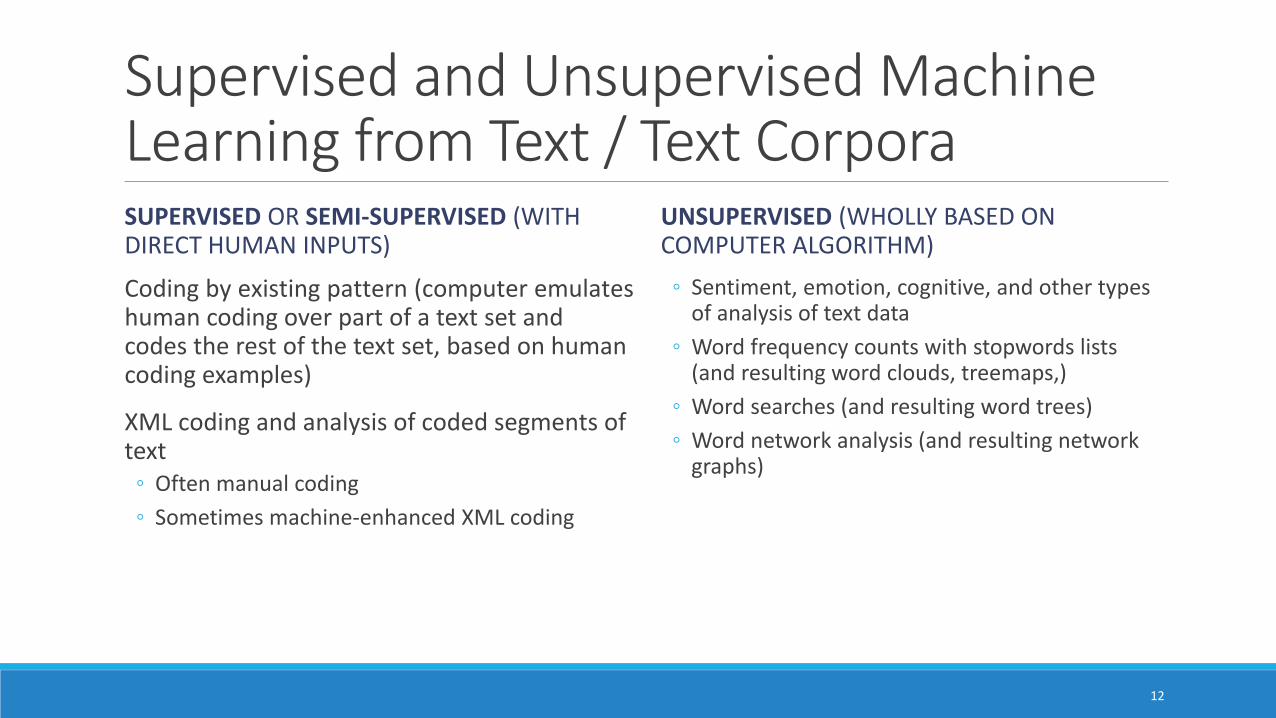
Supervised and Unsupervised Machine Learning from Text / Text Corpora SUPERVISED OR SEMI-SUPERVISED (WITH DIRECT HUMAN INPUTS)
Coding by existing pattern (computer emulates human coding over part of a text set and codes the rest of the text set, based on human coding examples)
XML coding and analysis of coded segments of text ◦ Often manual coding ◦ Sometimes machine-enhanced XML coding
UNSUPERVISED (WHOLLY BASED ON COMPUTER ALGORITHM) ◦ Sentiment, emotion, cognitive, and other types
of analysis of text data ◦ Word frequency counts with stopwords lists
(and resulting word clouds, treemaps,) ◦ Word searches (and resulting word trees) ◦ Word network analysis (and resulting network
graphs)
12
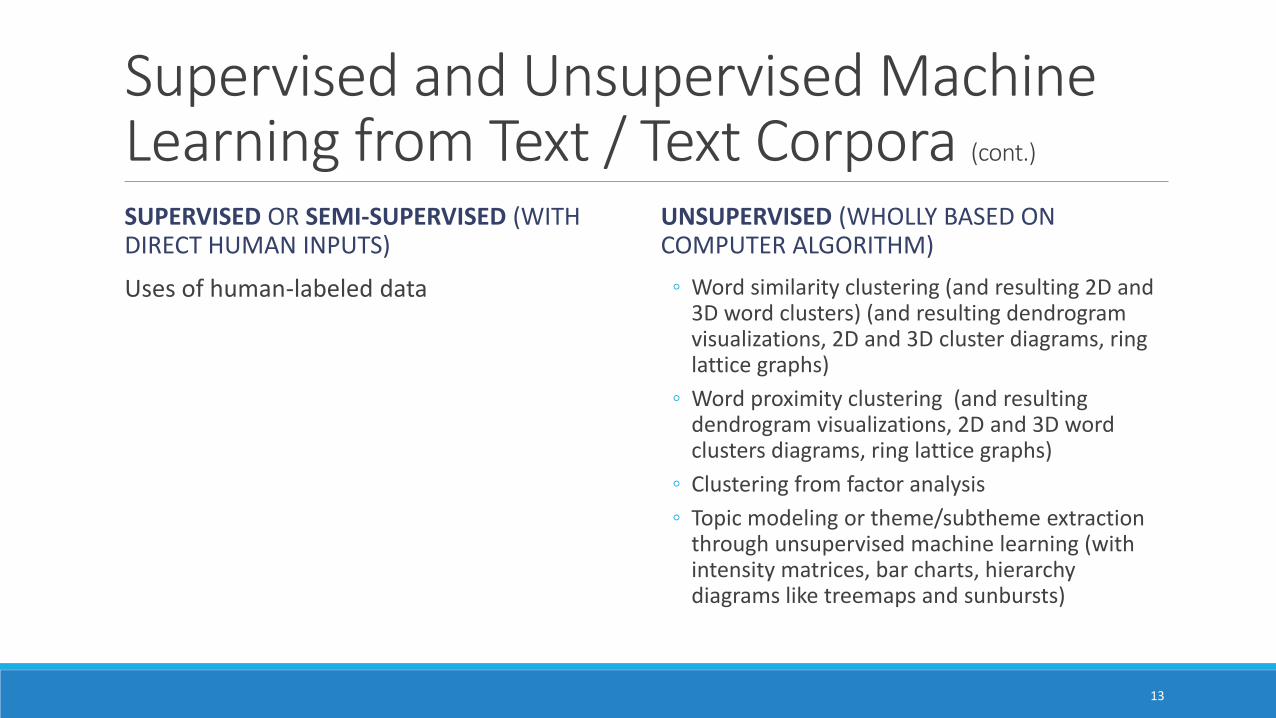
Supervised and Unsupervised Machine Learning from Text / Text Corpora (cont.)
SUPERVISED OR SEMI-SUPERVISED (WITH DIRECT HUMAN INPUTS)
Uses of human-labeled data
UNSUPERVISED (WHOLLY BASED ON COMPUTER ALGORITHM) ◦ Word similarity clustering (and resulting 2D and
3D word clusters) (and resulting dendrogramvisualizations, 2D and 3D cluster diagrams, ring lattice graphs)
◦ Word proximity clustering (and resulting dendrogram visualizations, 2D and 3D word clusters diagrams, ring lattice graphs)
◦ Clustering from factor analysis ◦ Topic modeling or theme/subtheme extraction
through unsupervised machine learning (with intensity matrices, bar charts, hierarchy diagrams like treemaps and sunbursts)
13
Supervised and Unsupervised Machine Learning from Text / Text Corpora (cont.)
All with extracted data tables (from which data visualizations are created)
All with extracted word lists (from which data visualizations are created)
14
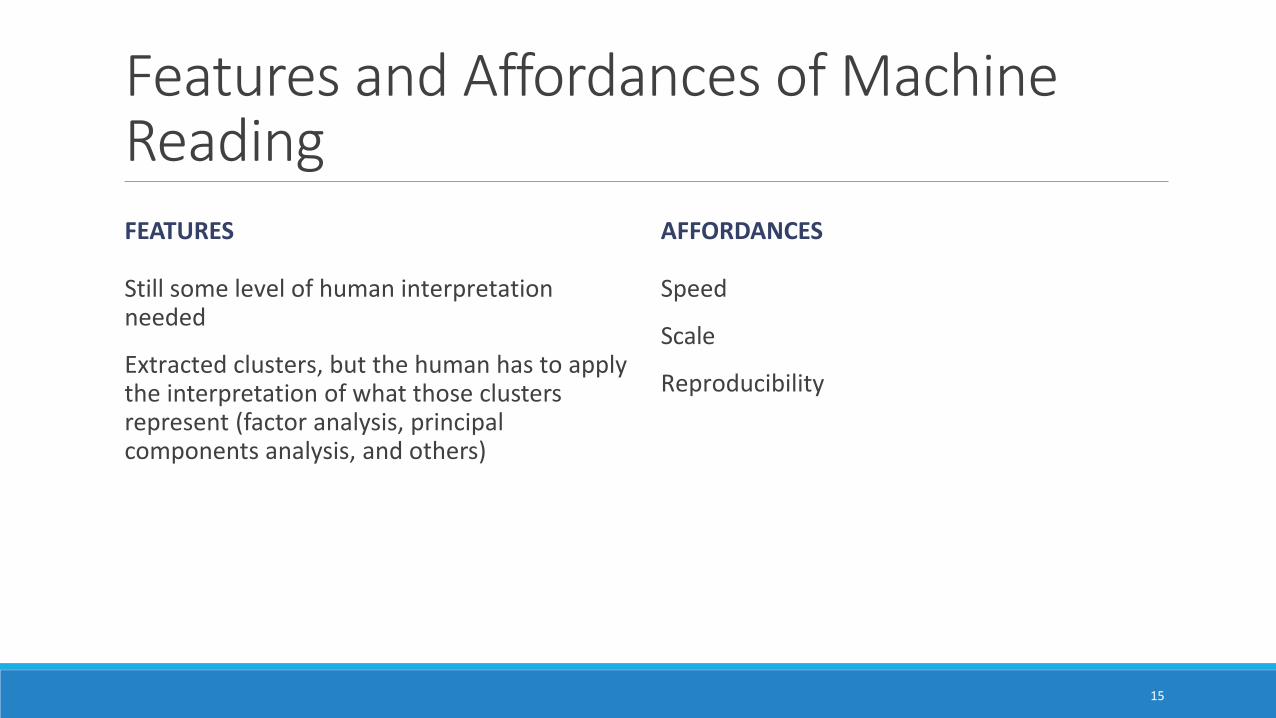
Features and Affordances of Machine Reading FEATURES
Still some level of human interpretation needed
Extracted clusters, but the human has to apply the interpretation of what those clusters represent (factor analysis, principal components analysis, and others)
AFFORDANCES
Speed
Scale
Reproducibility
15
Under the Hood… Bag of words (parsing: removal of punctuation, breaking writing apart into words) vs. structure and context-preserving methods
Sliding “windows” for co-occurrence and proximity captures
Languages are fairly predictably structured, so statistical methods and counting can be applied based on those patterns
Matrices are a common tool to capture relationships between words and parts of a text and documents; all relational matrices may be re-visualized as network graphs and other types of data visualizations
Pre-coded word sets or dictionaries are often used for sentiment analysis, emotion analysis, and the extraction of psychometric features
16
Under the Hood… (cont.)
Often a sequence of algorithmic procedures (and often black box except for the few software makers who are highly focused on documenting accurately)
17
Some Software and Capabilities Linguistic Inquiry and Word Count (LIWC2015): application of psychometrics and other constructs across over 100 dimensions; two-plus decades of empirical, lab, and other research; dictionaries available in multiple languages; customized dictionaries may be applied
AutoMap and NetScenes: extraction of content networks, and others (http://www.casos.cs.cmu.edu/projects/automap/)
Coh-Metrix (http://cohmetrix.com/)
DICTION (http://www.dictionsoftware.com/)
Latent Semantic Analysis @ CU Boulder (http://lsa.colorado.edu/)
(The presenter has only tried the top two. MS Word has a brief lexical element which enables the extraction of readability statistics based on the Flesch Reading Ease test and the Flesch-Kincaid Grade Level test.)
18
NVivo 11 PlusPrimary focus: Qualitative research data analysis suite ◦ Digital data curation ◦ Manual coding ◦ Data queries ◦ Auto coding ◦ Data visualizations, and others
Some built-in data analytics tools that enable machine reading of texts
This presentation will only focus on this particular tool for the use cases.
19
Some Machine Reading Sequences
20
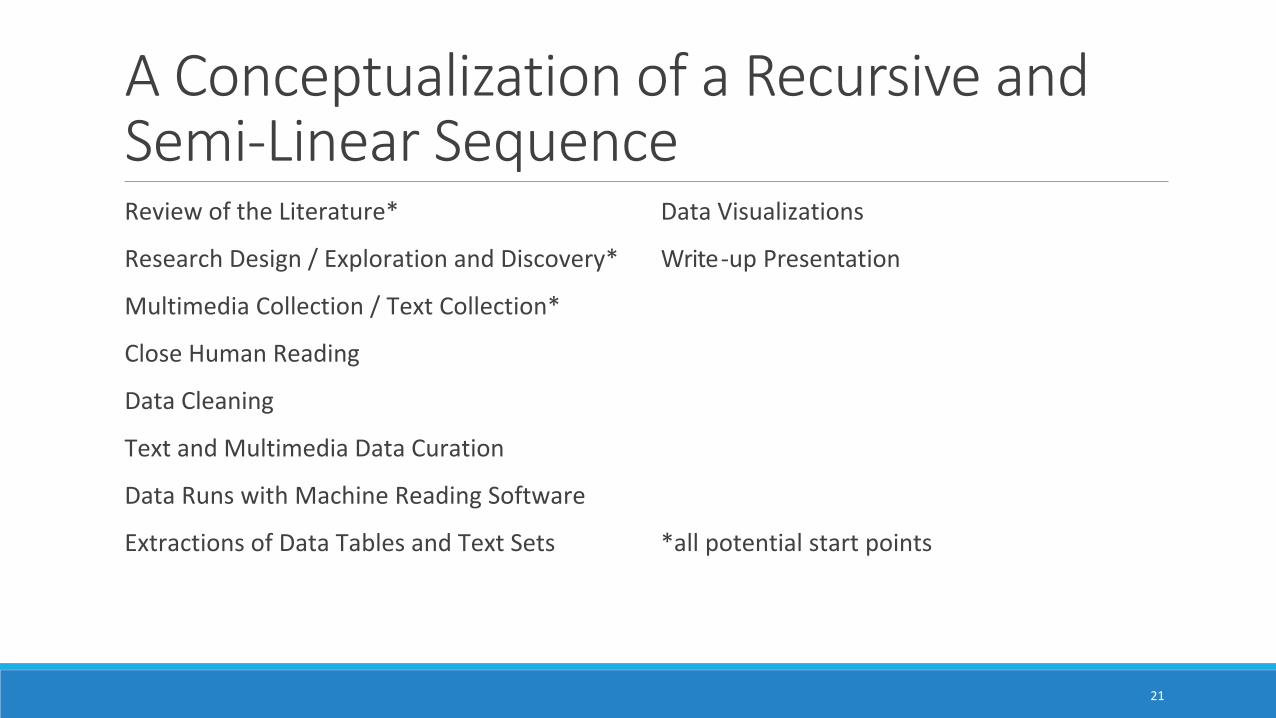
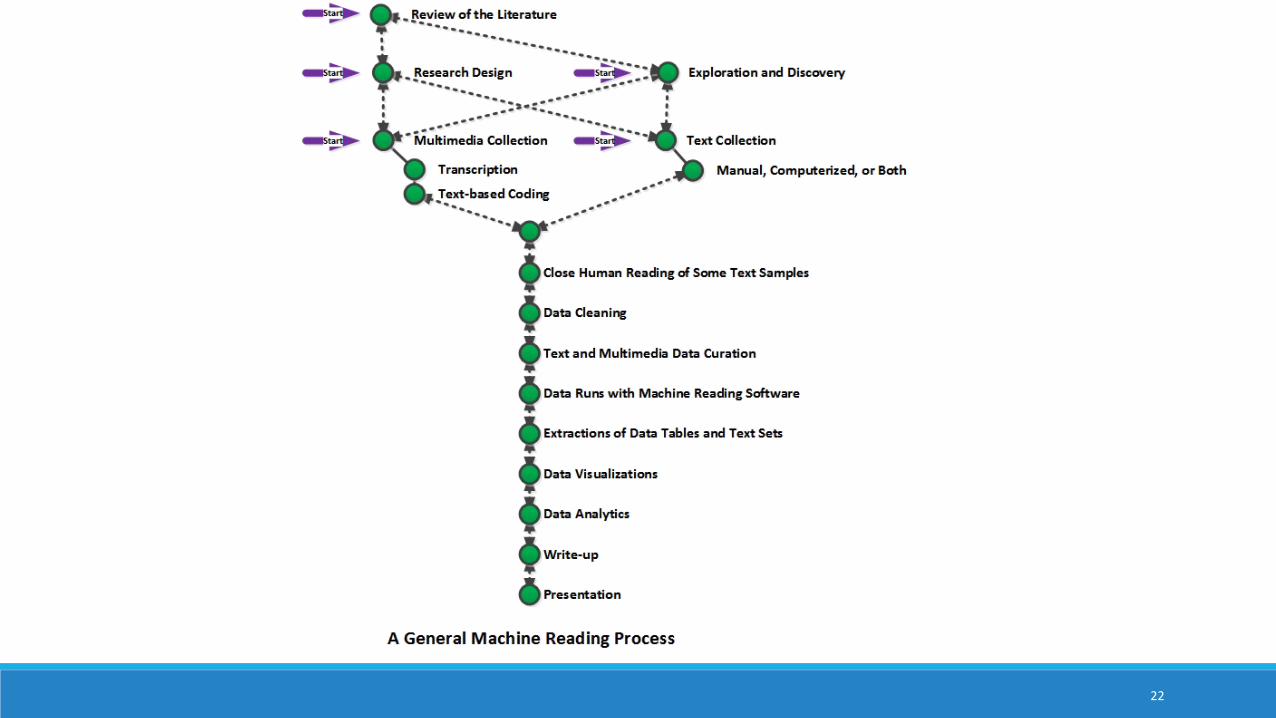
A Conceptualization of a Recursive and Semi-Linear SequenceReview of the Literature*
Research Design / Exploration and Discovery*
Multimedia Collection / Text Collection*
Close Human Reading
Data Cleaning
Text and Multimedia Data Curation
Data Runs with Machine Reading Software
Extractions of Data Tables and Text Sets
Data Visualizations
Write-up Presentation
*all potential start points
21
22
Power in Combinations and in SequencesMany points-of-entry to machine reading
Ranges of tactics and strategies and capabilities based on available texts, various software tools, and researcher capabilities
Text processing is sensitive to sequential time, so it is important to be very clear about what is happening at each processing phase (and how the data changes) ◦ Need clear documentation of what changes happened in each step
23
Why Text? May be human-collected data sets, sometimes computer program-scraped data sets, or a mix
Text of various types based on conventions
Text as a lowest common denominator in terms of multimedia objects (images, audio, video, and others)
24
Text Curation and Data Cleaning Selection of texts to include and those to exclude
Consistent and informative file naming protocols
Rendering of multimedia files to searchable text ones
Ensuring texts are machine readable ◦ Rendering of texts to searchability
De-duplication of files
Normalizing textual data, and others
25
26
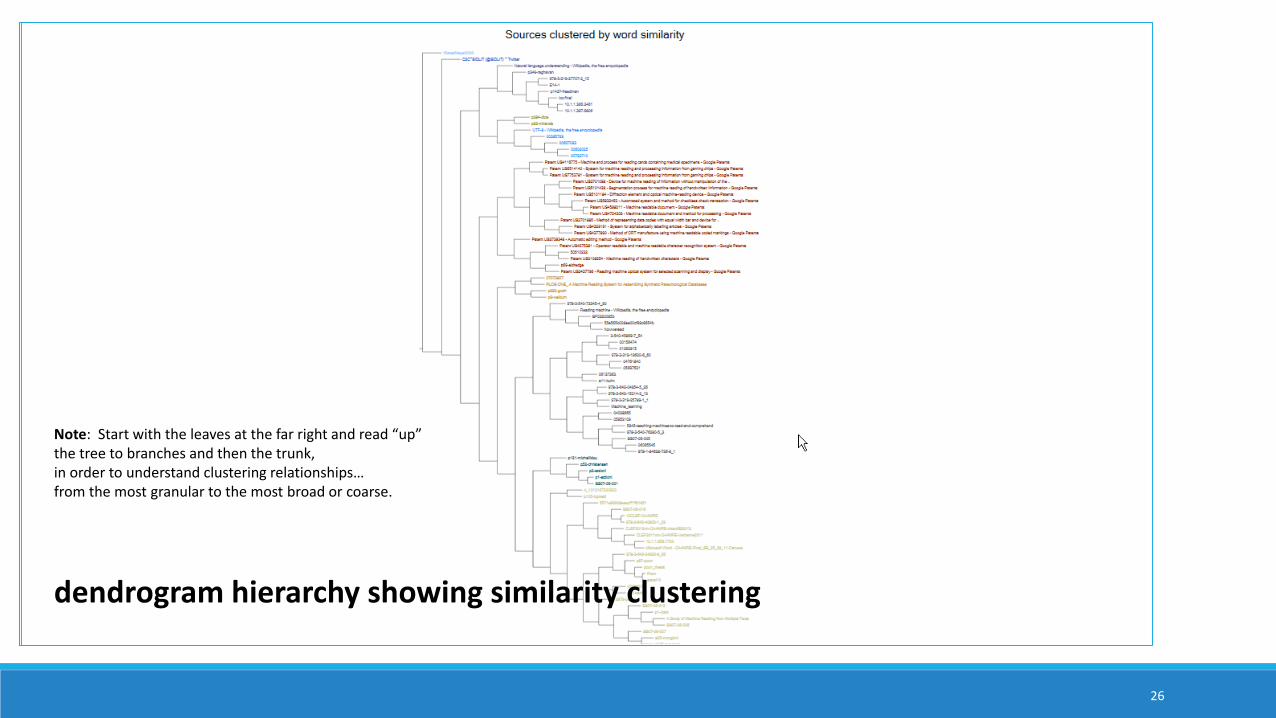
dendrogram hierarchy showing similarity clustering
Note: Start with the leaves at the far right and read “up” the tree to branches and then the trunk, in order to understand clustering relationships…from the most granular to the most broad or coarse.
27
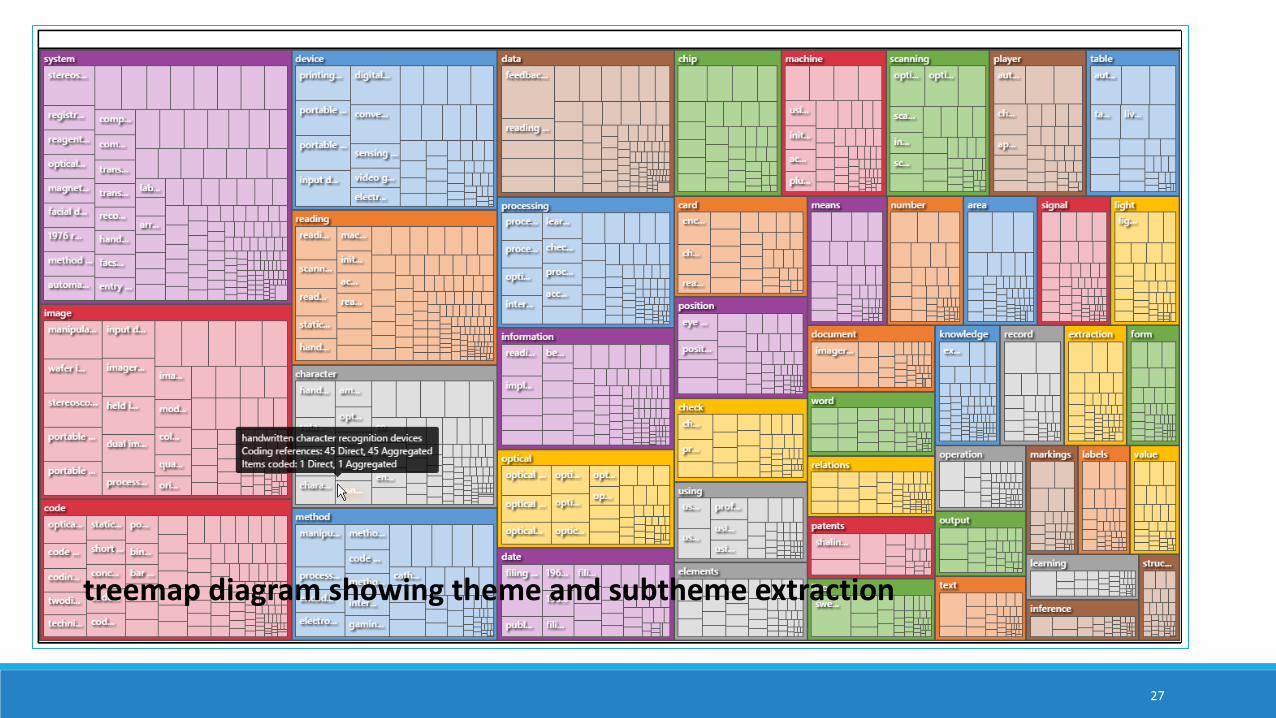
treemap diagram showing theme and subtheme extraction
28
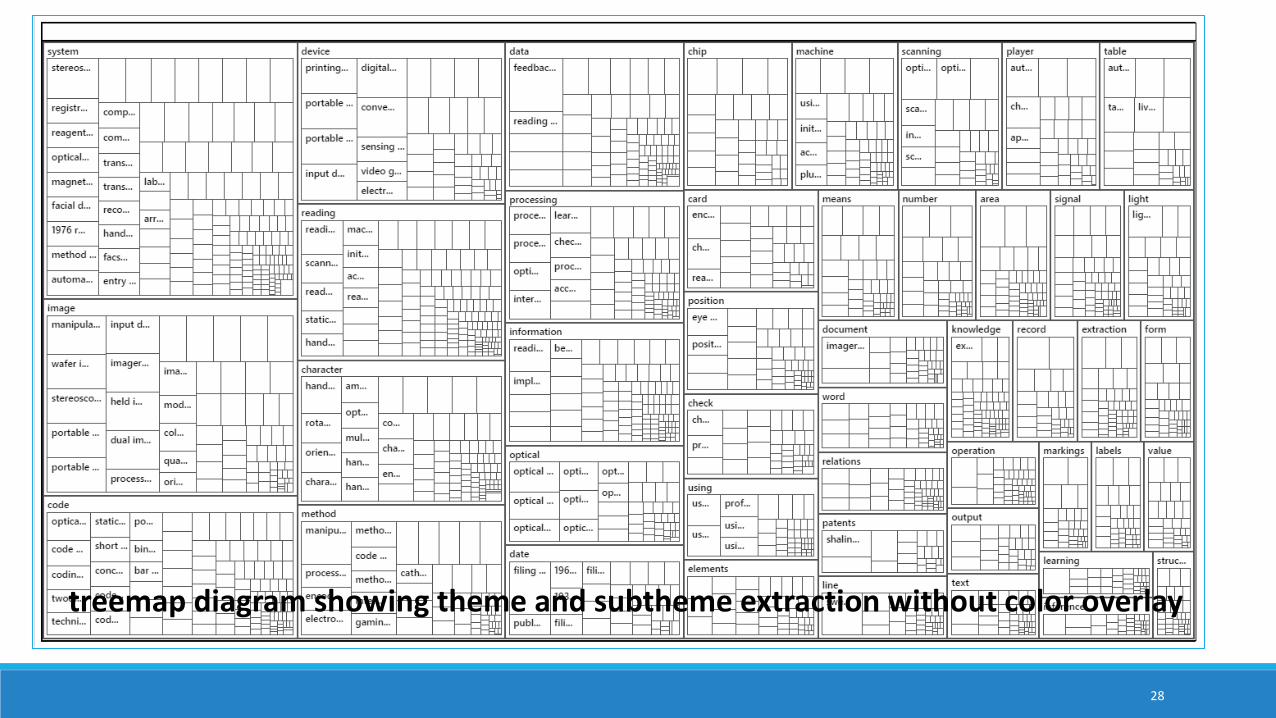
treemap diagram showing theme and subtheme extraction without color overlay
29
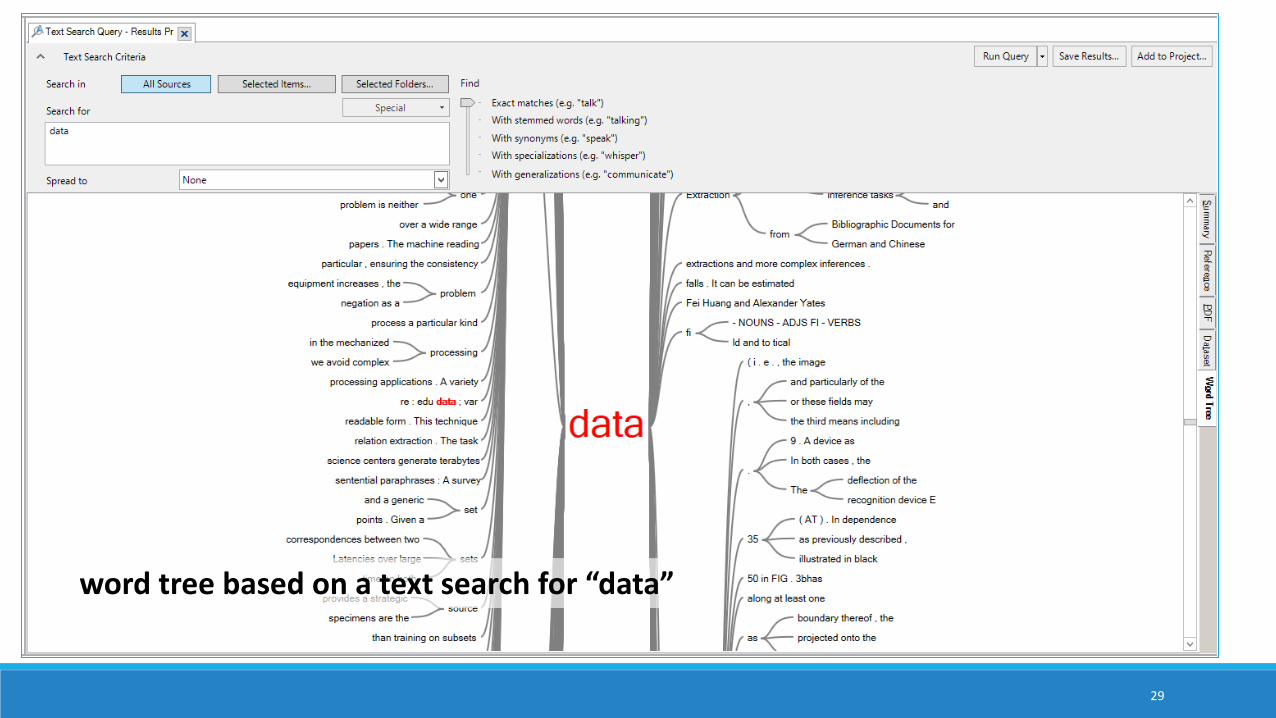
word tree based on a text search for “data”
30
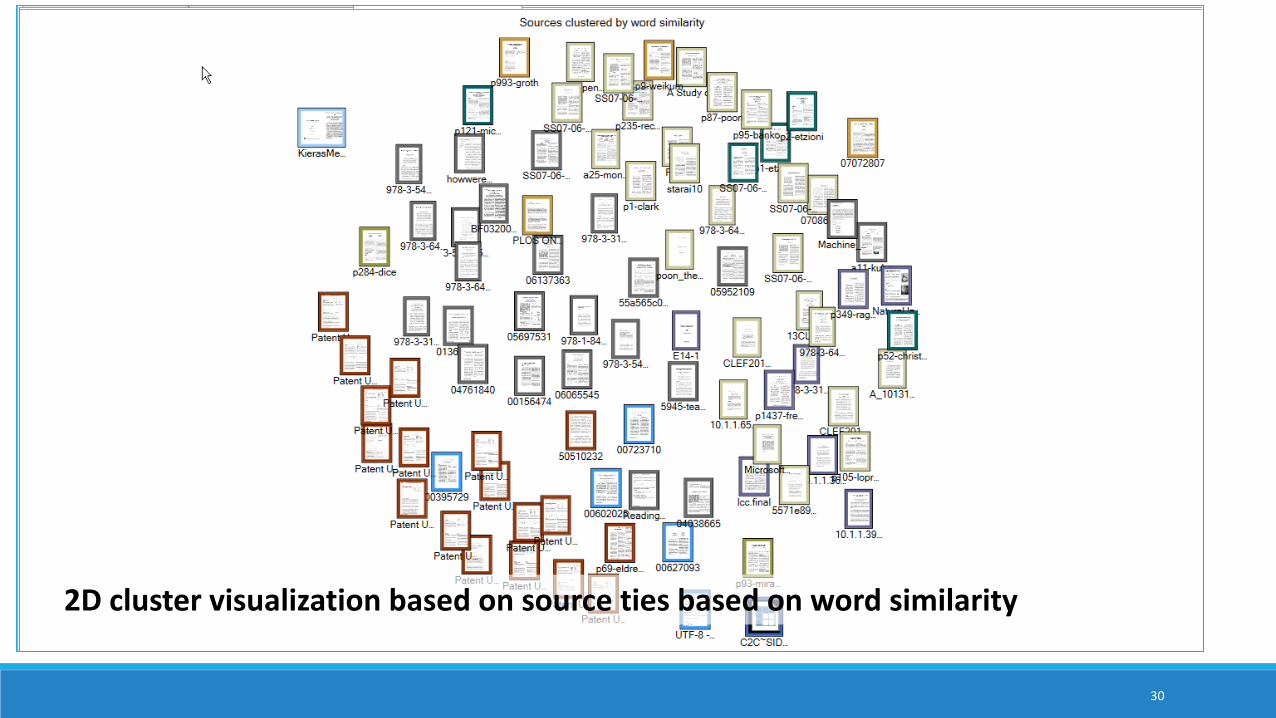
2D cluster visualization based on source ties based on word similarity
Setup of Machine Reading Processes There are a half-dozen widely-available software programs that may be used for machine reading of texts. Those who use high-level computer languages also have packages that enable various types of text analysis.
It helps to know what the capabilities are for the various software tools.
It helps to know what to set the parameters at for the various processes.
It helps to know how the respective data visualizations are to be interpreted and to mitigate for the fact that data visualizations are summary data. It is important to mitigate negative learning.
31
AssertabilityIt helps to know what may be asserted from the respective machine reading processes, so the findings may be accurately represented.
Also, many researchers use multiple processes and outside-understandings in order to contextualize the data from machine reading. Those insights should be properly couched as well.
32

Four “Use Cases” from Higher Education • APPLICATION OF MACHINE READING FOR:
• Learning • Awareness • Research
33
Overview of Use Cases Use Case #1: Topic Modeling and Article Histograms (latent structure in documents and document sets)
Use Case #2: Engaging with Social Media (Microblogging and Social Network) Data
Use Case #3: Exploring Manual and Machine Coding
Use Case #4: Machine Reading for Sentiment Analysis
34
Use Case #1: Topic Modeling and Article Histograms (latent structure in documents and document / text sets)
Using a computer to read a large amount of articles or contents to extract topics ◦ Can be a “knowledge poor” approach in which no prior information about the domain is applied to the
topic extraction (as in the case of NVivo 11 Plus)
Topic modeling may be used to identify which works should be read using human “close reading”◦ Article histograms through theme / subtheme extraction (topic modeling)◦ Understanding of topics as a finite feature set ◦ Classification of articles by their main named contents
Using a computer to extract themes and sub-themes to understand the general gist of an article or a text set
Can auto-code at three levels of granularity: sentence, paragraph, and cell (depending on the structure of the data)
35
Use Case #1 Work Sequence Collecting the documents as separate items in a text corpus
Cleaning the text sets
Running the theme and sub-theme extraction against the set (NVivo 11 Plus)
Selecting the appropriate themes and subthemes
Auto-coded at the more granular sentence level (vs. paragraph level)
Exporting the text-document intensity matrix
Mapping the entire set as a line graph (Excel)
Mapping separate articles as article histograms
36
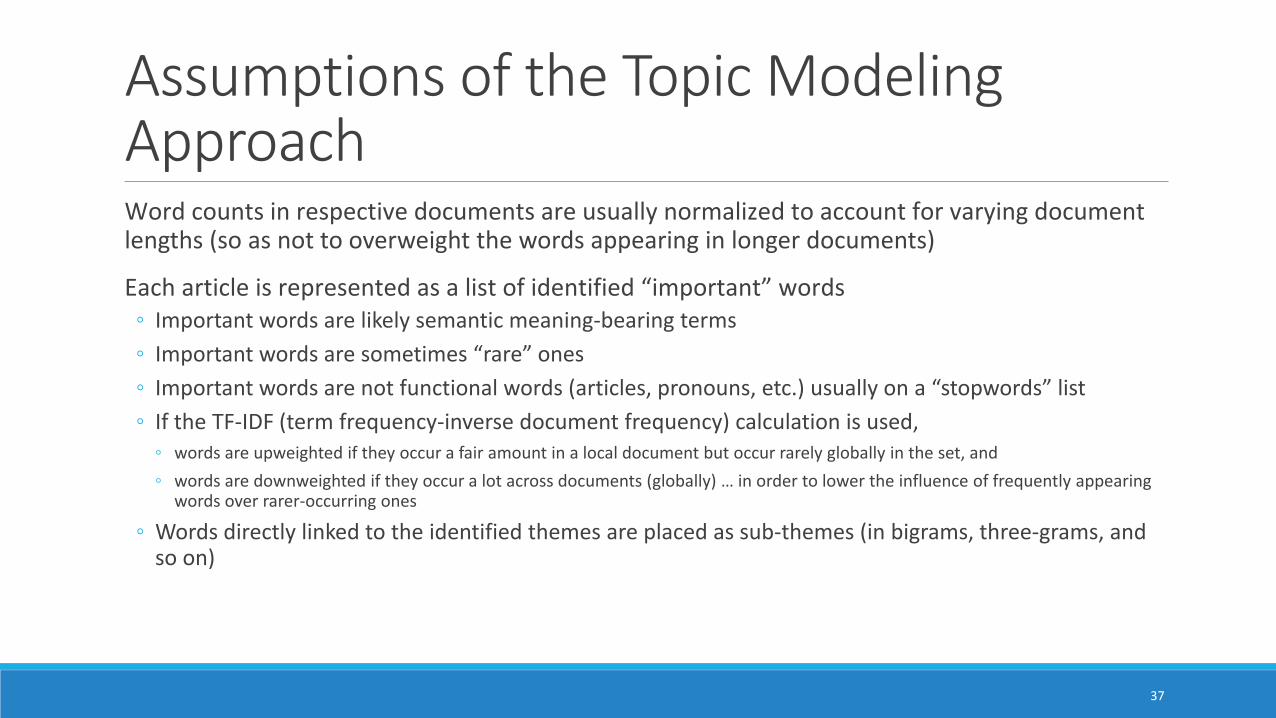
Assumptions of the Topic Modeling ApproachWord counts in respective documents are usually normalized to account for varying document lengths (so as not to overweight the words appearing in longer documents)
Each article is represented as a list of identified “important” words ◦ Important words are likely semantic meaning-bearing terms ◦ Important words are sometimes “rare” ones◦ Important words are not functional words (articles, pronouns, etc.) usually on a “stopwords” list◦ If the TF-IDF (term frequency-inverse document frequency) calculation is used,
◦ words are upweighted if they occur a fair amount in a local document but occur rarely globally in the set, and ◦ words are downweighted if they occur a lot across documents (globally) … in order to lower the influence of frequently appearing
words over rarer-occurring ones
◦ Words directly linked to the identified themes are placed as sub-themes (in bigrams, three-grams, and so on)
37
VisualizationsA dataset of articles about “machine reading” from Springer, IEEE Xplore Digital Library, ACM and Google Scholar
Kept at document size and stored in one folder
38
39
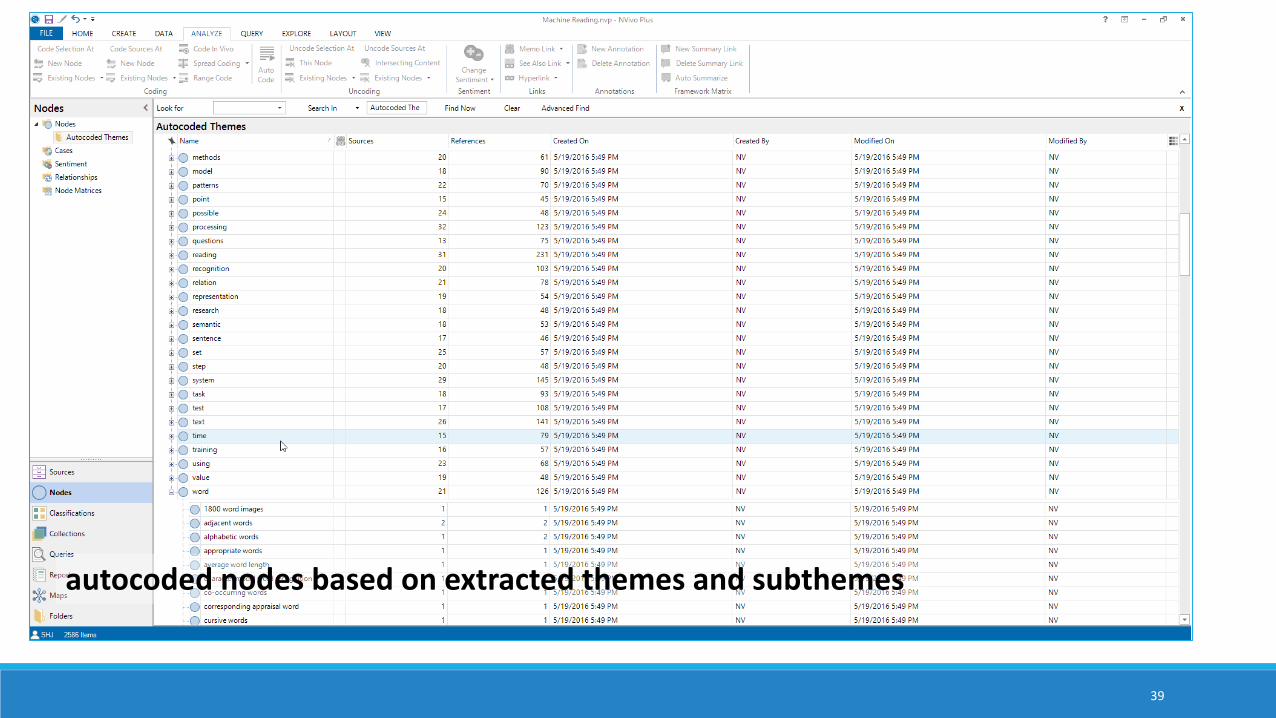
autocoded nodes based on extracted themes and subthemes
40
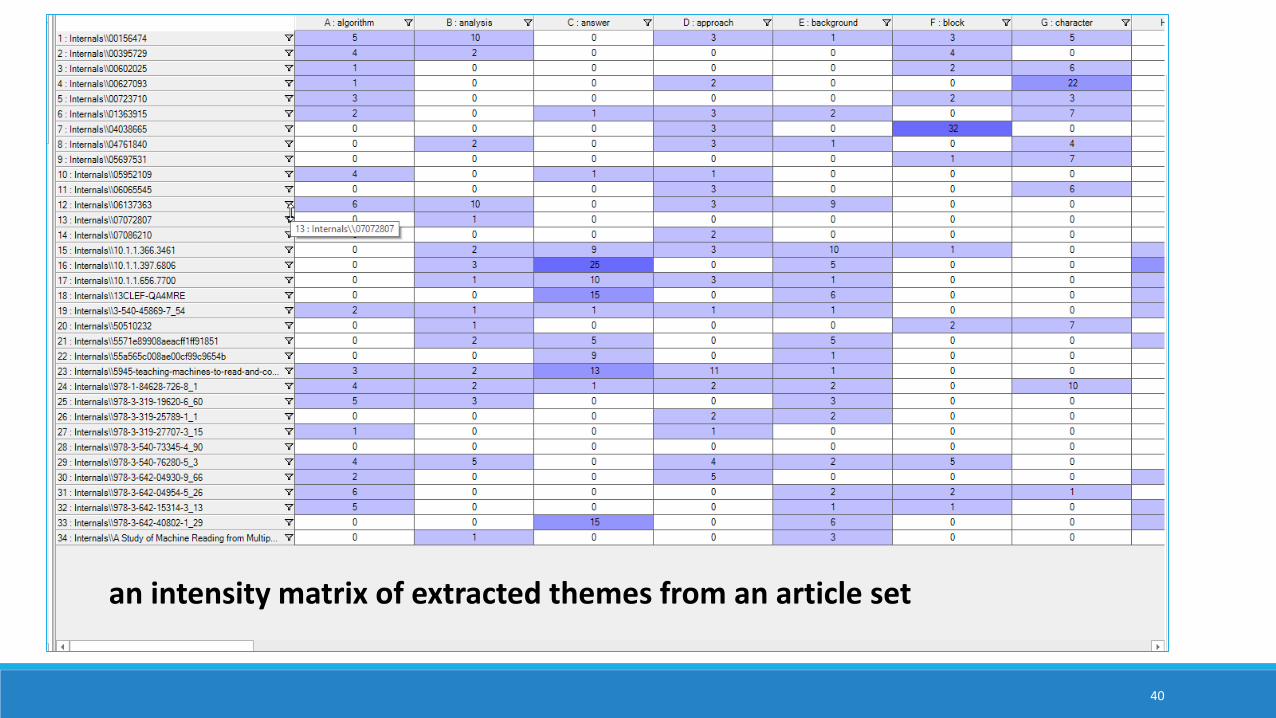
an intensity matrix of extracted themes from an article set
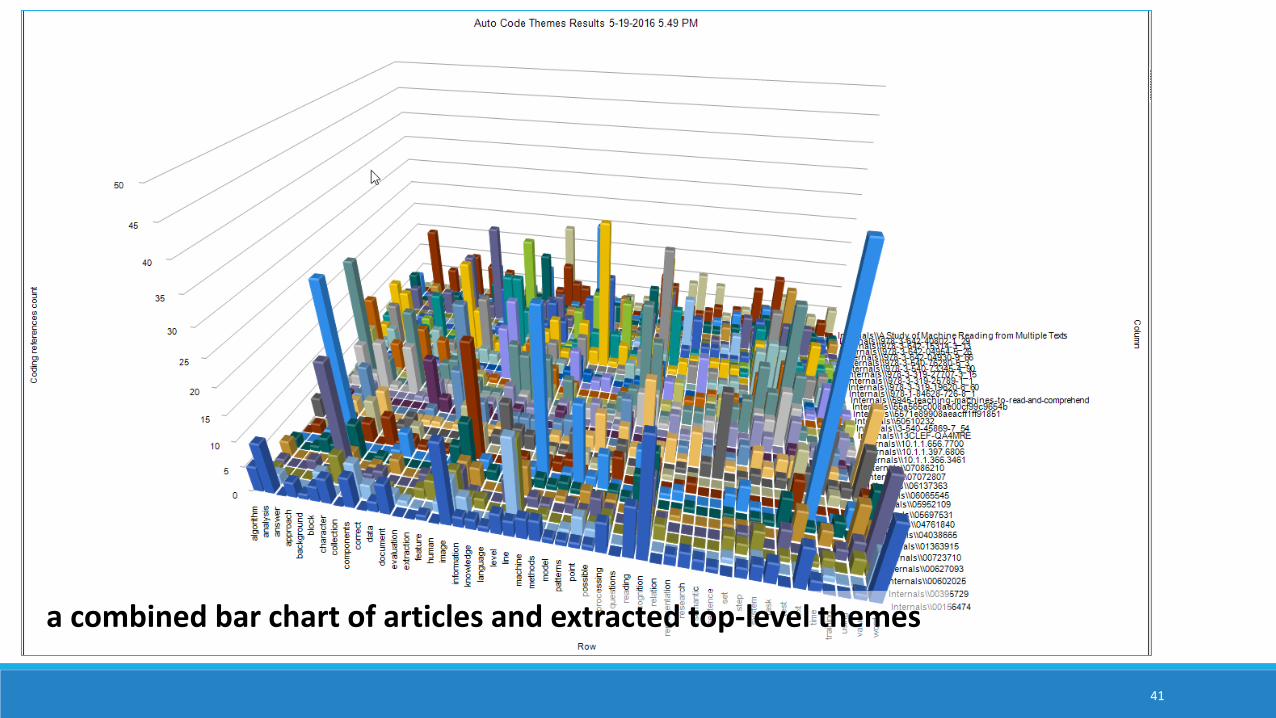
41
a combined bar chart of articles and extracted top-level themes
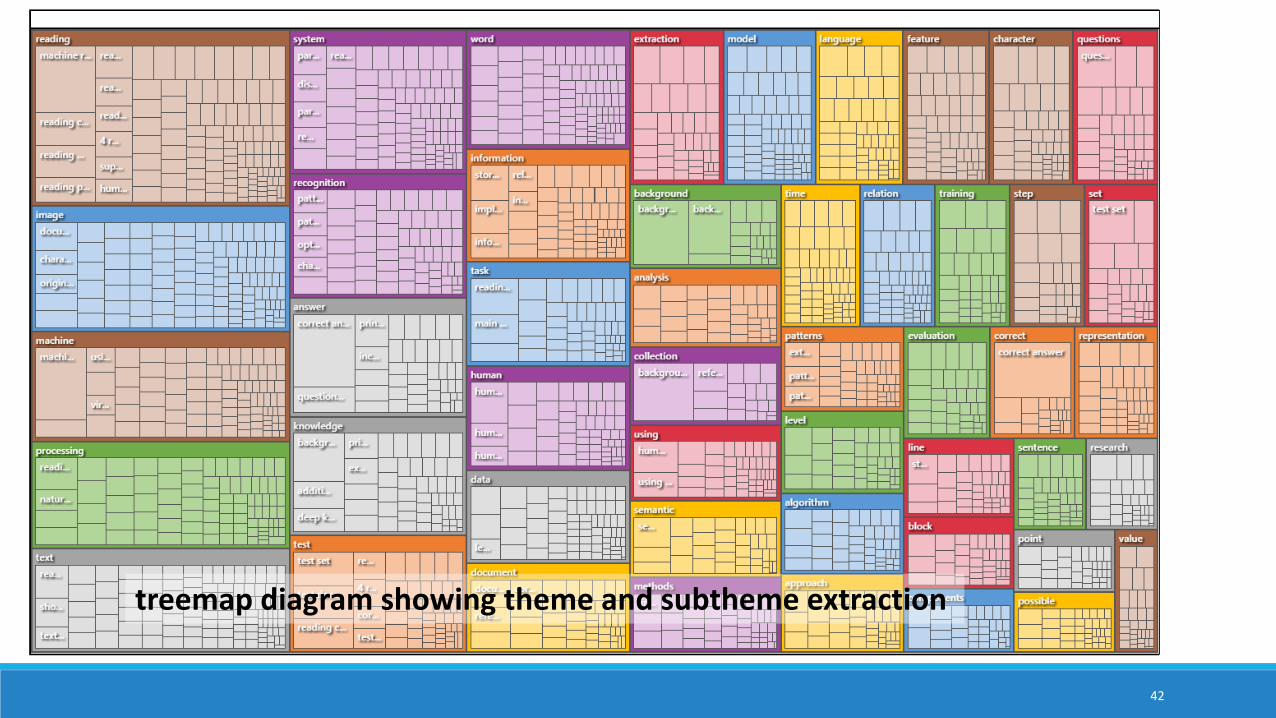
42
treemap diagram showing theme and subtheme extraction
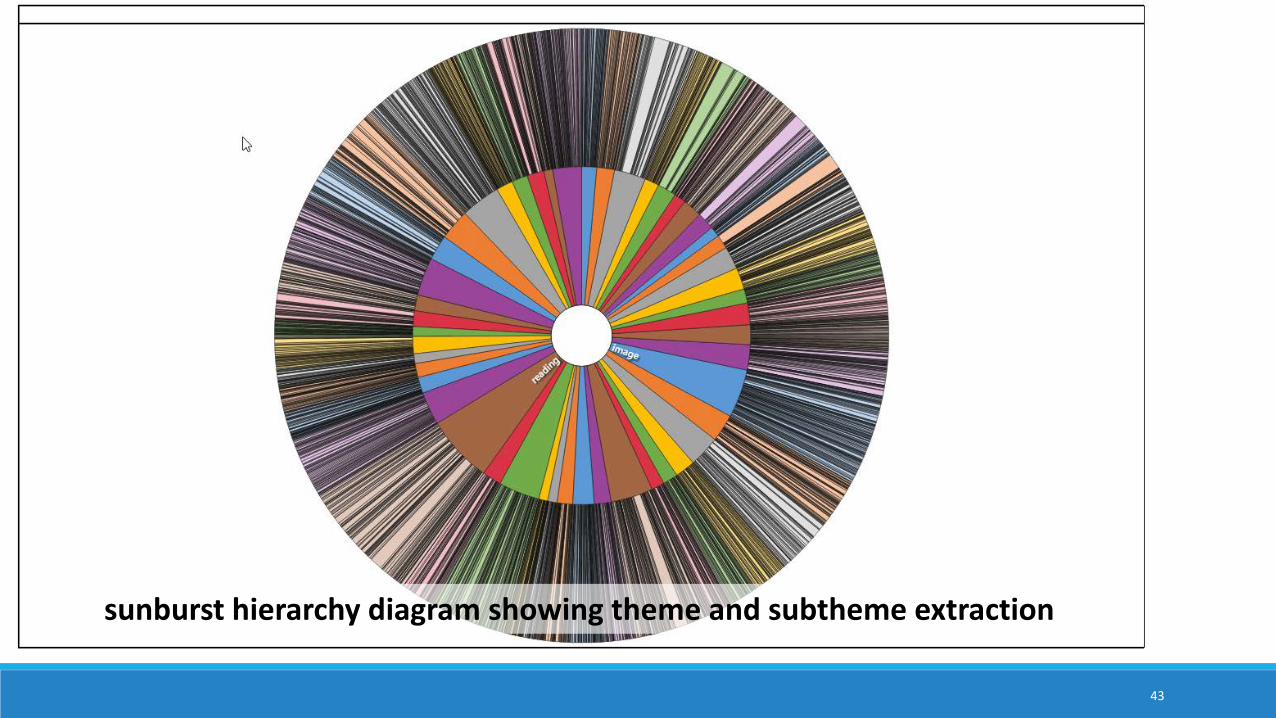
43
sunburst hierarchy diagram showing theme and subtheme extraction
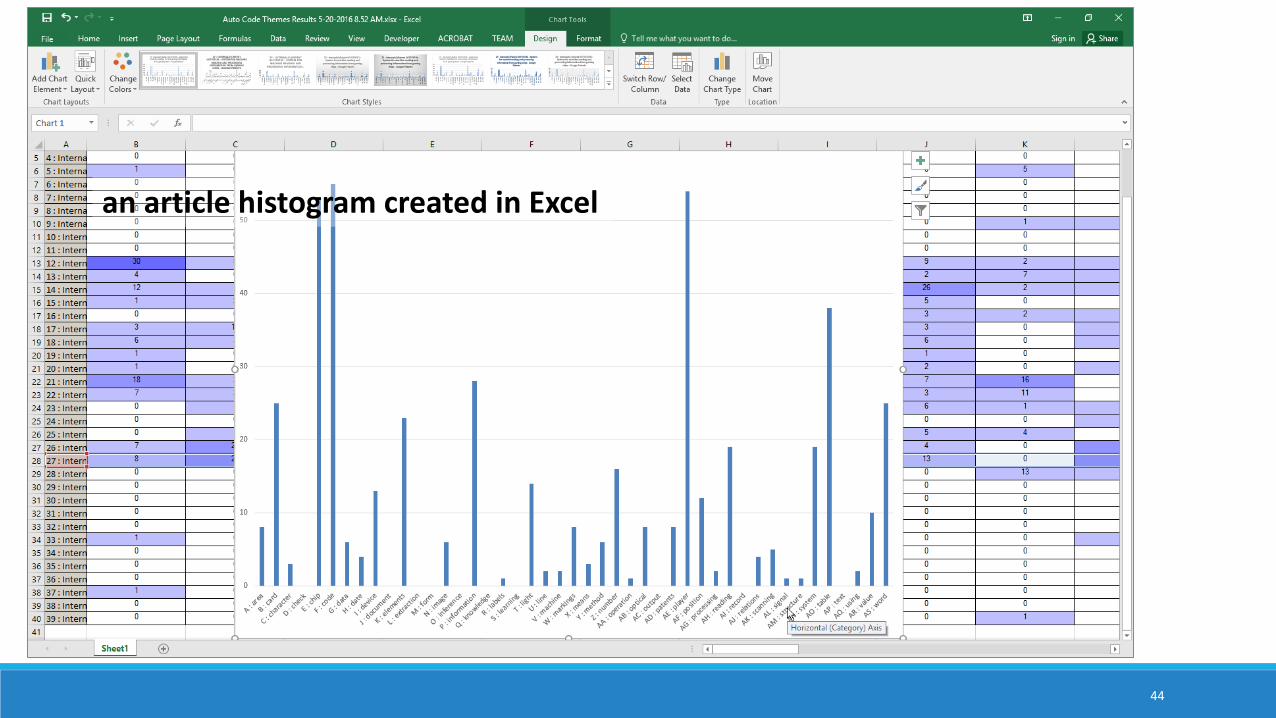
44
an article histogram created in Excel
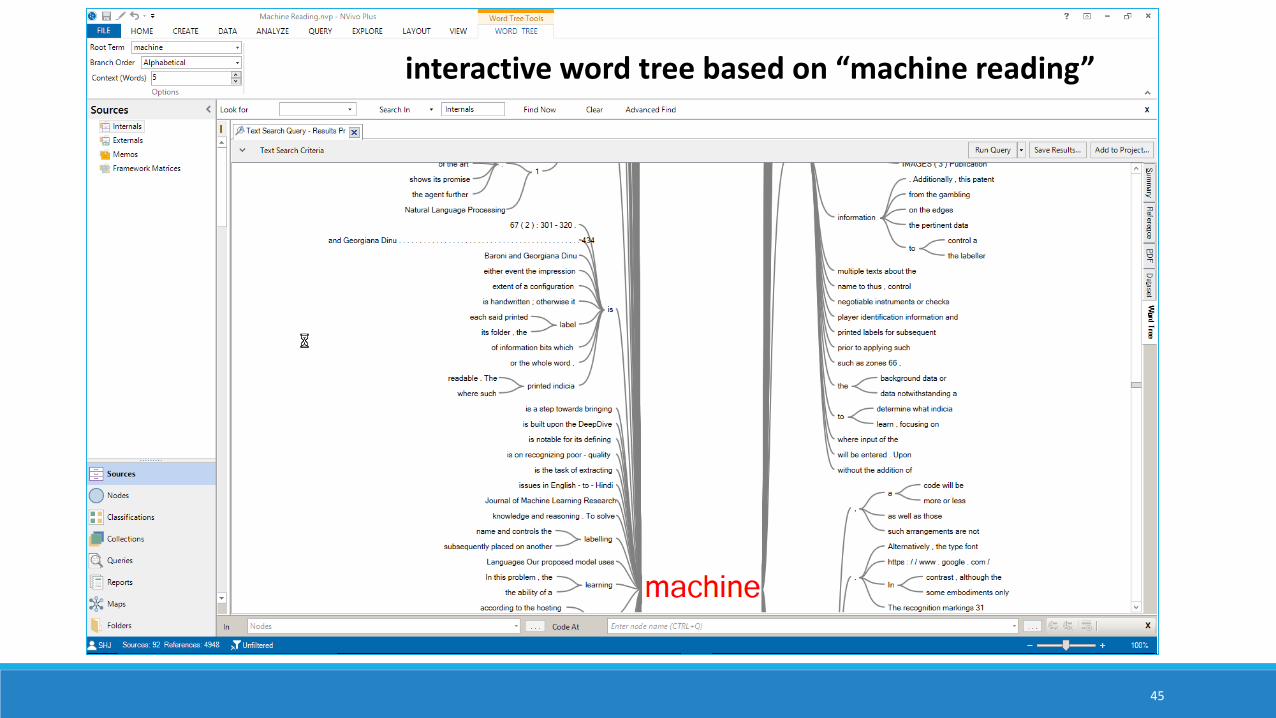
45
interactive word tree based on “machine reading”
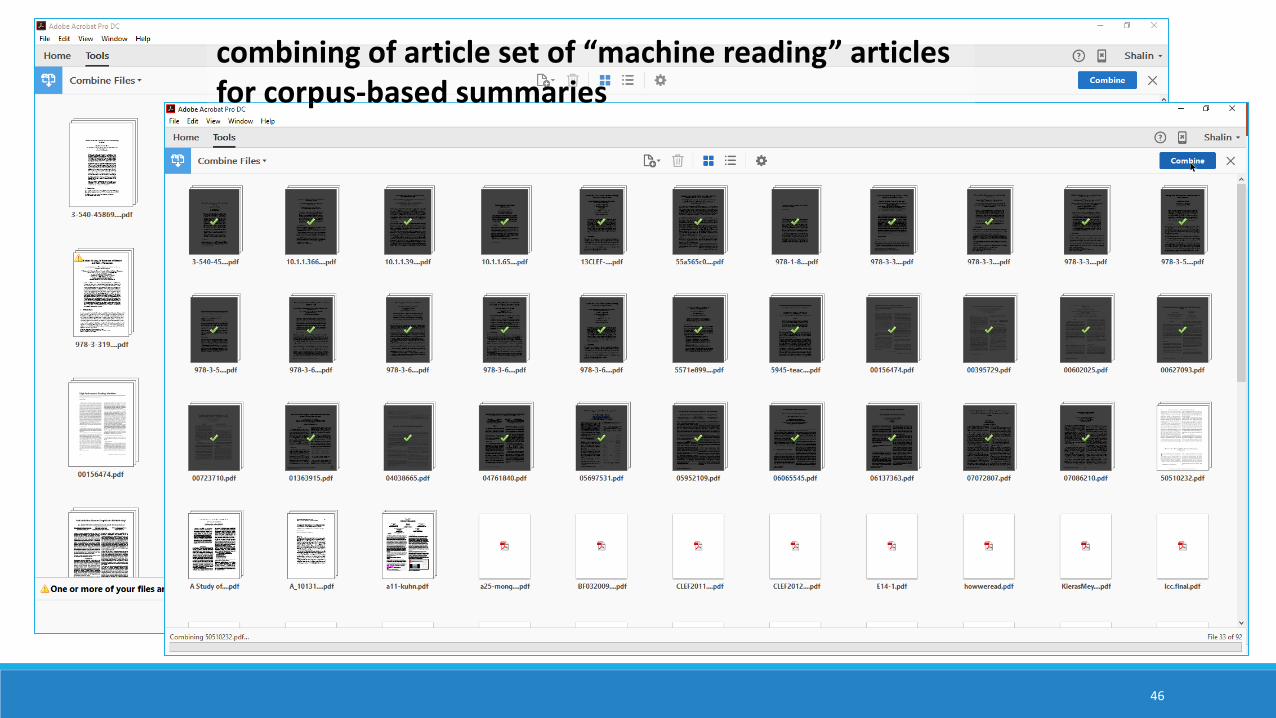
An Integrated File of All Articles1751 pp., > a million words from articles based on “machine reading” from the academic literature
Binder1 file
63 MB
Saved out as a .txt file from .pdf
Saved out as an .rtf file from .pdf
46
combining of article set of “machine reading” articles for corpus-based summaries
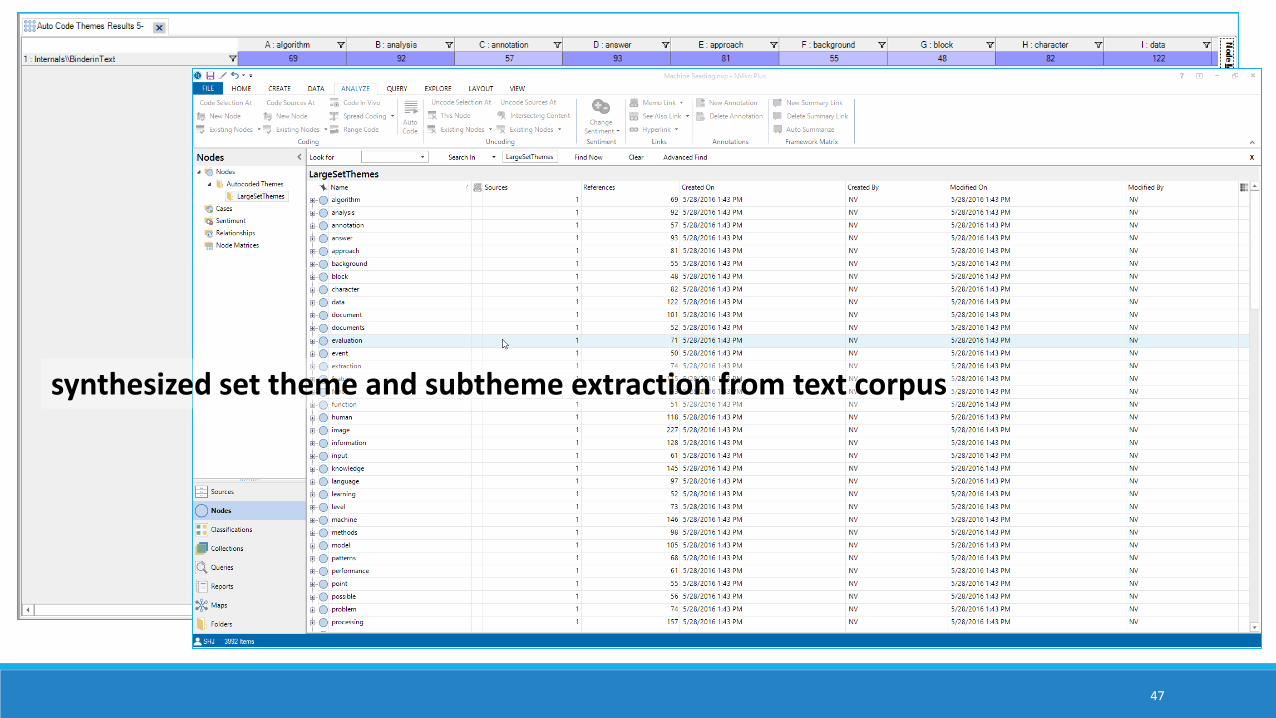
47
synthesized set theme and subtheme extraction from text corpus
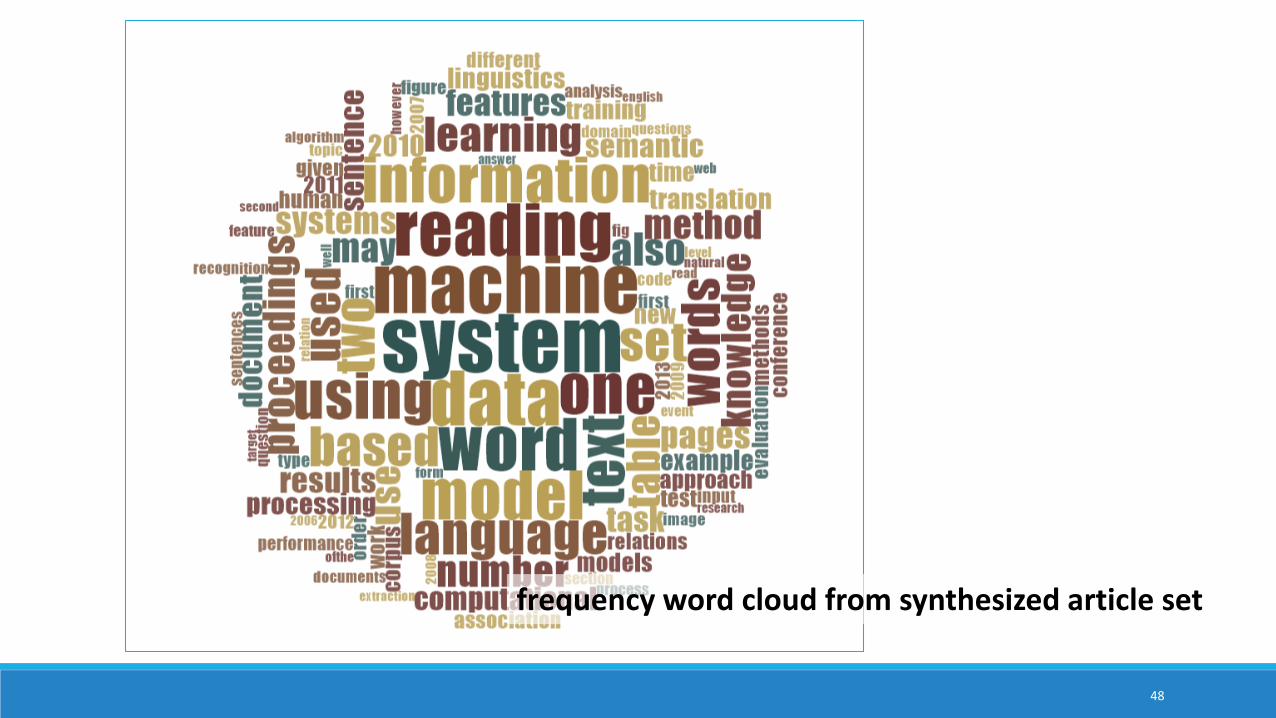
48
frequency word cloud from synthesized article set
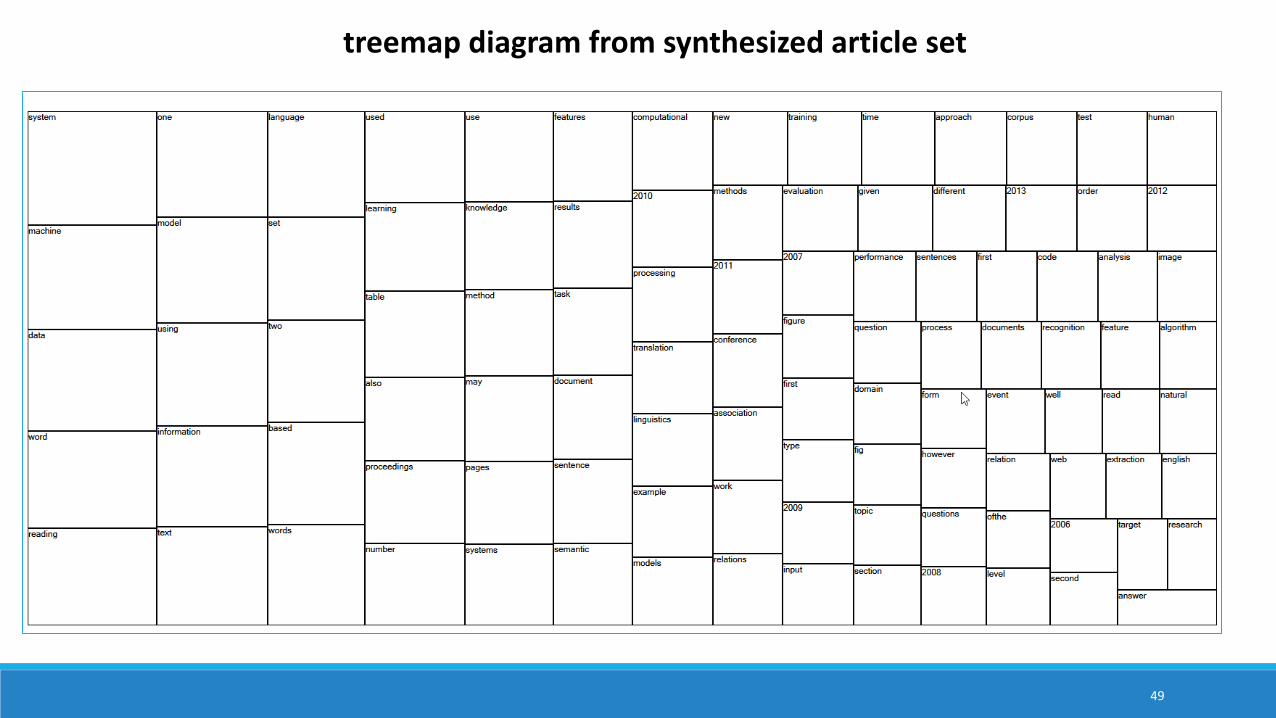
49
treemap diagram from synthesized article set

50
interactive word tree from “machine” seeded text search from synthesized article set
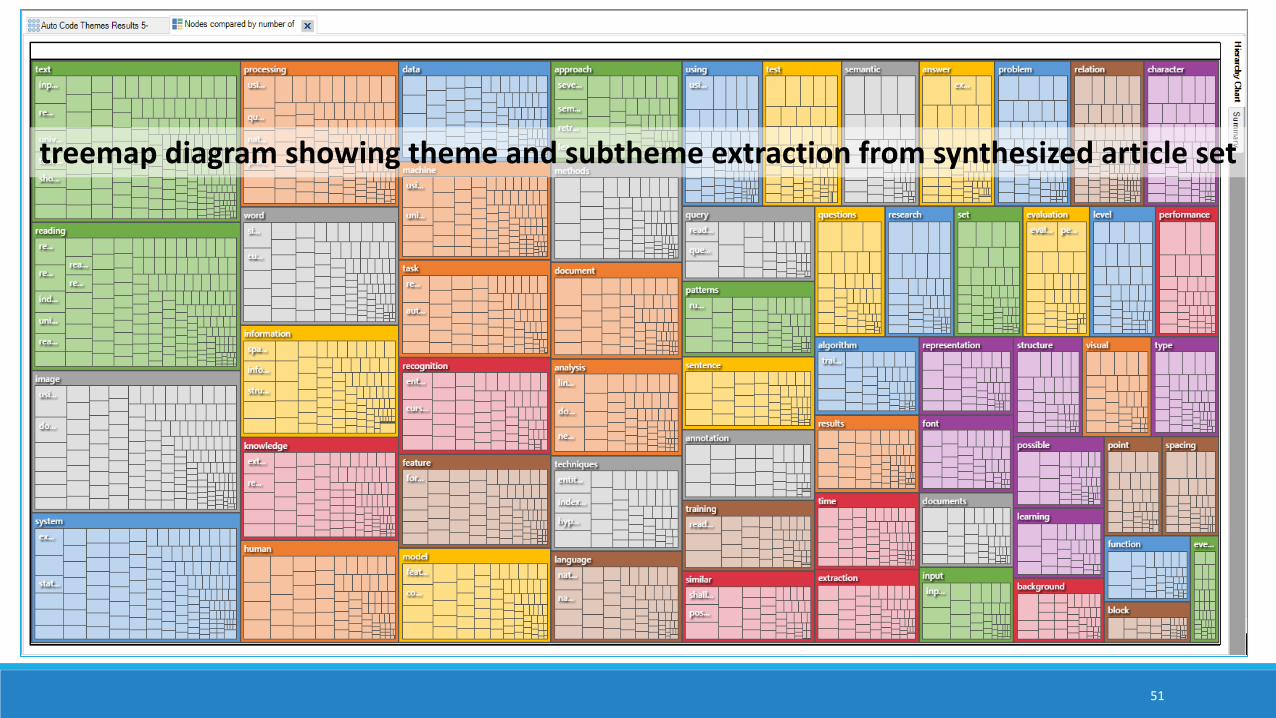
51
treemap diagram showing theme and subtheme extraction from synthesized article set
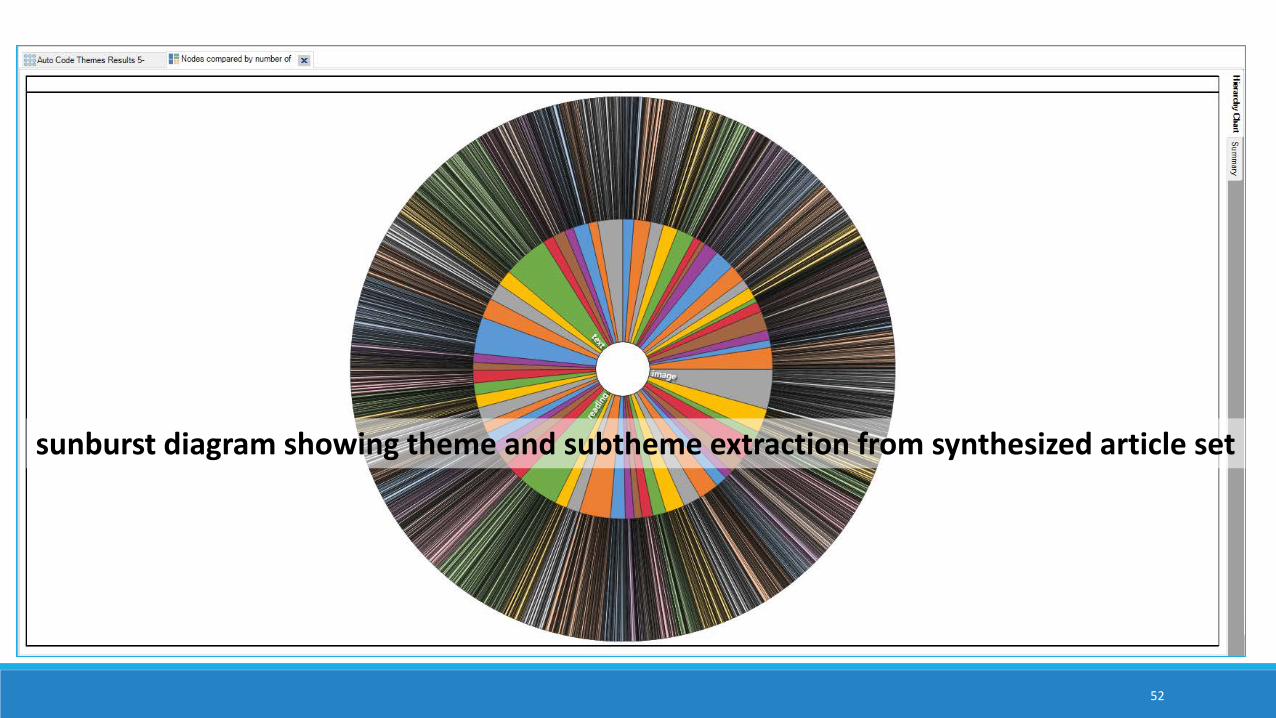
52
sunburst diagram showing theme and subtheme extraction from synthesized article set
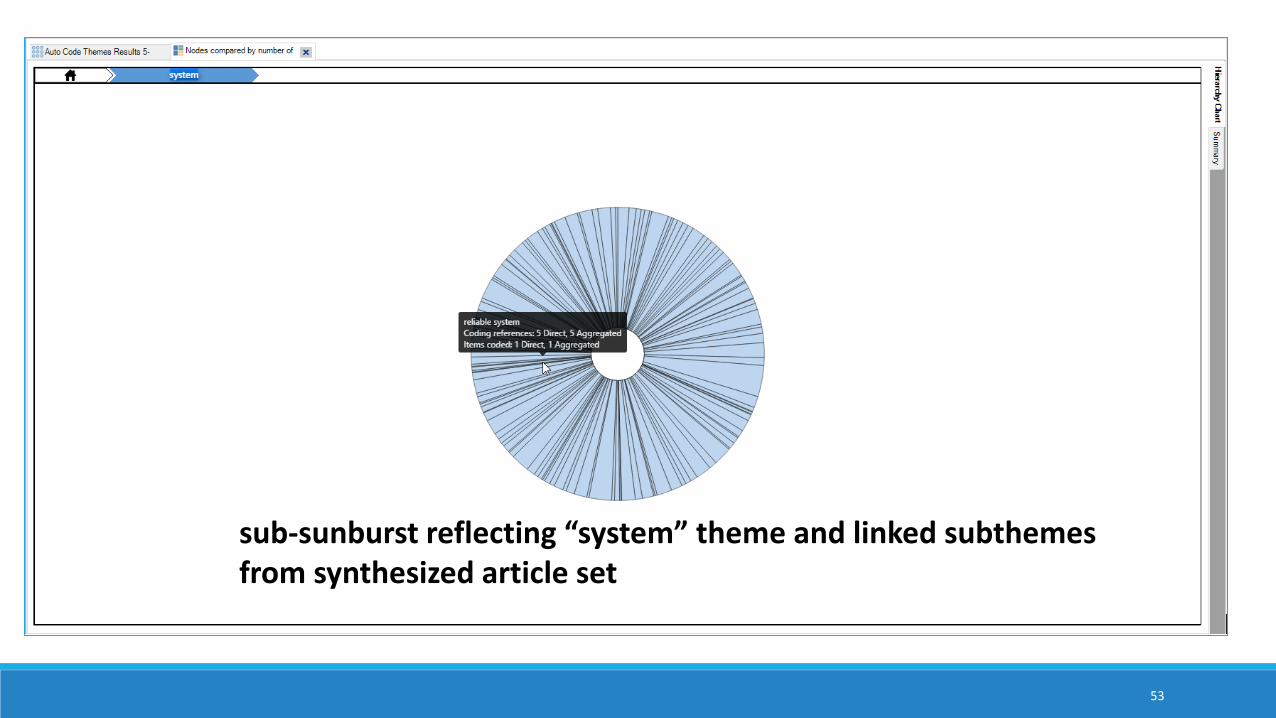
53
sub-sunburst reflecting “system” theme and linked subthemes from synthesized article set

54
treemap diagram showing auto-extracted sentiments from synthesized article set
55
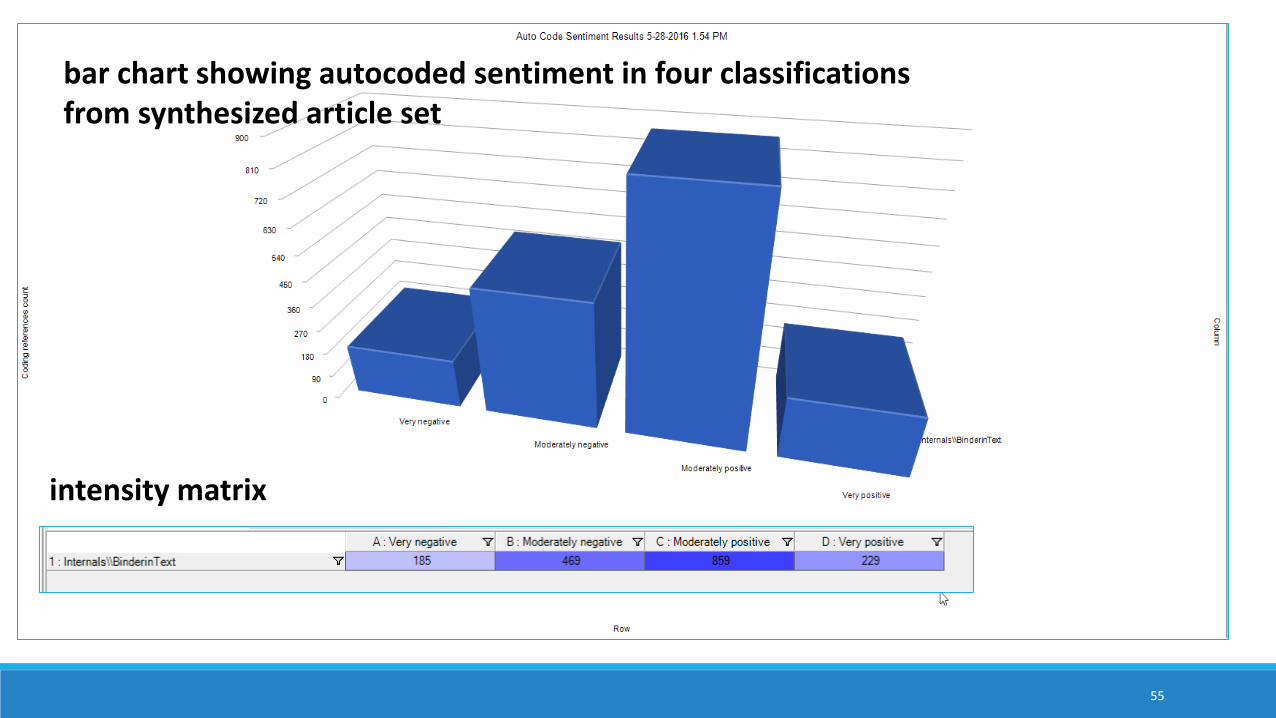
bar chart showing autocoded sentiment in four classifications from synthesized article set
intensity matrix
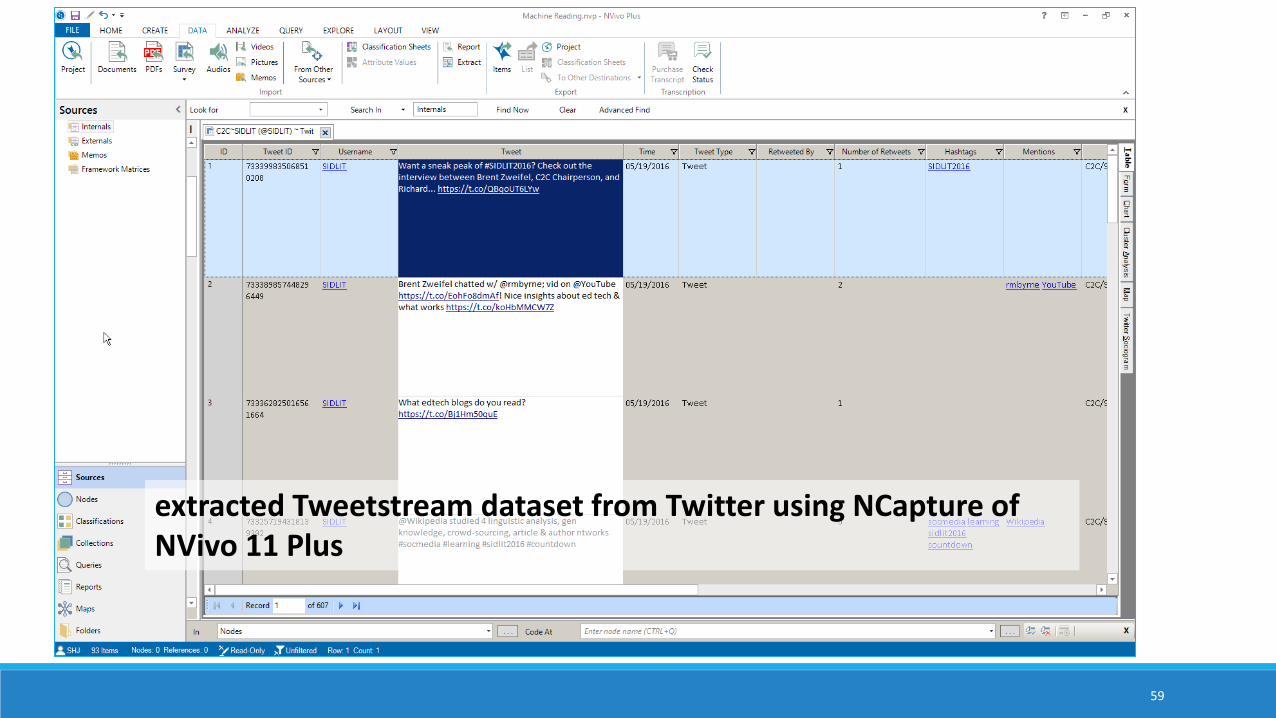
Use Case #2: Engaging with Social Media (Microblogging and Social Network) Data Using NCapture web browser add-on (on MS’s IE or Google Chrome) to extract a Twitter Tweetstream
Using NCapture web browser add-on to extract a Facebook wall of postings
Ability to capture text messages, URLs, geographical coordinates, thumbnail images, and other data
Ability to run sentiment analysis over the collected data
Ability to run theme and sub-theme extraction over the collected data
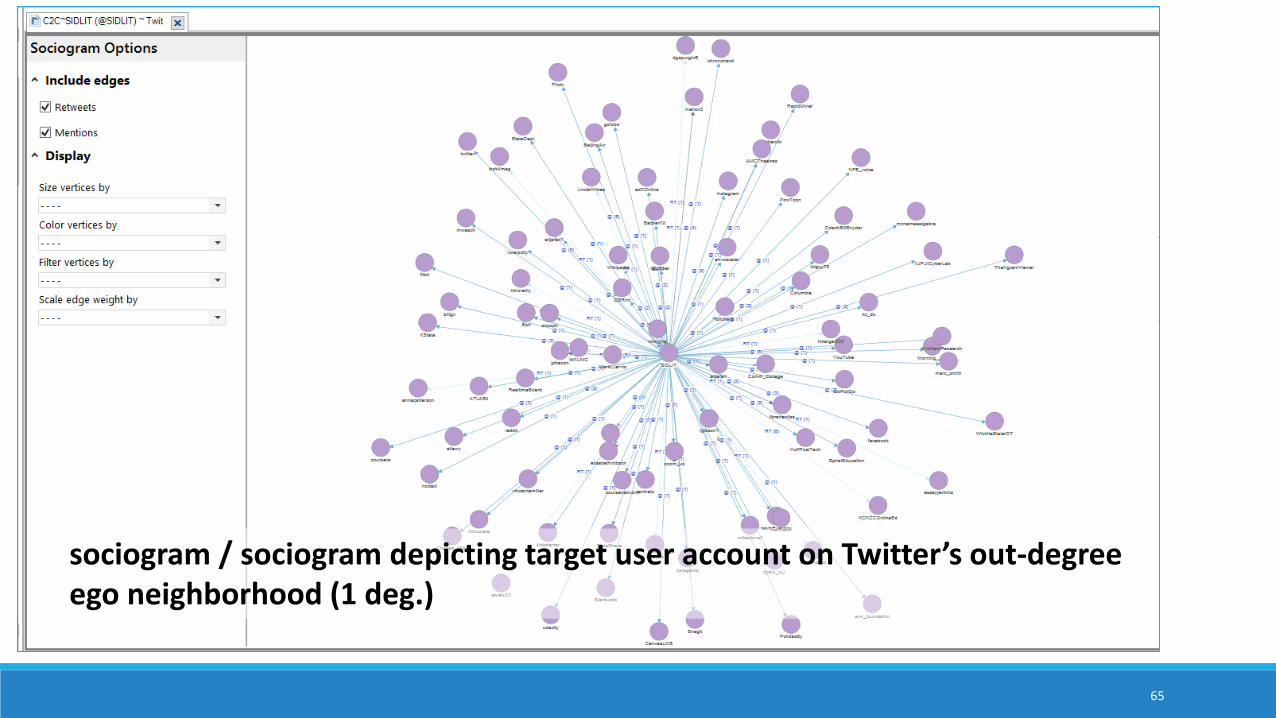
Ability to map social networks (sociograms) based on interaction data
56
Use Case #2 Work Sequence Capture a microblogging text set (Tweetstream, #hashtag conversation, keyword conversations, or other data extractions) from Twitter’s API
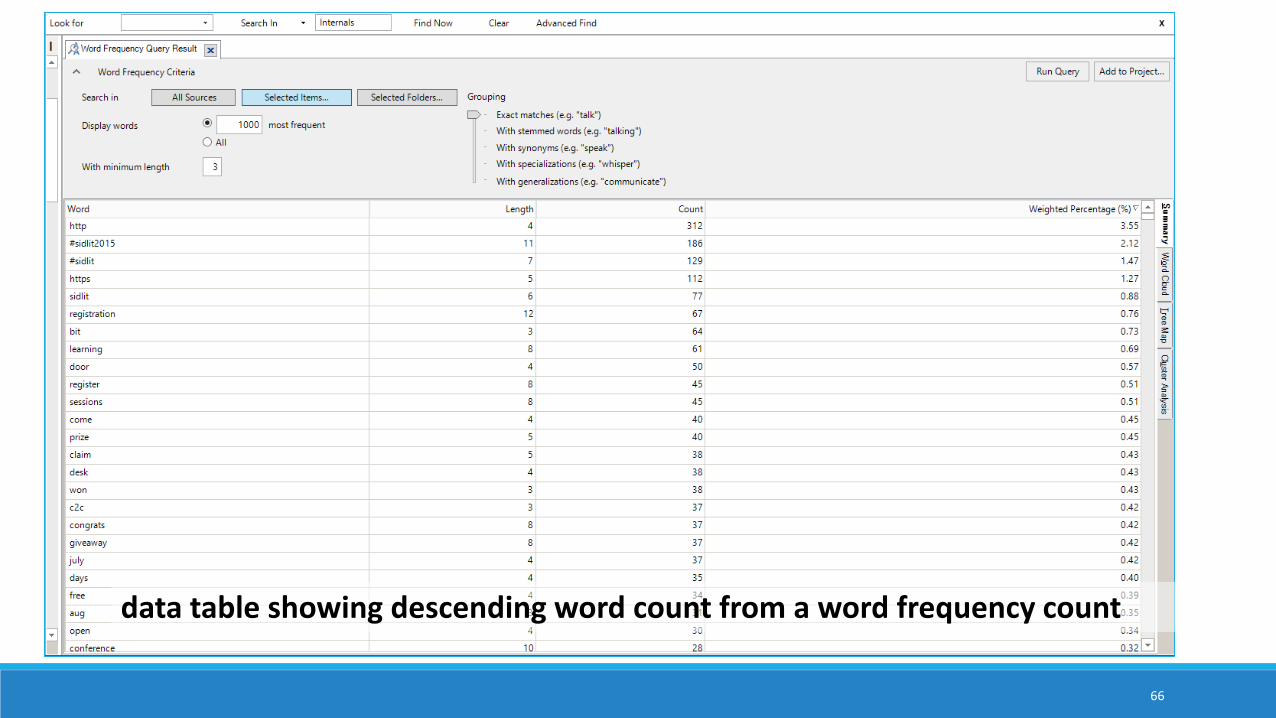
Run a text frequency count to capture a gist of the focus of the target text set (NVivo 11 Plus)
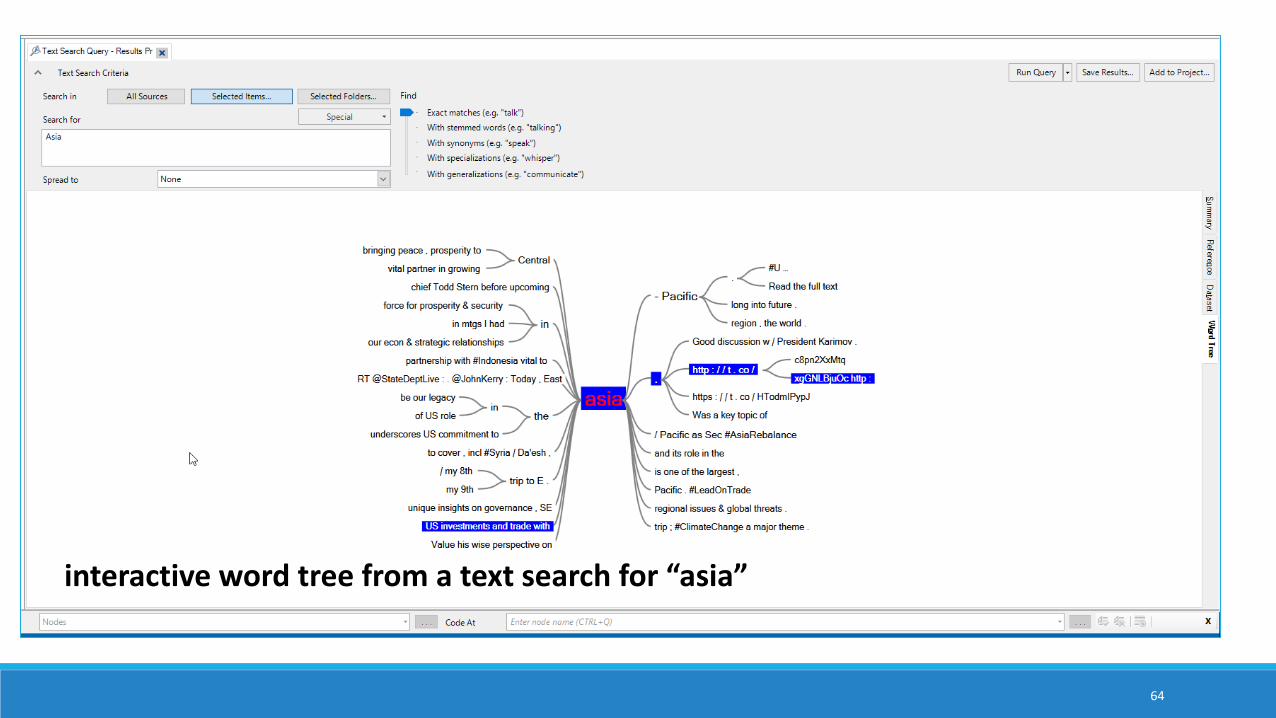
Run a word or phrase or name search to capture a sense of the gist of the targeted word use (NVivo 11 Plus)
Process the data and extract social networks to identify main communicators in the #hashtag network or the keyword network
57
Use Case #2 Work Sequence (cont.)
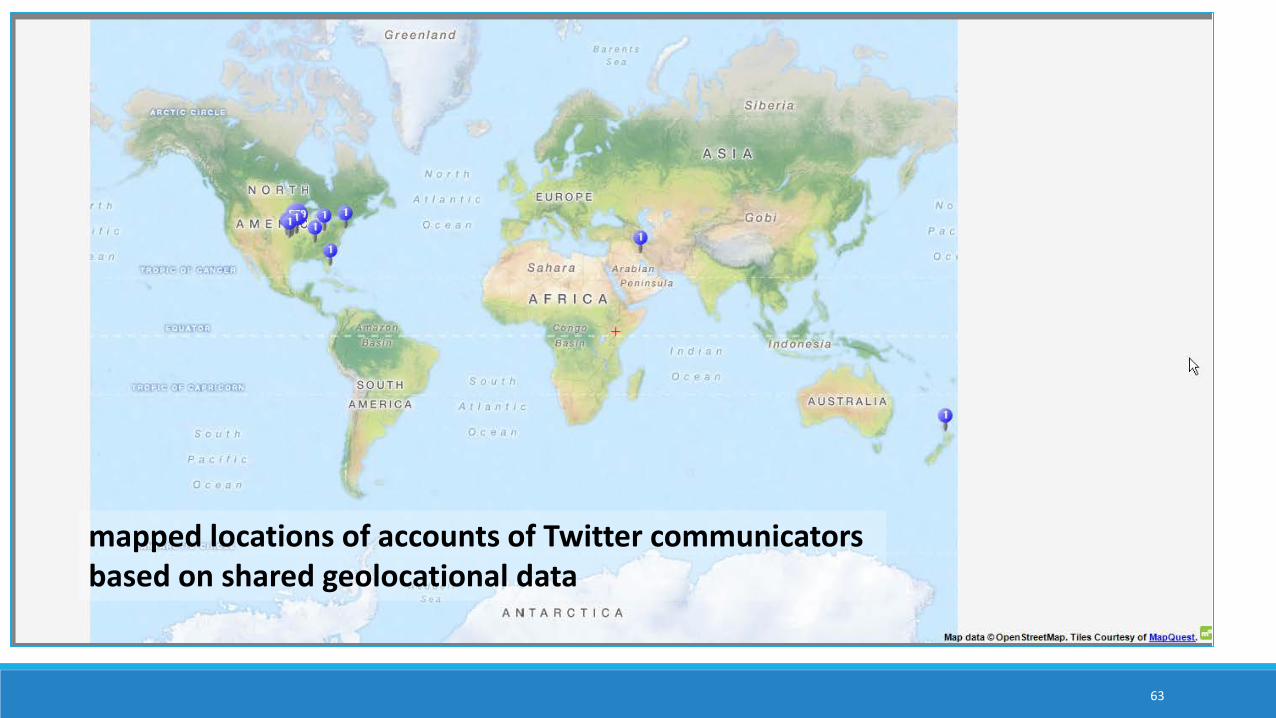
Map the microblogging data to a geographical map
Capture the URLs from the data set for more analysis
Capture related imagery from the data set for more analysis
Look at the postings over time for more analysis
Conduct a theme and sub-theme analysis of the text set to capture meaning
Map the text set for sentiment to capture the general sentiment of the text set ◦ Examine the extracted textual data for deeper insights
58
59
extracted Tweetstream dataset from Twitter using NCapture of NVivo 11 Plus
60
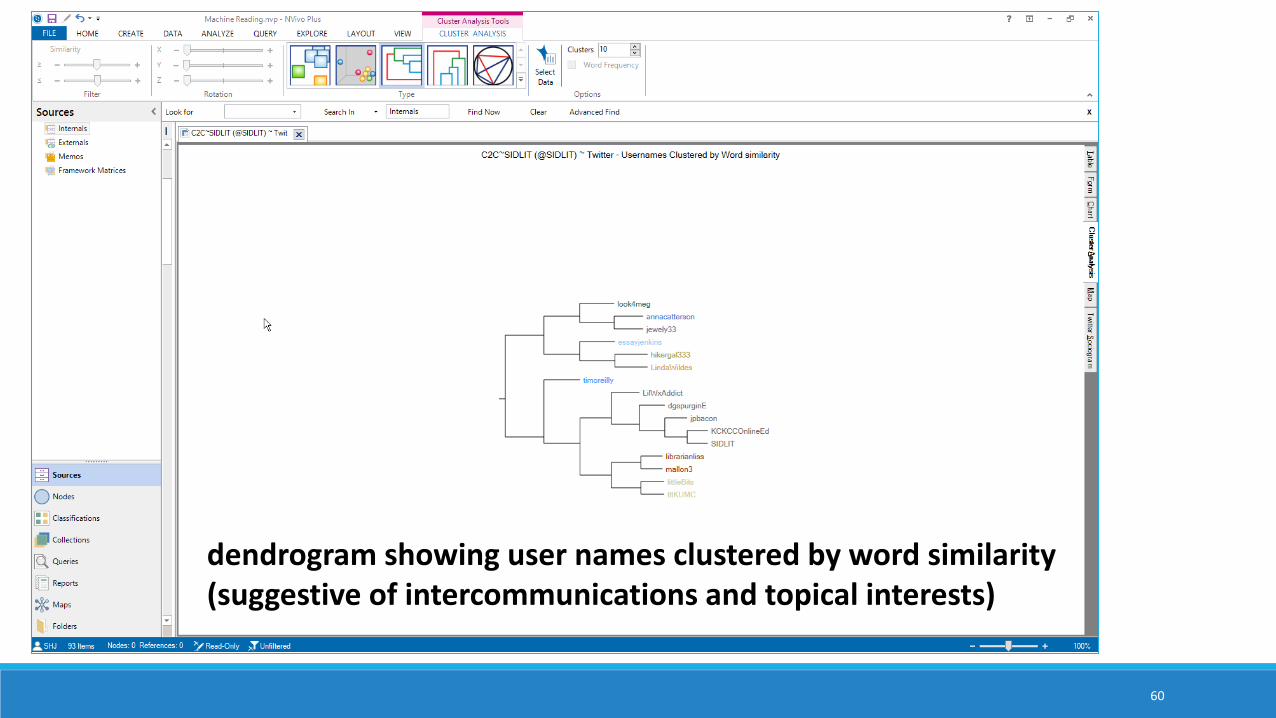
dendrogram showing user names clustered by word similarity (suggestive of intercommunications and topical interests)
61
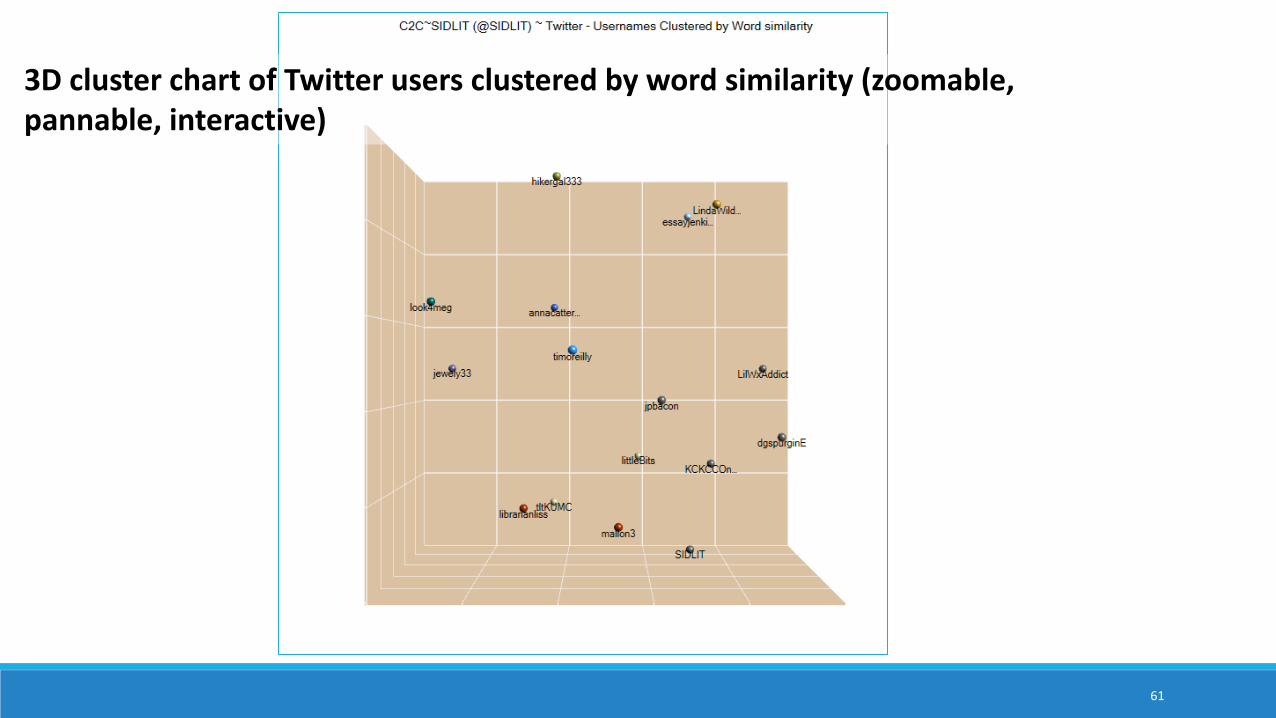
3D cluster chart of Twitter users clustered by word similarity (zoomable, pannable, interactive)
62
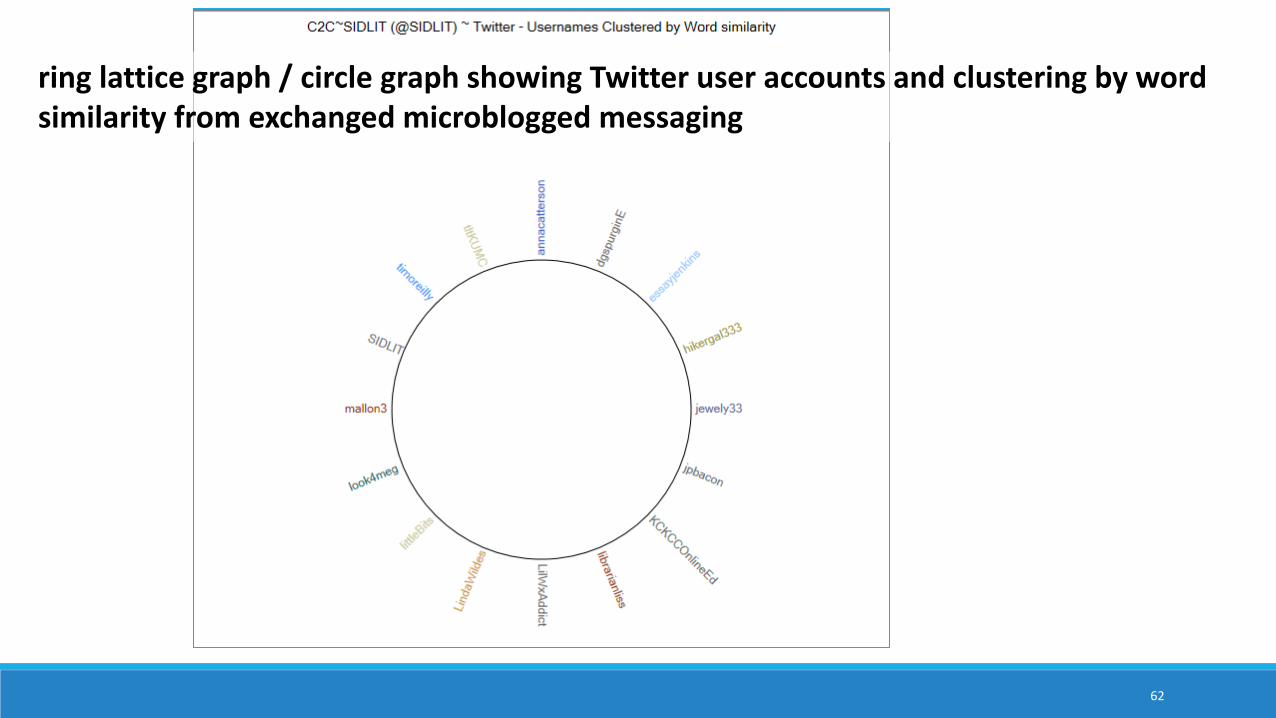
ring lattice graph / circle graph showing Twitter user accounts and clustering by word similarity from exchanged microblogged messaging
63
mapped locations of accounts of Twitter communicators based on shared geolocational data
64
interactive word tree from a text search for “asia”
65
sociogram / sociogram depicting target user account on Twitter’s out-degree ego neighborhood (1 deg.)
66
data table showing descending word count from a word frequency count
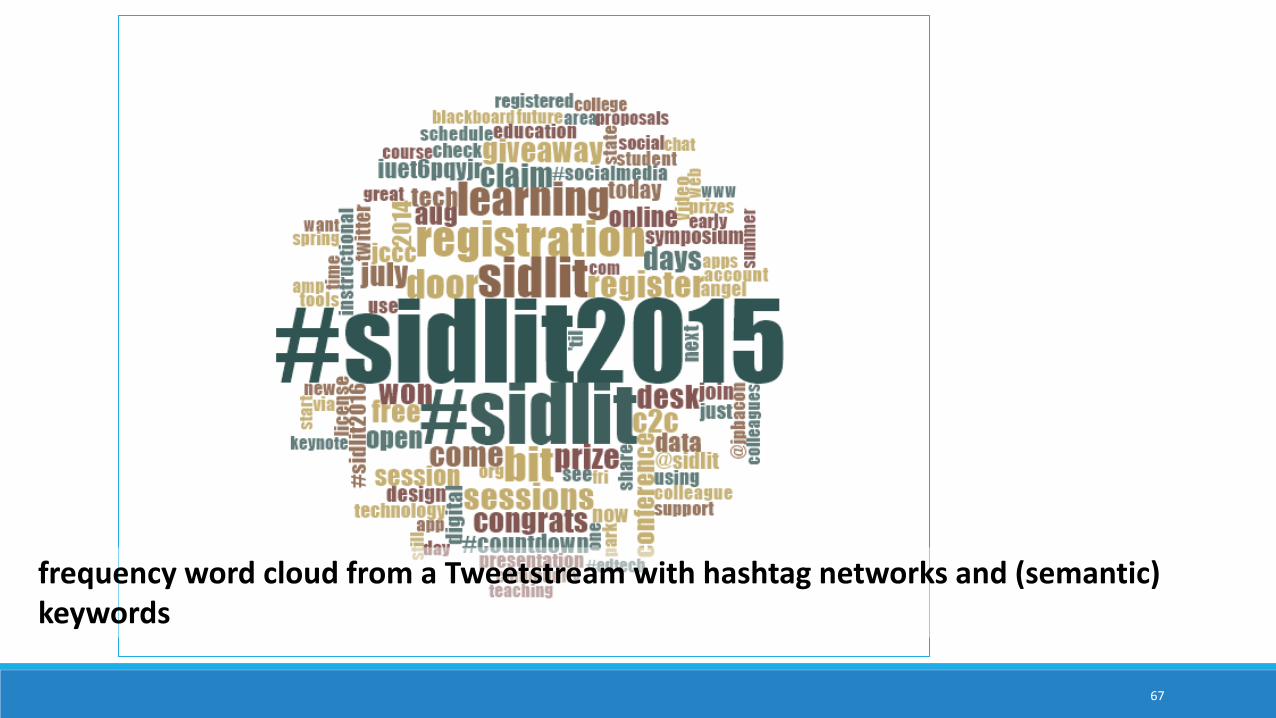
67
frequency word cloud from a Tweetstream with hashtag networks and (semantic) keywords
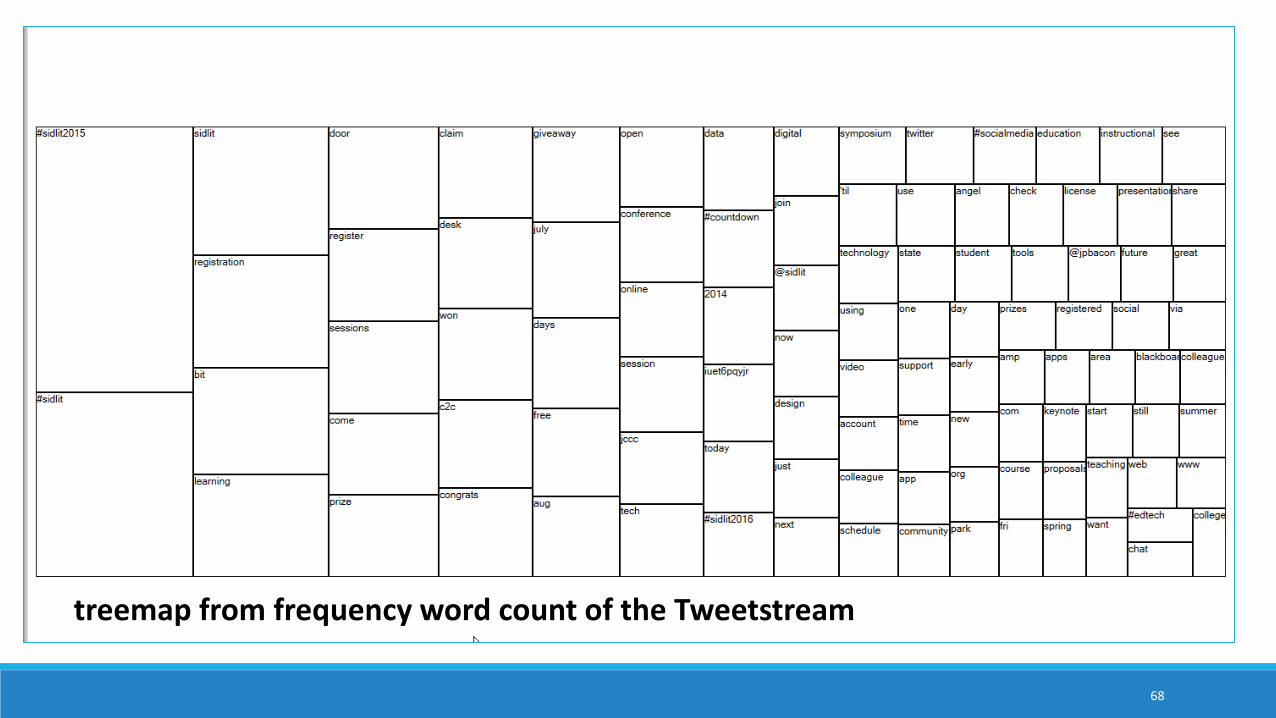
68
treemap from frequency word count of the Tweetstream
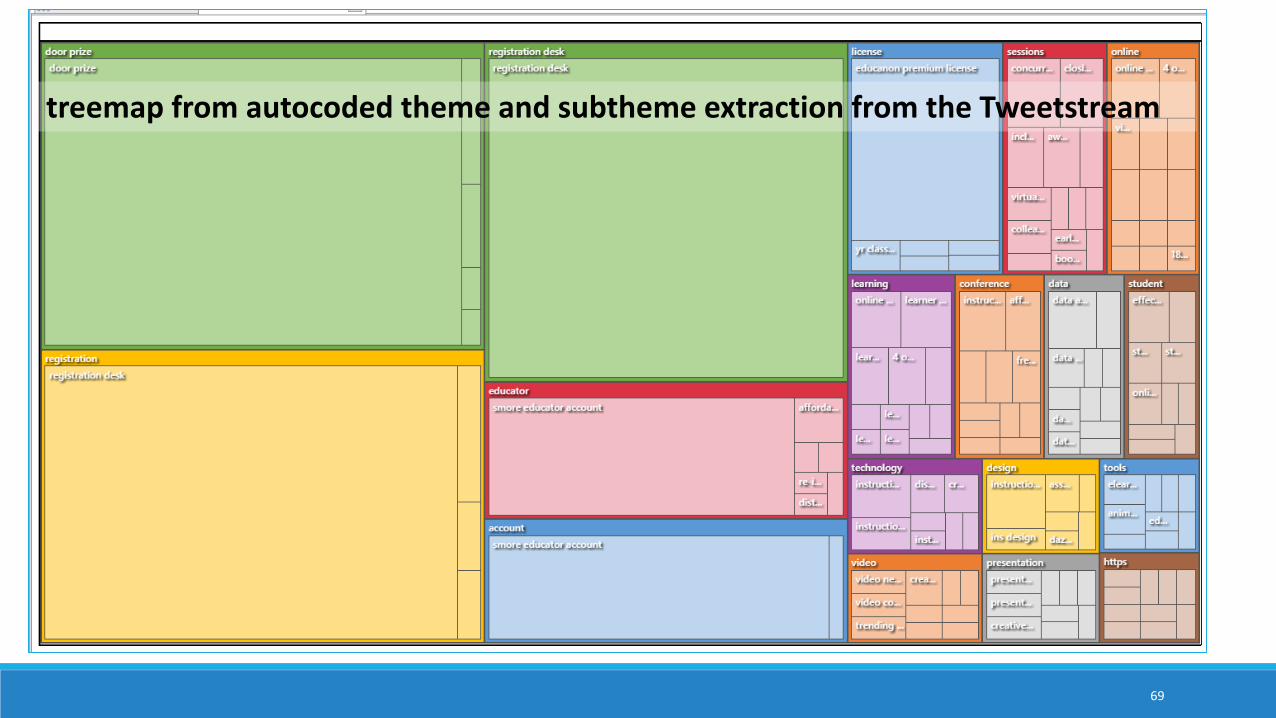
69
treemap from autocoded theme and subtheme extraction from the Tweetstream
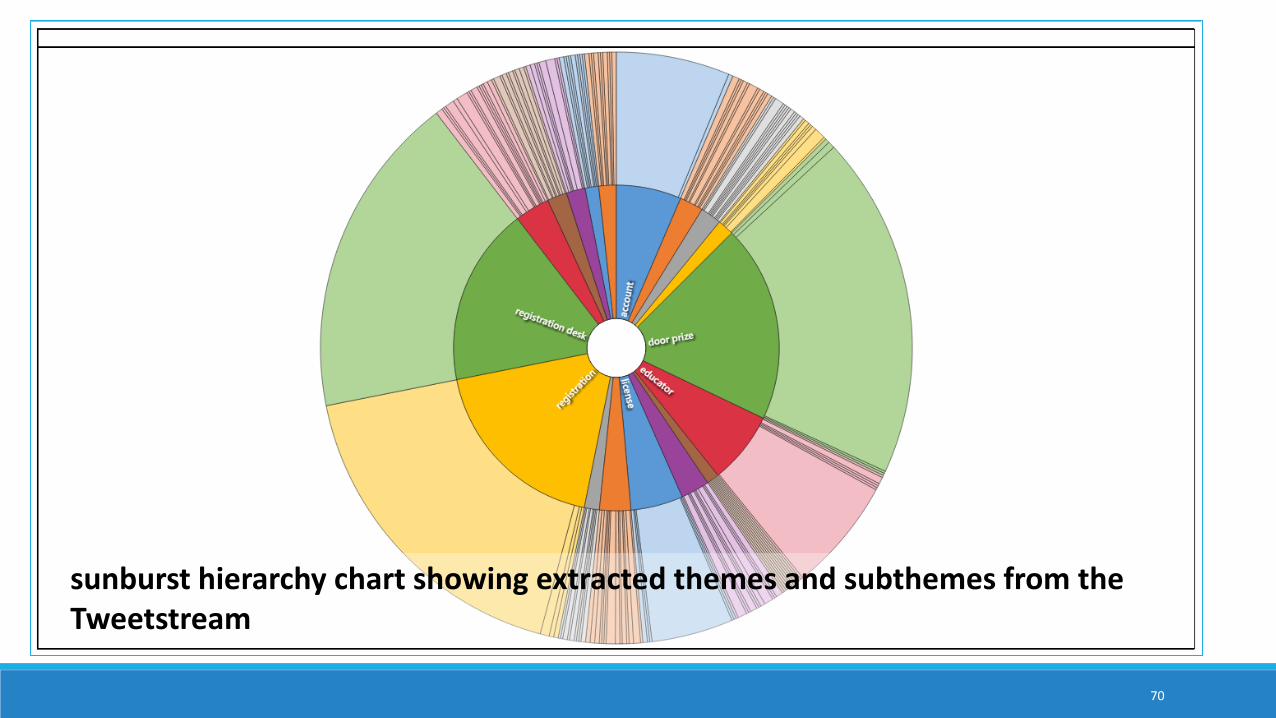
70
sunburst hierarchy chart showing extracted themes and subthemes from the Tweetstream
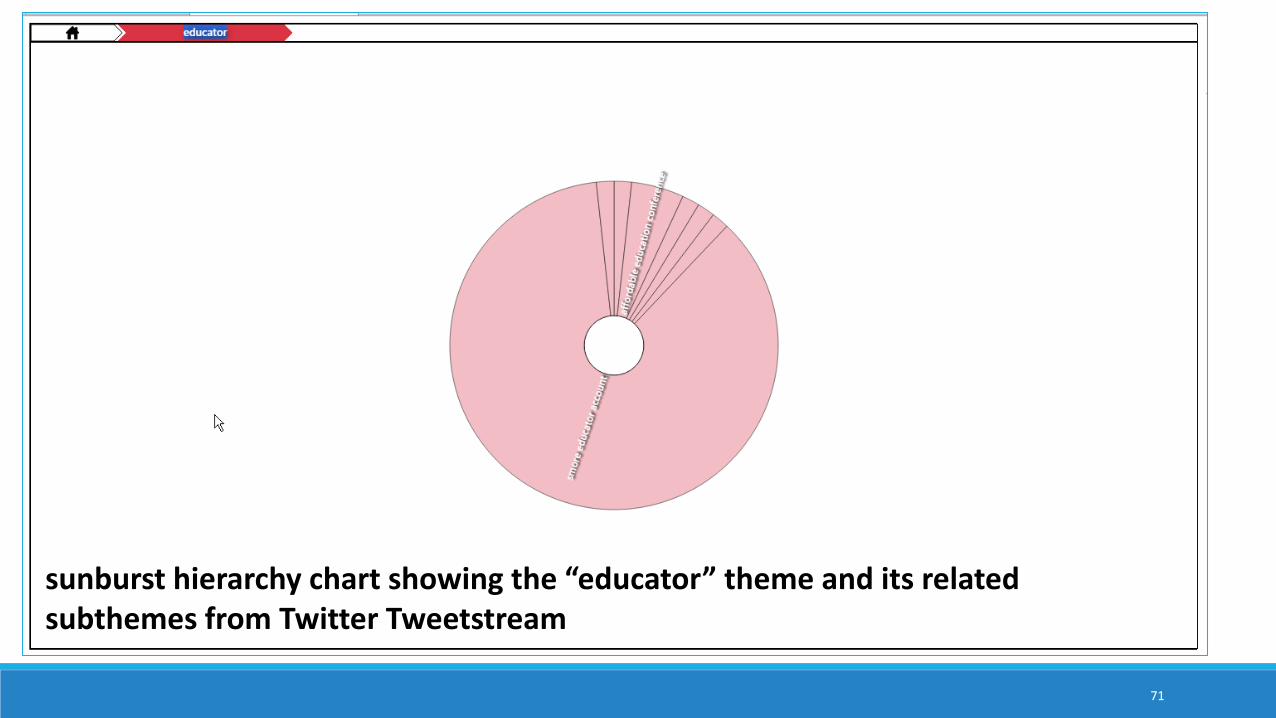
71
sunburst hierarchy chart showing the “educator” theme and its related subthemes from Twitter Tweetstream
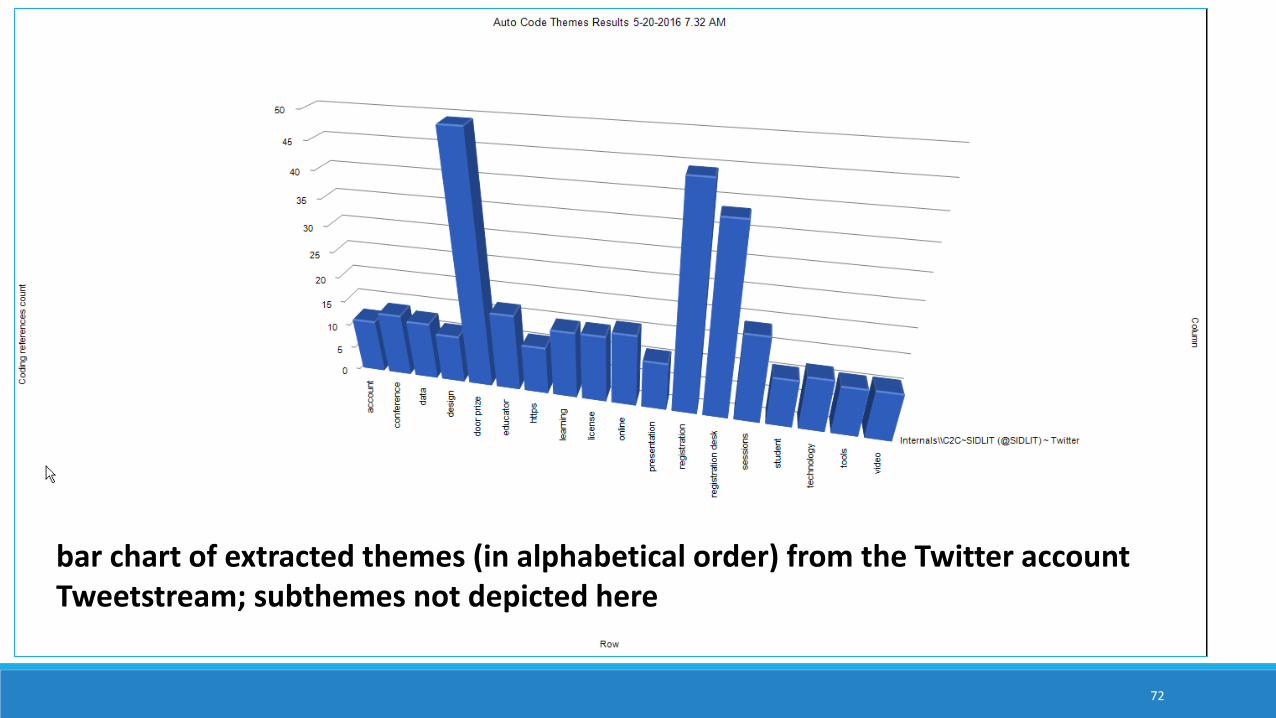
72
bar chart of extracted themes (in alphabetical order) from the Twitter account Tweetstream; subthemes not depicted here
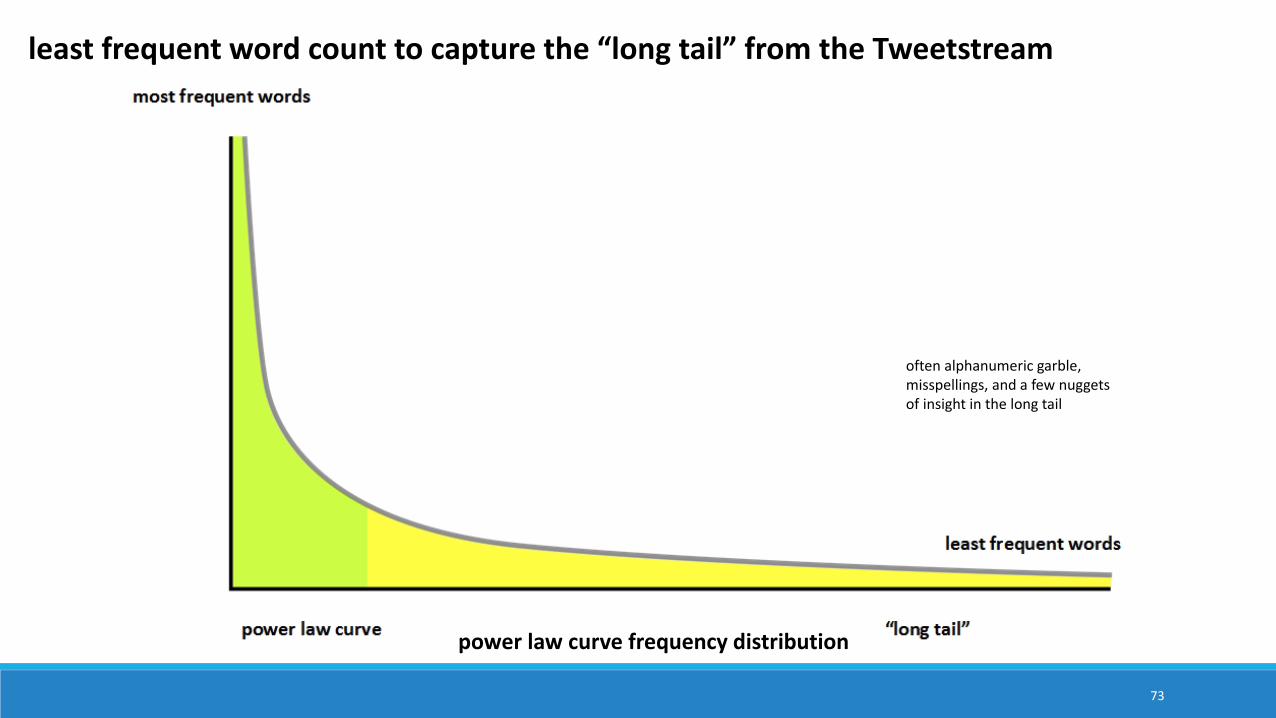
73
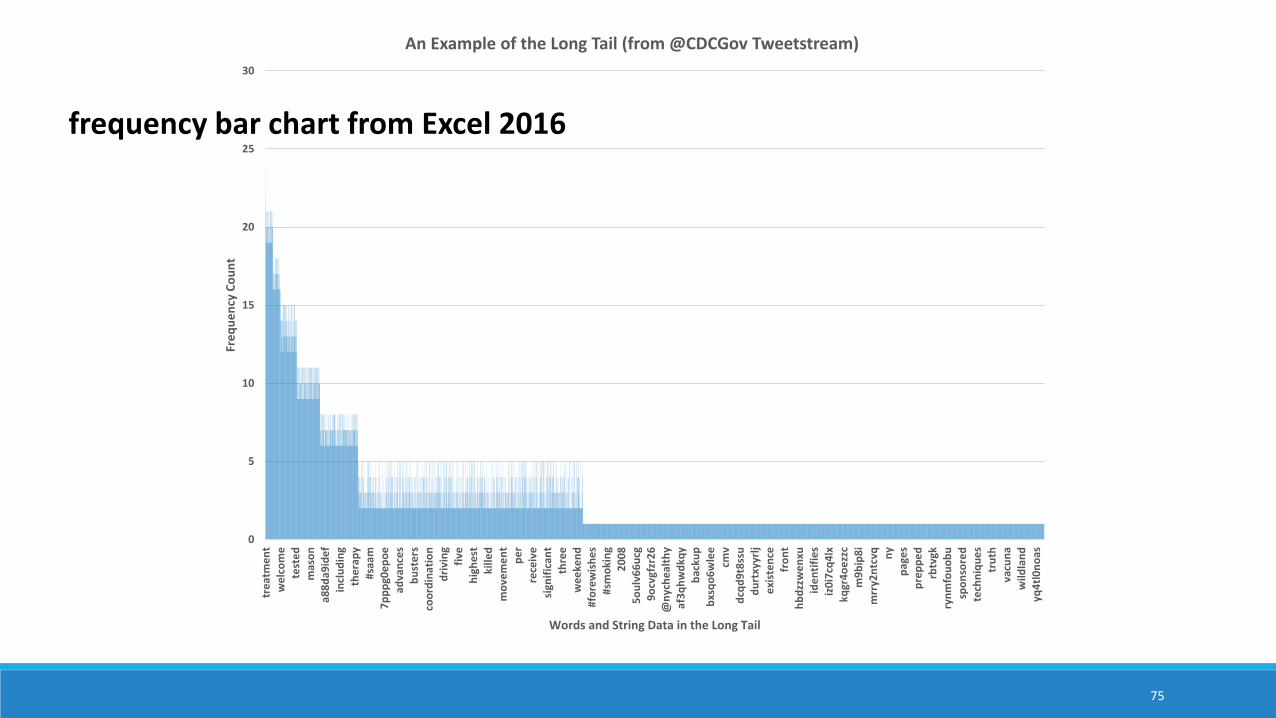
least frequent word count to capture the “long tail” from the Tweetstream
often alphanumeric garble, misspellings, and a few nuggetsof insight in the long tail
power law curve frequency distribution
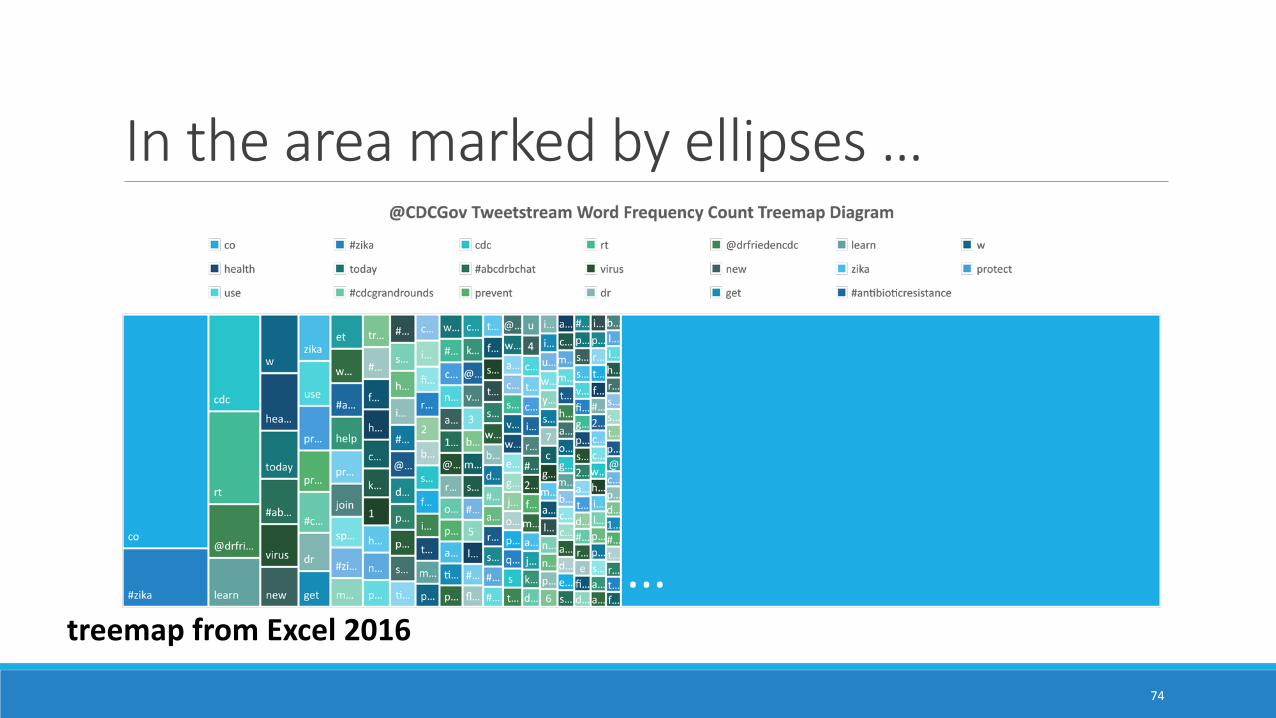
In the area marked by ellipses …
74
treemap from Excel 2016
75
0
5
10
15
20
25
30
trea
tmen
tw
elco
me
test
edm
ason
a88d
a9id
efin
clud
ing
ther
apy
#saa
m7p
ppg0
epoe
adva
nces
bust
ers
coor
dina
tion
driv
ing
five
high
est
kille
dm
ovem
ent
per
rece
ive
sign
ifica
ntth
ree
wee
kend
#for
ewis
hes
#sm
okin
g20
085o
ulv6
6ucg
9ocv
gfzr
26@
nych
ealth
yaf
3qhw
dkqy
back
upbx
sqo6
wle
ecm
vdc
qd9t
8ssu
durt
xyyr
ljex
iste
nce
fron
thb
dzzw
enxu
iden
tifie
siz
0i7c
q4lx
kqgr
4oez
zcm
9bip
8im
rry2
ntcv
q nypa
ges
prep
ped
rbtv
gkry
nmfo
uobu
spon
sore
dte
chni
ques
trut
hva
cuna
wild
land
yq4t
l0no
as
Freq
uenc
y Co
unt
Words and String Data in the Long Tail
An Example of the Long Tail (from @CDCGov Tweetstream)
frequency bar chart from Excel 2016
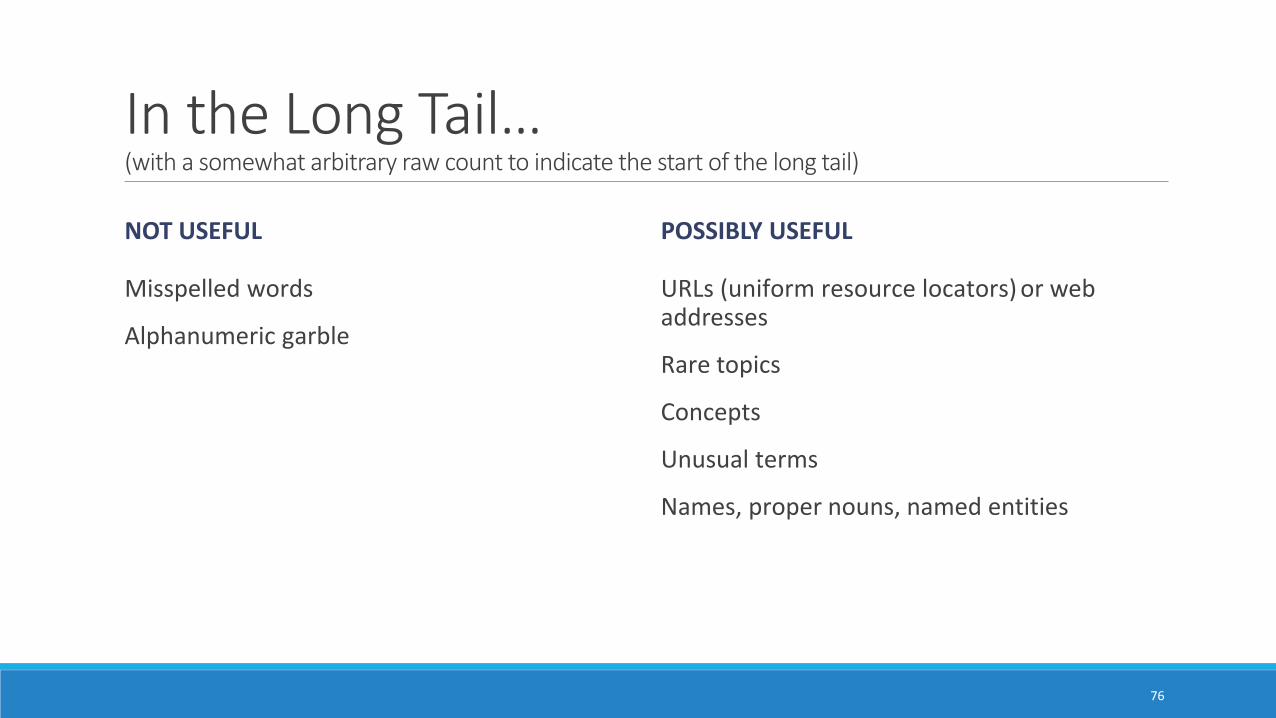
In the Long Tail… (with a somewhat arbitrary raw count to indicate the start of the long tail)
NOT USEFUL
Misspelled words
Alphanumeric garble
POSSIBLY USEFUL
URLs (uniform resource locators) or web addresses
Rare topics
Concepts
Unusual terms
Names, proper nouns, named entities
76
77
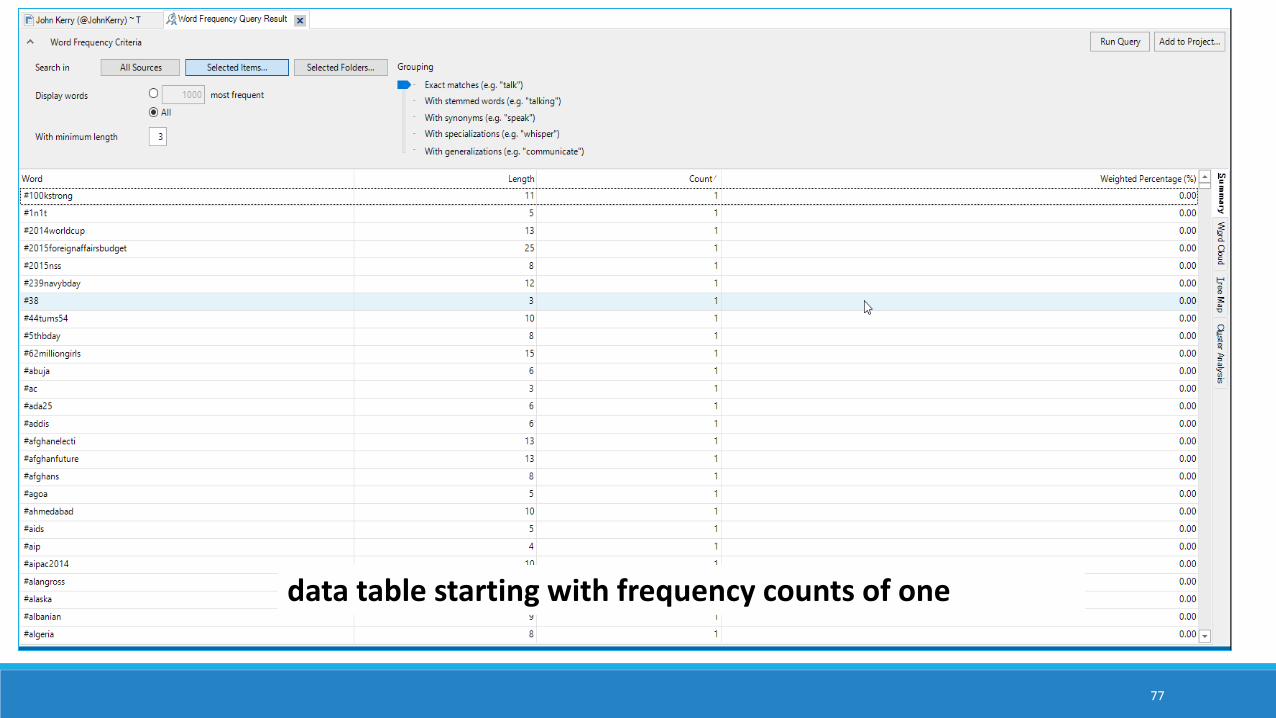
data table starting with frequency counts of one
78
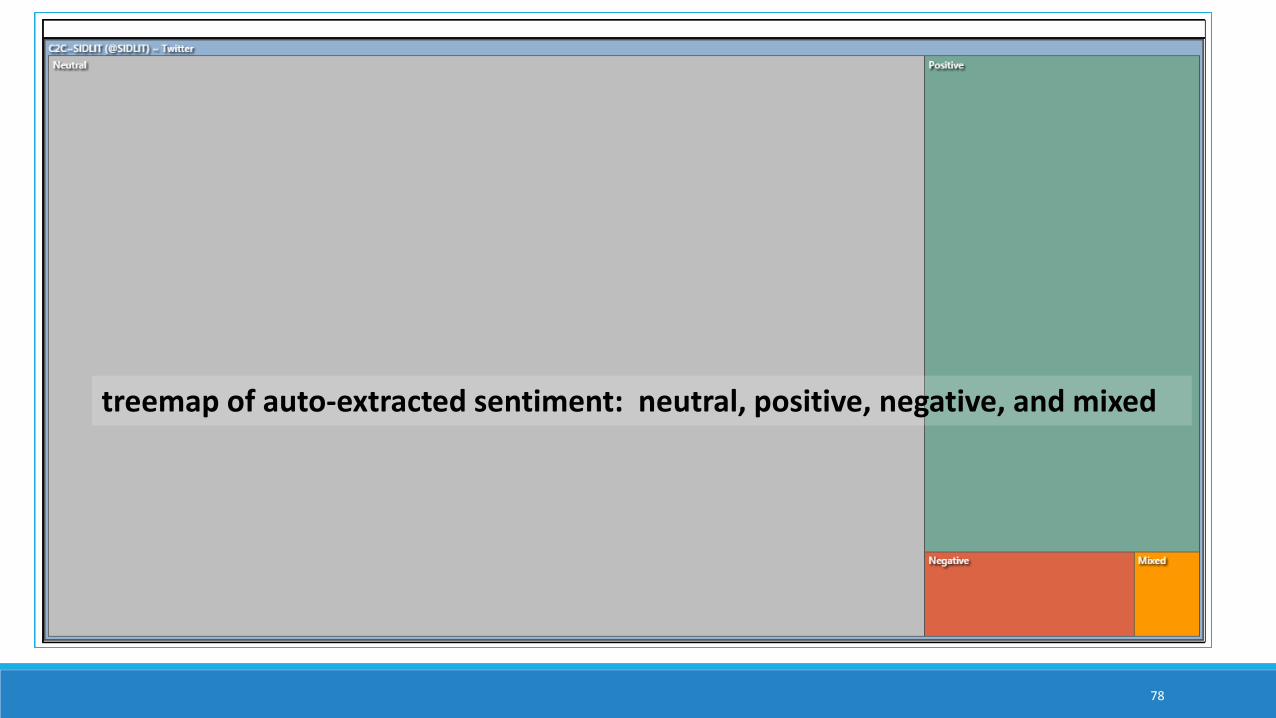
treemap of auto-extracted sentiment: neutral, positive, negative, and mixed
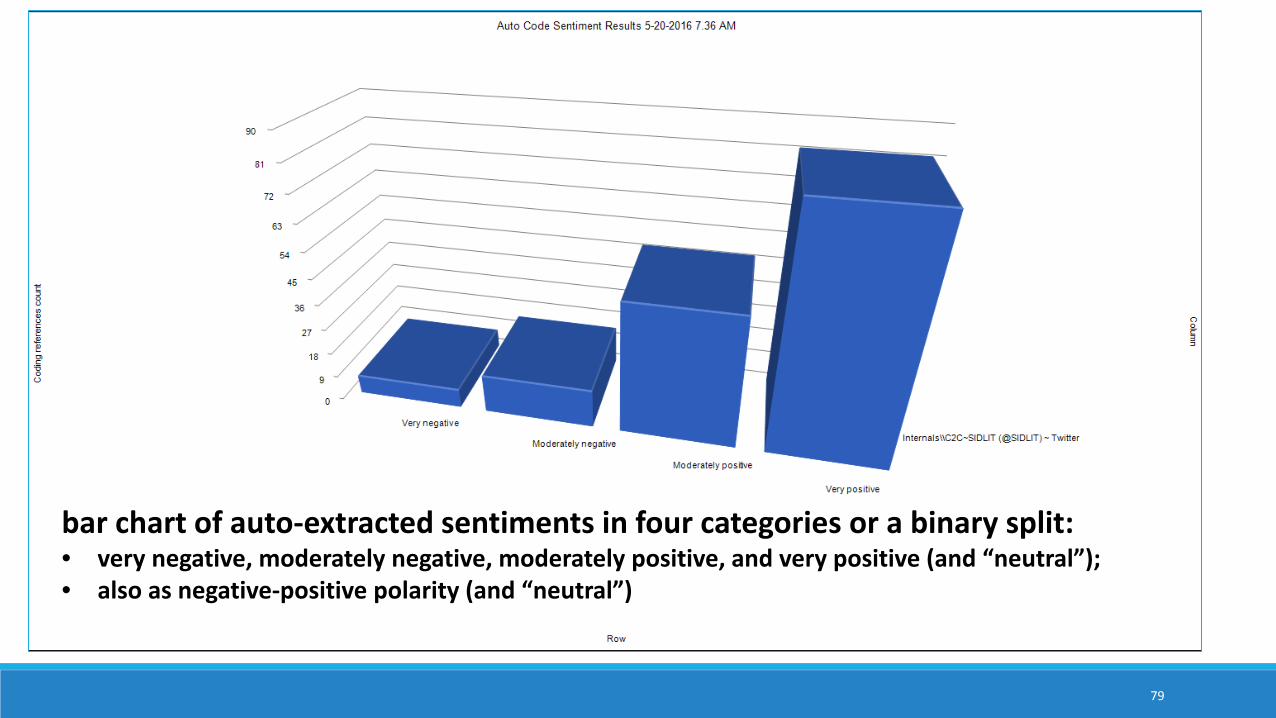
79
bar chart of auto-extracted sentiments in four categories or a binary split: • very negative, moderately negative, moderately positive, and very positive (and “neutral”); • also as negative-positive polarity (and “neutral”)
80
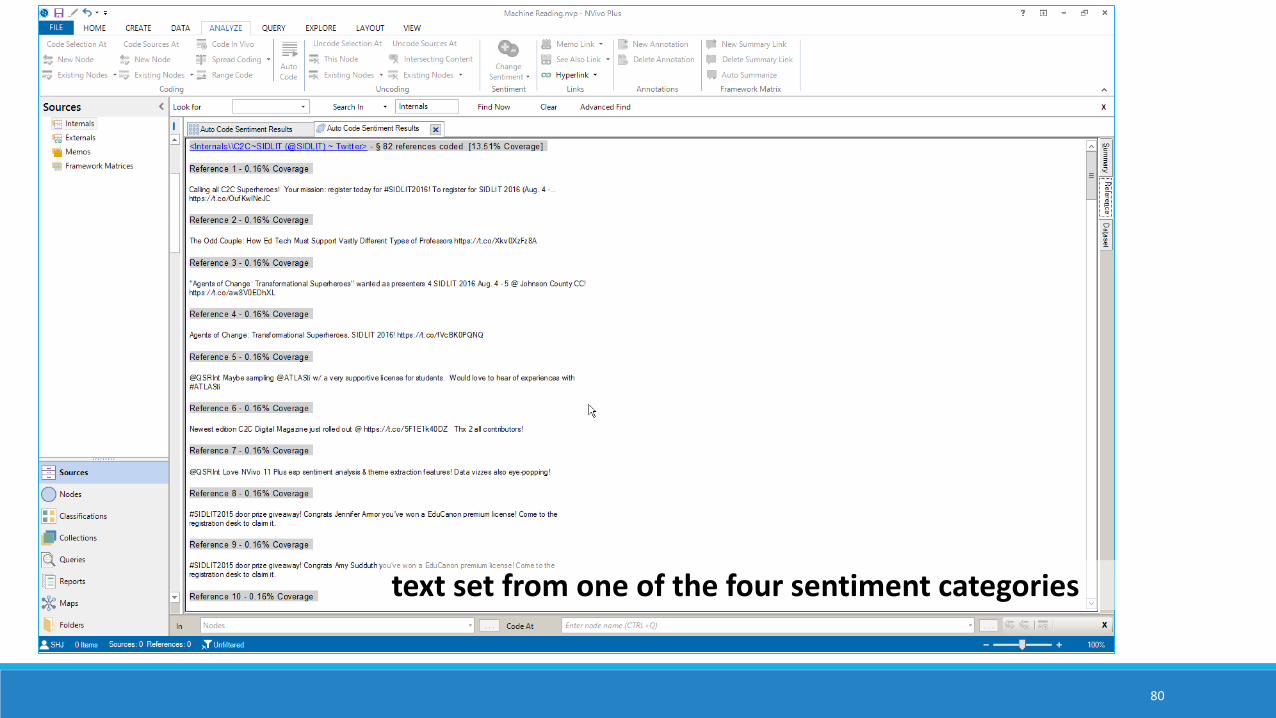
text set from one of the four sentiment categories
Use Case #3: Exploring Manual and Machine CodingExploring human-coded (and / or auto-coded or machine-coded) nodes for pattern identification: interrelationships, similarity clustering, and others
Data queries to enable coding exploration: word frequency count, text search, and others
Matrix coding query to explore interrelationships between codes (nodes)
81
Use Case #3 Work SequenceRaw source data ingested
Manual (and / or automated) coding of that data
Data queries of the coding to observe patterns in coding of that data◦ Ability to set up text frequency counts based on various parameters: exact matches, stemmed words,
synonyms, specializations, and generalizations
Text search with special character capabilities
Proximity searches for words occurring near a certain term
82
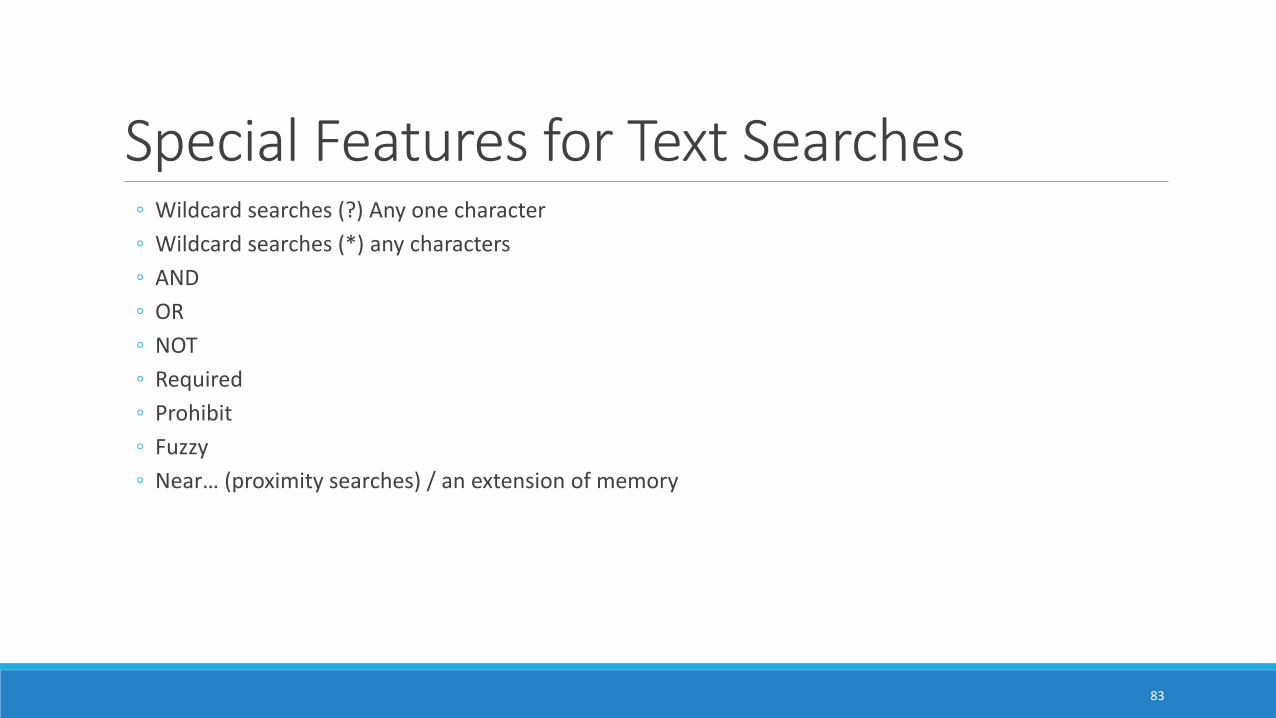
Special Features for Text Searches ◦ Wildcard searches (?) Any one character ◦ Wildcard searches (*) any characters ◦ AND ◦ OR ◦ NOT ◦ Required ◦ Prohibit ◦ Fuzzy ◦ Near… (proximity searches) / an extension of memory
83
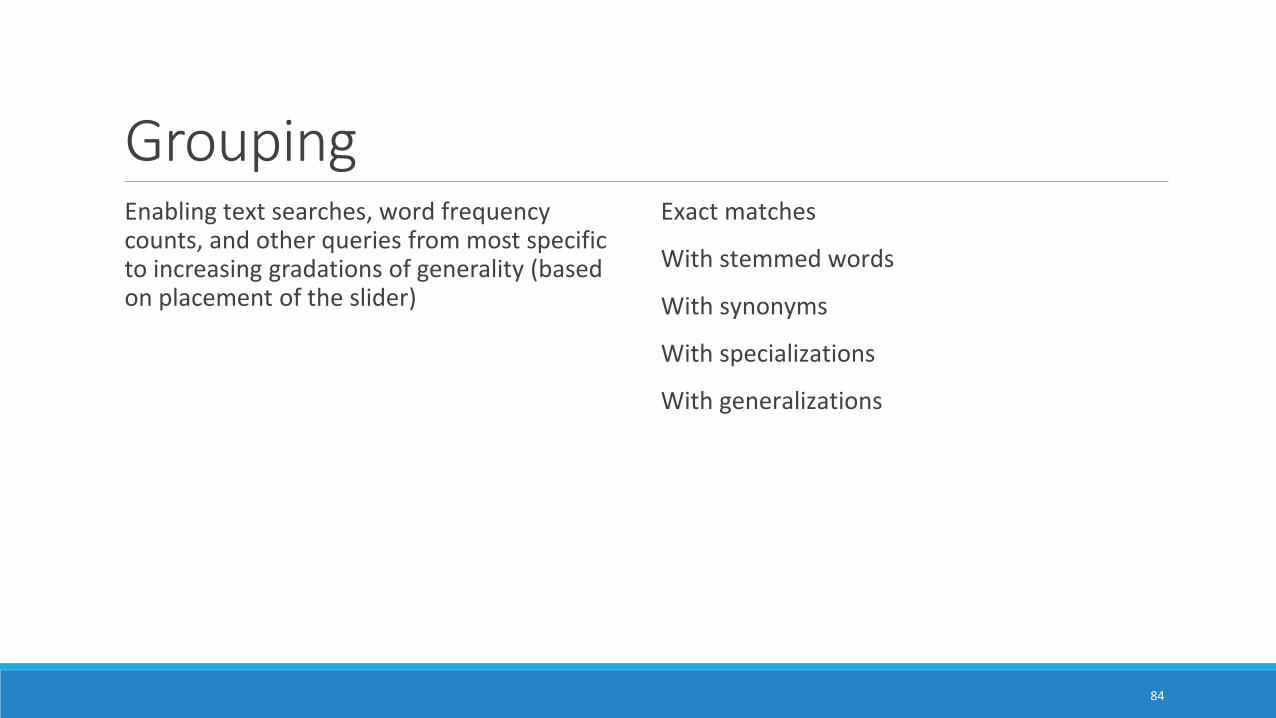
GroupingEnabling text searches, word frequency counts, and other queries from most specific to increasing gradations of generality (based on placement of the slider)
Exact matches
With stemmed words
With synonyms
With specializations
With generalizations
84
85
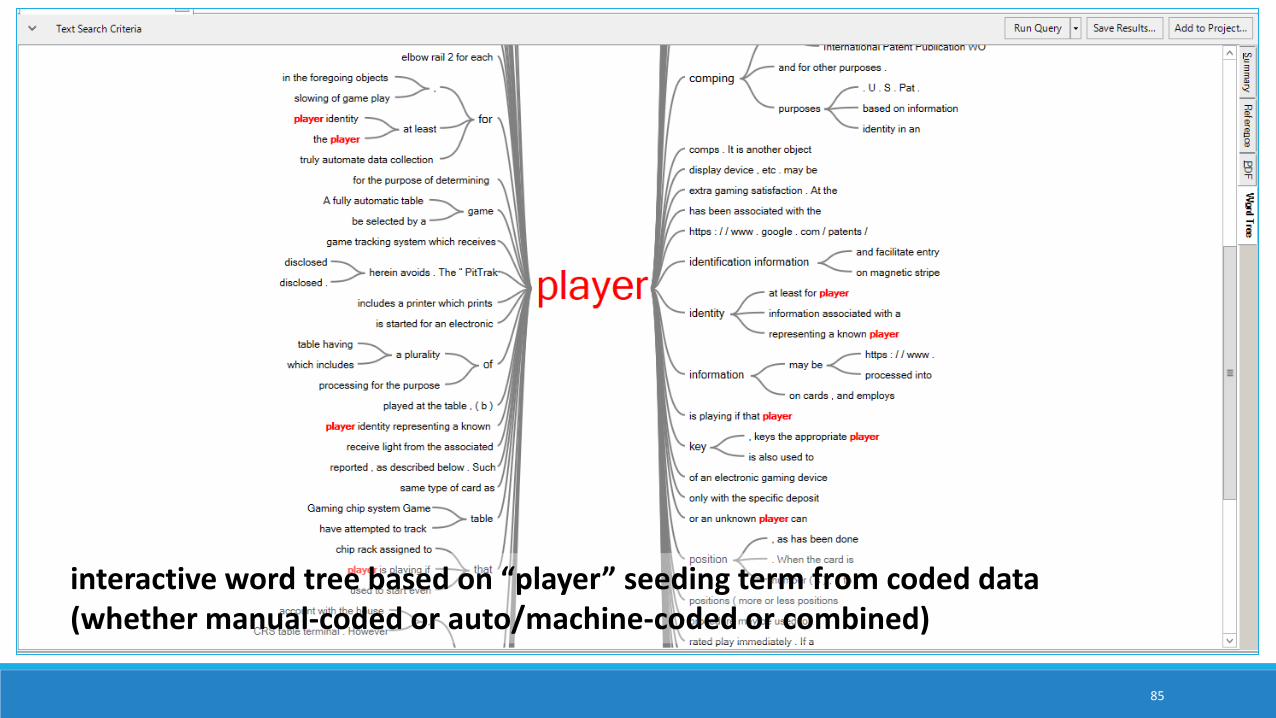
interactive word tree based on “player” seeding term from coded data (whether manual-coded or auto/machine-coded or combined)
86
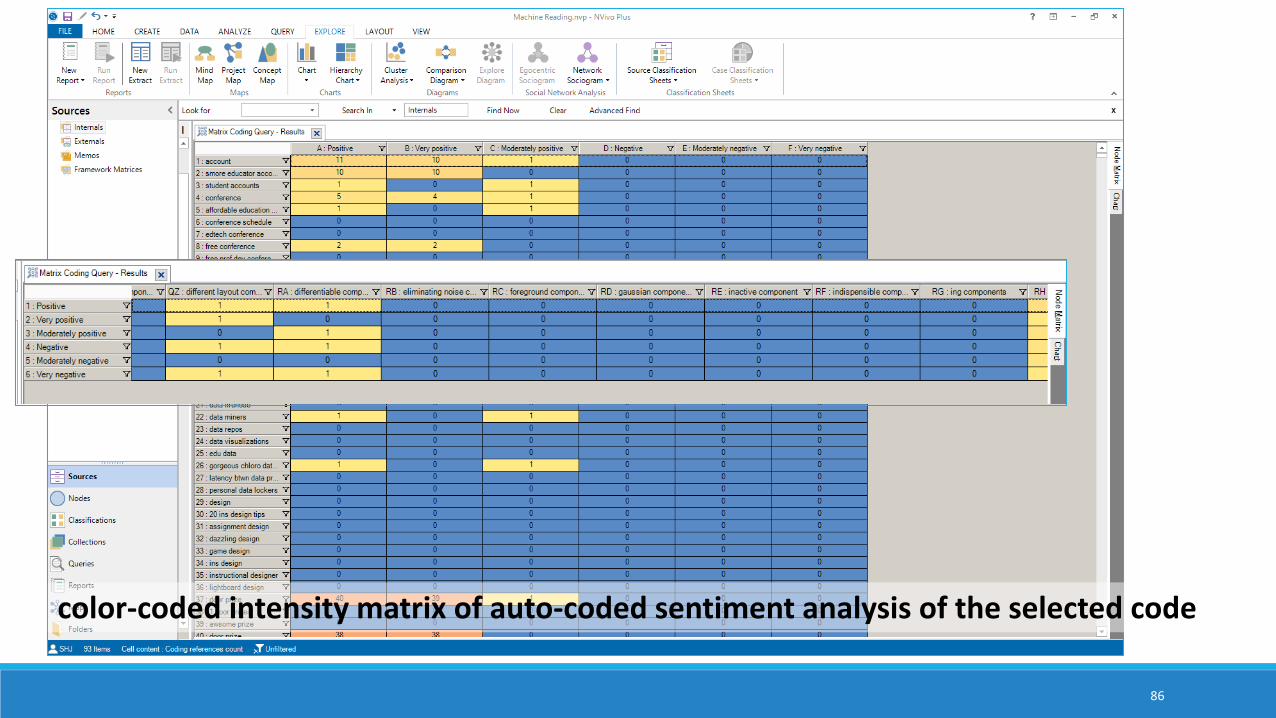
color-coded intensity matrix of auto-coded sentiment analysis of the selected code
87
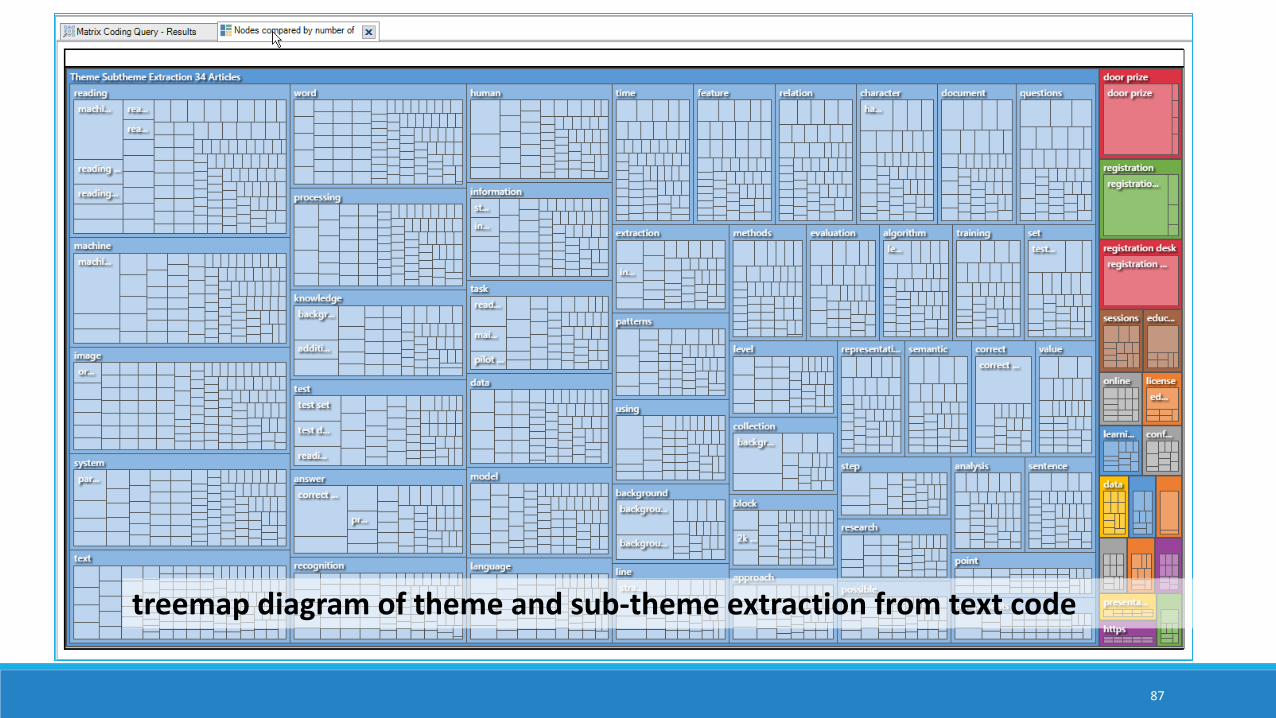
treemap diagram of theme and sub-theme extraction from text code
88
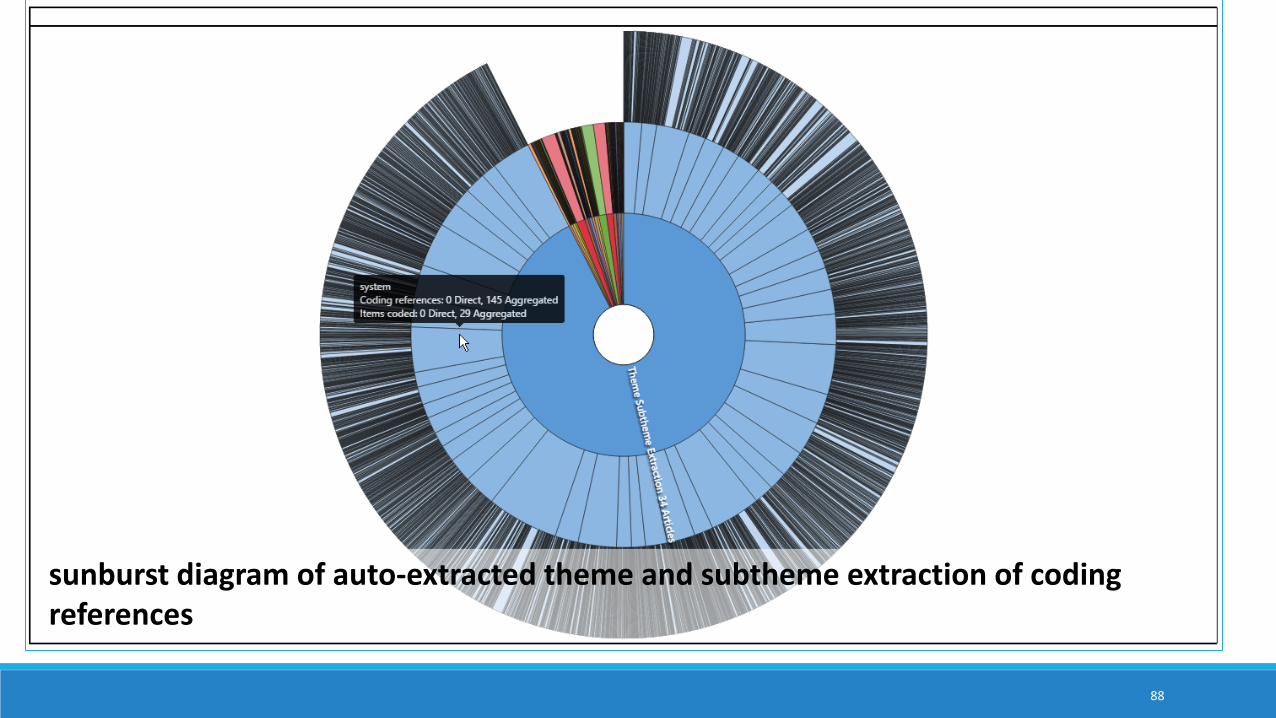
sunburst diagram of auto-extracted theme and subtheme extraction of coding references
89
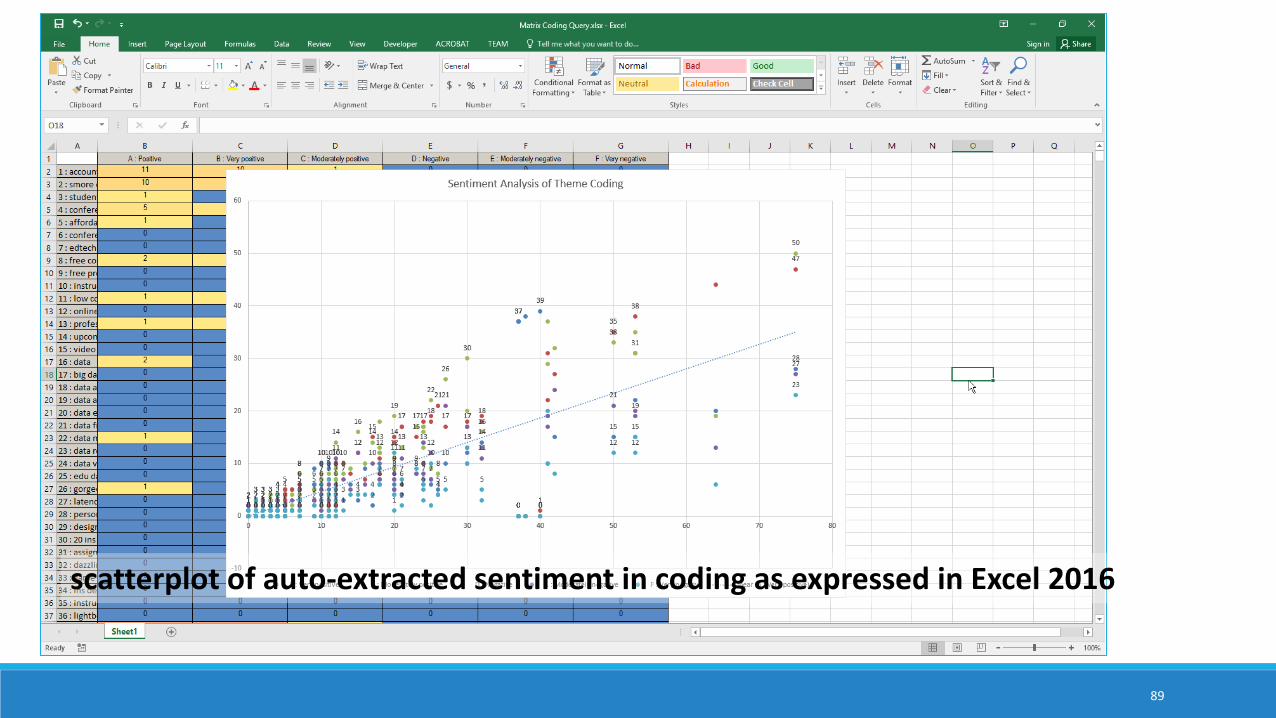
scatterplot of auto-extracted sentiment in coding as expressed in Excel 2016
Use Case #4: Machine Reading for Sentiment Analysis Ability to conduct a fast extraction of sentiment ◦ either as a polarity (positive-negative), with uncoded neutral text, or as ◦ a four-category set of sentiment (very negative, moderately negatively, moderately positive, and very
positive) and one of neutrality
Ability to explore the sentiment-coded text sets for textual contents ◦ Ability to query the coded text sets for additional word relationships and patterns
Ability to uncode or re-code autocoded text for sentiment to increase accuracy (through human oversight)
90
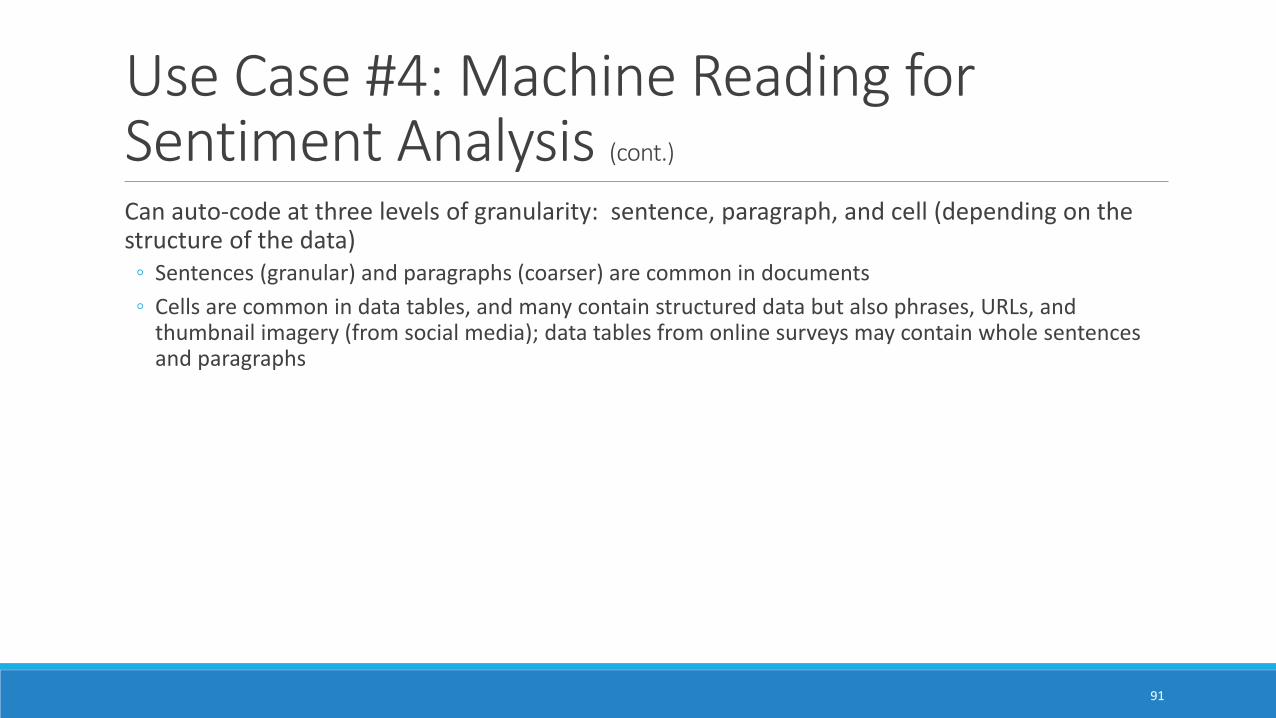
Use Case #4: Machine Reading for Sentiment Analysis (cont.)
Can auto-code at three levels of granularity: sentence, paragraph, and cell (depending on the structure of the data) ◦ Sentences (granular) and paragraphs (coarser) are common in documents ◦ Cells are common in data tables, and many contain structured data but also phrases, URLs, and
thumbnail imagery (from social media); data tables from online surveys may contain whole sentences and paragraphs
91
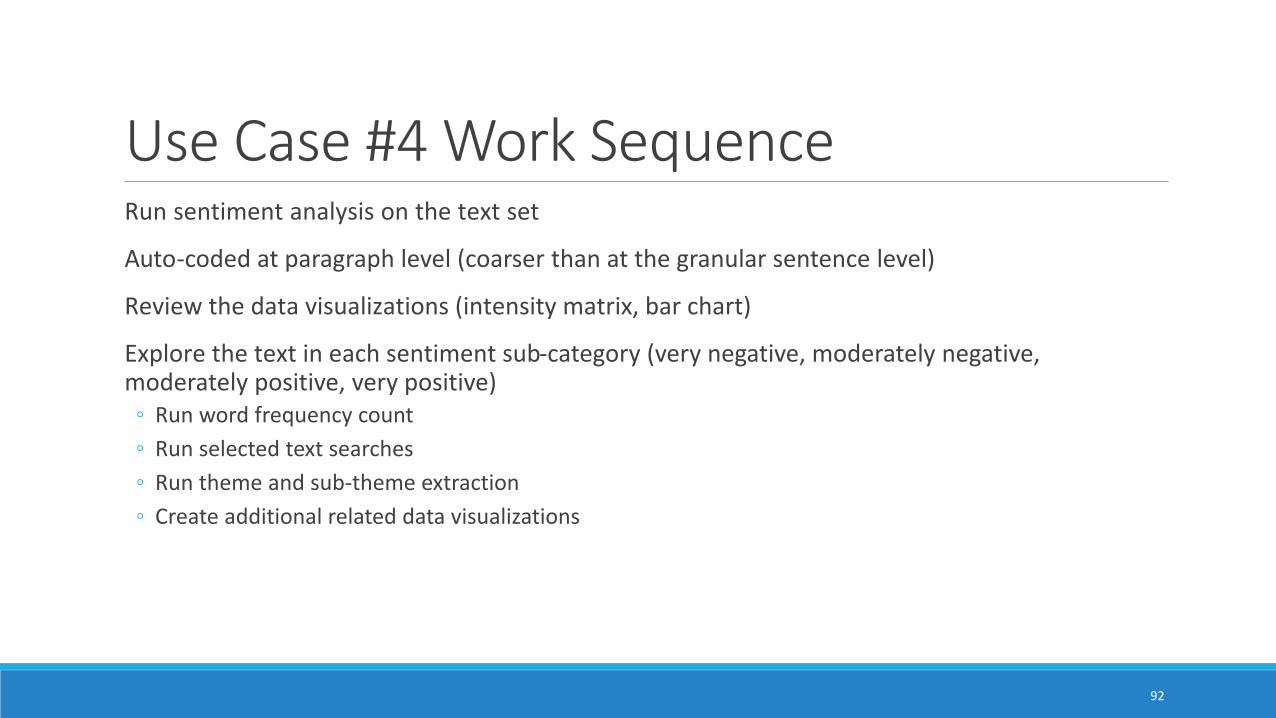
Use Case #4 Work SequenceRun sentiment analysis on the text set
Auto-coded at paragraph level (coarser than at the granular sentence level)
Review the data visualizations (intensity matrix, bar chart)
Explore the text in each sentiment sub-category (very negative, moderately negative, moderately positive, very positive) ◦ Run word frequency count ◦ Run selected text searches◦ Run theme and sub-theme extraction ◦ Create additional related data visualizations
92
93
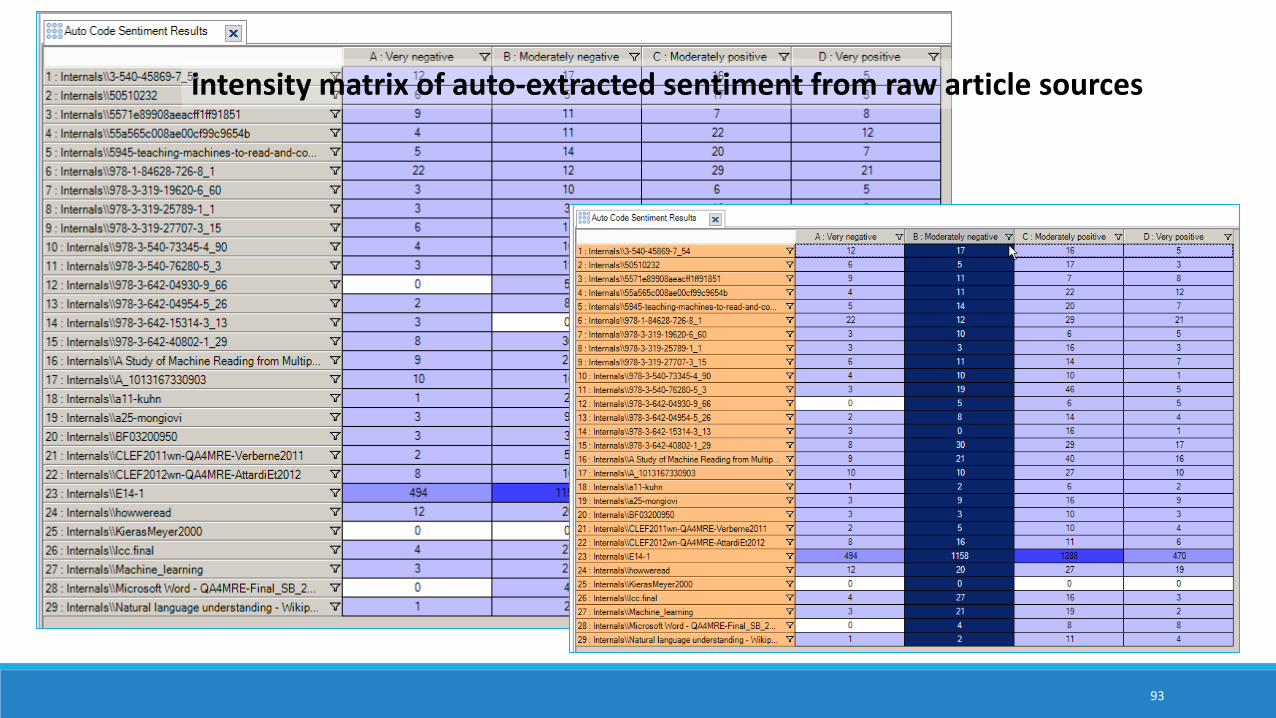
intensity matrix of auto-extracted sentiment from raw article sources
94
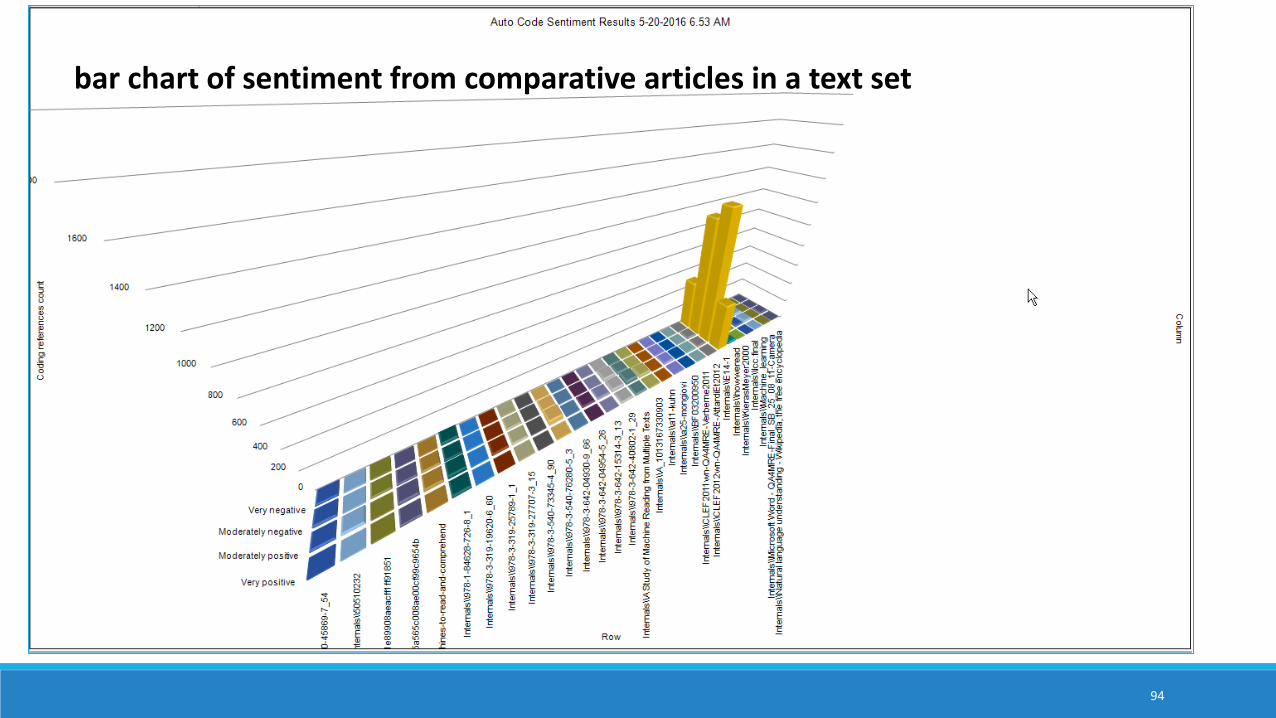
bar chart of sentiment from comparative articles in a text set
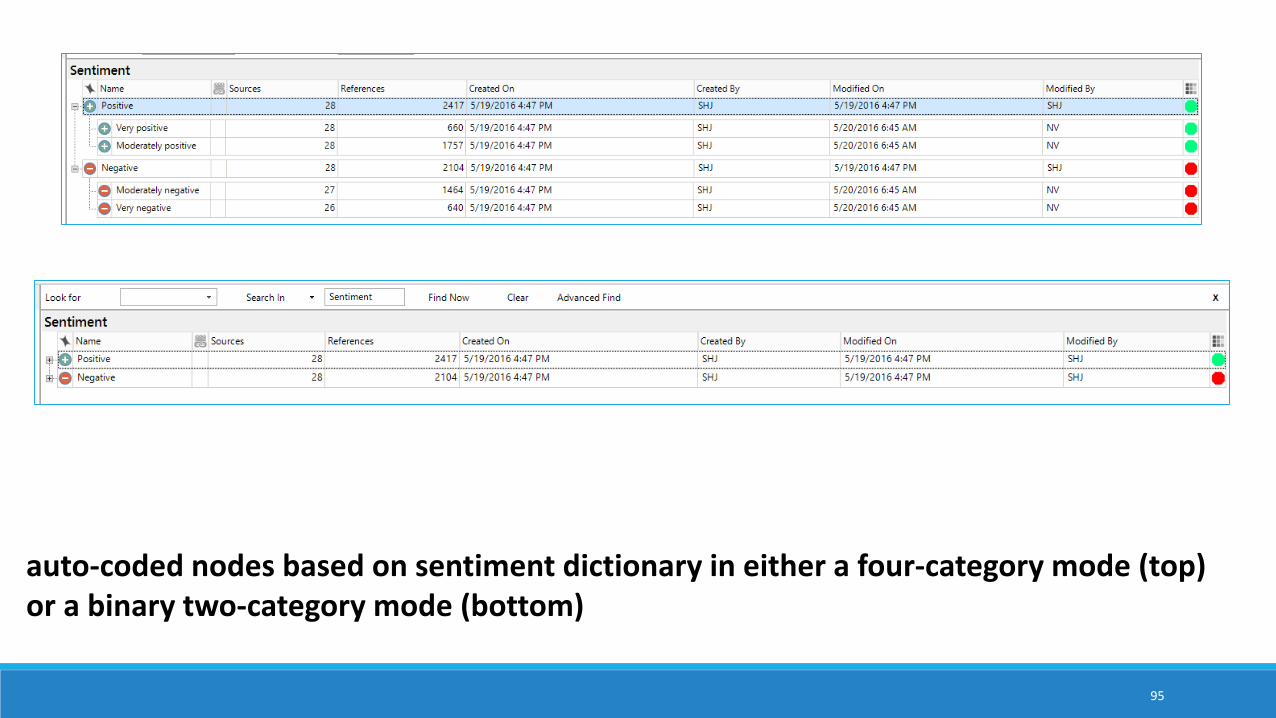
95
auto-coded nodes based on sentiment dictionary in either a four-category mode (top) or a binary two-category mode (bottom)
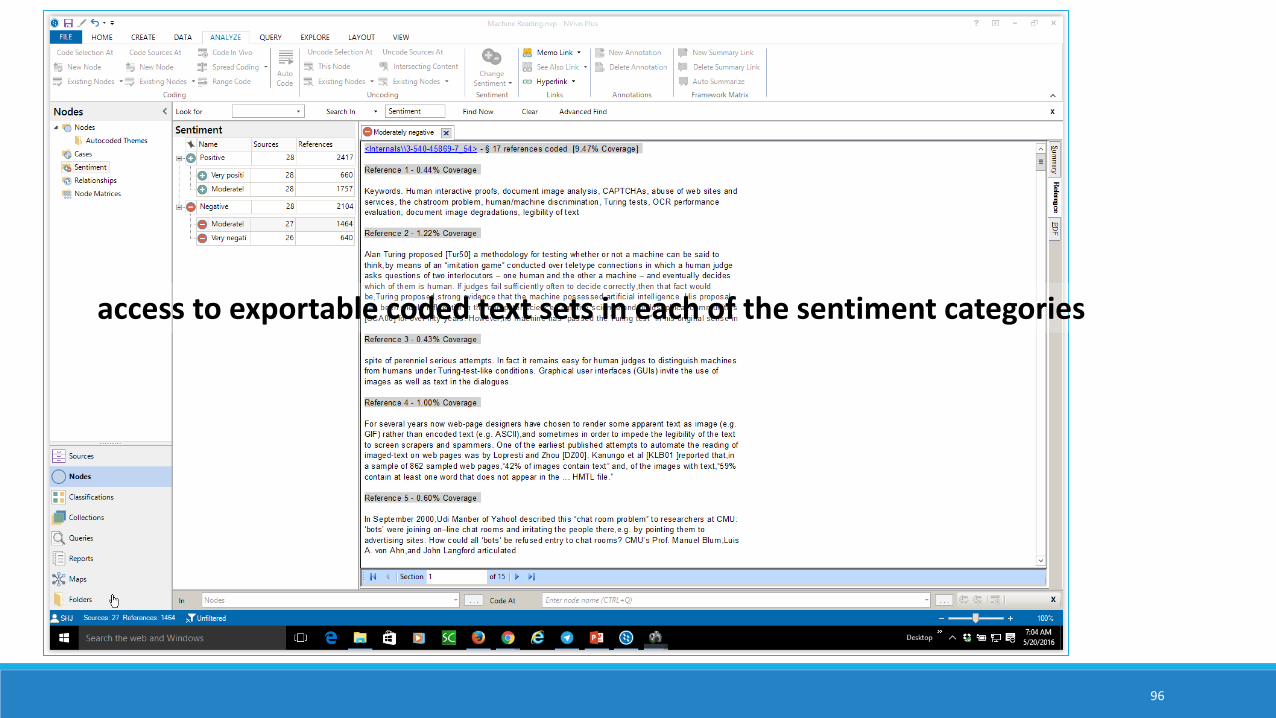
96
access to exportable coded text sets in each of the sentiment categories
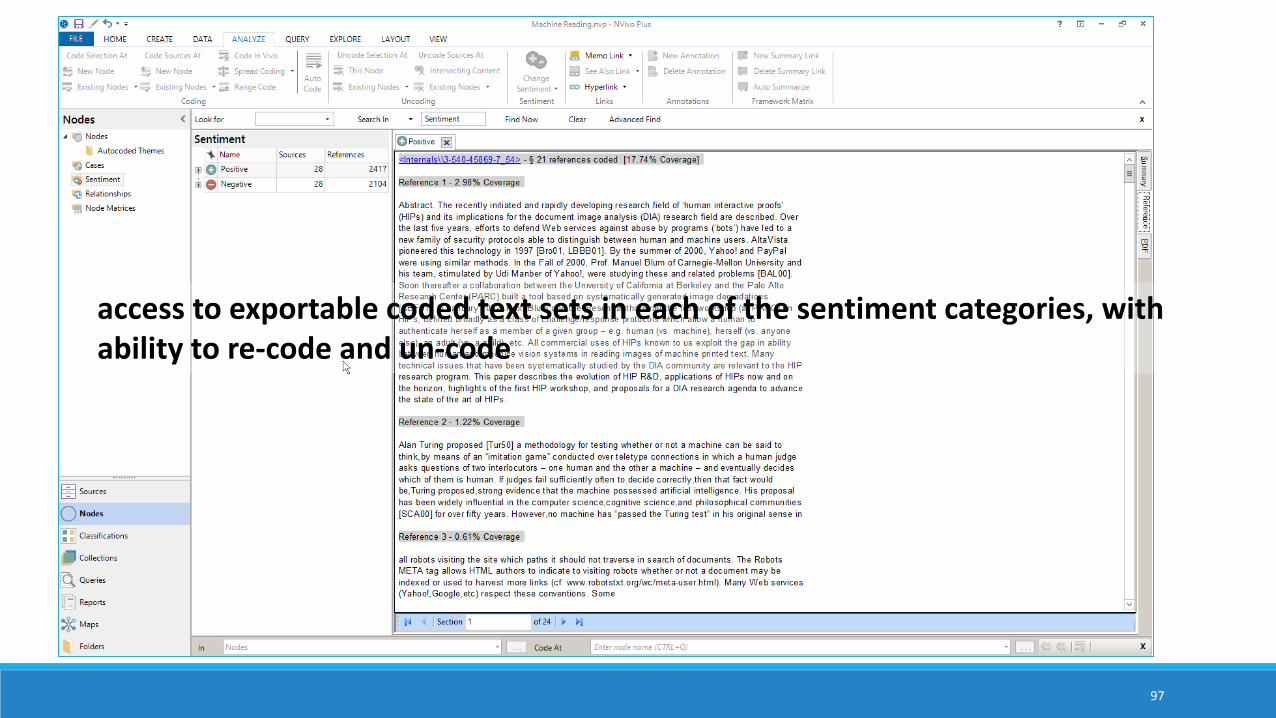
97
access to exportable coded text sets in each of the sentiment categories, with ability to re-code and un-code
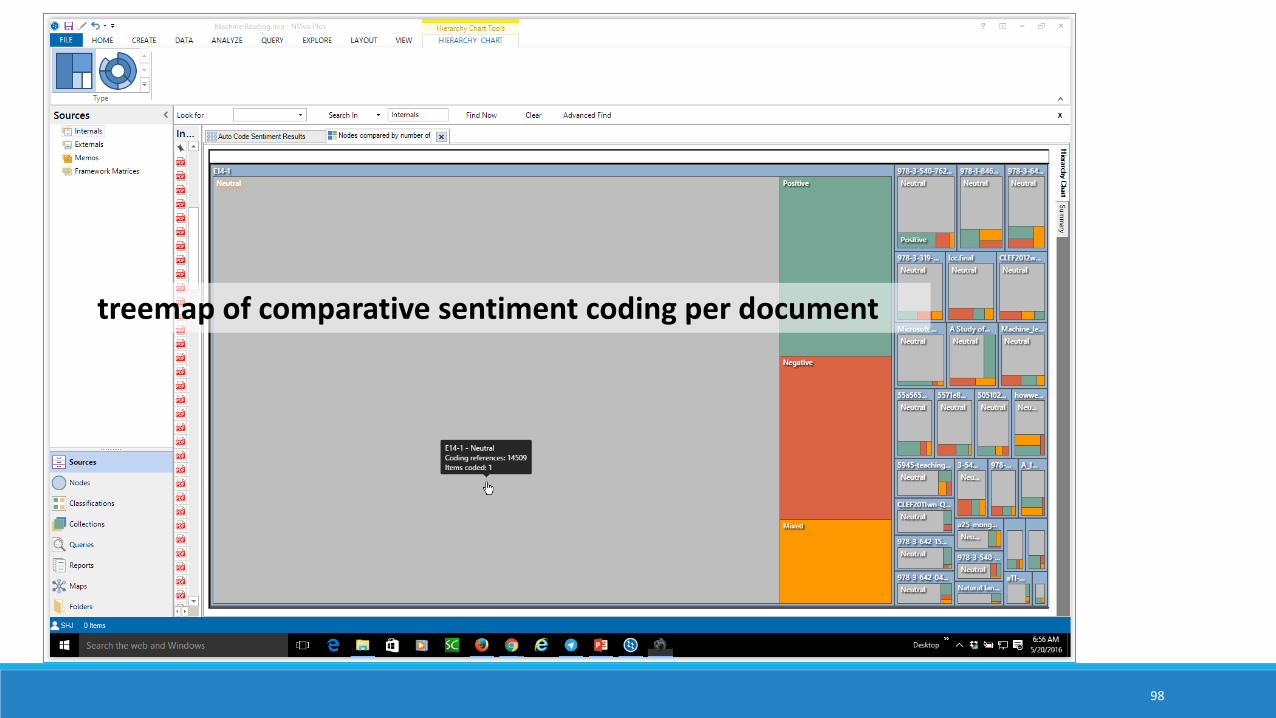
98
treemap of comparative sentiment coding per document
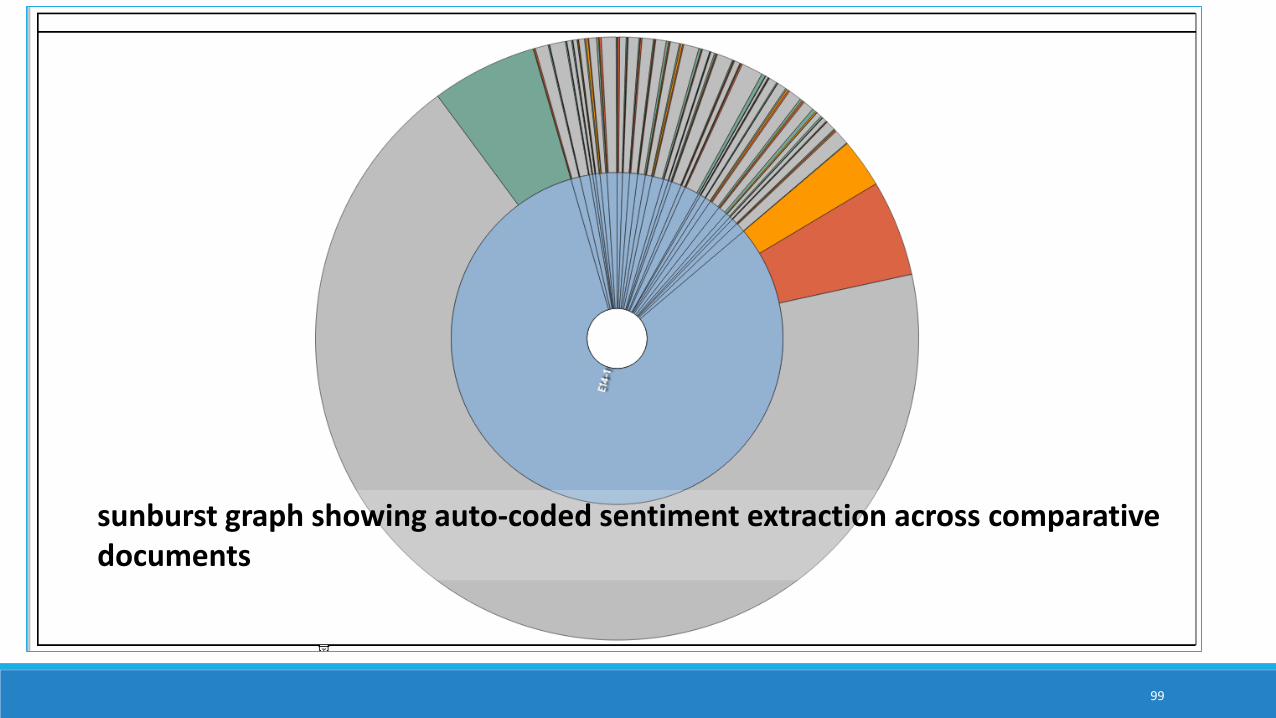
99
sunburst graph showing auto-coded sentiment extraction across comparative documents
Value-added Aspects to Machine Reading Machine reading augments human capabilities for knowing. It decodes (“reads”) beyond a surface level of understanding of words in various contexts. ◦ It enables efficient access to latent insights. ◦ There are ways to chain processes and compare / contrast information in a way that illuminates new
insights.
NVivo 11 Plus enables ways to save “macros” of the various data queries and autocodingsequences to enhance re-runs of the macro sequences. This may be helpful with continuing data collection, in order to update query results after the acquisition of new data.
There is value in comparing the outcomes from one software program to another…and to see what happens with different settings for the different machine reading approaches. ◦ Researchers may export data tables for additional analytics and data visualizations outside of the
software.
100
Demos (if time allows)
101
Questions? Comments?
102
Conclusion and Contact Dr. Shalin Hai-Jew◦ iTAC, Kansas State University ◦ 212 Hale / Farrell Library ◦ [email protected]◦ 785-532-5262
No ties: The presenter has no formal tie to QSR International, the maker of NVivo 11 Plus, nor to Microsoft, the maker of Excel.
About the data visualizations: Some of the data extractions and processes used only a few dozen source items, in part because of the need for coherent data visualizations and also to enable processing of the data on a local Windows machine. ◦ However, in a server-hosted context, text sets closer to big(ger) data may be run using NVivo 11 Plus.
A sampling: The four “use cases” presented here are by no means comprehensive. These offer a taste of some of the possibilities.
103