Capital Markets Seminar - HICL | Long-term equity … CMS 4 February 2016_0... · Capital Markets...
63
Capital Markets Seminar Delivering Real Value 4 February 2016 hicl.com
-
Upload
truongthien -
Category
Documents
-
view
216 -
download
0
Transcript of Capital Markets Seminar - HICL | Long-term equity … CMS 4 February 2016_0... · Capital Markets...
Capital Markets Seminar Delivering Real Value
4 February 2016
hicl.com
Disclaimer
By attending the meeting where this presentation is made, or by reading the presentation slides, you agree to be bound by the following limitations:
This document is an advertisement and is not a prospectus. Any decision to purchase shares in HICL Infrastructure Company Limited (the "Company") should be made solely on the basis of the prospectus, reports & accounts, and trading updates published by the Company, which are available from the HICL Website, www.hicl.com. The information in this document has been prepared by the Company solely to give an overview of the Company and the markets in which it operates.
This document is being distributed in the UK to, and is directed only at, persons who have professional experience in matters relating to investments who fall within the definition of "investment professionals" in Article 19(5) of, or a person falling within Article 49(2) (High Net Worth Companies, etc.) of, the Financial Services and Markets Act 2000 (Financial Promotion) Order 2005 of the United Kingdom (all such persons together being referred to as "relevant persons"). Any person who is not a relevant person should not act or rely on this presentation or this document or any of its contents. The information in this presentation is given in confidence and the recipients of this presentation should not engage in any behaviour in relation to qualifying investments or related investments (as defined in the Financial Services and Markets Act 2000 ("FSMA") and the Code of Market Conduct made pursuant to FSMA) which would or might amount to market abuse for the purposes of FSMA.
In EU member states, the Company’s shares will only be offered to the extent that the Company: (i) is permitted to be marketed into the relevant EEA jurisdiction pursuant to either Article 36 or 42 of the AIFMD (if and as implemented into local law); or (ii) can otherwise be lawfully offered or sold (including on the basis of an unsolicited request from a professional investor).
No representation or warranty, express or implied, is made as to, and no reliance should be placed on, the fairness, accuracy, completeness or correctness of the information, or opinions contained herein. Neither the Company, nor any of the Company's advisers or representatives, including its investment adviser, InfraRed Capital Partners Limited, shall have any responsibility or liability whatsoever (for negligence or otherwise) for any loss howsoever arising from any use of this document or its contents or otherwise arising in connection with this document. The information set out herein may be subject to updating, completion, revision, verification and amendment and such information may change materially. Neither the Company nor any other person is under an obligation to keep current the information contained in this document.
This document has not been approved by the UK Financial Conduct Authority or any other regulator. This document does not constitute or form part of, and should not be construed as, an offer, invitation or inducement to purchase or subscribe for any securities nor shall it or any part of it form the basis of, or be relied upon in connection with, any contract or commitment whatsoever. This document does not constitute a recommendation regarding the securities of the Company.
The information communicated in this document contains certain statements that are or may be forward looking. These statements typically contain words such as "expects" and "anticipates" and words of similar import. By their nature forward looking statements involve risk and uncertainty because they relate to events and depend on circumstances that will occur in the future. An investment in the Company will involve certain risks. In particular, certain figures provided in this presentation rely in part on large and detailed financial models; there is a risk that errors may be made in the assumptions or methodology used in a financial model. The Company’s targeted returns are based on assumptions which the Company considers reasonable. However, there is no assurance that all or any assumptions will be justified, and the Company’s returns may be correspondingly reduced. In particular, there is no assurance that the Company will achieve its distribution and IRR targets (which for the avoidance of doubt are targets only and not profit forecasts). A summary of the material risks relating to the Company and an investment in the securities of Company are set out in the section headed "Risk Factors" in the February 2013 Prospectus.
The publication and distribution of this document may be restricted by law in certain jurisdictions and therefore persons into whose possession this document comes or who attend the presentation should inform themselves about and observe any such restrictions. Any failure to comply with these restrictions could result in a violation of the laws of such jurisdiction. In particular, this document and the information contained herein, are not for publication or distribution, directly or indirectly, to persons in the United States (within the meaning of Regulation S under the US Securities Act of 1933, as amended (the "Securities Act")) or to entities in Canada, Australia or Japan. The securities of the Company have not been and will not be registered under the Securities Act and may not be offered or sold in the United States except to certain persons in offshore jurisdictions in reliance on Regulation S. Neither these slides nor any copy of them may be taken or transmitted into or distributed in Canada, Australia, Japan or any other jurisdiction which prohibits the same except in compliance with applicable securities laws. Any failure to comply with this restriction may constitute a violation of the United States or other national securities laws.
This presentation and subsequent discussion may contain certain forward looking statements with respect to the financial condition, results of operations and business of HICL Infrastructure Company Limited and its corporate subsidiaries (the “Group”). These forward-looking statements represent the Group’s expectations or beliefs concerning future events and involve known and unknown risks and uncertainty that could cause actual results, performance or events to differ materially from those expressed or implied in such statements. Additional detailed information concerning important factors that could cause actual results to differ materially is available in our Annual Report & Consolidated Financial Statements for the year ended 31 March 2015 available from the Company's website. Unless otherwise stated, the facts contained herein are accurate as at 31 January 2016.
Past performance is not a reliable indicator of future performance.
hicl.com | 2

Value Preservation
Health & Safety Executive Merseyside Headquarters

Value preservation
▲ What do we do?
Drive physical delivery of construction and operations
Ensure contract performance
▲ How do we do it?
Experienced team
Proactive approach
Manage key relationships
Robust risk management framework
▲ What does this mean for investors?
Delivering base case returns
Well-positioned to deliver successful projects for all stakeholders
hicl.com | 4
Delivery and contract performance

Value Preservation
Central Role of Asset Management
Health & Safety Executive Merseyside Headquarters

00
Typical project structure
hicl.com | 6
Asset management responsibilities in context
Project Company
Project Company manager
Other stakeholders
(users)
Insurers
Equity (HICL)
Senior debt Bank / bonds
Design & build
FM provider
Client
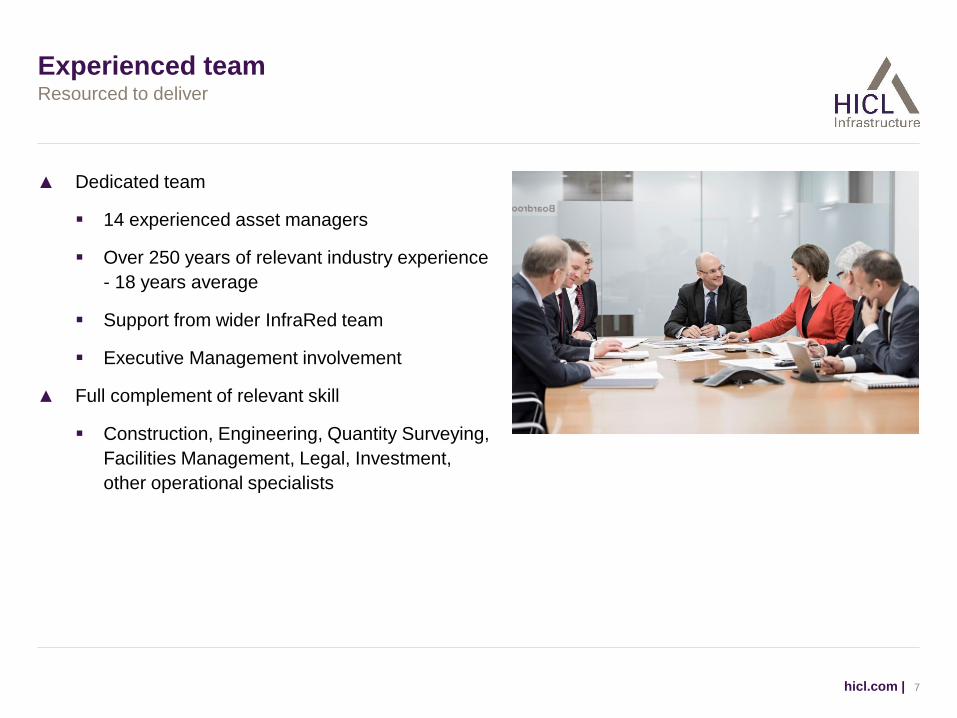
Experienced team
▲ Dedicated team
14 experienced asset managers
Over 250 years of relevant industry experience
- 18 years average
Support from wider InfraRed team
Executive Management involvement
▲ Full complement of relevant skill
Construction, Engineering, Quantity Surveying,
Facilities Management, Legal, Investment,
other operational specialists
hicl.com | 7
Resourced to deliver

How we preserve value – active management approach
▲ Effective due diligence pre-acquisition
Assessment of technical reports, asset inspections and operational reviews
▲ Focus on value added involvement post-acquisition
Effective transition planning
Strategic oversight, good governance, key relationships
Harvest best practice and capture lessons learned
Manage the teams on the ground responsible for day-to-day project management
▲ A few specifics
Being proactive
Solving a real challenge
Managing a potential dispute
hicl.com | 8
Proactive board level stewardship

South West (Enniskillen) Hospital
hicl.com | 9
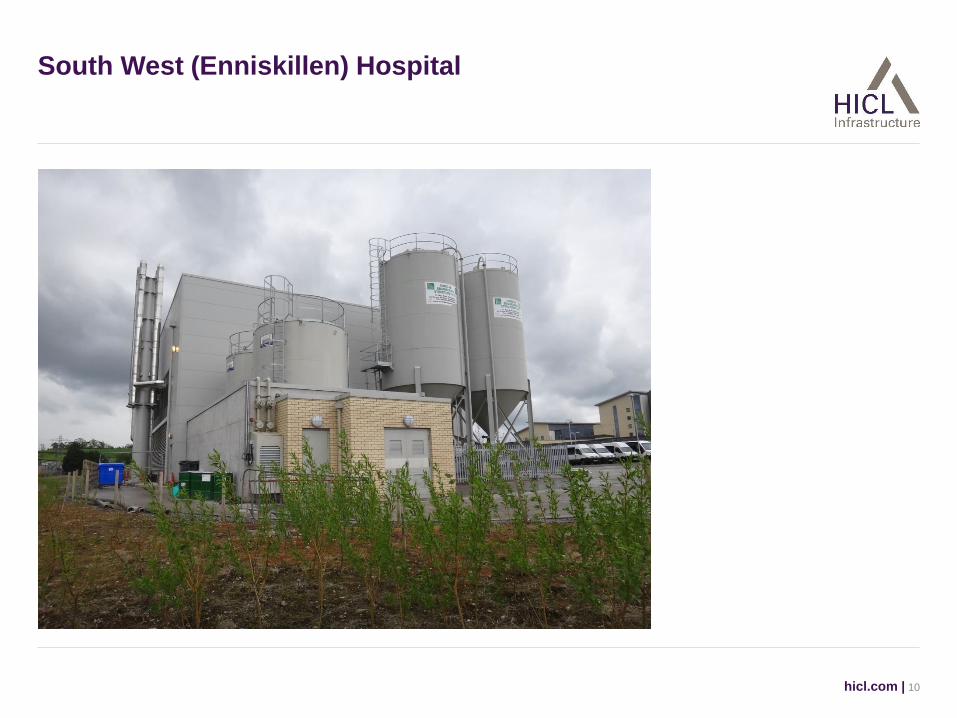
South West (Enniskillen) Hospital
hicl.com | 10

South West (Enniskillen) Hospital
hicl.com | 11

How we preserve value – relationship management
▲ Thousands of people interact with our projects every day
‘Live’ projects, broad range of stakeholders (e.g. client, subcontractors, end users, etc.)
▲ Focus on productive working relationships with key stakeholders
Partnering approach
Positive impact on operational efficiency
Eases resolution of issues when they arise
▲ Enforcement of contract terms when material disputes occur
Last resort, undertaken with care
Costs and process to be controlled
hicl.com | 12
Being a good partner is key

How we preserve value – relationship management
hicl.com | 13
Operational efficiencies
Source: InfraRed
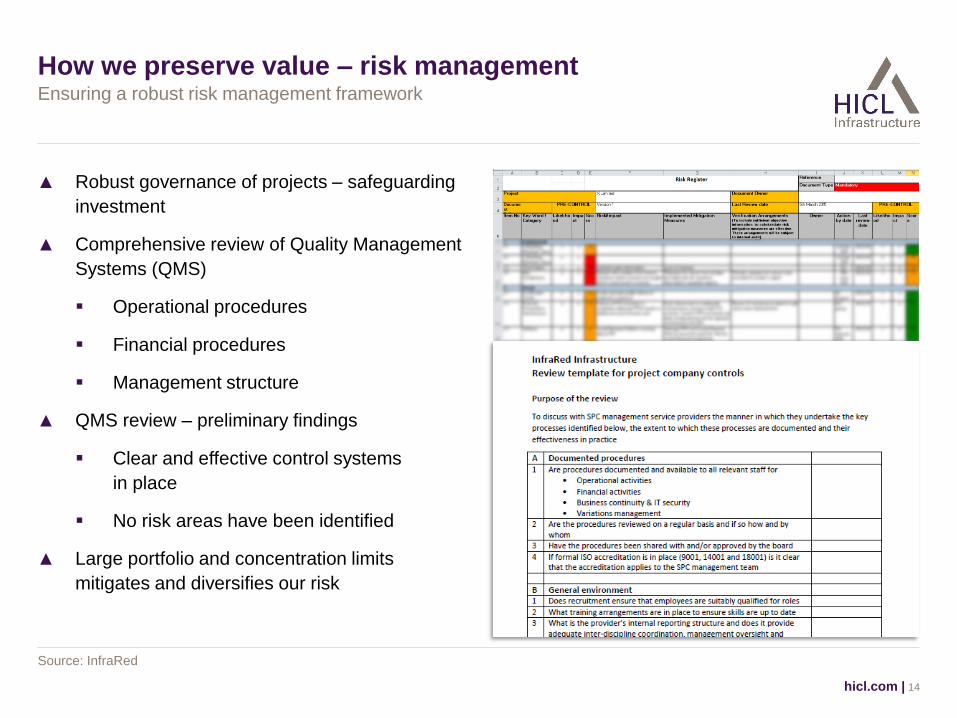
How we preserve value – risk management
▲ Robust governance of projects – safeguarding
investment
▲ Comprehensive review of Quality Management
Systems (QMS)
Operational procedures
Financial procedures
Management structure
▲ QMS review – preliminary findings
Clear and effective control systems
in place
No risk areas have been identified
▲ Large portfolio and concentration limits
mitigates and diversifies our risk
hicl.com | 14
Ensuring a robust risk management framework
Source: InfraRed
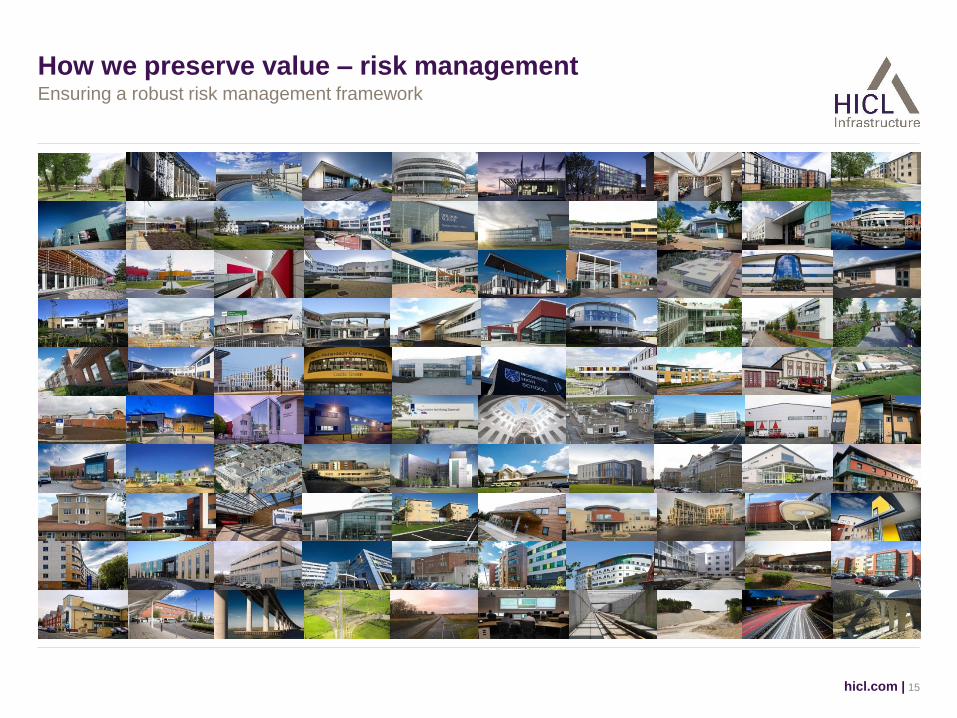
How we preserve value – risk management
hicl.com | 15
Ensuring a robust risk management framework
Value Preservation
Asset Management: Tools of the Trade
Health & Safety Executive Merseyside Headquarters

Managing lifecycle costs
▲ What are Lifecycle costs?
Costs of undertaking major maintenance and asset
replacement; large technical equipment
▲ Detailed plans and management tools to optimise whole life costs
and minimise risk of asset failure
Asset condition surveys, detailed budgets, credible forecasts
Bulk buying of replacement assets
Work with funders and their technical provisions
▲ Comprehensive, portfolio wide initiative
hicl.com | 17
A key determinant of value and asset performance
Managing contract changes
▲ What are Contract Variations?
Changes to the terms of the Concession Contract
A common feature, typically initiated by public sector clients to support business change
Needs careful management
▲ Reactive strategy
Case by case assessment
Consider and agree scope of variation, timetable, costs and contract terms
▲ Focus is to keep Project Company ‘whole’, while meeting the client’s objectives
No adverse change to risk profile
No deterioration in financial return
hicl.com | 18
‘Variations’ are important

Phase 1 – Paediatric assessment unit infill in courtyard
hicl.com | 19
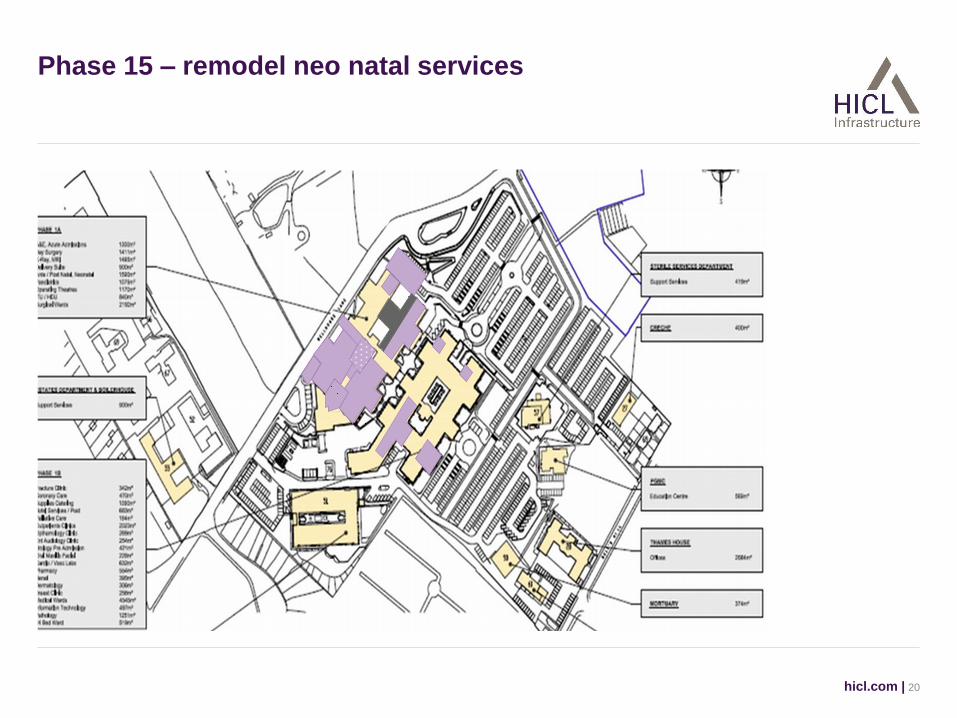
Phase 15 – remodel neo natal services
hicl.com | 20

Barnet Hospital
hicl.com | 21

Barnet Hospital
hicl.com | 22

Barnet Hospital
hicl.com | 23

Managing operational issues
▲ What is the ‘Firestopping’ issue about:
Failings in either the construction, and/or maintenance,
of certain fire protection measures
No consensus over contractual requirements;
multi-party responsibility
▲ What are we doing about it?
Proactively seeking to mitigate exposure
Tracking all projects; specialist surveys
Rectification plans in place, being implemented
▲ Investment implications
Costs of rectification and revenue deductions typically passed down
Equity largely insulated but responsible for managing supply chain
Too early to conclude all risks are covered, frictional costs cannot be entirely eliminated
hicl.com | 24
Firestopping – a live example being actively managed
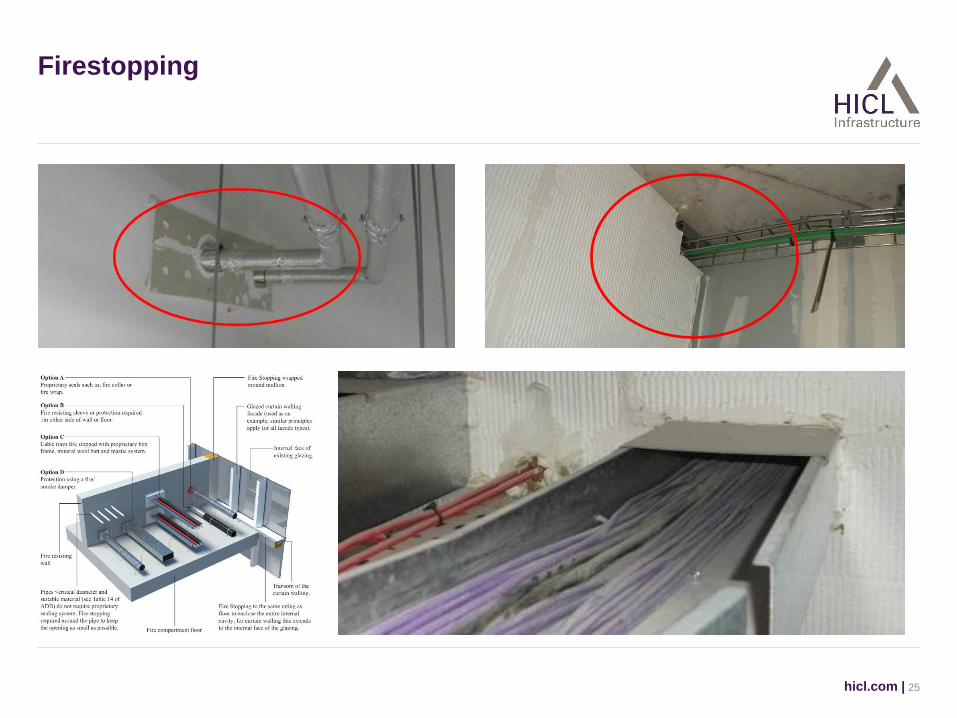
Firestopping
hicl.com | 25
Managing responsibly
▲ ESG can materially impact investment and corporate performance
▲ We're proactively driving good ESG practice throughout the HICL investments
Adoption of ESG policies in line with good industry practice
Active monitoring and evaluation of project level performance
30 KPI metrics – results weighted to derive single grade from a 4-point scoring system
InfraRed scored ‘A+’ in its 2015 PRI Assessment including all HICL investments
Highest attainable award, beats median score of 'B‘ for Infrastructure industry
hicl.com | 26
ESG – an essential for preserving value
InfraRed Scored A+

hicl.com |
ESG community engagement
27
Oasis Academy (Croydon Schools) and University of Sheffield Accommodation

Summary
▲ Active project board-level involvement,
stewards of the projects
▲ Using and improving best practice for all
▲ Lessons learned across portfolio
▲ Robust risk management approach
▲ Seek to prevent issues before they arise,
proactively solve issues when they do
▲ Delivering value for all stakeholders
hicl.com | 28
Value preserved by an experienced team of 14 with a proven track record
Part of InfraRed’s Asset Management Team

Value Enhancement
Oldham Library
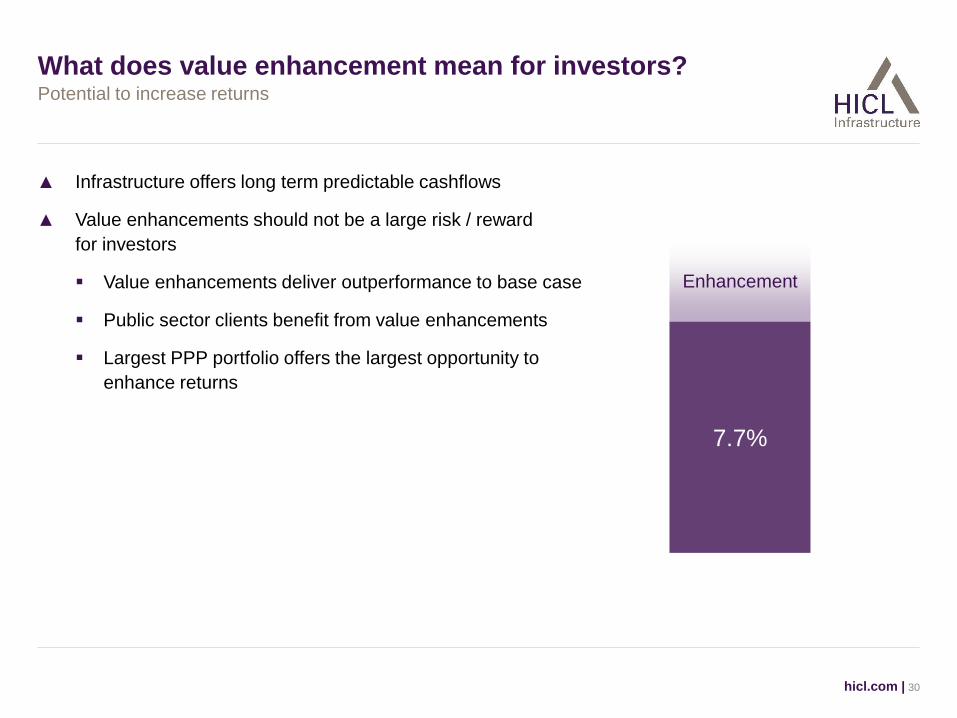
What does value enhancement mean for investors?
▲ Infrastructure offers long term predictable cashflows
▲ Value enhancements should not be a large risk / reward
for investors
Value enhancements deliver outperformance to base case
Public sector clients benefit from value enhancements
Largest PPP portfolio offers the largest opportunity to
enhance returns
hicl.com | 30
Potential to increase returns
7.7%
Enhancement

What is value enhancement?
hicl.com | 31
Increasing distributions to shareholders
-
£50m
£100m
£150m
£200m
£250m
£300m
£350m
2016 2017 2018 2019 2020 2021 2022 2023 2024 2025 2026 2027 2028 2029 2030 2031 2032 2033 2034 2035 2036 2037 2038 2039 2040 2041 2042 2043 2044 2045 2046 2047
Year Ending 31 March Source: InfraRed
1. The illustration represents a target only as at 30 September 2015 and is not a profit forecast. There can be no assurance that this target will be met.
2. The illustration assumes a Euro to Sterling exchange rate of 0.74, a Canadian dollar to Sterling exchange rate of 0.50, an Australian dollar to sterling
exchange rate of 0.46.
3. The cashflows are from the portfolio of 102 investments as at 30 September 2015 and does not include other assets or liabilities of the Group, and
assumes that during the period illustrated above, (i) no new investments are purchased, (ii) no existing investments are sold and (iii) the Group suffers
no material liability to withholding taxes, or taxation on income or gains.
Forecast gross cash receipts
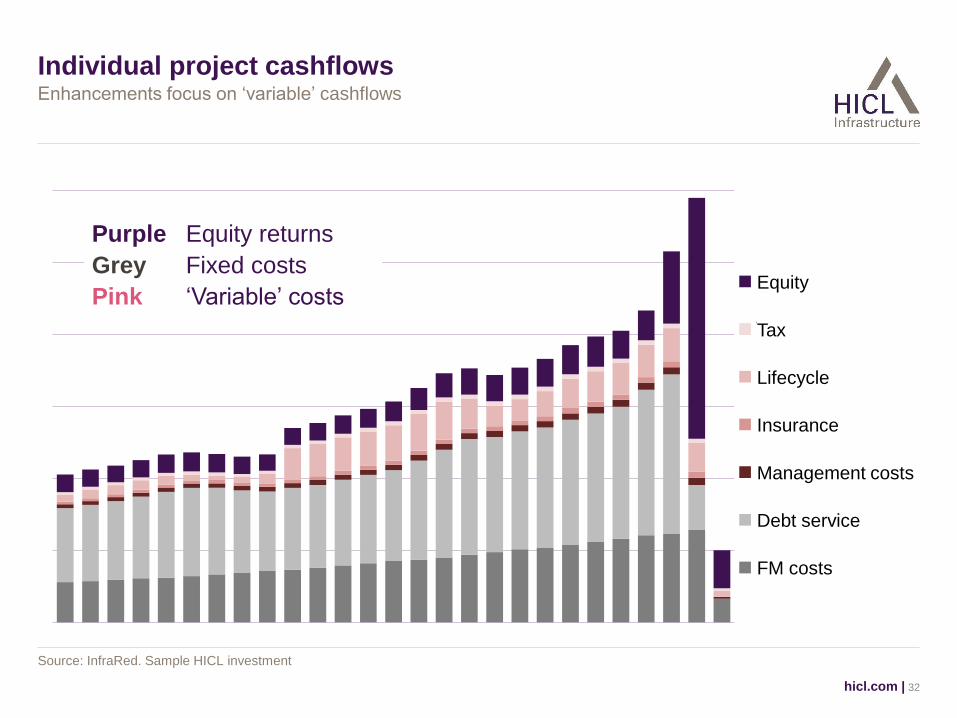
Individual project cashflows
hicl.com | 32
Enhancements focus on ‘variable’ cashflows
Source: InfraRed. Sample HICL investment
Equity
Tax
Lifecycle
Insurance
SPV costs
Debt service
FM costs
Purple Equity returns
Grey Fixed costs
Pink ‘Variable’ costs Equity
Tax
Lifecycle
Insurance
Management costs
Debt service
FM costs

Value enhancement options
hicl.com | 33
Fund level, project specific and portfolio wide
Accommodation
10 projects
Portfolio wide
Group level
Education
39 projects
Fire, law & order
13 projects
Health
31 projects
Transport
9 projects

Value enhancement options
hicl.com | 34
Fund level, project specific and portfolio wide
Distribution efficiency
Spend to save
Energy management
Model corrections
Insurance
Lifecycle Project
Company management
Variations
Treasury management
Third party revenue
Change in accounting
Disposals
Basis swaps
Tax claims & loss
surrenders
Refinancing Trapped
cash
Co-shareholder acquisitions
Cost management
Asset management Portfolio management
Project
specific
Portfolio
wide
Group
level
Financing
Cost management
Treasury management
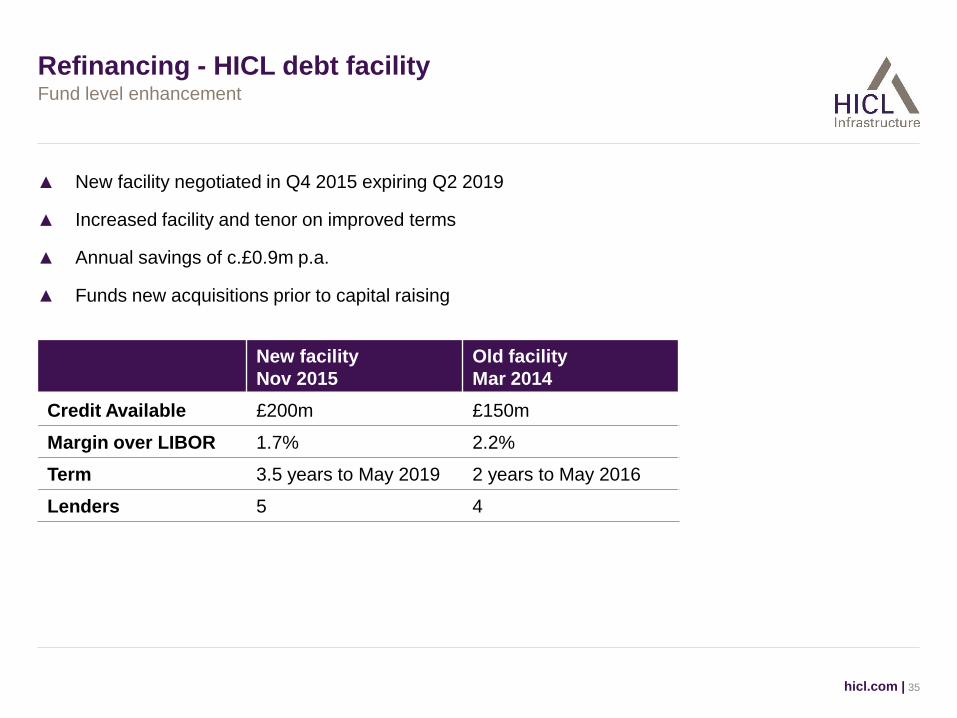
Refinancing - HICL debt facility
▲ New facility negotiated in Q4 2015 expiring Q2 2019
▲ Increased facility and tenor on improved terms
▲ Annual savings of c.£0.9m p.a.
▲ Funds new acquisitions prior to capital raising
hicl.com | 35
Fund level enhancement
New facility
Nov 2015
Old facility
Mar 2014
Credit Available £200m £150m
Margin over LIBOR 1.7% 2.2%
Term 3.5 years to May 2019 2 years to May 2016
Lenders 5 4
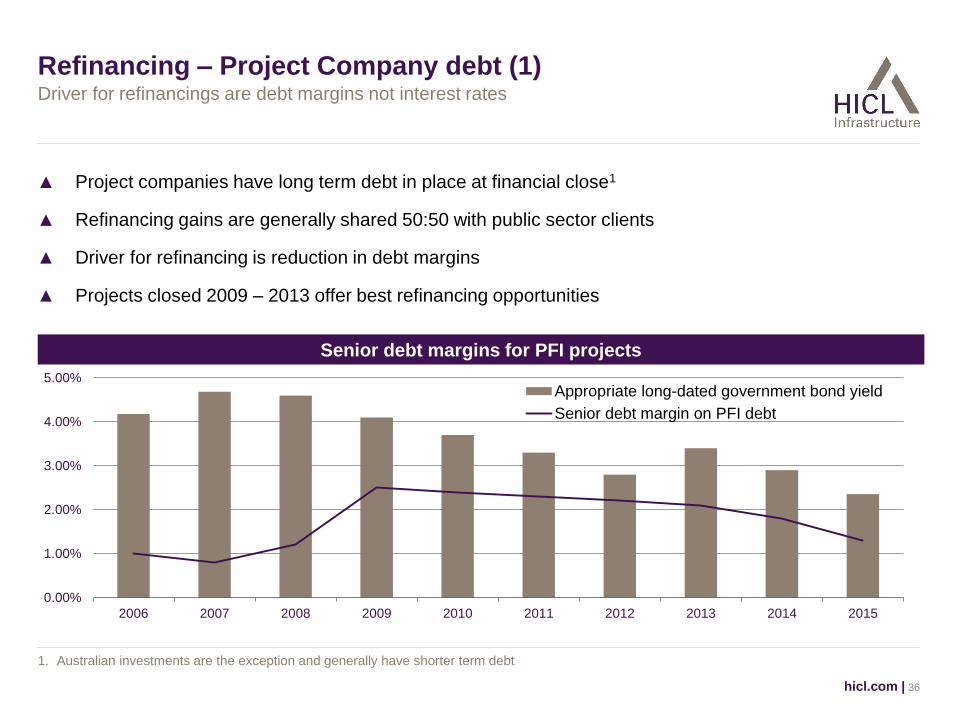
Refinancing – Project Company debt (1)
▲ Project companies have long term debt in place at financial close1
▲ Refinancing gains are generally shared 50:50 with public sector clients
▲ Driver for refinancing is reduction in debt margins
▲ Projects closed 2009 – 2013 offer best refinancing opportunities
hicl.com | 36
Driver for refinancings are debt margins not interest rates
1. Australian investments are the exception and generally have shorter term debt
Senior debt margins for PFI projects
0.00%
1.00%
2.00%
3.00%
4.00%
5.00%
2006 2007 2008 2009 2010 2011 2012 2013 2014 2015
Appropriate long-dated government bond yield
Senior debt margin on PFI debt

Refinancing – Project Company debt (2)
hicl.com | 37
Many stakeholders – number of challenges
Escalat-ing
advisors fees
EIB
Moving financial markets
Addit-ional debt
Gain share
Swap break-
age costs
Docu-ments
Termin-ation
liability
Align interests
Tax & account-
ing
Lenders new
Lenders legal
advisor
Client
Clients legal
advisor
Project legal
advisor
Project financial advisor
Lenders technical advisor
Clients financial advisor
Project + share-holders
Lenders existing

Central Middlesex Hospital ▲ 2011
▲ Basis swap to benefit from difference in 1 month + 6 month Libor rates
Refinancing successes
hicl.com | 38
Back on the table post financial crisis
Colchester Garrison ▲ 2009
▲ Early bond prepayment from surplus land sale proceeds
Blackburn Hospital ▲ 2011
▲ EIB margin reduction to mitigate Ambac downgrade
Staffordshire LIFT ▲ 2015
▲ Replaced lender to remove cash sweep
Aquasure Desalination ▲ 2015
▲ Part refinancing of debt on expiry for more favourable terms
Future Refinancings…. ▲ 2016
▲ 8 projects investigating refinancing of debt

0
10
20
30
40
50
60
70
80
£m
Lifecycle: a risk and opportunity (1)
▲ Lifecycle expenditure is becoming a prominent focus
▲ Active management by the Asset Management team creates potential
hicl.com | 39
Careful management of risks to realise value
Source: InfraRed. Estimated annual lifecycle expenditure for HICL investments with lifecycle risk, prorated for shareholding – 30 September 2015
HICL portfolio lifecycle spend forecast

Lifecycle: a risk and opportunity (2)
▲ Lifecycle risk can be with either subtracted or an equity risk / reward
▲ Approximately half of HICL portfolio has lifecycle risk with the Project Company
▲ Active management of expenditure while working with public sector clients
and FM Sub contractors will provide opportunities
hicl.com | 40
Sizing the opportunity
Source: HICL March 2015 Results Presentation
Savings Overspend
Change in expenditure - 10% + 10%
NAV movement
(pence per share) 3.2p (3.5p)
NAV movement (£’m) £41m (£45m)
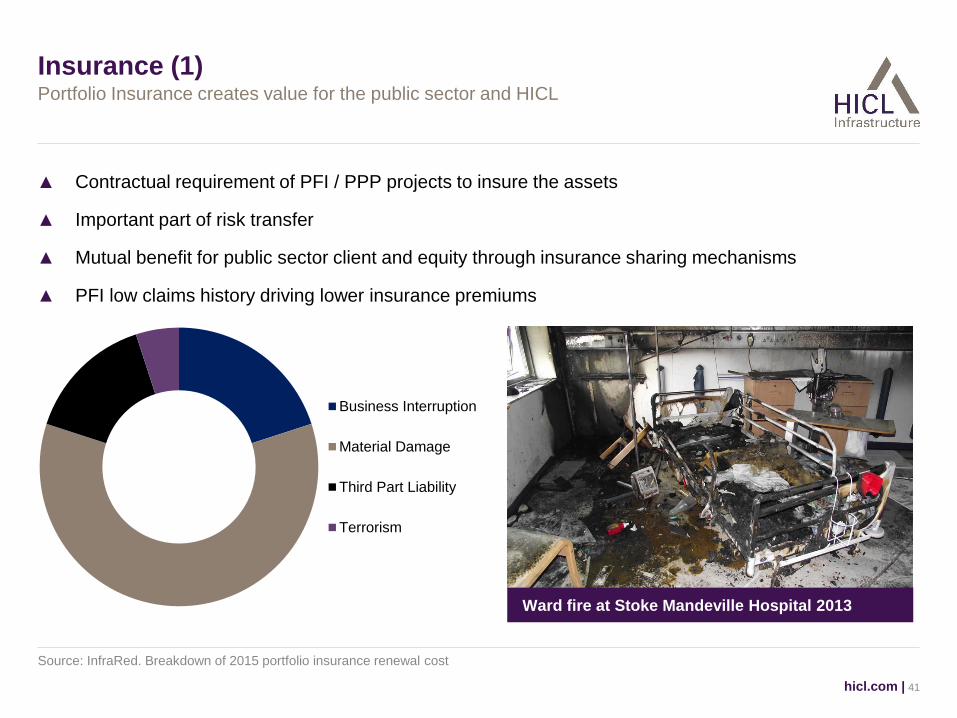
Insurance (1)
▲ Contractual requirement of PFI / PPP projects to insure the assets
▲ Important part of risk transfer
▲ Mutual benefit for public sector client and equity through insurance sharing mechanisms
▲ PFI low claims history driving lower insurance premiums
hicl.com | 41
Portfolio Insurance creates value for the public sector and HICL
Source: InfraRed. Breakdown of 2015 portfolio insurance renewal cost
Business Interruption
Material Damage
Third Part Liability
Terrorism
Ward fire at Stoke Mandeville Hospital 2013

Insurance (2)
▲ One of the largest Infrastructure
insurance portfolios with 57 HICL
investments, 62 in total1 including other
InfraRed funds
▲ £7bn of assets insured2
▲ Around 20% year on year savings
achieved on 2015 portfolio renewal
▲ Over £1m savings on 2015 renewal with
majority to be paid to public sector clients
▲ All project insurances competed against
portfolio on renewal
hicl.com | 42
Leverage scale through insurance portfolio
1. As at 31 December 2015
2. Capital value of assets insured
0
20
40
60
80
100
120
140
160
180
0
10
20
30
40
50
60
70
2012/13 2015/16
Pre
mia
£0
00
s
No
. o
f p
roje
cts
No. of projects (LHS) Ave premia (RHS)
Broker Primary underwriter
19 projects added to portfolio
20% year on year saving
Average premia (RHS)

Contract management
Client relationship
management
Risk management
framework
Corporate governance
Manage-ment of change
Project Company Management (1)
▲ Day to day management of all aspects of the project
▲ Majority of projects have contracts with specialist providers, and a few have directly employed staff
▲ Diverse range of Project Company Management suppliers, to HICL’s project companies
▲ Providers are independent of InfraRed
hicl.com | 43
Partnering approach based on best practice and industry knowledge
Lender requirements
Board meeting held at Fife Schools
Project Company
Management

Project Company Management (2)
▲ Portfolio scale creates opportunity in terms
of service delivery as well as price
▲ HICL’s Project Companies spend around
£12m1 per annum on management services
▲ Balancing act between quality of service
and price
▲ Partnering with trusted providers in an open
and knowledge sharing environment
▲ HICL’s scale allows learning and read across
of issues, solutions and best practice
Getting the balance right between fees and depth of service
1. Source: InfraRed with expenditure prorated for shareholding
Standardised MSA contract with specified
deliverable and KPIs
Group tendering of
MSA contracts
Regular partnering and lessons learnt
meetings
Best in class ESG, Risk
management, reporting and compliance
High quality internal controls
Additional support and
expertise available as
needed
hicl.com | 44
Summary
▲ Value enhancement delivers incremental returns above the base case
▲ HICL leverages benefits using InfraRed’s knowledge and expertise
▲ Working with our public sector clients to create mutual benefit
▲ Numerous small value enhancements all add up while maintaining investors’ risk / reward ratio
hicl.com | 45
Improvement for investors and public sector clients
InfraRed’s Portfolio Management Team

Value Accretive Investment
M80 Motorway
Defining a ‘value accretive investment’
▲ InfraRed evaluates three key parameters when assessing new HICL acquisitions:
Total return
Yield
Degree of inflation linkage
▲ A project may offer value accretion to the HICL portfolio from one or more of these parameters
▲ Other acquisition considerations (in relation to the portfolio) are:
Concentration risk (e.g. sector, counterparty)
Geography
Remaining asset life
hicl.com | 47
InfraRed applies rigorous investment evaluation criteria to all new opportunities

Value Accretive Investment
Value in the Eye of the Beholder
M80 Motorway
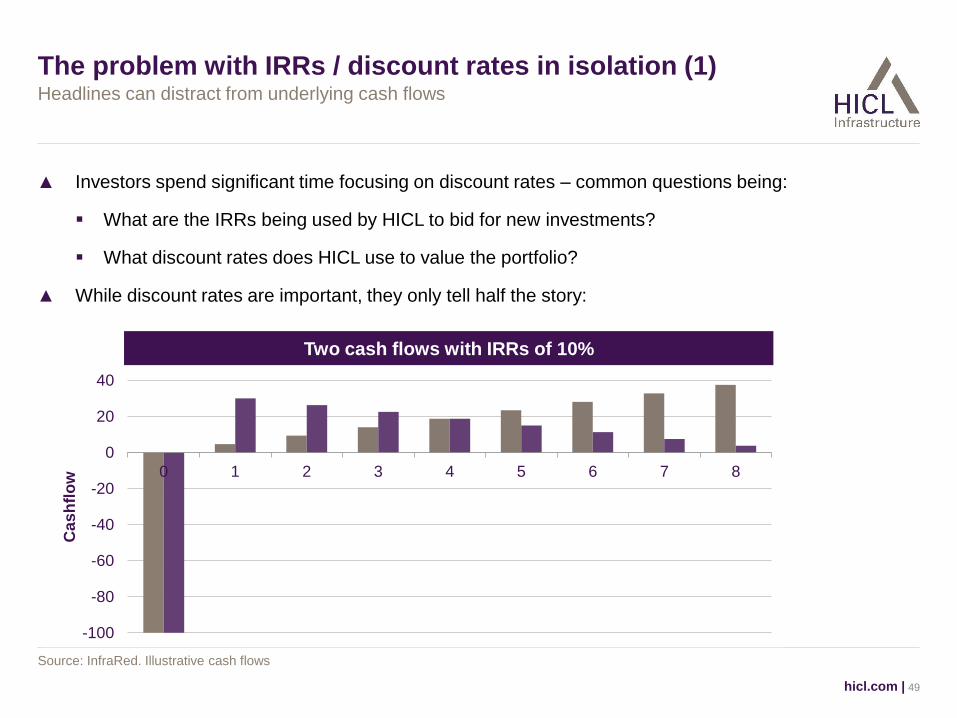
The problem with IRRs / discount rates in isolation (1)
▲ Investors spend significant time focusing on discount rates – common questions being:
What are the IRRs being used by HICL to bid for new investments?
What discount rates does HICL use to value the portfolio?
▲ While discount rates are important, they only tell half the story:
hicl.com | 49
Headlines can distract from underlying cash flows
Source: InfraRed. Illustrative cash flows
-100
-80
-60
-40
-20
0
20
40
0 1 2 3 4 5 6 7 8
Ca
sh
flo
w
Two cash flows with IRRs of 10%

750
900
1,050
1,200
1,350
1,500
1 2 3 4 5 6 7 8 9 10 11 12 13 14 15 16 17 18 19 20 21 22 23
Cas
hfl
ow
Years
£16m
£14m
£12m
£10m
£8m
NP
V
Valuation A @8%
Project Company
management
Insurance Lifecycle Tax1 Refinance Valuation B @8%
The problem with IRRs / discount rates in isolation (2)
▲ ‘Optimisation’ of cash flows can appear to materially increase the value of an investment
hicl.com | 50
As drivers of investment valuation, cash flow assumptions and discount rate are equally important
Source: InfraRed. Illustrative cash flows
1. For example differing assumptions re future corporation tax rates
Cashflow optimisation Refinance
Insurance
Lifecycle
Tax1
Project
Company
management
Base
£1.5m
£1.35m
£1.2m
£1.0m
£0.9m
£0.75m
Valuation
(NPV)
Discount rate
Valuation A
8.0% 5.5%
£12m £15m
£18m Valuation B £15m
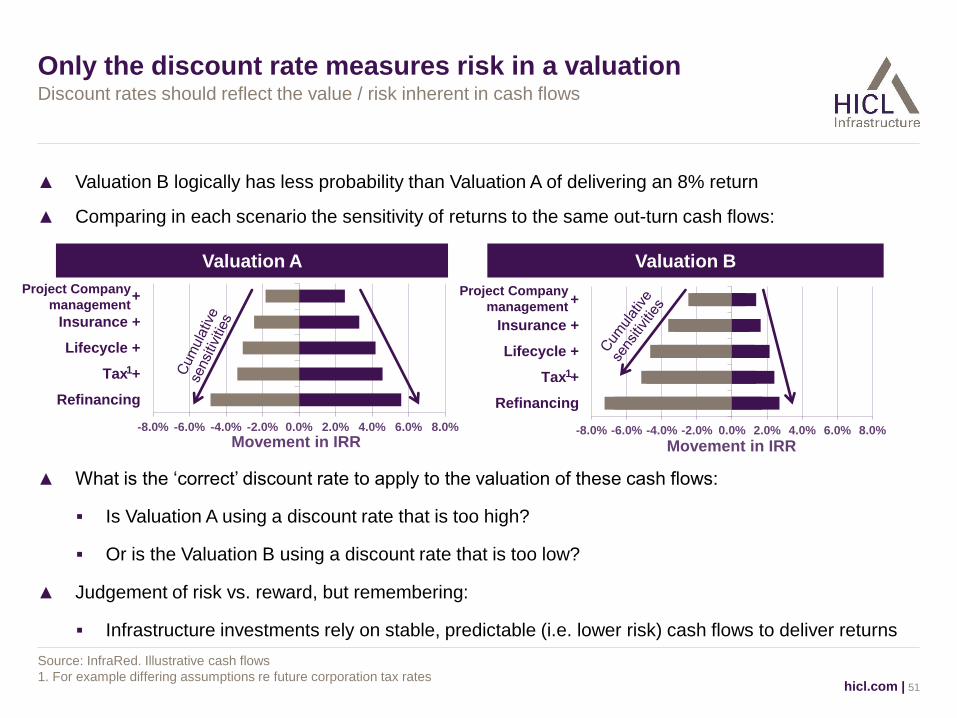
Only the discount rate measures risk in a valuation
▲ Valuation B logically has less probability than Valuation A of delivering an 8% return
hicl.com | 51
Discount rates should reflect the value / risk inherent in cash flows
Source: InfraRed. Illustrative cash flows
1. For example differing assumptions re future corporation tax rates
-8.0% -6.0% -4.0% -2.0% 0.0% 2.0% 4.0% 6.0% 8.0%
Refinancing
Tax +
Lifecycle +
Insurance +
SPC Costs +
Movement in IRR -8.0% -6.0% -4.0% -2.0% 0.0% 2.0% 4.0% 6.0% 8.0%
Refinancing
Tax +
Lifecycle +
Insurance +
SPC Costs +
Movement in IRR
▲ What is the ‘correct’ discount rate to apply to the valuation of these cash flows:
Is Valuation A using a discount rate that is too high?
Or is the Valuation B using a discount rate that is too low?
▲ Judgement of risk vs. reward, but remembering:
Infrastructure investments rely on stable, predictable (i.e. lower risk) cash flows to deliver returns
▲ Comparing in each scenario the sensitivity of returns to the same out-turn cash flows:
Valuation A Valuation B
1 1
Project Company
management Project Company
management
-300
-200
-100
0
100
200
300
400
500
1 2 3 4 5 6 7 8 9 10 11 12 13 14 15 16 17 18 19 20 21 22 23 24 25 26 27 28 29 30 31 32 33 34 35 36 37 38 39 40
Eq
uit
y C
as
hfl
ow
Years Demand Infrastructure
Availability Infrastructure
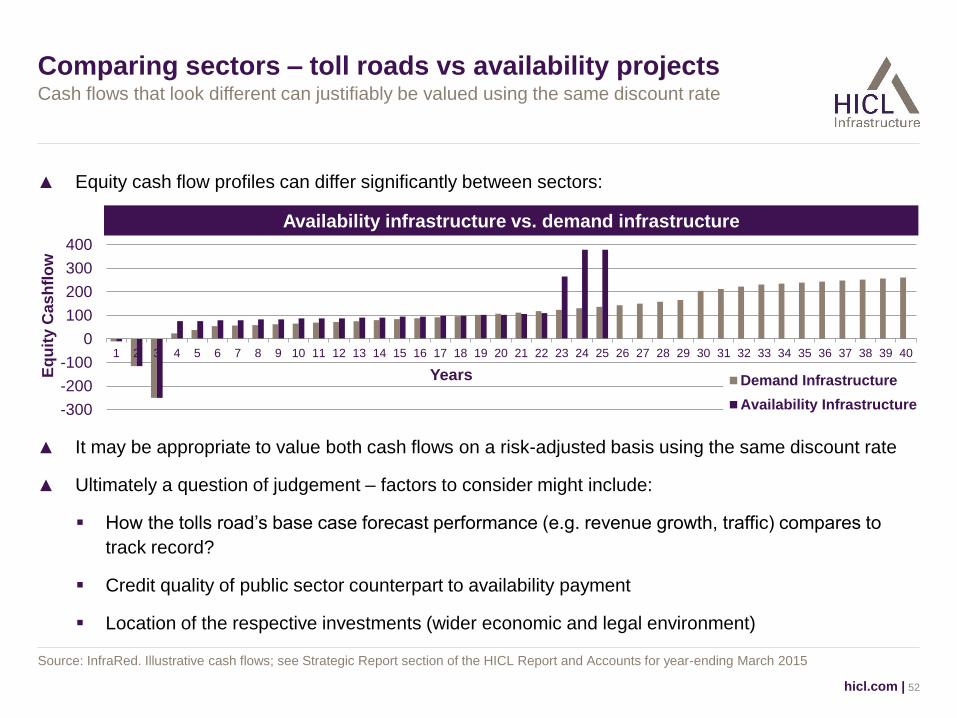
Comparing sectors – toll roads vs availability projects
▲ Equity cash flow profiles can differ significantly between sectors:
hicl.com | 52
Cash flows that look different can justifiably be valued using the same discount rate
Source: InfraRed. Illustrative cash flows; see Strategic Report section of the HICL Report and Accounts for year-ending March 2015
▲ It may be appropriate to value both cash flows on a risk-adjusted basis using the same discount rate
▲ Ultimately a question of judgement – factors to consider might include:
How the tolls road’s base case forecast performance (e.g. revenue growth, traffic) compares to
track record?
Credit quality of public sector counterpart to availability payment
Location of the respective investments (wider economic and legal environment)
Availability infrastructure vs. demand infrastructure

Value Accretive Investment
Finding Value in the Current Market
M80 Motorway
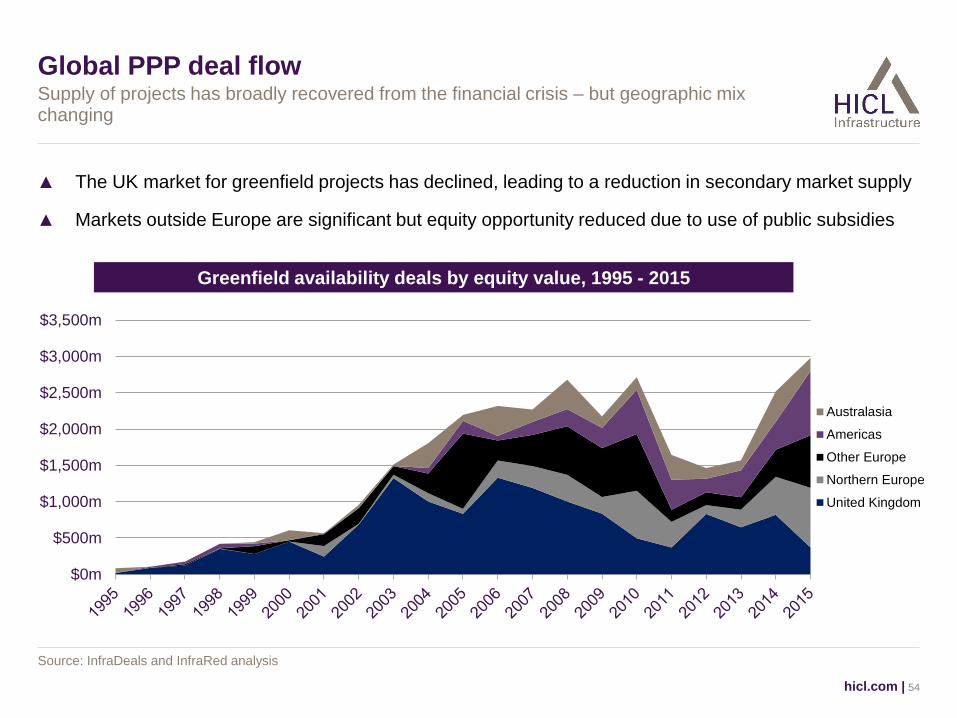
Global PPP deal flow
▲ The UK market for greenfield projects has declined, leading to a reduction in secondary market supply
▲ Markets outside Europe are significant but equity opportunity reduced due to use of public subsidies
hicl.com | 54
Supply of projects has broadly recovered from the financial crisis – but geographic mix changing
Source: InfraDeals and InfraRed analysis
$0m
$500m
$1,000m
$1,500m
$2,000m
$2,500m
$3,000m
$3,500m
Australasia
Americas
Other Europe
Northern Europe
United Kingdom
Greenfield availability deals by equity value, 1995 - 2015
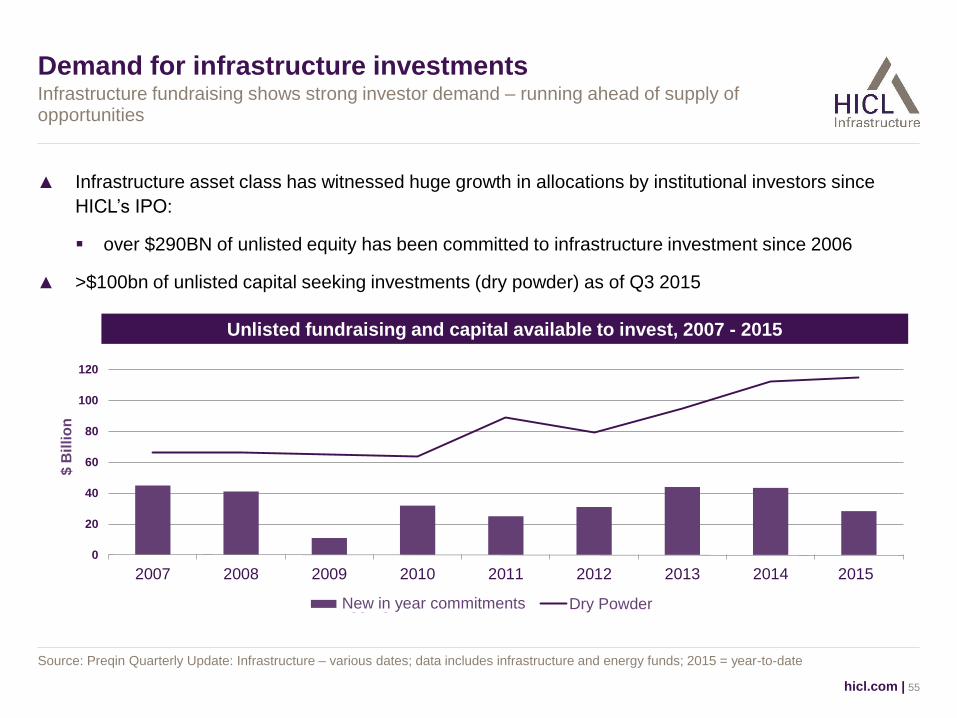
Demand for infrastructure investments
▲ Infrastructure asset class has witnessed huge growth in allocations by institutional investors since
HICL’s IPO:
over $290BN of unlisted equity has been committed to infrastructure investment since 2006
▲ >$100bn of unlisted capital seeking investments (dry powder) as of Q3 2015
hicl.com | 55
Infrastructure fundraising shows strong investor demand – running ahead of supply of opportunities
Source: Preqin Quarterly Update: Infrastructure – various dates; data includes infrastructure and energy funds; 2015 = year-to-date
0
20
40
60
80
100
120
140
2007 2008 2009 2010 2011 2012 2013 2014 2015*
$ B
illi
on
Aggregate Commitments Dry Powder
Unlisted fundraising and capital available to invest, 2007 - 2015
New in year commitments
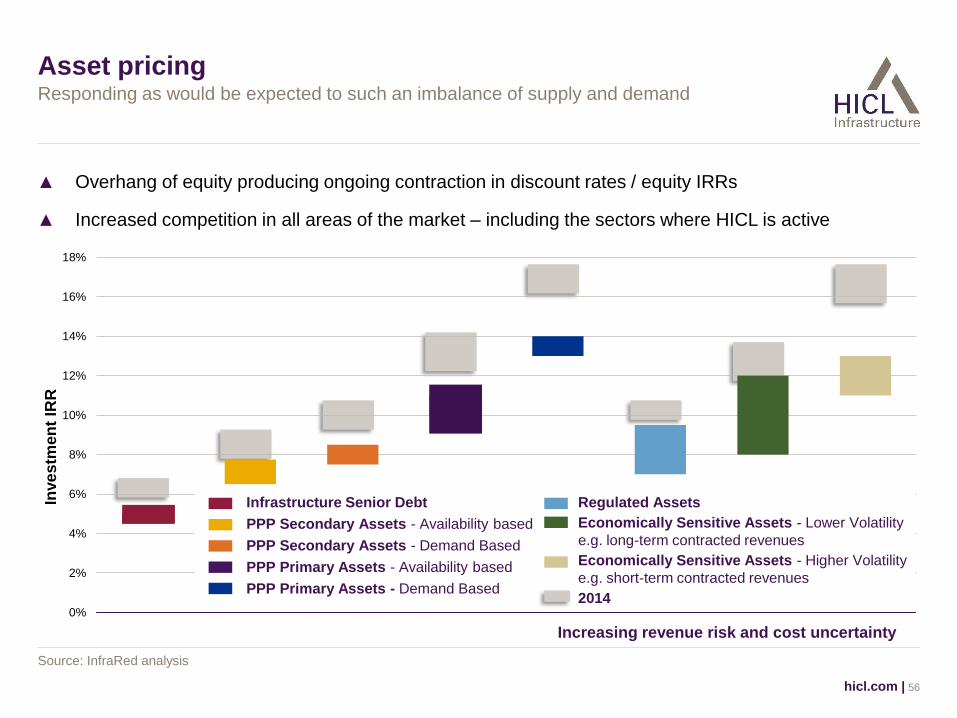
Asset pricing
▲ Overhang of equity producing ongoing contraction in discount rates / equity IRRs
▲ Increased competition in all areas of the market – including the sectors where HICL is active
hicl.com | 56
Responding as would be expected to such an imbalance of supply and demand
Source: InfraRed analysis
0%
2%
4%
6%
8%
10%
12%
14%
16%
18%
Inve
stm
en
t IR
R
Infrastructure Senior Debt
PPP Secondary Assets - Availability based
PPP Secondary Assets - Demand Based
PPP Primary Assets - Availability based
PPP Primary Assets - Demand Based
Increasing revenue risk and cost uncertainty
Regulated Assets
Economically Sensitive Assets - Lower Volatility
e.g. long-term contracted revenues
Economically Sensitive Assets - Higher Volatility
e.g. short-term contracted revenues
2014
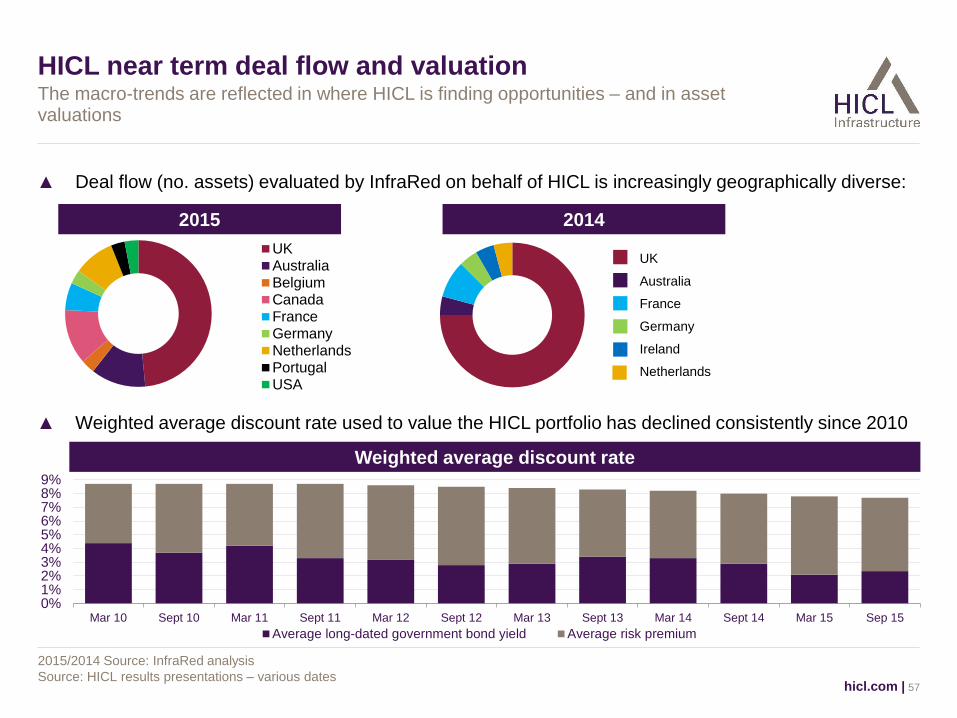
HICL near term deal flow and valuation
▲ Deal flow (no. assets) evaluated by InfraRed on behalf of HICL is increasingly geographically diverse:
hicl.com | 57
The macro-trends are reflected in where HICL is finding opportunities – and in asset valuations
2015/2014 Source: InfraRed analysis
Source: HICL results presentations – various dates
▲ Weighted average discount rate used to value the HICL portfolio has declined consistently since 2010
0%1%2%3%4%5%6%7%8%9%
Mar 10 Sept 10 Mar 11 Sept 11 Mar 12 Sept 12 Mar 13 Sept 13 Mar 14 Sept 14 Mar 15 Sep 15
Average long-dated government bond yield Average risk premium
UKAustraliaBelgiumCanadaFranceGermanyNetherlandsPortugalUSA
Weighted average discount rate
2015 2014
UK
Australia
France
Germany
Ireland
Netherlands

Finding value accretive investment
▲ HICL continues to source from open market auctions, but these supply a smaller proportion of assets
(by value):
hicl.com | 58
However, it is still possible to find pockets of value
Source: InfraRed analysis
▲ HICL’s Board held a strategy meeting in September 2015 which affirmed HICL’s acquisition strategy
▲ In addition to investments in core availability PPP markets, HICL continues to have capacity to seek
investments in:
non-UK markets;
development stage assets; and
adjacent sectors (e.g. transmission) with suitable revenue streams
▲ Portfolio must remain consistent with HICL’s investment proposition, i.e. lower end of the risk spectrum
Open market auction
Off-market / limited competition
Incremental / mop-up
Greenfield procurement
Last 5 years Last 24 months

Levels of market activity in key geographies (1)
hicl.com | 59
Potential deal flow in select markets covered by InfraRed’s global infrastructure investment team – not HICL specific
PPP Trans-
mission
Toll
roads Sectors
Greenfield Secondary
UK ▲▲ ▲▲▲▲ ▲▲▲ ▲
Belgium ▲▲ ▲▲ ▲ ▲
France ▲▲ ▲▲▲ ▲ ▲▲▲
Germany ▲▲▲▲ ▲ ▲ ▲▲
Ireland ▲▲ ▲▲ ▲ ▲▲▲
NL ▲▲▲▲ ▲▲▲ ▲ ▲
Norway ▲▲ ▲ ▲ ▲
Portugal ▲ ▲▲▲ ▲ ▲
Spain ▲ ▲▲▲ ▲ ▲▲
▲ Indicative deal flow strength, does not indicate HICL pipeline InfraRed office
Source: InfraRed analysis

Levels of market activity in key geographies (2)
hicl.com | 60
Potential deal flow in select markets covered by InfraRed’s global infrastructure investment team – not HICL specific
PPP Trans-
mission
Toll
roads Sectors
Greenfield Secondary
Canada ▲▲▲ ▲▲▲▲ ▲▲ ▲
USA ▲▲ ▲▲ ▲▲ ▲▲▲
PPP Trans-
mission
Toll
roads Sectors
Greenfield Secondary
Australia ▲▲▲ ▲▲▲ ▲▲ ▲
New
Zealand ▲▲ ▲ ▲ ▲
Singapore ▲ ▲ ▲ ▲
▲ Indicative deal flow strength, does not indicate HICL pipeline InfraRed office
Source: InfraRed analysis
Summary
▲ The size of HICL’s portfolio gives it distinct advantages; for example through economies of scale
▲ InfraRed’s experienced asset and portfolio management team converts this inherent advantage into
real value
▲ In combination with InfraRed’s sourcing network these factors assist with the evaluation of
new acquisitions:
Informed assessment of the deliverability of acquisition assumptions
Consistent approach to valuation and risk tolerance
Ability to price opportunities based on experience of delivering returns from actual cash flows
▲ For these reasons, despite challenging market conditions, HICL remains cautiously optimistic in its
ability to add new investments and to continue delivering real value for its shareholders
hicl.com | 61
Delivering value requires a competitive edge, experience and discipline

Concluding Remarks
Helicopter Training Facility
Concluding remarks
▲ Ten years successful investment history
▲ Projects are contractually structured, with long term relationships and an optimised allocation of risks
between the parties
Value Preservation and Value Enhancement
– Requires ‘hands-on’ management and the active pursuit of a range of initiatives delivering
preservation and enhancement of value for all
– Proactive role, supported by depth of experience, proven procedures, controls and risk
management framework
Value Accretive Investment
– Using expertise to source opportunities through relationships and using knowledge of the
asset class to secure investments that are value accretive
hicl.com | 63
Insight into the detailed management of the portfolio and approach to sourcing further investments


![Markets, Moral Hazard, and Equilibrium Selection ... · Markets, Moral Hazard, and Equilibrium Selection [Preliminary Draft - UTDallas Seminar] Shimon Kogan Anthony M. Kwasnica Roberto](https://static.fdocuments.in/doc/165x107/5e40faeb11ae9a323820cae9/markets-moral-hazard-and-equilibrium-selection-markets-moral-hazard-and.jpg)