Capital Markets Day 2011 - Galp Energia33 | Capital Markets Day - March 6th 2012 Galp Energia’s...
111
Capital Markets Day 2012 Solid foundations to deliver sustainable value
Transcript of Capital Markets Day 2011 - Galp Energia33 | Capital Markets Day - March 6th 2012 Galp Energia’s...
Capital Markets Day - March 6th 2012
Capital Markets Day 2012
Solid foundations to deliver sustainable value
Page 1

Capital Markets Day - March 6th 2012
2 |
Strategy overview Manuel Ferreira De Oliveira Chief Executive Officer

Delivering on our strategy
Solid foundations in place
Ensuring sustainable and responsible growth
Final remarks
3 | Capital Markets Day - March 6th 2012

17%
11%
7% 6%
3%
-1% -2%
-5%
-8%
1%
Galp Energia
SXEP
1 Annualized shareholder return, expressed in euros, from 2006/10/23 to 2011/12/31, including dividends payment 2 Includes BG Group, BP, Eni, OMV, Petrobras, Repsol, Royal Dutch Shell and Total
Long-term performance delivering unique returns
4 | Capital Markets Day - March 6th 2012
Total annualized shareholder return since the IPO1
Peers2

2011: a year of delivery unlocking further growth
5 | Capital Markets Day - March 6th 2012
Commitment Delivery Status
Creating value through increased focus in upstream
Drilling in Rovuma basin far exceeding pre-drill estimates, turning Mozambique into a new core area
Lula development on track, well ahead of expectations
Downstream transformational optimization
Upgrade project at its final stage
Reaching a sound capital structure Capital increase at Brazilian subsidiary allowing for cash-in of c.$5.2 Bln
Solid financial structure to enable future expansion

Positioned for profitable growth
6 | Capital Markets Day - March 6th 2012
Reaping the rewards on a well-defined strategic path
Focus on three high prolific
regions: Brazil, Mozambique and Angola
Still the most leveraged player
to the outstanding
Santos basin in Brazil
Continuous downstream
optimization to maintain
contribution to earnings
Enhanced financial flexibility
allowing for expansion
opportunities

Delivering on our strategy
Solid foundations in place
Ensuring sustainable and responsible growth
Final remarks
7 | Capital Markets Day - March 6th 2012

Intensive exploration activities led to the identification of new drilling targets
World-class gas discovery in Rovuma basin, Mozambique
First development steps taken in Lula field, Brazil, exceeding expectations
Increasing our upstream portfolio potential in 2011
8 | Capital Markets Day - March 6th 2012
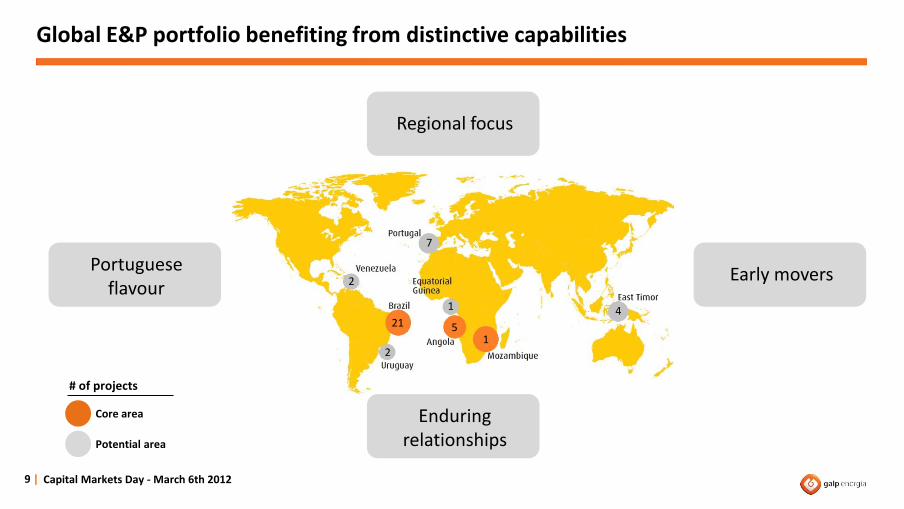
Global E&P portfolio benefiting from distinctive capabilities
9 | Capital Markets Day - March 6th 2012
Regional focus
Early movers Portuguese flavour 2
21
2
5
7
1
1
4
Core area
Potential area
# of projects
Enduring relationships

2,550
2,821
2010 2011
Exploration focus to enhance and enlarge current portfolio
Still a lot to take from current high potential exploration portfolio
Looking to enlarge portfolio
Focus on high risk/high reward exploration areas
Galp Energia to leverage on key distinctive capabilities
Exploration team allocating c.30% of its time to analyse new opportunities
10 | Capital Markets Day - March 6th 2012
Exploration resources1 (Mln Boe)
1 Mean unrisked estimate
Source: DeGolyer and MacNaughton @ 31/12/2011
+ 11%

574
709
2010 2011
2,356
2,672
2010 2011
Continuously adding resources and reserves to portfolio
11 | Capital Markets Day - March 6th 2012
3C contingent resources1 (Mln Boe) 3P reserves2 (Mln Boe)
1 Working interest 3C resources
2 Net entitlement 3P reserves Source: DeGolyer and MacNaughton @ 31.12.2011
+ 13%
+ 24%

Building certainty on high-reward projects
12 | Capital Markets Day - March 6th 2012
Faster Lula development on better reservoir data
Clear path outlined Ambition confirmed
20
11
ac
hie
vem
en
ts
WI production (kboepd)
21
2011
300
2020 target
+
+
70
2015E

Delivering profitable growth on current E&P portfolio
13 | Capital Markets Day - March 6th 2012
Strategic partnerships delivering outstanding value
Exploration in core areas being intensified
Enlarging exploration portfolio through new ventures
Still a lot to know and to take from current Brazilian portfolio
Resource base increased to 6.2 Bln boe

Upstream growth supported by downstream sound foundations
14 | Capital Markets Day - March 6th 2012
Refining & Marketing Gas & Power
245 MW of total
capacity installed by
2012
1,200 GWh of annual
electrical power
generation
Sourcing agreement of
6 bcm of natural gas
2nd natural gas player
in Iberia with over 1.3
Mln clients
11,655 km of NG
distribution network
3rd player in Iberia
1,502 service stations
and 595 non fuel
stores in Iberia and in
Africa
Annual sales of c.16
Mln tons of refined
products
Total refining capacity
of 330 kbpd
Nelson complexity of
7.71 in Sines refinery
and 10.7 in
Matosinhos refinery
1 Post-upgrade complexity index. Nelson complexity before the upgrade of 6.3 in Sines

1.310.62 0.85
-0.04
1Q11 2Q11 3Q11 4Q11
Refining margin pre-upgrade Refining margin post-upgrade
Upgrade to increase refining profitability
Refining business fundamental to our integrated player strategy
€1.4 Bln project to start generating returns from mid-2012
Upgrade crucial considering the current refining environment
Incremental refining margin throughout 2011 would have ranged between $2.5-$3.5/bbl
15 | Capital Markets Day - March 6th 2012
Galp Energia refining margin1 ($/bbl)
Range ≈ $2.5-$3.5/bbl
1 Assuming 2011 market conditions

Downstream businesses will face important challenges
16 | Capital Markets Day - March 6th 2012
Refining & Marketing Gas & Power
Guarantee successful integration of refining system
Deliver Sines post-upgrade steady production
Improve the marketing business performance
Strengthen the business in Africa
Maintain key competitive advantages in Iberia
Strengthen natural gas leading position by raising focus on trading and supply businesses
Start-up of Matosinhos cogeneration
Current European and Iberian adverse environment
Progressive increase of competition
Endogenous
Exogenous
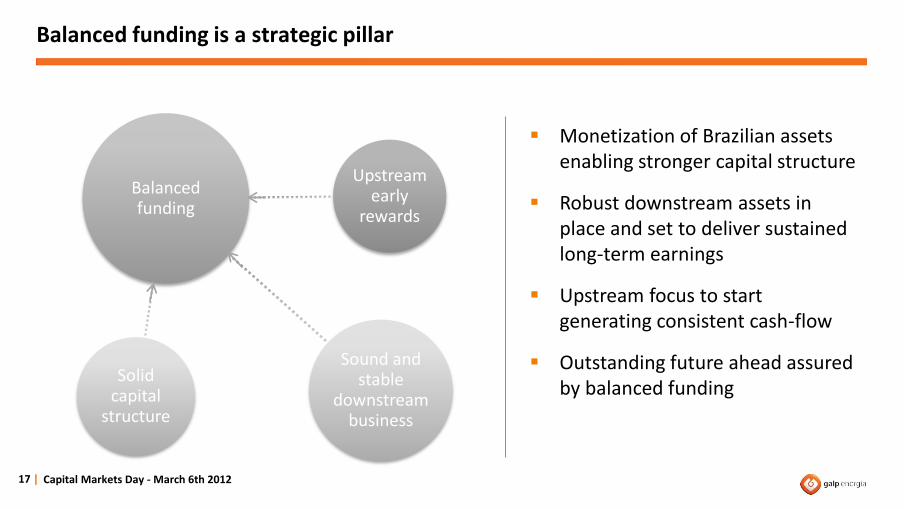
Monetization of Brazilian assets enabling stronger capital structure
Robust downstream assets in place and set to deliver sustained long-term earnings
Upstream focus to start generating consistent cash-flow
Outstanding future ahead assured by balanced funding
Balanced funding is a strategic pillar
17 | Capital Markets Day - March 6th 2012
Balanced funding
Upstream early
rewards
Solid capital
structure
Sound and stable
downstream business

Exciting future ahead supported by robust fundamentals
18 | Capital Markets Day - March 6th 2012
Outstanding exploration
potential
Delivering high
potential projects
Sound downstream
business
Solid capital
structure
Upstream profitable growth Balanced funding

Delivering on our strategy
Solid foundations in place
Ensuring sustainable and responsible growth
Final remarks
19 | Capital Markets Day - March 6th 2012

Sustainability fully integrated into our strategic decision making process
20 | Capital Markets Day - March 6th 2012
Getting the best from our people
Placing safety at the heart of our operations
Giving back to society
Responsible approach allows for
higher competitiveness,
corporate risk reduction and
enables social development
Growing with better energy

Getting the best from our people
21 |
Reservoir geoengineering advanced programme
Capital Markets Day - March 6th 2012
Leading highly skilled teams to deliver competitive performance
Partnering with renowned Portuguese and Brazilian universities to implement innovative training programmes
Promoting and developing expertise, namely in E&P and in refining businesses, through advanced training courses

Safety performance
Placing safety at the heart of our operations
Safety management showing continuous improvement, with industry-leading LTIFR
Integrated HSE management system implemented in 2006
Safety oriented training averaging more than 24,000 hours per year since 2006
HSE performance measured across all business segments
22 | Capital Markets Day - March 6th 2012
R&M 64%
4037
312.6
1.21.0
2009 2010 2011
Accidents resulting in work absence
Lost time injury frequency rate (LTIFR)
1 LTIFR is measured as the number of lost time accidents during the year per million hours worked (includes employees and contractors)
1

Actively managing our environmental footprint
23 | Capital Markets Day - March 6th 2012
R&M 64%
CO2 emissions (kton)
Leaving a smaller environmental footprint, actively managing CO2
emissions
Losses of containment index
Ecological preservation guides our activities, with good results within
API-754 performance indicator1
1 Recommended practice API 754 – Process Safety Performance Indicators identifies process safety indicators, particularly regarding the refining and petrochemical industry, where losses of containment has the potential to cause harm. Tier 1 and tier 2 represent those events which potential consequences are the most harmful. 2010 figures
0.350.87
2.24
2.71
Galp Energia CONCAWE
Tier 1 Tier 2
3,1402,941
2010 2011
Downstream Upstream

Growing with better energy
24 | Capital Markets Day - March 6th 2012
More than operating energy efficiently, we educate towards a
more sustainable world
Energy efficiency Biofuels
Over 13,000 hectares planted with Palma in Brazil and around 1,000
hectares with Jatropha in Mozambique

Giving back to society
25 |
End Hunger, Walk the World - Swaziland
Capital Markets Day - March 6th 2012
Sponsoring health initiatives that are vital to local communities
Eradicating social exclusion
Intensifying educative initiatives in Africa, namely through scholarships
Taking action towards sustainable mobility in Portugal
Actively promoting corporate volunteering

Galp Energia guided by sustainability
26 | Capital Markets Day - March 6th 2012
Sustainability incorporated into strategy and our daily routines
Galp Energia is a sustainable company, with related practices within the industry top 15%
Highly sustainable practices are already a reality, but there’s still progress to be made
Continuous improvement recognized by SAM Group, having achieved the qualification of Sector Mover 2012

Delivering on our strategy
Solid foundations in place
Ensuring sustainable and responsible growth
Final remarks
27 | Capital Markets Day - March 6th 2012

Solid foundations to deliver sustainable value
28 | Capital Markets Day - March 6th 2012
Continuously delivering on our strategy
Clearing the ground on a well defined strategic path
Incorporating high responsible practices and leading our people further
Creating shareholder value through key strategic pillars
Financial outlook Claudio De Marco Chief Financial Officer
Capital Markets Day - March 6th 2012
Page 29

Financial slack successfully achieved
Capital allocation towards upstream
Project delivery enhancing cash generation
Committed to a sound capital structure
New sustainable dividend policy
Final remarks
Appendix
30 | Capital Markets Day - March 6th 2012

Solid foundations built over years of demanding capex
Downstream transformational projects responsible for financial effort
High potential upstream projects being developed
Gearing level increased rapidly
2011 net debt to equity of 119%
31 | Capital Markets Day - March 6th 2012
Gearing evolution
0%
150%
0
600
1,200
1,800
2008 2009 2010 2011
Capex (€Mln) (lhs) Net debt/equity (rhs)

A cash in of $5.2 bln
Sinopec to hold 30% of Petrogal Brasil1, after the subscription of the capital increase
Partnership with one of the largest energy groups worldwide
Development of Brazilian projects fully funded
32 | Capital Markets Day - March 6th 2012
Galp Energia’s Brazilian portfolio
1 Petrogal Brasil and other related subsidiaries

Transaction executed in a challenging market environment
Financial environment deteriorated
Several interested parties in the deal, but few committed bidders
Implicit valuation of $12.5 bln based on a minority stake of 30%
Control and full consolidation of Petrogal Brasil1 maintained
33 | Capital Markets Day - March 6th 2012
Galp Energia’s Brazilian assets
Basin # projects % Galp Energia Operator
Potiguar 5 20% Petrobras
Santos
6 10-20% Petrobras
Espírito Santo 1 20% Petrobras
Pernambuco 3 20% Petrobras
Campos 1 15% Petrobras
Potiguar
Sergipe-Alagoas
Amazonas
5 40-50% Petrobras/Galp
Offshore
Onshore
1 Petrogal Brasil and other related subsidiaries

Flexibility to manage extra-cash at the holding level
Brazilian transaction ending a period of stretched balance sheet
10% to 20% of $4.8 bln to be retained to fund short-term capex needs
The remaining to be lent to shareholders on a pro-rata basis with reimbursements according to capex execution
34 | Capital Markets Day - March 6th 2012
Sinopec
Petrogal Brasil1
Galp Energia (70%)
Sinopec (30%)
$0.4 bln Intragroup loan reimbursement
1 Petrogal Brasil and other related subsidiaries
$4.8 bln
As a loan

Control and full consolidation maintained
Petrogal Brasil’s Board of Directors to be appointed proportionally by Galp Energia and Sinopec
Full consolidation of operations by Galp Energia
Net profit at the holding level impacted by Sinopec’s 30% share accounted in minority interests
Capex to be fully accounted at Galp Energia’s level
35 | Capital Markets Day - March 6th 2012

Financial slack successfully achieved
Capital allocation towards upstream
Project delivery enhancing cash generation
Committed to a sound capital structure
New sustainable dividend policy
Final remarks
Appendix
36 | Capital Markets Day - March 6th 2012

Capital allocation reflects the Company’s strategic path
Absorbing only maintenance capex
Investing towards higher operational safety and energy efficiency
37 | Capital Markets Day - March 6th 2012
Upstream Downstream
Reinforcing exploration budget to address new opportunities
Developing world class projects

2012: a year of capital allocation shift towards upstream
38 | Capital Markets Day - March 6th 2012
Capex by segment
€1 - €1.2bln
2011 2012
€1bln
E&P R&M G&P
2013 - 2016
c.€1.2bln/year

Brazil Mozambique
Angola Other and new ventures
Strengthening and diversifying our exploration portfolio
39 | Capital Markets Day - March 6th 2012
E&P capex 2012 exploration capex
2011 2012
Exploration Development

Financial slack successfully achieved
Capital allocation towards upstream
Project delivery enhancing cash generation
Committed to a sound capital structure
New sustainable dividend policy
Final remarks
Appendix
40 | Capital Markets Day - March 6th 2012

Strong cash generation from projects already implemented
Stable contribution from R&M business uplifted by upgrade project
G&P business to maintain solid contribution to earnings
41 | Capital Markets Day - March 6th 2012
Earnings growth by developing upstream projects
Oil price exposure increasing on cash generation
Upstream Downstream

Ebitda growth supported by upstream production ramp up
Strategy path to be materialized in earnings from 2012 onwards
42 | Capital Markets Day - March 6th 2012
Ebitda by segment
2012 2016
€0.9 – 1.1Bln
E&P R&M G&P
2011
CAGR1 ≈25% €0.8 Bln
1 CAGR 2011-2016

2011 2016
Iberia Other areas
Exposure to Iberian economic environment will decrease going forward
43 | Capital Markets Day - March 6th 2012
Ebitda 2011 vs 2016
>60%
<35%

Financial slack successfully achieved
Capital allocation towards upstream
Project delivery enhancing cash generation
Committed to a sound capital structure
New sustainable dividend policy
Final remarks
Appendix
44 | Capital Markets Day - March 6th 2012
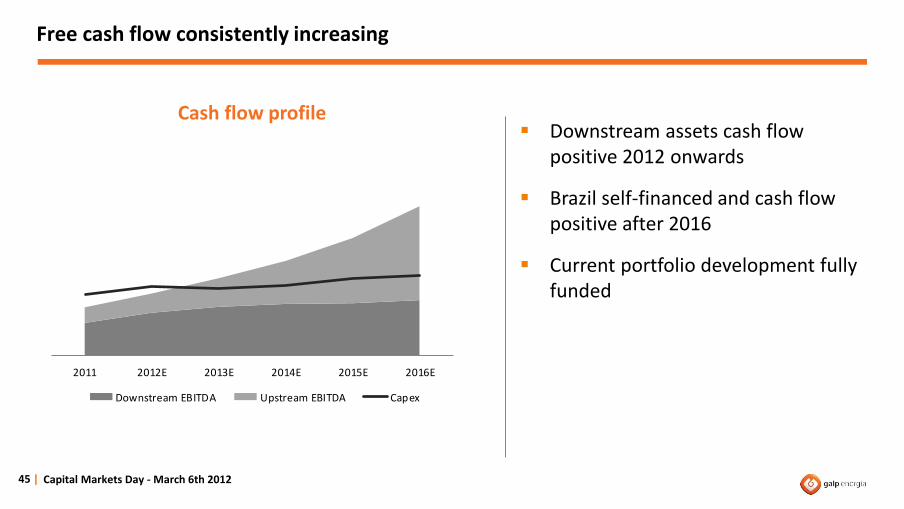
2011 2012E 2013E 2014E 2015E 2016E
Downstream EBITDA Upstream EBITDA Capex
Free cash flow consistently increasing
Downstream assets cash flow positive 2012 onwards
Brazil self-financed and cash flow positive after 2016
Current portfolio development fully funded
45 | Capital Markets Day - March 6th 2012
Cash flow profile

Sustainable and balanced capital structure going ahead
46 | Capital Markets Day - March 6th 2012
Net debt to equity
Source: Bloomberg 1 Assumes loan to Sinopec 2 Peers average includes Eni, BG Group, Repsol, OMV, Total, BP, Royal Dutch Shell and Petrobras
2 1
One of the most robust capital structures amongst peers
119%
<10%
37%<30%
2011 2011pro-forma
2011Peer average
Galp Energia target

Financial management to ensure a sound and flexible capital structure
47 | Capital Markets Day - March 6th 2012
Building up company’s flexibility
Mitigating execution risk
Enabling new venture
opportunities
Rewarding shareholders
Start of a new growth era with a sound capital structure

Financial slack successfully achieved
Capital allocation towards upstream
Project delivery enhancing cash generation
Committed to a sound capital structure
New sustainable dividend policy
Final remarks
Appendix
48 | Capital Markets Day - March 6th 2012

2007-2008 2009-2011 2012E 2013E 2014E 2015E 2016E
Rewarding shareholders through a consistent growing dividend
49 | Capital Markets Day - March 6th 2012 Dividend relates to net income of the corresponding financial year and not to the payment year 1 CAGR 2011-2016
€0.32/ share
€0.20/ share
Dividend policy to be driven by an era of progressive earnings growth

Financial slack successfully achieved
Capital allocation towards upstream
Project delivery enhancing cash generation
Committed to a sound capital structure
New sustainable dividend policy
Final remarks
Appendix
50 | Capital Markets Day - March 6th 2012

Commitment to maintain a sound financial position is a key strategic foundation
The start of a new growth era with a solid balance sheet
Execution risk mitigated and enhanced flexibility in project development
Cash flow from world class projects coming on-stream
Well balanced cash flow mix
Consistent dividend policy in line with further growth
51 | Capital Markets Day - March 6th 2012

Financial slack successfully achieved
Capital allocation towards upstream
Project delivery enhancing cash generation
Committed to a sound capital structure
New sustainable dividend policy
Final remarks
Appendix
52 | Capital Markets Day - March 6th 2012

2010 2011 Average 2012-2016
Oil price $/bbl 79.5 111 95
Benchmark refining margin $/bbl1 2.66 1.33 2.41
EUR:USD 1.33 1.39 1.40
Mid-cycle assumptions
2012-2016 Business plan assumptions
53 | Capital Markets Day - March 6th 2012
1 New post-upgrade benchmark refining margin = 42.5% cracking margin + 45.0% hydrocracking margin + 5.5% aromatics margin+ 7.0% base oils margin

Capital Markets Day - March 6th 2012
Upstream growth Fernando Gomes Executive Director
Page 54

A focused E&P strategy
Resources and targets
High potential exploration assets
Delivering world class development projects
55 | Capital Markets Day - March 6th 2012
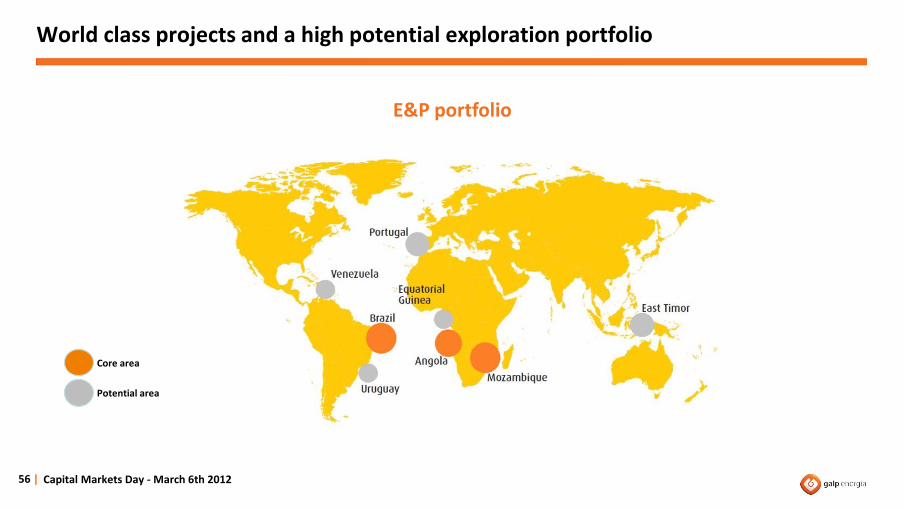
World class projects and a high potential exploration portfolio
56 | Capital Markets Day - March 6th 2012
Core area
Potential area
E&P portfolio

Capturing value from early exploration to production
57 | Capital Markets Day - March 6th 2012
Exp
lora
tio
n
Ap
pra
isal
Dev
elo
pm
ent
Pro
du
ctio
n
E&P projects lifecycle
cumulative value creation
Galp Energia is present in the entire upstream value chain

Focus on de-risking exploration assets
58 |
Project screening process R
isk
Potential
Capital Markets Day - March 6th 2012
Focus on high-risk / high-reward projects
Screening the most relevant projects to be developed first
Continuous de-risking process
Adding value to consortium decision making process
Ensuring financial discipline and funding flexibility
-
+ + -

Galp Energia is well positioned for future delivery
59 | Capital Markets Day - March 6th 2012
First mover advantage
Low entry costs
Leverage Portuguese flavour
Strategic partnerships with knowledgeable operators
Commitment to safe operations and best HSE practices
Highly qualified E&P team
Solid track record in identifying, accessing and delivering high potential and unexplored basins
Knowledge on deepwater projects
Strong resource base
Delivering value in high risk/high reward areas
Exploration footprint Exploration status

Enlarging our presence in key geographies with competitive advantages
Focus on well-known geologies and geographies
Access to new acreage in specific areas based on geological, regulatory, fiscal and political contexts
Aim to access areas with more material stakes while preserving a diversified portfolio
5
1 21
Brazil
Angola
Mozambique
Key geographies of the E&P portfolio
60 | Capital Markets Day - March 6th 2012

A focused E&P strategy
Resources and targets
High potential exploration assets
Delivering world class development projects
61 | Capital Markets Day - March 6th 2012

494 478
2,5502,821
2010 2011
Drilling activity throughout 2012 expected to unlock more than 100 Mln boe
62 | Capital Markets Day - March 6th 2012
Exploration resources1 (Mln boe)
Several high impact prospects identified within Galp Energia’s portfolio
Other areas
Other Brazil
Santos basin
1 Mean estimate Source: DeGolyer and MacNaughton @ 31/12/2011
+ 11%
Unrisked
Risked

172 202
754 870
2,356
2,672
2010 2011 2010 2011 2010 2011
Outstanding exploration delivery translated into contingent resources upgrade
63 | Capital Markets Day - March 6th 2012 1 Working interest resources Source: DeGolyer and MacNaughton @ 31/12/2011
1C 2C 3C
Contingent resources1 (Mln boe)
+ 17%
+ 15%
+ 13%
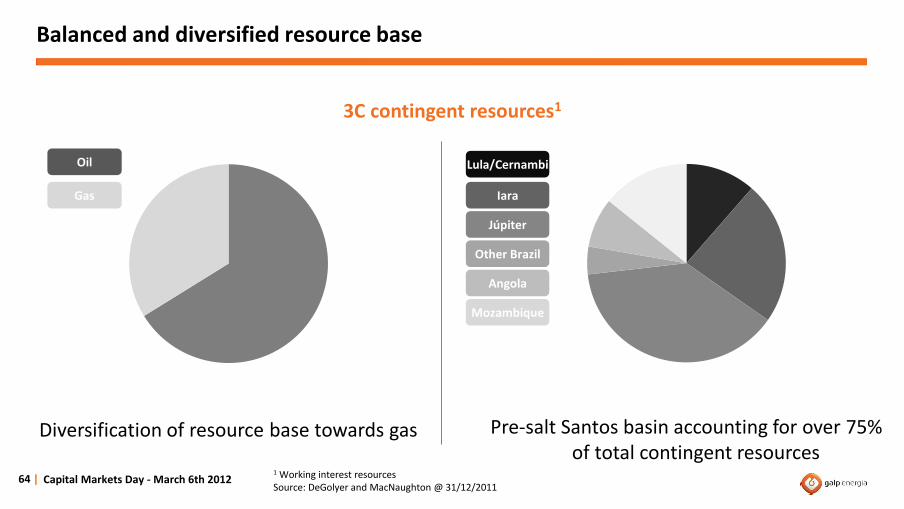
Balanced and diversified resource base
64 | Capital Markets Day - March 6th 2012
Gas
Oil
3C contingent resources1
1 Working interest resources Source: DeGolyer and MacNaughton @ 31/12/2011
Iara
Lula/Cernambi
Júpiter
Other Brazil
Angola
Mozambique
Diversification of resource base towards gas Pre-salt Santos basin accounting for over 75% of total contingent resources

128 145
397 399
574
709
2010 2011 2010 2011 2010 2011
Continuously de-risking contingent resource base
65 | Capital Markets Day - March 6th 2012
Reserves1 (Mln boe)
1Net entitlement reserves Source: DeGolyer and MacNaughton @ 31/12/2011
+ 14%
+ 0%
+ 24%
1P 2P 3P

Lula and Cernambi fields are the main contributors to reserve base
66 | Capital Markets Day - March 6th 2012
3P reserves1
1 Net entitlement reserves Source: DeGolyer and MacNaughton @ 31/12/2011
Gas
Oil
Angola
Brazil
Gas reserves accounts for c.15% of total Lula and Cernambi development projects continuously gaining relevance
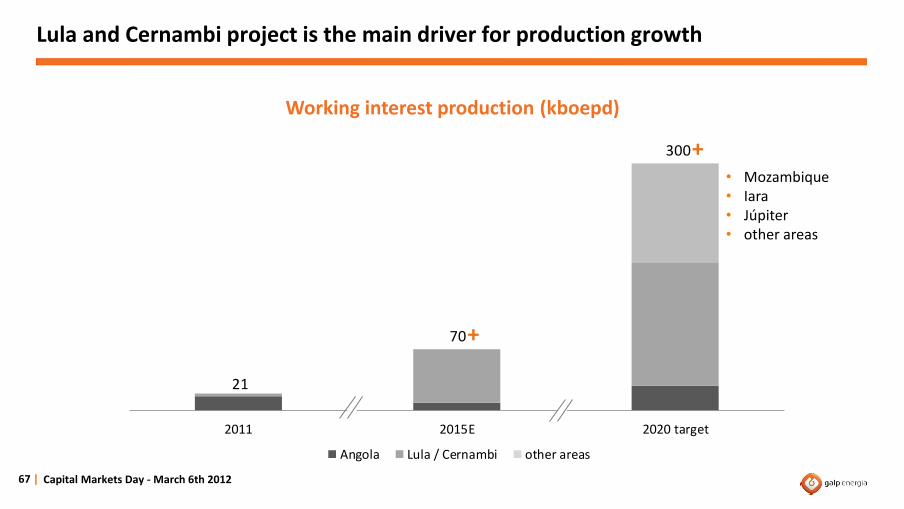
Lula and Cernambi project is the main driver for production growth
67 | Capital Markets Day - March 6th 2012
Working interest production (kboepd)
21
70
300
2011 2015E 2020 target
Angola Lula / Cernambi other areas
• Mozambique • Iara • Júpiter • other areas
+
+

Capital Markets Day - March 6th 2012
High potential exploration assets Roland Muggli Head of Exploration
Page 68

A focused E&P strategy
Resources and targets
High potential exploration assets
Delivering world class development projects
69 | Capital Markets Day - March 6th 2012

Over 100 prospects and leads currently in exploration funnel
70 | Capital Markets Day - March 6th 2012
Screen Evaluate Drilling Appraisal
Amazonas
New ventures
Pernambuco
Alentejo
Peniche Campos
Carcará
Bracuhy
Caramba
East Timor
Iara Júpiter
Block 141
Block 331
Block 14K1
Mozambique Angola LNG II
Potiguar
Espírito Santo
Uruguay
Block 321
1 projects at pre-development phase

Still a lot of upside potential from current exploration portfolio
71 | Capital Markets Day - March 6th 2012
Exploration portfolio – potential/risk profile
Lower resource potential
Hig
her
ris
k
Low
er r
isk
Higher resource potential
Blocks 32/33
Peniche basin Uruguay
Blocks 14/ 14K Campos basin
Espírito Santo basin
Amazonas basin
Mozambique
Alentejo basin
East Timor
Pernambuco basin Potiguar basin
BM-S-8
Júpiter
Caramba
112 prospects and leads identified within Galp Energia portfolio

Mozambique embraces a world class province
Mamba South-1 and North-1 wells discovered gas in place resources of up to 30 Tcf
Excellent reservoir characteristics in terms of porosity and permeability
Mamba North-1 test flowed 1 mln m3/d (35 mmscf/d) constrained by test equipment
Test also produced condensate in minor quantities
Rovuma basin discoveries
72 | Capital Markets Day - March 6th 2012

Intense exploration and appraisal campaign in place
Back-to-back drilling of 5 exploration/appraisal wells in 2012 with testing operations
Plan to also test a separate Eocene/Paleocene prospect not connected to Mamba structure
Block holds additional prospectivity warranting continued exploration during 2013
73 |
Area 4 discoveries
Capital Markets Day - March 6th 2012

Key Júpiter NE appraisal well in 2012
Júpiter discovery well found a reservoir of significant oil, condensate and gas with CO2 content
Júpiter NE appraisal well expected to be drilled in 2H2012 testing a thicker pre-salt reservoir section
Primary aim is to assess CO2 distribution and thickness of oil rim
Potential for large upside if field-wide OWC deeper than estimated in Júpiter well, not included in exploration resources
74 |
BM-S-24
Capital Markets Day - March 6th 2012

Testing Caramba resource upside in 2013
Caramba well in 2007 found a reservoir of light oil
Caramba pre-salt discovery with significant updip potential
Plan to drill Caramba Sul appraisal well in 2013
Expected DoC by April 2015
75 | Capital Markets Day - March 6th 2012
BM-S-21

3rd exploration well outcome is key to support a development plan
Evaluation plan for 2,432 km2
Two exploration wells to date encountered high API pre-salt oil in Bem-Te-Vi and Biguá accumulations
3rd exploration well, Carcará currently being drilled
Results will be an important contributor towards DoC in December 2012
76 | Capital Markets Day - March 6th 2012
BM-S-8
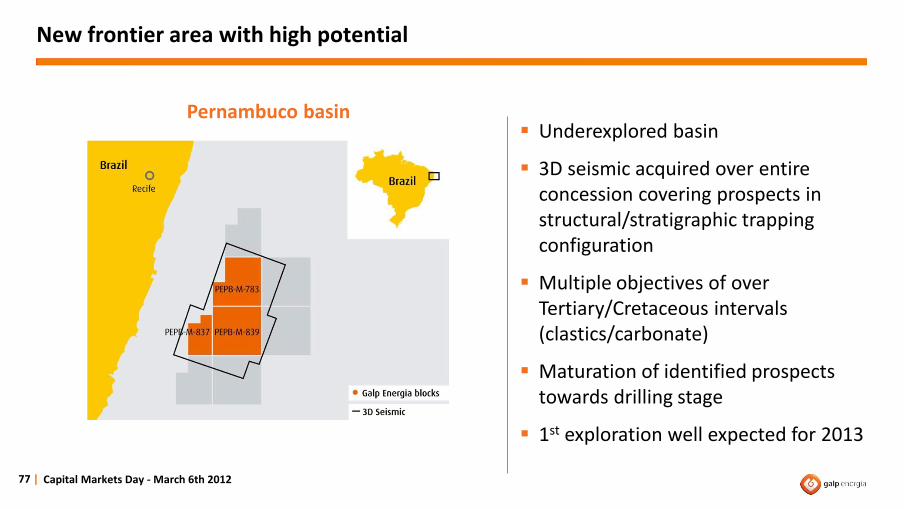
New frontier area with high potential
Underexplored basin
3D seismic acquired over entire concession covering prospects in structural/stratigraphic trapping configuration
Multiple objectives of over Tertiary/Cretaceous intervals (clastics/carbonate)
Maturation of identified prospects towards drilling stage
1st exploration well expected for 2013
77 | Capital Markets Day - March 6th 2012
Pernambuco basin
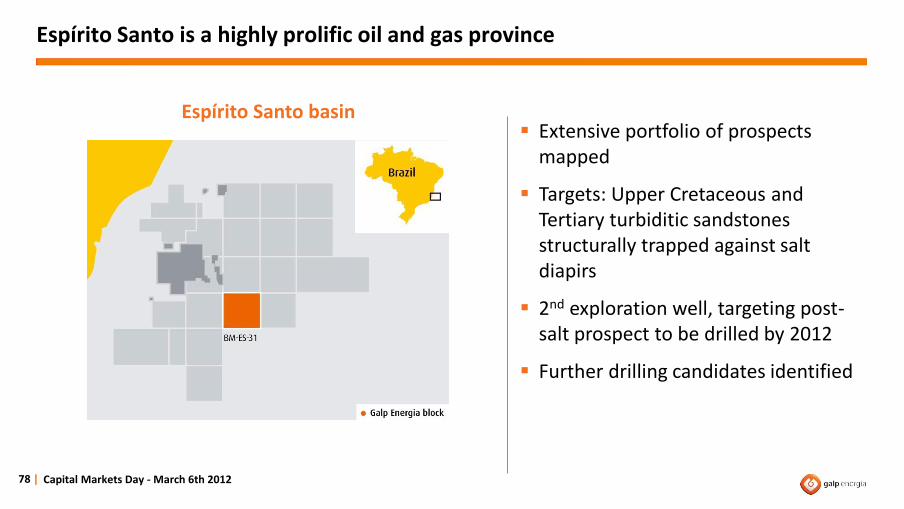
Espírito Santo is a highly prolific oil and gas province
Extensive portfolio of prospects mapped
Targets: Upper Cretaceous and Tertiary turbiditic sandstones structurally trapped against salt diapirs
2nd exploration well, targeting post-salt prospect to be drilled by 2012
Further drilling candidates identified
78 | Capital Markets Day - March 6th 2012
Espírito Santo basin

New frontier province with significant resource potential
Two contracts including stakes in five blocks, covering an acreage of 3,736 km2
Prolific shallow waters area located near Brazilian equatorial margin
9 prospects identified in water depths of 1,500m in a predominantly stratigraphic setting (Cretaceous clastics)
1st exploration well, Ararauna, to be drilled in 2012
79 | Capital Markets Day - March 6th 2012
Potiguar basin

Exploration phase extended in East Timor
Timor island accretionary wedge and foreland basin (Northern Bonaparte)
First frontier exploration well Cova-1 in 2011 was considered to be non-commercial
Well data allowed to re-evaluate entire concession including deeper plays (Permian, Triassic)
Extension of current exploration phase until November 2012 allows to mature identified prospects towards drill or drop decision
80 | Capital Markets Day - March 6th 2012
East Timor

Alentejo basin exploration drilling to start as early as 2013
Mesozoic rift basin with large structures identified
1,800 km2 of 3D seismic with excellent quality acquired in 2011
Several prospects identified with significant resource potential
Drilling decision for the 1st exploration well to be taken in 2012
81 | Capital Markets Day - March 6th 2012
Alentejo basin

Exploration activities still in early stages
82 | Capital Markets Day - March 6th 2012
Uruguay 6,290 km of 2D seismic over Blocks 3
and 4 in Punta del Este basin
2D seismic evaluation ongoing with focus on Tertiary stratigraphic and Paleozoic syn-rift plays
Several leads identified with significant upside potential
Basin modelling to assess charge uncertainty
Next milestone: decision on 3D seismic acquisition
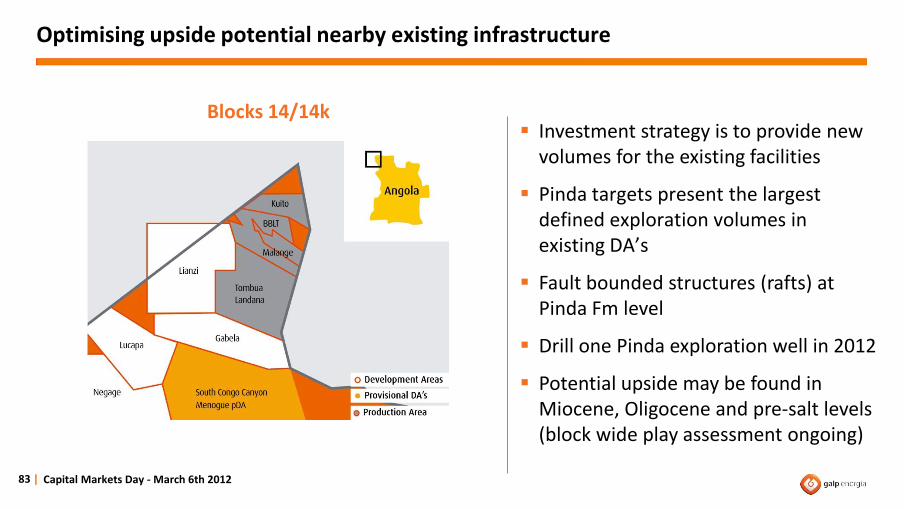
Optimising upside potential nearby existing infrastructure
Investment strategy is to provide new volumes for the existing facilities
Pinda targets present the largest defined exploration volumes in existing DA’s
Fault bounded structures (rafts) at Pinda Fm level
Drill one Pinda exploration well in 2012
Potential upside may be found in Miocene, Oligocene and pre-salt levels (block wide play assessment ongoing)
83 | Capital Markets Day - March 6th 2012
Blocks 14/14k

Evaluation program on track in blocks 32 and 33
Block 32
Five year exploration program to develop 2nd hub in block 32
Two exploration/appraisal wells in 2H12 (Gengibre-3 / Caril -2)
Oligocene/Miocene channels in mixed trapping configuration
84 | Capital Markets Day - March 6th 2012
Blocks 32/33
Block 33
One exploration well Sumate-1 to be drilled in March 2012 in block 33

1Q 2Q 3Q 4Q
Lula
Cernambi
Iara
BM-S-8
BM-S-24
Potiguar offshore
BM-ES-31
Block 14
Block 32
Block 33
LNG II
Mozambique Rovuma
Brazil
Angola
2012TotalCountry Area
More than 20 exploration and appraisal wells to drill in 2012
85 | Capital Markets Day - March 6th 2012
A A A
A
A
E
E
A
E
E
E A
E
A A A
E A A E E/A E/A
3
1
1
1
1
1
1
1
2
1
3
6
22
1 1 1
1
1
1 1
1Development de-risking wells

Delivering world class development projects Carlos Alves Head of Exploration & Production

A focused E&P strategy
Resources and targets
High potential exploration assets
Delivering world class development projects
87 | Capital Markets Day - March 6th 2012

Development options being analysed according to SEE approach
Distance to onshore just 40 km
Multi-train LNG train development scenarios are being developed
Unitisation discussions with area 1 shall take place in near future
Flow rates expected to be up to 4 Mln m3/d (150 mmscf/d) during production phase
High quality reservoir enhances flow and recovery rates, with impact on capex needs
88 | Capital Markets Day - March 6th 2012
Area 4 location
SEE: Social, Environmental, Economic impact
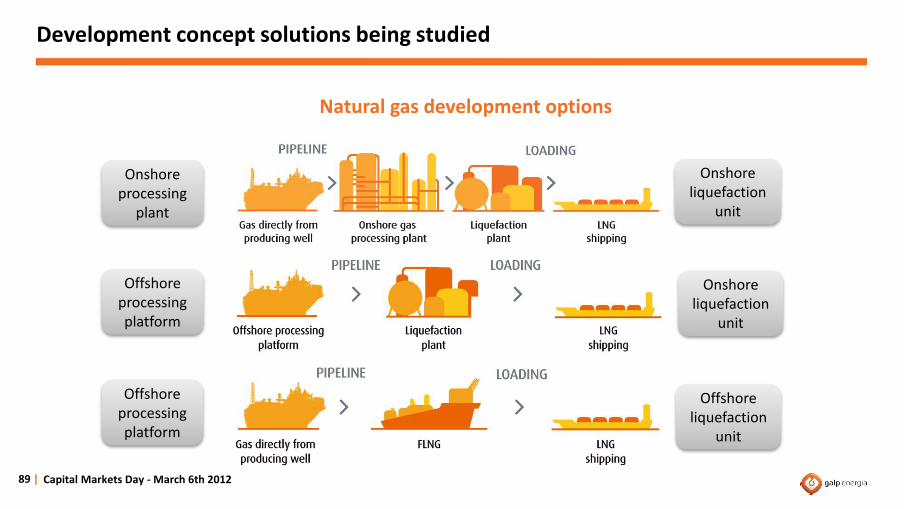
Development concept solutions being studied
Offshore processing platform
Onshore processing
plant
Offshore processing platform
Onshore liquefaction
unit
Onshore liquefaction
unit
Offshore liquefaction
unit
Natural gas development options
Capital Markets Day - March 6th 2012 89 |

Location near interesting LNG consumption markets
Global LNG market expected to double to c.400 Mtpa in 2020
Interesting geographical location to target the growing demand from Asian market
Leverage on partners and in-house Angolan and Brazilian experience to develop and market natural gas
Gas commercial production expected to start by 2018
90 | Capital Markets Day - March 6th 2012
LNG markets
Primary market targets

Pre-salt province revealed key success characteristics
Galp Energia benefited from being within the first movers into the pre-salt area
Seven discoveries within pre-salt layer in four blocks
Presence since 2000 starting to materialize
Significant upside potential from forthcoming appraisal and development activities
91 | Capital Markets Day - March 6th 2012
Pre-salt Santos basin

Potentially material appraisal activity underway in Júpiter
Gross 3C contingent resources above 5 bln boe1, of which 1/3 oil, 1/3 condensates and 1/3 natural gas
High CO2 content and to be studied by Jupiter NE appraisal well
EWT in Júpiter area expected for 2015
Expected DoC until February 2016
92 | Capital Markets Day - March 6th 2012
BM-S-24
1 Source: DeGolyer and MacNaughton @ 31/12/2011
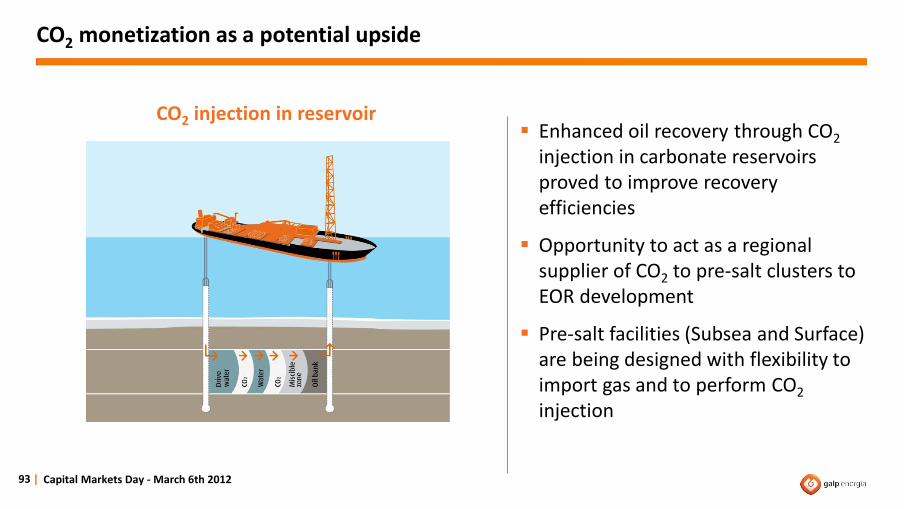
CO2 monetization as a potential upside
Enhanced oil recovery through CO2 injection in carbonate reservoirs proved to improve recovery efficiencies
Opportunity to act as a regional supplier of CO2 to pre-salt clusters to EOR development
Pre-salt facilities (Subsea and Surface) are being designed with flexibility to import gas and to perform CO2 injection
93 |
CO2 injection in reservoir
Capital Markets Day - March 6th 2012
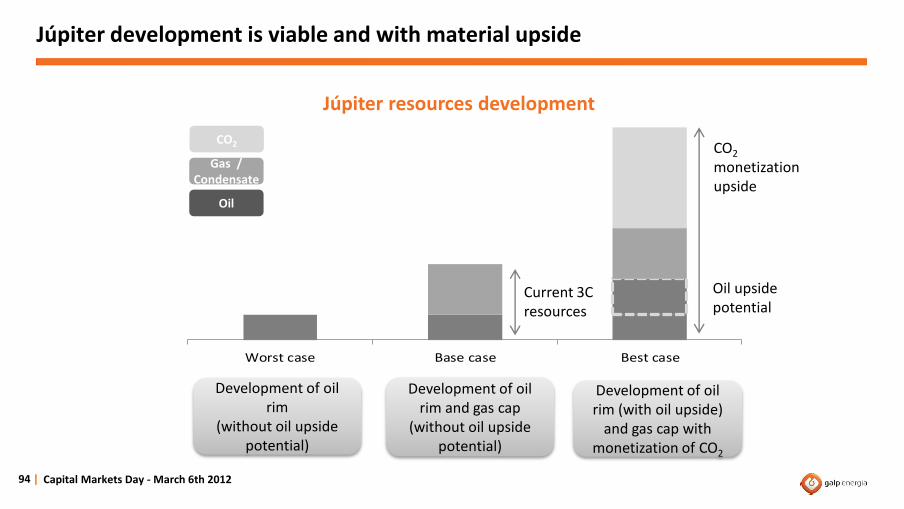
Worst case Base case Best case
Júpiter development is viable and with material upside
94 | Capital Markets Day - March 6th 2012
CO2 monetization upside
Development of oil rim (with oil upside)
and gas cap with monetization of CO2
Development of oil rim
(without oil upside potential)
Development of oil rim and gas cap
(without oil upside potential)
CO2
Gas / Condensate
Oil
Oil upside potential
Current 3C resources
Júpiter resources development

Appraisal activities confirmed Iara’s potential
Two wells drilled so far found a reservoir of oil with high quality
Reservoir rocks composed of microbial carbonates from sag and rift sections
Formation tests on Iara Horst registered good quality data
3-4 bln boe with upside potential
95 |
Iara field
Capital Markets Day - March 6th 2012

Drilling performance with high angle wells encourages application in Iara
Potential upside through multi-lateral and horizontal drilling on development phase in a cost effective manner
Technology being tested currently in Lula field
Potential for upward revision of recoverable resources
96 |
Drilling optimization
Capital Markets Day - March 6th 2012

Development of Iara being studied
Iara West currently being drilled with results expected during 2Q12 targeting a structure with potentially better reservoir characteristics
Intensive activity gathering information to prepare the development plan
EWT planned in the sequence of Iara West results
Expected DoC by December 2013
97 | Capital Markets Day - March 6th 2012
Iara field

Lula/Cernambi project has been a successful journey
98 | Capital Markets Day - March 6th 2012
• BM-S-11 awarded
• Tupi discovery
• First EWT
• Iracema discovery
• First oil from 1st pilot FPSO
• Lula/Cernambi DoC
2000
2006
2009
2010 2011
2012 and beyond
• First international oil sale
• First gas commercialization

Significant progress achieved in 2011
Appraisal activity during 2011 revealed better reservoir characteristics than initially expected
Initial flow capacity above expectations
EWT in Lula NE confirmed the productivity achieved in previous tests
Currently performing the 1st EWT in Cernambi South area
FPSO BW Cidade de São Vicente
99 | Capital Markets Day - March 6th 2012

Fast development of a world-class project
Lula – 1 project to reach full capacity in March
Four producing wells and one gas injection well to be in place at the end of March
Two WAG injection wells to be connected to FPSO Cidade de Angra dos Reis in 2012
Ready to connect highly deviated well (P8H) in 2013
100 |
Lula-1 project
Capital Markets Day - March 6th 2012

FPSO deployment in Lula/Cernambi
Infrastructure secured to support project development
2nd and 3rd production units being converted and expected to be on stream by 2Q13 and 2014 respectively
Works for the deployment of the six hulls already started at Rio Grande shipyard
FPSO deliveries on time to support the fast development of Lula/Cernambi project
Six rigs permanently allocated to BM-S-11 by YE2011
101 | Capital Markets Day - March 6th 2012

Lula/Cernambi production of c.1,500 kboepd in 2020
Production profile based on current technological achievements
Better reservoir characteristics allowed the upwards revision of production target
Knowledge acquired with Lula-1 will be key in accelerating the development of subsequent producing units
102 | Capital Markets Day - March 6th 2012
0
1,000
2,000
2012E 2013E 2014E 2015E 2016E 2017E 2018E 2019E 2020E
Lula/Cernambi production profile (kboepd)

Significant and reachable upside potential on Lula/Cernambi project
WAG alternative ready to be tested in Lula-1 from 2012 onwards
Each 1 p.p. increase in recovery factor results in an incremental c.300 Mboe of recoverable volumes
Potential for further capacity de-bottlenecking through sub-sea equipments
Potential for further economies of scale
103 |
Subsea equipment
Capital Markets Day - March 6th 2012

Angola is currently a development story
Presence in Angola rewarded with 26 discoveries
Three fields already under production: Kuito, BBLT and Tômbua-Lândana
Current projects already reached peak production
Further production increase will be driven by new projects already identified
Angola blocks
104 | Capital Markets Day - March 6th 2012

Five areas still to be developed
Kuito, BBLT and Tômbua-Lândana reaching mature phase
Lianzi, Malange and Lucapa first oil expected to occur between 2014 and 2017
Development scenarios based on both tie-backs and new FPSO production unit
World-class technical breakthroughs: Congo river crossing gas export project and Lianzi DEH flowlines application
105 | Capital Markets Day - March 6th 2012
Blocks 14/14K
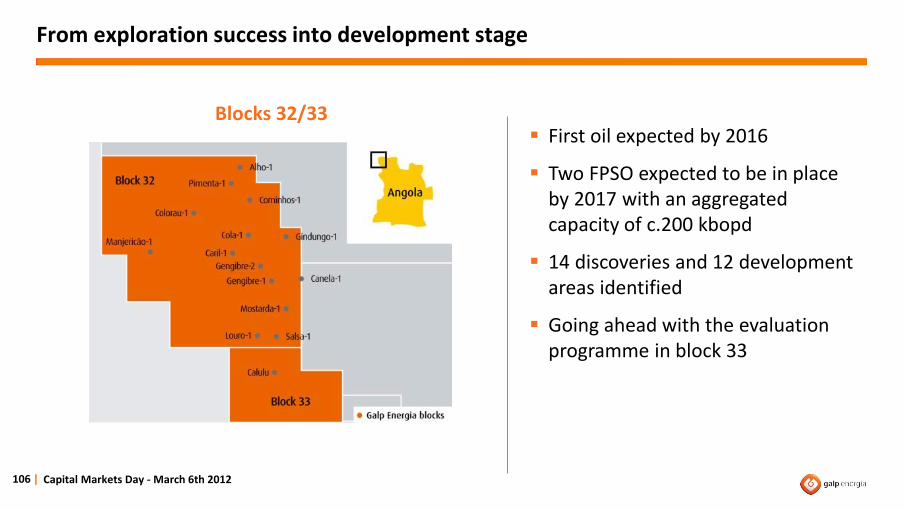
From exploration success into development stage
106 | Capital Markets Day - March 6th 2012
Blocks 32/33
First oil expected by 2016
Two FPSO expected to be in place by 2017 with an aggregated capacity of c.200 kbopd
14 discoveries and 12 development areas identified
Going ahead with the evaluation programme in block 33

Development of world class projects on track to achieve 300 kboepd by 2020
107 | Capital Markets Day - March 6th 2012
Mozambique development project being studied with first gas expected by 2018
Brazil gaining momentum and driving production growth
Significant upside through testing different techniques in pre-salt Santos basin
Angola development projects being prepared to support production increase

108 |
Capital Markets Day - March 6th 2012
Closing remarks Manuel Ferreira De Oliveira Chief Executive Officer

Solid foundations to deliver sustainable value
109 | Capital Markets Day - March 6th 2012
Solid financial structure
Outstanding exploration
potential
Delivering high potential projects
Sound downstream
business
Highly responsible
practices

Acronyms
110 | Capital Markets Day - March 6th 2012
# Number GWh GigaWatt hour
$ United States dol lar HSE Health, Safety and Environment
% Percentage IPO Ini tia l Publ ic Offering
2D Two dimens ional seismic Kboepd Thousand barrels of oi l equiva lent per day
3D Three dimens ional seismic Kbpd Thousand barrels per day
API gravity American Petroleum Insti tute gravi ty Km2
Square ki lometre
BBLT Benguela , Bel ize, Lobito, and Tomboco LNG Liqui fied Natura l Gas
Bbl Barrel LTIFR Lost time injury frequency rate
Bcm Bi l l ion cubic metres Mln Mil l ion
Bln Bi l l ion MW MegaWatt
Boe Barrel of oi l equiva lent Mmscf/d Mil l ion s tandard cubic feet per day
c. Circa NG Natura l Gas
CAGR Compound Annual Growth Rate OWC Oi l -water contact
Capex Capita l expenditure POS Probabi l i ty of success
CO2 Carbon Dioxide p.p. Percentage point
DA Development area R&M Refining & Marketing
DEH Direct electrica l heating RCA Replacement Cost adjusted
DoC Declaration of commercia l i ty SAM Sustainable Asset Management
E/A Exploration wel l /Appraisa l wel l SEE Socia l , Environmental and Economic impact
E&P Exploration & Production SXEP STOXX Europe 600 Oi l & Gas
EBITDA Earnings before interest, taxes , depreciation and amortization Tcf Tri l l ion cubic feet
EOR Enhanced oi l recovery Ton Tonne
EWT Extended Wel l Test WAG Water Al ternating Gas
FLNG Floating l iquefied natura l gas WI Working interest
FPSO Floating Production Storage Offloading YE Year End
Disclaimer
111 | Capital Markets Day - March 6th 2012
Financial outlook figures are RCA figures except otherwise noted.
Matters discussed in this presentation may constitute forward-looking statements. Forward-looking statements are statements other than in respect of
historical facts. The words “believe,” “expect,” “anticipate,” “intends,” “estimate,” “will,” “may,” "continue," “should” and similar expressions identify
forward-looking statements. Forward-looking statements may include statements regarding: objectives, goals, strategies, outlook and growth
prospects; future plans, events or performance and potential for future growth; liquidity, capital resources and capital expenditures; economic outlook
and industry trends; developments of Galp Energia’s markets; the impact of regulatory initiatives; and the strength of Galp Energia’s competitors. The
forward-looking statements in this presentation are based upon various assumptions, many of which are based, in turn, upon further assumptions,
including without limitation, management’s examination of historical operating trends, data contained in Galp Energia’s records and other data
available from third parties. Although Galp Energia believes that these assumptions were reasonable when made, these assumptions are inherently
subject to significant known and unknown risks, uncertainties, contingencies and other important factors which are difficult or impossible to predict and
are beyond its control. Such risks, uncertainties, contingencies and other important factors could cause the actual results of Galp Energia or the industry
to differ materially from those results expressed or implied in this presentation by such forward-looking statements.
The information, opinions and forward-looking statements contained in this presentation speak only as at the date of this presentation, and are subject
to change without notice. Galp Energia does not intend to, and expressly disclaim any duty, undertaking or obligation to, make or disseminate any
supplement, amendment, update or revision to any of the information, opinions or forward-looking statements contained in this presentation to reflect
any change in events, conditions or circumstances.