Capital and income growth from active global equity investment · Capital and income growth from...
96
Annual Report 2015 Capital and income growth from active global equity investment
Transcript of Capital and income growth from active global equity investment · Capital and income growth from...

Annual Report 2015
Capital and income growth from active global equity investment
To view the report online
If you would like to view video updates about the Company, please visit:
www.witan.com
Witan is an investment trust which is listed on the London Stock Exchange and was founded in 1909.
markets (principally equities) using a multi-manager approach. The portfolio is
sector and at the individual stock level.
Witan typically uses between 10 and 15
active approaches and styles aims to deliver added value for shareholders while smoothing out the volatility normally associated with
Witan’s objective
Long term growth in income and
investment in global equities
In the year of the 200th anniversary of the Battle of Waterloo, the cover shows a Seq he early 1850s and known as Wellingtonia – in the United
States as Washingtonia!

Annual Report 2015 Witan Investment Trust plc 01
Financial Statements
Statutory Information
Strategic ReportReport of the D
irectorsC
orporate Governance
Other Inform
ation
Contents
Report of the Directors
02 Financial Highlights04 Chairman’s Report06 Chief Executive’s Report
Strategic Report
09 Strategic Report23 Investment Managers26 Fifty Largest Equity Investments27
Statutory Information
28 Board of Directors30 Directors’ Report
Corporate Governance
34 Corporate Governance Statement44 Report of the Audit Committee46 Directors’ Remuneration Report57 Statement of Directors’
Responsibilities58 AIFMD disclosures
Financial Statements
60 Independent Auditor’s Report64 Statement of Comprehensive Income65 Statements of Changes in Equity66 Balance Sheets67 Cash Flow Statements68 Notes to the Financial Statements
Other Information
90 Historical Record90 Unsolicited approaches for shares91 Witan Wisdom and Jump92 Shareholder Information IBC The Royal Horticultural Society
02
04
06
Financial Highlights
Chairman’s Report
Chief Executive’s Report
Shareholder Total Return
NAV Total Return
Dividends per Share
+5.7%+6.4%
+10.4%

Witan Investment Trust plc Annual Report 201502
Share price and net asset value (NAV) 2015 2014 % change
Share price 780.0p 753.5p 3.5
NAV per ordinary share (debt at par value) 788.4p 760.3p 3.7
NAV per ordinary share (debt at fair value) 781.2p 749.2p 4.3
(Discount)/premium (NAV including income, debt at fair value)(A) (0.2)% 0.6%
(A) The average premium on this basis in 2015 was 0.1% (2014: average discount 2.8%), (Source: Morningstar).
Financial Highlights
Total returns since the introduction of the multi-manager structure (30.09.04) (F)
Corporate key performance indicators
Total return performance 1yr % Return 3yrs % Return 5yrs % Return
Total shareholder return (B) 5.7 66.3 70.4
Net asset value total return (C) 6.4 47.0 51.2
Benchmark (D) 3.5 31.9 38.7
FTSE All-Share Index (E) 1.0 23.4 33.8
FTSE All-World Index (E) 4.3 42.1 49.7
UK CPI Returns 0.2 2.8 10.0
(B) Source: Morningstar. The movement in ordinary share price adjusted to include the reinvestment of dividends.
(C) Source: Morningstar/Witan. The movement in the net asset value per share adjusted to include the reinvestment of dividends.
(D) Source: Morningstar/Witan. The benchmark is a composite of four indices: the FTSE All-Share Index 40%, the FTSE All-World North America Index 20%, the
Index 20%.
(E) Source: Morningstar. See also FTSE International for conditions of use (www.ftse.com).
(F) Source: Morningstar.
100
150
200
250
300
350
400
2005 2006 2007 2008 2009 2010 2011 2012 2013 2015
Share Price NAVWitan benchmark
2004 2014

Annual Report 2015 Witan Investment Trust plc 03
Financial Statements
Statutory Information
Strategic ReportReport of the D
irectorsC
orporate Governance
Other Inform
ation
Dividend information 2015 2014 % change
Revenue per share 18.5p 15.9p 16.4
Dividend per share 17.0p 15.4p 10.4
2016 dividend schedule* Dividend payable Ex-Dividend Date Pay date Dividend type per share
3 March 2016 1 April 2016 Fourth Interim (2015) 5.45p
19 May 2016 17 June 2016 First Interim 4.25p
25 August 2016 16 September 2016 Second Interim 4.25p
17 November 2016 16 December 2016 Third Interim 4.25p
*Please note that the dates and amounts for the first, second and third interim dividends could be subject to change.
2015 2014 % change
Net assets £1,577,330,000 £1,441,247,000 9.4
Number of ordinary shares in issue 200,071,000 189,561,000 5.5
Gearing (A) 10.7% 10.1%
Ongoing charge excluding performance fee 0.72% 0.74%
Ongoing charge including performance fee 0.99% 0.96%
8.5
11.5
14.5
17.5
2005 2007 2008 2009 2010 2011 2012 2013 2014 2015
Witan dividend (pence per share) (left scale)CPI Index (right scale)
2006
97
128
159
190
Since 2005, Witan’s dividend per share has risen 93%, compared with 27% for the UK consumer price index
of shareholders’ funds (see note 14, page 85).
Source: Datastream.

Witan Investment Trust plc Annual Report 201504
Chairman’s Report
Harry Henderson | Chairman
Summary2015 was another year when market sentiment was changeable, with no consistent market direction as discussed in the Chief Executive’s Report on page 6. Active investment selection was particularly important. During the year our managers
, with a modest additional contribution from the Company’s use of gearing. Eight of our external managers outperformed their benchmarks during the year, four of them by margins of over 5%.
As a result, Witan shareholders enjoyed a successful year, with a net asset value (‘NAV’) total return of 6.4%, 2.9% more than our benchmark’s total return of 3.5%. The share price total return was 5.7%, as the shares moved from a small premium at the end of 2014 to a 0.2% discount at the end of 2015. The dividend for the year has been increased by 10.4% to 17.0 pence per share (2014: 15.4 pence), while adding £2.4m to our revenue reserves. A fourth interim dividend of 5.45 pence was declared in February 2016, payable on 1 April 2016. This marks the
Taking a longer perspective, over the past 5 years Witan has achieved a NAV total return of +51%, compared with the +39% return from our benchmark over this period. Over the 10 years to the end of 2015, shareholders have enjoyed a NAV total return of 110%, compared with the benchmark’s return of 82%.
Witan’s shares in the marketThe Company’s shares enjoyed a further rerating during 2015, trading at a premium for much of the period. In order to meet demand from the market, the Company issued 10.5m shares at a premium to NAV, adding over £83m to our net assets. This
issuance itself is modestly accretive to NAV (+ £0.4m in 2015), being made at a premium. The increased

Annual Report 2015 Witan Investment Trust plc 05
Financial Statements
Statutory Information
Strategic ReportReport of the D
irectorsC
orporate Governance
Other Inform
ation
> NAV total return of 6.4% outperformed the benchmark’s return of 3.5%
> 1%, 12% ahead of the benchmark
> Share price average premium to NAV of 0.1%
> 10.5m shares issued at a premium to NAV, raising over £83m
> £75m long-term debt issued at under 3.5% p.a.
> Dividend increased by 10.4% to 17.0p, more than 10%
Highlights
market liquidity is helpful to existing and prospective investors, particularly those dealing in size on a single day and the increased assets of the Company
Whilst delivery of sound investment performance remains the principal focus of the Board, it has also always paid attention to discount-related issues. At the time of our change to a multi-manager approach in 2004, our Annual report said that “one of the more important long-term objectives is to create sustainable liquidity in Witan’s shares at or near to asset value”. We are pleased to have achieved this in 2015. Now the challenge is to achieve this objective through the full range of investment conditions. These issues are discussed in more detail in the Strategic Report on page 9.
BorrowingsDuring the year, the Company issued £75m of 20
The interest rates Witan secured are the lowest achieved in the sector for such long maturities
the scheduled repayment of our 8.5% Debenture in 2016. Further details of the Company’s policy on gearing and actions taken during 2015 may be found in the Strategic Report on page 9.
AGMOur Annual General Meeting will be held at
2.30 pm. Formal notice of the meeting will be sent to shareholders when the Annual Report is published. We look forward to the opportunity to meet you then for the Company’s 108th AGM.
James Bevan, who has been on the Board since 2007, will retire at the AGM. I should like to thank him on behalf of the Board for his wise counsel and advice.
I should like to thank the Chief Executive and the rest of our team for their hard work and excellent results this year.
Harry HendersonChairman8 March 2016

Witan Investment Trust plc Annual Report 201506
Chief Executive’s Report
The investment markets in 2015 As the Chairman has alluded to, equity markets delivered positive returns in 2015 in sterling terms but there were episodes of notable volatility. A
prices and lower bond yields) faded then reversed during the summer, as concerns about global growth
, returns turned positive for developed markets but remained negative for emerging markets. Japan was the standout performer, with a 16% total return in sterling terms, while the UK was a relative laggard, only returning 1.0%. Asian and other emerging economies fell, weighed down by concerns about weaker growth in China and exposure to falling commodity prices.
Economic growth fell short of hopes but, in developed economies, 2015 was generally stronger than 2014, while expectations for 2016 are for
to see in this an explanation for the volatility experienced in August and September (as well as early in 2016), when investor concerns became focused on the negative repercussions of the falls in oil and other commodity prices, with additional concerns about strains in the Chinese economy.
The fall in oil prices, from a consumer’s point of view, represents a boost in spending power and had been predicted to boost growth in 2015. Consumers were expected to spend the windfall, whereas much of the revenue from high oil prices had piled up in the sovereign wealth funds of producing nations, which were simply expected to have smaller surpluses to save, resulting in a net overall boost to activity. This appears not to have happened, owing to the speed and extent of the fall in oil prices – they halved in a few months in late 2014 and fell further during 2015.
As a result, countries and companies dependent on oil aggressively cut their spending, resulting in a sharp setback for industrial sectors that had
and production
Andrew Bell | Chief Executive
Annual Report 2015 Witan Investment Trust plc 07
Financial Statements
Statutory Information
Strategic ReportReport of the D
irectorsC
orporate Governance
Other Inform
ation
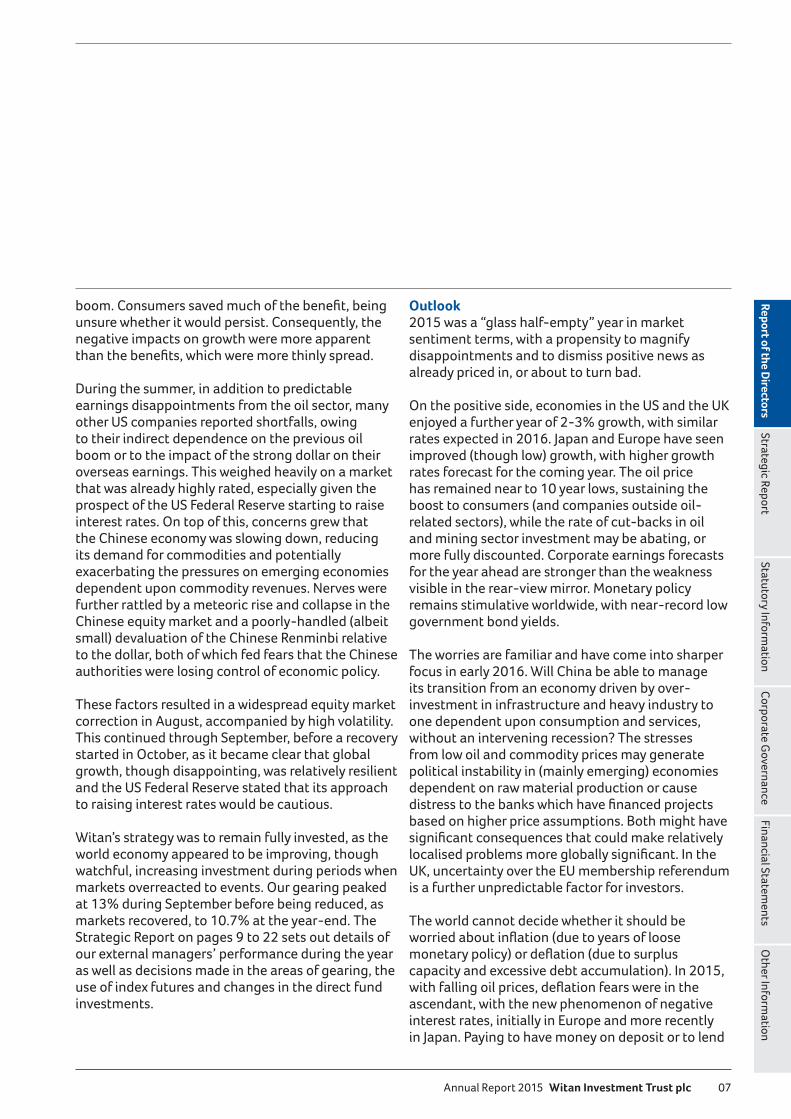
Outlook2015 was a “glass half-empty” year in market sentiment terms, with a propensity to magnify disappointments and to dismiss positive news as already priced in, or about to turn bad.
On the positive side, economies in the US and the UK enjoyed a further year of 2-3% growth, with similar rates expected in 2016. Japan and Europe have seen improved (though low) growth, with higher growth rates forecast for the coming year. The oil price has remained near to 10 year lows, sustaining the boost to consumers (and companies outside oil-related sectors), while the rate of cut-backs in oil and mining sector investment may be abating, or more fully discounted. Corporate earnings forecasts for the year ahead are stronger than the weakness visible in the rear-view mirror. Monetary policy remains stimulative worldwide, with near-record low government bond yields.
The worries are familiar and have come into sharper focus in early 2016. Will China be able to manage its transition from an economy driven by over-investment in infrastructure and heavy industry to one dependent upon consumption and services, without an intervening recession? The stresses from low oil and commodity prices may generate political instability in (mainly emerging) economies dependent on raw material production or cause
based on higher price assumptions. Both might have
UK, uncertainty over the EU membership referendum is a further unpredictable factor for investors.
The world cannot decide whether it should be
capacity and excessive debt accumulation). In 2015, with falling oil prices, ascendant, with the new phenomenon of negative interest rates, initially in Europe and more recently in Japan. Paying to have money on deposit or to lend
boom. Consumers saved muchunsure whether it would persist. Consequently, the negative impacts on growth were more apparent
During the summer, in addition to predictable earnings disappointments from the oil sector, many other US companies reported shortfalls, owing to their indirect dependence on the previous oil boom or to the impact of the strong dollar on their overseas earnings. This weighed heavily on a market that was already highly rated, especially given the prospect of the US Federal Reserve starting to raise interest rates. On top of this, concerns grew that the Chinese economy was slowing down, reducing its demand for commodities and potentially exacerbating the pressures on emerging economies dependent upon commodity revenues. Nerves were further rattled by a meteoric rise and collapse in the Chinese equity market and a poorly-handled (albeit small) devaluation of the Chinese Renminbi relative to the dollar, both of which fed fears that the Chinese authorities were losing control of economic policy.
These factors resulted in a widespread equity market correction in August, accompanied by high volatility. This continued through September, before a recovery started in October, as it became clear that global growth, though disappointing, was relatively resilient and the US Federal Reserve stated that its approach to raising interest rates would be cautious.
Witan’s strategy was to remain fully invested, as the world economy appeared to be improving, though watchful, increasing investment during periods when markets overreacted to events. Our gearing peaked at 13% during September before being reduced, as markets recovered, to 10.7% at the year-end. The Strategic Report on pages 9 to 22 sets out details of our external managers’ performance during the year as well as decisions made in the areas of gearing, the use of index futures and changes in the direct fund investments.

Witan Investment Trust plc Annual Report 201508
Chief Executive’s Report continued
to governments is a novel concept. In 2016, this
rates are set to rise later in the year due to the falls in oil prices dropping out of the annual comparison. With bond yields so low, investors may be more sensitive than expected to signs that the direction of
Concerns continue to be expressed about the slow
Much looser monetary policy than normal has been required, which has generated relatively pallid rates of economic growth. However, anaemia is not the same as rigor mortis. There are now more examples of economies where recovery is well-established, with the US and UK relatively robust but even previous problem areas such as Japan and Europe are seeing more encouraging growth. The Achilles’ heel now is seen as emerging economies but, after 5 years of emerging market underperformance, this may
.
It seems unlikely that the world will see rapid rates of economic growth in 2016 but nor does it appear probable that there will be renewed slippage into recession. Interest rates seem likely to remain exceptionally low for an extended period (even if they have begun to rise in the US). Finding companies which can grow their earnings in a world of moderate growth will continue to be the focus of our managers. On the macro-economic level, whilst there is an ever-present potential for policy mistakes, policy makers appear aware of the risks of
pro-growth emphasis should prove supportive for equity markets. However, as recent months have demonstrated, there will be inevitable periods of volatility dence is tested by shorter term market and economic events.
Andrew Bell Chief Executive8 March 2016

Annual Report 2015 Witan Investment Trust plc 09
Financial Statements
Statutory Information
Strategic ReportReport of the D
irectorsC
orporate Governance
Other Inform
ation
Strategic ReportStrategy and business model
shareholders, together with an income that rises faster than
The Company employs an active multi-manager approach, allocating funds for investment by selected managers with
best available managers, including those not accessible on the same terms (or at all) to UK investors.
Witan’s multi-manager approach was adopted in 2004, in the belief that no single manager was likely to excel in all markets and at all points in the economic cycle. Employing managers to invest in their areas of greatest competence has the potential to improve returns and to reduce risk relative to using a single manager across the investment waterfront.
value or growth approaches and geographical exposure),
combined ability to outperform over time. We seek managers who can capture the longer term growth rewards from equity investment by focusing on fundamental share values rather than chasing short-term momentum.
2. Business modelThe Company has appointed Witan Investment Services Limited as its Alternative Investment Fund Manager under the Alternative Investment Fund Managers Directive (‘AIFMD’). As AIFM, WIS has responsibility for operating the Company’s portfolio and risk management processes. WIS delegates certain portfolio management responsibilities to external portfolio managers. In addition, the Company uses an outsourced model for other corporate functions, such as fund accounting, custody and specialist professional services. These activities are overseen by the WIS and Witan Executive team, covering Investment, Operations and
Director of the Company.
Whilst the external managers appointed are responsible for stock selection in their individual portfolios, WIS and the Company’s Board are responsible for the overall delivery of performance to shareholders, through the following means:
> Setting the overall investment objective;
> Selecting competent managers, who are expected to outperform a suitable benchmark relating to the investment remit set by the Company;
> Operating appropriate portfolio, corporate governance
corporate management and to meet the requirements of the AIFMD;
Companies are required to publish a Strategic Report, which should provide a description of the objectives which its strategy is designed to deliver for shareholders, the business model and the outlook for the year ahead. It should also include analysis of the Company’s performance during the year, relative to the key elements of its business strategy. This Strategic Report has been prepared solely to provide additional information to shareholders to assess the Company’s strategies and the potential for those strategies to succeed. The Strategic Report contains certain forward looking statements. These statements are made by the directors in good faith based on the information available to them up to the time of their approval of this report and such statements should be treated with caution due to the inherent uncertainties, including both economic and business risk factors, underlying any such forward-looking information. This report falls into four main sections:
1. Strategy
2. Business model
3. Performance and principal developments in 2015
4. Corporate and operational structure
Witan is an Investment Trust, which was founded in 1909 and has been listed on the London Stock Exchange since 1924. It is managed by the Executive team of its Alternative Investment Fund Manager (AIFM), Witan Investment Services Limited (WIS), under the control and supervision of the Company’s Board of Directors.
1. StrategyThe Company’s strategy is to create value for shareholders, by addressing its investment objective, by adding value in
with existing and potential shareholders.
The Company invests its shareholders’ funds primarily in a broad spread of global equity markets. The objective is
ies created by global economic growth and to outperform a representative equity benchmark, thereby generating long-term capital growth for

Witan Investment Trust plc Annual Report 201510
Strategic ReportStrategy and business model continued
> Adjusting asset allocation according to opportunities that arise;
> The judicious use of borrowings with the aim of adding to performance;
> Direct investment in funds exposed to specialist asset categories;
> Controlled and selective use of exchange-traded derivatives to adjust asset allocation; and
> Clear communication of Witan’s objective and its results to shareholders and potential investors.
The Board’s and the Executive’s role in investment managementAs noted above, the Company has appointed its wholly-owned subsidiary WIS as its AIFM. As such, WIS has responsibility for ensuring that portfolio and risk management of the Company are properly carried out, with appropriate safeguards to ensure the functional and hierarchical independence of those with portfolio and risk management responsibilities. The Board remains responsible for setting the investment strategy, policy and guidelines of the Company and the AIFM operates within these.
The selection of individual investments is largely delegated to external managers, subject to investment limits and
the Company and its AIFM have selected (e.g. value, higher dividend yield, special situations). The managers are chosen by the Witan and WIS Boards after a disciplined selection process focused on the managers’ scope to add value and
The overwhelming majority of the portfolio is managed in segregated accounts, held by the Company’s depositary (via the custodian to whom it delegates safekeeping responsibilities). This enables the Company to analyse the risks and opportunities of the portfolio as a whole as well as of each manager’s portfolio. The operations of the custodian and the safeguarding of the Company’s assets are further supervised by the depositary, appointed by Witan and its AIFM, in accordance with the requirements set out in the AIFMD.
At the end of 2015, the Company and its AIFM had 11 external investment managers, covering a range of investment remits. Information regarding the proportion of Witan’s assets managed by each and of their performance during the year is set out on page 13.
A proportion, up to 10%, of the portfolio (at the time of investment) may be invested in collective funds selected by WIS, with the objective of outperforming Witan’s equity benchmark. This portfolio is managed subject to limits set by the Board, and in accordance with portfolio and risk management processes established by Witan and the Company’s AIFM. These investments may represent asset categories that are temporarily undervalued or funds which are viewed as attractive longer-term generators of superior returns.
The WIS Executive, overseen by and working within clear parameters set by the Board, seeks to add to performance by adjusting the level of gearing employed, by the selective use of exchange-traded derivatives to alter the asset allocation and by the use of specialist funds to gain exposure to areas under-represented in the rest of the portfolio. In essence,
advantage of investment opportunities that may arise, in addition to the total returns arising from the investment managers’ portfolios, which are expected to be the most
the Company’s performance.
Our selected benchmark The Company’s benchmark, used as a reference point for comparing performance, is a combination of global equity
most of the portfolio holdings are chosen. Since October 2007 the benchmark (based on the FTSE All-World indices) has been:
40% UK 20% North America 20% Europe ex-UK
a comprehensive range of investment opportunities in the
belief that the opportunities are related to the importance of economic regions more than the market capitalisation of regional equity markets. The high weighting in the UK (which declined from 60% to 50% in 2004 and to 40% in 2007)
It should be emphasised that the portfolio is actively managed and not designed to track any index or combination of market indices. Performance can be expected to vary, sometimes considerably, from that of the benchmark, while aiming for outperformance in the longer term.
Performance information for other commonly used indices is also given in the key performance indicators summary section on page 11.
Annual Report 2015 Witan Investment Trust plc 11
Financial Statements
Statutory Information
Strategic ReportReport of the D
irectorsC
orporate Governance
Other Inform
ation
Strategic ReportPerformance and principal developments in 2015
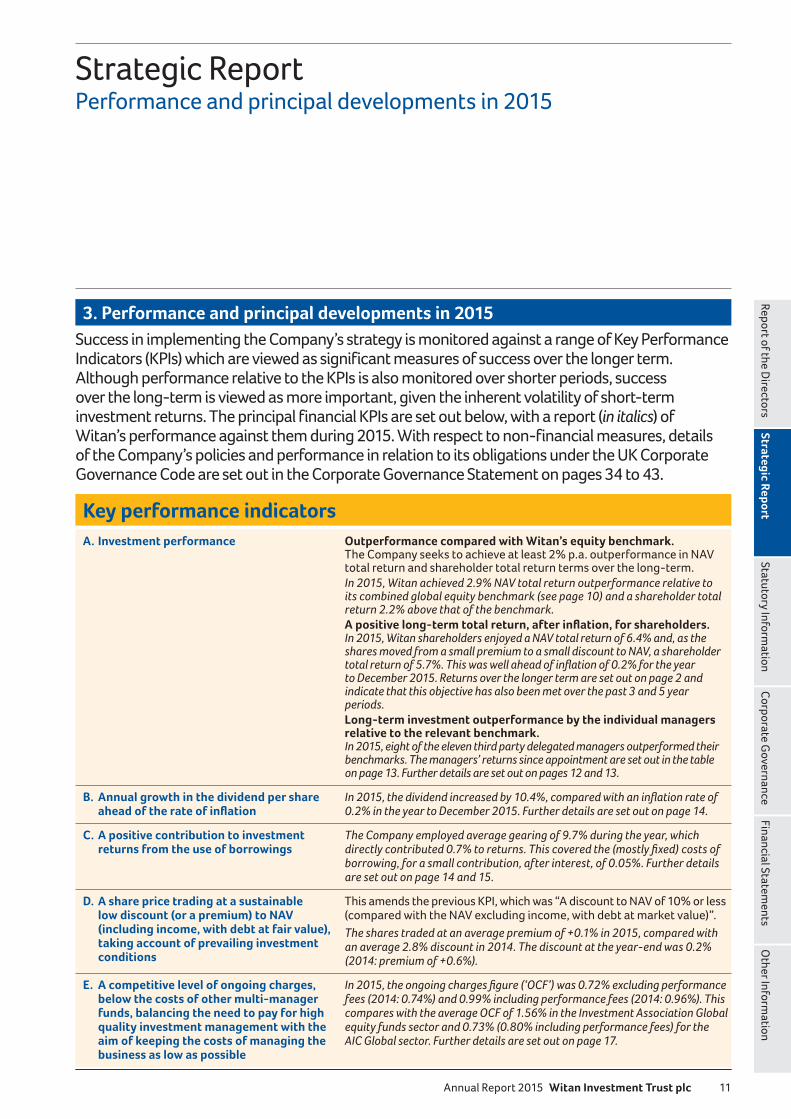
A. Investment performance Outperformance compared with Witan’s equity benchmark. The Company seeks to achieve at least 2% p.a. outperformance in NAV total return and shareholder total return terms over the long-term. In 2015, Witan achieved 2.9% NAV total return outperformance relative to its combined global equity benchmark (see page 10) and a shareholder total return 2.2% above that of the benchmark.
In 2015, Witan shareholders enjoyed a NAV total return of 6.4% and, as the shares moved from a small premium to a small discount to NAV, a shareholder
2% for the year to December 2015. Returns over the longer term are set out on page 2 and indicate that this objective has also been met over the past 3 and 5 year periods.Long-term investment outperformance by the individual managers relative to the relevant benchmark. In 2015, eight of the eleven third party delegated managers outperformed their benchmarks. The managers’ returns since appointment are set out in the table on page 13. Further details are set out on pages 12 and 13.
B. Annual growth in the dividend per share In 2015, the dividend increased by 10.40.2% in the year to December 2015. Further details are set out on page 14.
C. A positive contribution to investment returns from the use of borrowings
The Company employed average gearing of 9.7% during the year, which
borrowing, for a small contribution, after interest, of 0.05%. Further details are set out on page 14 and 15.
D. A share price trading at a sustainable low discount (or a premium) to NAV (including income, with debt at fair value), taking account of prevailing investment conditions
This amends the previous KPI, which was “A discount to NAV of 10% or less (compared with the NAV excluding income, with debt at market value)”.The shares traded at an average premium of +0.1% in 2015, compared with an average 2.8% discount in 2014. The discount at the year-end was 0.2% (2014: premium of +0.6%).
E. A competitive level of ongoing charges, below the costs of other multi-manager funds, balancing the need to pay for high quality investment management with the aim of keeping the costs of managing the business as low as possible
fees (2014: 0.74%) and 0.99% including performance fees (2014: 0.96%). This Investment Association Global
equity funds sector and 0.73% (0.80% including performance fees) for the AIC Global sector. Further details are set out on page 17.
Key performance indicators
3. Performance and principal developments in 2015Success in implementing the Company’s strategy is monitored against a range of Key Performance Indicators (KPIs) which are viewed as significant measures of success over the longer term. Although performance relative to the KPIs is also monitored over shorter periods, success over the long-term is viewed as more important, given the inherent volatility of short-term investment returns. The principal financial KPIs are set out below, with a report (in italics) of Witan’s performance against them during 2015. With respect to non-financial measures, details of the Company’s policies and performance in relation to its obligations under the UK Corporate Governance Code are set out in the Corporate Governance Statement on pages 34 to 43.

Witan Investment Trust plc Annual Report 201512
Strategic ReportPerformance and principal developments in 2015 continued
Performance summary and attribution2015 was in some respects similar to 2014, in that equity investment returns oscillated around the unchanged mark for much of the year. Japan was the strongest of the main equity markets (with a total return in sterling of 16%), while sterling total returns in developed markets ranged from just 1.0% for the UK (weighed down by high oil and mining sector weightings) to 7% for the US and 5% for Europe. Emerging
concerns including weak commodity prices, lower growth in China and the prospect of rising US interest rates.
Witan’s NAV total return (after all costs) was 6.4%, 2.9% ahead of the 3.5% return from the composite equity benchmark.
securities, the NAV total return was 5.8%, 2.3% ahead of the
closed the year on a 0.2% discount (2014: +0.6% premium).
In a year when market returns were modest and variable, active investment selection was needed to achieve more tangible returns and respond to the opportunities created by market volatility. Witan’s gross portfolio return (before costs) was 6.7%. This performance was boosted by outperformance by the managers’ portfolios (with 8 out of our 11 third party delegated managers ahead of their benchmarks). In the underperforming UK market, the three UK managers’ targeted stock selection enabled them to outperform their
4.7% and 7.7%, compared with the UK market’s total return of just 1.0%. The contribution from gearing (0.7%) was slightly greater than the drag from the Company’s mostly
Combined portfolio composition During the year the Company invested its assets with a view to spreading investment risk and in accordance with the
in terms of stocks, sectors and geography. The portfolio has been actively managed by the investment managers, in accordance with their individual mandates, with overall asset allocation and risk being managed by the Executive team, within delegated limits from the Board and the Company’s AIFM.
The sector breakdown and regional exposure for the aggregated portfolio is shown on page 27. The top 50 holdings across the combined Witan portfolio are set out on page 26. They represented 42% of Witan’s portfolio at
and the portfolio’s broad geographical exposure.
returns, since the purpose of using active managers is to
the benchmark. One measure of active management in a portfolio is known as “active share”. This indicates the
portfolio identical to the benchmark having an active share of 0% while one with no holdings in common with its benchmark would have an active share of 100%. Although looking at active share at a particular point is an incomplete measure of the degree to which a portfolio is managed actively (let alone successfully), the active share of our combined portfolio was circa 66% at the end of 2015 (2014: 65%). This level of active
multi-manager structure Witan’s portfolio retains an active approach, while relative performance in recent years also
Equity mandate Investment manager Benchmark Investment style
UK Artemis Investment Management LLP FTSE All-Share Recovery/special situations
UK Heronbridge Investment Management LLP FTSE All-Share Intrinsic value growth
UK Lindsell Train Limited FTSE All-Share Long-term growth from undervalued brands
Global Lansdowne Partners (UK) LLP DJ Global Titans Concentrated, benchmark-independent investment in developed markets
Global MFS International (UK) Limited FTSE All-World Growth at an attractive price
Global Pzena Investment Management LLC FTSE All-World Systematic value
Global Tweedy, Browne Company LLC FTSE All-World Fundamental value
Global Veritas Asset Management LLP FTSE All-World Fundamental value, real return objective
Pan-European Marathon Asset Management LLP FTSE All-World Capital cycles Developed Europe
(including Japan) Management LLC
Emerging Markets Trilogy Global Advisers, LP MSCI Emerging Markets Fundamental, growth orientated
Directly-held Witan’s AIFM and Executive team Witan’s combined Collective funds invested in mispriced investments equity benchmark or specialist assets, recovery situations

Annual Report 2015 Witan Investment Trust plc 13
Financial Statements
Statutory Information
Strategic ReportReport of the D
irectorsC
orporate Governance
Other Inform
ation
Investment manager performanceDetails of the manager structure in place at the end of 2015, showing the proportion of Witan’s assets that each managed and the performance they achieved, are set out in the table below:
Benchmark Value of % of Witan’s Benchmark Performance performance Witan assets assets under Performance performance since since managed management in 2015 in 2015 appointment appointmentInvestment manager at 31.12.15 at 31.12.15 (%) (%) (%) (%) £m (Note 1) (Note 2)
Artemis 173.4 9.9 5.4 1.0 10.5 4.8
Heronbridge 109.8 6.3 4.7 1.0 8.5 4.5
Lindsell Train 179.2 10.2 7.7 1.0 17.1 8.3
Lansdowne Partners 196.5 11.2 17.5 6.0 26.8 11.8
MFS 142.0 8.1 5.3 4.0 11.8 9.0
Pzena 162.2 9.3 2.3 4.0 5.6 7.8
Tweedy, Browne 51.1 2.9 0.5 4.0 4.5 7.8
Veritas 202.8 11.6 8.5 3.8 12.1 8.9
Marathon 138.5 7.9 10.7 3.4 10.5 7.3
Matthews 194.5 11.1 10.1 4.0 6.3 3.3
Trilogy 47.2 2.7 (10.7) (9.7) (4.8) (2.6)
Witan Direct Holdings 152.4 8.7 0.3 3.5 7.3 7.0
Notes:1. Percentage of Witan’s investments managed and cash balances held centrally by Witan.2. The percentages are annualised where the date of appointment was more than one year ago.
demonstrates that Witan’s aggregated portfolio retains an individual character distinct from the relevant indices.
Manager structure and performance The Company’s delegated managers have a range of
set by the Company. Details of each manager’s mandate, benchmark and investment style are shown on page 12. Further details, including the date of appointment are shown in the manager summaries on pages 23 to 25.
All of the delegated managers were in place throughout the year. During the year, eight of the third party delegated managers outperformed their benchmarks, while three underperformed, along with the Direct Holdings. Lansdowne delivered a particularly strong performance, with a total return of 17.5%. Marathon, Matthews, Lindsell Train and Veritas also delivered above average returns, in Matthews’ case overcoming the headwind from low returns from the
had a hard time in 2015, so Pzena and Tweedy, Browne’s returns were below benchmark. Our emerging market manager, Trilogy, also slightly underperformed its asset class, which was notably weaker than developed markets.
Directly held investments This portfolio, which held 6.7% of assets at the end of 2014, underperformed Witan’s benchmark by 3.2% during
3%. Its proportion of the investment portfolio at the year-end was 8.7%, owing to net investments made during the year. The investment in Electra Private Equity convertible shares was sold. An investment was made in Apax Global Alpha, a newly listed private equity fund. The holding in SVG Capital (where despite good NAV progress and reduced portfolio
increased at low prices and we also added to Princess Private Equity. Less favourably, we continued to add, gradually (though not gradually enough), to our holding in BlackRock
but the shares (and the sector) have yet to stabilise, with sentiment currently almost universally negative. Despite the near-term risks to capital and dividends in the sector, it has increased potential as a medium-term recovery story. We also added to the Edinburgh Dragon convertible
Asian markets recover and downside protection (through redemption at par in 2018) if they do not. We trimmed our
Net asset value total return +6.4% Portfolio total return (gross) +6.7%Benchmark total return +3.5% Benchmark total return +3.5%
Relative investment performance +3.2%Gearing impact +0.7%
+0.6%Share buybacks/issuance +0.0%
+1.3%+4.5%
Borrowing costs -0.6%Operating costs and tax -1.0%
-1.6%Relative performance +2.9% +2.9%

Witan Investment Trust plc Annual Report 201514
holding in Aberforth Geared Income Trust, owing to its excellent NAV progress, as it outperformed the smaller companies index, which itself outperformed the wider market in 2015. The main investments are in listed private equity and related funds (Apax Global Alpha, Princess Private Equity, SVG Capital and NB Distressed Debt Investment Fund), UK domestic recovery (Aberforth Geared Income Trust), specialist sector funds (principally Blackrock World Mining Trust) and the convertible bonds of Edinburgh Dragon Investment Trust and JZ Capital Partners.
Dividend policy and performance in 2015 The Company’s policy (subject to circumstances) is to increase its dividend per share in real terms, ahead of the increase in UK Consumer Price Index (CPI).
The Company’s revenue earnings increased by 16% to 18.49 pence per share in 2015. This was driven by an increase in portfolio dividends and by strength in the US dollar (in which US and a number of UK company dividends are denominated) relative to sterling.
For 2015, the Board has declared a fourth interim dividend of 5.45 pence per share, to be paid to shareholders on 1 April 2016, making a total distribution for the year of 17.0 pence (2014: 15.4 pence). This represents an increase of 10.4%, more than 10% ahead of the 0.2year to December 2015. This is the 41st consecutive year that Witan has increased its dividend.
The chart below shows the growth in dividends over the past 10 years, which has been ahead of the rise in the UK CPI in each year.
Since 2005, Witan’s dividend per share has risen 93% compared with 27% for the UK consumer price index.
8.5
11.5
14.5
17.5
20152006 2007 2008 2009 2010 2011 2012 2013 2014
Witan dividend (pence per share) (left scale)CPI Index (right scale)
200597
128
159
190
Source: Datastream.
payments for 2016 (in June, September and December) will, in the absence of unforeseen circumstances, be paid at a rate of 4.25 pence per share (2015: 3.85 pence), being one quarter of
the full year payment for 2015. The fourth payment (in March
between the three quarterly dividends already paid and the payment decided for the full year.
Policy on gearing and the use of derivativesEmployment of gearing PurposeThe purpose of using borrowings is to improve (or “gear/ leverage”) returns for shareholders, by achieving investment returns higher than the interest cost of the borrowings. Accordingly, attention is paid to using a level of gearing appropriate for market conditions (put simply, having more borrowings when markets are attractively valued and borrowing less at times when returns are expected to be poorer). In addition, a blend of long-term and short-term borrowings is used, to balance the certainty of cost associated with locking in fixed rates for longer periods with the flexibility of using short-term facilities which can be readily repaid when they are not required.
LimitsAlthough the Company has the legal power under its Articles of Association to borrow up to 100% of the adjusted total of shareholders’ funds (which is also the maximum level of leverage set by its AIFM), this is subject to practical constraints including a test of prudence. The Board’s longstanding policy is not to allow gearing (as defined on page 3) to rise to more than 20%, other than temporarily in exceptional circumstances. Over the past five years it has generally varied between 5% and 15% and where appropriate the Company may hold a small net cash position.
StructureFollowing the issuance of new long-term debt in 2015 (detailed in the following section), the Company’s fixed-rate borrowings rose from £110m to £185m but will reduce to £140m when the Debenture is repaid in October 2016. The average interest rate paid on the Company’s fixed-rate borrowings has declined from 7% (prior to the issue) to 5.6% and will fall further to 4.6% following repayment of the Debenture, while the average borrowing term has doubled from 7 to 14 years. The Company also has a £50m one-year facility, providing additional flexibility over the level of gearing, as well as enabling the Company to borrow in currencies other than sterling, if deemed appropriate. Witan may either invest its borrowings fully, or neutralise their effect with cash balances (or the sale of equity index futures) according to its assessment of the markets. The Company’s delegated managers are not permitted to borrow within their portfolios but may hold cash if deemed appropriate.
Strategic ReportPerformance and principal developments in 2015 continued

Annual Report 2015 Witan Investment Trust plc 15
Financial Statements
Statutory Information
Strategic ReportReport of the D
irectorsC
orporate Governance
Other Inform
ation
Action taken in 2015In mid-2015, the Company issued £21m of 20 year and £54m of 30 year fixed-interest debt at yields of 3.29% and 3.47% respectively. These borrowing yields are the lowest rates achieved in the sector for borrowing at such long maturities for many decades. The Board believes that fixing borrowing costs at such low rates will benefit future shareholder returns. In 2015, the funds raised were predominantly used to repay short-term borrowings but the issues also took account of the October 2016 repayment date of the Company’s 8.5% Debenture stock.
The size of the Company’s short-term facility was reduced from £70m to £25m for the second half of 2015, to limit commitment costs. The current facility is £50m, which will rise to £75m in October 2016. At the end of December, the drawn balance on this facility was £3m (2014: £45m).
Gearing was managed actively during the year. It was reduced in early 2015 as the markets rose, and increased in the summer and autumn, as market setbacks created opportunities. Gearing was 10.1% at the end of 2014, 9.6% mid-year and 10.7% at the year-end. The calculation of gearing takes account of cash balances and the full nominal value of any derivatives held, since this represents the size of the asset or liability to which the derivative provides exposure.
Gearing benefited performance during the year. Although the estimated contribution of 0.7% of shareholders’ funds was similar to the interest costs borne (0.6%), the majority of the finance cost is fixed and would have been incurred irrespective of whether the funds were invested, so the benefit (similar to 2014) was noticeable, in a year of moderate absolute returns.
At the end of 2014, gross gearing (adding together the value of all positions (less cash), irrespective of whether they were an asset or a liability) was 10.1%. This included a £34.7 million long position in Nikkei Index futures, equivalent to 2.4% of net assets.
At the end of 2015, gross gearing (on the same basis) was 10.7%. This included £37m in index futures (FTSE 100 (£24m) and MSCI Emerging Markets (£13m)) equivalent to 2.4% of net assets. Gearing excluding this was 8.3%. Further details of the accounting treatment for these positions are given in note 1 on page 71.
Use of derivatives PolicyWitan’s policy on the use of derivatives emphasises simplicity, transparency, cost effectiveness and the minimisation of
counterparty risk. Where financial instruments are available that help the Company to implement its investment policy (whether for the purpose of increasing exposure to a particular asset or for portfolio hedging) their use will be considered. In recent years, exchange-traded index futures have been the only instruments used. These give exposure to a particular market index, are relatively liquid to trade and depend upon the creditworthiness of the particular exchange, not an individual firm. The Company takes full account of the effect of the nominal value of the futures contracts when calculating its gearing. The value of the investments (which are traded on official exchanges) is fully marked to market every day.
The use of index futures enables Witan to adjust its gearing rapidly, helping investment flexibility. It also provides a means of adjusting asset allocation (by directing investment to particular markets). In both cases index futures enable the adjustments to be made without interfering with the assigned objectives for our investment managers, which are to pick stocks that will grow in value over the medium to long term and outperform their respective benchmarks. The operation of this investment area is the responsibility of the AIFM, acting under guidelines set by the Board. Transactions are reported to the Board as they occur, with the CEO and AIFM being accountable for the financial results. The Company’s delegated managers are not permitted to use derivatives or to gear their portfolios.
Activity during 2015In early March, we sold our position in Nikkei 225 Index futures contracts, after a strong run in the Japanese market. The position was equivalent to approximately 2.4% of net assets at the end of 2014, having been in place since purchase in early 2013, to increase our portfolio exposure to a market which we believed to be attractive and where our managers had relatively little stock exposure.
The Company had a short position in Gilt futures during March and early April. This was established to protect against the risk of a rise in yields during the period when the Company was seeking to lock in low rates on long-term borrowings. Given volatility in government bond markets, together with uncertainty ahead of the UK General Election, negating part (around one third) of the interest rate risk was viewed as prudent. In the event, gilt yields fell in March which meant that the protection proved unnecessary and this position made a loss. However, the benefit of that fall in yields on our new long-term debt costs was significantly greater.

Witan Investment Trust plc Annual Report 201516
Strategic ReportPerformance and principal developments in 2015 continued
In the aftermath of the decisive UK General Election result, we increased our exposure to UK equities by 1.5% using FTSE 100 index futures. The timing of this was inopportune, given the later summer volatility in markets. Our timing was better in August and September, when we invested 2% of net assets in FTSE 100 and MSCI Emerging Markets index futures on two of the most volatile days. When the markets rebounded, these positions were reduced.
At the end of 2015, our derivatives exposure was £37m, £24m in UK FTSE 100 index futures and £13m in MSCI Emerging Markets index futures. The realised gain on index futures during the year is shown in the cash flow statement on page 67.
Witan’s shares in the market – liquidity and discountsWitan is a member of the FTSE 250 index, with a market capitalisation of over £1.5 billion at 31 December 2015. The Board places great importance on the encouragement of a liquid market in Witan’s shares on the London Stock Exchange. Considerable effort is devoted to communicating Witan’s objective and performance clearly to shareholders and potential investors. There is a wide range of firms and online investment platforms through which the Company’s shares may be held and the Company’s subsidiary Witan Investment Services Limited also operates a savings plan for investing in Witan shares, details of which are described on page 91.
Whilst delivery of sound investment performance remains the principal focus of the Board, it has also always paid attention to discount-related issues. The Company has, over many years, made significant use of share buybacks, purchasing shares for cancellation when they have stood at an unduly wide discount (to the NAV taking debt at fair value). In addition to being accretive to NAV, this had the objective of reducing the discount. A total of over 49% of our shares were repurchased and cancelled between 1998 and 2013. In recent years, partly as a result of this persistence, Witan’s shares have traded closer to NAV than historically and, for much of 2015, at a premium.
Witan Investment Trust discount trend
-16
-14
-12
-10
-8
-6
-4
-2
0
2
4
5 day average discount
3 month average discount
1 year average discount
2010 2011 2013 2014 20152012
Source: Morningstar.
The discount trend since 2011 is illustrated in the chart above. The Company’s shares continued to trade at a premium for much of 2015, as a result of demand in the market, which the Company met by issuing a total of 10.5m new shares at a premium to NAV. This increased our net assets by over £83m. This process has three principal benefits for shareholders. Share buybacks and issuance are accretive to NAV per share and help contribute to liquidity in the trading of the Company’s shares, while (in the case of new issuance) benefiting the ongoing charges figure by spreading the Company’s fixed costs over a wider base.
The long-term objective remains (while taking account of wider market conditions) to create sustainable liquidity in Witan’s shares at or near to asset value, building on the progress achieved. Discounts are affected by many factors not under the Company’s control, hence the need to pay respect to prevailing investment conditions. With this in mind, as stated in the interim report, although no new discount target is set, the Company remains prepared to buy back shares taking account of prevailing market conditions, the level of the discount and the impact on the NAV per share. In accordance with this policy, subsequent to the year end, the Company bought back shares on a number of occasions following a widening in the discount during February. Similarly, where it is in shareholders’ interests, the Company may issue shares at a premium to NAV. The criterion for the Company’s transactions in its own shares will always be that it should be in shareholders’ interests.

Annual Report 2015 Witan Investment Trust plc 17
Financial Statements
Statutory Information
Strategic ReportReport of the D
irectorsC
orporate Governance
Other Inform
ation
Marketing The purpose of marketing for an investment trust is to communicate the Company’s strategy and new developments effectively to existing and potential shareholders, to ensure they are properly informed of our performance as stewards of their savings and to help sustain a liquid market in our shares. Clear communication of the Company’s investment objective and its success in executing its strategy makes it easier for investors to decide how Witan fits in with their own investment objectives. Other things being equal, this should help the shares to trade closer to NAV, from which all shareholders benefit. If the shares trade on a premium, as in 2015, this creates the possibility of increasing the size of the Company to meet market demand by issuing new shares, with benefits in terms of greater liquidity as well as spreading costs.
many years operated a marketing programme in order to disseminate information about our investment strategy and performance more widely. This programme communicates
and intermediaries using a range of media (including direct meetings, press interviews and advertising through traditional media and the internet). The Company also provides an informative and easy to use website (www.witan.com) to enable investors to make informed decisions about including Witan shares in their investment portfolios. The website, which is regularly refreshed with new information, includes a section focused on the requirements of nancial advisers as well as information about the Witan Wisdom and Jump savings schemes operated by the Company’s subsidiary, Witan Investment Services Limited.
CostsInvestment management feesEach of the delegated external managers is entitled to a base management fee rate, levied on the assets under management, and in some cases a performance fee, calculated according to investment performance relative to an appropriate benchmark. The agreements can be terminated on one month’s notice (except one, for which three months’ notice applies). One of the investment mandates is operated via a fund vehicle, to simplify custody arrangements in emerging economies.
The base management fee rates for managers in place at the end of 2015 ranged from 0.2% to 0.8% per annum and the performance fees ranged from nil (the majority) to 20% of the relevant outperformance. The average base management fee, weighted according to the value of the funds under management, was 0.49% as at 31 December 2015 (2014: 0.48%). On a similar basis, the average performance fee is 6% of the outperformance of the relevant benchmark (2014: 6%), subject to capping of payments for any particular year.
As an illustration, if our managers uniformly outperformed their benchmarks by 3% after base management fees, this would generate a performance fee of 0.17% of net assets, giving total investment management fees of 0.66% (including a 0.49% base fee). The comparable estimate in 2014 was 0.65% (including a 0.48% base fee). The actual fees payable will of course vary according to the level of performance and the variation in performance between managers with higher or lower fees.
Witan takes care to ensure the competitiveness of the fee rates it pays and that where higher fees are incurred they are linked to good performance, from which shareholders benefit. A majority of the managers have base fees alone (without performance fees) and a majority of the fee structures incorporate a “taper” whereby the average fee rate reduces as the portfolio grows.
The Company’s external investment managers may use certain services which are paid for, or provided by, various brokers. In return, they may place business, including transactions relating to the Company, with those brokers.
Ongoing charges and costs
operating and investment management costs of the Company, expressed as a percentage of average net assets) was 0.72% in 2015 (2014: 0.74%). Increased investment
the average level of net assets. When performance fees due to the relevant external managers are included, the OCF was 0.99% in 2015 (2014: 0.96%). Relative performance was better than in 2014 but there was a greater contribution to this from managers without performance fees.
This compares with the average OCF for 2015 of 1.56% in the Investment Association Global equity funds sector (source: IA, Morningstar) and 0.73% (0.80% including performance fees) for the AIC Global sector (source: AIC).

Witan Investment Trust plc Annual Report 201518
The Company exercises strict scrutiny and control over costs, since any negotiated savings in investment management or other fees directly reduce the costs for shareholders. This will not always result in the lowest absolute costs, since the Board believes that it is in shareholders’ interests to pay for managers who add value. The Board believes that the OCF during the year represented good value for money for shareholders, taking account of recent and longer-term outperformance.
There is continuing debate over the most appropriate measure of investment company costs, to enable investors to assess value for money and to make comparisons between funds. Consensus on how best to present a single figure for costs remains elusive, partly because of concerns that oversimplification might distort comparisons rather than facilitating them.
In the meantime, the Company will continue to focus on the OCF (which is prepared in accordance with the AIC’s recommended methodology) as a readily-understood measure of the underlying expenses of running the business. As last year, we are presenting the information on costs in a single table above. This indicates the main cost headings in money terms and as a percentage of net assets. The figures for relative NAV total return performance are also included, for comparison purposes.
Priorities for the year ahead In 2016, the key priorities for Witan include:
> Investment. Seek to build on the good returns achieved for shareholders in recent years, setting an
opportunities in the world economy. Make use of a range of active managers to deliver our strategic objectives through a multi-manager structure. Continue to deliver
> Communication. Communicate Witan’s distinct and
to existing and potential shareholders. Continue to increase the focus on improving information for personal
are less practicable;
> Regulatory change. Continue to operate risk and investment management processes in compliance with the AIFMD, liaising closely with the Company’s AIFM, Witan Investment Services Limited; and
> Client service. Provide good service to the corporate and individual clients of Witan Investment Services Limited.
Strategic ReportPerformance and principal developments in 2015 continued
Category of cost 2015
£m
2015% of average
net assets2014
£m
2014% of average
net assets
Other expenses (excluding investment management expenses) 5.41 0.34 4.90 0.36
Less expenses relating to the subsidiary (whose expenses do not relate to the operation of the investment company)
(0.93) (0.06) (1.01) (0.07)
Investment management base fees (see note 4) 6.99 0.44 6.17 0.45
Ongoing Charges Figure (including investment management base fees) 11.47 0.72 10.06 0.74
Investment management performance fees (see note 4) 4.30 0.27 3.00 0.22
Ongoing charges (including performance fees) 15.77 0.99 13.06 0.96
Portfolio transaction costs 1.75 0.11 0.91 0.07
Relative outperformance during the year (with debt at fair value) +2.9% +1.1%

Annual Report 2015 Witan Investment Trust plc 19
Financial Statements
Statutory Information
Strategic ReportReport of the D
irectorsC
orporate Governance
Other Inform
ation
4. Corporate and operational structureAs described earlier (page 9) Witan is an Investment Trust with a Premium Listing on the London Stock Exchange. It has a single, wholly-owned subsidiary, Witan Investment Services Limited (‘WIS’) which acts as the Company’s AIFM.
Operational management arrangements In addition to the appointment of delegated investment managers, Witan and WIS contract with third parties for the supporting services required, including:
> BNP Paribas Securities Services London Branch (‘BNPSS’) for global depositary services, custody, investment accounting and administration;
> Frostrow Capital LLP for company secretarial services;
> International Financial Data Services (‘IFDS’) Ltd. as the savings plan administrators of Witan Wisdom and Jump Savings;
> Specialist advisers used for investment manager research and investor communications;
> The Company also takes specialist advice on regulatory compliance issues and, as required, procures legal,
As with investment management, the contracts governing the provision of these services are formulated with legal advice and stipulate clear objectives and guidelines for the level of service required.
Since November 2005 the Company has had a lease on office
is also the Company’s registered office. The current lease has a 5 year term, commencing October 2015.
The Company’s policy towards its employees is to attract and retain staff with the particular skills and expertise required to manage the affairs of an investment trust company. Details of the Company’s remuneration policies and required disclosures are set out in the Directors’ Remuneration Report on page 46. Employees and those who seek to work within the Group are treated equally regardless of sex, marital status, creed, colour, race or ethnic origin. The Company has seven direct employees, four men and three women. The Board currently consists of seven non-executive directors (five men and two women) and the Chief Executive Officer,
Andrew Bell, who is an employee. Given its outsourced model and small number of direct employees, the Group has no specific policies in respect of environmental or social and community affairs.
Witan Investment Services (‘WIS’) Witan Investment Services Limited is a wholly-owned subsidiary of Witan Investment Trust plc (‘Witan’). It is authorised and regulated by the Financial Conduct Authority (‘FCA’).
It was established in March 2005 to provide investment savings accounts and marketing services and to give investment advice to professional investors. Since July 2014 WIS has acted as the Company’s AIFM to fulfil the requirements of the AIFMD.
In addition to its responsibilities as Witan’s AIFM, WIS’s principal activities are to provide executive management services to the Boards of Witan and Witan Pacific Investment Trust plc (‘Witan Pacific’), to communicate information about the companies to the market, to increase investor interest in their shares and to operate cost-effective savings plans for investors to hold the shares.
WIS’s operational objectives for 2016 are:
>responsibilities as Witan’s AIFM;
>
> to provide suitable advice to the Boards of its corporate clients;
> to reduce the net operating costs for Witan; and
> to seek appropriate business opportunities that can add value for shareholders.
WIS has two principal sources of income. These are savings plan revenues and the fees (as AIFM or Executive Manager and for marketing services) paid by its corporate clients,
to provide the services described above and professional advice to ensure that its regulatory and accounting
Strategic ReportCorporate and operational structure

Witan Investment Trust plc Annual Report 201520
> managers’ competence;
> monitoring the global economic, geo-political and stock market outlook;
> active management of risk, whether to preserve capital or capitalise on opportunities;
> the application of relevant policies on gearing and liquidity; and
> the use of share buybacks and issuance to respond to market supply and demand.
(CEO)) managed the overall business and the investment portfolio in accordance with limits and restrictions determined by the Board and its AIFM. The Board regularly reviews the matters delegated to Executive management, on which the CEO reports at each Board meeting. The Board also regularly reviews investment strategy and performance, supported by comprehensive management information
OperationalMany of the Group’s financial systems are outsourced to third parties, principally BNP Paribas Securities Services (‘BNPSS’). Disruption to the accounting, payment systems or custody records operated by BNPSS could prevent the accurate reporting and monitoring of the Company’s financial position. BNPSS as the Company’s depositary has a key responsibility for monitoring such issues on behalf of the Company and its AIFM, WIS. Details of how the Board monitors the services provided by its suppliers, and the key elements designed to provide effective internal control, are explained further in the Corporate Governance Statement.
Corporate governanceThe Board takes its own regulatory responsibilities very seriously and regularly reviews the main points of compliance against requirements.
Details of the Company’s compliance with corporate governance best practice are set out in the Corporate Governance Statement on pages 34 to 43. The Board conducts an annual internal assessment of the effectiveness of its governance processes in managing the Company and enabling it to evolve in response to future challenges. There is also a 3-yearly independent external review, the most recent of which was conducted in late 2013. See page 38 for further details.
Strategic ReportCorporate and operational structure continued
The savings plans provided for WIS clients are marketed under the Witan Wisdom and Jump Savings brands. They currently have over 23,000 accounts with assets of some £345 million invested.
Principal risks and uncertaintiesRisks are inherent in investment and corporate management but it is important that their nature and magnitude are understood, in order that risks, particularly those which the
avoided or controlled. In accordance with the provisions of the AIFMD, WIS has established a Risk Committee in order to comply with its risk management and reporting obligations as Witan’s AIFM. The Company has established a detailed framework of the key risks impinging on the business as set out below, with associated policies and processes devised to mitigate or manage those risks. This risk map is reviewed regularly by the Audit Committee along with the WIS Risk Committee, which report on issues arising to their respective boards, for action as necessary. The guiding principles remain watchfulness, proper analysis, prudence and a clear system of risk management.
Where appropriate, the Witan and WIS boards meet jointly to cover matters of common interest. The WIS board consists
also directors of Witan, and one executive director who is a Company employee.
The Group’s key risks fall broadly under the following categories:
Market and investment portfolio risks Witan is set up to invest in UK and overseas equity markets on behalf of its shareholders. Equity exposure is unlikely to drop below 80%, in normal conditions. Therefore a key risk of investing in Witan is a general fall in equity prices, which could be exacerbated by gearing. Other risks, as with any international equity portfolio, are the investment portfolio’s exposure to country, currency, industrial sector and stock
in Witan’s share price discount or premium to NAV and the performance of its investment managers.
The Board seeks to manage these risks through:
> appropriate asset allocation decisions, with a broadly

Annual Report 2015 Witan Investment Trust plc 21
Financial Statements
Statutory Information
Strategic ReportReport of the D
irectorsC
orporate Governance
Other Inform
ation
Operational and regulatory risks are regularly and extensively reviewed by Witan’s Audit Committee. WIS is subject to its own operating rules and regulations and is regulated by the FCA. Since becoming the AIFM for Witan, WIS has become more closely involved in a wide range of Witan’s operations. The Company has established a modus operandi for the effective coordination of these responsibilities, which has been adapted to ensure full compliance with the AIFMD’s requirements without duplication of effort and will continue to be adapted in the light of experience.
Operationally the multi-manager structure is robust, as the investment managers, the custodian and the fund accountants keep their own records which are regularly reconciled. The depositary, AIFM and the Board provide additional checks and risk management safeguards. Management monitors the activities of all third parties and reports any significant issues to the Board.
Accounting, legal and regulatoryIn order to qualify as an investment trust the Company must comply with sections 1158-59 of the Corporation Tax Act 2010 (‘CTA’). A breach of these sections could result in the Company losing investment trust status and, as a consequence, capital gains realised within the Company’s portfolio would be subject to Corporation Tax. The criteria are monitored by the CEO and AIFM and reviewed at each Board meeting. The Company also carefully and regularly monitors
nvestment trusts.
The Company is required to comply with the provisions of the Companies Act 2006 (‘Companies Act’), and the Company must also comply with the UK Listing Authority’s Listing Rules and Disclosure Rules (‘UKLA Rules’). A breach of the Companies Act could result in the Company and/or the
proceedings. Breach of the UKLA Rules could result in the suspension of the Company’s shares which would in turn lead to a breach of the provisions of the CTA.
protection for shareholders. The Board relies on the CEO, the AIFM, the Company Secretary and the Group’s professional advisers to ensure compliance with all applicable rules. WIS is regulated by the Financial Conduct Authority to act as the AIFM for Witan, for the marketing and administration of savings plans and the provision of investment advice to professional clients.
Liquidity and going concernThe Company’s portfolio consists mainly of securities that are readily realisable. The Company and its AIFM regularly review possible liquidity needs (for example to cover operational costs, loan servicing and repayment, shareholder dividends and share buybacks) relative to the Company’s portfolio income and the significance of possible liquidity calls relative to the value and tradability of the Company’s assets. Given that most of the likely liquidity requirements are readily foreseeable (for example, loan payments and dividends are timetabled), while others (such as share buybacks) are subject to the Company’s discretion, the Board is satisfied that unexpected liquidity needs are not significant relative to the size of the Company’s portfolio and that they could be readily met without compromising normal portfolio management practice.
Accordingly, the Company has adequate financial resources to continue in operational existence for the foreseeable future. Therefore, the directors believe that it is appropriate to continue to adopt the going concern basis in preparing the financial statements. In reviewing the position as at the date of this report, the Board has considered the guidance on this matter issued by the Financial Reporting Council.
Viability StatementIn accordance with the 2014 UK Corporate Governance Code, the Board has assessed the prospects of the Company over a longer period than the 12 months required by the ‘Going Concern’ provision. The new provisions require the Board to explain, taking account of the Company’s current position and principal risks, how they have assessed its prospects and over what period and why they consider that period to be appropriate. The directors must state whether they have a reasonable expectation that the Company will be able to continue in operation and meet its liabilities as they fall due over the period of their assessment.
The Company’s current position and prospects are set out in the Chairman’s and Chief Executive’s Reports and the Strategic Report. The principal risks are set out on pages 20 and 21. The Board has considered the Company’s financial position and its ability to liquidate its portfolio and meet its expenses as they fall due and notes the following:

Witan Investment Trust plc Annual Report 201522
> The portfolio consists of investments traded on major international stock exchanges and there is a spread of investments by size of company. In normal conditions, the current portfolio could be liquidated to the extent of more than 85% within 5 trading days and there is no expectation that the nature of the investments held within the portfolio will be materially different in future;
> The closed-ended nature of the Company means that, unlike an open-ended fund, it does not need to realise investments when shareholders wish to sell their shares;
> The Board has considered the viability of the Company under various scenarios and concluded that it would usually be able to take appropriate action to protect the value of the Company’s assets. As set out in note 14 to the accounts, the Board has considered price risk sensitivity (the sensitivity of the profit after taxation for the year and the value of the shareholders’ funds to changes in the fair value of the Group’s investments) and foreign currency sensitivity (the sensitivity to changes in the exchange rates for the £/US dollar, £/Euro and £/Japanese yen.
> In addition to its cash balances, which were £57.6 million at 31 December 2015 (2014: £46.6 million), the Company has a short-term bank facility which can be used to meet its liabilities and fixed-rate financing in the form of Debenture Stock, Secured Bonds, Secured Notes and cumulative preference shares. With the exception of the short-term facility and the Debenture Stock, which is repayable in 2016, this financing will remain in place until at least 2025. Details of the Company’s non current liabilities are set out in note 13 to the accounts.
> The expenses of the Company are predictable and modest in comparison with the assets and there are no capital commitments currently foreseen which would alter that position.
As well as considering the principal risks on pages 20 to 21 and the financial position of the Company, the Board has taken account of the following assumptions in considering the Company’s longer-term viability:
> The Company’s remit of investing in the securities of global listed companies will continue to be an activity to which investors will wish to have exposure;
> Investors will continue to want to invest in closed-ended investment trusts;
> The performance of the Company will continue to be satisfactory. The Board is able to replace any of the current investment managers when it considers it appropriate to do so.
> The Company will continue to have access to adequate capital when required. The Company issued 10.5m ordinary shares in 2015 and had shareholders’ funds in excess of £1.5bn at the end of 2015. It also issued £75m of fixed interest debt in June 2015. This was done in anticipation of the repayment of the 8.5% Debenture Stock in 2016.
Based on the results of its review, and taking into account the long-term nature of the Company and its financing, the Board has a reasonable expectation that the Company will be able to continue its operations and meet its expenses and liabilities as they fall due for the foreseeable future, taken to mean at least the next five years.
ApprovalThis report was approved by the Board of directors on 8
H M Henderson A L C BellChairman Chief Executive8
Strategic ReportCorporate and operational structure continued

Annual Report 2015 Witan Investment Trust plc 23
Financial Statements
Statutory Information
Strategic ReportReport of the D
irectorsC
orporate Governance
Other Inform
ation
Heronbridge Investment Management LLPHeronbridge is a long-only, value-biased equity investment management boutique. Founded in November 2005, it is a small,
who were previously with Merrill Lynch Investment Managers and
£1.5bn (as at 31.12.15) for institutional and charity clients in the UK, the US and elsewhere. In order to maximise the alignment of interests,
and have a considerable proportion of their own assets co-invested alongside those of clients.
Equity Mandate Benchmark Investment style Inception date
UK FTSE All-Share Intrinsic value growth
17.06.13
Lindsell Train – UKLindsell Train was established in 2000 by Michael Lindsell and Nick Train and focuses on the management of UK, Global and Japanese equity mandates for institutional clients. The business was founded on the shared investment philosophy that developed while Michael and Nick worked together during the early 1990s and which underlies the business today. The “purpose” of Lindsell Train is to provide a
strong investment results for their clients. Lindsell Train thinks it important to maintain a small and simple organisational structure that avoids the bureaucracy and distractions experienced within some larger, more complex investment management businesses. The structure is designed to allow the investment professionals to concentrate on investment issues and to give them the freedom to invest in line with their investment principles, which they believe will maximise returns to their investors over the longer term. The business has grown steadily and assets under management total £6.25bn (as at 31.12.15). Lindsell Train continues to be majority owned by the two founders. This is important because it ensures they maintain the integrity of the business
Equity Mandate Benchmark Investment style Inception dateUK FTSE All-Share Long-term growth
from undervalued brands
01.09.10
Lansdowne Partners (UK) LLPLansdowne Partners (founded in 1998) manages assets for a
and most sophisticated investors. Assets under management are
European, Developed Markets, Global Financials and Global Energy, each with its own dedicated team of portfolio managers and analysts.
investment philosophy is predicated on generating consistent, absolute risk-adjusted returns, through the use of exceptional investment talent within a leading-edge operational infrastructure. Central to Lansdowne Partners’ investment philosophy is a rigorous process of fundamental research. The Developed Markets Strategy is run by Peter Davies, Jonathan Regis and Stuart Roden, who have been with Lansdowne Partners since 2001. The Developed Markets Long-Only Strategy leverages the fundamental stock analysis of the team, investing predominantly in mega-cap companies (+$10bn market cap) in developed markets.
Equity Mandate Benchmark Investment style Inception date
Global DJ Global Titans Concentrated, benchmark-independent investment in developed markets
14.12.12
Artemis Investment Management – UKEstablished in 1997, Artemis Investment Management Limited manages over £22.9bn (as at 31.12.15) on behalf of a range of retail
Derek Stuart’s £1.9bn UK Special Situations Strategy launched in 2001 – a contrarian strategy that aims to outperform the FTSE All-Share Index
with an absolute return mindset, in order to generate maximum returns. It is a stock picking strategy that aims to achieve long term capital growth by focusing on stocks that are out of favour and have turnaround potential.
Equity Mandate Benchmark Investment style Inception date
UK FTSE All-Share Recovery/special situations
06.05.08
Strategic ReportInvestment Managers

Witan Investment Trust plc Annual Report 201524
Pzena Investment Management Pzena Investment Management is a global, institutional investment manager with a strict focus on long-term classic value investing.
1 January 1996. Pzena manages $26bn (as at 31.12.15) in assets for leading endowments/foundations and pension plans and for individual investors from around the world. Pzena’s team has grown
United Kingdom for business development and client service.
Equity Mandate Benchmark Investment style Inception date
Global FTSE All-World Systematic value 02.12.13
Veritas Asset Management
of assets, with the key objective of delivering long-term real returns to its clients. Veritas aligns its interest with clients’ objectives and is committed to partnership. Veritas manages both segregated portfolios and funds, with either long-only or long-short real return mandates. Their clients include institutions, charities, trusts and private clients. The Real Return Group Limited was set up in 2003 as a boutique focused on real return investing. The Real Return Group Limited and Veritas Asset Management (UK) Limited merged in 2004. In 2013 Veritas Asset Management (UK) Limited completed a corporate reorganisation and Veritas Asset Management LLP was formed as a regulated fund management boutique running Global and Asian Equity mandates. Veritas Asset Management LLP is the UK operating company of the Veritas Asset Partners Limited group, of which Veritas Asset Management (Asia) Limited in Hong Kong is also a subsidiary. In 2014 Veritas Asset Management LLP partnered with AMG Group. AMG has a stake in a number of investment boutiques and is quoted on the NYSE.
Equity Mandate Benchmark Investment style Inception date
Global FTSE All-World Fundamental value, real return objective
11.11.10
MFS Investment Management
investment styles that combine both fundamental and quantitative research and portfolio management. Their investment philosophy has remained consistent: to identify opportunities on behalf of clients through the application of global research and bottom-up security selection. MFS’ culture is investment-driven, client centered, and collaborative. To underscore their values of collaboration and accountability, they structure ownership and compensation to reward long-term investment performance and teamwork. Up to 22% ownership of MFS is available to key MFS contributors. Their majority shareholder since 1982 has been Sun Life of Canada (U.S.) Financial Services Holdings, Inc.
Equity Mandate Benchmark Investment style Inception date
Global FTSE All-World Growth at an attractive price
30.09.04
Tweedy, Browne Company LLCTweedy, Browne Company LLC is principally engaged in the management of international, global and global, high-dividend equity
founded in 1920 as Tweedy & Co., a dealer in closely held and inactively traded securities, they have pursued a value-oriented approach to
Their investment principles are based upon the broad concepts of “intrinsic value” and “margin of safety” as conceived and practiced by the late Benjamin Graham. For more than ninety years, through depressions, recessions, and stock market cycles, through a quadrupling
the emergence and disappearance of numerous investment fads, they have adhered to the same value-oriented principles of analysis and investment. The consistency of their results over many decades
£12.4bn (as at 31.12.15) of assets under management.
Equity Mandate Benchmark Investment style Inception date
Global FTSE All-World Fundamental value 02.12.13
Strategic ReportInvestment Managers continued

Annual Report 2015 Witan Investment Trust plc 25
Financial Statements
Statutory Information
Strategic ReportReport of the D
irectorsC
orporate Governance
Other Inform
ation
Marathon Asset Management Marathon Asset Management was founded in 1986 and is totally independent, managing some £35.9bn (as at 31.12.15) of institutional client assets. At the heart of Marathon’s investment philosophy is the ‘capital cycle’ approach to investment. This is based on the idea that the prospect of high returns will attract excessive capital (and hence competition), and vice versa. In addition, the assessment of management and how they respond to incentives and the forces of the capital cycle is critical to the investment outcome. The investment philosophy is intrinsically contrarian. Given the long-term nature of the capital cycle, Marathon’s investment ideas generally require patience and,
Equity Mandate Benchmark Investment style Inception date
Pan- European FTSE All-World Developed Europe
Capital cycles 23.07.10
Trilogy Global AdvisorsTrilogy Global Advisors is a long-only, specialist equity investment boutique managing global developed and global emerging market portfolios for institutional pension schemes. Founded in 1999, it is
assets under management comprise £6.3bn (as at 31.12.15) with approximately a third represented by UK pension fund clients and around a third of total assets managed in dedicated global emerging market equity portfolios.
Equity Mandate Benchmark Investment style Inception date
Emerging Markets MSCI Emerging Markets
Fundamental, growth orientated
09.12.10
specialist in the U.S. Matthews has £17.3bn (as at 31.12.15) in assets under management. Matthews Asia employs a fundamental, bottom-up investment process that seeks to identify companies with sustainable long-term growth prospects, strong business models, quality management teams and reasonable valuations. Matthews Asia will seek to invest its portion of the Trust in companies that are paying high dividends relative to their current share price, or are well-positioned to do so in the future.
Equity Mandate Benchmark Investment style Inception date
(including Japan)
MSCI Asia with dividend growth
20.02.13
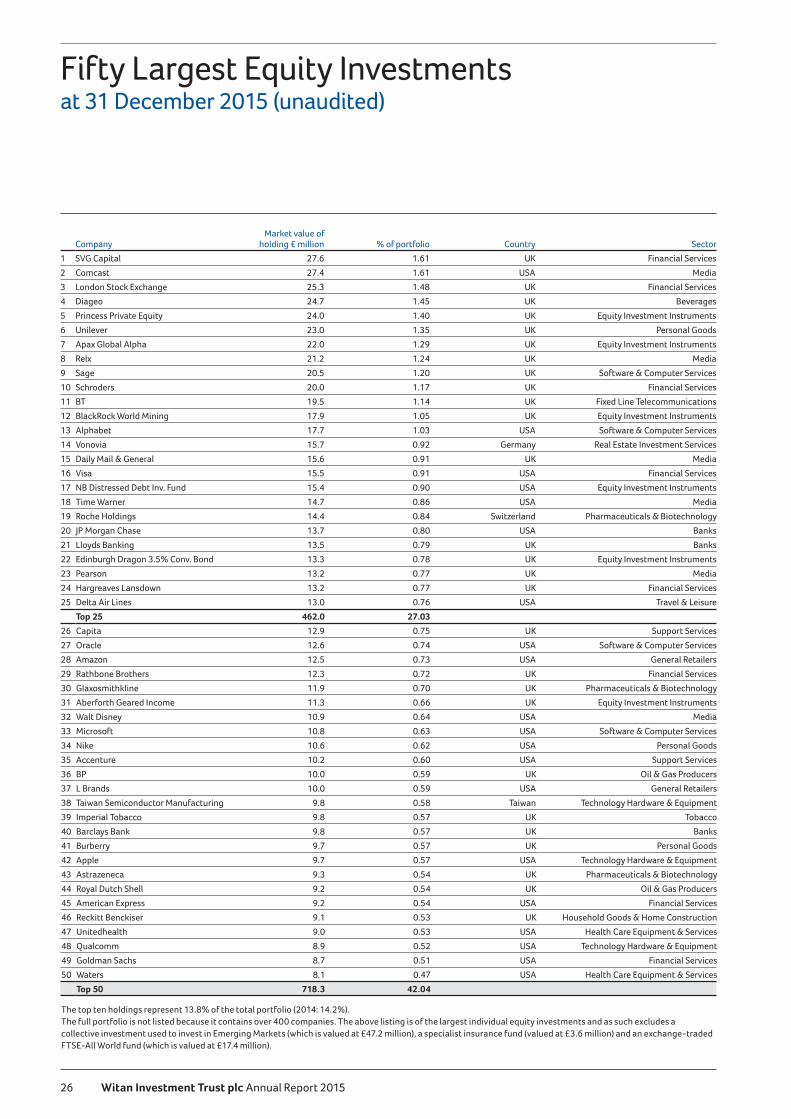
Witan Investment Trust plc Annual Report 201526
Fifty Largest Equity Investments at 31 December 2015 (unaudited)
CompanyMarket value of
holding £ million % of portfolio Country Sector
1 SVG Capital 27.6 1.61 UK Financial Services
2 Comcast 27.4 1.61 USA Media
3 London Stock Exchange 25.3 1.48 UK Financial Services
4 Diageo 24.7 1.45 UK Beverages
5 Princess Private Equity 24.0 1.40 UK Equity Investment Instruments
6 Unilever 23.0 1.35 UK Personal Goods
7 Apax Global Alpha 22.0 1.29 UK Equity Investment Instruments
8 Relx 21.2 1.24 UK Media
9 Sage 20.5 1.20 UK Software & Computer Services
10 Schroders 20.0 1.17 UK Financial Services
11 BT 19.5 1.14 UK Fixed Line Telecommunications
12 BlackRock World Mining 17.9 1.05 UK Equity Investment Instruments
13 Alphabet 17.7 1.03 USA Software & Computer Services
14 Vonovia 15.7 0.92 Germany Real Estate Investment Services
15 Daily Mail & General 15.6 0.91 UK Media
16 Visa 15.5 0.91 USA Financial Services
17 NB Distressed Debt Inv. Fund 15.4 0.90 USA Equity Investment Instruments
18 Time Warner 14.7 0.86 USA Media
19 Roche Holdings 14.4 0.84 Switzerland Pharmaceuticals & Biotechnology
20 JP Morgan Chase 13.7 0.80 USA Banks
21 Lloyds Banking 13.5 0.79 UK Banks
22 Edinburgh Dragon 3.5% Conv. Bond 13.3 0.78 UK Equity Investment Instruments
23 Pearson 13.2 0.77 UK Media
24 Hargreaves Lansdown 13.2 0.77 UK Financial Services
25 Delta Air Lines 13.0 0.76 USA Travel & Leisure
Top 25 462.0 27.03
26 Capita 12.9 0.75 UK Support Services
27 Oracle 12.6 0.74 USA Software & Computer Services
28 Amazon 12.5 0.73 USA General Retailers
29 Rathbone Brothers 12.3 0.72 UK Financial Services
30 Glaxosmithkline 11.9 0.70 UK Pharmaceuticals & Biotechnology
31 Aberforth Geared Income 11.3 0.66 UK Equity Investment Instruments
32 Walt Disney 10.9 0.64 USA Media
33 Microsoft 10.8 0.63 USA Software & Computer Services
34 Nike 10.6 0.62 USA Personal Goods
35 Accenture 10.2 0.60 USA Support Services
36 BP 10.0 0.59 UK Oil & Gas Producers
37 L Brands 10.0 0.59 USA General Retailers
38 Taiwan Semiconductor Manufacturing 9.8 0.58 Taiwan Technology Hardware & Equipment
39 Imperial Tobacco 9.8 0.57 UK Tobacco
40 Barclays Bank 9.8 0.57 UK Banks
41 Burberry 9.7 0.57 UK Personal Goods
42 Apple 9.7 0.57 USA Technology Hardware & Equipment
43 Astrazeneca 9.3 0.54 UK Pharmaceuticals & Biotechnology
44 Royal Dutch Shell 9.2 0.54 UK Oil & Gas Producers
45 American Express 9.2 0.54 USA Financial Services
46 Reckitt Benckiser 9.1 0.53 UK Household Goods & Home Construction
47 Unitedhealth 9.0 0.53 USA Health Care Equipment & Services
48 8.9 0.52 USA Technology Hardware & Equipment
49 Goldman Sachs 8.7 0.51 USA Financial Services
50 Waters 8.1 0.47 USA Health Care Equipment & Services
Top 50 718.3 42.04
The top ten holdings represent 13.8% of the total portfolio (2014: 14.2%).The full portfolio is not listed because it contains over 400 companies. The above listing is of the largest individual equity investments and as such excludes a
-traded FTSE-All World fund (which is valued at £17.4 million).

Annual Report 2015 Witan Investment Trust plc 27
Financial Statements
Statutory Information
Strategic ReportReport of the D
irectorsC
orporate Governance
Other Inform
ation
at 31 December 2015 (unaudited)
Notes
United Kingdom
%
ContinentalEurope
%
NorthAmerica
%(ex Japan)
%Japan
%
LatinAmerica
%Other
%
Total2015
%
Basic Materials Chemicals 0.1 0.7 0.1 0.4 – – – 1.3
Industrial Metals & Mining – – – 0.1 – – – 0.1
Mining 0.4 – – – – – – 0.4
0.5 0.7 0.1 0.5 – – – 1.8
Consumer Goods Automobiles & Parts 0.1 0.4 – 0.4 0.7 – – 1.6
Beverages 1.5 0.6 – 0.2 0.4 – – 2.7
Food Producers 0.3 0.4 0.3 0.1 0.2 – – 1.3
Household Goods & Home Construction 0.7 – 0.1 0.1 – – – 0.9
Leisure Goods – – – 0.2 – – – 0.2
Personal Goods 1.9 0.6 0.7 0.4 0.5 – – 4.1
Tobacco 0.9 – 0.2 0.3 0.4 – – 1.8
5.4 2.0 1.3 1.7 2.2 – – 12.6
Consumer Services Food & Drug Retailers 0.4 0.1 0.4 0.2 0.2 – – 1.3
General Retailers 0.4 0.2 1.9 – – – – 2.5
Media 4.7 0.5 3.7 0.1 – – – 9.0
Travel & Leisure 2.5 0.4 1.0 0.1 – – – 4.0
8.0 1.2 7.0 0.4 0.2 – – 16.8
Financials Banks 1.9 1.4 1.7 0.4 0.4 0.1 – 5.9
Equity Investment Instruments 4.3 1.3 0.9 – – – – 6.5
Financial Services 6.9 0.2 2.6 0.3 – – – 10.0
Life Insurance 0.2 – 0.1 0.3 – – – 0.6
Non–life Insurance 0.3 0.6 0.3 – – – – 1.2
Real Estate Investment Services – 0.9 – 0.4 – – – 1.3
Real Estate Investment Trusts 0.1 – – 0.3 – – – 0.4
13.7 4.4 5.6 1.7 0.4 0.1 – 25.9
Health Care Health Care Equipment & Services 0.3 0.6 3.8 0.7 – – – 5.4
Pharmaceuticals & Biotechnology 1.2 1.3 0.4 – – – – 2.9
1.5 1.9 4.2 0.7 – – – 8.3
Industrials Aerospace & Defence 1.3 1.0 0.1 0.1 – – – 2.5
Construction & Materials 0.2 0.3 – 0.1 – – – 0.6
Electronic & Electrical Equipment 0.7 0.4 0.2 0.1 0.5 – – 1.9
General Industrials 0.3 0.3 0.5 0.1 – – – 1.2
Industrial Engineering 0.8 0.2 0.1 0.2 – – – 1.3
Industrial Transportation 0.2 0.3 0.3 0.3 – – – 1.1
Support Services 3.4 0.5 0.9 0.1 0.3 – – 5.2
6.9 3.0 2.1 1.0 0.8 – – 13.8
Oil & Gas Alternative Energy – 0.2 – – – – – 0.2
Oil & Gas Producers 1.3 0.6 0.2 – – – – 2.1
Oil Equipment Services & Distribution 0.1 – 0.4 – – – – 0.5
1.4 0.8 0.6 – – – – 2.8
Technology Software & Computer Services 3.0 – 2.6 0.2 – – 0.1 5.9
Technology Hardware & Equipment 0.4 0.2 1.6 0.7 0.3 – – 3.2
3.4 0.2 4.2 0.9 0.3 – 0.1 9.1
Telecommunications Fixed Line Telecommunications 1.2 0.3 0.1 0.5 – – – 2.1
Mobile Telecommunications 0.6 0.3 – 0.6 0.4 – 0.1 2.0
1.8 0.6 0.1 1.1 0.4 – 0.1 4.1
Utilities Electricity – 0.2 – 0.2 – – – 0.4
Gas, Water & Multi-utilities 0.2 – – 0.2 – 0.1 – 0.5
0.2 0.2 – 0.4 – 0.1 – 0.9
Open-ended Funds (see note 3) 0.1 0.3 0.7 1.8 0.1 0.3 0.6 3.9
Totals 2015 42.9 15.3 25.9 10.2 4.4 0.5 0.8 100.0
Totals 2014 42.9 14.7 25.4 10.5 4.7 0.9 0.9 100.0
1. The holding of £37 million equity futures (2.4 5).
3. Open-ended Funds are the collective investment fund used to invest in Emerging Markets, a specialist insurance fund and an exchange traded FTSE-All World fund.

Witan Investment Trust plc Annual Report 201528
Board of Directors
H M Henderson Chairman (A), (C), (D)
Appointed a director in 1988, Harry Henderson became Chairman in March 2003. He was formerly a partner of Cazenove & Co. and subsequently a senior executive at Cazenove Group plc, retiring in 2002. Mr Henderson is Chairman of Witan Investment Services Limited. He is also a director of Cadogan Settled Estates Limited.
A L C Bell MA (D)
Andrew Bell was appointed a director and
2010. He is responsible for the overall management of Witan. Previously he worked at Rensburg Sheppards Investment Management Limited as Head of Research and as an equity strategist and Co-Head of the Investment Trusts team at BZW and Credit Suisse First Boston. Prior to the City, he worked for Shell in Oman, leaving to take a Sloan Fellowship at the London Business School. He is a non-executive director of Henderson High Income Trust plc, Chairman of Gabelli Value Plus+ Trust plc and was Chairman of the Association of Investment Companies until January 2015.
J E B Bevan MA Director (A)
James Bevan was appointed a director in 2007. He is CIO, CCLA Investment Management. Before joining CCLA in November 2006, he was the Chief
for Barclays Stockbrokers and Barclays Personal Investment Management, having joined BZW in 1988, following postgraduate research in applied economics and asset allocation at Cambridge University.
R W Boyle MA, FCA Chairman of the Audit Committee (A), (B), (D)
Robert Boyle was appointed a director in 2007. He is a Chartered Accountant and was a partner of PricewaterhouseCoopers LLP, where he was responsible for multi-national client accounts, specialising in the telecoms and media sectors: he was chairman of the PWC European Entertainment and Media Practice for twelve years, retiring in 2006. He is a non-executive director, and chairman of the audit committee, of Maxis Berhad (in Malaysia) and Centaur Media plc.

Annual Report 2015 Witan Investment Trust plc 29
Financial Statements
Statutory Information
Strategic ReportReport of the D
irectorsC
orporate Governance
Other Inform
ation
(A) Independent non-executive directors.(B) Members of the Audit Committee which
is chaired by Mr Boyle. (C) Members of the Remuneration and Nomination
Committee which is chaired by Mrs Claydon.(D) Director of Witan Investment Services Limited.
M C Claydon BA, MBA Chairman of the Remuneration and Nomination Committee (A), (B), (C), (D)
Catherine Claydon joined the Board in 2009. Previously she was a Managing Director in the Pension Advisory Group at Goldman Sachs (1992-2007) and Lehman Brothers (2007- 2008). She is a non-executive director of the Dunedin Income Growth Investment Trust. She is Deputy Chairman of the BT Pension Scheme, a director of the Barclays UK Pension Fund and an independent member of Unilever UK Pension Fund’s Investment Committee.
S E G A Neubert LLM Director (A), (D)
Suzy Neubert joined the Board in 2012. She is Sales & Marketing Director at J O Hambro Capital Management, which she joined in March 2006. She was previously Managing Director of Equity Markets within the Global Markets and Investment Banking Group at Merrill Lynch Securities in London. From 1993, she worked at Smith New Court Europe (later taken over by Merrill Lynch) as a European equity analyst and later as Director of European Equity Sales. Prior to Smith New Court, she worked at Hambros Bank as an Executive in the Corporate
Director (A), (C)
was chairman of the Oxford University investment committee from 2007 to 2014 and of Keystone Investment Trust plc from 2001 to 2010. He is a trustee of Royal Marsden Cancer Charity, Canterbury
Foundationa director of Shepherd Neame Limited.
A Watson CBE, BSc (Econ), ASIP, Barrister-at-Law, FCISI (Hons), D.Sc. (Hons) Senior Independent Director (A), (B), (D)
Tony Watson was appointed a director in 2006. He was appointed Senior Independent Director in February 2008. He is the Senior Independent Director of Lloyds Banking Group plc. He was formerly chairman of the Trustees of the Marks & Spencer Pension Scheme, chairman of the Strategic Investment Board Limited (Northern Ireland), a member of the Financial Reporting Council, a non-executive director of Hammerson plc, Vodafone Group Plc and the Shareholder Executive. Mr Watson retired in 2006 from an executive career in the investment management industry, most recently as Chief Executive of Hermes Fund Managers Limited.

Witan Investment Trust plc Annual Report 201530
Directors’ ReportStatutory Information
The directors present the Annual Report of the Group for the year ended 31 December 2015.
Activities and business reviewA review of the business is given in the Chairman’s and Chief Executive’s reports on pages 4 to 8 and in the Strategic Report on pages 9 to 25. The directors are required by the Companies Act to prepare a Strategic Report for each financial year, which contains a fair review of the business of the Group during the financial year ended 31 December 2015 and of the position of the Group at the end of the year and a description of the principal risks and uncertainties facing the Group. This information can be found within the Strategic Report on pages 20 to 21.
Investment policyThe Company’s investment policy is set out on the inside front cover.
StatusWitan Investment Trust plc (‘the Company’) is incorporated in the United Kingdom and registered in England and Wales and domiciled in the United Kingdom. It is an investment company as defined in section 833 of the Companies Act 2006 and operates as an investment trust in accordance with section 1158 of the Corporation Tax Act 2010. The Company has received confirmation from HM Revenue and Customs that it has been accepted as an approved investment trust with effect from 1 January 2012, provided it continues to meet the eligibility conditions of section 1158 and of the ongoing requirements for approved companies in the Investment Trust (Approved Company) (Tax) Regulations 2011.
Subsidiary companyThe Company has one subsidiary company, Witan Investment Services Limited, which provides marketing services and investment products to the Company and executive management and marketing services to third party investment trust clients. Witan Investment Services Limited is authorised and regulated by the Financial Conduct Authority to manage savings schemes for investors and provide investment advice to professional investors and also acts as the Company’s AIFM.
ISAsThe Company intends to continue to manage its affairs so that its investments fully qualify for the stocks and shares component of an ISA and Junior ISA.
Substantial share interestsAs at 31 December 2015, the following had notified the Company of interests in the Company’s voting rights:
%
Aviva plc and its subsidiaries 16.24
The above percentage is calculated by applying the shareholding as notified to the Company to the issued ordinary share capital as at 31 December 2015
There has not been any change in this holding or new holdings notified between the year end and the date of
AssetsAt 31 December 2015 the total net assets of the Group were £1,577.3 million (2014: £1,441.2 million). At this date the net asset value per ordinary share was 788.4p (2014: 760.3p).
Revenue and dividendThe total profit for the year was £83.7 million (2014: £95.3 million). A profit of £36.0 million is attributable to revenue (2014: £30.1 million). The profit for the year attributable to revenue has been applied as follows:
£’000
Distributed as dividends: First interim of 3.85p per ordinary share (paid on 18 June 2015) 7,450Second interim of 3.85p per ordinary share (paid on 18 September 2015) 7,550Third interim of 3.85p per ordinary share (paid on 18 December 2015) 7,670Fourth interim of 5.45p per ordinary share (payable on 1 April 2016) 10,895Added to the revenue reserve 2,394
35,959
The directors have declared a fourth interim dividend instead of a final dividend in order to ensure that, as in previous years, the distribution is made to shareholders before 5 April 2016. The Company intends to grow the dividend in real terms, ahead of inflation.
Company revenue accountAs permitted by section 408 of the Companies Act 2006,
The profit on the revenue return of the Company dealt with 35,645,000
(2014: £29,910,000).

Annual Report 2015 Witan Investment Trust plc 31
Financial Statements
Statutory Information
Strategic ReportReport of the D
irectorsC
orporate Governance
Other Inform
ation
DirectorsThe current directors of the Company are shown on pages 28 and 29.
All the directors held office throughout the year under review. At the Annual General Meeting on 28 April 2016,
of Association and, being eligible, will seek re-election by
also retire and stand for re-election, as they have served as a director for more than nine years and are eligible to stand
despite their length of service. This is explained in more detail
5. wed the performance and commitment of the directors standing for re-election and considers that each of them should continue to serve on the
relevant experience that allows them to contribute effectively to the leadership of the Company.
Mr ire at the Annual General Meeting but wi him for his significant contribution to the Company since his appointment in 2007.to repla he course of the year.
of directors is set out on page 36 in the Corporate Governance Statement.
During the year the membership of the Audit Committee
During the year the membership of the Remuneration Committee comprised Mrs Claydon (Chairman),
No director was a party to, or had an interest in, any contract or arrangement with the Company at any time during the year or to the date of this report. With the exception of
the Company.
Directors’ interestsThe interests of the directors in the share capital of the Company are set out in the Directors’ Remuneration Report on page 48.
Directors’ conflicts of interestDirectors have a duty to avoid situations where they have, or could have, a direct or indirect interest that conflicts,
2006 (‘the Act’) has allowed directors of public companies to authorise such conflicts and potential conflicts, where appropriate, but only if the Articles of Association contain a provision to this effect. The Act also allows the Articles of Association to contain other provisions for dealing with directors’ conflicts of interest to avoid a breach of duty.
of interest can be permitted: either the situation cannot reasonably be regarded as likely to give rise to a conflict of interest or the matter has been authorised in advance by the directors. The Company’s Articles of Association, which were adopted by shareholders on 27 April 2010, give the directors the relevant authority required to deal with conflicts of interest.
Each of the directors has provided a statement of all conflicts of interest and potential conflicts of interest, if any, applicable to the Company. A register of conflicts of
directors have also undertaken to notify the Chairman as soon as they become aware of any new potential conflicts of
also been agreed that directors will advise the Chairman and the Company Secretary in advance of any proposed external appointment and new directors will be asked to submit a list of potential situations falling within the conflicts of
The Chairman will then determine whether the relevant appointment causes a conflict or potential conflict of interest
directors who have no interest in the matter being considered
deciding whether to approve a conflict of interest, directors will also act in a way they consider, in good faith, will be most likely to promote the Company’s success in taking such a
giving authorisation if the directors consider this to be appropriate.
authorisation of conflicts have operated effectively since
confirms that its procedures for the approval of conflicts of interest have been followed by all the directors.
Witan Investment Trust plc Annual Report 201532
Directors’ indemnityThe Company’s Articles of Association allow the Company, subject to the provisions of UK legislation, to:
(a) indemnify any person who is or was a director, or a director of any associated company, directly or indirectly against any loss or liability, whether in connection with any proven or alleged negligence, default, breach of duty or breach of trust by him or her, or otherwise, in relation to the Company or any associated company; and
(b) purchase and maintain insurance for any person who is or was a director, or a director of any associated company, against any loss or liability or any expenditure he or she may incur, whether in connection with any proven or alleged negligence, default, breach of duty or breach of trust by him or her, or otherwise, in relation to the Company or any associated company.
Directors’ and officers’ liability insurance cover is in place in respect of the directors and was in place throughout the year under review.
Directors’ feesThe report on the directors’ remuneration is set out on pages 46 to 56.
Financial instruments and the management of risk
to market risk, price risk, currency risk, interest rate risk, liquidity risk and credit risk. The Company’s policies for managing these risks are outlined in note 14 to the accounts on pages 79 to 86.
Investment managersIt is the opinion of the directors that the continuing appointment of the investment managers listed on
2 is in the interests of the Company’s shareholders
with them are competitive and appropriate to the investment mandates.
The Board and the Company’s AIFM review the appointments of the investment managers on a regular basis and make changes as appropriate.
Share capitalThe Company’s share capital comprises:
a) ordinary shares of 25p nominal value each (‘shares’)The voting rights of the shares on a poll are one vote for
issue. During the year 10,510,000 shares have been issued.
192,646 shares have been bought back and at the date of this report there were 199,878,354 shares in issue.
The Company’s Articles of Association permit the Company to purchase its own shares and to fund such purchases from its accumulated realised capital profits. At the AGM in April 2015 a special resolution was passed giving the Company authority, until the conclusion of the AGM in 2016, to make market purchases to be held in treasury of the Company’s ordinary shares up to a maximum of 28,437,678 shares (being 14.99% of the issued ordinary share capital as
bought back 192,646 shares since the date of the last AGM, and so at the date of this report, the Company had valid authority, outstanding until the conclusion of the AGM in 2016, to make market purchases to be held in treasury of 28,245,032 shares.
Annual General Meeting to buy shares into treasury, for possible reissuance when the shares trade at a premium. The Company makes use of share buybacks, purchasing shares to be held in treasury with the objective of achieving a sustainable low discount (or a premium) to NAV. Shares are not bought back unless the result is an increase in the net asset value per ordinary share. Shares will only be re-sold from treasury at, or at a premium to, the net asset value per ordinary share.
The Company is also seeking to renew shareholder approval to issue shares, up to 10% of the starting total, provided that such shares are issued at or at a premium to net asset value.
b) 2.7% preference shares of £1 nominal value each (‘2.7% preference shares’) The 2.7% preference shareholders have no rights to attend and vote at general meetings. At 31 December 2015 there were 500,000 2.7% preference shares in issue. Further details on the preference shares are given in note 17 on page 87.
Directors’ Report continued

Annual Report 2015 Witan Investment Trust plc 33
Financial Statements
Statutory Information
Strategic ReportReport of the D
irectorsC
orporate Governance
Other Inform
ation
c) 3.4% preference shares of £1 nominal value each (‘3.4% preference shares’) The 3.4% preference shareholders have no rights to attend and vote at general meetings. At 31 December 2015 there were 2,055,000 3.4% preference shares in issue. Further details on the preference shares are given in note 17 on
87.
At the AGM in April 2015 a special resolution was passed giving the Company authority, until the conclusion of the AGM in 2016, to make market purchases for cancellation of the Company’s own 2.7% preference shares and 3.4% preference shares up to a maximum of all those in
at 31 December 2015 the Company had valid authority, outstanding until the conclusion of the AGM in 2016, to make market purchases for cancellation of 500,000 2.7% preference shares and 2,055,000 3.4% preference
the year end and the date of this report. Accordingly, the Company has valid authority to make market purchases for cancellation of 500,000 2.7% preference shares and 2,055,000 3.4% preference shares. The directors intend to seek a fresh authority at the AGM in April 2016. There are no restrictions on the transfer of the Company’s share capital and there are no shares or stock which carry specific rights with regards to control of the Company.
Independent auditorResolutions to reappoint Deloitte LLP as the Company’s auditor and to authorise the directors to determine their remuneration will be proposed at the forthcoming AGM. However, as noted on page 45, the Audit Committee intends to carry out a tender for the audit of the Company’s accounts during 2016, with a viethe audit of the accounts for the year ending 31 December 2016.
Directors’ statement as to the disclosure of information
Each of the directors at the date of approval of this report confirms that:
(1) so far as the director is aware, there is no relevant audit information of which the Company’s auditor is unaware; and
(2) the director has taken all the steps that he/she ought to have taken as a director to make himself/herself aware of any relevant audit information and to establish that the Company’s auditor is aware of that information.
This confirmation is given and should be interpreted in accordance with the provisions of section 418 of the Companies Act 2006.
Annual General MeetingThe next AGM will be held at 2.30 pm on Thursday 28 April 2016 at Merchant Taylors’ Hall, 30 Threadneedle
out in the accompanying circular to shareholders, together with explanations of the resolutions.
Greenhouse gas emissionsThe Company has a staff of seven employees, operating from small serviced office premises. Accordingly it does not have
own operations, nor does it have responsibility for any other emission producing sources under the Companies Act 2006 (Strategic Report and Directors’ Reports) Regulations 2013,
Frostrow Capital LLPSecretary
8 March 2016
Witan Investment Trust plc Annual Report 201534
Background
The UK Listing Authority’s Disclosure and Transparency Rules (the ‘Disclosure Rules’) require listed companies to disclose how they have applied the principles and complied with the provisions of the UK Corporate Governance Code (the ‘Corporate Governance Code’), as issued by the Financial Reporting Council (‘the FRC’). The provisions of the Corporate Governance Code, which was issued by the FRC in September 2014, were applicable in the year under review. The Corporate Governance Code can be viewed at www.frc.org.uk.
The related Code of Corporate Governance (‘the AIC Code’), issued by the Association of Investment Companies (‘the AIC’), provides specific corporate governance guidelines to investment companies. The FRC has confirmed that AIC member companies who report against the AIC Code and who follow the AIC’s Corporate Governance Guide for Investment Companies (the ‘AIC Guide’) will be meeting their obligations in relation to the Corporate Governance Code and the associated disclosure requirements of the Disclosure Rules. The AIC Code issued in February 2015 was applicable in the year under review. The AIC Code can be viewed at www.theaic.co.uk.
Compliance
recommendations of the AIC Code by reference to the AIC Guide. The AIC Code, as explained by the AIC Guide, addresses all the principles set out in the Corporate Governance Code, as well as setting out additional principles and recommendations on issues that are of specific relevance to the Company.
recommendations of the AIC Code and by reference to the AIC Guide (which incorporates the Corporate Governance Code) will provide better information to shareholders.
The Company has complied with the recommendations of the AIC Code and the best practice provisions of the Corporate Governance Code throughout the year ended 31 December 2015 except as set out below:
> The Corporate Governance Code (C.3.5) includes provisions relating to the need for an internal audit function. As explained on page 43, the Company does
> provisions relating to the annual re-election of all directors. As explained on page 36, the Company considers that this provision is inappropriate to the Company.
The principles of the AIC CodeThe AIC Code is made up of twenty one principles. Its three
investment managers; and shareholder communications.
Corporate Governance Statement

Annual Report 2015 Witan Investment Trust plc 35
Financial Statements
Statutory Information
Strategic ReportReport of the D
irectorsC
orporate Governance
Other Inform
ation
Principles of the AIC Code Application of the principles
1. The chairman should be independent.
Mr H M Henderson has been Chairman of the Company since the
since his appointment, an independent non-executive director. Independence stems from the ability to make those objective
Accordingly, he stands for re-election by the shareholders each
not of itself impair a director’s ability to act independently; rather, a director’s longer perspective adds value to the deliberations of a well-balanced investment trust company board. The other independent non-executive directors, under the chairmanship of the Senior Independent Director, review and evaluate annually the performance and continuing independence of the Chairman.
which for many years has acted as the Company’s stockbroker. However, he did not have responsibility for or involvement with Cazenove’s role with the Company, being for many years responsible for aspects of Cazenove’s fund management division.
interests and those of the other shareholders.
Mr A Watson was appointed as the Senior Independent Director in February 2008. As noted above, he takes the lead in the annual evaluation of the Chairman. He is also able to act as a sounding board for the Chairman and serve as an intermediary for the other directors, should this prove necessary, and to act as a channel of communication for shareholders in the event that contact through the Chairman has failed to resolve concerns or is inappropriate.
2. A majority of the board should be independent of the manager. independent non-executive directors and one executive director
of the Company’s executive management. All the directors are wholly independent of the Company’s various investment
is independent in character and judgement and there are no relationships or circumstances relating to the Company that are likely to affect their judgement (see also section 1 above).

Witan Investment Trust plc Annual Report 201536
Principles of the AIC Code Application of the principles
3. Directors should be submitted for re-election at regular intervals. Nomination for re-election should not be assumed but be based on disclosed procedures and continued satisfactory performance.
New directors stand for election by the shareholders at the annual general meeting of the Company that follows their appointment. Thereafter all directors stand for re-election at least every three years, as required by the Company’s Articles of Association. Directors who have served for more than nine years stand for re-election annually. There are currently four directors with
Governance Code, which states that all directors of FTSE 350 companies should be subject to annual election by shareholders.
directors is inappropriate to the Company. There are two main reasons for this view: (a) it appears to place excessive emphasis on the short term and insufficient emphasis on the need for an effective board to work together and to refresh its composition over time; and (b) there is some danger, because many small and nominee shareholders choose not to exercise their voting rights, that if all the directors seek re-election at once a minority of the
reasons injurious to the interests of the Company’s investors as a
of the FTSE 350 Index, a view which a number of prominent institutional investors have shared.
Committee oversees this process. Further details are given under section 7 on page 38.
Corporate Governance Statement continued

Annual Report 2015 Witan Investment Trust plc 37
Financial Statements
Statutory Information
Strategic ReportReport of the D
irectorsC
orporate Governance
Other Inform
ation
Principles of the AIC Code Application of the principles
4. The board should have a policy on tenure, which is disclosed in the annual report.
New directors are appointed for an initial term ending three years from the date of their first annual general meeting after appointment and with the expectation that they will serve a minimum of two three-year terms, but there is no absolute limit to the period for which a director may serve. The continuation of directors’ appointments is contingent on satisfactory performance evaluation and re-election at annual general meetings. Directors’
as a whole. None of the non-executive directors has a contract of service and a director may resign by notice in writing to the
well-balanced and refreshed regularly by the appointment of new directors with the skills and experience necessary, in particular, to replace those lost by directors’ retirements. Directors must be able to demonstrate their commitment to the Company, including
experience of various areas that is relevant to the Company’s objective and operations, the most important skill-sets being investment management, finance, marketing, financial services, risk management, custody and settlement, and investment banking. Specialist agents are used to assist with recruitment. While the roles and contributions of longer serving directors are
length of service is only one factor and that the shareholders benefit from having directors with a longer perspective of the Company’s history and its place in the savings market.
5. There should be full disclosure of information about the board.
Details of the directors are set out on pages 28 and 29. They demonstrate a broad range of investment, professional and commercial expertise and experience, gained overseas as well as in the United Kingdom.
6. The board should aim to have a balance of skills, experience, length of service and knowledge of the Company.
details of each director are set out on pages 28 and 29.
Board Diversity The Company welcomes the objectives of the Davies Report to improve the performance of corporate boards by encouraging the appointment of the best people from a range of differing perspectives and backgrounds. The Company recognises the benefits of diversity on the board, including gender, and takes this into account in its board appointments. The Company is committed to ensuring that its director search processes actively seek both men and women with the right qualifications so that appointments can be made, on the basis of merit, against objective criteria from a diverse selection of candidates. To this end the
the director search process.

Witan Investment Trust plc Annual Report 201538
Principles of the AIC Code Application of the principles
7. The board should undertake a formal and rigorous annual evaluation of its own performance and that of its committees and individual directors.
on an annual basis. This process is based on open discussion and
its Committees. The Chairman leads on applying the conclusions of the evaluation. The Chairman reviews with each director his or her individual performance, contribution and commitment to the Company. The Senior Independent Director leads the annual evaluation of the Chairman and reviews the conclusions with him.
Corporate Governance Code, which states that evaluation of the board of FTSE 350 companies should be externally facilitated at
the size of the company, periodic external evaluation should add
led on implementing those changes recommended by the report
does not have any other connection with the Company. The tends to appoint an external organisation to facilitate its
ard in 2016.
responsibilities and the value of their time spent.The Directors’ Remuneration Report on pages 46 to 56 details the process for determining the directors’ remuneration and sets out the amounts payable.
9. The independent directors should take the lead in the appointment of new directors and the process should be disclosed in the annual report.
the recruitment process, which includes the use of a firm of non-executive director recruitment consultants. However, all the independent non-executive directors are asked to contribute and to consider serving on the sub-committee appointed to draw up the shortlist of candidates. Notwithstanding this, the Chairman would not expect to be involved in the selection of his successor.
induction. introductory programme covering the Company’s strategy, policies and operations, including those outsourced to third parties. Thereafter, directors are given, on a regular and ongoing basis, key information on the Company’s investment portfolios, financial position, internal controls and details of the Company’s regulatory and statutory obligations (and changes thereto). The directors are encouraged to attend industry and other seminars, conferences and courses, if necessary at the Company’s expense, and to participate generally in industry events. A log of directors’ training is maintained and reviewed each year by the Audit Committee.
The directors have access to the advice and services of the Company’s Executive team and AIFM and of the Company Secretary, through its appointed representative, who are
followed and that applicable rules and regulations are complied with.
11. The chairman (and the board) should be brought into the process of structuring a new launch at an early stage.
This principle does not apply to the Company, which is a long established investment trust company.
Corporate Governance Statement continued

Annual Report 2015 Witan Investment Trust plc 39
Financial Statements
Statutory Information
Strategic ReportReport of the D
irectorsC
orporate Governance
Other Inform
ation
Principles of the AIC Code Application of the principles
co-operative and open environment.representatives of the Company’s Executive team and the AIFM and a representative of the Company Secretary expect to be
to meetings with the Company’s investment managers and each investment manager sends representatives at least once a year.
and a supportive and co-operative relationship with the Executive team and with the Company’s investment managers, advisors and support staff.
13. The primary focus at regular board meetings should be a review of investment performance and associated matters such as gearing, asset allocation, marketing/investor relations, peer group information and industry issues.
performance and all associated matters. The Chief Executive
performance, asset allocation, gearing, marketing and investor relations are usually key agenda items.
strategy. of the Company and for promoting its success. At least one of its meetings each year is devoted entirely to reviewing overall strategy and progress is monitored throughout the year.
15. The board should regularly review both the performance of, and contractual arrangements with, the manager (or executives of a self-managed company).
the performance of and the contractual arrangements with the
Nomination Committee oversees this process.
of the investment managers and their terms of reference, which
16. The board should agree policies with the manager covering key operational issues. that of its AIFM, as set out on page 41. Each investment manager
runs a discrete investment portfolio within the terms of the mandate given to them in an investment management contract. Further details are given on page 41. Shares are held by the Company’s custodian/depositary.
discount or premium (if any) and, if desirable, take action to reduce it.
and the discount/premium to net asset value on a daily basis and
where appropriate of share buybacks (at a discount) and issuance (at a premium) in order to add to the net asset value per share and achieve a sustainable low discount (or a premium) to NAV.
18. The board should monitor and evaluate other service providers. monitoring and evaluating the performance of the Company’s
this process together with the WIS Risk Committee.

Witan Investment Trust plc Annual Report 201540
Principles of the AIC Code Application of the principles
Shareholder communications19. The board should regularly monitor the shareholder
canvassing shareholder views and for communicating the board’s views to shareholders.
The Chairman is responsible for ensuring that there is effective communication with the Company’s shareholders. He works
liaison with the Company’s stockbroker. There is a process in place for analysing and monitoring the shareholder register and a programme for meeting or speaking with the institutional investors and with private client stockbrokers and advisors. In addition to the
Director, expects to be available to meet the larger shareholders.
The Company encourages attendance at its Annual General Meeting as a forum for communication with the individual shareholders. The Notice of Annual General Meeting and related papers are sent to shareholders at least 20 working days before the
of the Audit Committee and the Chairman of the Remuneration and Nomination Committee all expect to be present at the Annual General Meeting and able to answer questions from shareholders as appropriate. Details of the proxy votes received in respect of each resolution are made available to shareholders. The Chief
The directors may be contacted through the Company Secretary at the address shown on page 92.
20. The board should normally take responsibility for, and have a direct involvement in, the content of communications regarding major corporate issues
AIFM expect to lead on preparing and effecting communications
21. The board should ensure that shareholders are provided
the risk: reward balance to which they are exposed by holding the shares.
investors and approves a marketing programme and budget each year to enable this to be achieved. Copies of the Annual Report and the Half Year Report are circulated to shareholders, to those who hold shares through the subsidiary company’s products and, where possible, to investors through other providers’ products and nominee companies (or written notification is sent when they are published online). In addition, the Company publishes a factsheet monthly and its net asset value per share daily. All this information is readily accessible on the Company’s website (www.witan.com). The Company belongs to the Association of Investment Companies which publishes information to increase investors’ understanding.
Corporate Governance Statement continued

Annual Report 2015 Witan Investment Trust plc 41
Financial Statements
Statutory Information
Strategic ReportReport of the D
irectorsC
orporate Governance
Other Inform
ation
The Board
the Company. Its role is to provide leadership within a framework of prudent and effective controls that enable
Company’s strategic aims (subject to the Company’s Articles of Association and to such approval of the shareholders in general meeting as may be required from time to time) and ensures that the necessary resources are in place to enable the Company’s objectives to be met.
and deals with the most important aspects of the Company’s affairs, including the setting of parameters for and the monitoring of investment strategy, the review of investment performance and the extent to which borrowings may be used.
and the AIFM for the overall management of the Company including investment performance, business development, shareholder relations, marketing, investment trust industry matters, administration and unquoted investments. The
investment strategy and asset allocation, on the selection and monitoring of the investment managers and their terms
conjunction with the AIFM, sets limits on matters such as asset allocation, gearing and investment in derivatives,
his discretion.
investment limits and restrictions and those which govern the Company’s tax status as an investment trust, have been adhered to.
The individual investment managers are each appointed to manage a discrete portfolio in accordance with guidelines which limit, for example, the markets in which they can invest, the size of each investment and the amount of cash that may be held in their portfolio in normal circumstances. They are not allowed to invest in unquoted securities, to borrow against the security of the portfolio, to sell stocks short or to use derivatives. The investment managers take decisions as to the purchase and sale of individual investments and are responsible for effecting those decisions on the best available terms. The Company and the AIFM receive monthly confirmation from each of the investment managers that they have carried out their duties in accordance with the terms of their investment mandates.
In addition to his responsibilities for the overall management
the Direct Holdings portfolio. A maximum of 10% of the Company’s gross assets (at the time of purchase) may be invested in this portfolio and there are restrictions on the number, size and type of investments that may be made.
The Chairman is responsible for ensuring that the directors are provided, in a timely manner, with management, regulatory and financial information that is clear, accurate
or otherwise.
Matters specifically reserved for decision by the full
for directors, in the furtherance of their duties, to take independent professional advice, if necessary, at the Company’s expense.
Board Committees
Remuneration and Nomination Committee. The membership of the Audit Committee and the Remuneration and Nomination Committee is set out on pages 28 and 29. The roles and responsibilities of the Committees are described in the Report of the Audit Committee on pages 44 and 45 and
6 to 56.
Meetings of the Board and its Committees The number of formal meetings during the year of the
individual directors at those meetings, is shown in the table that follows.
BoardAudit
Committee
Remuneration and
Nomination Committee
Number of meetings 10 4 3
H M Henderson 10 4* 310 4* 3*
9 – –10 4 –
M C Claydon 10 4 3S E G A Neubert 10 – –
8 – 3A Watson 10 4 –
* Not a member of the Committee but in attendance by invitation for all or part of the meetings.
All the directors attended the Annual General Meeting in

Witan Investment Trust plc Annual Report 201542
Directors’ remunerationThe directors’ remuneration is detailed in the Directors’ Remuneration Report on pages 46 to 56.
Accountability and audit The directors’ statement of responsibilities in respect of the accounts is set out on page 57.
The report of the independent auditor is set out on pages 60 to 63.
agents, including the various investment managers, the management of the investment portfolio, global custody (which includes the safeguarding of the assets), the investment administration, management and financial accounting, company secretarial and certain other administrative requirements and the registration services. Each of these contracts was entered into after full and proper
services offered, including the control systems in operation in
receives and considers regular reports from the investment managers and ad hoc reports and information are supplied
Internal control
evaluating and managing the significant risks faced by the Company. This process accords with the Turnbull guidance, is subject to regular review by the Audit Committee and was fully in place during the year under review and up to the date
Company’s system of internal control and has conducted its annual review of the effectiveness of the system, covering all the controls, including financial, operational and compliance controls and risk management systems. This review took into account points raised during the year in the regular appraisal of specific areas of risk. However, such a system is designed to manage rather than eliminate the risks of failure to achieve the Company’s business objectives and can only provide reasonable and not absolute assurance against material misstatement or loss.
In accordance with provisions C2 and C3 of the Corporate
risks at least once a year. These are analysed and recorded in a risk map. The Company receives from its main contractors formal reports which detail the steps taken to monitor the areas of risk and which report the details of any known internal control failures.
As described elsewhere, the management of Witan’s portfolio is outsourced to a number of third party investment managers around the world. There are currently 11 such investment managers as well as the Direct Holdings portfolio
aspects of the management of the portfolio, including asset
has set guidelines in respect of each of these aspects within
overall performance of the Company and other matters of significance.
The in-house Executive management team of Witan and WIS is responsible for managing and controlling the relationships with the third party managers. The management team receives monthly reports on investment and compliance matters from each manager. During 2015, the investment managers were asked to provide detailed information on
receives each year from its investment managers reports on their internal controls; in most cases these include a report from the relevant company’s auditors on the control policies and procedures in operation.
Holdings portfolio. In addition, the portfolio’s performance is independently measured by WM Performance Services, along with those of the third party managers.
The Company’s subsidiary, WIS, is authorised and regulated by the Financial Conduct Authority to provide investment products and services and was appointed as the Company’s AIFM from July 2014. The compliance structures required for these activities, including a compliance manual and a compliance monitoring programme, have been duly put into place.
The Company has a formal policy for staff to raise in confidence any concerns about possible improprieties, whether in matters of financial reporting or otherwise, for appropriate independent investigation. Its staff comprises
who are well known to and have frequent formal and informal
Corporate Governance Statement continued

Annual Report 2015 Witan Investment Trust plc 43
Financial Statements
Statutory Information
Strategic ReportReport of the D
irectorsC
orporate Governance
Other Inform
ation
The Company does not have an internal audit function. Through WIS, the AIFM, it delegates to third parties the management of its investments and most of its other operations and employs only a small staff. The investment managers and certain other key contractors are subject to external regulation and most have compliance and internal audit functions of their own. The Company’s investments are held on its behalf by a global custodian appointed by the depositary. A specialist firm of investment accountants and administrators is responsible for investment administration, for maintaining accounting records and for preparing financial accounts, management accounts and other management information. Their work is reviewed by an independent accountant who also carries out some of the work that an internal audit function would cover. In addition,
annual report on its internal controls, including a report from its auditor on the control policies and procedures in operation. The investment performance of the investment managers, both individually and collectively, is measured for Witan by a company that is independent of all the investment managers. The corporate Company Secretary is a company with well-established experience in servicing investment trusts.
The appointment of these and other professional contractors provides a clear separation of duties and a structure of
and the AIFM will continue to monitor its system of internal control in order to provide assurance that it operates as intended and the directors will review at least annually whether a function equivalent to an internal audit is needed.
Stewardship and the exercise of voting powers
success, companies need to maintain high standards of corporate governance and corporate responsibility. Therefore Witan expects the companies in which it is invested to comply with best practice in corporate governance matters, or to provide adequate explanation of any areas in which they fail to comply, whilst recognising that a different approach may be justified in special circumstances. In respect of UK companies, current best practice in corporate governance matters is set out in the UK Corporate Governance Code.
managers to engage with companies and to vote shares, in the best long-term interest of Witan shareholders but in accordance with their own investment philosophies. Where applicable, it monitors the policies of the investment managers in respect of the UK Stewardship Code. Elsewhere in the world it can be more difficult to vote shares as each country has its own rules and practices regarding shareholder notification, voting restrictions, registration conditions and share blocking, including, for example, dealing constraints. Therefore, whilst the Company’s investment managers are apprised of the Company’s approach to the stewardship of its assets and the importance of sound corporate governance, they use their discretion according to their knowledge of the relevant circumstances. The investment managers report their compliance with the UK Stewardship Code, or equivalent legislation, to the Audit Committee each year.
In respect of the direct investments held, the Company’s Executive management maintains regular touch with the management of the investee holdings and engages when issues arise that are controversial or potentially prejudicial to the interests of Witan’s shareholders. An annual report is provided to the Audit Committee in compliance with the UK Stewardship Code.
Approval
8
H M HendersonChairman
8 March 2016
Witan Investment Trust plc Annual Report 201544
Report of the Audit Committee
Statement by the Chairman of the Committee
As Chairman of the Audit Committee (‘the Committee’), I am pleased to present the Report of the Committee for the year ended 31 December 2015.
Composition and responsibilities of the CommitteeThe Committee comprises three non-executive directors,
has taken note of the requirement that at least one member of the Committee should have recent and relevant financial experience and is satisfied that the Committee is properly constituted in this respect, as I am a Chartered Accountant and was previously a partner in PricewaterhouseCoopers LLP. Mr Watson, who was appointed to the Committee in 2006, and Mrs Claydon who was appointed to the Committee in 2013, were members of the Committee throughout the year. Details of our qualifications and experience are given on pages 28 and 29.
The role of the Committee is to assist the directors in applying financial reporting and internal control principles and to maintain an appropriate relationship with the Group’s auditor. The Committee’s role and responsibilities are set out in its terms of reference, which comply with the UK Corporate Governance Code. The terms of reference are available on request from the Company Secretary and can be seen on the Company’s website (www.witan.com). In summary, the Committee is responsible for monitoring the integrity of the Company’s financial statements, including consideration of the Company’s accounting policies and significant reporting judgements. It reviews the Company’s internal financial controls and risk management systems using an external consultant where appropriate.
RiskManagement has identified (Strategic Report pages 20 and 21) five main areas of potential risk: market and investment portfolio, operational, corporate governance, accounting, legal and regulatory, and liquidity and going concern, and has set out the actions taken to evaluate and manage these risks. The auditor has also detailed two specific areas of risk in its report: investment valuation and ownership of investments and has set out the work it has performed to satisfy itself that these have been properly reflected in the financial statements. The Committee reviews the various actions taken and satisfies itself that they are sufficient: in particular the Committee reviews management’s Risk Report at each meeting and requires amendments to both risks and mitigating actions if appropriate.
Meetings of the CommitteeThe Committee held three meetings during 2015, in February, August and November and also met in February 2016. Representatives of the external auditor were present at the meetings held in February 2015 and 2016 and November
matters discussed at the meeting. In summary, the main matters dealt with at these meetings were as follows:
> Assessment of the controls to ensure the ownership, valuation and liquidity of investments: this includes assessing management reports on the controls and procedures of external managers and the external custodian/administrator and the review of the audit work performed. No significant issues were identified.
> Interim and year-end reporting, in the light of the requirements of the revised Code of Corporate Governance issued by the AIC, and the new requirements for a viability statement and additional disclosures on going concern and risk management. The Committee agreed the process, timing and responsibility for compliance.
> Following the appointment of WIS as the Company’s AIFM, the Committee has worked with the Risk Committee of WIS, the Company’s subsidiary, to

Annual Report 2015 Witan Investment Trust plc 45
Financial Statements
Statutory Information
Strategic ReportReport of the D
irectorsC
orporate Governance
Other Inform
ation
> A variety of more detailed matters including the adequacy of procedures and monitoring to ensure internal controls, whistleblowing, anti-money laundering compliance, data and IT systems protection and business continuity.
> In the light of the relative simplicity of the operations and the use of independent external consultants to advise on regulatory compliance and adherence to internal procedures, it was concluded that no internal audit function was required (see page 43).
Going concernThe Committee considered the issue of going concern and
going concern basis in preparing the Group’s accounts. The and going
concern” on page 21 and under note 1(b) on page 68.
External auditThe Committee reviews the scope and effectiveness of the audit process, including agreeing the auditor’s assessments of materiality, and monitors the auditor’s independence and objectivity. It conducted a formal review of the performance of the auditor during the year, concluding that performance had been satisfactory and did not give rise to any grounds for change. However, as reported below, recent legislation means that the Company has to carry out a tender for the audit.
Deloitte & Touche, a predecessor firm of Deloitte LLP, was first appointed as the Company’s auditor in March 1997. The audit was subject to competitive tender in 2007, at which time Deloitte LLP was reappointed. The auditor is required to rotate the audit partner every five years. The current partner took on responsibility for the audit with effect from the audit of the Company’s accounts for the year ended 31 December 2014. In light of recent legislation on audit tendering, the Committee intends to carry out a tender for the audit of the Company’s accounts during 2016, with a view to appointing a new audit firm for the audit of the accounts for the year ending 31 December 2016.
The Committee approved the proposed audit fee. The Committee has a rule that a specified engagement of the auditor to provide non-audit services cannot exceed 50% of the annual audit fees without Committee approval. As noted in note 5 on page 72, the Committee approved the appointment of Deloitte LLP to provide advice on one-off withholding tax claims. The appointment, which was made on a one-off basis, was awarded on a competitive basis and the Committee satisfied itself that Deloitte’s audit teams and tax advisory team were independent of each other. Although the fees paid to date for this work have amounted to £108,000, the Committee is pleased to note that, to date, £951,000 of withholding tax has been recovered and it is hoped that further recoveries will be made in future.
The Committee is aware of the new limit on non-audit fees that is being introduced with effect from January 2017, from which time non-audit fees cannot be more than 70% of the average audit fees for the last three years.
Financial statements
the Annual Report taken as a whole is fair, balanced and understandable and provides the information necessary for shareholders to assess the Company’s performance, business model and strategy. The Committee has given this confirmation on the basis of its review of the whole document, underpinned by involvement in the planning for its preparation, review of the processes to assure the accuracy of factual content, and by assurances from the Remuneration and Nomination Committee.
ApprovalThis report was approved by the Committee on 8 March 2016 and is signed on its behalf by:
Robert BoyleChairman of the Audit Committee 8 March 2016

Witan Investment Trust plc Annual Report 201546
Directors’ Remuneration Report
Chairman’s statement
IntroductionAs Chairman of the Remuneration and Nomination Committee (the ‘Committee’), I am pleased to present the Directors’ Remuneration Report for the year ended 31 December 2015.
This report covers the remuneration-related activities of the Committee for the year ended 31 December 2015. It sets out the remuneration policy and remuneration details for the non-executive and executive directors of the Company. It has been prepared in accordance with the Large and Medium-sized Companies and Groups (Accounts and Reports) (Amendment) Regulations 2013 (the ‘Regulations’) and the requirements of the Association of Investment Companies. The report is split into three main areas: this statement from me as Chairman of the Committee, an annual report on remuneration and a policy report. The annual report on remuneration provides details on remuneration
information required by the Regulations. It will be subject to an advisory vote at the Annual General Meeting in April 2016.
The Company’s existing policy was subject to a binding shareholder vote at the Annual General Meeting in 2014 and
As explained below, the Committee has reviewed the terms of the Chief Executive
remuneration and proposes a number of changes to its policy, which will be submitted for shareholder approval at the Annual General Meeting in April 2016.
The Companies Act 2006 requires the auditor to report to shareholders on certain parts of the Directors’ Remuneration Report and to state whether, in their opinion, those parts of the report have been properly prepared in accordance with the Regulations. The parts of the annual report on remuneration that are subject to audit are indicated in the report.
Role of the CommitteeThe remuneration-related role of the Committee is essentially twofold. First, it has a role in respect of executive remuneration, assisting the directors in determining the remuneration of the
remuneration arrangements for the Company’s staff. Second,
nomination committee with responsibility for reviewing the
the remuneration of the non-executive directors. The Committee’s role and responsibilities are set out in its terms of reference, which are available on request from the Company Secretary and can be found on the Company’s website (www.witan.com).
The Committee normally consists of three non-executive directors, including its Chairman, who are appointed by the
the Committee. I was appointed to the Committee, and to act
appointed to the Committee in 2003 and 2011 respectively.
The Committee’s programme is to meet formally at least twice a year and on such other occasions as required. The Committee held three formal meetings during the year, during which it addressed all the remuneration-related matters under its remit.
There have been no changes in the fees payable to non-executive directors, during the year. Since 1 April 2014, the non-executive directors’ fees have been paid at the following annual rates: £
Chairman of the Company 57,000 Chairman of the Audit Committee 36,000 Chairman of the Remuneration and Nomination Committee 34,000Senior Independent Director 34,000
The implementation of the Alternative Investment Fund Managers Directive has resulted in additional duties for non-executive directors. However, the Committee has decided that, to date, the additional duties are not sufficient to warrant the payment of any additional remuneration to the non-executive directors.
The Company’s Articles of Association currently limit the aggregate fees payable to the non-executive directors to £350,000 per annum.
The aggregate non-executive directors’ fees currently amount to £251,000 per annum.
During 2015 the Committee reviewed the components of
the revisions to the UK Corporate Governance Code relating to clawback and malus. The Committee compared the terms
roles. The benchmark information was provided by McLagan.
As a result of the review, the Committee agreed that, while
groups, the current bonus arrangements were out of line with payments made elsewhere in the market. The Committee proposes to address this by making a number of changes to the current arrangements as noted below. If approved by shareholders at the AGM in April 2016, the changes will be implemented with effect from 1 January 2016.
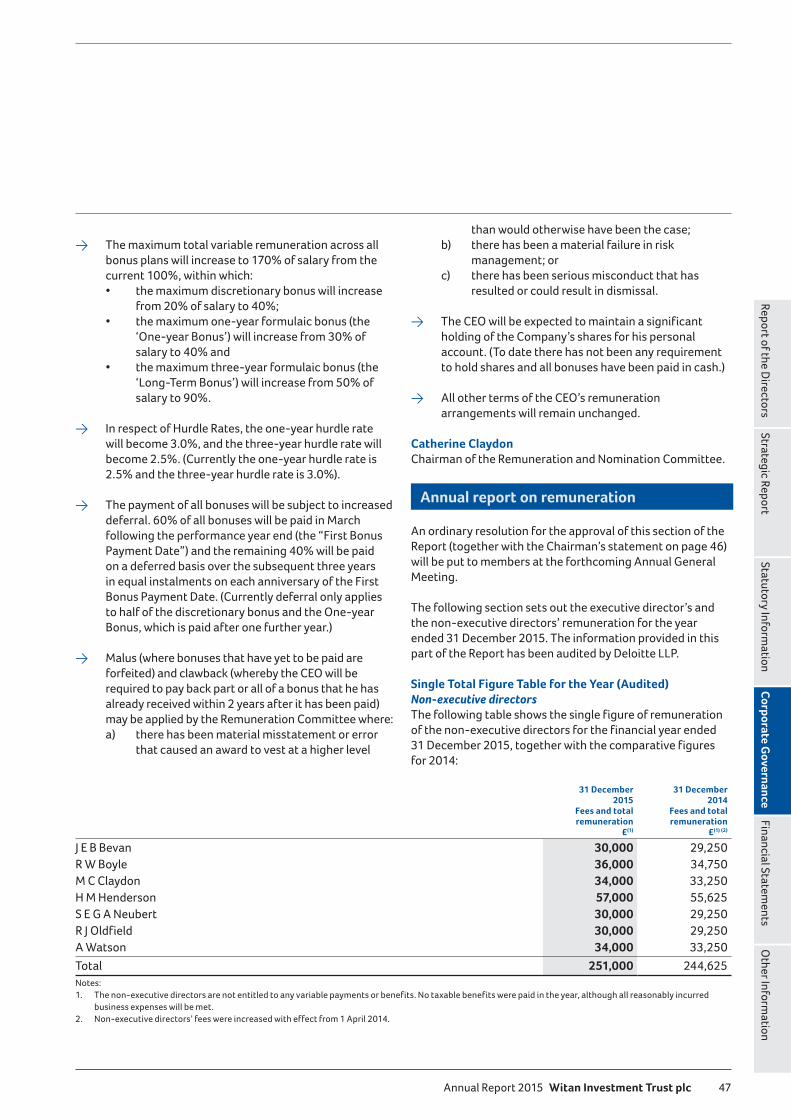
Annual Report 2015 Witan Investment Trust plc 47
Financial Statements
Statutory Information
Strategic ReportReport of the D
irectorsC
orporate Governance
Other Inform
ation
> The maximum total variable remuneration across all bonus plans will increase to 170% of salary from the current 100%, within which:
from 20% of salary to 40%; -year formulaic bonus (the
‘One-year Bonus’) will increase from 30% of
‘Long-Term Bonus’) will increase from 50% of salary to 90%.
>
>
>
2
a) there has been material misstatement or error
Notes:
business expenses will be met. ectors’ fees were in
management; or
>
>
Catherine Claydon
Annual report on remuneration
eport (together with the Chairman’s statement on page )
Single Total Figure Table for the Year (Audited) Non-executive directorsThe following table shows the single figure of remuneration
for 2014:
31 December 2015
Fees and total remuneration
£(1)
31 December 2014
Fees and total remuneration
£(1) (2)
30,000 29,25036,000 34,75034,000 33,25057,00030,000 29,25030,000 29,25034,000 33,250
Total 251,000
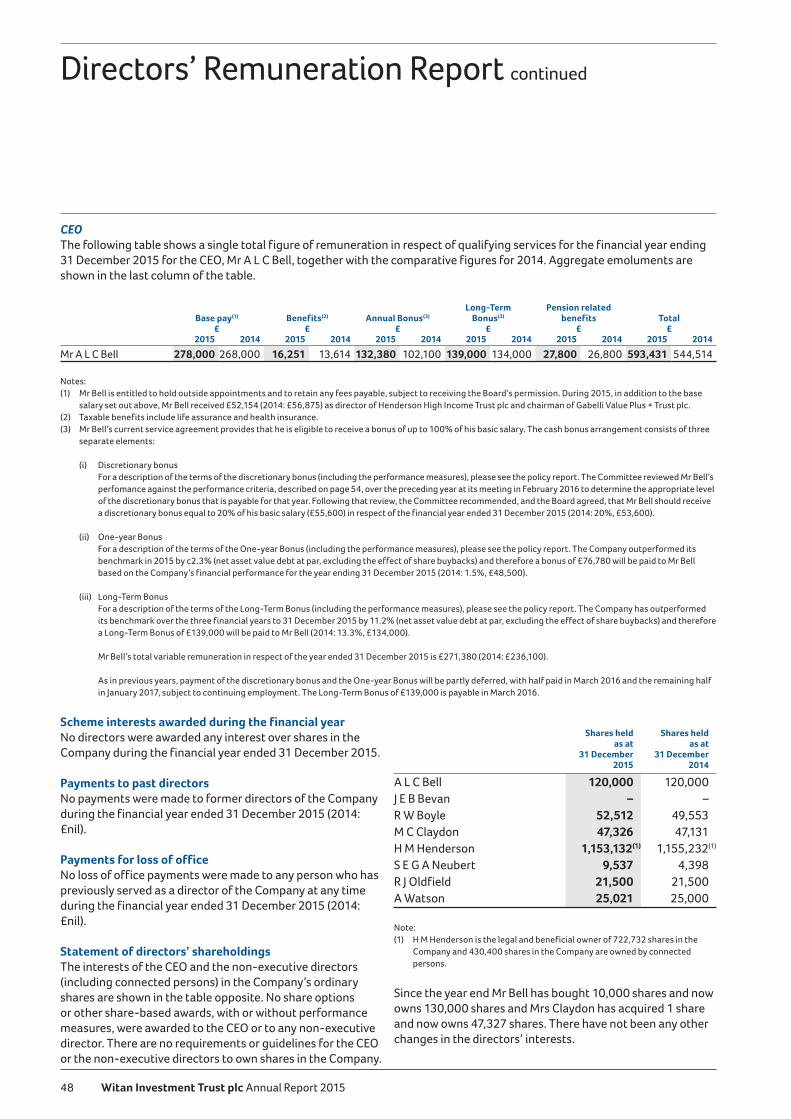
Witan Investment Trust plc Annual Report 201548
CEOThe following table shows a single total figure of remuneration in respect of qualifying services for the financial year ending
shown in the last column of the table.
Base pay £
Benefits(2) £
Annual Bonus(3) £
Long-TermBonus(3)
£
Pension related benefits
£Total
£
278,000 268,000 13,614 102,100 134,000 27,800 26,800 544,514
Notes:
52,154 (2014: £56,875) as director of Henderson High Income Trust plc and chairman of Gabelli Value Plus + Trust plc.(2) Taxable benefits include life assurance and health insurance.
current service agreement provides that he is eligible to receive a bonus of up to 100% of his basic salary. The cash bonus arrangement consists of three separate elements:
(i) Discretionary bonus
perfomance against the performance criteria, described on page 54, over the preceding year at its meeting in February 2016 to determine the appropriate level of the discretionary bonus that is payable for that year. Following that review, ta discretionary bonus equal to 20% of his basic salary (£55,600) in respect of the financial year ended 31 December 2015 (2014: 20%, £53,600).
onus For a description of the terms of the ne-year onus (including the performance measures), please see the policy report. The Company outperformed its
based on the Company’s financial performance for the year ending 31 December 2015 (2014: 1.5%, £48,500).
For a description of the terms of the onus (including the performance measures), please see the policy report. The Company has outperformed its benchmark over the three financial years to 31 December 2015 by 11.2% (net asset value debt at par, excluding the effect of share buybacks) and therefore
271,380 (2014: £236,100).
As in previous years, payment of the discretionary bonus and the ne-year onus will be partly deferred, with half paid in March 2016 and the remaining half
Scheme interests awarded during the financial yearNo directors were awarded any interest over shares in the Company during the financial year ended 31 December 2015.
Payments to past directorsNo payments were made to former directors of the Company during the financial year ended 31 December 2015 (2014: £nil).
Payments for loss of officeNo loss of office payments were made to any person who has previously served as a director of the Company at any time during the financial year ended 31 December 2015 (2014: £nil).
Statement of directors’ shareholdings
(including connected persons) in the Company’s ordinary shares are shown in the table opposite. No share options or other share-based awards, with or without performance
or the non-executive directors to own shares in the Company.
Shares held as at
Shares held as at
120,000– –
49,553M C Claydon 47,131H M Henderson 1,155,232(1)
S E G A Neubert 9,537 4,39821,500
A Watson 25,000
Note:(1) H M Henderson is the legal and beneficial owner of 722,732 shares in the
Company and 430,400 shares in the Company are owned by connected persons.
Since the year end ht 10,000 shares and now owns 130,000 shares and Mrs Claydon has acquired 1 share and now owns 47,327 shares. There have not been any other changes in the directors’ interests.
Directors’ Remuneration Report continued

Annual Report 2015 Witan Investment Trust plc 49
Financial Statements
Statutory Information
Strategic ReportReport of the D
irectorsC
orporate Governance
Other Inform
ation
None of the directors had an interest in the secured bonds, debenture stock or preference shares of the Company.
Total shareholder return performance graphThe line graph below sets out the Company’s seven-year total shareholder return performance relative to the FTSE All-Share Index and the FTSE World (ex UK) Index (sterling adjusted). This line graph assumes a notional investment of £100 into the Indices on 31 December 2008 and the reinvestment of all income, excluding dealing expenses.
100
125
150
175
200
225
250
275
2008 2009 2010 2011 2012 20142013
Witan Total Return
FTSE World (ex UK) Total Return
FTSE All-Share Total Return
Benchmark
2015
Source: Morningstar.
The Company is required to compare the Company’s share price with a single broad equity market index. The Company has compared the share price total return against (i) a UK market index, namely the FTSE All-Share Index because the Company’s shares are listed on the UK market and the UK forms the largest constituent of the Company’s benchmark; and also (ii) a global index, namely the FTSE World (ex UK) Index because more than half of the Company’s investments are held in overseas companies. The performance of the Company’s benchmark is also shown.
CEO remuneration table
CEO single figure of total remuneration
£
Annual discretionary and One-year
Bonus pay-out against
maximum %
Long-Term Bonus
pay-out against
maximum %
593,431 95.2 100.0544,514 76.2 100.0486,802 95.0 64.2400,535 86.5 13.7314,160 40.0 n/a409,495 100.0 n/a
2010 – Mr Clarke(1) 111,318 15.0 n/a2009 – Mr Clarke(1) 253,273 30.0 n/a
Note:
Percentage change in remuneration of CEOThe table below shows how the percentage change in the
4 and 2015 compares with the percentage increase in each of those components of pay for the Group’s employees taken as
Percentage increase in remuneration in
CEO%
Employees%
Salary and fees 4 49
All taxable benefits 9 46
Annual bonuses (discretionary and ne-year ) 29 6
4 n/a
Total 9 44
The increase bonus in 2015 is primarily due to the better performance of the Company in 2015 than in 2014, which resulted in a higher percentage of the
being paid in respect of 2015 (see note 3(ii) on page 48).
The percentage increase for the employees’ salary and fees and taxable benefits reflects an increase in the number of employees as well as salary increases.
Relative importance of spend on payDifference
Spend £000 £000 £000
Fees of non-executive directors 25 6Remuneration paid to or receivable by all employees of
in respect of the year(1) 860 243
Dividends paid to shareholders in respect of the year ended 31 December 2015 33,565 4,410Share buybacks – 363 (363)
Total payments to shareholders 33,565 4,047
Notes:(1) Includes any accruals onus, subject
to performance being sustained and to his continued employment with the Company.
Statement of implementation of remuneration policy in 6
The Company intends to implement the revised remuneration policy as detailed in the Chairman’s Statement and in the policy section of the report with effect from 1 January 2016. There will not be any fee increases for non-executive directors in 2016.

Witan Investment Trust plc Annual Report 201550
Consideration by the directors of matters relating to directors’ remuneration
non-executive directors and it has appointed the Committee to consider matters relating thereto. The Committee
As noted above (page 46), the Committee reviewed the emuneration during the year compared
with information provided by McLagan. The Committee was not provided with any other advice or services, during the financial year ending 31 December 2015, in respect of the fees payable to the non-executive directors or the
The Committee assesses the workload and responsibilities of the non-executive directors and reviews, from time to time, the fees paid to non-executive directors of other investment trust companies.
Herbert Smith Freehills LLP provided legal advice to the Company throughout the year, including in relation to the operation of the Company’s incentive arrangements and on
considered by the Committee.
The table below sets out the members of the Committee
remuneration, and shows the number of meetings attended by each non-executive director:
NameNumber of meetings
attended
M C Claydon 3/3H M Henderson 3/3
3/3
Statement of shareholder votingAt the Annual General Meetings held on 30 April 2015 and 30 April 2014 respectively, ordinary resolutions to approve the Directors’ Remuneration Report for the year ended
were passed on a show of hands. The proxy votes in each case were as follows:
Votes for
Votes against
Votes at proxies’
discretionVotes
withheld
Total votes cast (excluding
votes withheld)
Approval of Directors’ Remuneration Report
22,468,888 108,243 65,995 60,267 22,643,126
99.2% 0.5% 0.3% – 100%
Approval of Remuneration Policy
24,151,328 419,308 75,393 313,413 24,646,029
98.0% 1.7% 0.3% – 100%
The Company is committed to ongoing shareholder dialogue and takes an active interest in voting outcomes. Where there are substantial votes against resolutions in relation to directors’ remuneration, the reasons for any such vote will be sought and any actions in response will be detailed in future Directors’ Remuneration Reports. There were no substantial shareholder votes against the resolutions at the Annual General Meeting in 2015.
Remuneration policy
A report on the Company’s remuneration policy in accordance with the new Regulations was submitted for the first time in the 2013 Annual Report. An ordinary resolution for the approval of the policy was put to members at the AGM on 30 April 2014 and passed by the members. This policy took effect from 1 January 2015.
As set out on page 46, the Committee proposes to amend
1 January 2016 and accordingly a revised policy will be put to shareholders at the AGM in April 2016. All provisions of the revised policy, if it is approved by shareholders, are expected, in the absence of regulatory or other reasons for change, to remain in effect until the AGM in 2019 when the Company will next be required to submit its remuneration policy to its members.
Non-executive directorsAll the directors are non-executive, with the exception of the
three years from the date of their first annual general meeting after appointment and with the expectation that they will serve two three-year terms. The continuation of directors’ appointments is contingent on satisfactory performance evaluation and re-election at annual general meetings. Non-executive directors’ appointments are reviewed formally
non-executive directors has a letter of appointment which sets out the terms on which they provide their services. A non-executive director may resign by notice in writing to the
Directors’ Remuneration Report continued

Annual Report 2015 Witan Investment Trust plc 51
Financial Statements
Statutory Information
Strategic ReportReport of the D
irectorsC
orporate Governance
Other Inform
ation
Remuneration policy for non-executive directorsThe following table provides a summary of the key elements of the remuneration of the non-executive directors:
Purpose Operation
Fees Fees payable to the directors should reflect the time committed to the Company’s affairs and should be sufficient to enable candidates of high calibre to be recruited.
There are no performance-related elements and no fees are subject to clawback provisions.
Non-executive directors are to be remunerated in the form of fees, payable monthly in arrears, to the director personally or to a third party specified by him or her. There are no long-term incentive schemes or pension arrangements and the fees are not specifically related to their performance, either individually or collectively.
The Committee determines the level of fee at its discretion. The fees are reviewed each year, although such review will not necessarily result in any increase in the fees. Proposed increases in fees are determined in the light of increases in inflation and in the Company’s share price, net asset value and dividend payments.
Director are paid higher fees than the other non-executive directors in recognition of their
£57,000 per annum. The Senior Independent Director receives a fee of £4,000 in addition to the annual base fee.
Each non-executive director’s annual base fee is £30,000.
Additional fees are payable as follows:
> Chairman of Audit Committee £6,000;
> Chairman of Remuneration and Nomination Committee £4,000.
All of the above fees took effect on 1 April 2014. The maximum amount of fees, in aggregate, that may be paid to non-executive directors in any financial year is £350,000 following approval by shareholders at the Annual General Meeting in

Witan Investment Trust plc Annual Report 201552
Remuneration policy for the CEO (and any future executive director)
applied to any other executive director appointed by the Company.
Purpose and link to strategy
Operation and clawback
Maximum opportunity
Performance measures
Base salarymarket competitive levels in order to recruit and retain an executive director of a suitably high calibre.
The level of pay reflects a number of factors including individual experience, expertise and pay appropriate to the position.
and fixed for 12 months.The Committee has agreed to increase the
from 1 January 2016, by 1% to £281,000 per annum.
Year-on-year, salary increases for any executive director will not exceed 10% per annum other than in times of abnormal inflation or other exceptional circumstances, in which case the increase will not exceed 20%.
Not applicable.
Benefits-in-kind competitive level of
benefits-in-kind to help recruit or retain an executive director of a suitably high calibre.
An executive director may be eligible to receive a range of benefits including some or all of:
> private medical insurance for the executive director and their family;
> death in service insurance;
> business-related expenses.
Where benefits are sourced through third party providers, the expense will reflect the cost of the provision of the benefits from time to time but will be kept under review by the Committee.
The maximum benefit that can be offered or paid to an executive director is:
> private medical insurance provided on a family basis;
> death in service insurance of 4 times base salary;
> business-related expenses.
Not applicable.
Pensioncompetitive levels of guaranteed cash earnings to help recruit or retain an executive director of a suitably high calibre.
cash payment, equal to 10% of base salary, in lieu of pension contributions.
The maximum cash payment in lieu of pension contributions is 10% of base salary.
Not applicable.
Directors’ Remuneration Report continued

Annual Report 2015 Witan Investment Trust plc 53
Financial Statements
Statutory Information
Strategic ReportReport of the D
irectorsC
orporate Governance
Other Inform
ation
Purpose and link to strategy
Operation and clawback
Maximum opportunity
Performance measures
Discretionary bonus
The purpose of the bonus arrangements is
maximise the Company’s performance and its return to shareholders.
discretionary bonus of up to 40% (previously 20%) of basic annual salary. The Committee will review
performance criteria to determine the appropriate level of bonus payable in respect of the preceding year.
The Committee may change the terms of this bonus or reduce any bonus payment that would otherwise be payable in order to comply with any relevant current or future regulations, including the FCA Remuneration Code. See note 2 on page 54 for the operation of deferral, malus and clawback.
The maximum cash bonus payable to any executive director is 40% (previously 20%) of base salary.
Please see Note 1 on page 54 for details of the performance measures subject to
discretionary bonus.
One-year Bonus
The purpose of the bonus arrangements is
maximise the Company’s performance and its return to shareholders.
bonus of up to 40% (previously 30%) of base salary by reference to the performance of the Company over the previous financial year.
The Committee may change the terms of this bonus or reduce any bonus payment that would otherwise be payable in order to comply with any relevant current or future regulations, including the FCA Remuneration Code. See note 2 on page 54 for the operation of deferral, malus and clawback.
The maximum cash bonus payable to any executive director is 40% (previously 30%) of base salary.
Please see Note 1 on page 54 for details of the performance measures subject to the
ne-year onus.
Long-Term Bonus
The purpose of the bonus arrangements is
maximise the Company’s performance and its return to shareholders.
bonus of up to 90% (previously 50%) of base salary by reference to the performance of the Company over the previous three financial years.
The Committee may, with shareholder approval as appropriate, change the terms of this bonus or reduce any bonus payment that would otherwise be payable in order to comply with any relevant current or future regulations, including the FCA Remuneration Code. See note 2 on page 54 for the operation of deferral, malus and clawback.
The maximum cash bonus payable to any executive director is 90% (previously 50%) of base salary.
Please see Note 1 on page 54 for details of the performance measures subject to the

Witan Investment Trust plc Annual Report 201554
Notes:
eligible to receive a bonus of up to 170% (previously 100%) of his basic salary. The cash bonus arrangement consists of three separate elements as set out below:
(i) Discretionary bonus
discretion of the Committee, a cash bonus of up to 40% (previously 20%) of his basic annual salary. The Committee has determined a number of criteria that it takes into account, including the management and administration of
other stakeholders, on which to judge his performance.
(ii) One-year Bonus
bonus of up to 40% (previously 30%) of his basic annual salary. The bonus will be determined by the Company’s net asset value per share total return performance over the previous financial year (debt at par, excluding the effect of share buybacks or issuance) relative to its benchmark.
3.0% (previously 2.5%) or more will generate a bonus of the full 40%. No bonus is payable if performance is in line with or below that of the benchmark. Relative performance of between nil and 3.0% will generate a pro rata bonus. (The benchmark (the
hmark’) is a composite of 40% FTSE All-Share Index, 20% FTSE All-World North America Index, 20% FTSE All-World Europe (ex UK) Index and 20% FTSE All-World Asia Pacific Index, all on a total return basis.)
(iii) Long-Term Bonus
of up to 90% (previously 50%) of his basic annual salary by reference to the Company’s performance over the
determined by reference to the Company’s net asset value per share total return (debt at par, excluding the effect of share buybacks or issuance) relative to its benchmark, as set out in the Company’s audited annual accounts for the applicable financial years. Compounded average annual outperformance of the enchmark by an average of 2.5% (previously 3%) per annum or more will generate a bonus of the full 90%. No bonus is payable if performance is in line with or below that of the enchmark. Relative performance of between nil and 2.5% per annum will generate a pro rata bonus.
of the enchmark over the relevant three financial years, the Company’s net asset value total return per share is negative over that period.
Subject to shapayable for the first time on this new basis in respect of the three-year period from 1 January 2016 to 31 December 2018. The discretionary bonus and will both be payable for the first time on this basis in respect of the one-year period from 1 January 2016 to 31 December 2016.
2. Deferral, malus and clawback
All bonuses will be subject to deferral in terms of payment. 60% of any bonus will be paid in March following the
of all bonuses will be payable on a deferred basis over the following three years, in equal instalments on each
2.2 MalusMalus (where bonuses that have yet to be paid are forfeited) may be applied by the Remuneration Committee where:a) there has been material misstatement or error that
causes an award to vest at a higher level than would otherwise have been the case;
b) there has been a material failure in risk management;c) there has been serious misconduct that has or could
result in dismissal.
2.3. ClawbackAny bonus will be subject to a clawback period of 2 years
pay back part or all of any bonus already received. Clawback may be applied by the Remuneration Committee where:a) there has been material misstatement or error that
causes an award to vest at a higher level than would otherwise have been the case;
b) there has been a material failure in risk management;c) there has been serious misconduct that has or could
result in dismissal.
3. Legacy plansThe Committee reserves the right to make remuneration payments and payments for loss of office that are not in line with the policy set out above (i) where the terms of such a payment were agreed before the policy came into effect or at a time when the relevant individual was not a director of the Company and (ii) in the opinion of the Committee, such a payment is not in consideration of the individual becoming a director of the Company. For these purposes, payments include the Committee making awards of variable remuneration.
Directors’ Remuneration Report continued

Annual Report 2015 Witan Investment Trust plc 55
Financial Statements
Statutory Information
Strategic ReportReport of the D
irectorsC
orporate Governance
Other Inform
ation
. Differences in the Company’s remuneration policy for directors as compared to employeesThe remuneration policy for the executive director differs principally from that for employees in that the executive director’s remuneration is more heavily weighted towards variable pay so that a greater proportion of his pay is related to the Company’s performance and the value created for shareholders.
Principles and approach to recruitment and internal promotion of directorsNon-executive directors1) Remuneration of non-executive directors should
reflect the specific circumstances of the Company and the duties and responsibilities of the non-executive directors. It should provide appropriate compensation for the experience and time committed to the proper oversight of the affairs of the Company.
2) Non-executive directors are not eligible to receive bonuses, pension benefits, share options or other benefits.
3) The total remuneration of the non-executive directors is determined by the provisions of the Company’s Articles of Association and by shareholder resolution.
4) The basic non-executive director’s fee will be paid to each non-executive director, with a higher fee per annum for the Chairman of the Company. An additional fee per annum will be paid to the Chairman of each of the Audit and Remuneration and Nomination Committees and to the Chairman of any other Committees that the Company forms; and to the Senior Independent Director.
Executive directors 1) When hiring a new executive director, or promoting to
offer a package that is sufficient to retain and motivate and, if relevant, attract the right talent whilst paying no more than is necessary.
will be in line with the policy set out in the table.
3) The maximum level of variable pay that may be awarded to a new director on recruitment or on
70% of base salary (calculated at the date of grant, excluding any buy-out awards – see below).
4) The Committee may, where it considers it to be in the best interests of the Company and shareholders, offer an additional cash payment to an executive director in
order to replace awards which would be foregone by the individual on leaving his/her previous employment (i.e. buy-out arrangements) which will be intended to mirror forfeited awards as far as possible by reflecting the value, nature, time horizons and performance measures.
Letters of appointment/service contract Non-executive directors’ letters of appointmentThe non-executive directors all have letters of appointment, which may be inspected at the Company’s registered office. None of the non-executive directors is subject to any notice period. All continuing non-executive directors are required to stand for re-election by the shareholders at least every three years. The initial period of appointment is two terms of three years. All reasonably incurred expenses will be met.
for re-election at the Annual General Meeting in April 2016.
CEO’s service contract
service agreement dated 3 February 2010, as amended, provided in 2015 for a salary of £278,000 (2014: £268,000) per annum. The salary has been increased to £281,000 with
terminated by either party on the giving or receiving of not less than nine months’ written notice.
Please see ‘Policy on payment for loss of office’ (below) for
Illustration of application of remuneration policyThe chart on page 56 shows an indication of the values of
accordance with the revised remuneration policy for the first full year (i.e. year ending 31 December 2018) in which the policy applies at three direct levels of performance:
> minimum performance, i.e. fixed salary, taxable benefits and payment in lieu of pension contributions, with no bonus pay-out;
> on-target performance, fixed pay plus bonus payments assuming a 50% pay-out of each of the discretionary,
ne-
> maximum performance, fixed pay plus bonus payments assuming 100% pay-out of each of the discretionary,
ne-

Witan Investment Trust plc Annual Report 201556
Minimum performance On target performance Maximum performance
Fixed payDiscretionary bonusOne-year BonusLong-Term Bonus
050
100150200250300350400450500550600650700750800850
100% 58%
10%
10%
22%
14.8%
40%
14%
14%
32%
£325,000
£563,600
£802,700
£’00
0s
Policy on payment for loss of officeNon-executive directorsNone of the non-executive directors is subject to any notice period. It is the Company’s policy not to enter into any arrangement with any of the non-executive directors to entitle any of the non-executive directors to compensation for loss of office.
CEO (and any future executive directors)
which would not exceed nine months.
The Company may, in its absolute discretion and without
immediately by giving him written notice together with a payment of such sum as would have been payable by the
accrual) in respect of his notice period. The Company may, at its discretion, make the termination payment in instalments over a period of no longer than six months from the termination date and on terms that any payment should be
If a new executive director is recruited, the Company’s policy regarding payments for loss of office will be the same as for
a good leaver reason (i.e. death, ill-health, injury, disability, redundancy, retirement or due to any other circumstance that the Committee at its discretion permits), any bonus payment shall be pro-rated for time and performance. The Committee may, however, taking into account such factors as it considers appropriate, increase the proportion of the relevant bonus
prior to the date that the relevant bonus would otherwise
relevant bonus for nil consideration unless the Committee, in its absolute discretion, determines otherwise.
A change of control of the Company shall not affect the amount of any bonus or the date on which it becomes payable unless the Committee determines otherwise, in which case the Committee shall determine whether the pro-rated performance targets attached to the applicable bonuses have been satisfied at that time.
If the Committee determines that the pro-rated performance targets have not been satisfied on the change of control, the applicable bonus shall immediately lapse unless the Committee determines otherwise. To the extent that the Committee determines that the pro-rated performance targets have been satisfied on the change of control, if the
that the applicable bonus would otherwise have been paid to
> a reason which would have justified his summary dismissal;
> his cessation of employment without the giving or receiving of notice; or
> his resignation
the applicable bonus shall become payable to the extent determined at the time of the change of control on, or as
Statement of consideration of conditions elsewhere in the Company The Committee considers the employment conditions,
The Company did not consult with employees when drawing up the remuneration policy.
Where possible, the Committee benchmarks the remuneration
paid to employees in comparable roles in other companies.
Statement of consideration of shareholder viewsThe Company places great importance on communication with its shareholders. The Company had frequent meetings with institutional shareholders and City analysts throughout the year to 31 December 2015 and met with shareholders in general at the Annual General Meeting held in 2015 and can confirm that it is not aware of negative views being expressed by shareholders in relation to its policy on Directors’ Remuneration.
Approval
8
Catherine Claydon Chairman of the Remuneration and Nomination Committee8 March 2016
Directors’ Remuneration Report continued

Annual Report 2015 Witan Investment Trust plc 57
Financial Statements
Statutory Information
Strategic ReportReport of the D
irectorsC
orporate Governance
Other Inform
ation
Statement of Directors’ Responsibilitiesin respect of the Annual Report, the Directors’ Remuneration
The directors are responsible for preparing the Annual Report and the financial statements in accordance with applicable law and regulations.
Company law requires the directors to prepare financial statements for each financial year. Under that law the directors are required to prepare the Group financial statements in accordance with International Financial Reporting Standards (‘IFRSs’) as adopted by the European Union (‘EU’) and Article 4 of the EU IAS Regulation and have also chosen to prepare the parent company financial statements under IFRSs as adopted by the EU. Under company law the directors must not approve the financial statements unless they are satisfied that they give a true and fair view of the state of affairs of the Company and of the profit or loss of the Company for that period. In preparing these financial statements, International Accounting Standard 1 requires that directors:
> properly select and apply accounting policies;
> present information, including accounting policies, in a manner that provides relevant, reliable, comparable and understandable information;
> provide additional disclosures when compliance with the specific requirements in IFRSs is insufficient to enable users to understand the impact of particular transactions, other events and conditions on the entity’s financial position and financial performance; and
> make an assessment of the Company’s ability to continue as a going concern.
The directors are responsible for keeping adequate accounting records that are sufficient to show and explain the Company’s transactions and disclose with reasonable accuracy at any time the financial position of the Company and enable them to ensure that the financial statements comply with the Companies Act 2006.
They are also responsible for safeguarding the assets of the Company and hence for taking reasonable steps for the prevention and detection of fraud and other irregularities.
The directors are responsible for the maintenance and integrity of the corporate and financial information included on the Company’s website. Legislation in the United Kingdom governing the preparation and dissemination of financial statements may differ from legislation in other jurisdictions.
Responsibility statementWe confirm that to the best of our knowledge:
> the financial statements, prepared in accordance with International Financial Reporting Standards as adopted by the EU, give a true and fair view of the assets, liabilities, financial position and profit or loss of the Company and the undertakings included in the consolidation taken as a whole;
> the Strategic Report includes a fair review of the development and performance of the business and the position of the Company and the undertakings included in the consolidation taken as a whole, together with a description (on pages 20 and 21) of the principal risks and uncertainties that they face; and
> the financial statements, taken as a whole, are fair, balanced and understandable, and provide the information necessary for shareholders to assess the Company’s position, performance, business model and strategy.
H M Henderson A L C Bell Chairman Chief Executive8 March 2016 8 March 2016
Note to those who access this document by electronic means
Copies of the Annual Report and the Half Year Report are circulated to shareholders, to those who hold shares through Witan Investment Services Limited’s savings schemes and, where possible, to investors through other providers’ products and nominee companies (or written notification is sent when they are published online). It is also made available in electronic

Witan Investment Trust plc Annual Report 201558
Witan Investment Trust plc is an ‘alternative investment fund’ (‘AIF’) for the purposes of the EU Alternative Investment Fund Managers Directive (Directive 2011/61/EU) (the ‘AIFMD’) and the Company has appointed its subsidiary, Witan Investment Services Limited (‘WIS’), to act as its AIFM. WIS is authorised and regulated by the United Kingdom Financial Conduct Authority as a ‘full scope UK AIFM’.
The Company is required to make certain disclosures available to investors in accordance with the AIFMD. Those disclosures that are required to be made pre-investment are included within the Investor Disclosure Document (‘IDD’) which can be found on the Company’s website www.witan.com. There have not been any material
The Company and AIFM also wish to make the following disclosures to investors:
> the investment strategy, geographic and sector investment focus and principal stock exposures are included in the Strategic Report. A list of the top 50 portfolio holdings is included on page 26;
> none of the Company’s assets is subject to special arrangements arising from their illiquid nature;
> the Strategic Report and note 14 to the accounts set out the risk profile and risk management systems in place. There have been no changes to the risk management systems in place in the period under review and no breaches of any of the risk limits set, with no breach expected;
> there are no new arrangements for managing the liquidity of the Company or any material changes to the liquidity management systems and procedures employed by the Company; and
> all authorised Alternative Investment Fund Managers are required to comply with the AIFMD Remuneration Code. The relevant disclosures required are set out below.
RemunerationDuring the year ended 31 December 2015, WIS had 11 members of staff and directors. The total remuneration paid during this period was:
Senior Management
(9)£’000
Staff(2)
£’000
Fixed remuneration 871 176Variable remuneration 305 17
Total 1,176 193
WIS has only one AIF, the Company. Further details of the Company’s Remuneration Policy for its directors are set out in the Directors’ Remuneration Report on pages 50 to 56.
LeverageCircumstances when the Company may use leverage The purpose of using leverage, through borrowing, known
by achieving investment returns higher than the interest cost of the borrowings. Accordingly, attention is paid to using a level of gearing appropriate for market conditions (put simply, borrowing more when markets are attractively valued and borrowing less at times when returns are expected to be poorer). In addition, a blend of long-term and short-term borrowings is used, to balance the certainty of cost associated with locking in fixed rates for longer periods with the flexibility of using short-term facilities which can be readily repaid when they are not required.
In a rising market, gearing will tend to enhance returns because of the investment fund’s increased exposure to the market. the same token, however, it will tend to increase losses triggered by a falling market.
Types and sources of leverage permitted The Company has £185 million of long-term debt, consisting of debenture, secured bonds, fixed rate loan notes and preference share capital but this will reduce to £140 million when the debentu . The Company also has a £50 million one-year facility, providing additional flexibility over the level of gearing, as well as enabling the Company to borrow in other currencies than sterling, if deemed appropriate. The Company may either invest its borrowings fully, or neutralise their effect with cash balances (or the sale of equity index futures) according to its assessment of the markets.
Restrictions on the use of leverageThe Company’s delegated investment managers are not permitted to borrow within their portfolios but may hold cash if deemed appropriate.
Alternative Investment Fund Managers Directive

Annual Report 2015 Witan Investment Trust plc 59
Financial Statements
Statutory Information
Strategic ReportReport of the D
irectorsC
orporate Governance
Other Inform
ation
The maximum level of leverage which the AIFM is entitled to employ on behalf of the CompanyThe Company has the legal power under its Articles of Association to borrow up to 100% of the adjusted total of shareholders’ funds (and WIS has agreed to set the maximum leverage level at that 100% level). This is subject to practical constraints including a test of prudence and the long-standing policy is not to allow gearing to rise to more than 20%, other than temporarily in exceptional
varied between 5% and 15% and where appropriate the Company may hold a small net cash position.
Under AIFMD the Company is required to calculate leverage under the two methodologies specified by the Directive, the ‘Gross Method’ and the ‘Commitment Method’, the difference being that the Commitment Method allows certain exposures to be offset or netted.
The table below sets out the current maximum permitted limit and the actual level of leverage for the Company, as a percentage of adjusted shareholders’ funds:
Gross method
%
Commitment method
%
Maximum level 100 100Actual level at 31 December 2015 10.7 14.3
The current difference between the two methods is that the Commitment Method allows certain exposures to be netted off (for example hedging, although currently this is not applicable) and projects what gearing would be if cash held at the year end were to be invested. The Gross Method produces a level in line with our own calculation, consistent with the actual historical numbers for gearing as defined on page 3.
There have not been any changes to the maximum level of leverage that the AIFM may employ on behalf of the Company or any changes to the right of reuse of collateral or any guarantee granted under the leveraging arrangements.
It is the Company’s policy that leveraging arrangements are not collateralised.

Witan Investment Trust plc Annual Report 201560
Independent Auditor’s Reportto the members of Witan Investment Trust plc
Opinion on financial statements of Witan Investment Trust plcIn our opinion:
>
the year then ended;
> prepared in accordance with International Financial Reporting Standards (IFRSs) as adopted by the European Union;
> properly prepared in accordance with IFRSs as adopted by the European Union and as applied in accordance with the provisions of the Companies Act 2006; and
> accordance with the requirements of the Companies
statements, Article 4 of the IAS Regulation. The financial statements comprise the Consolidated Statement of Comprehensive Income, Consolidated and Individual Company Statements of Changes in Equity,
Consolidated and Individual Company Cash Flow Statements and the related notes 1 to 25. The financial reporting framework that has been applied in their preparation is applicable law and IFRSs as adopted by the European Union and, as regards the parent company financial statements, as applied in accordance with the provisions of the Companies Act 2006.
Separate opinion in relation to IFRSs as issued by the IASBAs explained in note 1 to the financial statements, in addition to complying with its legal obligation to apply IFRSs as adopted by the European Union, the Group has also applied IFRSs as issued by the International Accounting Standards
In our opinion the financial statements comply with IFRSs as
Going concern and the Directors’ assessment of the principal risks that would threaten the solvency or liquidity of the TrustAs required by the Listing Rules we have reviewed the Directors’ statement regarding the appropriateness of the going concern basis of accounting contained within note 1 to the financial statements and the Directors’ Statement on the longer term viability of the Group contained within the Strategic Report.
We have nothing material to add or draw attention to in relation to:
> 20 that they have carried out a robust assessment of the principal risks facing the Trust, including those that would threaten its business model, future performance, solvency or liquidity;
> the disclosures on pages 20 and 21 that describe those risks and explain how they are being managed or mitigated;
> the Directors’ statement in note 1(b)statements of the Annual Report about whether they considered it appropriate to adopt the going concern basis of accounting in preparing them and
Group’s ability to continue to do so over a period of at least twelve months from the date of approval of the
> the Directors’ explanation on page 22 as to how they have assessed the prospects of the Group, over what period they have done so and why they consider that period to be appropriate, and their statement as to whether they have a reasonable expectation that the Group will be able to continue in operation and meet its liabilities as they fall due over the period of their assessment, including any related disclosures
assumptions.
We agreed with the Directors’ adoption of the going concern basis of accounting and we did not identify any material uncertainties. However, because not all future events or conditions can be predicted, this statement is not a guarantee as to the Group’s ability to continue as a going concern.
IndependenceWe are required to comply with the Financial Reporting Council’s Ethical Standards for Auditors and we confirm that we are independent of the Group and we have fulfilled our other ethical responsibilities in accordance with those standards. We also confirm we have not provided any of the prohibited non-audit services referred to in those standards.
Our assessment of risks of material misstatementThe assessed risks of material misstatement described below are those that had the greatest effect on our audit strategy, the allocation of resources in the audit and directing the efforts of the engagement team:
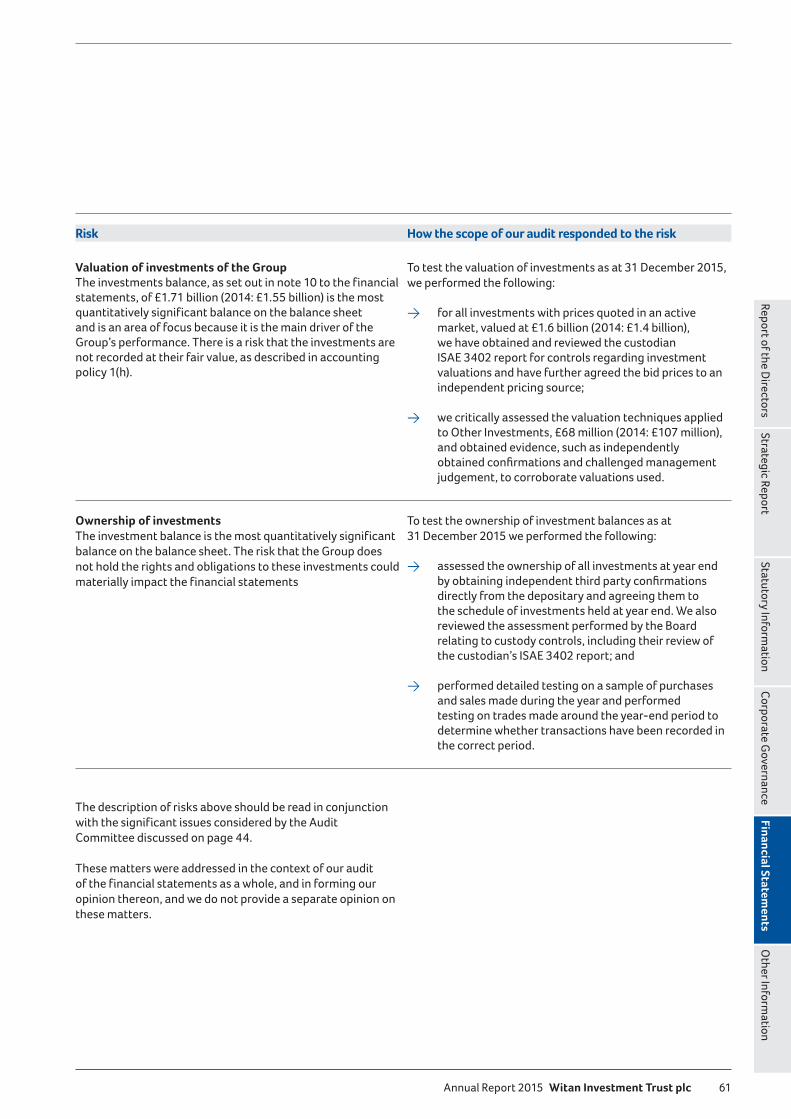
Annual Report 2015 Witan Investment Trust plc 61
Financial Statements
Statutory Information
Strategic ReportReport of the D
irectorsC
orporate Governance
Other Inform
ation
Risk How the scope of our audit responded to the risk
Valuation of investments of the GroupThe investments balance, as set out in note 10 to the financial statements, of £1.71 billion (2014: £1.55 billion) is the most quantitatively significant balance on the balance sheet and is an area of focus because it is the main driver of the Group’s performance. There is a risk that the investments are not recorded at their fair value, as described in accounting
To test the valuation of investments as at 31 December 2015, we performed the following:
> for all investments with prices quoted in an active market, valued at £1.6 billion (2014: £1.4 billion), we have obtained and reviewed the custodian
s regarding investment valuations and have further agreed the bid prices to an independent pricing source;
> we critically assessed the valuation techniques applied 68
and obtained evidence, such as independently
judgement, to corroborate valuations used.
Ownership of investmentsThe investment balance is the most quantitatively significant balance on the balance sheet. The risk that the Group does not hold the rights and obligations to these investments could materially impact the financial statements
To test the ownership of investment balances as at
> assessed the ownership of all investments at year end
directly from the depositary and agreeing them to the schedule of investments held at year end. We also reviewed the assessment ard relating to custody controls, including their review of the custodian’s ISAE 3402 report; and
> performed detailed testing on a sample of purchases and sales made during the year and performed testing on trades made around the year-end period to determine whether transactions have been recorded in the correct period.
The description of risks above should be read in conjunction with the significant issues considered by the Audit Committee discussed on page 44.
These matters were addressed in the context of our audit of the financial statements as a whole, and in forming our opinion thereon, and we do not provide a separate opinion on these matters.

Witan Investment Trust plc Annual Report 201562
Our application of materialityWe define materiality as the magnitude of misstatement in the financial statements that makes it probable that the economic decisions of a reasonably knowledgeable person would be changed or influenced. We use materiality both in planning the scope of our audit work and in evaluating the results of our work.
We determined materiality for the Group to be £15.8 million (2014: £14 million), which has been determined using 1% of total equity. Total equity has been chosen as a benchmark as it is considered the most relevant benchmark for investors.
We agreed with the Audit Committee that we would report to the Committee all known audit errors in excess of £10,000 (2014 £10,000), as well as differences below that threshold that, in our view, warranted reporting on qualitative grounds. We also report to the Audit Committee on disclosure matters that we identified when assessing the overall presentation of the financial statements.
An overview of the scope of our audit
of the Group and its environment, including group-wide controls, and assessing the risks of material misstatement at the group level. Audit work to respond to the risks of material misstatement for all entities in the Group was performed directly by the audit engagement team.
Investment Services (WIS) and we have audited 100% of the Company to Group materiality for the year ended 31 ecember 2015. The audit of WIS was performed for local statutory purposes at the level of materiality applicable to the entity, £42,956 (2014: £37,347), which was lower than Group materiality.
As the accounting is performed by service organisations, we obtained an understanding of how the Group uses service organisations in its operations and evaluated the design and implementation of relevant controls at the Group that relate to the services provided by service organisations. We reviewed the latest reports on internal controls from the service organisations and contacted them directly to obtain specific information we needed to conduct our audit.
Opinion on other matters prescribed by the Companies Act 2006In our opinion:
> the part of the Directors’ Remuneration Report to be audited has been properly prepared in accordance with the Companies Act 2006; and
> the information given in the Strategic Report and the
Matters on which we are required to report by exceptionAdequacy of explanations received and accounting records Under the Companies Act 2006 we are required to report to you if, in our opinion:
> we have not received all the information and explanations we require for our audit; or
> adequate accounting records have not been kept by the parent company, or returns adequate for our audit have not been received from branches not visited by us; or
> agreement with the accounting records and returns.
We have nothing to report in respect of these matters.
Directors’ remunerationUnder the Companies Act 2006 we are also required to report if in our opinion certain disclosures of directors’ remuneration have not been made or the part of the Directors’ Remuneration Report to be audited is not in agreement with the accounting records and returns. We have nothing to report arising from these matters.
Corporate Governance StatementUnder the Listing Rules we are also required to review the part of the Corporate Governance Statement relating to the company’s compliance with certain provisions of the UK Corporate Governance Code. We have nothing to report arising from our review.
Independent Auditor’s Report continued

Annual Report 2015 Witan Investment Trust plc 63
Financial Statements
Statutory Information
Strategic ReportReport of the D
irectorsC
orporate Governance
Other Inform
ation
Our duty to read other information in the Annual ReportUnder International Standards on Auditing (UK and Ireland), we are required to report to you if, in our opinion, information in the annual report is:
> materially inconsistent with the information in the
> apparently materially incorrect based on, or materially inconsistent with, our knowledge of the Group acquired in the course of performing our audit; or
> otherwise misleading.
In particular, we are required to consider whether we have identified any inconsistencies between our knowledge acquired during the audit and the directors’ statement that they consider the annual report is fair, balanced and understandable and whether the annual report appropriately discloses those matters that we communicated to the Audit Committee which we consider should have been disclosed. We confirm that we have not identified any such inconsistencies or misleading statements.
Respective responsibilities of directors and auditorAs explained more fully in the Directors’ Responsibilities Statement, the directors are responsible for the preparation of the financial statements and for being satisfied that they
express an opinion on the financial statements in accordance with applicable law and International Standards on Auditing (UK and Ireland). We also comply with International Standard
and tools aim to ensure that our quality control procedures
and systems include our dedicated professional standards review team, and independent partner reviews.
This report is made solely to the Company’s members, as a body, in accordance with Chapter 3 of Part 16 of the
so that we might state to the Company’s members those matters we are required to state to them in an auditor’s report and for no other purpose. To the fullest extent permitted by law, we do not accept or assume responsibility to anyone other than the Company and the Company’s members as a body, for our audit work, for this report, or for the opinions we have formed.
Scope of the audit of the financial statementsAn audit involves obtaining evidence about the amounts and disclosures in the financial statements sufficient to give reasonable assurance that the financial statements are free from material misstatement, whether caused by fraud or error. This includes an assessment of: whether the accounting policies are appropriate to the Group’s and the parent company’s circumstances and have been consistently applied and adequately disclosed; the reasonableness of significant accounting estimates made by the directors; and the overall presentation of the financial statements. In addition, we read all the financial and non-financial information in the annual report to identify material inconsistencies with the audited financial statements and to identify any information that is apparently materially incorrect based on, or materially inconsistent with, the knowledge acquired by us in the course of performing the audit. If we become aware of any apparent material misstatements or inconsistencies we consider the implications for our report.
Andrew Partridge (Senior Statutory Auditor)for and on behalf of Deloitte LLPChartered Accountants and Statutory AuditorLondon, United Kingdom
8 March 2016

Witan Investment Trust plc Annual Report 201564
Consolidated Statement of Comprehensive Income for the year ended 31 December 2015
Year ended 31 December 2015 Year ended 31 December 2014
Notes
Revenue return£’000
Capitalreturn£’000
Total£’000
Revenue return£’000
Capitalreturn£’000
Total£’000
Investment income 2 45,818 – 45,818 38,297 – 38,297
Other income 3 1,460 – 1,460 1,440 – 1,440
Gains on investments held at fair value through profit or loss 10 – 64,563 64,563 – 79,073 79,073
Total income 47,278 64,563 111,841 39,737 79,073 118,810
Expenses
Management and performance fees 4 (1,747) (9,539) (11,286) (1,541) (7,623) (9,164)
Other expenses 5 (5,309) (101) (5,410) (4,798) (101) (4,899)
40,222 54,923 95,145 33,398 71,349 104,747
Finance costs 6 (2,484) (7,199) (9,683) (2,115) (6,095) (8,210)
37,738 47,724 85,462 31,283 65,254 96,537
Taxation 7 (1,779) – (1,779) (1,218) – (1,218)
of the parent company 35,959 47,724 83,683 30,065 65,254 95,319
Earnings per ordinary share 9 18.49p 24.54p 43.03p 15.88p 34.47p 50.35p
The total column of this statement represents the Group’s Statement of Comprehensive Income, prepared in accordance with IFRSs as adopted by the European Union.
The revenue return and capital columns are supplementary to this and are prepared under guidance published by the Association of Investment Companies.
Group’s total comprehensive income.
All items in the above statement derive from continuing operations.
interests.
The notes on pages 68 to 89

Annual Report 2015 Witan Investment Trust plc 65
Financial Statements
Statutory Information
Strategic ReportReport of the D
irectorsC
orporate Governance
Other Inform
ation
Consolidated and Individual
for the year ended 31 December 2015
GroupYear ended 31 December 2015
Notes
Ordinary share
capital £’000
Share premium account
£’000
Capital redemption
reserve£’000
Other capital
reserves£’000
Revenue reserve
£’000Total
£’000
47,390 18,106 46,498 1,274,185 55,068 1,441,247
– – – 47,724 35,959 83,683Transactions with owners,
Ordinary dividends paid 8 – – – – (31,373) (31,373) Issue of ordinary shares 15,16 2,628 81,145 – – – 83,773
Total equity at 31 December 2015 50,018 99,251 46,498 1,321,909 59,654 1,577,330
CompanyYear ended 31 December 2015
Notes
Ordinary share
capital £’000
Share premium account
£’000
Capital redemption
reserve£’000
Other capital
reserves£’000
Revenue reserve
£’000Total
£’000
47,390 18,106 46,498 1,274,479 54,774 1,441,247
– – – 48,038 35,645 83,683Transactions with owners,
Ordinary dividends paid 8 – – – – (31,373) (31,373) Issue of ordinary shares 15,16 2,628 81,145 – – – 83,773
Total equity at 31 December 2015 50,018 99,251 46,498 1,322,517 59,046 1,577,330
GroupYear ended 31 December 2014
Notes
Ordinary share
capital £’000
Share premium account
£’000
Capital redemption
reserve£’000
Other capital
reserves£’000
Revenue reserve
£’000Total
£’000
47,328 16,237 46,498 1,208,931 53,950 1,372,944
– – – 65,254 30,065 95,319Transactions with owners,
Ordinary dividends paid 8 – – – – (28,947) (28,947) Buybacks of ordinary shares 15,16 – – – (363) – (363)
Issue of ordinary shares 15,16 62 1,869 – 363 – 2,294
47,390 18,106 46,498 1,274,185 55,068 1,441,247
CompanyYear ended 31 December 2014
Notes
Ordinary share
capital £’000
Share premium account
£’000
Capital redemption
reserve£’000
Other capital
reserves£’000
Revenue reserve
£’000Total
£’000
47,328 16,237 46,498 1,209,070 53,811 1,372,944
– – – 65,409 29,910 95,319Transactions with owners,
Ordinary dividends paid 8 – – – – (28,947) (28,947) Buybacks of ordinary shares 15,16 – – – (363) – (363)
Issue of ordinary shares 15,16 62 1,869 – 363 – 2,294
47,390 18,106 46,498 1,274,479 54,774 1,441,247
The notes on pages 68 to 89

Witan Investment Trust plc Annual Report 201566
Consolidated and Individual Company Balance Sheetsfor the year ended 31 December 2015
Notes
Group 31 December
2015£’000
Company 31 December
2015£’000
Group 31 December
2014£’000
Company 31 December
2014£’000
Non current assets Investments held at fair value through profit or loss 10 1,708,728 1,710,236 1,552,278 1,553,472 Current assetsOther receivables 11 7,255 6,547 6,931 6,922
57,587 56,582 46,554 45,136
64,842 63,129 53,485 52,058
Total assets 1,773,570 1,773,365 1,605,763 1,605,530
Current liabilitiesOther payables 12 (8,265) (8,060) (9,088) (8,855)8½ per cent. Debenture Stock 2016 13 (44,583) (44,583) – –Bank loans (3,000) (3,000) (45,000) (45,000)
(55,848) (55,643) (54,088) (53,855)
Total assets less current liabilities 1,717,722 1,717,722 1,551,675 1,551,675
Non current liabilities
8½ per cent. Debenture Stock 2016 13 – – (44,581) (44,581) 6.125 per cent. Secured Bonds due 2025 13 (63,354) (63,354) (63,292) (63,292) 3.29 per cent. Secured Notes due 2035 13 (20,491) (20,491) – – 3.47 per cent. Secured Notes due 2045 13 (53,992) (53,992) – – 3.4 per cent. cumulative preference shares of £1 13, 17 (2,055) (2,055) (2,055) (2,055) 2.7 per cent. cumulative preference shares of £1 13, 17 (500) (500) (500) (500)
(140,392) (140,392) (110,428) (110,428)
Net assets 1,577,330 1,577,330 1,441,247 1,441,247
Equity attributable to equity holdersOrdinary share capital 15 50,018 50,018 47,390 47,390Share premium account 16 99,251 99,251 18,106 18,106Capital redemption reserve 16 46,498 46,498 46,498 46,498
Other capital reserves 16 1,321,909 1,322,517 1,274,185 1,274,479Revenue reserve 16 59,654 59,046 55,068 54,774
Total equity 1,577,330 1,577,330 1,441,247 1,441,247
Net asset value per ordinary share 18 788.39p 788.39p 760.31p 760.31p
authorised for issue on 8 March 2016 and were signed on their behalf by
H M Henderson A L C Bell
The notes on pages 68 to 89

Annual Report 2015 Witan Investment Trust plc 67
Financial Statements
Statutory Information
Strategic ReportReport of the D
irectorsC
orporate Governance
Other Inform
ation
Consolidated and Individual Company Cash Flow Statementsfor the year ended 31 December 2015
Notes
Group 2015
£’000
Company 2015
£’000
Group 2014
£’000
Company 2014
£’000
Operating activitiesProfit before taxation 85,462 85,462 96,537 96,537Interest paid 6 9,683 9,683 8,210 8,210Gains on investments held at fair value through profit or loss 10 (64,563) (64,877) (79,073) (79,228)Net purchases of investments held at fair value through profit or loss 19 (91,933) (91,933) (38,165) (38,165)Net gains from futures contracts 10 1,048 1,048 6,413 6,413Scrip dividends included in investment income 2 (1,116) (1,116) (1,200) (1,200)Increase in other receivables (2,545) (1,846) (302) (440)(Decrease)/increase in other payables (592) (564) 956 991
taxation (64,556) (64,143) (6,624) (6,882)Interest paid (9,347) (9,347) (8,149) (8,149)Tax on overseas income (1,745) (1,745) (1,962) (1,962)Recovery of prior years' withholding tax 103 103 581 581
(75,545) (75,132) (16,154) (16,412)
Financing activities
8 (31,373) (31,373) (28,947) (28,947)Issue of Secured Notes net of issue expenses 74,472 74,472 – –Buybacks of ordinary shares – – (363) (363)Issue proceeds of ordinary shares 85,702 85,702 365 365(Repayment)/drawdown of bank loans (42,000) (42,000) 35,000 35,000
86,801 86,801 6,055 6,055
Increase/(decrease) in cash and cash equivalents 11,256 11,669 (10,099) (10,357)46,554 45,136 57,532 56,372
Effect of foreign exchange rate changes (223) (223) (879) (879)
57,587 56,582 46,554 45,136
The notes on pages 68 to 89

Witan Investment Trust plc Annual Report 201568
Notes to the Financial Statementsfor the year ended 31 December 2015
1 Accounting policiesThe financial statements of the Group have been prepared in accordance with International Financial Reporting Standards (‘IFRSs’) as adopted by the European Union and therefore the Group financial statements comply with Article 4 of the EU IAS Regulation. These comprise standards and interpretations approved by the International Accounting Standards Board (‘IASB’), together with interpretations of the International Accounting Standards and Standing Interpretations Committee approved by the International Accounting Standards Committee (‘IASC’) that remain in effect, to the extent that they have been adopted by the European Union.
These financial statements are presented in pounds sterling because that is the currency of the primary economic environment in which the Group operates.
The financial statements have been prepared on the historical cost basis, except for the revaluation of certain financial instruments. The principal accounting policies
set out in the Statement of Recommended Practice Financial Statements of Investment Trust Companies and Venture Capital Trusts (‘the SORP’) issued by the Association of Investment Companies (‘the AIC’) in November 2014 is consistent with
the directors have sought to prepare the financial statements on a basis compliant with the recommendations of the SORP.
In the application of the Group’s accounting policies,
assumptions about carrying values of assets and liabilities that are not always readily apparent from other sources. The estimates and associated assumptions are based on historical experience and other factors that are considered
(b) Going concernThe Group’s business activities, together with the factors likely to affect its future development and performance, are set out in the Strategic Report on pages 9 to 25. The financial postion of the Group as at 31 December 2015 is shown on the balance sheet on page 66. The cash flows of the Group for the year ended 31 December 2015 are not untypical and are set out on page 67. The Company had fixed debt and preference share capital totalling £184,975,000, as set out in note 13 on page 78; the 8.5% Debenture Stock is repayable 2016. In 2015, the Group renewed a one-year secured multi-currency borrowing facility for £50 million, of which £3 million was
Company issued two Secured Notes repayable in 2035 and 2045 for £21 million and £54 million respectively.
The consolidated financial statements incorporate the financial statements of the Company and the entity controlled by the Company (its subsidiary) made up to
Company has the power to govern the financial and operating policies of an investee entity so as to obtain
are made to the financial statements of the subsidiary to bring the accounting policies used by it into line with those used by the Group. All intra-group transactions, balances, income and expenses are eliminated on consolidation.
IncomeIn order to better reflect the activities of an investment trust company, and in accordance with guidance issued by the AIC, supplementary information which analyses the Statement of Comprehensive Income between items of a revenue and capital nature has been presented alongside the Statement of Comprehensive Income. In accordance with the Company’s Articles of Association, net capital returns may not be distributed by way of dividend. Additionally, the net revenue is the measure the directors believe appropriate in assessing
section 1158 of the Corporation Tax Act 2010.
(e) Income
dividend date is available, dividends receivable on or before the year end are treated as revenue for the year. Provision is made for any dividends not expected to be received. The
recognised on a time apportionment basis so as to reflect the effective yield on the debt securities and shares. Interest receivable from cash and short-term deposits is accrued to the end of the period. Stock lending fees and underwriting commission are recognised as earned. Any special dividends are looked at individually to ascertain the reason behind the payment. This will determine whether they are treated as
its dividends in the form of additional shares rather than cash, the amount of cash dividend foregone is recognised as income. Any excess in the value of shares received over the amount of cash dividend foregone is recognised as a gain in the Statement of Comprehensive Income.
All expenses and interest payable are accounted for on an accruals basis. Expenses are presented as capital where a

Annual Report 2015 Witan Investment Trust plc 69
Financial Statements
Statutory Information
Strategic ReportReport of the D
irectorsC
orporate Governance
Other Inform
ation
connection with the maintenance or enhancement of the value of the investments can be demonstrated. In this respect the investment management fees and finance costs are allocated 25% to revenue and 75% to capital to reflect the Board’s expectations of long-term investment returns. Any performance fees payable are allocated wholly to capital, reflecting the fact that, although they are calculated on a total return basis, they are expected to be attributable largely, if not wholly, to capital performance.
(g) TaxationThe tax expense represents the sum of the tax currently payable and deferred tax.
The tax currently payable is based on the taxable profit for the period. Taxable profit differs from net profit as reported in the Statement of Comprehensive Income because it excludes items of income or expense that are taxable or deductible in other years and it further excludes items that are never taxable or deductible. The Group’s liability for current tax is calculated using tax rates that were applicable at the balance sheet date.
In line with the recommendations of the SORP, the allocation method used to calculate tax relief on expenses presented against capital returns in the supplementary information in the Statement of Comprehensive Income is the ‘marginal basis’. Under this basis, if taxable income is capable of being offset entirely by expenses presented in the revenue return column of the Statement of Comprehensive Income then no tax relief is transferred to the capital return column.
Deferred tax is the tax expected to be payable or recoverable on differences between the carrying amounts of assets andliabilities in the financial statements and the corresponding tax bases used in the computation of taxable profit, and isaccounted for using the balance sheet liability method. Deferred tax liabilities are recognised for all taxable temporary differences and deferred tax assets are recognised to the extent that it is probable that taxable profits will be available against which deductible temporary differences can be utilised. Investment trusts which have approval as such under section 1158 of the Corporation Tax Act 2010 are not liable for taxation on capital gains.
The carrying amount of deferred tax assets is reviewed at each balance sheet date and reduced to the extent that it is no longer probable that sufficient taxable profits will be available to allow all or part of the asset to be recovered.
Deferred tax is calculated at the tax rates that are expected to apply in the period when the liability is settled or the asset is realised. Deferred tax is charged or credited in the Statement of Comprehensive Income, except when it relates
market, the investments concerned are recognised or derecognised on the trade date.
All the Group’s investments are defined by IFRSs as adopted by the European Union as investments held at
allocated to the capital return within the Statement of Comprehensive Income as ‘Gains or losses on investments held at fair value through profit or loss’. Also included within this heading are transaction costs in relation to the purchase or sale of investments.
All investments are designated upon initial recognition as held at fair value through profit or loss, and are measured at
the bid price or the last traded price, depending on the convention of the exchange on which the investment is
closing price, the bid price or the single price as appropriate, released by the relevant investment manager.
The Group derecognises a financial asset only when the contractual rights to the cash flows from the asset expire, or when it transfers the financial asset and substantially all the risks and rewards of ownership of the asset to another entity. On derecognition of a financial asset, the difference between the asset’s carrying amount and the sum of the consideration received and receivable and the cumulative gain or loss that
which there is only an inactive market, are established by
recent arm’s length market transactions, the current fair value of another instrument that is substantially the same, discounted cash flow analysis, option pricing
been demonstrated to provide reliable estimates of prices
provision for impairment.
is held at fair value in the Company balance sheet. This isconsidered to be the net asset value of the shareholder’s funds, as shown in its balance sheet.

Witan Investment Trust plc Annual Report 201570
1 Accounting policies continued(i) Cash and cash equivalents
Cash comprises cash in hand and demand deposits. Cash
readily convertible to known amounts of cash and that are
(j) Dividends payableInterim dividends are recognised in the period in which they are paid. Final dividends are not recognised until approved by the shareholders in general meeting.
(k) All debentures and secured bonds are initially recognised at cost, being the fair value of the consideration received, less issue costs where applicable. After initial recognition,
measured at amortised cost using the effective interest method, with the interest expense recognised on an effective yield basis. The effective interest method is a method of calculating the amortised cost of a financial liability and of allocating interest expense over the relevant period. The effective interest rate is the rate that exactly discounts estimated future payments over the expected life of the financial liabilities, or, where appropriate, a shorter period, to the net carrying amount on initial recognition.
(l) Foreign currency translationTransactions involving foreign currencies are converted at the rate ruling at the date of the transaction.
Foreign currency monetary assets and liabilities that are fair valued and denominated in foreign currencies arere-translated into sterling at the rate ruling on the balance sheet date. Foreign exchange differences arising on translation are recognised in the Statement of Comprehensive Income and allocated to the capital return.
(i) Changes in accounting policy and disclosuresThe accounting policies adopted are consistent with those of the previous financial year.
The following new and revised Standards and Interpretations have been adopted in the current year. Their adoption has not had any significant impact on the amounts reported in these financial statements.IAS 40 Amendment (AI 2011-13)
Interrelationship between IFRS 3 and IAS 40 (ancillary services)
IFRS 3 Amendment (AI 2011-13)
IFRS 13 Amendment (AI 2011-13)
Scope of paragraph 52 (portfolio exception)
At the date of authorisation of these financial statements, the following Standards and Interpretations, which have not been applied in these financial statements, were in issue but not effective (and in some cases had not yet been adopted by the European Union).
IAS 1 Amendment Disclosure Initiative
IAS 16 and IAS 38 Amendment of Depreciation and AmortisationIAS 16 and IAS 38 Amendment (AI 2010-12)
Revaluation method – proportionate restatement of accumulated depreciation/amortisation
IAS 16 and IAS 41 Amendment
Bearer Plants
IAS 19 AmendmentContributions
IAS 19 Amendment (AI 2012-14)IAS 24 Amendment (AI 2010-12)
Key management personnel
IAS 27 AmendmentStatements
IAS 34 Amendment (AI 2012-14)
Disclosure of information 'elsewhere in the interim report'
IFRS 2 Amendment (AI 2010-12)IFRS 3 Amendment (AI 2010-12)
Accounting for contingent consideration in a business combination
IFRS 5 Amendment (AI 2012-14)
Changes in methods of disposals
IFRS 7 Amendment (AI 2012-14)
Servicing contracts
IFRS 7 Amendment (AI 2012-14) disclosures to condensed interim
IFRS 8 Amendment (AI 2010-12)
Aggregation of operating segments
IFRS 8 Amendment (AI 2010-12)
Reconciliation of the total of the reportable segments' assets to the entity's assets
IFRS 11 Amendment Interests in Joint Operations
Notes to the Financial Statements continued
for the year ended 31 December 2015

Annual Report 2015 Witan Investment Trust plc 71
Financial Statements
Statutory Information
Strategic ReportReport of the D
irectorsC
orporate Governance
Other Inform
ation
The directors do not expect that the adoption of the Standards listed on page 70 will have a material impact on the financial statements of the Group in future periods.
Beyond the information above, it is not practical to provide a reasonable estimate of the effect of these Standards until a detailed review has been completed.
The Group’s activities expose it primarily to the financial risks of changes in market prices, foreign currency exchange rates and interest rates. Derivative transactions which the Company may enter into comprise forward exchange contracts (the purpose of which is to manage currency risks
options on shares held within the portfolio, or on indices appropriate to sections of the portfolio (the purpose of which is to provide protection against falls in the capital values of the holdings) and futures contracts appropriate to sections
of the portfolio (to provide additional market exposure or to provide protection against falls in the capital values of the holdings). The Company may also write options on shares represented in the portfolio where such options are priced attractively relative to the investment managers’ longer-term expectations for the relevant share prices. The Group does not use derivative financial instruments for speculative purposes. Hedge accounting is not used.
The use of financial derivatives is governed by the Group’s policies as approved by the Board, which has set written principles for the use of financial derivatives.
Changes in the fair value of derivative financial instruments are recognised in the Statement of Comprehensive Income as they arise. If capital in nature, the associated change in value is presented as a capital item in the Statement of Comprehensive Income.
2 Investment income2015
£’0002014
£’000
UK dividends from listed investments 19,416 16,160UK special dividends from listed investments 1,124 346
20,540 16,506
Overseas dividends from listed investments 22,396 19,592Overseas special dividends from listed investments 716 128Property income dividends 47 –Scrip dividends from listed investments 1,116 1,200Fixed interest and convertible bonds 1,003 871
25,278 21,791
Total investment income 45,818 38,297
2015£’000
2014£’000
United Kingdom 21,645 17,409North America 6,685 5,958Continental Europe 9,244 7,515Japan 1,666 1,218Asia Pacific (ex Japan) 5,055 4,119
207 389Other 1,316 1,689
Total investment income 45,818 38,297

Witan Investment Trust plc Annual Report 201572
3 Other income2015
£’0002014
£’000
Deposit interest 127 202Stock lending income 186 140Income from the subsidiary company's third party business 1,147 1,098
1,460 1,440
At 31 December 2015 the total value of securities on loan by the Company for stock lending purposes was £119,797,000
in the form of CREST DBVs (Delivery by Values); the content of CREST
4 Management feesYear ended 31 December 2015 Year ended 31 December 2014
Revenue£’000
Capital£’000
Total£’000
Revenue£’000
Capital£’000
Total£’000
Management fees 1,747 5,241 6,988 1,541 4,625 6,166Performance fees – 4,298 4,298 – 2,998 2,998
1,747 9,539 11,286 1,541 7,623 9,164
A summary of the terms of the management agreements is given on page 17 in the Strategic Report.
5 Other expensesAuditor’s remuneration
2015Revenue
£’000
2014Revenue
£’000
Fees payable to the Company’s auditor and its associates for the audit of the Company’s annual accounts 54 49
– the audit of the Company’s subsidiary 5 5
Total audit fees 59 54
61 32Other services 3 2
Total non-audit fees 64 34
Total fees paid 123 88
45).
Notes to the Financial Statements continued
for the year ended 31 December 2015
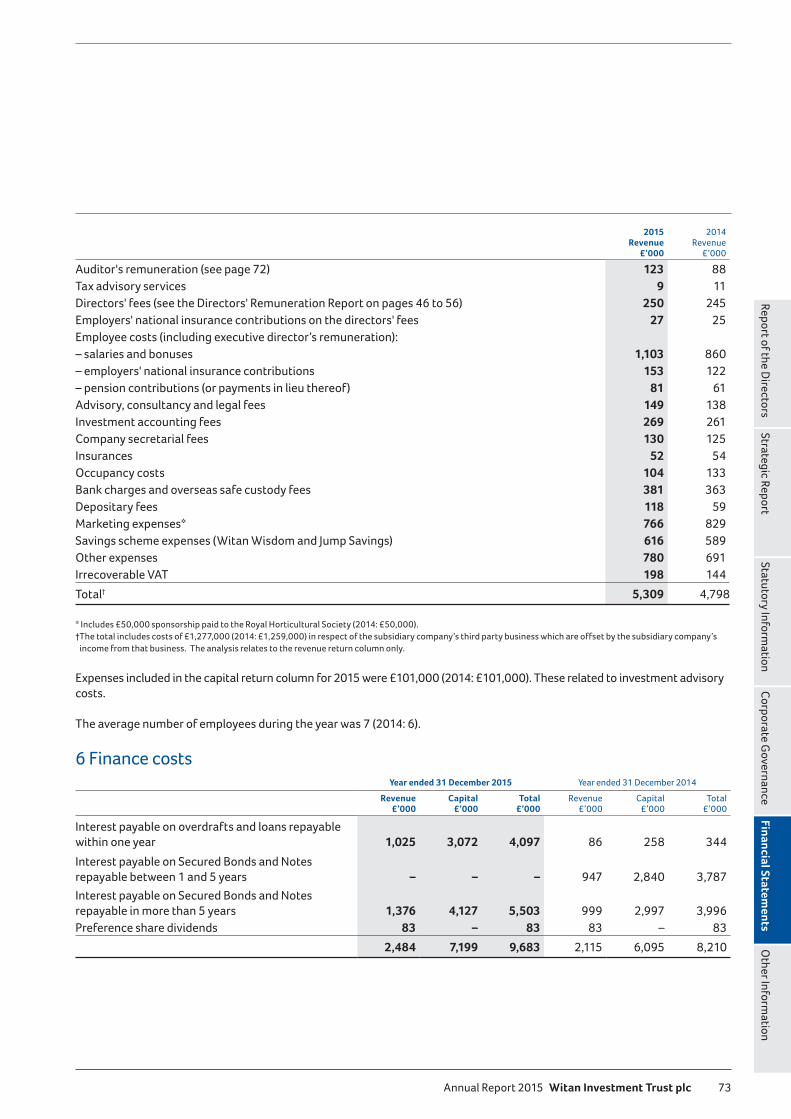
Annual Report 2015 Witan Investment Trust plc 73
Financial Statements
Statutory Information
Strategic ReportReport of the D
irectorsC
orporate Governance
Other Inform
ation
2015 Revenue
£’000
2014 Revenue
£’000
Auditor's remuneration (see page 72) 123 88Tax advisory services 9 11Directors' fees (see the Directors' Remuneration Report on pages 46 to 56) 250 245Employers' national insurance contributions on the directors' fees 27 25
– salaries and bonuses 1,103 860– employers' national insurance contributions 153 122– pension contributions (or payments in lieu thereof) 81 61Advisory, consultancy and legal fees 149 138Investment accounting fees 269 261Company secretarial fees 130 125Insurances 52 54Occupancy costs 104 133Bank charges and overseas safe custody fees 381 363Depositary fees 118 59
766 829616 589
Other expenses 780 691Irrecoverable VAT 198 144
Total† 5,309 4,798
income from that business. The analysis relates to the revenue return column only.
costs.
6 Finance costsYear ended 31 December 2015 Year ended 31 December 2014
Revenue£’000
Capital£’000
Total£’000
Revenue£’000
Capital£’000
Total£’000
Interest payable on overdrafts and loans repayable within one year 1,025 3,072 4,097 86 258 344
Interest payable on Secured Bonds and Notes repayable between 1 and 5 years – – – 947 2,840 3,787
Interest payable on Secured Bonds and Notes repayable in more than 5 years 1,376 4,127 5,503 999 2,997 3,996Preference share dividends 83 – 83 83 – 83
2,484 7,199 9,683 2,115 6,095 8,210

Witan Investment Trust plc Annual Report 201574
7 TaxationYear ended 31 December 2015 Year ended 31 December 2014
Revenue£’000
Capital£’000
Total£’000
Revenue£’000
Capital£’000
Total£’000
– – – – – –
Foreign tax suffered 2,454 – 2,454 2,040 – 2,040Recovery of prior years' withholding tax (381) – (381) (581) – (581)Foreign tax recoverable (294) – (294) (241) – (241)
Total current tax for the year (see note 7 (b)) 1,779 – 1,779 1,218 – 1,218
The tax assessed for the year is lower than that resulting from applying the effective standard rate of corporation tax in the
Year ended 31 December 2015 Year ended 31 December 2014
Revenue£’000
Capital£’000
Total£’000
Revenue£’000
Capital£’000
Total£’000
Net profit on ordinary activities before taxation 37,738 47,724 85,462 31,283 65,254 96,5377,642 9,664 17,306 6,726 14,030 20,756
Non-taxable UK dividends (4,159) – (4,159) (3,549) – (3,549)Non-taxable overseas dividends (4,907) – (4,907) (4,388) – (4,388)
2,148 – 2,148 1,799 – 1,799Recovery of prior years' withholding tax (381) – (381) (581) – (581)Non-taxable gains on investments held at fair value through profit or loss – (13,074) (13,074) – (17,001) (17,001)Excess management expenses not utilised in year 3,089 – 3,089 2,665 – 2,665Unused loan relationship deficits for the year 1,717 – 1,717 1,499 – 1,499Preference dividends not deductible in determining taxable profit
17 – 17 18 – 18
Capitalised expenses (3,410) 3,410 – (2,971) 2,971 –Disallowable expenses 23 – 23 – – –
Current tax charge 1,779 – 1,779 1,218 – 1,218
approval in the foreseeable future, the Company has not provided deferred tax on any capital gains and losses arising on the revaluation or disposal of investments.
No provision has been made for deferred tax on income outstanding at the end of the year as this will be covered by
unrelieved loan relationship deficits and eligible unrelieved foreign tax.
It is unlikely that the Company will obtain relief for these in the future so no deferred tax asset has been recognised.
Notes to the Financial Statements continued
for the year ended 31 December 2015

Annual Report 2015 Witan Investment Trust plc 75
Financial Statements
Statutory Information
Strategic ReportReport of the D
irectorsC
orporate Governance
Other Inform
ation
8 Dividends2015
£’0002014
£’000
Amounts recognised as distributions to equity holders in the year:
per ordinary share 8,727 8,519
per ordinary share 7,450 6,815
share 7,550 6,815
per ordinary share 7,670 6,815Refund of unclaimed dividends (24) (17)
31,373 28,947
Fourth interim dividend for the year ended 31 December 2015 of 5.45 10,895 8,727
1158 of the Corporation Tax Act 2010 are considered.
2015£’000
2014£’000
Revenue profits available for distribution 35,959 30,065(7,450) (6,815)
per ordinary share
(7,550) (6,815)
(7,670) (6,815)Fourth interim dividend for the year ended 31 December 2015 of 5.45 (10,895) (8,727)Revenue retained for the year 2,394 893
9 Earnings per ordinary share
year.
The earnings per ordinary share figure detailed above can be further analysed between revenue and capital, as below. The Company has no securities in issue that could dilute the return per ordinary share. Therefore the basic and diluted earnings per ordinary share are the same.
2015£’000
2014£’000
Net revenue profit 35,959 30,065Net capital profit 47,724 65,254
Net total profit 83,683 95,319
194,455,343 189,302,044

Witan Investment Trust plc Annual Report 201576
9 Earnings per ordinary share continued2015
Pence2014
Pence
Revenue earnings per ordinary share 18.49 15.88 Capital earnings per ordinary share 24.54 34.47
Total earnings per ordinary share 43.03 50.35
10 Investments held at fair value through profit or loss
2015 2014
Group£’000
Company£’000
Group£’000
Company£’000
732,292 732,292 667,393 667,393976,436 976,436 884,885 884,885
Investment in subsidiary undertaking – 1,508 – 1,194
1,708,728 1,710,236 1,552,278 1,553,472
Valuation 31 December
2014£’000
Purchases£’000
Sales£’000
Investmentgains/(losses)
£’000
Valuation31 December
2015£’000
Cost31 December
2015£’000
United Kingdom 665,728 218,464 181,859 29,959 732,292 625,467North America 394,169 148,166 138,113 38,908 443,130 343,263Continental Europe 228,407 86,515 70,929 17,903 261,896 227,833Japan 73,232 27,007 15,936 (9,422) 74,881 64,581Asia Pacific (ex Japan) 161,429 63,284 39,603 (10,796) 174,314 176,753
13,704 1,648 9 (6,675) 8,668 15,119Other 15,609 – 5,055 2,993 13,547 17,624
1,552,278 545,084 451,504 62,870 1,708,728 1,470,640
The above figures do not include the gains/losses on futures positions.
2015£’000
2014£’000
Realised gains on sales of investments 86,781 63,230Realised gain on futures 1,048 6,413Movement in investment holding gains (23,911) 12,633Movement in unrealised gain on futures 868 (2,324)
(223) (879)
64,563 79,073
Notes to the Financial Statements continued
for the year ended 31 December 2015

Annual Report 2015 Witan Investment Trust plc 77
Financial Statements
Statutory Information
Strategic ReportReport of the D
irectorsC
orporate Governance
Other Inform
ation
(iv) Derivatives
Contract
Position long
Settlement value £’000
Nominal exposure
£’000
Unrealised gain/(loss)
£’000
FTSE Index Future 380 23,187 23,553 366MSCI Index Future 500 13,477 13,357 (120)
36,664 36,910 246
The realised gain on the closing of futures positions during the year was £1,048,000.
Open future contracts as at year ended 31 December 2014
Contract
Position long
Settlement value
£’000
Nominal exposure
£’000
Unrealised loss
£’000
Nikkei Index Future 750 35,344 34,722 (622)
During the period realised gains on closing of futures positions was £6,413,000.
(v) Substantial share interestsThe Company has notified interests in 3% or more of the voting rights of three of the investee companies, all of which are closed-ended investment funds. However, the Board does not consider any of the Company’s investments to be individually material in the context of these financial statements.
It is the Company’s stated policy to invest no more than 15% of its gross assets in other listed investment companies (including listed investment trusts).
11 Other receivables2015 2014
Group£’000
Company£’000
Group£’000
Company£’000
Sales for future settlement 155 155 676 676Unrealised gain on derivatives designated as held at fair value through profit
366 366 – –Taxation recoverable 945 945 1,082 1,082Intercompany account – 1,976 – 715Prepayments and accrued income 3,077 3,077 2,476 2,476Share issue proceeds receivable – – 1,929 1,929Other debtors 2,712 28 768 44
7,255 6,547 6,931 6,922
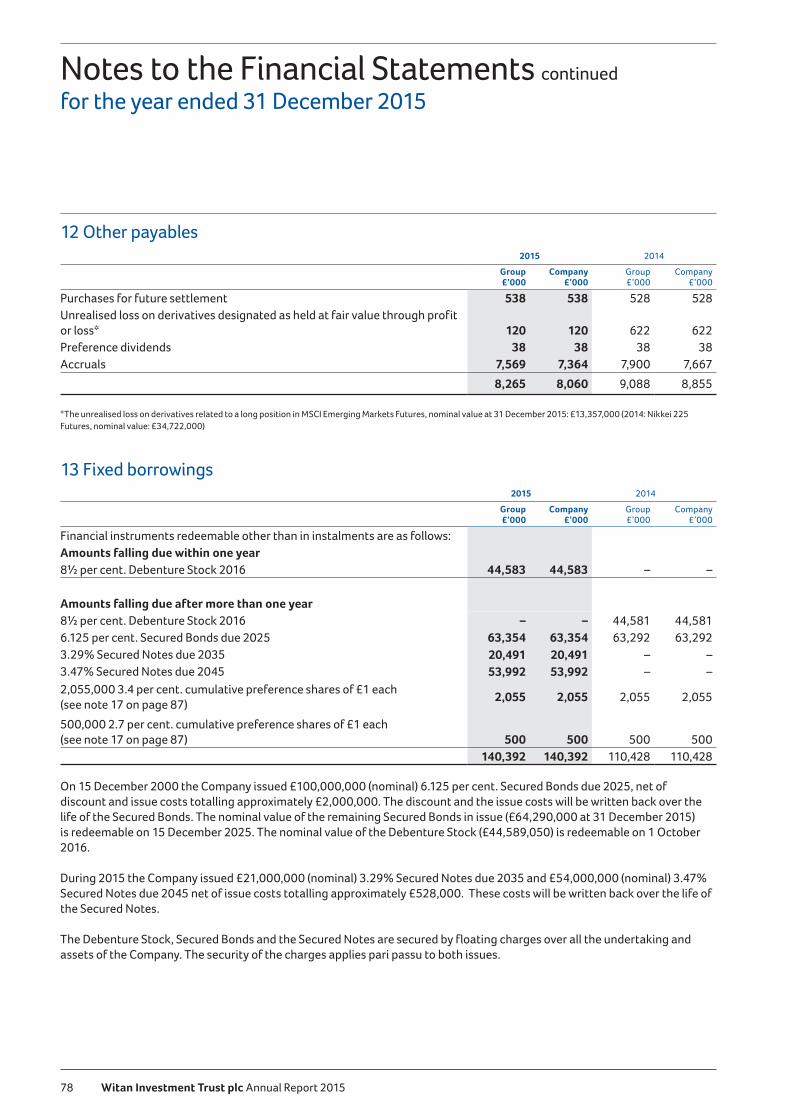
Witan Investment Trust plc Annual Report 201578
12 Other payables2015 2014
Group£’000
Company£’000
Group£’000
Company£’000
Purchases for future settlement 538 538 528 528Unrealised loss on derivatives designated as held at fair value through profit
120 120 622 622Preference dividends 38 38 38 38Accruals 7,569 7,364 7,900 7,667
8,265 8,060 9,088 8,855
13 Fixed borrowings2015 2014
Group£’000
Company£’000
Group£’000
Company£’000
Amounts one year8½ per cent. Debenture Stock 2016 44,583 44,583 – –
8½ per cent. Debenture Stock 2016 – – 44,581 44,5816.125 per cent. Secured Bonds due 2025 63,354 63,354 63,292 63,2923.29% Secured Notes due 2035 20,491 20,491 – –3.47% Secured Notes due 2045 53,992 53,992 – –2,055,000 3.4 per cent. cumulative preference shares of £1 each (see note 17 on page 87)
2,055 2,055 2,055 2,055
500,000 2.7 per cent. cumulative preference shares of £1 each (see note 17 on page 87) 500 500 500 500
140,392 140,392 110,428 110,428
On 15 December 2000 the Company issued £100,000,000 (nominal) 6.125 per cent. Secured Bonds due 2025, net of discount and issue costs totalling approximately £2,000,000. The discount and the issue costs will be written back over the life of the Secured Bonds. The nominal value of the remaining Secured Bonds in issue (£64,290,000 at 31 December 2015) is redeemable on 15 December 2025. The nominal value of the Debenture Stock (£44,589,050) is redeemable on 1 October 2016.
During 2015 the Company issued £21,000,000 (nominal) 3.29% Secured Notes due 2035 and £54,000,000 (nominal) 3.47% Secured Notes due 2045 net of issue costs totalling approximately £528,000. These costs will be written back over the life of the Secured Notes.
The Debenture Stock, Secured Bonds and the Secured Notes are secured by floating charges over all the undertaking and assets of the Company. The security of the charges applies pari passu to both issues.
Notes to the Financial Statements continued
for the year ended 31 December 2015

Annual Report 2015 Witan Investment Trust plc 79
Financial Statements
Statutory Information
Strategic ReportReport of the D
irectorsC
orporate Governance
Other Inform
ation
14 Financial instrumentsRisk management policies and procedures
that could result in either a reduction in the Group’s net assets or a reduction in the profits available for distribution by way of dividends.
directors’ approach to the management of them, are set out below.
have not changed from the previous accounting period, although in some instances additional resources have been allocated to some areas.
14.1 Market riskThe fair value or future cash flows of a financial instrument held by the Group may fluctuate due to changes in market prices.
Board reviews and agrees policies for managing these risks, which policies have remained substantially unchanged from those applying in the year ended 31 December 2014. The investment managers assess the exposure to market risk when making each investment decision and monitor the overall level of market risk on the whole of their investment portfolios on an ongoing basis.
14.2 Price riskPrice risks (i.e. changes in market prices other than those arising from interest rate risk or currency risk) may affect the value
Management of the riskThe Board manages the risks inherent in the investment portfolios by regularly reviewing relevant information from the investment managers. The Board meets regularly and at each meeting reviews investment performance. The Board monitors the managers’ compliance with their mandates and also whether each mandate and asset allocation is compatible with
2015£’000
2014£’000
Investments held at fair value through profit or loss 1,708,728 1,552,278Nominal futures exposure (long position) 36,910 34,722
Concentration of exposure to price risksAn analysis of the Group’s investment portfolio is shown on page 27. This shows that the greater geographical weighting is to UK companies, with significant exposure also to North America, Asia and Continental Europe. Accordingly, there is a concentration of exposure to those regions, although an investment’s country of domicile or of listing does not necessarily
Price risk sensitivityThe following table illustrates the sensitivity of the profit after taxation for the year and the value of the shareholders’
futures contracts). This level of change is considered to be reasonably possible based on observation of market conditions
balance sheet date, with all other variables held constant. The results of these example calculations are significant but not

Witan Investment Trust plc Annual Report 201580
14 Financial instruments continued2015 2014
Increase
£’000
Decrease
£’000
Increasein fair value
£’000
Decreasein fair value
£’000
Income statement – profit after taxRevenue return – – – – Capital return – investments 256,309 (256,309) 232,842 (232,842)Capital return – futures 5,537 (5,537) 5,208 (5,208)
261,846 (261,846) 238,050 (238,050)
14.3 Currency riskA proportion of the Group’s assets, liabilities and income is denominated in currencies other than sterling (the Group’s
the sterling value of those items.
Management of the riskThe investment managers monitor their exposure to currencies as part of their normal investment processes. The Board receives a monthly report on the currency exposures of the entire fund.
Income denominated in foreign currencies is converted into sterling upon receipt. The Group does not normally use financial instruments to mitigate the currency exposure in the period between the time that income is included in the financial statements and its receipt.
Foreign currency exposureThe fair values of the Group’s monetary items that have foreign currency exposure at 31 December are shown below.
included separately in the analysis so as to show the overall level of exposure.
2015US$
£’000Euro
£’000Yen
£’000Other£’000
Receivables (due from brokers, dividends and other income receivable) 581 310 438 875 Cash at bank and on deposit 2,849 1,298 – 147 Payables (due to brokers, accruals and other creditors) (1,081) – – – Payables (unrealised loss on derivatives designated as held at fair value through profit or loss) (120) – – – Total foreign currency exposure on net monetary items 2,229 1,608 438 1,022
460,610 171,963 76,686 253,128
Total net foreign currency exposure 462,839 173,571 77,124 254,150
2014US$
£’000Euro
£’000Yen
£’000Other£’000
Receivables (due from brokers, dividends and other income receivable) 1,103 247 180 888 Cash at bank and on deposit 2,312 1,333 3,522 39 Payables (due to brokers, accruals and other creditors) (199) – – (43)Payables (unrealised loss on derivatives designated as held at fair value through profit or loss) – – (622) – Total foreign currency exposure on net monetary items 3,216 1,580 3,080 884
397,012 153,429 50,448 299,934
Total net foreign currency exposure 400,228 155,009 53,528 300,818
The above amounts are not necessarily representative of the exposure to risk during the year as levels of monetary foreign currency exposure change significantly throughout the year.
Notes to the Financial Statements continued
for the year ended 31 December 2015

Annual Report 2015 Witan Investment Trust plc 81
Financial Statements
Statutory Information
Strategic ReportReport of the D
irectorsC
orporate Governance
Other Inform
ation
Foreign currency sensitivity
monetary financial assets and financial liabilities and the exchange rates for the £/US dollar, £/Euro and £/Japanese yen. The
being invested overseas.
£/US dollar +/- 15% (2014£/Euro +/- 15% (2014£/Japanese yen +/- 15% (2014
The sensitivity analysis is based on the Group’s monetary foreign currency financial instruments held at the balance sheet date and takes account of any forward foreign exchange contracts that offset the effects of changes in currency exchange rates.
2015 2014
US$£’000
Euro£’000
Yen£’000
US$£’000
Euro£’000
Yen£’000
Income statement - profit after taxRevenue return 1,649 931 240 1,412 767 182 Capital return 79,784 31,107 13,533 70,061 25,678 8,903
Change to the profit after tax 81,433 32,038 13,773 71,473 26,445 9,085
Change to the shareholders' funds 81,433 32,038 13,773 71,473 26,445 9,085
2015 2014
US$£’000
Euro£’000
Yen£’000
US$£’000
Euro£’000
Yen£’000
Income statement - profit after taxRevenue return (1,219) (688) (178) (1,044) (567) (135)Capital return (58,939) (22,992) (10,002) (51,784) (18,979) (6,580)
Change to the profit after tax (60,158) (23,680) (10,180) (52,828) (19,546) (6,715)
Change to the shareholders' funds (60,158) (23,680) (10,180) (52,828) (19,546) (6,715)
In the opinion of the directors, neither of the above sensitivity analyses is representative of the year as a whole since the level
14.4 Interest rate riskInterest rate movements may affect the level of income receivable from fixed interest securities and cash at bank and on deposit.
Management of the riskThe possible effects on fair value and cash flows that could arise as a result of changes in interest rates are taken into account when making investment decisions.
The Group holds cash balances, partly to meet payments as they fall due but also when appropriate to offset the long-term borrowings that it has in place.
The Group finances part of its activities through preference shares that do not have redemption dates and through debenture stock and secured bonds that were issued as part of the Company’s planned gearing.

Witan Investment Trust plc Annual Report 201582
14 Financial instruments continuedInterest rate exposureThe exposure at 31 December 2015
>
>
minus variable rate borrowing.
bonds.
borrowing.
>4
> the finance charge on the preference shares is at a weighted average interest rate of 3.3% (2014
> the finance charge on the debenture stock is at a weighted average interest rate of 8.5% (2014
> the finance charge on the secured bonds is at a weighted average interest rate of 6.125% (2014
> the finance charge on the secured notes is at a weighted average interest rate of 3.41% for an average period of
The above year end amounts are not representative of the exposure to interest rates during the year, as the level of exposure changes as investments are made in fixed interest securities, long-term debt is partially redeemed and as the level of cash balances varies during the year. In the context of the Group’s balance sheet, the exposure to interest rate risk is not considered to be material.
Interest rate sensitivityBased on the Group’s monetary financial instruments at each balance sheet date, an increase or decrease of 200 basis points
This level of change is considered to be reasonably possible based on observation of current market conditions. This is not representative of the year as a whole, since the exposure changes as investments are made. In the context of the Group’s balance sheet, the outcome is not considered to be material.
14.5 Liquidity riskThis is the risk that the Group will encounter difficulty in meeting obligations associated with its financial liabilities.
Management of the risk
securities that are readily realisable. The Group has borrowed £44,587,000 by its issue of 8½ per cent Debenture Stock 2016 and £63,174,000 by its issue in 2000 of 6.125 per cent Secured Bonds due 2025. During the year, the Group issued 3.47% and 3.29% Secured Notes for £54,000,000 and £21,000,000 respectively. The Group is able to draw short-term borrowings
50,000,000 from its secured and committed multi-currency borrowing facility with BNP December 2016). £3,000,000 was drawn down under the facility at 31 December 2015.
The Board gives guidance to the investment managers as to the maximum amount of the Company’s resources that should be invested in any one company. The policy is that the Group should remain fully invested in normal market conditions.
Notes to the Financial Statements continued
for the year ended 31 December 2015

Annual Report 2015 Witan Investment Trust plc 83
Financial Statements
Statutory Information
Strategic ReportReport of the D
irectorsC
orporate Governance
Other Inform
ation
Liquidity risk exposureThe remaining contractual maturities of the financial liabilities at 31 December 2015, based on the earliest date on which
2015 2014
Within1 year£’000
1 and 5 years£’000
More than5 years
£’0001 year£’000
Between1 and 5 years
£’000
More than5 years
£’000
47,432 – – 3,790 47,432 – 3,938 15,751 83,806 3,938 15,751 87,744 2,565 10,259 130,712 – – –
Preference shares† 83 332 2,555 83 332 2,555 Other creditors and accruals 8,263 – – 9,078 – – Bank loan and interest payable 3,003 – – 45,043 – –
65,284 26,342 217,073 61,932 63,515 90,299
† The figures in the ‘More than 5 years’ columns do not include the ongoing annual finance cost of £83,000.
14.6 Credit riskThe failure of the counterparty to a transaction to discharge its obligations under that transaction could result in the Group suffering a loss.
Management of the risk
>
> transactions involving derivatives are entered into only with investment banks, the credit rating of which is taken into account so as to minimise the risk to the Group of default;
> investment transactions are carried out with a large number of brokers, whose credit standard is reviewed periodically by the investment managers, and limits are set on the amount that may be due from any one broker;
> stock lending transactions are carried out with a number of approved counterparties, the credit ratings of which are reviewed periodically, and limits are set on the amount that may be sent to any one counterparty. Other than stock lending, none of the Company’s financial assets or liabilities is secured by collateral or other credit enhancements;
>
None of the Group’s financial liabilities is past its due date or impaired.
Credit risk exposureThe table below summarises the credit risk exposure of the Group as at the year end.
2015£’000
2014£’000
Fixed interest securities 25,312 34,137Cash 57,587 46,554
Sales for future settlement 155 676Unrealised gain on derivative designated as held at fair value through profit or loss 366 –Taxation recoverable 945 1,082Accrued income 3,077 2,476Other debtors 2,712 2,697
90,154 87,622

Witan Investment Trust plc Annual Report 201584
14 Financial instruments continued
Except for those financial liabilities measured at amortised cost that are shown below, the financial assets and financial liabilities are either carried in the balance sheet at their fair value (investments and derivatives) or the balance sheet amount is a reasonable approximation of fair value (amounts due from brokers, dividends and interest receivable, amounts due to brokers, accruals, cash at bank and bank overdrafts).
2015 2014
Fairvalue£’000
Balancesheet
amount£’000
Fairvalue
£’000
Balancesheet
amount£’000
Non current liabilitiesPreference shares 1,399 2,555 1,384 2,555 Debenture stock 46,765 44,583 49,471 44,581 Secured Bonds 78,198 63,354 80,659 63,292 Secured Notes 73,009 74,483 – –
199,371 184,975 131,514 110,428
or, in the case of the Secured Notes, calculating a present value by using a discount rate which reflects the yield on a UK gilt of similar maturity plus a credit spread of 1.15%.
Fair value hierarchy disclosures
The table below sets out fair value measurements using the IFRS 7 fair value hierarchy.
At 31 December 2015Level 1
£’000Level 2
£’000Level 3
£’000Total
£’000
1,640,781 – – 1,640,781 Investments in other funds – 68,198 – 68,198 Derivatives (nominal exposure of £36,910,000) 246 – – 246
Total 1,641,027 68,198 – 1,709,225
At 31 December 2014 £’000 £’000 £’000Total
£’000
1,444,457 – – 1,444,457 Investments in other funds – 107,821 – 107,821 Derivatives (nominal exposure of £34,722,000) (622) – – (622)
Total 1,443,835 107,821 – 1,551,656
Categorisation within the hierarchy has been determined on the basis of the lowest level input that is significant to the fair
Notes to the Financial Statements continued
for the year ended 31 December 2015

Annual Report 2015 Witan Investment Trust plc 85
Financial Statements
Statutory Information
Strategic ReportReport of the D
irectorsC
orporate Governance
Other Inform
ation
Level 2 Financial assets
5 or 31 December 2014.
Capital management
> to ensure that it will be able to continue as a going concern; and
>and debt.
£1,441,247,000).
Gearing
The Group’s policy is to manage the effective gearing in the portfolio to be below 20%, other than temporarily in exceptional circumstances. Effective gearing is defined as the difference between shareholders’ funds and the total market value of the investments (including the nominal value (effective underlying exposure) of futures positions which were £36,910,000 long
2015£’000
2014£’000
Value of investments per the Balance Sheet 1,708,728 1,552,278
Nominal exposure of futures 36,910 34,722
1,745,638 1,587,000
Shareholders' funds per the Balance Sheet (A) 1,577,330 1,441,247Excess of gross value of investments over shareholders’ funds (B) 168,308 145,753Effective gearing (B as a percentage of A) 10.7% 10.1%
> the planned level of gearing, which takes into account the Chief Executive Officer’s view on the market;
>and the share price (ie the level of share price discount or premium); and
>

Witan Investment Trust plc Annual Report 201586
14 Financial instruments continued
> the terms of issue of the Company’s Debenture stock and Secured Brespect of borrowings, measured in accordance with the policies used to prepare the annual financial statements, not
> as a public company, the Company has a minimum issued share capital of £50,000; and
> in order to be able to pay dividends out of profits available for distribution by way of dividends, the Company has to be able to meet one of the two capital restriction tests imposed on investment companies by company law.
15 Called up share capital Group andCompany
2015£’000
Group andCompany
2014£’000
50,018 47,390
at a cost of £363,000 and 301,000 shares issued for £2,294,000).
16 Share premium account and reserves
Sharepremiumaccount
£’000
Capitalredemption
reserve£’000
Capitalreserve
arising oninvestments
sold£’000
Capitalreserve
arising onrevaluation
investmentsheld
£’000
Revenuereserve
£’000
Group
At 1 January 2015 18,106 46,498 1,012,812 261,373 55,068Net movement on investments – – 87,829 (23,043) –Net movement on foreign exchange – – (223) – –Expenses and interest payable charged to capital net of tax relief – – (16,839) – –Issue of ordinary shares to market 81,145 – – – –Profit for the year – – – – 35,959Ordinary dividends paid – – – – (31,373)
At 31 December 2015 99,251 46,498 1,083,579 238,330 59,654
Company
At 1 January 2015 18,106 46,498 1,012,812 261,667 54,774Net movement on investments – – 87,829 (22,729) –Net movement on foreign exchange – – (223) – –Expenses and interest payable charged to capital net of tax relief – – (16,839) – –Issue of ordinary shares to market 81,145 – – – –Profit for the year – – – – 35,645Ordinary dividends paid – – – – (31,373)
At 31 December 2015 99,251 46,498 1,083,579 238,938 59,046
In accordance with the Company’s Articles of Association, dividends may only be paid out of current period revenue or revenue reserves.
Notes to the Financial Statements continued
for the year ended 31 December 2015

Annual Report 2015 Witan Investment Trust plc 87
Financial Statements
Statutory Information
Strategic ReportReport of the D
irectorsC
orporate Governance
Other Inform
ation
17 Preference shares
Group andCompany
2015£’000
Group andCompany
2014£’000
2,055,000 3.4 per cent. cumulative preference shares of £1 each 2,055 2,055500,000 2.7 per cent. cumulative preference shares of £1 each 500 500
2,555 2,555
The 3.4 per cent. and 2.7 per cent. cumulative preference shares constitute a single class and confer the right, in priority to
(i) to receive a fixed cumulative preferential dividend at the respective rates (exclusive of tax credit thereon) of 3.4 per cent. and 2.7 per cent. per annum, such dividend being payable half-yearly on 15 January and 15 July in each year in respect of the 3.4 per cent. cumulative preference shares, and on 1 February and 1 August in each year in respect of the 2.7 per cent. cumulative preference shares; and
(ii) to receive repayment of capital at par in a winding up of the Company (but do not confer any further right to participate in profits or assets).
The preference shareholders are entitled to receive notices of general meetings of the Company but are not entitled to attend
Company set out in its Articles of Association).
In the event of a poll at a general meeting of the Company, every member of the Company who is present in person or by proxy and who is entitled to vote thereat, whether an ordinary shareholder or, in the circumstances outlined above, a preference shareholder, has one vote for every £1 nominal value of shares registered in their name. Accordingly, on a poll each ordinary shareholder has one vote for every four shares held.
18 Net asset value per ordinary shareThe net asset value per ordinary share of
£’000
Total net assets at 1 January 2015 1,441,247Total profit for the year 83,683Dividends paid in the year on the ordinary shares (see note 8) (31,373)Issue of ordinary shares to market 83,773
Net assets attributable to the ordinary shares at 31 December 2015 1,577,330
An alternative net asset value per ordinary share can be calculated by deducting from the total assets less current liabilities of the Company the preference shares, the debenture stock and the Secured Bonds and Notes at their market (or fair) values rather than at their par (or book) values. Details of the alternative values are set out in note 14.7. The net asset value per

Witan Investment Trust plc Annual Report 201588
Notes to the Financial Statements continued
for the year ended 31 December 2015
19 Notes to the cash flow statementPurchases and sales of investments are considered to be operating activities of the Company, given its purpose, rather than investing activities. The cash flows associated with these activities are presented below.
Group andCompany
2015£’000
Group andCompany
2014£’000
Proceeds on disposal of fair value through profit or loss investments 452,025 352,950Purchases of fair value through profit or loss investments (543,958) (391,115)
(91,933) (38,165)
20 Capital commitments and contingent liabilitiesAt 31 December 2015 and 31 December 2014 there were no capital commitments in respect of securities not fully paid up and
five years in October 2015.
21 Operating lease arrangements2015
£’0002014
£’000
Minimum lease payments under operating leases recognised for the year 49 49
At the balance sheet date, the Group had outstanding commitments for the future minimum lease payments under non-
2015£’000
2014£’000
73 –
In the second to fifth years inclusive 219 –
The operating lease payments represent rentals payable by the Group for its office property.
The lease was re-negotiated during 2015 for a further term of five years and to include additional office space.
22 Subsidiary undertaking
the United Kingdom.

Annual Report 2015 Witan Investment Trust plc 89
Financial Statements
Statutory Information
Strategic ReportReport of the D
irectorsC
orporate Governance
Other Inform
ation
23 Related party transactions disclosuresBalances and transactions between the Company and its subsidiary, which are related parties, amounting to £452,000 have been eliminated on consolidation and are not disclosed in this note.
Remuneration of key management personnelThe remuneration of the directors, who are the key management personnel of the company for each of the relevant categories specified in IAS 24 Related Party Disclosures is provided in the audited part of the Directors’ Remuneration Report on pages 47 to 48.
Directors’ transactions
24 Segment reporting
identified on the basis of internal reports about components of the Group that are reviewed regularly by the Chief Executive Officer and that are used to allocate resources to the segments and to assess their performance. The identification of the Group’s reportable segments did not change as a result of the adoption of IFRS 8.
Geographical segmentsGeographical segments are considered to be the primary reporting segment. An analysis of investment income by geographical segment is set out in note 2 on page 71. Analyses of expenses by geographical segment and of profit by geographical segment have not been given as it is not possible to prepare such information in a meaningful way. An analysis of the investments by geographical segment is set out in note 10 on page 76. Analyses of the remaining assets and liabilities by geographical region have not been given as either it is not possible to prepare such information in a meaningful way or the results are not considered to be significant.
Business segments
in the accounts of that company; and (ii) the provision of alternative investment fund manager, executive and marketing
31 December 2015 31 December 2014
Investmenttrust
£’000
Managementservices
£’000Total
£’000
Investment trust
£’000
Management services
£’000Total
£’000
Revenue 46,127 1,151 47,278 38,635 1,102 39,737Interest expense 9,683 – 9,683 8,210 – 8,210Net result 83,683 – 83,683 95,319 – 95,319Carrying amount of assets 1,575,822 1,508 1,577,330 1,440,053 1,194 1,441,247
Since the year end, the Board has declared a fourth interim dividend in respect of the year ended 31 December 2015 of 5.45p per ordinary share (see also page 4 and note 8 on page 75).
Since the year end, 192,646 ordinary shares of 25p have been bought back.

Witan Investment Trust plc Annual Report 201590
Historical Record(unaudited)
Debt at fair value Debt at par value
Market price per ordinary
share in pence
Net assetvalue per
ordinary sharein pence(b)
Share price(discount)/
premium%(b)
Net assetvalue per
ordinary sharein pence(c)
Share pricediscount
%(c)
Earnings per ordinary
share in pence
Dividendsper ordinary
share in pence
31 December 2005 414.0 458.9 (9.8) 469.5(a) (11.8) 8.96(a) 8.8
31 December 2006 454.5 508.4 (10.6) 517.1 (12.1) 10.24 9.2
31 December 2007 478.5 537.9 (11.0) 545.7 (12.3) 11.08 9.9
31 December 2008 351.0 400.3 (12.3) 410.1 (14.4) 11.60 10.2
31 December 2009 444.6 497.0 (10.5) 502.7 (11.6) 10.63 10.5
31 December 2010 516.5 578.1 (10.7) 584.4 (11.6) 9.45 10.9
31 December 2011 450.0 503.7 (10.7) 516.9 (12.9) 13.27 12.0
31 December 2012 503.0 568.9 (11.6) 581.8 (13.5) 14.50 13.2
31 December 2013 669.0 717.6 (6.8) 725.2 (7.7) 15.44 14.4
31 December 2014 753.5 749.2 0.6 760.3 (0.9) 15.88 15.4
31 December 2015 780.0 781.2 (0.2)(d) 788.4 (1.1) 18.49 17.0
(a) The figure for 2005 has been calculated in accordance with International Financial Reporting Standards (‘IFRSs’) as adopted by the European Union. (b) The net asset value per ordinary share is calculated by deducting from the total assets less current liabilities of the Group the fixed borrowings at their fair (or
market) values. The share price discount shown reflects this calculation. (c) The net asset value per ordinary share is calculated by deducting from the total assets less current liabilities of the Group the fixed borrowings at their par (not
their market) values. The share price discount shown reflects this calculation.
Many companies have become aware that their shareholders have received unsolicited phone calls or correspondence concerning investment matters. These are typically from overseas based ‘brokers’ who target UK shareholders offering to sell them what often turn out to be worthless or high risk shares in US or UK investments. They can be very persistent and extremely persuasive. Shareholders are therefore advised to be very wary of any unsolicited advice, offers to buy shares at a discount or offers of free company reports.
Please note that it is very unlikely that either the Company or the Company’s Registrar, Computershare Investor Services
documentation already circulated to shareholders and never in respect of investment ‘advice’.
If you are in any doubt about the veracity of an unsolicited phone call, please call either the Company Secretary or the Registrar at the numbers provided on page 92.

Annual Report 2015 Witan Investment Trust plc 91
Financial Statements
Statutory Information
Strategic ReportReport of the D
irectorsC
orporate Governance
Other Inform
ation
stockbroker but there is a variety of other ways to invest in
isdom and Jump Savings. Advisers
number of dedicated platforms. These include Ascentric, Nucleus, Seven Investment Management and Transact. A growing number of platforms offer investment trusts directly to investors including Alliance Trust Savings, Hargreaves
Witan Wisdom
than government stamp duty, for regular savings or dividend
of £15.
The Witan Wisdom ISA is a stocks and shares ISA that
wrapper. Investors have an annual ISA allowance of up to £15,240 for both the 2015/16 and 2016/17 tax years. The
£2,000, with the regular savings minimum being £100 per
and after transfer.
The Witan Wisdom Share Plan is our straightforward, low-cost savings scheme. The minimum lump sum investment is £500, and the minimum regular contribution is £50 per
Jump gives parents, grandparents and other adults the
savings plan has a minimum lump sum investment set at £250 and regular contributions can be made from £50 per
Junior ISA – Is a tax efficient wrapper available to children born before 1 September 2002 or after 3 January 2012, or
can only be opened by the parent though others can add to it. It currently has an annual subscription limit of £4,080 for both the 2015/16 and 2016/17 tax years. You can open a Jump Junior ISA with a minimum lump sum investment of
Jump Child Trust Fund Fund (CTF) is a tax efficient savings vehicle with an annual limit of £4,080 each year (measured by the child’s birthday). Each child born in the UK from 1 September 2002 up to and including 2 January 2012 was eligible for a CTF. You can transfer existing CTFs to a Jump CTF or directly into a Jump
confirmed, you will be able to transfer existing CTFs to the
Jump Savings Plan – the Jump Savings Plan offers greater flexibility than the Junior ISA or Child Trust Fund in terms of the limits, access and control of the investment. It can also be opened by grandparents, relatives and other family friends. You can open a Jump Savings Plan with a lump
Shareholders who hold their investment via Jump are charged a single flat annual fee of £31.60 + VAT.
Given the flat rate annual fees for Jump, the cost is high for the minimum subscription levels to our plans and investors should consider carefully the suitability for them if they do not plan to add to the account.
Brochures and applications for all of our products are available by calling 0800 082 81 80 or online via www.witan.com.
the address details can be found on page 92. To keep up to
plc please visit www.witan.com/stayintouch to provide us with your email address.
are reminded that past performance is not a guide to future performance and the value of investments and the income from them may go down as well as up and investors may not get back the amount originally invested. Please note that tax assumptions may change if the law changes, and the value of tax relief (if any) will depend upon your individual circumstances. Investors should consult their own tax advisers in order to understand any
is authorised and regulated by the Financial Conduct Authority.
improve customer service.
compounded.
with effect from 6 April 2017 and for Jump shareholders with effect from 6 April 2018. You can select to pay the AMF by direct debit thus avoiding the possibility of selling shares if the AMF cannot be recovered from cash held at the time of dividend reinvestment.

Witan Investment Trust plc Annual Report 201592
Freephone:0800 082 8180
E-mail: [email protected]
Post:
PO Box 10550ChelmsfordCM99 2BA
You can follow the progress of your investment through the
press stock exchange listings under ‘Investment Trusts’ or
website (www.witan.com).
0974406.
DividendA fourth interim dividend of 5.45p per share has been declared, payable on 1 April 2016. The record date for the dividend was 4 March 2016 and the ex-dividend date for the dividend was 3 March 2016 (see pages 4 and 30).
From April 2016 dividend tax credits will be replaced by an annual £5,000 tax-free allowance on dividend income across an individual’s entire share portfolio. Above this amount, individuals will pay tax on their dividend income at a rate dependent on their income tax bracket and personal circumstances. The Company will continue to provide registered shareholders with a confirmation of the dividends it has paid
received when calculating and reporting total dividend income received. It is the shareholder’s responsibility to include all dividend income when calculating any tax liability.
Capital Gains TaxThe calculation of the tax on chargeable gains will depend on your personal circumstances. If you are in any doubt about your personal tax position, you are recommended to contact your professional adviser.
Disability ActCopies of this Annual Report and other documents issued by
Secretary. If needed, copies can be made available in a variety of formats, including Braille, audio tape or larger type as appropriate.
You can contact our Registrar, Computershare Investor Services
impaired people who have their own telephone to contact them directly, without the need for an intermediate operator, by
dialling 0370 702 0005. Specially trained operators are available
Alternatively, if you prefer to go through a ‘typetalk’ operator (provided by The Royal National Institute for Deaf People), you should dial 18001 followed by the number you wish to dial.
14 Queen Anne’s Gate
Company Secretary
25 Southampton Buildings
Registered Number
Number 101625.
Custodian, Investment Administrator and DepositaryBNP Paribas Securities Services55 Moorgate
Registrar
The PavilionsBridgwater RoadBristol BS99 6ZZ
3
2 pence per minute from a BT line plus any network extras; calls from other providers, or from mobile phones, may cost more.
Auditor
Chartered Accountants
Solicitors
Exchange HousePrimrose Street
Edinburgh EH2 4DFStockbrokerJ.P. Morgan Cazenove25 Bank Street
The Company conducts its affairs so that its shares can be recommended by independent financial advisers (‘IFAs’) to retail private investors. The shares are excluded from the Financial Conduct Authority’s restrictions which apply to non-mainstream investment products because they are shares in a UK-listed investment trust.
Shareholder Information

Our relationship with the RHS
Witan Investment Trust has enjoyed a fruitful relationship with the Royal Horticultural Society (‘RHS’) for more than 18 years. Over this time, Witan has helped to redevelop a number of new gardens at Wisley including the Walled Garden West, the Herb Garden, the Bowes-Lyon Rose Garden and the Vegetable Garden at Hyde Hall, which is scheduled to open to the public in Spring 2017. In 2016, Witan will sponsor a garden at the RHS Hampton Court Palace Flower Show, which runs from 5 to 10 July. Tickets are available via the RHS website (www.rhs.org.uk). Witan shareholders who hold their shares through Witan Wisdom or Jump Savings, or on the main register, are eligible to apply for a ballot for a ticket that will allow free entry for two adults to any one of the four RHS gardens in the UK.
If you would like to request a ticket then

Printed by Park Communications on FSC®
®