Capital and income growth from active global equity investment · Annual report 2013 Capital and...
92
Annual report 2013 Capital and income growth from active global equity investment
Transcript of Capital and income growth from active global equity investment · Annual report 2013 Capital and...
Annual report 2013
Capital and income growth from active global equity investment
To view the report online
If you would like to view video updates about the Company, please visit:
www.witan.com
Witan is an investment trust which is listed on the London Stock Exchange and was founded in 1909.
markets (principally equities) using a multi-manager approach. The portfolio is
sector and at the individual stock level.
Witan typically uses between 10 and 15
active approaches and styles aims to deliver added value for shareholders while smoothing out the volatility normally associated with
Witan’s objective
Long term growth in income and
investment in global equities

Annual Report 2013 Witan Investment Trust plc 01
Financial Statements
Statutory Information
Strategic ReportReport of the D
irectors C
orporate Governance
Other Inform
ation
Contents
Report of the Directors
02 Financial Highlights 04 Chairman’s and Chief Executive’s
Report
Strategic Report
0 8 Strategic Report 21 Investment Managers 24 Fifty Largest Investments 25 Classi cation of Investments
Statutory Information
26 Board of Directors 28 Directors’ Report
Corporate Governance
32 Corporate Governance Statement 42 Report of the Audit Committee 44 Directors’ Remuneration Report
Financial Statements
55 Statement of Directors’ Responsibilities
56 Independent Auditor’s Report 60 Statement of Comprehensive Income 61 Statements of Changes in Equity 62 Balance Sheets 63 Cash Flow Statements 64 Notes to the Financial Statements
Other Information
86 Historical Record 86 Unsolicited approaches for shares 87 Witan Wisdom and Jump 88 Shareholder Information IBC The Royal Horticultural Society
02
04
Financial highlights
Chairman’s and Chief Executive’s report
Witan’s net asset value total return was 29.4% in 2013
Shareholder Total Return
NAV Total Return
Dividends per Share
+36.7%+29.4%
+9.1%

Witan Investment Trust plc Annual Report 201302
Share price and net asset value (NAV) 2013 2012 % change
Share Price 669.0p 503.0p 33.0
NAV per ordinary share (debt at par value) 725.2p 581.8p 24. 6
NAV per ordinary share (debt at market value) 717. 6p 568.9p 26. 1
Discount (debt at market value) (A) 6.8% 11.6%
Discount (NAV excluding income, debt at market value) (B) 6.1% 10.2%
Financial highlights
NAV total return since introduction of the multi-manager structure (30.09.04) (G)
Corporate key performance indicators
(A) This is the discount to NAV including income. (B) The average discount on this basis in 2013 was 8.3% (2012: 10.7%).(Source: Datastream)
Total return performance 1yr % Return 3yrs % Return 5yrs % Return
Total shareholder return (C) 36.7 40.1 117.7
Net asset value total return (D) 29.4 33.7 104.0
Benchmark (E) 20.7 26.9 82.2
FTSE All-Share Index (F) 20.8 31.0 95.2
FTSE World (ex UK) Index (F) 22.7 29.0 78.9
(C) Source: Datastream. The movement in ordinary share price adjusted to include the reinvestment of dividends.
(D) Source: Datastream/Witan. The movement in the net asset value per share adjusted to include the reinvestment of dividends.
(E) Source: Witan. The benchmark is a composite of four indices: the FTSEAll-Share Index 40%, the FTSE All-World North America Index 20%, the FTSE All-World Europe (ex UK) Index 20% and the FTSE All-World Asia Paci c Index 20%.
(F) Source: Datastream. See also FTSE International for conditions of use (www.ftse.com).
(G) Source: Datastream.
100
125
150
175
200
225
250
275
300
2005 2006 2007 2008 2009 2010 2011 2012 2013
Witan benchmarkShare Price Total ReturnNAV
2004

Annual Report 2013 Witan Investment Trust plc 03
Financial Statements
Statutory Information
Strategic ReportReport of the D
irectors C
orporate Governance
Other Inform
ation
Dividend informationDividend Information 2013 2012 % change
Revenue per share 15.4p 14.5p 6.2%
Dividend per share 14.4p 13.2p 9.1%
2014 Dividend schedule* Dividend payable
Ex-Dividend Date Pay Date Dividend Type per share
26/02/2014 28/03/2014 Fourth Interim 4.5p
21/05/2014 18/06/2014 First Interim 3.6p
20/08/2014 18/09/2014 Second Interim 3.6p
20/11/2014 18/12/2014 Third Interim 3.6p
*Please note that the dates and amounts for the first, second and third interim dividends could be subject to change.
Other nancial informationOther Financial Information 2013 2012 % change
Net Assets £1,372,944,000 £1,105,847,000 24.2%
Number of ordinary shares in Issue 189,311,000 190,079,500 -0.4%
Gearing (A) 7. 3% 6.1%
Share buy-backs (B) 0.4% 1.2%
Ongoing charge excluding performance fee 0.69% 0.69%
Ongoing charge including performance fee 1.12% 0.97%
8.0
10.0
12.0
14.0
16.0
2003 2005 2006 2007 2008 2009 2010 2011 2012 2013
Witan dividend (pence per share) (left scale)CPI Index (right scale)
200494.0
117.5
141.0
164.5
188.0
Since 2003, Witan’s dividend per share has risen 73%, compared with +31% for the UK consumer price index
(A) The di erence between shareholders’ funds and the total market value of the investments (including the face value of futures positions) expressed as a percentage of shareholders’ funds (see note 14, page 81).
(B) The percentage of the ordinary share capital in issue at the previous year end that was bought back during the year.
Source: Datastream.

Witan Investment Trust plc Annual Report 201304
Chairman’s and Chief Executive’s report
Harry Henderson | Chairman
Andrew Bell | Chief Executive
SummaryIn 2013 Witan delivered a net asset value (NAV) total return of 29.4% , 8.7% more than our benchmark’s total return of 20.7% and 8.6% more than the 20.8% return on the FTSE All -Share index of UK shares. The share price total return was 36.7% , enhanced by a narrowing in our share price discount to NAV.The total dividend for the year was 14.4 pence per
share (2012: 13.2 pence), an increase of 9.1%, marking the 39th consecutive year of rising dividends at Witan. This includes the fourth interim dividend of 4.5 pence declared in February 2014 and payable on 28 March 2014.
Over the past 5 years, despite the market gloom which initially followed the collapse of Lehman Brothers in 2008, Witan has achieved an NAV total return of +104% , compared with the +82% returns from our benchmark over this period (source: Datastream). It is encouraging to report a healthy level of outperformance over the longer term, alongside the strong results achieved in 2013.
The returns were driven by widespread outperformance by our investment managers as well as the bene t of employing gearing, during a year of improving investor con dence and rising stock markets. Although this recovery in con dence is welcome, it is prudent to note that the rise in equity markets has reduced the safety margin previously provided by low valuations. The forthcoming corporate reporting season will be important in con rming whether the growth that equity investors have anticipated is being realised.
The investment markets in 2013Equity markets performed very well in 2013, helped by the absence of the crises and persistent disappointments that had characterised the previous two years. Economic growth was weak during the rst part of the year but improved, encouraging equity markets to factor in better times in 2014. In the US, the economy sustained close to 2% growth, improving during the year despite a sharp tightening of scal policy. The UK avoided a “triple-dip” recession (and the earlier “second dip” was revised away by more up -to -date economic gures) and began to see stronger growth. Japan’s
economy responded positively to the devaluation of the previously overvalued yen and even Europe saw a modest recovery from the recessionary conditions experienced at the start of the year.

Annual Report 2013 Witan Investment Trust plc 05
Financial Statements
Statutory Information
Strategic ReportReport of the D
irectors C
orporate Governance
Other Inform
ation
> The NAV total return of 29.4% outperformed the benchmark’s return of 20.7%
> NAV total return over last ve years of 104% , 22% ahead of the benchmark
> Dividend increased by 9.1% to 14.4p, 7.1% ahead of the rate of in ation
> The 39th consecutive year of increased dividends
> The discount narrowed from 10.2% to 6.1%
How we’ve performed
Equities may also have been helped by the rst signs of investors turning away from bond markets. Yields had fallen so far in 2012 that the penny nally seemed to drop that buying bonds with yields below the in ation rate was a recipe for losing money. Yields rose sharply in the early summer, in response to hints that the US Federal Reserve (‘the Fed’) was considering reducing its bond purchases. It had previously been buying bonds in order to boost the money supply and encourage economic recovery. With some signs that this policy was proving successful,in May it signalled a possible change. This led to a sharp sell-o in bond markets which disturbed equity sentiment for several months and, in the case of emerging markets, for the rest of the year.
Once it became clear that any change in purchases by the Fed was dependent upon continued economic improvement and that they were a long way from deciding to raise interest rates, equity markets resumed progress, amid signs that economic growth was improving in most regions. Bonds did not recover, underscoring the point that the rise in yields was due to the overextended starting level, with the Fed’s policy signal the catalyst not the cause of the rise.
Witan’s strategy during the year was to remain fully invested into what seemed to be an improving outlook for economic growth and corporate earnings, although our gearing was reduced towards the end of the year. We increased our exposure to Japan, by appointing a manager (Matthews) for Far Eastern equities including Japan, by purchasing a Japanese fund (managed by Polar Capital) and by investing in Japanese equity index futures. We took pro ts in areas where we felt that valuations had become less attractive (including UK smaller companies and our holding in the private equity company 3i Group) and we allocated additional funds to the managers (Lansdowne, Matthews and Heronbridge) appointed since autumn 2012.
We completed a review of our list of managers, culminating late in the year in the appointment of two global managers (Pzena and Tweedy, Browne) with a value-based approach. With hindsight, we should have had more in Europe (which outperformed) and less in emerging economies (which lagged) but overall our shareholders enjoyed a successful year.
The Discount, Share Buybacks and Treasury sharesThe Company’s discount (relative to the NAV excluding income, with debt at market value) progressively narrowed during the year, ending at 6.1% , compared with 10.2% at the end of 2012. The average discount for the year was 8.3% (2012: 10.7%).
This narrower discount is to be welcomed as it re ects, at least in part, increased investor enthusiasm for the Company’s active multi-manager approach to investment in global equity markets. During the year, the Company purchased for cancellation a total of 0.4% of the starting shares in issue, at discounts between 8% and 11% , generating a small uplift in the NAV per share. This should also be seen as re ecting the Board’s wish to encourage the trend of a narrowing discount, from which all shareholders would clearly bene t, although it is recognised that market conditions and investment performance will also have a material in uence.
Although the Company’s shares currently remain at a discount, the Board is seeking powers at the forthcoming Annual General Meeting to buy shares into Treasury, for possible reissuance in the event of the shares moving to a premium. Shares will only be re-sold from Treasury at (or at a premium to) the net asset value per ordinary share.
Additionally, the Company is seeking shareholder approval to issue shares, up to 10% of the starting total, provided that such shares are issued at or at a premium to net asset value.
Witan Investment Trust plc Annual Report 201306
Chairman’s and Chief Executive’s report continued
Regulatory changes and Investment Management FeesThe Alternative Investment Fund Managers Directive (‘AIFMD’) passed into UK law in July 2013, after several years of debate in European political circles. Funds a ected have until July 2014 to comply with its requirements. Although “alternative investment” in the UK is generally used to describe exposure to specialist investment strategies such as hedge funds and private equity, the Directive will also apply to mainstream investment funds, such as Witan and other investment trusts, as well as many open-ended funds.
For mainstream funds, such as most investment trusts, the safeguards and reporting requirements required by the AIFMD are generally already covered by the Listing Rules for quoted companies or by existing corporate governance practices and regulations. The principal e ect will be to require investment funds to appoint an Alternative Investment Fund Manager (‘AIFM’) and for AIFMs to be internally organised along prescribed lines and to meet amended reporting requirements.
Witan Investment Trust, along with its wholly-owned subsidiary Witan Investment Services (‘WIS’) is in the process of adapting its internal organisation in order to comply with the new regulation, enabling WIS to act as the AIFM for Witan. This is not expected to result in material changes to Witan’s overall sta ng, although there will be additional costs associated with legal advice and the requirement to appoint a Depositary. The Company expects to report to Shareholders under the new arrangements from the end of 2014.
Investment Management FeesThe most signi cant variable costs incurred by the Company are the investment management fees paid to our external managers. The introduction of the Retail Distribution Review (‘RDR’), discussed below, has led to questioning of the role of performance fees, as well as introducing greater transparency over the structure of fees charged by open-ended funds.
Over the past year, the proportion of our assets managed without performance fees has increased. However, the Company believes that performance fees can be appropriate, provided that the resulting total fee is competitive. The Company structures the fee agreement with each external manager to obtain the best deal for shareholders. Whilst this will not always produce the lowest costs in absolute terms, the Company believes it is in shareholders’ interests to pay for managers who add value. Witan takes care to ensure the competitiveness of the fee rates it pays and that where higher fees are incurred they are linked to good performance, from which shareholders bene t. Further details are set out in the Strateg ic Report.
The Retail Distribution Review (‘RDR’), which took e ect at the start of 2013, was a positive development for investment trusts, removing some of the built-in nancial incentives for nancial advisers to favour open-ended funds over
investment trusts. As a result of “levelling the playing eld” the RDR has made the decision over which
fund to buy based more clearly on the merits of the funds themselves, which is a welcome development. A more competitive market has resulted, which should be a bene t for investors. There are some signs of a downward trend in investment manager fees following the ending of “trail commission”, while investment trusts have needed to develop better communications with nancial advisers and their clients, many of whom have relatively little familiarity with investment trusts.
Witan welcomes the changes introduced by the RDR. With over two-thirds of our shares owned by private individuals or wealth managers and advisors managing portfolios on their behalf, the Company is run with a keen awareness of private investors’ interests. Witan o er s an actively-managed portfolio with a 39-year record of consecutive dividend rises as well as being diversi ed by manager, geographic region , business sector and at the individual company level. Further details of our investment approach and results are set out in the Strategic Report.
Annual Report 2013 Witan Investment Trust plc 07
Financial Statements
Statutory Information
Strategic ReportReport of the D
irectors C
orporate Governance
Other Inform
ation
AGMOur Annual General Meeting will be held at Merchant Taylors’ Hall on Wednesday 30 April 2014 at2.30 pm. Formal notice of the meeting will be sent to shareholders when the Annual Report is published. We look forward to the opportunity to meet you then for the Company’s 106th AGM.
Outlook 2014 may be the rst year since the nancial crisis that economic growth exceeds expectations. Alongside improving news on the growth outlook during 2013, there has been greater calm about the handling of issues such as the US budget de cit and tensions in the Eurozone which had caused such volatility in 2011 and 2012. Accordingly, equity investors have been prepared to pay a higher multiple of earnings for shares, perceiving the risks to have reduced.
Fundamental headwinds remain, in the form of pressures on consumer spending, with prices rising faster than wages, and the pressure on governments to rein in budget de cits. In addition, some emerging markets have encountered adjustment problems from the decline in commodity prices and from fears of a tightening in global liquidity as the US Federal Reserve begins to reduce the monetary stimulus applied to the US economy. The recent relative calm in Europe could yet be disturbed if the European elections in May generate signi cant support in Euro currency states for parties wishing to leave the Euro zone.
Maintaining the momentum of recovery remains a balancing act. Governments need to take action to address budget de cits and Central Banks to forestall future in ation but neither will wish to damage a recovery which still remains patchy. Although the Authorities have made clear since 2012 that they are committed to promoting economic recovery, without which the foregoing problems become more intractable, policy misjudgements are possible, to which equity markets may prove more vulnerable after the gains of the past two years.
On a more positive note, it appears increasingly possible that the recovery will becomeself-reinforcing, as companies begin to invest more in future growth and take on more sta . This would make it easier for consumers to maintain spending, while making inroads into their debt, and lead to a cyclical improvement in government nances. Although current in ation expectations
are low, this follows several years of subdued growth. Government bond yields have risen from the unprecedentedly low levels of a year ago but remain well below levels viewed as normal prior to the nancial crisis. However, it is possible that a year of
surprisingly strong growth will rekindle fears that the exceptional money creation in recent years will lead to rising in ation. Bonds remain vulnerable both to a cyclical rise in in ation and changed expectations about where in ationary risks lie for the future.
Investors are demanding a lower risk premium for holding equities, which have shrugged o the rise in bond yields. This rerating of equities is a normal event when economies are improving but, unlike rises driven by increased pro ts, it is less repeatable. So, investors should look to earnings as the principal driver of returns in 2014. If corporate earnings grow, while interest rates remain low, equities should o er competitive returns, although the need to be selective, to nd the areas of superior or underestimated growth, appears greater than before. This is re ected in Witan’s continued focus on managers who base their portfolios on the merits of particular companies, not their weight in a benchmark index.
Harry Henderson Andrew Bell Chairman Chief Executive 11 March 2014

Witan Investment Trust plc Annual Report 201308
Strategic reportStrategy and business model
Strategy
The Company invests its shareholders’ funds primarily in a broad geographical spread of global equity markets, in order to participate in opportunities created by growth in the world’s economy and to outperform a representative equity benchmark. The objective is to generate long-term growth in capital for shareholders, together with an income that rises faster than the rate of in ation.
The Company employs an active multi-manager approach, allocating funds for investment by selected managers with di ering styles and specialisations. The aim is to access the best available management ability, including managers not accessible on the same terms (or at all) to UK investors.
Witan’s multi-manager approach was adopted in 2004, in the belief that no single manager was likely to excel in all markets and at all points in the economic cycle. Employing managers to invest in their areas of greatest competence has the potential to improve returns and to reduce risk relative to using a single manager across the investment waterfront.
Our approach aims to balance di erent factors (such as quality, value or growth approaches and geographical exposure), aiming to pro t from managers’ combined ability to outperform over time.
It is sometimes said of investment markets that whilst in the short-term they are a voting machine (a ected by sentiment) in the long-term they are a weighing machine (recording substantive changes). We seek managers who can capture the longer term growth rewards from equity investment by focusing on fundamental share values rather than chasing short-term momentum.
Business modelWhilst the external managers are responsible for stock selection in their individual portfolios, the Company’s Board and Executive team are responsible for the overall delivery of performance to shareholders, through the following means:
> Setting the overall investment objective.
> Selecting competent managers, who are expected to outperform a suitable benchmark relating to the investment remit set by the Company.
Under updated guidelines for UK-listed Companies’ Annual Reports, companies are required to publish a Strategic Report. This replaces the previously-required Business Review, although the objectives are similar. The Strategic Report should provide a description of the objectives which the strategy is designed to deliver for Shareholders, the business model and the outlook for the year ahead (see page 7). It should also include analysis of the Company’s performance during the year, relative to the key elements of its business strategy.
This Strategic Report has been prepared solely to provide additional information to shareholders to assess the Company’s strategies and the potential for those strategies to succeed. The Strategic Report contains certain forward-looking statements. These statements are made by the directors in good faith based on the information available to them up to the time of their approval of this report and such statements should be treated with caution due to the inherent uncertainties, including both economic and business risk factors, underlying any such forward-looking information.
This report falls into four main sections:
Page
Strategy 08
Business model 08
Performance and principal developments in 2013 10
Corporate and operational structure 17
Witan is an Investment Trust, which was founded in 1909 and has been listed on the London Stock Exchange since 1924. It is managed by an Executive team, under the control and supervision of the Board of Directors.
Annual Report 2013 Witan Investment Trust plc 09
Financial Statements
Statutory Information
Strategic ReportReport of the D
irector sC
orporate Governance
Other Inform
ation
> Adjusting asset allocation according to opportunities that arise.
> The selective use of borrowings with the aim of adding to performance.
> Direct investment in funds exposed to specialist asset categories.
> Controlled and selective use of exchange-traded derivatives to adjust asset allocation.
> Maintaining an e ective system of risk management and corporate governance.
In addition to delegating investment management to external portfolio managers, the Company operates an outsourced model for other corporate functions, such as fund accounting, custody and specialist professional services. These are overseen by the in-house Executive Team, covering Investment, Operations and Marketing, headed by the Chief Executive O cer, who is a Director of the Company.
The Board’s and the Executive’s role in investment managementAs already described, the selection of individual investments is delegated to external managers, subject to investment limits and guidelines which re ect the particular mandate (e.g. UK or Global equities) and the speci c investment approach which the Company has selected (e.g. value, higher dividend yield, special situations). The managers are chosen by the Board after a disciplined selection process focused on the managers’ scope to add value and their t with the overall balance of the portfolio.
The overwhelming majority of the portfolio is managed in segregated accounts, held at the Company’s custodian, which enables the Company to view the portfolio as a whole and analyse its risks and opportunities as well as those at the level of each manager’s portfolio.
At the end of 2013, the Company had 11 external investment managers, covering a range of investment remits. Information regarding the proportion of Witan’s assets managed by each and of their performance during the year is set out on page 12. Details of the manager changes during the year are set out on page 11.
Up to 10% of the portfolio (at the time of investment) may be invested in collective funds selected by the Chief Executive, with the objective of outperforming Witan’s equity benchmark. These may represent asset categories that are temporarily undervalued or funds which are viewed as attractive longer-term generators of superior returns. This portfolio is subject to limits set by the Board.
The Board and the Executive (under delegated guidelines from the Board) also seek to add to performance by adjusting the level of gearing employed, by the selective use of exchange -traded derivatives to alter the asset allocation and by the use of specialist funds to gain exposure to areas underrepresented in the rest of the portfolio. In essence, the Company seeks to have su cient levers to pull to take advantage of investment opportunities that may arise, in addition to the total returns arising from the investment managers’ portfolios, which are expected to be the most signi cant driver of the Company’s performance.
Our Selected Benchmark The Company’s benchmark is a reference point for what shareholders can expect from an investment in Witan, in terms of the underlying investment structure and in performance. Since October 2007 the benchmark (based on the FTSE All -World indices) has been:
40% UK 20% North America 20% Europe ex-UK 20% Asia Paci c.
This re ects an investment policy that balances investment in the UK market (both for its domestic and international exposure) with access to growth in other regions of the world.
It should be emphasised that the portfolio is actively managed and not designed to track any index. Performance can be expected to vary, sometimes considerably, from that of the benchmark, while aiming for consistent outperformance in the longer term.
Performance information for other commonly used indices is also given in the Key Performance Indicators summary section on page 2 .

Witan Investment Trust plc Annual Report 201310
Investment performance Outperformance compared with Witan’s equity benchmark.The Company seeks to achieve at least 2% p.a. outperformance in NAV total return and shareholder total return terms over the long-term. In 2013, Witan achieved 8.7% NAV total return outperformance relative to its combined global equity benchmark ( see page 9) and a shareholder total return 16% above that of the benchmark. A positive long-term total return, after in ation, for shareholders. In 2013, Witan shareholders enjoyed an NAV total return of 29.4% and, owing to the narrowing of the discount, a shareholder total return of 36.7% . In ation was 2.0% in the year to December 2013. Returns over the longer term are set out on page 2 and indicate that this objective has also been met over the past 3 and 5 year periods.Long-term investment outperformance by the individual managers relative to the relevant benchmark. In 2013, six of the seven managers who had been in place throughout the year outperformed their benchmarks. The portfolio of direct holdings managed by the CEO also outperformed, as well as the two new managers who had been in place for more than one month.The managers’ returns since appointment are set out in the table on page 12.Further details are set out on pages 11-12.
Annual growth in the dividend per share ahead of the rate of in ation
In 2013, the dividend increased by 9.1%, compared with an in ation rate of 2.0% during the year.Further details are set out on page 13.
A positive contribution to investment returns from the use of borrowings
The Company employed average gearing of 9% during the year, which contributed 1. 9% to returns after taking account of the costs of borrowing.Further details are set out on pages 13-14.
A discount to NAV of 10% or less (compared with the NAV excluding income, with debt at market value)
The discount on this basis averaged 8.3% during 2013, ending the year at 6.1% , compared with 10.2% at the end of 2012.Further details are set out on page 15.
A competitive level of ongoing charges, balancing the need to pay for high quality investment management with the aim of keeping the costs of managing the business as low as possible
In 2013, the ongoing charges gure was 0. 69% excluding performance fees (2012: 0.69%) and 1.1 2% including performance fees (2012: 0.97%). This increase on the previous year was driven by changes in external manager fees, due to the strong performance delivered in 2013. Further details are set out on page 1 6.
Key performance indicators
Strategic reportPerformance and principal developments in 2013
Performance and principal developments in 2013Success in implementing the Company’s strategy is monitored against a range of Key Performance Indicators (KPIs) which are viewed as significant measures of success over the longer term. Although performance relative to the KPIs is also monitored over shorter periods, it is success over the long-term that is viewed as more important, given the inherent volatility of short-term investment returns. The principal financial KPIs are set out below, with a report (in italics) of Witan’s performance against them during 2013. In addition, details of the Company’s performance in relation to its obligations under the UK Corporate Governance Code are set out in the Corporate Governance Statement on pages 32 to 41.
Annual Report 2013 Witan Investment Trust plc 11
Financial Statements
Statutory Information
Strategic ReportReport of the D
irector sC
orporate Governance
Other Inform
ation
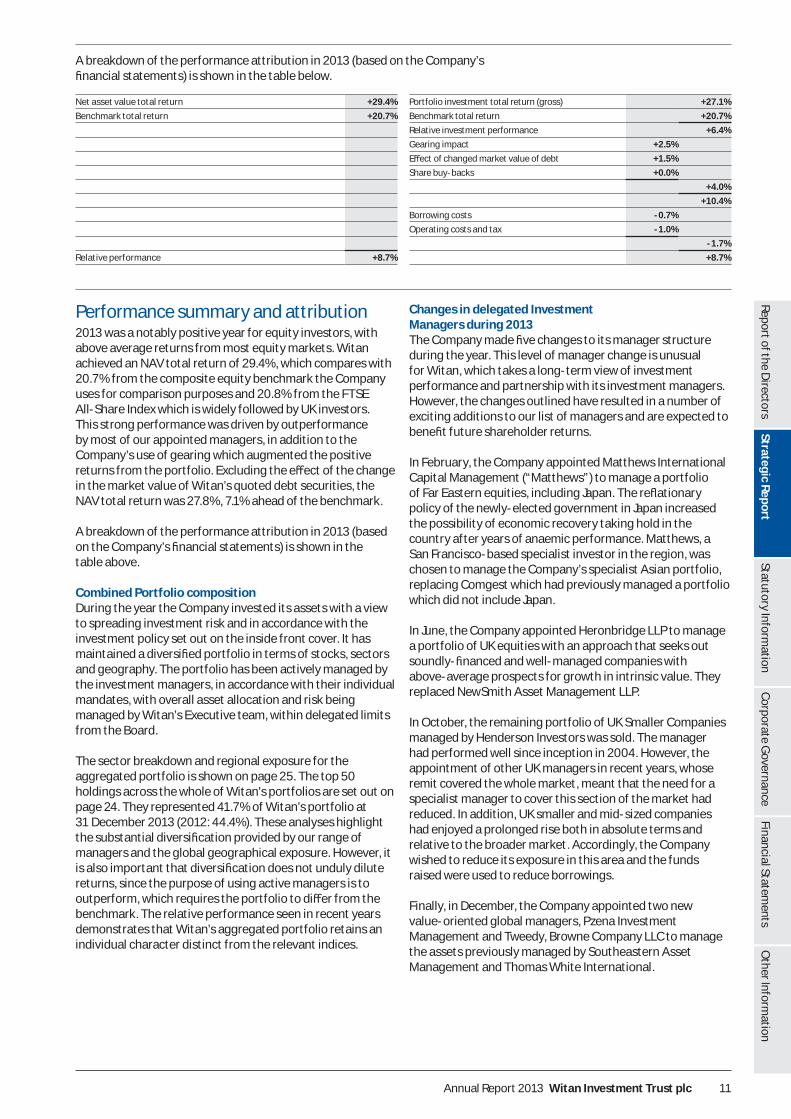
A breakdown of the performance attribution in 2013 (based on the Company’s nancial statements) is shown in the table below .
Net asset value total return +29.4% Portfolio investment total return (gross) +27.1%
Benchmark total return +20.7% Benchmark total return +20.7%
Relative investment performance +6.4%
Gearing impact +2.5%
E ect of changed market value of debt +1.5%
Share buy-backs +0.0%
+4.0%
+10.4%
Borrowing costs -0.7%
Operating costs and tax -1.0%
-1.7%
Relative performance +8.7% +8.7%
Performance summary and attribution2013 was a notably positive year for equity investors, with above average returns from most equity markets. Witan achieved an NAV total return of 29.4% , which compares with 20.7% from the composite equity benchmark the Company uses for comparison purposes and 20.8% from the FTSE All-Share Index which is widely followed by UK investors. This strong performance was driven by outperformance by most of our appointed managers, in addition to the Company’s use of gearing which augmented the positive returns from the portfolio. Excluding the e ect of the change in the market value of Witan’s quoted debt securities, the NAV total return was 27.8%, 7.1% ahead of the benchmark.
A breakdown of the performance attribution in 2013 (based on the Company’s nancial statements) is shown in thetable above.
Combined Portfolio composition During the year the Company invested its assets with a view to spreading investment risk and in accordance with the investment policy set out on the inside front cover. It has maintained a diversi ed portfolio in terms of stocks, sectors and geography. The portfolio has been actively managed by the investment managers, in accordance with their individual mandates, with overall asset allocation and risk being managed by Witan’s Executive team, within delegated limits from the Board.
The sector breakdown and regional exposure for the aggregated portfolio is shown on page 25. The top 50 holdings across the whole of Witan’s portfolios are set out on page 24. They represented 4 1.7% of Witan’s portfolio at31 December 2013 (2012: 44.4%). These analyses highlight the substantial diversi cation provided by our range of managers and the global geographical exposure. However, it is also important that diversi cation does not unduly dilute returns, since the purpose of using active managers is to outperform, which requires the portfolio to di er from the benchmark. The relative performance seen in recent years demonstrates that Witan’s aggregated portfolio retains an individual character distinct from the relevant indices.
Changes in delegated Investment Managers during 2013The Company made ve changes to its manager structure during the year. This level of manager change is unusual for Witan, which takes a long-term view of investment performance and partnership with its investment managers. However, the changes outlined have resulted in a number of exciting additions to our list of managers and are expected to bene t future shareholder returns.
In February, the Company appointed Matthews International Capital Management (“Matthews”) to manage a portfolio of Far Eastern equities, including Japan. The re ationary policy of the newly-elected government in Japan increased the possibility of economic recovery taking hold in the country after years of anaemic performance. Matthews, a San Francisco-based specialist investor in the region, was chosen to manage the Company’s specialist Asian portfolio, replacing Comgest which had previously managed a portfolio which did not include Japan.
In June, the Company appointed Heronbridge LLP to manage a portfolio of UK equities with an approach that seeks out soundly- nanced and well-managed companies withabove-average prospects for growth in intrinsic value. They replaced NewSmith Asset Management LLP.
In October, the remaining portfolio of UK Smaller Companies managed by Henderson Investors was sold. The manager had performed well since inception in 2004. However, the appointment of other UK managers in recent years, whose remit covered the whole market, meant that the need for a specialist manager to cover this section of the market had reduced. In addition, UK smaller and mid-sized companies had enjoyed a prolonged rise both in absolute terms and relative to the broader market. Accordingly, the Company wished to reduce its exposure in this area and the funds raised were used to reduce borrowings.
Finally, in December, the Company appointed two newvalue-oriented global managers, Pzena Investment Management and Tweedy, Browne Company LLC to manage the assets previously managed by Southeastern Asset Management and Thomas White International.

Witan Investment Trust plc Annual Report 201312
Investment Manager PerformanceOf the seven managers in place throughout the year, six outperformed their benchmarks. Matthews (appointed in February) and Heronbridge (in June) also outperformed. For Pzena and Tweedy, Browne, appointed in December, it is too soon to comment. Particularly strong absolute and relative returns of over 35% were achieved by Artemis and Lindsell Train in the UK. MFS in Global Equities, Marathon in Europe and the portfolio of direct holdings achieved returns of close to 30%. The standout return was from Lansdowne who achieved a total return of 49% in their rst year with Witan. Their proportion of Witan’s portfolio was added to during the year, increasing from 2.5% to 8.8% . Trilogy’s performance, whilst lagging its benchmark, was held back by adverse investment conditions in emerging economies.
Directly held investmentsThis portfolio which held 10.3% of assets at the end of 2012, outperformed Witan’s benchmark during 2013, with a return from the portfolio of 31% . The holding in 3i Group (Witan’s largest equity holding at the end of 2012) was a signi cant
contributor, as a favourable investor response to new management combined with a more positive stock market environment to drive a major rerating for the stock. This position has been sold, with pro ts also taken in a number of other holdings in the direct portfolio. The portfolio represented 6. 3% of assets at the year end. The main investments were in listed private equity and related companies (Electra Private Equity, Princess Private Equity and NB Distressed Debt Investment Fund), UK domestic recovery (Aberforth Geared Income Trust), two specialist sector funds (Polar Capital Insurance Fund and Ludgate Environmental Fund Limited) and the convertible bonds of Edinburgh Dragon Investment Trust.
Manager structure and performance The Company’s 11 external managers have a range of investment approaches and follow di ering mandates set by the Company. Details of each manager’s mandate, benchmark, investment style and date of appointment are included in the Manager summaries on pages 21 to 23.
Performance Benchmarkfor the year ended 31 December 2013 and Value of Performance Performancefrom inception to 31 December 2013 Witan assets % of Witan’s Benchmark since since managed assets under Performance Performance appointment appointment £m management in 2013 in 2013 to 31.12.13 to 31.12.13Investment Manager at 31.12.13 at 31.12.13 (%) (%) (%) (%) (Note 1) (Note 2)
Artemis (UK) 149.4 10.1 35.7 20.8 12.9 6.1
Heronbridge (UK) 104.7 7.1 n/a n/a 16.2 9.6
Lindsell Train (UK) 179.4 12.1 38.9 20.8 23.3 12.9
Lansdowne (Global) 130.8 8.8 48.8 19.9 46.6 18.5
MFS (Global) 131.1 8.9 27.7 21.0 12.5 9.3
Pzena (Global) 141.3 9.5 n/a n/a 1.1 1.0
Tweedy, Browne (Global) 47.4 3.2 n/a n/a 0.9 1.0
Veritas (Global) 176.7 11.9 23.5 21.1 12.7 9.9
Marathon (Pan-Europe) 121.4 8.2 29.1 23.1 13.0 10.6
Matthews (Asia) 133.7 9.0 n/a n/a 2.0 (1.0)
Trilogy (Emerging Markets) 51.0 3. 5 (5.3) (4.1) (5.4) (2.4)
Witan Direct Holdings 92.4 6. 3 31.0 20.7 9.8 8.3
Notes:1. Percentage of Witan’s investments managed, excluding the holdings in Polar Japan open -ended funds (£2 0.5m , 1.4% of assets) and cash balances held centrally by Witan.2. The percentages are annualised where the inception date was before 2013.
Strategic reportPerformance and principal developments in 2013 continued

Annual Report 2013 Witan Investment Trust plc 13
Financial Statements
Statutory Information
Strategic ReportReport of the D
irector sC
orporate Governance
Other Inform
ation
Dividend Policy and performance in 2013 The Company’s policy, subject to circumstances, is to increase its dividend per share in real terms, ahead of the increase in UK Consumer Prices (CPI).
For 2013, the Board has declared a fourth interim dividend of 4.5 pence per share, to be paid to shareholders on 28 March 2014, making a total distribution for the year of 14.4 pence (2012: 13.2 pence). This represents an increase of 9.1% , over 7% ahead of the 2.0% rate of consumer price in ation (CPI) in the year to December 2013. This is the 39th consecutive year that Witan has increased the dividend.
The chart below shows the growth in dividends over the past 10 years. Our dividend per share has grown ahead of the rise in the UK consumer price index in each year and cumulatively has grow n by 73%, more than twice the 31% rise in consumer prices.
Policy on gearing and the use of derivativesEmployment of Gearing PurposeThe purpose of using borrowings is to improve (or “gear”) returns for shareholders, by achieving investment returns higher than the interest cost of the borrowings. Accordingly, attention is paid to using a level of gearing appropriate for market conditions (put simply, having more borrowings when markets are attractively valued and borrowing less at times when returns are expected to be poorer). In addition, ablend of long-term and short-term borrowings is used, to balance the certainty of cost associated with locking in xed rates for longer periods with the exibility of using
short-term facilities which can be readily repaid when they are not required.
LimitsAlthough the Company has the legal power under its Articles of Association to borrow up to 100% of the adjusted total of shareholders’ funds, with the objective of enhancing returns, this is subject to practical constraints including a test of prudence. The Board’s longstanding policy is not to allow gearing (as de ned on page 3) to rise to more than 20%, other than temporarily in exceptional circumstances. Over the past ve years it has generally varied between 0% and 15% and where appropriate the Company may hold a small net cash position.
StructureWitan has £110m of long -term debt, consisting of debenture, secured bond and preference share capital. The Company also has a £50 million one -year facility, providing additional exibility over the level of gearing, as well as enabling the
Company to borrow in other currencies than sterling, if deemed appropriate. Witan may either invest its borrowings fully, or neutralise their e ect with cash balances (or the sale of equity index futures) according to its assessment of the markets. The Company’s investment managers are not permitted to borrow within their portfolios but may hold cash if deemed appropriate.
Since 2003, Witan’s dividend per share has risen 73% compared with +31% for the UK consumer price index
8.0
10.0
12.0
14.0
16.0
2003 2005 2006 2007 2008 2009 2010 2011 2012 2013
Witan dividend (pence per share) (left scale)CPI Index (right scale)
200494.0
117.5
141.0
164.5
188.0
Source: Datastream.
The Company commenced paying quarterly dividends in 2013. The rst three payments for 2014 (in June, September and December) will, in the absence of unforeseen circumstances, be paid at a rate of 3.6 pence per share (2013: 3.3 pence), being one quarter of the full year payment for 2013. The fourth payment (in March 2015) will be a balancing amount, re ecting the di erence between the three quarterly dividends already paid and the payment decided for the full year.

Witan Investment Trust plc Annual Report 201314
Action taken in 2013Gearing was managed actively during the year. It was increased to 11% during the middle quarters of the year before being reduced in the autumn, ending the year at 7. 3%. Gearing signi cantly bene ted performance during the year, increasing the Group’s exposure to the rise in markets.
The calculation of gearing takes account of the nominal value of any derivatives held, since this represents the size of the asset or liability to which the derivative provides exposure.
At the end of 2012, the published gearing gure of 6.1% took account of a £29.7 million short position in the 10-year gilt future, equivalent to 2.7% of net assets. Gearing before accounting for this position was 8.8% . Gross gearing (adding together the value of all positions (less cash), irrespective of whether they were an asset or a liability) was 11.5% at the end of 2012.
At the end of 2013, gross gearing on the same basis was 7. 3% . This included a £35.2 million long position in Nikkei Index futures, equivalent to 2.6% of net assets. Further details of the accounting treatment for these positions are given in note 1 on page 67.
Use of Derivatives PolicyWitan’s policy on the use of derivatives emphasises simplicity, transparency, cost e ectiveness and the minimisation of counterparty risk. Where nancial instruments are available that help the Company to implement its investment policy (whether for the purpose of increasing exposure to a particular asset or for portfolio hedging) their use will be considered. In recent years, exchange-traded index futures have been the only instruments used. These give exposure to a particular market index, are relatively liquid to trade and depend upon the creditworthiness of the particular exchange, not an individual rm.
The use of index futures enables Witan to adjust its gearing rapidly, conferring tactical exibility. It also provides a means of adjusting asset allocation (by allocating investment to particular markets). In both cases, the use of index futures enables the adjustments to be made without interfering with the assigned objectives for our investment managers, which are to pick stocks that will grow in value over the medium to long term and outperform their respective benchmarks.The operation of this investment area is the responsibility of the CEO, within guidelines set by the Board. Transactions are reported to the Board as they occur, with the CEO being accountable for the nancial results. The Company’s external managers are not permitted to make use of derivatives or to gear their portfolios.
Activity during 2013At the end of 2012, the Company held a short position in the 10-year gilt futures, which was established inter alia to reduce the potential adverse portfolio impact from an expected rise in gilt yields. However, this position was gradually reduced and nally closed in April, when the improving prospects for global equity markets led to a decision to redeploy the capital employed to increase exposure to the Japanese equity market. Since April, the Company has held a position in the Nikkei Index futures contract, equivalent to approximately 3% of net assets. This has given the Company additional exposure to the strongly-performing Japanese market at a time when its externally managed portfolios had relatively little Japanese exposure.
The underlying futures exposure varied between –2.7% (represented by a £29.7 million short position in the gilt future in January) and +4.0% of assets, nishing the year at +2.6% (represented by a £35 million position in Japanese equity index futures). The Company takes full account of the e ect of the nominal value of the futures contracts when calculating its gearing. The value of the investments (which are traded on o cial exchanges) is fully marked to market every day. The realised gain on index futures during the year is shown in the cash ow statement on page 63.
Strategic reportPerformance and principal developments in 2013 continued
Annual Report 2013 Witan Investment Trust plc 15
Financial Statements
Statutory Information
Strategic ReportReport of the D
irector sC
orporate Governance
Other Inform
ation
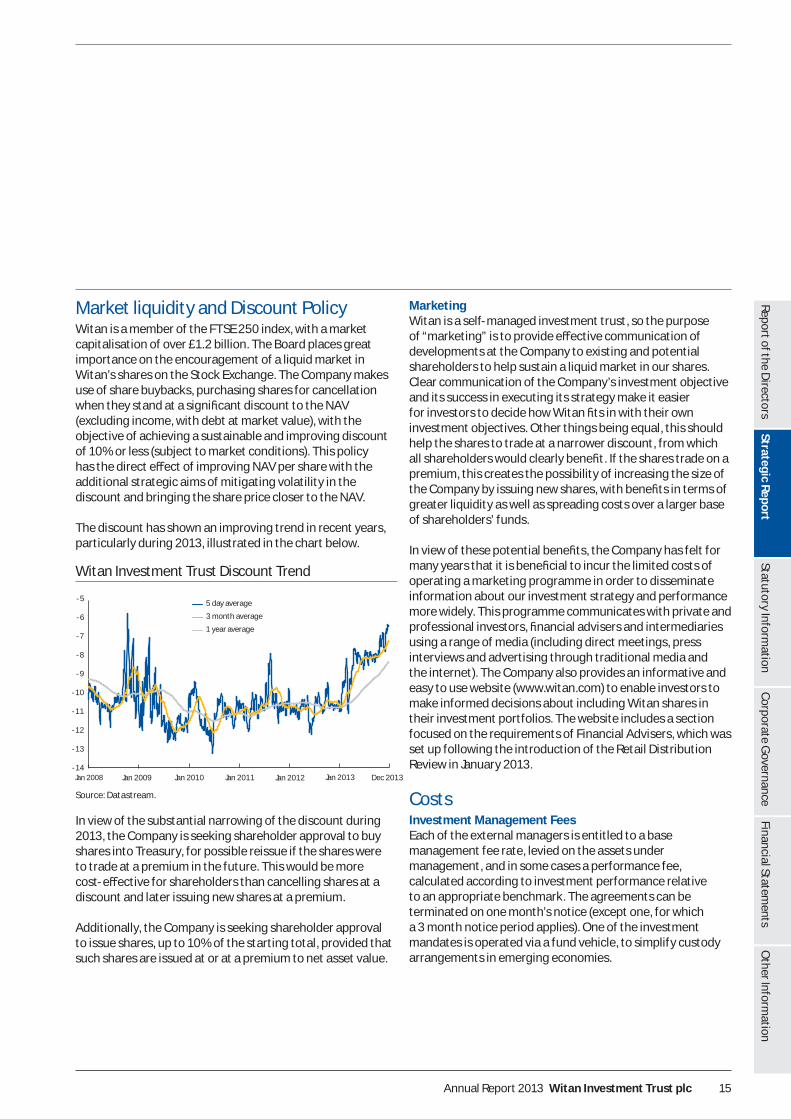
Market liquidity and Discount Policy Witan is a member of the FTSE 250 index, with a market capitalisation of over £1.2 billion. The Board places great importance on the encouragement of a liquid market in Witan’s shares on the Stock Exchange. The Company makes use of share buybacks, purchasing shares for cancellation when they stand at a signi cant discount to the NAV (excluding income, with debt at market value), with the objective of achieving a sustainable and improving discount of 10% or less (subject to market conditions). This policy has the direct e ect of improving NAV per share with the additional strategic aims of mitigating volatility in the discount and bringing the share price closer to the NAV.
The discount has shown an improving trend in recent years, particularly during 2013, illustrated in the chart below.
Source: Datastream.
In view of the substantial narrowing of the discount during 2013, the Company is seeking shareholder approval to buy shares into Treasury, for possible reissue if the shares were to trade at a premium in the future. This would be more cost-e ective for shareholders than cancelling shares at a discount and later issuing new shares at a premium.
Additionally, the Company is seeking shareholder approval to issue shares, up to 10% of the starting total, provided that such shares are issued at or at a premium to net asset value.
Marketing Witan is a self-managed investment trust, so the purpose of “marketing” is to provide e ective communication of developments at the Company to existing and potential shareholders to help sustain a liquid market in our shares. Clear communication of the Company’s investment objective and its success in executing its strategy make it easier for investors to decide how Witan ts in with their own investment objectives. Other things being equal, this should help the shares to trade at a narrower discount, from which all shareholders would clearly bene t. If the shares trade on a premium, this creates the possibility of increasing the size of the Company by issuing new shares, with bene ts in terms of greater liquidity as well as spreading costs over a larger base of shareholders’ funds.
In view of these potential bene ts, the Company has felt for many years that it is bene cial to incur the limited costs of operating a marketing programme in order to disseminate information about our investment strategy and performance more widely. This programme communicates with private and professional investors, nancial advisers and intermediaries using a range of media (including direct meetings, press interviews and advertising through traditional media and the internet). The Company also provides an informative and easy to use web site (www.witan.com) to enable investors to make informed decisions about including Witan shares in their investment portfolios. The web site includes a section focused on the requirements of Financial Advisers, which was set up following the introduction of the Retail Distribution Review in January 2013.
CostsInvestment Management FeesEach of the external managers is entitled to a base management fee rate, levied on the assets under management, and in some cases a performance fee, calculated according to investment performance relative to an appropriate benchmark. The agreements can be terminated on one month’s notice (except one, for which a 3 month notice period applies). One of the investment mandates is operated via a fund vehicle, to simplify custody arrangements in emerging economies.
Witan Investment Trust Discount Trend
5 day average
3 month average
1 year average
-14
-12
-11
-10
-9
-8
-7
-6
-5
-13
Jan 2008 Jan 2009 Jan 2010 Jan 2011 Jan 2012 Jan 2013 Dec 2013

Witan Investment Trust plc Annual Report 201316
The base management fee rates for managers in place at the end of 2013 range from 0.2% to 0.8 % per annum and the performance fees range from nil to 20 per cent of the relevant outperformance. The average base management fee, weighted according to the value of the funds under management, was 0.47% as at 31 December 2013 ( 2012: 0.35%). On a similar basis, the average performance fee is 6% of the outperformance of the relevant benchmark (2012: 11%), subject to capping of payments for any particular year. The average base fee has risen, while the average performance fee across the portfolio has fallen. This is due to a rise (from 31% to 57% ) in the proportion of assets managed without performance fee arrangements.
As an illustration, if our managers uniformly outperformed their benchmarks by 3% after base management fees, this would generate a performance fee of 0.19% of net assets, giving total investment management fees of 0.66% (including a 0.47% base fee). The comparable estimate in 2012 was 0.69% (including a 0.3 5% base fee). The actual fees payable will of course vary according to the level of performance and the variation in performance between managers with higher or lower fees.
Witan takes care to ensure the competitiveness of the fee rates it pays and that where higher fees are incurred they are linked to good performance, from which shareholders bene t. A majority of the managers have base fees alone (without performance fees) and a majority of the fee structures incorporate a “taper” whereby the rate reduces for larger portfolios.
The Company’s external investment managers may use certain services which are paid for, or provided by, various brokers. In return, they may place business, including transactions relating to the Company, with those brokers.
Ongoing Charges and costs The ongoing charges gure (“OCF” ) (which is the recurring operating and investment management costs of the Company, expressed as a percentage of average net assets) was 0. 69% in 2013, the same as in 2012 (0.69%). The higher average level of net assets (allowing xed costs to be spread over a larger base) was o set by an increase in the average
investment management fee payable to our external managers, following changes in the managers used. When performance fees due to the relevant external managers are included, the OCF was 1.1 2% in 2013 (2012: 0.97%), re ecting a very strong year in performance terms. This compares with the average OCF of 1.69% in the IMA Flexible Investment equity funds sector (source: IMA, Financial Express as at December 2013) and 0.77% (0.83% including performance fees) for the AIC Global Growth sector (source: AIC, as at 31 December 2013).
The Company exercises strict scrutiny and control over costs. As a self-managed investment trust, any negotiated savings in investment management or other fees directly reduce the costs for shareholders. Whilst this will not always generate the lowest absolute costs, the Board believes that it is in shareholders’ interests to pay for managers who add value. The Board believes that the increase in the OCF during the year represented good value for money for shareholders, given the signi cantly increased level of outperformance generated by the portfolio in 2013.
There is continuing debate over the most appropriate measure of investment company costs, to enable investors to assess value for money and to make comparisons between funds. In recent years, the Total Expense Ratio (TER) was overtaken by the Ongoing Charges Figures (OCF) and there is discussion in the fund sector about whether further changes should be made, for example to distil all costs into a single Cost of Ownership Figure for Investors . Consensus on how to present a single gure remains elusive at present, partly because of concerns that oversimpli cation might distort comparisons rather than facilitating them.
In the meantime, the Company will continue to focus on the OCF (which is prepared in accordance with the AIC’s recommended methodology) as a readily-understood measure of the underlying expenses of running the business. This year, Witan has decided to present the information on costs, previously given in di erent parts of the Annual Report, in a single table on page 17. This indicates the main cost heading in money terms and as a percentage of net assets. The gures for relative NAV total return performance are also included, for comparison purposes.
Strategic reportPerformance and principal developments in 2013 continued

Annual Report 2013 Witan Investment Trust plc 17
Financial Statements
Statutory Information
Strategic ReportReport of the D
irector sC
orporate Governance
Other Inform
ation
Corporate and operational structureAs described earlier (page 8) Witan is an Investment Trust with a Premium Listing on the London Stock Exchange. Ithas a single, wholly owned, subsidiary, Witan Investment Services Limited (‘WIS’).
Operational Management Arrangements In addition to the appointment of external investment managers, Witan contracts with third parties for the supporting services it requires, including:
> BNP Paribas Securities Services SA (‘BNPSS’) for global custody, investment accounting and administration.
> Frostrow Capital LLP for company secretarial services.
> International Financial Data Services (‘IFDS’) Ltd. as the savings plan administrators of Witan Wisdom andJump Savings.
> Specialist advisers are also used for media relations, advertising and investment manager research.
> The Company also takes specialist advice on regulatory compliance issues and, as required, procures legal, investment consulting, nancial and tax advice.
As with investment management, the contracts governing the provision of these services are formulated with legal advice and stipulate clear objectives and guidelines for the level of service required.
Corporate and operational structure
Priorities for the year ahead In 2014, the key priorities for Witan include:
> Investment. Seek to build on the strong returns achieved for shareholders in 2013, setting an appropriate strategic asset allocation to re ect changing opportunities in the world economy. Make use of a range of active managers to deliver our strategic objectives through a multi-manager structure. Continue to deliver dividend growth ahead of in ation.
> Communication. Communicate Witan’s distinct and active investment approach and achievements more e ectively to existing and potential shareholders. In particular increase the focus on improving information for personal investors and nancial advisers, where direct meetings are less practicable.
> Regulatory change. Complete the process of authorisation under the AIFMD.
> Client service. Provide excellent service to the corporate and individual clients of Witan Investment Services.
Category of cost 2013
£m
2013% of net
assets2012
£m
2012% of net
assets
Other Expenses (excluding investment management expenses) (see note 5 on page 6 9)
5.32 0.42 4.87 0.47
Less other non-recurring expenses and those relating to the subsidiary (whose expenses do not relate to the operation of the investment company).
(1.16) (0.09) (1.15) (0.11)
Investment management base fees (see note 4, page 68) 4.58 0.36 3.38 0.33
Ongoing Charges Figure (including investment managers base fees) 8.74 0.69 7.10 0.69
Investment managers performance fees (see note 4, page 68) 5.49 0.43 2.93 0.28
Ongoing charges (including performance fees) 14.23 1.1 2 10.03 0.97
Portfolio transaction costs* 1.89 0. 16 1.2 3 0.12
Relative out performance during the year (valuing debt at par value) + 7.1% +2.0%
* excludes non-recurring portfolio transition costs of £ 0. 9m arising from the manager changes (2012: £0.04m).

Witan Investment Trust plc Annual Report 201318
Premises and sta ngSince November 2005 the Company has had a lease on o ce premises at 14 Queen Anne’s Gate, London SW1H 9AA, which is also the Company’s registered o ce.
The Company’s policy towards its employees is to attract and retain sta with the particular skills and expertise required to manage the a airs of an investment trust company. Details of the Company’s remuneration policies and required disclosures are set out in the Directors’ Remuneration Report on page 44. Employees and those who seek to work within the Group are treated equally regardless of sex, marital status, creed, colour, race or ethnic origin. The Company has six direct employees, four men and two women. The Board currently consists of seven non-executive Directors ( ve men and two women) and the Chief Executive O cer, Andrew Bell, who is an employee. Given its outsourced model and small number of direct employees, the Group has no speci c policies in respect of environmental or social and community a airs .
Witan Investment Services (‘WIS’) Witan Investment Services Limited is a wholly owned subsidiary of Witan Investment Trust plc. It was established in March 2005 to provide investment savings accounts and marketing services and to give investment advice to professional investors. It is authorised and regulated by the Financial Conduct Authority (FCA).
The principal activities of WIS have historically been to provide executive management services to the Boards of Witan Investment Trust plc (‘Witan’) and Witan Paci c Investment Trust plc (‘Witan Paci c’), to communicate information about the Companies to the market to increase investor interest in their shares and to operate cost-e ective savings plans for investors to hold the shares. From 2014, as already noted, it is also expected to become the AIFMfor Witan.
WIS’s operational objectives are:
> to provide a reliable and e cient investment savings platform for Witan and Witan Paci c investors
> to provide suitable advice to the Boards of itscorporate clients
> to reduce the net operating costs for WitanInvestment Trust
> to seek appropriate business opportunities which can add value for shareholders
> (from 2014) to provide an appropriate system of investment and risk management to ful l its obligations as Witan’s AIFM under the AIFMD.
WIS has two principal sources of income. These are savings plan revenues and the executive management and marketing fees paid by its corporate clients, Witan and Witan Paci c. The main costs incurred by WIS are fees to the savings schemes administrator (IFDS), sta costs to provide the services described above and professional advice toensure that its regulatory and accounting obligations are properly satis ed.
The savings plans provided for WIS clients are marketed under the Witan Wisdom and Jump Savings brands. They currently have over 2 4,000 accounts with assets of some £ 280 million invested. During 2013, the account fees paid by investors for Witan Wisdom accounts were reviewed, to ensure an equitable balance between administration fees and transaction costs and to re ect changes in the savings market. Details have been sent to account holders, with the changes taking e ect from April 2014.
Principal risks and uncertaintiesRisks are inherent in investment and corporate management but it is important that their nature and magnitude is understood, in order that risks, particularly those which the Company does not wish to take, can be identi ed and either avoided or controlled. The Company (and its subsidiary WIS) has established a detailed framework of the key risks impinging on the business (principally investment, operational, nancial and regulatory), with associated policies and processes devised to mitigate or manage those risks. This Risk Map is reviewed regularly by the Audit Committee and the Board and updated as necessary. Under the AIFMD taking e ect from July 2014, additional rules are being introduced regarding the monitoring and management of business risks. The Company expects to establish a Risk Committee within WIS in order to comply with the risk management and reporting obligations of the AIFMD. The guiding principles already in place (watchfulness, proper analysis, prudence and a clear system of risk management) will remain the same.
Strategic reportCorporate and operational structure continued

Annual Report 2013 Witan Investment Trust plc 19
Financial Statements
Statutory Information
Strategic ReportReport of the D
irector sC
orporate Governance
Other Inform
ation
The Group’s key risks fall broadly under the following categories:
Market and investment portfolio risks Witan is set up to invest in UK and overseas equity markets on behalf of its shareholders. Equity exposure is unlikely to drop below 80%, in normal conditions. Therefore a key risk of investing in Witan is a general fall in equity prices. Other risks, as with any international equity portfolio, are the overall investment portfolio’s exposure to country, currency, industrial sector, and stock speci c risks. There are also risks associated with the performance of its investment managers.
The Board seeks to manage these risks through:
> appropriate asset allocation decisions, with a broadly diversi ed equity benchmark
> regular reviews of the competence of our fund managers
> monitoring the global economic, geo-political and stock market outlook
> the application of relevant policies on gearing and liquidity
> manager diversi cation
> delegating authority to the executive management team to manage risk actively, whether to preserve capital or capitalise on opportunities.
During the year Witan’s Chief Executive O cer (CEO), Andrew Bell, managed the overall business and the investment portfolio in accordance with limits and restrictions determined by the Board. The Board regularly reviews the matters delegated to Executive management, on which the CEO reports at each Board meeting. The Board also regularly reviews investment strategy and performance, supported by comprehensive management information including investment performance data and nancial reports.
OperationalMany of the Group’s nancial systems are outsourced to third parties, principally BNPSS. Disruption to the accounting, payment systems or custody records operated by BNPSS could prevent the accurate reporting and monitoring of the Company’s nancial position. Details of how the Board monitors the services provided by its suppliers, and the key elements designed to provide e ective internal control, are explained further in the Corporate Governance Statement.
Corporate governance The Board takes its own regulatory responsibilities very seriously and regularly reviews the main points of compliance against requirements.
Details of the Company’s compliance with corporate governance best practice are set out in the Corporate Governance Statement on pages 32 to 41. The Board conducts an annual internal assessment of the e ectiveness of its governance processes in managing the Company and enabling it to evolve in response to future challenges. There is also a 3-yearly independent external review, the most recent of which was conducted in late 2013. See page 36 for further details.
Operational and regulatory risks are regularly and extensively reviewed by Witan’s Audit Committee. WIS is subject to its own operating rules and regulations and is regulated by the Financial Conduct Authority (“FCA”). From 2014, WIS is expected to become the AIFM for Witan, which will entail it becoming more closely involved in a wide range of Witan’s operations. Ahead of this development, Witan and WIS are in the process of adapting the internal governance structure for review of the relevant risks and control framework.
Operationally the multi-manager structure is robust, as the investment managers, the custodian and the fund accountants keep their own records which are regularly reconciled. Management monitors the activities of all third parties and reports any signi cant issues to the Board.
Witan Investment Trust plc Annual Report 201320
Accounting, legal and regulatoryIn order to qualify as an investment trust the Company must comply with sections 1158-59 of the CorporationTax Act 2010 (‘CTA’). A breach of these sections couldresult in the Company losing investment trust status and,as a consequence, capital gains realised within the Company’s portfolio would be subject to Corporation Tax. The criteria are monitored by the CEO and reviewed at each Board meeting. The Company also carefully and regularly monitors compliance with the accounting rules a ecting investment trusts.
The Company is required to comply with the provisions of the Companies Act 2006 (‘Companies Act’), and the Company must also comply with the UK Listing Authority’s Listing Rules and Disclosure Rules (‘UKLA Rules’). A breach of the Companies Act could result in the Company and/or the directors being ned or becoming the subject of criminal proceedings. Breach of the UKLA Rules could result in the suspension of the Company’s shares which would in turn lead to a breach of the provisions of the CTA.
These legal and regulatory requirements o er signi cant protection for shareholders. The Board relies on the CEO, the Company Secretary and the Group’s professional advisers to ensure compliance with all applicable rules. WIS is regulated by the Financial Conduct Authority for the marketing and administration of savings plans and the provision of investment advice to professional clients. It will also assume additional responsibilities as the AIFM for Witan in 2014.
As noted in the Chairman’s and Chief Executive’s Statement, the Alternative Investment Fund Manager Directive became law in the UK in July 2013. The Company is reviewing its systems and procedures to ensure that it will be fully compliant with the Directive ahead of the deadline of July 2014. It remains the Company’s policy to meet best practice in complying with all applicable regulations.
Going concernThe assets of the Company consist mainly of securities that are readily realisable and, accordingly, the Company has adequate financial resources to continue in operational existence for the foreseeable future. Therefore, the directors believe that it is appropriate to continue to adopt the going concern basis in preparing the financial statements. In reviewing the position as at the date of this report, the Board has considered the guidance on this matter issued by the Financial Reporting Council. (See also note 16 on page 64).
ApprovalThis report was approved by the Board of Directors on 11 March 2014 and is signed on its behalf by:
Harry Henderson Andrew Bell Chairman Chief Executive 11 March 2014
Strategic reportCorporate and operational structure continued

Annual Report 2013 Witan Investment Trust plc 21
Financial Statements
Statutory Information
Strategic ReportReport of the D
irector sC
orporate Governance
Other Inform
ation
Artemis Investment Management – UKEstablished in 1997, Artemis Investment Management Limited manages over £17.3bn (as at 31.12.13) on behalf of a range of retail and institutional clients. Witan’s portfolio is a segregated mirror of Derek Stuart’s £1.9bn UK Special Situations Strategy launched in 2001 – a contrarian fund that aims to outperform the FTSE All-Share Index by 3% per annum. This approach seeks to exploit market ine ciencies, with an absolute return mindset, in order to generate maximum returns. It is a stock-picking strategy that aims to achieve long-term capital growth by focusing on stocks that are out of favour and have turnaround potential.
Equity Mandate Benchmark Investment style Inception date
UK FTSE All-Share Recovery/special situations
06.05.08
Lindsell Train – UKLindsell Train was established in 2000 by Michael Lindsell and Nick Train and focuses on the management of UK, Global and Japanese equity mandates for institutional clients. The business was founded on the shared investment philosophy that developed while Michael and Nick worked together during the early 1990s and which underlies the business today. The “purpose” of Lindsell Train is to provide a professional working environment that enables the rm to achieve strong investment results for their clients. Lindsell Train think it important to maintain a small and simple organisational structure that avoids the bureaucracy and distractions experienced within some larger, more complex investment management businesses. The structure is designed to allow the investment professionals to concentrate on investment issues and to give them the freedom to invest in line with their investment principles, which they believe will maximise returns to their investors over the longer term. The business has grown steadily and assets under management total £3.4bn (as at 31.12.13). Lindsell Train continues to be majority owned by the two founders. This is important because it ensures they maintain the integrity of the business principles on which the rm was founded.
Equity Mandate Benchmark Investment style Inception dateUK FTSE All-Share Long-term growth
from undervalued brands
01.09.10
Heronbridge Investment Management LLPHeronbridge is a long-only, value-biased equity investment management boutique. Founded in November 2005, it is a small, focused, independent rm, controlled by its working partners who were previously with Merrill Lynch Investment Managers, Silchester International Investors and Goldman Sachs Asset Management. Heronbridge currently manage £1.3bn (as at 31.12.13) for institutional and charity clients in the UK, the US and elsewhere. In order to maximise the alignment of interests, the rm’s partners have a considerable proportion of their own assets co-invested alongside those of clients.
Equity Mandate Benchmark Investment style Inception date
UK FTSE All-Share Intrinsic value growth
17.06.13
Lansdowne Partners LimitedLansdowne Partners Limited Partnership, acting through its general partner Lansdowne Partners Limited (“Lansdowne Partners”) was founded in 1998. Lansdowne Partners manages assets for a diversi ed client base that includes some of the world’s largest and most sophisticated investors. Assets under management are £10.5bn (as at 31.12.13) across three distinct Equity investment strategies; European, Developed Markets and Global Financials, each with its own dedicated team of portfolio managers and analysts, Lansdowne Partners employs 93 people in its London o ce. The investment philosophy is predicated on generating consistent, absolute risk adjusted returns, through the use of exceptional investment talent within a leading-edge operational infrastructure. Central to Lansdowne Partners’ investment philosophy is a rigorous process of fundamental research. The Developed Markets Strategy is run by Co-Heads Peter Davies and Stuart Roden, who have been with Lansdowne since 2001. The Developed Markets Long Only Strategy leverages the fundamental stock analysis of the team, investing predominantly in mega-cap companies (+$10bn market cap) in developed markets.
Equity Mandate Benchmark Investment style Inception date
Global DJ Global Titans Concentrated, benchmark-independent investment in developed markets
14.12.12
Investment managers
Witan Investment Trust plc Annual Report 201322
Pzena Investment Management Pzena Investment Management, an independent registered investment management rm, began managing assets in 1996. Pzena employs a classic value investment approach and manages U.S., non-U.S. and global portfolios with a goal of long-term alpha generation. As of31 December 2013, Pzena managed approximately £16.1bn in assets for leading endowments, foundations, pension plans and individual investors. The team comprises 71 employees; the rm is based in New York City, and has a representative o ce for Business Development and Client Services in Melbourne, Australia.
Equity Mandate Benchmark Investment style Inception date
Global FTSE All-World Systematic value 02.12.13
Tweedy, Browne Company LLCTweedy, Browne Company LLC is principally engaged in the management of international, global and global high dividend equity portfolios for institutional and individual clients. Since the rm was founded in 1920 as Tweedy & Co., a dealer in closely held and inactively traded securities, they have pursued a value oriented approach to securities, rst as a market maker, and later, as an investor and manager. Their investment principles are based upon the broad concepts of “intrinsic value” and “margin of safety” as conceived and practiced by the late Benjamin Graham. For more than ninety years, through depressions, recessions, and stock market cycles, through a quadrupling of interest rates and the advent of double digit in ation, and through the emergence and disappearance of numerous investment fads, they have adhered to the same value oriented principles of analysis and investment. The consistency of their results over many decades has con rmed their con dence in this approach. As at 31 December 2013, Tweedy Browne had £12.2bn of assets under management.
Equity Mandate Benchmark Investment style Inception date
Global FTSE All-World Fundamental value 02.12.13
MFS Investment ManagementMFS is a global investment rm managing £248.9bn (as at 31.12.13) of equity and xed income assets for investors worldwide. Founded in 1924, MFS established one of the industry’s rst in-house fundamental research departments in 1932. Today, MFS o ers a broad range of investment styles that combine both fundamental and quantitative research and portfolio management. Their investment philosophy has remained consistent: to identify opportunities on behalf of clients through the application of global research and bottom-up security selection. MFS’ culture is investment driven, client centred, and collaborative. To underscore their values of collaboration and accountability, they structure ownership and compensation to reward long-term investment performance and teamwork. Up to 22% ownership of MFS is available to key MFS contributors. Their majority shareholder since 1982 has been Sun Life of Canada (U.S.) Financial Services Holdings, Inc.
Equity Mandate Benchmark Investment style Inception date
Global FTSE All-World Growth at an attractive price
30.09.04
Veritas Asset Management Veritas is an independent investment company, managing £10.0bn (as at 31.12.13) of assets, with the key objective of deliveringlong-term real returns to its clients. Veritas aligns its interest with clients’ objectives and is committed to partnership. Veritas manages both segregated portfolios and funds, with either long-only orlong-short real return mandates. Their clients include institutions, charities, trusts and private clients. The Real Return Group Limited was set up in 2003 as a boutique focused on real return investing. The Real Return Group Limited and Veritas Asset Management (UK) Limited merged in 2004. In 2013 Veritas Asset Management (UK) Limited completed a corporate reorganisation and Veritas Asset Management LLP was formed as a regulated fund management boutique running Global and Asian Equity mandates. Veritas Asset Management LLP is the UK operating company of the Veritas Asset Partners Limited group, of which Veritas Asset Management (Asia) Limited in Hong Kong is also a subsidiary. The Real Return Group is 100% owned by management and employees and operates as a partnership.
Equity Mandate Benchmark Investment style Inception date
Global FTSE All-World Fundamental value, real return objective
11.11.10
Strategic reportInvestment managers continued

Annual Report 2013 Witan Investment Trust plc 23
Financial Statements
Statutory Information
Strategic ReportReport of the D
irector sC
orporate Governance
Other Inform
ation
Marathon Asset ManagementMarathon Asset Management was founded in 1986 and is totally independent, managing some £31.0bn (as at 31.12.13) of institutional client assets. At the heart of Marathon’s investment philosophy is the ‘capital cycle’ approach to investment. This is based on the idea that the prospect of high returns will attract excessive capital (and hence competition), and vice versa. In addition, the assessment of management and how they respond to incentives and the forces of the capital cycle is critical to the investment outcome. The investment philosophy is intrinsically contrarian. Given the long-term nature of the capital cycle, Marathon’s investment ideas generally require patience and, by industry standards, long stock holding periods.
Equity Mandate Benchmark Investment style Inception date
Pan- European FTSE All-World Developed Europe
Capital cycles 23.07.10
Trilogy Global AdvisorsTrilogy Global Advisors is a long-only specialist equity investment boutique managing global developed and global emerging market portfolios for institutional pension schemes. Founded in 1999, it is wholly independent with all the equity owned by the principal partners, other sta and non-executive directors. It has two investment o ces in New York and Orlando, Florida, and a marketing and client service o ce in London. Total assets under management comprise £9.0bn (as at 31.12.13) with approximately a third represented by UK pension fund clients and around a half of total assets managed in dedicated global emerging market equity portfolios.
Equity Mandate Benchmark Investment style Inception date
Emerging Markets MSCI Emerging Markets
Fundamental, growth orientated
09.12.10
Matthews International Capital Management (Matthews Asia)Matthews Asia, an independent, privately owned rm based in San Francisco, is the largest dedicated Asia only investment specialist in the U.S. Matthews has £15.6bn (as at 31.12.13) in assets under management, including an Asia Dividend portfolio managed for Witan Paci c Investment Trust since April 2012. Matthews Asia employs a fundamental, bottom-up investment process that seeks to identify companies with sustainable long-term growth prospects, strong business models, quality management teams and reasonable valuations. Matthews Asia will seek to invest its portion of the Trust in companies that are paying high dividends relative to their current share price, or are well positioned to do so in the future.
Equity Mandate Benchmark Investment style Inception date
Asia Paci c (including Japan)
MSCI Asia Paci c Free
Quality companies with dividend growth
22.02.13

Witan Investment Trust plc Annual Report 201324
Fifty largest equity investments at 31 December 2013 (unaudited)
CompanyMarket value of
holding £ million % of portfolio Country Sector
1 Reed Elsevier 28.3 1.96 UK Media
2 Diageo 24.8 1.73 UK Beverages
3 Electra Private Equity* 23.5 1.63 UK Equity Investment Instruments
4 BP 22.4 1.56 UK Oil & Gas Producers
5 Daily Mail & General 21.7 1.5 1 UK Media
6 London Stock Exchange 19.2 1.34 UK Financial Services
7 Google 18.8 1.31 USA Software & Computer Services
8 Unilever 18.5 1.29 UK Food Producers
9 Pearson 17.8 1.24 UK Media
10 Princess Private Equity 17.0 1.19 UK Equity Investment Instruments
11 Sage 16.4 1.14 UK Software & Computer Services
12 GlaxoSmithKline 16.3 1.14 UK Pharmaceuticals & Biotechnology
13 Vodafone Group 15.2 1.06 UK Mobile Telecommunications
14 Schroders 15.2 1.05 UK Financial Services
15 Aberforth Geared Income 14.7 1.01 UK Equity Investment Instruments
16 NB Distressed Debt 13.7 0.95 USA Equity Investment Instruments
17 JP Morgan Chase 12.9 0.90 USA Banks
18 Wells Fargo 11.8 0.82 USA Banks
19 Lloyds Banking 11.7 0.82 UK Banks
20 Burberry 11.4 0.79 UK Personal Goods
21 Edinburgh Dragon 3.5% Conv Bond 11.3 0.78 UK Equity Investment Instruments
22 Rathbone Brothers 11.2 0.78 UK Financial Services
23 Capita 11.1 0.77 UK Support Services
24 Microsoft 10.7 0.75 USA Software & Computer Services
25 Amazon 10.5 0.73 USA General Retailers
Top 25 406.1 28.25
26 Comcast 10.5 0.73 USA Media
27 Oracle 10.0 0.70 USA Software & Computer Services
28 Nike 10.0 0.69 USA Personal Goods
29 BT 9.8 0. 68 UK Fixed Line Telecommunications
30 Reckitt Benckiser 9.0 0.6 3 UK Household Goods & Home Construction
31 Greene King 9.0 0.6 3 UK Travel & Leisure
32 Roche Holdings 9.0 0.6 3 Switzerland Pharmaceuticals & Biotechnology
33 Imperial Tobacco 8.3 0.5 8 UK Tobacco
34 Lockheed Martin 8.3 0.5 7 USA Aerospace & Defence
35 Walt Disney 8.2 0.5 7 USA Media
36 Delta Air Lines 8.2 0.5 7 USA Travel & Leisure
37 Qualcomm 7.5 0.5 2 USA Technology Hardware & Equipment
38 Fidessa 7.3 0.5 1 UK Software & Computer Services
39 Barclays Bank 7.3 0.5 1 UK Banks
40 Euromoney 7.0 0. 49 UK Media
41 Unitedhealth 6.8 0.4 7 USA Health Care Equipment & Services
42 Colgate-Palmolive 6.7 0.4 7 USA Personal Goods
43 Orix 6.7 0.4 6 Japan Financial Services
44 Ses 6.6 0.4 6 Luxembourg Media
45 MTN 6.3 0.4 4 South Africa Mobile Telecommunications
46 International Consolidated Airline 6.2 0.4 4 UK Travel & Leisure
47 Citigroup 6.1 0.4 2 USA Banks
48 Hays 6.0 0.4 2 UK Support Services
49 Safran 5.8 0.4 1 France Aerospace & Defence
50 Hargreaves Lansdown 5.8 0.4 0 UK Financial Services
Top 50 598.5 4 1.65
The top 10 holdings represent 14. 8% of the total portfolio (2012: 17. 8%).The full portfolio is not listed because it contains over 4 00 companies. The above listing is of the largest individual equity investments and as such excludes a collective investment used to invest in Emerging Markets (which is valued at £51.0 million), a specialist insurance fund ( valued at £8.5 million), Japan equity funds valued at £20.5 million and an exchange traded FTSE All- World fund (which is valued at £36.1 million).*Includes convertible bonds valued at £ 4.3 million.

Annual Report 2013 Witan Investment Trust plc 25
Financial Statements
Statutory Information
Strategic ReportReport of the D
irector sC
orporate Governance
Other Inform
ation
Classi cation of investments at 31 December 2013 (unaudited)
Notes
United Kingdom
%
ContinentalEurope
%
NorthAmerica
%
Asia Paci c(ex Japan)
%Japan
%
LatinAmerica
%Other
%
Total2013
%
Basic Materials Chemicals – 1.0 0.2 0.2 0.1 – – 1.5
Industrial Metals & Mining – 0.1 – – – – – 0.1
Mining 0.4 0.3 – 0.2 – – – 0.9
0.4 1.4 0.2 0.4 0.1 – – 2.5
Consumer Goods Automobiles & Parts – 0.5 – 0.6 0.2 – – 1.3
Beverages 1.9 0.6 0.1 0.3 0.2 – – 3.1
Food Producers 1.4 0.5 – 0.2 0.2 – – 2.3
Household Goods & Home Construction 0.8 – 0.1 0.1 – – – 1.0
Leisure Goods – – – 0.1 – – – 0.1
Personal Goods 0.8 0.6 1.2 0.6 0.2 – – 3.4
Tobacco 0.9 0.1 – 0.2 0.3 – – 1.5
5.8 2.3 1.4 2.1 1.1 – – 12.7
Consumer Services Food & Drug Retailers 0.5 – 0.7 – 0.1 – – 1.3
General Retailers 0.3 – 1.8 0.1 – – – 2.2
Media 5.8 1.0 2.3 0.2 – – – 9.3
Travel & Leisure 2.9 0.2 0.9 0.1 – – – 4.1
9.5 1.2 5.7 0.4 0.1 – – 16.9
Financials Banks 1.9 1.3 2.3 0.5 0.1 0.2 0.1 6.4
Equity Investment Instruments 4.8 – 1.0 – – – – 5.8
Financial Services 4.7 0.2 1.4 0.2 0.4 – – 6.9
Life Insurance 0.9 0.2 0.1 – – – – 1.2
Nonlife Insurance 0.2 0.4 0.4 – 0.1 – – 1.1
Real Estate Investment Services 0.2 – – 0.1 – – – 0.3
Real Estate Investment Trusts – – – 0.3 – – – 0.3
12.7 2.1 5.2 1.1 0.6 0.2 0.1 22.0
Health Care Health Care Equipment & Services 0.3 0.7 2.3 0.9 0.1 – – 4.3
Pharmaceuticals & Biotechnology 1.5 1.1 0.6 – 0.1 – – 3.3
1.8 1.8 2.9 0.9 0.2 – – 7.6
Industrials Aerospace & Defence 0.5 0.5 0.8 0.2 – – – 2.0
Construction & Materials 0.1 0.4 – – – – – 0.5
Electronic & Electrical Equipment 0.8 0.5 0.2 0.3 0.3 – – 2.1
General Industrials 0.4 0.4 0.4 0.1 – – – 1.3
Industrial Engineering 0.2 0.3 0.2 0.3 – – 0.2 1.2
Industrial Transportation 0.2 0.1 0.3 0.2 – – – 0.8
Support Services 3.7 0.5 0.6 – 0.4 – – 5.2
5.9 2.7 2.5 1.1 0.7 – 0.2 13.1
Oil & Gas Alternative Energy – 0.1 – – – – – 0.1
Oil & Gas Producers 2.4 1.0 0.2 – – – – 3.6
Oil Equipment Services & Distribution 0.1 0.1 0.7 0.2 – – – 1.1
2.5 1.2 0.9 0.2 – – – 4.8
Technology Software & Computer Services 2.7 0.2 2.9 – – – – 5.8
Technology Hardware & Equipment 0.2 0.2 1.0 0.1 – – – 1.5
2.9 0.4 3.9 0.1 – – – 7.3
Telecommunications Fixed Line Telecommunications 0.7 0.2 – 0.3 – – – 1.2
Mobile Telecommunications 1.2 0.4 – 0.5 0.3 – 0.4 2.8
1.9 0.6 – 0.8 0.3 – 0.4 4.0
Utilities Electricity 0.2 0.1 0.1 – – – – 0.4
Gas, Water & Multiutilities – 0.1 – 0.2 – 0.3 – 0.6
0.2 0.2 0.1 0.2 – 0.3 – 1.0
Open-Ended Funds (see note 3) 0.3 0.9 1.6 2.3 1.6 0.7 0.7 8.1
Totals 2013 43.9 14.8 24.4 9.6 4.7 1.2 1.4 100.0
Totals 2012 46.7 16.5 19.5 11.4 1.1 2.3 2.5 100.0
1. The holding of £ 35m Japan equity index futures (2.5% of net assets) is not included in this classi cation.2. Included in the above are xed interest holdings (including convertibles) of £15,543,000 (2012: £28,704,000).3. Open-ended funds relates to the collective investment fund used to invest in Emerging Markets, a specialist insurance fund, two Japan equity fund s and an
exchange -traded MSCI global equity fund.

Witan Investment Trust plc Annual Report 201326
Board of Directors
H M Henderson Chairman (A), (C), (D)
Appointed a director in 1988, Harry Henderson became Chairman in March 2003. He was formerly a partner of Cazenove & Co. and subsequently a senior executive at Cazenove Group plc, retiring in 2002. Mr Henderson is Chairman of Witan Investment Services Limited. He is also a director of Cadogan Settled Estates Limited.
A L C Bell MA Chief Executive O cer (D)
Andrew Bell was appointed a director and Chief Executive O cer from February 2010. He is responsible for the overall management of Witan. Previously he worked at Rensburg Sheppards Investment Management Limited as Head of Research and as an equity strategist and Co-Head of the Investment Trusts team at BZW and Credit Suisse First Boston. Prior to the City, he worked for Shell in Oman, leaving to take a Sloan Fellowship at the London Business School. He is a non -executive director of Henderson High Income Trust plc and became Chairman of the Association of Investment Companies in January 2013.
R W Boyle MA, FCA Chairman of the Audit Committee (A), (B)
Robert Boyle was appointed a director in 2007. He is a Chartered Accountant and was a partner of PricewaterhouseCoopers LLP, where he was responsible for multi-national client accounts, specialising in the telecoms and media sectors: he was chairman of the PWC European Entertainment and Media Practice for twelve years, retiring in 2006. He is a non-executive director, and chairman of the audit committee, of Maxis Berhad (in Malaysia), Centaur Media plc and Prosperity Voskhod Fund Ltd (an AIM listed company).
J E B Bevan MA Director (A)
James Bevan was appointed a director in 2007. He is CIO, CCLA Investment Management. Before joining CCLA in November 2006, he was the Chief Investment O cer at Abbey. Prior to Abbey, he was Chief Investment O cer for Barclays Stockbrokers and Barclays Personal Investment Management, having joined BZW in 1988, following postgraduate research in applied economics and asset allocation at Cambridge University.

Annual Report 2013 Witan Investment Trust plc 27
Financial Statements
Statutory Information
Strategic ReportReport of the D
irector sC
orporate Governance
Other Inform
ation
(A) Independent non-executive directors.(B) Members of the Audit Committee which
is chaired by Mr Boyle. (C) Members of the Remuneration and Nomination
Committee which is chaired by Mrs Claydon.(D) Director of Witan Investment Services Limited.
M C Claydon BA, MBA Chairman of the Remuneration and Nomination Committee (A), (B), (C), (D)
Catherine Claydon joined the Board in 2009. Previously she was a Managing Directorin the Pension Advisory Group at Goldman Sachs (1992-2007) and Lehman Brothers (2007- 2008). She is a non-executive director of the Dunedin Income Growth Investment Trust. She is a trustee of the Barclays UK Pension Fund and the BT Pension Scheme, and an independent member of Unilever UK Pension Fund’s Investment Committee.
S E G A Neubert LLM Director (A), (D)
Suzy Neubert joined the Board in 2012. She is Sales & Marketing Director at J O Hambro Capital Management, which she joined in March 2006. She was previously Managing Director of Equity Markets within the Global Markets and Investment Banking Group at Merrill Lynch Securities in London. From 1993, she worked at Smith New Court Europe (later taken over by Merrill Lynch) as a European equity analyst and later as Director of European Equity Sales. Prior to Smith New Court, she worked at Hambros Bank as an Executive in the Corporate Finance division. She is a quali ed barrister.
R J Old eld BA Director (A), (C)
Richard Old eld joined the Board in 2011. He is chief executive of Old eld Partners, an investment management rm which he founded in 2005 after nine years as chief executive of a family investment o ce. Before that he was a director of Mercury Asset Management plc which he joined in 1977. He is chairman of the Oxford University investment committee and was chairman of Keystone Investment Trust plc from 2001 to 2010. He is a trustee of Royal Marsden Cancer Charity and of Canterbury Cathedral Trust.
A Watson CBE, BSc (Econ), ASIP, Barrister-at-Law, FCISI (Hons), D.Sc. (Hons) Senior Independent Director (A), (B)
Tony Watson was appointed a director in 2006. He was appointed Senior Independent Director in February 2008. He is a non-executive director of Hammerson plc, Lloyds Banking Group plc, Vodafone Group Plc and the Shareholder Executive. He was formerly chairman of the Trustees of the Marks & Spencer Pension Scheme , chairman of the Strategic Investment Board Limited (Northern Ireland) and a member of the Financial Reporting Council. Mr Watson retired in 2006 from an executive career in the investment management industry, most recently as Chief Executive of Hermes Fund Managers Limited.

Witan Investment Trust plc Annual Report 201328
Directors’ ReportStatutory Information
The directors present the Annual Report of the Group for the year ended 31 December 2013.
Activities and Business ReviewA review of the business is given in the Chairman’s and Chief Executive’s report on pages 4 to 7 and in the Strategic Report on pages 8 to 23. The Directors are required by the Companies Act to prepare a Strategic Report for each financial year, which contains a fair review of the business of the Group during the financial year ended 31 December 2013 and of the position of the Group at the end of the year and a description of the principal risks and uncertainties facing the Group. This information can be found within the Strategic Report on pages 18 to 20.
Investment PolicyThe Company’s investment policy is set out on the inside front cover.
StatusWitan Investment Trust plc (‘the Company’) is incorporated in the United Kingdom and registered in England and Wales and domiciled in the United Kingdom. It is an investment company as defined in section 833 of the Companies Act 2006 and operates as an investment trust in accordance with section 1158 of the Corporation Tax Act 2010. The Company has received confirmation from HM Revenue and Customs that it has been accepted as an approved investment trust with effect from 1 January 2012, provided it continues to meet the eligibility conditions of section 1158 and of the ongoing requirements for approved companiesin the Investment Trust (Approved Company) (Tax) Regulations 2012.
Subsidiary CompanyThe Company has one subsidiary company, Witan Investment Services Limited, which provides marketing services and investment products to the Company and executive management and marketing services to third party investment trust clients. Witan Investment Services Limited is authorised and regulated by the Financial Conduct Authority to manage savings schemes for investors and provide investment advice to professional investors.
ISAsThe Company intends to continue to manage its affairs so that its investments fully qualify for the stocks and shares component of an ISA and Junior ISA.
Substantial Share InterestsAs at 1 1 March 2014, the following had notified the Company of interests in the Company’s voting rights:
%
AXA Investment Managers SA 18.1 Legal & General Group plc (direct) 4. 5
The above percentages are calculated by applying the shareholdings as notified to the Company to the issued ordinary share capital as at 10 March 2014 (the shareholdings representing the voting rights).
AssetsAt 31 December 2013 the total net assets of the Group were £ 1,372.9 million (2012: £1,105.8 million). At this date the net asset value per ordinary share was 725.2p (2012: 581.8p).
Revenue and DividendThe total profit for the year was £ 303.9 million (2012: £146.3 million). A profit of £ 29.3 million is attributable to revenue (2012: £27.7 million). The profit for the year attributable to revenue has been applied as follows:
£’000
Distributed as dividends:
First interim of 3.3p per ordinary share(paid on 18 June 2013) 6,229Second interim of 3.3p per ordinary share(paid on 18 September 2013) 6,248Third interim of 3.3p per ordinary share(paid on 18 December 2013) 6,247Fourth interim of 4.5p per ordinary share(payable on 28 March 2014) 8,519Added to the revenue reserve 2,020
29,263
The directors have declared a fourth interim dividend instead of a final dividend in order to ensure that, as in previous years, the distribution is made to the shareholders before 5 April. The Company intends to grow the dividend in real terms, ahead of inflation.
Company Revenue AccountAs permitted by section 408 of the Companies Act 2006, the Company has not presented its own income statement. The profit on the revenue return of the Company dealt with in the accounts of the Group amounted to £29,150,000 (2012: £27,660,000).

Annual Report 2013 Witan Investment Trust plc 29
Financial Statements
Statutory Information
Strategic ReportReport of the D
irectors C
orporate Governance
Other Inform
ation
DirectorsThe current directors of the Company are shown on page s 26 and 27.
All the directors held office throughout the year under review. In addition, Mr R A Bruce held office until his retirement from the Board on 30 April 2013. At the Annual General Meeting on 30 April 2014, Mr Oldfield andMr Watson will retire in accordance with the Company’s Articles of Association and, being eligible, will seekre-election by shareholders. Mr Henderson will also retire and stand for re-election, as he has served as a director for more than nine years and is eligible to stand for re-election.The Board considers him to be independent despite his length of service. This is explained in more detail in sections 1 and 2 on page 33.
The Board’s policy on the frequency of the re-electionof directors is set out on page 34 in the CorporateGovernance Statement.
During the year the membership of the Audit Committee comprised Mr Boyle (Chairman), Mr Bruce, until his retirement on 30 April 2013, Mr Watson, and Mrs Claydon who was appointed as a member of the Committee on 6 August 201 3. During the year the membership of the Remuneration Committee comprised Mrs Claydon (Chairman),Mr Henderson and Mr Oldfield.
As noted on page 33, Mr Henderson was formerly a senior executive at Cazenove and a partner in its predecessor firm. As one of a number of institutional investors, the Company purchased in 2001 a holding of shares in Cazenove Group plc (‘Cazenove’), which was disposed of in 2013 (see note 10 (vi) on page 73).
No director was a party to, or had an interest in, any contract or arrangement with the Company at any time during the year or to the date of this report. With the exception ofMr Bell, no director has or had a service contract withthe Company.
Directors’ InterestsThe interests of the directors in the share capital of the Company are set out in the Directors’ Remuneration Report on page 46.
Directors’ Conflicts of InterestDirectors have a duty to avoid situations where they have, or could have, a direct or indirect interest that conflicts, or possibly could conflict, with the Company’s interests. With effect from 1 October 2008, the Companies Act 2006 (‘the Act’) has allowed directors of public companies to authorise such conflicts and potential conflicts, where appropriate, but only if the Articles of Association contain a provision to this effect. The Act also allows the Articles of Association to contain other provisions for dealing with directors’ conflicts of interest to avoid a breach of duty. There are two circumstances in which a potential conflict of interest can be permitted: either the situation cannot reasonably be regarded as likely to give rise to a conflict of interest or the matter has been authorised in advance by the directors. The Company’s Articles of Association, which were adopted by shareholders on 27 April 2010, give the directors the relevant authority required to deal with conflicts of interest.
Each of the directors has provided a statement of all conflicts of interest and potential conflicts of interest, if any, applicable to the Company. A register of conflicts of interest has been compiled and approved by the Board. The directors have also undertaken to notify the Chairman as soon as they become aware of any new potential conflicts of interest that need to be approved by the Board and added to the register, which is reviewed annually by the Board. It has also been agreed that directors will advise the Chairmanand the Company Secretary in advance of any proposed external appointment and new directors will be asked to submit a list of potential situations falling within the conflicts of interest provisions of the Act in advance of joining the Board. The Chairman will then determine whether the relevant appointment causes a conflict or potential conflict of interest and should therefore be considered by the Board. Only directors who have no interest in the matter being considered would be able to participate in the Board approval process. In deciding whether to approve a conflict of interest, directors will also act in a way they consider, in good faith, will be most likely to promote the Company’s success in taking such a decision. The Board can impose limits or conditions when giving authorisation if the directors consider this tobe appropriate.
The Board believes that its arrangements for the authorisation of conflicts have operated effectively since they were introduced on 1 October 2008. The Board also confirms that its procedures for the approval of conflicts of interest have been followed by all the directors.

Witan Investment Trust plc Annual Report 201330
Directors’ Report continued
Directors’ IndemnityThe Company’s Articles of Association allow the Company, subject to the provisions of UK legislation, to:
(a) indemnify any person who is or was a director, or a director of any associated company, directly or indirectly against any loss or liability, whether in connection with any proven or alleged negligence, default, breach of duty or breach of trust by him or her, or otherwise, in relation to the Company or any associated company; and
(b) purchase and maintain insurance for any person who is or was a director, or a director of any associated company, against any loss or liability or any expenditure he or she may incur, whether in connection with any proven or alleged negligence, default, breach of duty or breach of trust by him or her, or otherwise, in relation to the Company or any associated company.
Directors’ and officers’ liability insurance cover is in place in respect of the directors and was in place throughout the year under review.
Directors’ FeesThe report on the directors’ remuneration is set out on pages 44 to 54.
Financial Instruments and the Management of RiskBy its nature as an investment trust, the Company is exposed to market risk, price risk, currency risk, interest rate risk, liquidity risk and credit risk. The Company’s policies for managing these risks are outlined in note 14 to the accounts on pages 74 to 82.
Investment ManagersIt is the opinion of the directors that the continuing appointment of the investment managers listed on page 12 is in the interests of the Company’s shareholders as a whole and that the terms of engagement negotiated with them are competitive and appropriate to the investment mandates.
The Board reviews the appointments of the investment managers on a regular basis and makes changesas appropriate.
Share CapitalThe Company’s share capital comprises:
a) ordinary shares of 25p nominal value each (‘shares’)The voting rights of the shares on a poll are one vote for every four shares held (one vote per £1 of nominal value). At 31 December 2012 there were 190,079,500 shares in issue. During the year a total of 768,500 shares was bought back by the Company for cancellation. At 31 December 2013 there were 189,311,000 shares in issue and thus the number of voting rights was 47,327,750 on a poll. The Company’s Articles of Association permit the Company to purchase its own shares and to fund such purchases from its accumulated realised capital profits. At the AGM in April 2013 a special resolution was passed giving the Company authority, until the conclusion of the AGM in 2014, to make market purchases for cancellation of the Company’s ordinary shares up to a maximum of 28,398,105 shares (being 14.99% of the issued ordinary share capital as at 30 April 2013). At the date of this report, the Company had valid authority, outstanding until the conclusion of the AGM in 2014, to make market purchases for cancellation of 28,262,105 shares. The directors intend to seek a fresh authority at the AGM in April 2014. The Company makes use of share buybacks, purchasing shares for cancellation when they stand at a significant discount to NAV, with the objective of achieving a sustainable discount of 10% or less. Shares are not bought back unless the result is an increase in the net asset value per ordinary share.
In addition, although the Company’s shares currently remain at a discount, the Board is seeking powers at the forthcoming Annual General Meeting to buy shares into treasury, for possible reissuance in the event of the shares moving to a premium. Shares will only be re-sold from treasury at (or at a premium to) the net asset value per ordinary share.
The Company is also seeking shareholder approval to issue shares, up to 10% of the starting total, provided that such shares are issued at or at a premium to net asset value.
b) 2.7% preference shares of £1 nominal value each(‘2.7% preference shares’) The 2.7% preference shareholders have no rights to attend and vote at general meetings. At 31 December 2013 there were 500,000 2.7% preference shares in issue. Further details on the preference shares are given in note 17 onpage 83.

Annual Report 2013 Witan Investment Trust plc 31
Financial Statements
Statutory Information
Strategic ReportReport of the D
irectors C
orporate Governance
Other Inform
ation
c) 3.4% preference shares of £1 nominal value each(‘3.4% preference shares’) The 3.4% preference shareholders have no rights to attend and vote at general meetings. At 31 December 2013 there were 2,055,000 3.4% preference shares in issue. Further details on the preference shares are given in note 17 on page 83.
At the AGM in April 2013 a special resolution was passed giving the Company authority, until the conclusion of the AGM in 2014, to make market purchases for cancellation of the Company’s own 2.7% preference shares and 3.4% preference shares up to a maximum of all those in issue. This authority has not been used. Accordingly, as at 31 December 2013 the Company had valid authority, outstanding until the conclusion of the AGM in 2014, to make market purchases for cancellation of 500,000 2.7% preference shares and 2,055,000 3.4% preference shares. No preference shares were bought back between the year end and the date of this report. Accordingly, the Company has valid authority to make market purchases for cancellation of 500,000 2.7% preference shares and 2,055,000 3.4% preference shares. The directors intend to seek a fresh authority at the AGM in April 2014. There are no restrictions on the transfer of the Company’s share capital and there are no shares or stock which carry specific rights with regards to control of the Company.
Independent AuditorResolutions to reappoint Deloitte LLP as the Company’s auditor and to authorise the directors to determine their remuneration will be proposed at the forthcoming Annual General Meeting.
Directors’ Statement as to the Disclosure of Information to the AuditorEach of the directors at the date of approval of this report confirms that:
(1) so far as the director is aware, there is no relevant audit information of which the Company’s auditor is unaware; and
(2) the director has taken all the steps that he/she ought to have taken as a director to make himself/herself aware of any relevant audit information and to establish that the Company’s auditor is aware of that information.
This confirmation is given and should be interpreted in accordance with the provisions of section 418 of the Companies Act 2006.
Annual General Meeting The next AGM will be held at 2.30 pm on Wednesday 30 April 2014 at Merchant Taylors’ Hall, 30 Threadneedle Street, London EC2R 8JB. The formal notice of the AGM is set out in the accompanying circular to shareholders, together with explanations of the resolutions.
Greenhouse Gas Emissions The Company has a staff of six employees, operating from small serviced office premises. Accordingly it does not have any significant greenhouse gas emissions to report from its own operations, nor does it have responsibility for any other emission producing sources under the Companies Act 2006 (Strategic Report and Directors’ Reports) Regulations 2013, including those within its underlying investment portfolio.
By order of the Board
Frostrow Capital LLPSecretary
1 1 March 2014

Witan Investment Trust plc Annual Report 201332
Corporate governance statement
Background
The UK Listing Authority’s Disclosure and Transparency Rules (the ‘Disclosure Rules’) require listed companies to disclose how they have applied the principles and complied with the provisions of the UK Corporate Governance Code (the ‘ Corporate Governance Code’), as issued by the Financial Reporting Council (‘the FRC’). The provisions of the Corporate Governance Code, which was issued by the FRC in September 2012, were applicable in the year under review. The Corporate Governance Code can be viewed at www.frc.org.uk
The related Code of Corporate Governance (‘the AIC Code’), issued by the Association of Investment Companies (‘the AIC’), provides specific corporate governance guidelines to investment companies. The FRC has confirmed that AIC member companies who report against the AIC Code and who follow the AIC’s Corporate Governance Guide for Investment Companies (the ‘AIC Guide’) will be meeting their obligations in relation to the Corporate Governance Code and the associated disclosure requirements of the Disclosure Rules. The AIC Code issued in February 2013 was applicable in the year under review. The AIC Code can be viewed atwww.theaic.co.uk
ComplianceThe Board has considered the principles and recommendations of the AIC Code by reference to the AIC Guide. The AIC Code, as explained by the AIC Guide, addresses all the principles set out in the Corporate Governance Code, as well as setting out additional principles and recommendations on issues that are of specific relevance to the Company.
The Board considers that reporting against the principles and recommendations of the AIC Code and by reference to the AIC Guide (which incorporates the Corporate Governance Code) will provide better information to shareholders.
The Company has complied with the recommendations of the AIC Code and the best practice provisions of the Corporate Governance Code throughout the year ended 31 December 2013 except as set out below:
> The Corporate Governance Code (C.3.5) includes provisions relating to the need for an internal audit function. As explained on page 41, the Company does not have an internal audit function.
> The Corporate Governance Code (B.7.1) includes provisions relating to the annual re-election of all directors. As explained on page 34, the Company considers that this provision is inappropriate to the Company.
The Principles of the AIC CodeThe AIC Code is made up of twenty one principles. Its three sections cover the Board; board meetings and relations with the investment managers; and shareholder communications.

Annual Report 2013 Witan Investment Trust plc 33
Financial Statements
Statutory Information
Strategic ReportReport of the D
irectors C
orporate Governance
Other Inform
ation
Principles of the AIC Code Application of the principles
The Board1. The chairman should
be independent.Mr H M Henderson has been Chairman of the Company since the Annual General Meeting in March 2003; he joined the Board in 1988. The Board considers that Mr Henderson is, and has been since his appointment, an independent non-executive director. Independence stems from the ability to make those objective decisions that may be in con ict with the interests of management; this in turn is a function of con dence, integrity and judgement. Mr Henderson has served on the Board for more than nine years. Accordingly, he stands for re-election by the shareholders each year and will do so for as long as he continues to serve on the Board. The Board is rmly of the view, however, that length of service does not of itself impair a director’s ability to act independently; rather, a director’s longer perspective adds value to the deliberations of a well-balanced investment trust company board. The other independent non-executive directors, under the chairmanship of the Senior Independent Director, review and evaluate annually the performance and continuing independence of the Chairman.
Mr Henderson was formerly a partner of Cazenove & Co., the rm which for many years acted as the Company’s stockbroker. However, he did not have responsibility for or involvement with Cazenove’s role with the Company, being for many years responsible for aspects of Cazenove’s fund management division. Accordingly, the Board considers that the Chairman has no relationships that might create a con ict of interest between his interests and those of the other shareholders.
Mr A Watson was appointed as the Senior Independent Director in February 2008. As noted above, he takes the lead in the annual evaluation of the Chairman. He is also able to act as a sounding board for the Chairman and serve as an intermediary for the other directors, should this prove necessary, and to act as a channel of communication for shareholders in the event that contact through the Chairman has failed to resolve concerns or is inappropriate.
2. A majority of the board should be independent of the manager.
At 31 December 2013 the Board was composed of seven independent non-executive directors and one executive director (the Chief Executive Officer). The Board is therefore independent of the Company’s executive management. All the directors are wholly independent of the Company’s various investment managers. In the opinion of the Board, each of the directors is independent in character and judgement and there are no relationships or circumstances relating to the Company that are likely to affect their judgement (see also section 1 above).

Witan Investment Trust plc Annual Report 201334
Principles of the AIC Code Application of the principles
The Board3. Directors should be submitted for re-election at regular
intervals. Nomination for re-election should not be assumed but be based on disclosed procedures and continued satisfactory performance.
New directors stand for election by the shareholders at the annual general meeting of the Company that follows their appointment. Thereafter all directors stand for re-election at least every three years, as required by the Company’s Articles of Association. Directors who have served for more than nine years stand forre-election annually. There is currently one director with service of more than nine years: Mr H M Henderson, the Chairman.
The Board has reviewed Provision B.7.1 of the Corporate Governance Code, which states that all directors of FTSE 350 companies should be subject to annual election by shareholders. The Board considers that the annual re-election of all the directors is inappropriate to the Company. There are two main reasons for this view: (a) it appears to place excessive emphasis on the short term and insufficient emphasis on the need for an effective board to work together and to refresh its composition over time; and (b) there is some danger, because many small and nominee shareholders choose not to exercise their voting rights, that if all the directors seek re-election at once a minority of the shareholders could engineer the removal of the whole Board for reasons injurious to the interests of the Company’s investors as a whole. Therefore the Board considers it appropriate to continue to apply Provision B.7.1 as if the Company were not a constituent of the FTSE 350 Index, a view which a number of prominent institutional investors have shared.
Every year the Board reviews its composition and the composition of its two Committees. The Board’s Remuneration and Nomination Committee oversees this process. Further details are given under section 7 on page 36.
Corporate governance statement continued

Annual Report 2013 Witan Investment Trust plc 35
Financial Statements
Statutory Information
Strategic ReportReport of the D
irectors C
orporate Governance
Other Inform
ation
Principles of the AIC Code Application of the principles
The Board4. The board should have a policy on tenure, which is
disclosed in the annual report.New directors are appointed for an initial term ending three years from the date of their first annual general meeting after appointment and with the expectation that they will serve two three-year terms. The continuation of directors’ appointments is contingent on satisfactory performance evaluation and re-election at annual general meetings. Directors’ appointments are reviewed formally every three years by the Board as a whole. None of the non-executive directors has a contract of service and a director may resign by notice in writing to the Board at any time; there are no set notice periods. The Board’s tenure and succession policy seeks to ensure that the Board is well-balanced and refreshed regularly by the appointment of new directors with the skills and experience necessary, in particular, to replace those lost by directors’ retirements. Directors must be able to demonstrate their commitment to the Company, including in terms of time. The Board seeks to encompass past and current experience of various areas that is relevant to the Company’s objective and operations, the most important skill-sets being investment management, finance, marketing, financial services, risk management, custody and settlement, and investment banking. Specialist agents are used to assist with recruitment. While the roles and contributions of longer serving directors are subject to rigorous review, the Board is strongly of the view that length of service is only one factor and that the shareholders benefit from having directors with a longer perspective of the Company’s history and its place in the savings market. Therefore there is no absolute limit to the period for which a director may serve.
5. There should be full disclosure of information about the board.
Details of the directors are set out on pages 26 and 27. They demonstrate a broad range of investment, professional and commercial expertise and experience, gained overseas as well as in the United Kingdom.
6. The board should aim to have a balance of skills, experience, length of service and knowledge of the Company.
The Board considers that it has achieved this aim. Brief biographical details of each director are set out on pages 26 and 27 .
Board Diversity The Company welcomes the objectives of the Davies Report to improve the performance of corporate boards by encouraging the appointment of the best people from a range of differing perspectives and backgrounds. The Company recognises the benefits of diversity on the board, including gender, and takes this into account in its board appointments. The Company is committed to ensuring that its director search processes actively seek both men and women with the right qualifications so that appointments can be made, on the basis of merit, against objective criteria from a diverse selection of candidates. To this end the Board will continue to dedicate time to consider diversity during the director search process.
Witan Investment Trust plc Annual Report 201336
Corporate governance statement continued
Principles of the AIC Code Application of the principles
The Board7. The board should undertake a formal and rigorous
annual evaluation of its own performance and that of its committees and individual directors.
The Board has established a process to evaluate its performance on an annual basis. This process is based on open discussion and seeks to assess the strengths and weaknesses of the Board and its Committees. The Chairman leads on applying the conclusions of the evaluation. The Chairman reviews with each director his or her individual performance, contribution and commitment to the Company. The Senior Independent Director leads the annual evaluation of the Chairman and reviews the conclusions with him. The Board’s Remuneration Committee oversees this process. In addition, in consideration of Provision B.6.2 of the Corporate Governance Code, which states that evaluation of the board of FTSE 350 companies should be externally facilitated at least every three years, the Board concluded that, regardless of the size of the company, periodic external evaluation should add value to the process. Accordingly, in July 2013, the Board appointed BoardAlpha Limited to carry out an evaluation programme. The Board reviewed the report submitted to it and the Chairman has led on implementing those changes recommended by the report that the Board considered should be made. The report did not identify any material weaknesses or concerns. BoardAlpha Limited does not have any other connection with the Company.
8. Director remuneration should re ect their duties, responsibilities and the value of their time spent.
The Directors’ Remuneration Report on pages 44 to 54 details the process for determining the directors’ remuneration and sets out the amounts payable.
9. The independent directors should take the lead in the appointment of new directors and the process should be disclosed in the annual report.
The Board’s Remuneration and Nomination Committee oversees the recruitment process, which includes the use of a firm of non-executive director recruitment consultants. However, all the independent non-executive directors are asked to contribute and to consider serving on the sub-committee appointed to draw up the shortlist of candidates. Notwithstanding this, the Chairman would not expect to be involved in the selection of his successor.
10. Directors should be o ered relevant training and induction.
Directors newly appointed to the Board are provided with an introductory programme covering the Company’s strategy, policies and operations, including those outsourced to third parties. Thereafter, directors are given, on a regular and ongoing basis, key information on the Company’s investment portfolios, financial position, internal controls and details of the Company’s regulatory and statutory obligations (and changes thereto). The directors are encouraged to attend industry and other seminars, conferences and courses, if necessary at the Company’s expense, and to participate generally in industry events. A log of directors’ training is maintained and reviewed each year by the Audit Committee.
The directors have access to the advice and services of the Company’s executive team and of the Company Secretary, through its appointed representative, who are responsible to the Board for ensuring that Board procedures are followed and that applicable rules and regulations are complied with.
11. The chairman (and the board) should be brought into the process of structuring a new launch at an early stage.
This principle does not apply to the Company, which is a long established investment trust company.
Annual Report 2013 Witan Investment Trust plc 37
Financial Statements
Statutory Information
Strategic ReportReport of the D
irectors C
orporate Governance
Other Inform
ation
Principles of the AIC Code Application of the principles
Board meetings and the relationship with the manager12. Boards and managers should operate in a supportive,
co-operative and open environment.Typically, the Board meets approximately ten times each year. The Chief Executive Officer (who is himself a director), other representatives of the Company’s executive team and a representative of the Company Secretary expect to be present at all meetings. The Board devotes two full days each year to meetings with the Company’s investment managers and each investment manager sends representatives at least once a year. The Chairman seeks to encourage open debate within the Board and a supportive and co-operative relationship with the executive team and with the Company’s investment managers, advisors and support staff.
13. The primary focus at regular board meetings should be a review of investment performance and associated matters such as gearing, asset allocation, marketing/investor relations, peer group information and industry issues.
The Chief Executive Officer and his team monitor investment performance and all associated matters. He reports to each Board meeting, at which investment performance, asset allocation, gearing, marketing and investor relations are usually keyagenda items.
14. Boards should give su cient attention to overall strategy.
The Board is responsible for determining the strategic direction of the Company and for promoting its success. At least one of its meetings each year is devoted entirely to reviewing overall strategy and progress is monitored throughout the year.
15. The board should regularly review both the performance of, and contractual arrangements with, the manager (or executives of a self-managed company).
The Board’s Remuneration and Nomination Committee reviews the performance of and the contractual arrangements with the Chief Executive Officer. The Chief Executive Officer is responsible to the Board for reviewing the performance and the contractual arrangements of his staff. The Board’s Remuneration and Nomination Committee oversees this process.
The Chief Executive Officer leads on the selection and monitoring of the investment managers and their terms of reference, which are approved by the Board.
16. The board should agree policies with the manager covering key operational issues.
The Company manages its own operations through the Board as set out on page 39 . Each investment manager runs a discrete investment portfolio within the terms of the mandate given to them in an investment management contract. Further details are given on page 39. Shares are held by the Company’s custodian.
17. Boards should monitor the level of the share price discount or premium (if any) and, if desirable, take action to reduce it.
The Chief Executive Officer and his team monitor the share price and the discount to net asset value on a daily basis and he reports to every Board meeting.
The Board has a share buy-back programme that seeks to add to the net asset value per share and achieve a sustainable discount of not more than 10%.
18. The board should monitor and evaluate other service providers.
The Chief Executive Officer and his team are responsible for monitoring and evaluating the performance of the Company’s various service providers. The Board’s Audit Committee oversees this process.
Witan Investment Trust plc Annual Report 201338
Principles of the AIC Code Application of the principles
Shareholder communications19. The board should regularly monitor the shareholder
pro le of the company and put in place a system for canvassing shareholder views and for communicating the board’s views to shareholders.
The Chairman is responsible for ensuring that there is effective communication with the Company’s shareholders. He works closely with the Chief Executive Officer and there is regular liaison with the Company’s stockbroker. There is a process in place for analysing and monitoring the shareholder register and a programme for meeting or speaking with the institutional investors and with private client stockbrokers and advisors. In addition to the Chief Executive Officer, the Chairman, or the Senior Independent Director, expects to be available to meet the larger shareholders.
The Company encourages attendance at its Annual General Meeting as a forum for communication with the individual shareholders. The Notice of Annual General Meeting and related papers are sent to shareholders at least 20 working days before the meeting. The Chairman, the Chief Executive Officer, the Chairman of the Audit Committee and the Chairman of the Remuneration and Nomination Committee all expect to be present at the Annual General Meeting and able to answer questions from shareholders as appropriate. Details of the proxy votes received in respect of each resolution are made available to shareholders. The Chief Executive Officer makes a presentation to the meeting.
The directors may be contacted through the Secretary at the address shown on page 88.
20. The board should normally take responsibility for, and have a direct involvement in, the content of communications regarding major corporate issues even if the manager is asked to act as spokesman.
While the Chief Executive Officer and his team expect to lead on preparing and effecting communications with investors, all major corporate issues are put to the Board or, if time is of the essence, to a Committee thereof.
21. The board should ensure that shareholders are provided with su cient information for them to understand the risk: reward balance to which they are exposed by holding the shares.
The Board places importance on effective communication with investors and approves a marketing programme and budget each year to enable this to be achieved. Copies of the Annual Report and the Half Year Report are circulated to shareholders, to those who hold shares through the subsidiary company’s products and, where possible, to investors through other providers’ products and nominee companies (or written notification is sent when they are published on-line). In addition, the Company publishes a fact sheet monthly and its net asset value per share daily. All this information is readily accessible on the Company’s website (www.witan.com). The Company belongs to the Association of Investment Companies which publishes information to increase investors’ understanding.
Corporate governance statement continued

Annual Report 2013 Witan Investment Trust plc 39
Financial Statements
Statutory Information
Strategic ReportReport of the D
irectors C
orporate Governance
Other Inform
ation
The BoardThe Board is collectively responsible for the success of the Company. Its role is to provide leadership within a framework of prudent and effective controls that enable risk to be assessed and managed. The Board sets the Company’s strategic aims (subject to the Company’s Articles of Association and to such approval of the shareholders in general meeting as may be required from time to time) and ensures that the necessary resources are in place to enable the Company’s objectives to be met.
The Board has typically met approximately ten times a year and deals with the most important aspects of the Company’s affairs, including the setting of parameters for and the monitoring of investment strategy, the review of investment performance and the extent to which borrowings maybe used.
The Chief Executive Officer is responsible to the Board for the overall management of the Company including investment performance, business development, shareholder relations, marketing, investment trust industry matters, administration and unquoted investments. The duties of the Chief Executive Officer include leading on investment strategy and asset allocation, on the selection and monitoring of the investment managers and their terms of reference and on the use of derivatives. The Board sets limits on matters such as asset allocation, gearing and investment in derivatives, within which the Chief Executive Officer may operate athis discretion.
The Chief Executive Officer reports to each meeting of the Board. His report includes confirmation that the Board’s investment limits and restrictions and those which govern the Company’s tax status as an investment trust, have been adhered to.
The individual investment managers are each appointed to manage a discrete portfolio in accordance with guidelines which limit, for example, the markets in which they can invest, the size of each investment and the amount of cash that may be held in their portfolio in normal circumstances. They are not allowed to invest in unquoted securities, to borrow against the security of the portfolio, to sell stocks short or to use derivatives. The investment managers take decisions as to the purchase and sale of individual investments and are responsible for effecting those decisions on the best available terms. The Company receives monthly confirmation from each of the investment managers that they have carried out their duties in accordance with the terms of their investment mandates.
In addition to his responsibilities for the overall management of the Company, the Chief Executive Officer manages the Direct Holdings portfolio. A maximum of 10% of the Company’s gross assets (at the time of purchase) may be invested in this portfolio and there are restrictions on the number, size and type of investments that may be made.
The Chairman is responsible for ensuring that the directors are provided, in a timely manner, with management, regulatory and financial information that is clear, accurate and relevant, whether from the Chief Executive Officeror otherwise.
Matters specifically reserved for decision by the full Board have been defined. There is an agreed procedure for directors, in the furtherance of their duties, to take independent professional advice, if necessary, at the Company’s expense.
Board CommitteesThe Board has established an Audit Committee and a Remuneration and Nomination Committee. The membership of the Audit Committee and the Remuneration and Nomination Committee is set out on page s 26 and 27. The roles and responsibilities of the Committees are described in the Report of the Audit Committee on page s 42 and 43 and in the Directors’ Remuneration Report on pages 44 to 54.
Meetings of the Board and its Committees The number of formal meetings during the year of theBoard and its Committees, and the attendance of the individual directors at those meetings, is shown in the table that follows.
BoardAudit
Committee
Remuneration and
Nomination Committee
Number of meetings 11 3 2
H M Henderson 10 3* 2A L C Bell 11 3* 2*J E B Bevan 9 – –R W Boyle 11 3 –R A Bruce 4 of 4 1 of 1 –M C Claydon 10 0 of 1 2S E G A Neubert 10 – –R J Oldfield 10 – 2A Watson 10 3 –
* Not a member of the Committee but in attendance by invitation for all or part of the meetings.
All the directors attended the Annual General Meeting in April 2013 and the Board’s ‘Away Day’ in May 2013.

Witan Investment Trust plc Annual Report 201340
Corporate governance statement continued
Directors’ RemunerationThe directors’ remuneration is detailed in the Directors’ Remuneration Report on pages 44 to 54.
Accountability and Audit The directors’ statement of responsibilities in respect of the accounts is set out on page 55.
The report of the independent auditor is set out on page s 56 to 59.
The Board has delegated contractually to external agents, including the various investment managers, the management of the investment portfolio, global custody (which includes the safeguarding of the assets), the investment administration, management and financial accounting, company secretarial and certain other administrative requirements and the registration services. Each of these contracts was entered into after full and proper consideration by the Board of the quality and cost of the services offered, including the control systems in operation in so far as they relate to the affairs of the Company. The Board receives and considers regular reports from the investment managers and ad hoc reports and information are supplied to the Board from its other contractors as required.
Internal ControlThe Board has established an ongoing process for identifying, evaluating and managing the significant risks faced by the Company. This process accords with the Turnbull guidance, is subject to regular review by the Audit Committee and was fully in place during the year under review and up to the date of this annual report. The Board remains responsible for the Company’s system of internal control and has conducted its annual review of the effectiveness of the system, covering all the controls, including financial, operational and compliance controls and risk management systems. This review took into account points raised during the year in the regular appraisal of specific areas of risk. However, such a system is designed to manage rather than eliminate the risks of failure to achieve the Company’s business objectives and can only provide reasonable and not absolute assurance against material misstatement or loss.
In accordance with provisions C2 and C3 of the Corporate Governance Code the Board reviews the Company’s business risks at least once a year. These are analysed and recorded in a risk map. The Company receives from its main contractors formal reports which detail the steps taken to monitor the areas of risk and which report the details of any known internal control failures.
As described elsewhere, the management of Witan’s portfolio is outsourced to a number of third party investment managers around the world. There are currently 11 such investment managers as well as the Direct Holdings portfolio which is managed by the Chief Executive Officer.
The Chief Executive Officer has responsibility for a number of aspects of the management of the portfolio, including asset allocation, gearing and investment in derivatives. The Board has set guidelines in respect of each of these aspects within which he may operate. The Chief Executive Officer reports to the Board regularly on each of these areas, as well as on the overall performance of the Company and other mattersof significance.
Witan’s in-house executive management team is responsible for managing and controlling the relationships with the third party managers. The management team receives monthly reports on investment and compliance matters from each manager. During 2013, the investment managers were asked to provide detailed information on their operational structures and systems. The Board also receives each year from its investment managers reports on their internal controls; in most cases these include a report from the relevant company’s auditors on the control policies and procedures in operation.
The Chief Executive Officer makes regular reports to the Board on the performance of and activity within the Direct Holdings portfolio. In addition, the portfolio’s performance is independently measured by WM Performance Services, along with those of the third party managers.
The Company’s subsidiary, Witan Investment Services Limited, is authorised and regulated by the Financial Conduct Authority to provide investment products and services. The compliance structures required for these activities, including a compliance manual and a compliance monitoring programme, have been duly put into place.
The Company has a formal policy for staff to raise in confidence any concerns about possible improprieties, whether in matters of financial reporting or otherwise, for appropriate independent investigation. Its staff comprises only six people (including the Chief Executive Officer), who are well known to and have frequent formal and informal contact with the members of the Board.

Annual Report 2013 Witan Investment Trust plc 41
Financial Statements
Statutory Information
Strategic ReportReport of the D
irectors C
orporate Governance
Other Inform
ation
The Company does not have an internal audit function. It delegates to third parties the management of its investments and most of its other operations and employs only a small staff. The investment managers and certain other key contractors are subject to external regulation and most have compliance and internal audit functions of their own. The Company’s investments are held on its behalf by a global custodian. A specialist firm of investment accountants and administrators is responsible for investment administration, for maintaining accounting records and for preparing financial accounts, management accounts and other management information. Their work is reviewed by an independent accountant who also carries out some of the work that an internal audit function would cover. In addition, the Board receives from the investment administrator an annual report on its internal controls, including a report from its auditor on the control policies and procedures in operation. The investment performance of the investment managers, both individually and collectively, is measuredfor Witan by a company that is independent of all the investment managers. The corporate company secretary is a company with well-established experience in servicing investment trusts.
The appointment of these and other professional contractors provides a clear separation of duties and a structure of internal controls that is balanced and robust. The Board will continue to monitor its system of internal control in order to provide assurance that it operates as intended and the directors will review at least annually whether a function equivalent to an internal audit is needed.
Stewardship and the Exercise of Voting PowersIt is the Board’s view that, in order to achieve long-term success, companies need to maintain high standards of corporate governance and corporate responsibility. Therefore Witan expects the companies in which it is invested to comply with best practice in corporate governance matters, or to provide adequate explanation of any areas in which they fail to comply, whilst recognising that a different approach may be justified in special circumstances. In respect of UK companies, current best practice in corporate governance matters is set out in the UK Corporate Governance Code.
The Board encourages the Company’s appointed investment managers to engage with companies and to vote shares, in the best long-term interest of Witan shareholders but in accordance with their own investment philosophies. Where applicable, it monitors the policies of the investment managers in respect of the UK Stewardship Code. Elsewhere in the world it can be more difficult to vote shares as each country has its own rules and practices regarding shareholder notification, voting restrictions, registration conditions and share blocking, including, for example, dealing constraints. Therefore, w hilst the Company’s investment managers are apprised of the Company’s approach to the stewardship of its assets and the importance of sound corporate governance, they use their discretion according to their knowledge of the relevant circumstances. The investment managers report their compliance with the UK Stewardship Code, or equivalent legislation, to the Audit Committee each year.
In respect of the direct investments held, the Company’s executive management maintains regular touch with the management of the investee holdings and engages when issues arise that are controversial or potentially prejudicial to the interests of Witan’s shareholders. An annual report is provided to the Audit Committee in compliance with the UK Stewardship Code.
Witan Investment Trust plc Annual Report 201342
Statement by the Chairma n of the Committee
As Chairman of the Audit Committee (“the Committee”), I am pleased to present the Report of the Committee for the year ended 31 December 2013.
Composition and responsibilities of the CommitteeThe Committee comprises three non-executive directors, including its Chairman, who are appointed by the Board.I was appointed Chairman of the Committee in 2007. The Board has taken note of the requirement that at least one member of the Committee should have recent and relevant financial experience and is satisfied that the Committee is properly constituted in this respect, as I am a Chartered Accountant and was previously a partner in PricewaterhouseCoopers LLP. Mr Watson, who was appointed to the Committee in 2006, was a member of the Committee throughout the year. Mr Bruce was appointed to the Committee in 2002 and retired as a director in April 2013. Mrs Claydon was appointed to the Committee in August 2013. Details of their qualifications and experience are given on page s 26 and 27.
The role of the Committee is to assist the directors in applying financial reporting and internal control principles and to maintain an appropriate relationship with the Group’s auditor. The Committee’s role and responsibilities are set out in its terms of reference, which comply with the UK Corporate Governance Code. The terms of reference are available on request from the Company Secretary and can be seen on the Company’s website (www.witan.com). In summary, the Committee is responsible for monitoring the integrity of the Company’s financial statements, including consideration of the Company’s accounting policies and significant reporting judgements. It reviews the Company’s internal financial controls and risk management systems using an external consultant where appropriate.
RiskManagement has identified (Strateg ic Report pages 18 to 20) four main areas of risk: Market and Investment Portfolio, Operational, Corporate Governance and Accounting, Legal and Regulatory and has set out the actions taken to evaluate and manage these risks. The Auditors have also detailed two specific areas of risk in their report: Investmen t valuation and liquidity and ownership of investments and have set out the work they have performed to satisfy themselves that these have been properly reflected in the financial statements. The Committee reviews the various actions taken and satisfies itself that they are sufficient: in particular the Committee reviews management’s Risk Report at each meeting and requires amendments to both risks and mitigation actions if appropriate.
Meetings of the CommitteeThe Committee held three meetings during 2013, in February, August and November and also met in February 2014. Representatives of the external auditor were present at the meetings held in February 2013 and 2014 and November 2013. I report to the Board after each meeting on the main matters discussed at the meeting. In summary, the main matters dealt with at these meetings were as follows:
> Assessment of the controls to ensure the ownership, valuation and liquidity of investments: this includes assessing management reports on the controls andprocedures of external managers and the external custodian/administrator and the review of the audit work performed. No significant issues were identified.
> Interim and year end reporting, in the light of the requirements of the revised Code of Corporate Governance issued by the AIC, the Financial Reporting Council’s revised Guidance on Audit Committees and the requirement for a Strategic Report. The Committee agreed the process, timing and responsibility for compliance, and in particular ensured that there was a fuller explanation of the impact of the Company’s use of derivatives.
Report of the audit committee

Annual Report 2013 Witan Investment Trust plc 43
Financial Statements
Statutory Information
Strategic ReportReport of the D
irectors C
orporate Governance
Other Inform
ation
> A variety of more detailed matters including internal controls, whistleblowing, anti-money laundering compliance, data protection and business continuity.
> In the light of the relative simplicity of the operations and the use of independent external consultants to advise on regulatory compliance and adherence to internal procedures, it was concluded that no internal audit function was required (see page 41).
External auditThe Committee reviews the scope and effectiveness of the audit process, including agreeing the auditor’s assessments of materiality, and monitors the auditor’s independence and objectivity. It conducted a formal review of the performance of the auditor during the year and concluded that performance was satisfactory and there were no grounds for change.
Deloitte & Touche, a predecessor firm of Deloitte LLP, was first appointed as the Company’s auditor in March 1997. The audit was subject to competitive tender in 2007, at which time Deloitte LLP was reappointed. T he Committee reviews the performance of the auditors annually. Relevant guidance on audit rotation will be complied with when this has been finalised.
The Committee approved the proposed audit fee . There is a rule that a specified engagement of the auditor to provide non-audit services cannot exceed 50% of the annual audit fees without Committee approval. As noted in note 5 onpage 68, the Committee approved the appointment of Deloitte LLP to provide advice on one-off withholding tax claims for a fee of £15,000. The appointment, which was made on a one-off basis, was awarded on a competitive basis and the Committee satisfied itself that Deloitte’s audit team and tax advisory team were independent of each other.
Financial StatementsThe Board has requested the Committee to confirm that in its opinion the Board can make the required statement that the Annual Report taken as a whole is fair, balanced and understandable and provides the information necessary for shareholders to assess the Company’s performance, business model and strategy. The Committee has given this confirmation on the basis of its review of the whole document, underpinned by involvement in the planning for its preparation, review of the processes to assure the accuracy of factual content, and by assurances from the Remuneration and Nomination Committee.
ApprovalThis report was approved by the Committee on 10 March 2014 and is signed on its behalf by:
Robert BoyleChairman of the Audit Committee
1 1 March 2014
Witan Investment Trust plc Annual Report 201344
Directors’ remuneration report
Chairma n’s statement
IntroductionAs Chairman of the Remuneration and Nomination Committee (“the Committee”), I am pleased to present the Directors’ Remuneration Report for the year ended 31 December 2013.
This report covers the remuneration-related activities of the Committee for the year ended 31 December 2013. It sets out the remuneration policy and remuneration details for the non-executive and executive directors of the Company. It has been prepared in accordance with the Large and Medium-sized Companies and Groups (Accounts and Reports) (Amendment Regulations) 2013 (the “Regulations”) which came into force on 1 October 2013 and the requirements of the Association of Investment Companies. This is the first time that the Company has been required to report in accordance with the Regulations. The report is split into three main areas: this statement from me as Chairman of the Committee, an annual report on remuneration and a policy report. The policy report will be subject to a binding shareholder vote at the Annual General Meeting in 2014 and will take effect from 1 January 2015. The annual report on remuneration provides details on remuneration in the financial year ending 31 December 2013 and other information required by the Regulations. It will be subject to an advisory vote at the Annual General Meeting in 2014.
The Companies Act 2006 requires the auditors to report to shareholders on certain parts of the Directors’ Remuneration Report and to state whether, in their opinion, those parts of the report have been properly prepared in accordance with the Regulations. The parts of the annual report on remuneration that are subject to audit are indicated in the report.
Role of the CommitteeIt was agreed during the year that the Committee should be renamed the Remuneration and Nomination Committee (formerly the Remuneration Committee) to reflect its role more accurately.
The remuneration-related role of the Committee is essentially twofold. First, it has a role in respect of executive remuneration, assisting the directors in determining the remuneration of the Chief Executive Officer (the “CEO”) and evaluating his performance; and assisting the CEO in determining the remuneration arrangements for the Company’s staff. Second, in respect of the non-executive directors, it serves as the Board’s nomination committee with responsibility for reviewing the effectiveness and composition of the Board and considering the remuneration of the non-executive directors. The Committee’s role and responsibilities are set out in its terms of reference, which are available on request from the Company Secretary and can be found on the Company’s website.
The Committee normally consists of three non-executive directors, including its Chairman, who are appointed by the Board. During the year I served as Chairman of the Committee and Mr H M Henderson and Mr R J Oldfield were members of the Committee. I was appointed to the Committee, and to act as its Chairman, in 2009. Mr Henderson and Mr Oldfield were appointed to the Committee in 2003 and 2011 respectively.
The Committee’s programme is to meet formally at least twice a year and on such other occasions as required. The Committee held two formal meetings during the year, during which it addressed all the remuneration-related matters under its remit.
There have been no substantial changes in the Company’s approach to the remuneration of the CEO, or the fees payable to non-executive directors, during the year. In February 2014, the Committee undertook a review of the non-executive directors’ fees. The Committee’s recommendation, to which the Board agreed, was for non-executive directors’ fees to be increased with effect from 1 April 2014 by £3,000 per annum in respect of the non-executive directors other than the Chairman and £5,000 per annum in respect of the Chairman of the Company. The additional fee payable to the Chairman of the Audit Committee was increased from £4,000 to £6,000 per annum. This will be the first increase since 1 April 2011. Accordingly, with effect from 1 April 2014, the non-executive directors’ fees will be paid at the following annual rates: £
Chairman of the Compan y 57,000 Chairman of the Audit Committee 36,000 Chairman of the Remuneration and Nomination Committee 34,000 Senior Independent Director 34,000 Other non-executive directors 30,000
The implementation of the Alternative Investment Fund Managers Directive is expected to result in additional duties for non-executive directors. The degree to which this is required will be reviewed after the future regulatory structure has taken full effect to determine what, if any, additional remuneration may be appropriate.
The aggregate non-executive directors’ fees currently amount to £225,500 per annum. This will increase to £251,000 with effect from 1 April 2014.
The Company’s Articles of Association currently limit the aggregate fees payable to the non-executive directors to £300,000 per annum. The Board has agreed to seek an increase in this limit and a resolution will be put to the Annual General Meeting in April 2014 which, if passed, will increase the aggregate maximum to £350,000 per annum.
Catherine ClaydonChairman of the Remuneration and Nomination Committee
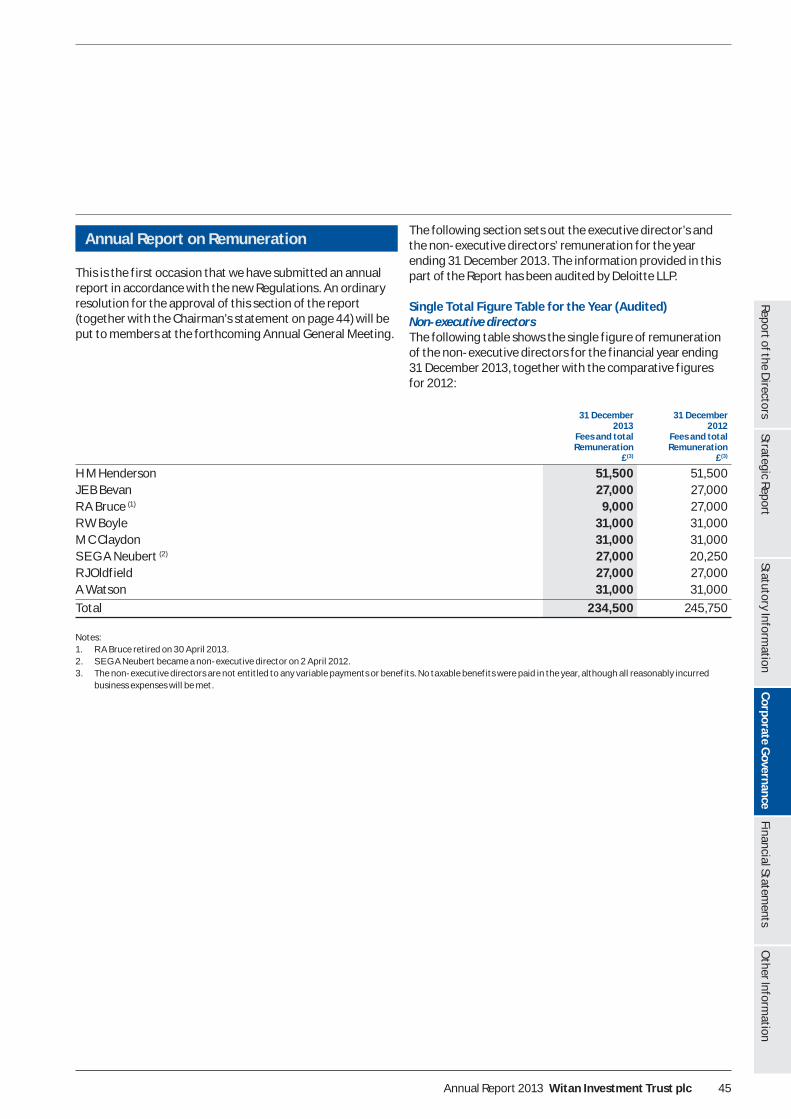
Annual Report 2013 Witan Investment Trust plc 45
Financial Statements
Statutory Information
Strategic ReportReport of the D
irectors C
orporate Governance
Other Inform
ation
Annual Report on Remuneration
This is the first occasion that we have submitted an annual report in accordance with the new Regulations. An ordinary resolution for the approval of this section of the report (together with the Chairman’s statement on page 44) will be put to members at the forthcoming Annual General Meeting.
The following section sets out the executive director’s and the non-executive directors’ remuneration for the year ending 31 December 2013. The information provided in this part of the Report has been audited by Deloitte LLP. Single Total Figure Table for the Year (Audited) Non-executive directorsThe following table shows the single figure of remuneration of the non-executive directors for the financial year ending 31 December 2013, together with the comparative figures for 2012:
31 December2013
Fees and totalRemuneration
£ (3)
31 December2012
Fees and totalRemuneration
£ (3)
H M Henderson 51,500 51,500J E B Bevan 27,000 27,000R A Bruce (1) 9,000 27,000R W Boyle 31,000 31,000M C Claydon 31,000 31,000S E G A Neubert (2) 27,000 20,250R J Oldfield 27,000 27,000A Watson 31,000 31,000
Total 234,500 245,750
Notes:1. R A Bruce retired on 30 April 2013.2. S E G A Neubert became a non-executive director on 2 April 2012.3. The non-executive directors are not entitled to any variable payments or benefits. No taxable benefits were paid in the year, although all reasonably incurred
business expenses will be met.
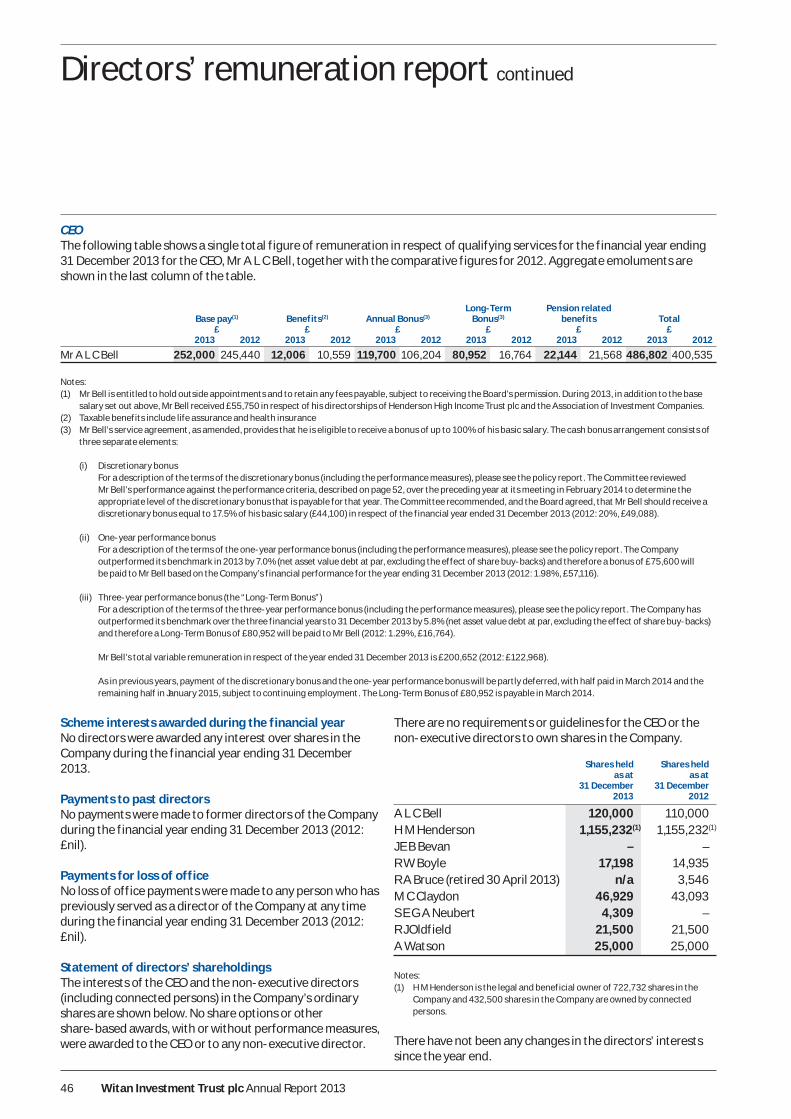
Witan Investment Trust plc Annual Report 201346
Directors’ remuneration report continued
CEOThe following table shows a single total figure of remuneration in respect of qualifying services for the financial year ending 31 December 2013 for the CEO, Mr A L C Bell, together with the comparative figures for 2012. Aggregate emoluments are shown in the last column of the table.
Base pay(1)
£Benefits(2)
£Annual Bonus(3)
£
Long- TermBonus(3)
£
Pension related benefits
£Total
£ 2013 2012 2013 2012 2013 2012 2013 2012 2013 2012 2013 2012
Mr A L C Bell 252,000 245,440 12,006 10,559 119,700 106,204 80,952 16,764 22,144 21,568 486,802 400,535
Notes:(1) Mr Bell is entitled to hold outside appointments and to retain any fees payable, subject to receiving the Board’s permission. During 2013, in addition to the base
salary set out above, Mr Bell received £55,750 in respect of his directorships of Henderson High Income Trust plc and the Association of Investment Companies. (2) Taxable benefits include life assurance and health insurance (3) Mr Bell’s service agreement, as amended, provides that he is eligible to receive a bonus of up to 100% of his basic salary. The cash bonus arrangement consists of
three separate elements:
(i) Discretionary bonus For a description of the terms of the discretionary bonus (including the performance measures), please see the policy report. The Committee reviewed
Mr Bell’s performance against the performance criteria, described on page 52, over the preceding year at its meeting in February 2014 to determine the appropriate level of the discretionary bonus that is payable for that year. The Committee recommended, and the Board agreed, that Mr Bell should receive a discretionary bonus equal to 17.5% of his basic salary (£44,100) in respect of the financial year ended 31 December 2013 (2012: 20%, £49,088).
(ii) One-year performance bonus For a description of the terms of the one-year performance bonus (including the performance measures), please see the policy report. The Company
outperformed its benchmark in 2013 by 7.0 % (net asset value debt at par, excluding the effect of share buy-backs) and therefore a bonus of £75,600 will be paid to Mr Bell based on the Company’s financial performance for the year ending 31 December 2013 (2012: 1.98%, £57,116).
(iii) Three -year performance bonus (the “Long-Term Bonus”) For a description of the terms of the three-year performance bonus (including the performance measures), please see the policy report. The Company has
outperformed its benchmark over the three financial years to 31 December 2013 by 5. 8% (net asset value debt at par, excluding the effect of share buy-backs) and therefore a Long-Term Bonus of £80,952 will be paid to Mr Bell (2012: 1.29%, £16,764).
Mr Bell’s total variable remuneration in respect of the year ended 31 December 2013 is £200,652 (2012: £122,968).
As in previous years, payment of the discretionary bonus and the one-year performance bonus will be partly deferred, with half paid in March 2014 and the remaining half in January 2015, subject to continuing employment. The Long-Term Bonus of £80,952 is payable in March 2014.
Scheme interests awarded during the financial yearNo directors were awarded any interest over shares in the Company during the financial year ending 31 December 2013.
Payments to past directors No payments were made to former directors of the Company during the financial year ending 31 December 2013 (2012: £nil).
Payments for loss of officeNo loss of office payments were made to any person who has previously served as a director of the Company at any time during the financial year ending 31 December 2013 (2012: £nil).
Statement of directors’ shareholdingsThe interests of the CEO and the non-executive directors (including connected persons) in the Company’s ordinary shares are shown below. No share options or othershare-based awards, with or without performance measures, were awarded to the CEO or to any non-executive director.
There are no requirements or guidelines for the CEO or the non-executive directors to own shares in the Company.
Shares held as at
31 December 2013
Shares held as at
31 December 2012
A L C Bell 120,000 110,000H M Henderson 1,155,232(1) 1,155,232(1)
J E B Bevan – –R W Boyle 17,198 14,935R A Bruce (retired 30 April 2013) n/a 3,546M C Claydon 46,929 43,093S E G A Neubert 4,309 –R J Oldfield 21,500 21,500A Watson 25,000 25,000
Notes:(1) H M Henderson is the legal and beneficial owner of 722,732 shares in the
Company and 432,500 shares in the Company are owned by connected persons.
There have not been any changes in the directors’ interests since the year end.

Annual Report 2013 Witan Investment Trust plc 47
Financial Statements
Statutory Information
Strategic ReportReport of the D
irectors C
orporate Governance
Other Inform
ation
None of the directors had an interest in the secured bonds, debenture stock or preference shares of the Company.
Total Shareholder Return performance graphThe line graph below sets out the Company’s five-year total shareholder return performance relative to the FTSE A ll-Share Index and the FTSE World (ex UK) Index (sterling adjusted). This line graph assumes a notional investment of £1 00 into the Indices on 31 December 2008 and the reinvestment of all income, excluding dealing expenses.
100
125
150
175
200
225
2008
FTSE All-Share Total Return
Witan Total Return
FTSE World (ex UK) Total Return
2009 2010 2011 2012 2013
Benchmark
Source: Datastream
The Company is required to compare the Company’s share price with a single broad equity market index. The Company has compared the share price total return against (i) a UK market index, namely the FTSE All-Share Index because the Company’s shares are listed on the UK market and the UK forms the largest constituent of the Company’s benchmark; and also (ii) a global index, namely the FTSE World (ex UK) Index because more than half of the Company’s investments are held in overseas companies. The performance of the Company’s benchmark is also shown.
CEO remuneration table
Year ended 31 December
CEO singlefigure of total remuneration
£
Annual discretionary and one-year
bonuspay-out against
maximum %
Long-term bonus
pay-out against
maximum%
2013 – Mr Bell 486,802 95.0 64.22012 – Mr Bell 400,535 86.5 13. 72011 – Mr Bell 314,160 40.0 n/a2010 – Mr Bell 409,495 100.0 n/a2010 – Mr Clarke(1) 111,318 15.0 n/a2009 – Mr Clarke(1) 253,273 30.0 n/a
Note(1) Mr R E Clarke was the CEO until 8 February 2010, when Mr Bell was appointed.
Percentage change in remuneration of CEOThe table below shows how the percentage change in the CEO’s salary, benefits and bonus between 2012 and 2013 compares with the percentage increase in each of those components of pay for the Group’s employees taken as a whole:
Percentage increase in remuneration in
2013 compared with remuneration in 2012
CEO%
Employees%
Salary and fees 3 4
All taxable benefits 14 27
Annual bonuses (discretionary and one-year performance) 13 (8)
Long- Term Bonus 383 n/a
Total 23 3
Relative importance of spend on pay2013 2012 Difference
Spend £000 £000 £000
Fees of non-executive directors 235 246 (11)Remuneration paid to or receivable by all employees of the Group (including the CEO) in respect of the year 1, 0 89(1) 647 44 2
D ividends paid to shareholders in respect of the year ending31 December 2013 27,243 25,079 2,164Share buybacks 4,437 10,777 (2)
Total payments to shareholders 31,680 35,856
(1) Includes an accrual for future payment of the CEO’s three year performance bonus, subject to performance being sustained and to his continued employment with the Company.
(2) Share buyback activity reflects changes in the discount, which narrowed during the year (see further comments on page 5).
Statement of implementation of remuneration policy in 2014The Company will not be formally implementing the approved remuneration policy in the current financial year, as the approved remuneration policy will not take effect until1 January 2015, although details of the fee increases for 2014 are set out in the Chairman’s statement.
Consideration by the directors of matters relating to directors’ remunerationThe Board as a whole sets the fees that are payable to the non-executive directors and it has appointed the Committee to consider matters relating thereto. The Committee also considers the remuneration of the CEO and makes a recommendation on this to the Board for its approval.

Witan Investment Trust plc Annual Report 201348
Directors’ remuneration report continued
The Committee was not provided with advice or services, during the financial year ending 31 December 2013, in respect of the fees payable to the non-executive directors or the remuneration payable to the CEO. The Committee assesses the workload and responsibilities of the non-executive directors and reviews, from time to time, the fees paid to non-executive directors of other investment trust companies.
Herbert Smith Freehills LLP provided legal advice to the Company throughout the year, including in relation to the operation of the Company’s incentive arrangements and on the CEO’s service agreements. This advice was available to be considered by the Committee.
The table below sets out the members of the Committee who were present during any consideration of the CEO’s remuneration, and shows the number of meetings attended by each non-executive director:
NameNumber of meetings
attended
M C Claydon 2/2H M Henderson 2/2R J Oldfield 2/2
Statement of shareholder votingAt the Annual General Meeting held on 30 April 2013, an ordinary resolution to approve the Directors’ Remuneration Report for the year ended 31 December 2012 was passed on a show of hands. The proxy votes were as follows:
Votes for
Votesagainst
Votes at proxies’
discretionVotes
withheld
Total votes cast (excluding
votes withheld)
26,102,706 373,253 78,499 360,870 26,554,458
98.3% 1.4% 0.3% – 100%
The Company is committed to on-going shareholder dialogue and takes an active interest in voting outcomes. Where there are substantial votes against resolutions in relation to directors’ remuneration, the reasons for any such vote will be sought and any actions in response will be detailed in future Remuneration Reports. There were no substantial shareholder votes against the resolution at the Annual General Meeting in 2013.
Remuneration Policy
This is the first occasion that we have submitted this report on our remuneration policy in accordance with the new Regulations. There has not been any significant change in policy from the previous year.
An ordinary resolution for the approval of this policy will be put to members at the forthcoming Annual General Meeting and, if the resolution is passed by the members, this policy will take effect from 1 January 2015. All provisions of this policy are expected to remain in effect until the Annual General Meeting in 2017 when the Company is next required to submit its remuneration policy to its members.
The terms of the CEO’s Long-Term Bonus was specifically approved at the 2013 Annual General Meeting. Non-executive directorsAll the directors are non-executive, with the exception of the CEO. New directors are appointed for an initial term ending three years from the date of their first annual general meeting after appointment and with the expectation that they will serve two three-year terms. The continuation of directors’ appointments is contingent on satisfactory performance evaluation and re-election at annual general meetings.Non-executive directors’ appointments are reviewed formally every three years by the Board as a whole. Each of thenon-executive directors has a letter of appointment which sets out the terms on which they provide their services. Anon-executive director may resign by notice in writing to the Board at any time; there are no set notice periods.

Annual Report 2013 Witan Investment Trust plc 49
Financial Statements
Statutory Information
Strategic ReportReport of the D
irectors C
orporate Governance
Other Inform
ation
Remuneration policy for non-executive directorsThe following table provides a summary of the key elements of the remuneration of the non-executive directors:
Purpose Operation
Fees Fees payable to the directors should reflect the time committed to the Company’s affairs and should be sufficient to enable candidates of high calibre to be recruited.
There are no performance-related elements and no fees are subject to claw-back provisions.
Non-executive directors are to be remunerated in the form of fees, payable monthly in arrears, to the director personally or to a third party specified by him. There are no long-term incentive schemes or pension arrangements and the fees are not specifically related to their performance, either individually or collectively.
The Committee determines the level of fee at its discretion. The fees are reviewed each year, although such review will not necessarily result in any increase in the fees. Proposed increases in fees are determined in the light of increases in inflation and in the Company’s share price, net asset value and dividend payments.
The Chairman of the Board, the Chairmen of the Board’s Committees and the Senior Independent Director are paid higher fees than the other non-executive directors in recognition of their more onerous roles (see below).
The Chairman of the Board receives a fee of £57,000 per annum. The Senior Independent Director receives a fee of £4,000 in addition to the annual base fee.
Each non-executive director’s annual base fee is £30,000.
Additional fees are payable as follows:
> Chairman of Audit Committee £6,000;
> Chairman of Remuneration and Nomination Committee £4,000.
All of the above fees will take effect on 1 April 2014. The maximum amount of fees, in aggregate, that may be paid to non-executive directors in any financial year is £300,000 (although a resolution has been put to the Annual General Meeting in April 2014 which, if passed, will increase the aggregate maximum to £350,000).
Directors’ and officers’ liability insurance cover is held by the Company in respect of all the directors (including the CEO).
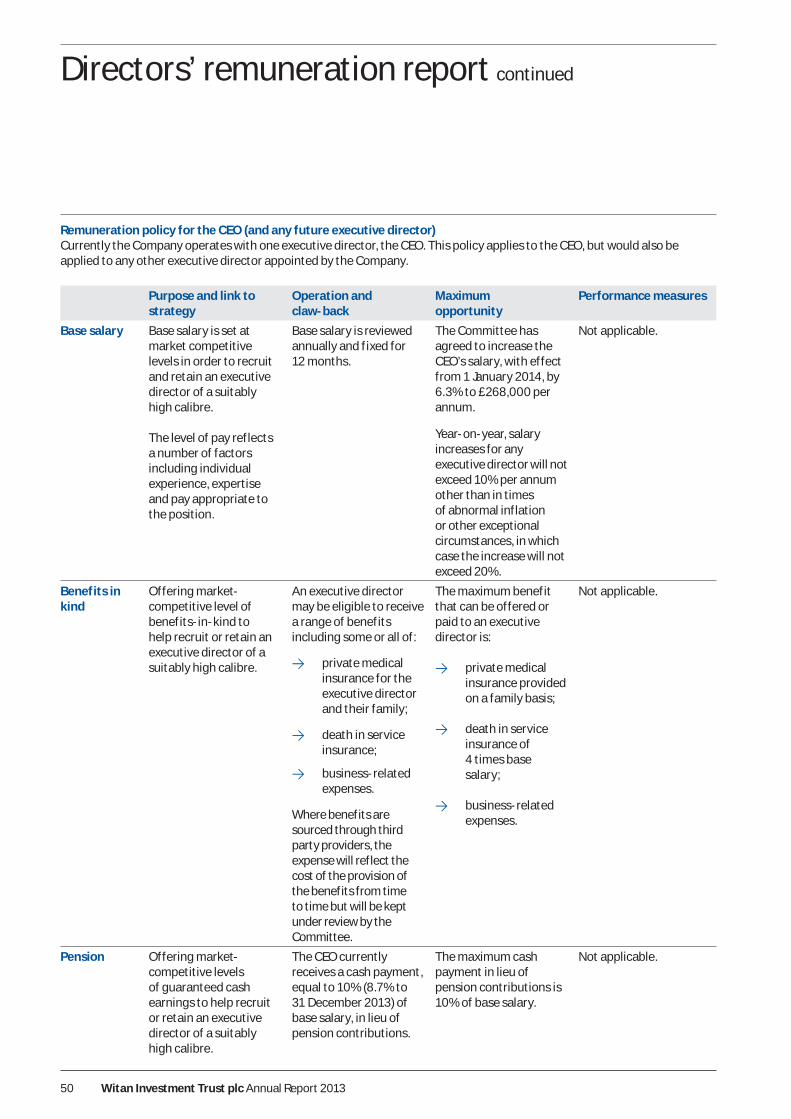
Witan Investment Trust plc Annual Report 201350
Directors’ remuneration report continued
Remuneration policy for the CEO (and any future executive director)Currently the Company operates with one executive director, the CEO. This policy applies to the CEO, but would also be applied to any other executive director appointed by the Company.
Purpose and link to strategy
Operation andclaw-back
Maximumopportunity
Performance measures
Base salary Base salary is set at market competitive levels in order to recruit and retain an executive director of a suitably high calibre.
The level of pay reflects a number of factors including individual experience, expertise and pay appropriate to the position.
Base salary is reviewed annually and fixed for12 months.
The Committee has agreed to increase the CEO’s salary, with effect from 1 January 2014, by 6.3% to £268,000 per annum.
Year-on-year, salary increases for any executive director will not exceed 10% per annum other than in times of abnormal inflation or other exceptional circumstances, in which case the increase will not exceed 20%.
Not applicable.
Benefits in kind
Offering market-competitive level of benefits-in-kind to help recruit or retain an executive director of a suitably high calibre.
An executive director may be eligible to receive a range of benefits including some or all of:
> private medical insurance for the executive director and their family;
> death in service insurance;
> business-related expenses.
Where benefits are sourced through third party providers, the expense will reflect the cost of the provision of the benefits from time to time but will be kept under review by the Committee.
The maximum benefit that can be offered or paid to an executive director is:
> private medical insurance provided on a family basis;
> death in service insurance of 4 times base salary ;
> business-related expenses.
Not applicable.
Pension Offering market-competitive levels of guaranteed cash earnings to help recruit or retain an executive director of a suitably high calibre.
The CEO currently receives a cash payment, equal to 10% (8.7% to 31 December 2013) of base salary, in lieu of pension contributions.
The maximum cash payment in lieu of pension contributions is 10% of base salary.
Not applicable.

Annual Report 2013 Witan Investment Trust plc 51
Financial Statements
Statutory Information
Strategic ReportReport of the D
irectors C
orporate Governance
Other Inform
ation
Purpose and link to strategy
Operation andclaw-back
Maximumopportunity
Performance measures
Discretionary bonus
The purpose of the bonus arrangements is to incentivise the CEO to maximise the Company’s performance and its return to shareholders.
The CEO is eligible to receive a discretionary bonus of up to 20% of basic annual salary. The Committee will review the CEO’s performance against the performance criteria to determine the appropriate level of bonus payable in respect of the preceding year.
The Committee may reduce any bonus payment that would otherwise be payable in order to comply with the FCA Remuneration Code.
The maximum cash bonus payable to any executive director is 20% of base salary.
Please see Note 1 on page 52 for details of the performance measures subject to the CEO’s discretionary bonus.
One-year performance bonus
The purpose of the bonus arrangements is to incentivise the CEO to maximise the Company’s performance and its return to shareholders
The CEO is eligible to receive a bonus of up to 30% of base salary by reference to the performance of the Company over the previous financial year.
The Committee may reduce any bonus payment that would otherwise be payable in order to comply with the FCA Remuneration Code.
The maximum cash bonus payable to any executive director is 30% of base salary.
Please see Note 1 on page 52 for details of the performance measures subject to the CEO’s one-year performance bonus.
Long-Term Bonus
The purpose of the bonus arrangements is to incentivise the CEO to maximise the Company’s performance and its return to shareholders.
The CEO is eligible to receive a bonus of up to 50% of base salary by reference to the performance of the Company over the previous three financial years.
The Committee may reduce any bonus payment that would otherwise be payable in order to comply with the FCA Remuneration Code.
The maximum cash bonus payable to any executive director is 50% of base salary.
Please see Note 1 on page 52 for details of the performance measures subject to the CEO’s Long-Term Bonus.

Witan Investment Trust plc Annual Report 201352
Directors’ remuneration report continued
Notes:
1. Performance measuresMr Bell’s service agreement, as amended, provides that he is eligible to receive a bonus of up to 100% of his basic salary. The cash bonus arrangement consists of three separate elements as set out below:
(i) Discretionary bonusEach year Mr Bell is eligible to receive, at the absolute discretion of the Committee, a cash bonus of up to 20% of his basic annual salary. The Committee has determined a number of criteria that it may take into account, including the management and administration of the Company and reporting to the Board, shareholders and other stakeholders, on which to judge his performance.
(ii) One-year performance bonusEach year Mr Bell is eligible to receive an additional cash bonus of up to 30% of his basic annual salary. The bonus will be determined by the Company’s net asset value per share total return performance over the previous financial year (debt at par, excluding the effect of share buy-backs) relative to its benchmark. Outperformance of the benchmark by 2.5% or more will generate a bonus of the full 30%. No bonus is payable if performance is in line with or below that of the benchmark. Relative performance of between nil and 2.5% will generate a pro rata bonus. (The benchmark is a composite of 40% FTSE All-Share Index, 20% FTSE All-World North America Index, 20% FTSE All-World Europe (ex UK) Index and 20% FTSE All-World Asia Pacific Index, all on a total return basis.)
(iii) Three -year performance bonus (the “Long-Term Bonus”)Each year Mr Bell is eligible to receive a Long-Term Bonus of up to 50% of his basic annual salary by reference to the Company’s performance over the previous three financial years. The Long-Term Bonus will be determined by reference to the Company’s net asset value per share total return (debt at par, excluding the effect of share buy-backs) relative to its benchmark, as set out in the Company’s audited annual accounts for the applicable financial years. Outperformance of the benchmark by an average of 3% per annum or more will generate a bonus of the full 50%. No bonus is payable if performance is in line with or below that of the benchmark. Relative performance of between nil and 3% per annum will generate a pro rata bonus.
The Long-Term Bonus will be halved if, despite outperformance of the benchmark over the relevant three financial years, the Company’s net asset value total return per share is negative over that period. The Long-Term Bonus
was introduced in 2011 and paid, for the first time, in May 2013 following shareholder approval of the terms of the Long-Term Bonus at the Annual General Meeting, in respect of the three financial years ended 31 December 2012.
2. Legacy plansThe Committee reserves the right to make remuneration payments and payments for loss of office that are not in line with the policy set out above (i) where the terms of such a payment were agreed before the policy came into effect or at a time when the relevant individual was not a director of the Company and (ii) in the opinion of the Committee, such a payment is not in consideration of the individual becoming a director of the Company. For these purposes, payments include the Committee satisfying awards of variable remuneration.
3. Differences in the Company’s remuneration policy for directors as compared to employees The only respect in which the remuneration policy for the executive director differs from that for employees is that the executive director’s remuneration is more heavily weighted towards variable pay so that a greater proportion of his pay is related to the Company’s performance and the value created for shareholders.
Principles and approach to recruitment and internal promotion of directorsNon-executive directors1) Remuneration of non-executive directors should
reflect the specific circumstances of the Company and the duties and responsibilities of the non-executive directors. It should provide appropriate compensation for the experience and time committed to the proper oversight of the affairs of the Company.
2) Non-executive directors are not eligible to receive bonuses, pension benefits, share options or other benefits.
3) The total remuneration of the non-executive directors is determined by the provisions of the Company’s Articles of Association and by shareholder resolution.
4) The basic non-executive director’s fee will be paid to each non-executive director with a higher fee per annum for the Chairman of the Company. An additional fee per annum will be paid to the Chairman of each of the Audit and Remuneration and Nomination Committees and to the Chairman of any other Committees that the Company forms; and to the Senior Independent Director.

Annual Report 2013 Witan Investment Trust plc 53
Financial Statements
Statutory Information
Strategic ReportReport of the D
irectors C
orporate Governance
Other Inform
ation
Executive directors 1) When hiring a new executive director, or promoting to
the Board from within the Group, the Committee will offer a package that is sufficient to retain and motivate and, if relevant, attract the right talent whilst paying no more than is necessary.
2) Ordinarily, remuneration for a new executive director will be in line with the policy set out in the table.
3) The maximum level of variable pay that may be awarded to a new director on recruitment or on promotion to the Board shall be limited to 100% of base salary (calculated at the date of grant, excluding any buy-out awards – see below).
4) The Committee may, where it considers it to be in the best interests of the Company and shareholders, offer an additional cash payment to an executive director in order to replace awards which would be foregone by the individual on leaving his/her previous employment (i.e. buy-out arrangements) which will be intended to mirror forfeited awards as far as possible by reflecting the value, nature, time horizons and performance measures.
Letters of appointment/Service contract Non-executive directors’ letters of appointmentThe non-executive directors all have letters of appointment, which may be inspected at the Company’s registered office. None of the non-executive directors is subject to any notice period. All continuing non-executive directors are required to stand for re-election by the shareholders at least every three years. The initial period of appointment is two terms of three years. All reasonably incurred expenses will be met.
Mr Henderson, Mr Oldfield and Mr Watson are proposed for re-election at the Annual General Meeting in April 2014.
CEO’s service contract The CEO’s service contract with the Company may be inspected at the Company’s registered office. The CEO’s service agreement dated 3 February 2010, as amended, provide d in 2013 for a salary of £252,000 (2012: £245,440) per annum. The salary has been increased to £268,000 with effect from 1 January 2014. Mr Bell’s appointment may be terminated by either party on the giving or receiving of not less than nine months’ written notice.
Please see “Policy on payment for loss of office” (below) for further details of the CEO’s service contract.
Illustration of application of remuneration policyThe chart below shows an indication of the values of the CEO’s remuneration that would be received by the CEO in accordance with the director’s remuneration policy for the first full year in which the policy applies at three direct levels of performance:
> minimum performance, i.e. fixed salary, taxable benefits and payment in lieu of pension contributions, with no bonus pay-out;
> on-target performance, fixed pay plus short andlong-term bonus payments assuming a 50% pay out of each of the discretionary, one year performance and Long-Term bonuses; and
> maximum performance, fixed pay plus short andlong-term bonus payments assuming 100% pay-out of each of the discretionary, one year performance and Long-Term bonuses.
Minimum performance On target performance Maximum performance
Fixed payDiscretionary bonusOne year performance bonusLong-Term bonus
100% 69.4%
6.1%9.2%
15.3%
53.2%
9.4%
14.0%
23.4%
£286,150
£412,150
£538,150
0
50
100
150
200
250
300
350
400
450
500
550
600
£’00
0s
Policy on payment for loss of officeNon-executive directorsNone of the non-executive directors is subject to any notice period. It is the Company’s policy not to enter into any arrangement with any of the non-executive directors to entitle any of the non-executive directors to compensation for loss of office.
CEO (and other executive directors)The Company’s policy is to agree a notice period for the CEO which would not exceed nine months.

Witan Investment Trust plc Annual Report 201354
Directors’ remuneration report continued
The Company may, in its absolute discretion and without any obligation to do so, terminate the CEO’s employment immediately by giving him written notice together with a payment of such sum as would have been payable by the Company to the CEO as salary (excluding future bonus accrual) in respect of his notice period. The Company may, at its discretion, make the termination payment in instalments over a period of no longer than six months from the termination date and on terms that any payment should be reduced to take account of mitigation by the CEO.
If a new executive director is recruited, the Company’s policy regarding payments for loss of office will be the same as for the CEO.
If the CEO ceases employment as a result of one of the good leaver reasons (i.e. death, ill-health, injury, disability, redundancy, retirement or due to any other circumstance that the Committee at its discretion permits), any bonus payment shall be pro-rated for time and performance. The Committee may, however, taking into account such factors as it considers appropriate, increase the proportion of the relevant bonus that becomes payable. If the CEO ceases employment other than as a “good leaver”, or if the CEO gives or receives notice prior to the date that the relevant bonus would otherwise have been paid, the CEO will forfeit any right to receive the relevant bonus for nil consideration unless the Committee, in its absolute discretion, determines otherwise.
A change of control of the Company shall not affect the amount of any bonus or the date on which it becomes payable unless the Committee determines otherwise, in which case the Committee shall determine whether the pro-rated performance targets attached to the applicable bonuses have been satisfied at that time.
If the Committee determines that the pro-rated performance targets have not been satisfied on the change of control, the applicable bonus shall immediately lapse unless the Committee determines otherwise. To the extent that the Committee determines that the pro-rated performance targets have been satisfied on the change of control, if the CEO ceases to be employed by the Company prior to the date that the applicable bonus would otherwise have been paid to the CEO other than as a result of:
> a reason which would have justified his summary dismissal;
> his cessation of employment without the giving or receiving of notice; or
> his resignation
the applicable bonus shall become payable to the extent determined at the time of the change of control on, or as soon as practicable after, the CEO’s cessation of employment.
Statement of consideration of conditions elsewhere in the Company The Committee considers the employment conditions, including salary increases, of employees other than the CEO when setting the CEO’s remuneration.
The Company did not consult with employees when drawing up the remuneration policy.
Where possible, the Committee benchmarks the remuneration of the employees and CEO by obtaining details of remuneration paid to employees in comparable roles in other companies.
Statement of consideration of shareholder viewsThe Company places great importance on communication with its shareholders. The Company had frequent meetings with institutional shareholders and City analysts throughout the year to 31 December 2013 and met with shareholders in general at the Annual General Meeting held in 2013 and can confirm that it is not aware of negative views being expressed by shareholders in relation to its policy on Directors’ Remuneration.
ApprovalThis report was approved by the Board of directors on 10 March 2014 and is signed on its behalf by:
Catherine Claydon Chairman of the Remuneration and Nomination Committee 1 1 March 2014

Annual Report 2013 Witan Investment Trust plc 55
Financial Statements
Statutory Information
Strategic ReportReport of the D
irector sC
orporate Governance
Other Inform
ation
The directors are responsible for preparing the Annual Report and the financial statements in accordance with applicable law and regulations.
Company law requires the directors to prepare financial statements for each financial year. Under that law the directors are required to prepare the Group financial statements in accordance with International Financial Reporting Standards (IFRSs) as adopted by the European Union (‘EU’) and Article 4 of the EU IAS Regulation and have also chosen to prepare the parent company financial statements under IFRSs as adopted by the EU. Under company law the directors must not approve the financial statements unless they are satisfied that they give a true and fair view of the state of affairs of the Company and of the profit or loss of the Company for that period. In preparing these financial statements, International Accounting Standard 1 requires that directors:
> properly select and apply accounting policies;
> present information, including accounting policies, in a manner that provides relevant, reliable, comparable and understandable information;
> provide additional disclosures when compliance with the specific requirements in IFRSs is insufficient to enable users to understand the impact of particular transactions, other events and conditions on the entity’s financial position and financial performance; and
> make an assessment of the Company’s ability to continue as a going concern.
The directors are responsible for keeping adequate accounting records that are sufficient to show and explain the Company’s transactions and disclose with reasonable accuracy at any time the financial position of the Company and enable them to ensure that the financial statements comply with the Companies Act 2006.
They are also responsible for safeguarding the assets of the Company and hence for taking reasonable steps for the prevention and detection of fraud and other irregularities.
The directors are responsible for the maintenance and integrity of the corporate and financial information included on the Company’s website. Legislation in the United Kingdom governing the preparation and dissemination of financial statements may differ from legislation in other jurisdictions.
Responsibility statementWe confirm that to the best of our knowledge:
> the financial statements, prepared in accordance with International Financial Reporting Standards as adopted by the EU, give a true and fair view of the assets, liabilities, financial position and profit or loss of the Company and the undertakings included in the consolidation taken as a whole ;
> the Strategic Report includes a fair review of the development and performance of the business and the position of the Company and the undertakings included in the consolidation taken as a whole, together with a description (on pages 1 8 to 20) of the principal risks and uncertainties that they face; and
> the financial statements, taken as a whole, are fair, balanced and understandable, and provide the information necessary for shareholders to assess the Company’s performance, business model and strategy.
By order of the Board
H M Henderson A L C Bell Chairman Chief Executive O cer 1 1 March 2014 1 1 March 2014
Statement of Directors’ responsibilitiesin respect of the annual report, the directors’ remuneration report and the nancial statements
Note to those who access this document by electronic means
The Annual Report for the year ended 31 December 2013 has been approved by the Board of Witan Investment Trust plc. Copies of the Annual Report and the Half Year Report are circulated to shareholders, to those who hold shares through Witan Investment Services’ savings schemes and, where possible, to investors through other providers’ products and nominee companies (or written notification is sent when they are published on-line). It is also made available in electronic format for the convenience of readers. Printed copies are available from the Company’s Registered Office in London.

Witan Investment Trust plc Annual Report 201356
Opinion on financial statements of Witan Investment Trust plcIn our opinion:
> the nancial statements give a true and fair view of the state of the Group’s and of the parent Company’s a airs as at 31 December 2013 and of the Group’s pro t for the year then ended;
> the Group nancial statements have been properly prepared in accordance with International Financial Reporting Standards (IFRSs) as adopted by the European Union;
> the parent Company nancial statements have been properly prepared in accordance with IFRSs as adopted by the European Union and as applied in accordance with the provisions of the Companies Act 2006; and
> the nancial statements have been prepared in accordance with the requirements of the Companies Act 2006 and, as regards the Group nancial statements, Article 4 of the IAS Regulation.
The financial statements comprise the Consolidated Statement of Comprehensive Income, Consolidated and Individual Company Statements of Changes in Equity, Consolidated and Individual Company Balance Sheets, Consolidated and Individual Company Cash Flow Statements and the related notes 1 to 25. The financial reporting
framework that has been applied in their preparation is applicable law and IFRSs as adopted by the European Union and, as regards the parent company financial statements, as applied in accordance with the provisions of the Companies Act 2006.
Going concernAs required by the Listing Rules we have reviewed the directors’ statement contained within the Strategic Report that the Group is a going concern. We confirm that:
> we have concluded that the directors’ use of the going concern basis of accounting in the preparation of the nancial statements is appropriate; and
> we have not identi ed any material uncertainties that may cast signi cant doubt on the Group’s ability to continue as a going concern.
However, because not all future events or conditions can be predicted, this statement is not a guarantee as to the Group’s ability to continue as a going concern.
Our assessment of risks of material misstatement The assessed risks of material misstatement described below are those that had the greatest effect on our audit strategy, the allocation of resources in the audit and directing the efforts of the engagement team:
Independent auditor’s reportto the members of Witan Investment Trust plc

Annual Report 2013 Witan Investment Trust plc 57
Financial Statements
Statutory Information
Strategic ReportReport of the D
irector sC
orporate Governance
Other Inform
ation
Risk How the scope of our audit responded to the risk
Valuation and liquidity of investments of the Group The investment balance is the most quantitatively significant balance on the balance sheet and is the main driver of the group’s performance, standing at £1.4 billion as at 31 December 2013. There is a risk that if the investments are not actively traded, the prices are not reflective of their fair value.
To test the valuation of investments as at 31 December 2013, we performed the following:
> assessed the design and implementation of controls over the pricing of investments to identify whether there were any weaknesses in internal control over valuing investments;
> for all quoted investments, valued at £1,43 7 million, we agreed the bid prices to an independent pricing source; and
> for all derivative instruments, valued at £1.7 million, we involved a nancial instrument specialist to value such instruments, including assessing the discount factors and other indices used in the valuations.
To test the liquidity of investments as at 31 December 2013, we performed the following:
> veri ed the trading activity and volume, on a sample basis, of investments held around the year end; and
> identi ed investments which are not frequently traded and considered indicators of impairment by monitoring the price of any post year-end sales.
Ownership of investments The investment balance is the most quantitatively significant balance on the balance sheet, standing at £1.4 billion as at 31 December 2013. Therefore, the risk that the Group does not hold the rights and obligations to these investments could materially impact the financial statements.
We confirmed the ownership of all investments at year end by obtaining independent third party confirmations directly from the custodians and agreeing them to the listing of investments held at year end.
We reviewed the latest available report on internal controls of the Group’s outsourced custodian and assessed the adequacy of the custodian’s controls over the safeguarding and monitoring of the Group’s investments.
The Audit Committee’s consideration of these risks is set out on page 42.
Our audit procedures relating to these matters were designed in the context of our audit of the financial statements as a whole, and not to express an opinion on individual accounts or disclosures. Our opinion on the financial statements is not modified with respect to any of the risks described above, and we do not express an opinion on these individual matters.
Witan Investment Trust plc Annual Report 201358
Independent auditor’s report continued
Our application of materiality We define materiality as the magnitude of misstatement in the financial statements that makes it probable that the economic decisions of a reasonably knowledgeable person would be changed or influenced. We use materiality both in planning the scope of our audit work and in evaluating the results of our work.
We determined materiality for the Group to be £41million, which has been determined using 3% of Shareholders’ Funds.
We agreed with the Audit Committee that we would report to the Committee all audit differences in excess of £10,000, as well as differences below that threshold that, in our view, warranted reporting on qualitative grounds. We also report to the Audit Committee on disclosure matters that we identified when assessing the overall presentation of the financial statements .
An overview of the scope of our audit Our audit was scoped by obtaining an understanding of the Group and its environment, including group-wide controls, and assessing the risks of material misstatement. Audit work to respond to the risks of material misstatement for all entities in the Group was performed directly by the audit engagement team.
As the accounting is performed by service organisations, we obtained an understanding of how the Group uses service organisations in its operations and evaluated the design and implementation of relevant controls at the Group that relate to the services provided by service organisations. We reviewed the latest reports on internal controls from the service organisations and contacted them directly to obtain specific information we needed to conduct our audit .
Opinion on other matters prescribed by the Companies Act 2006In our opinion:
> the part of the Directors’ Remuneration Report to be audited has been properly prepared in accordance with the Companies Act 2006; and
> the information given in the Strategic Report and the Directors’ Report for the nancial year for which the nancial statements are prepared is consistent with
the nancial statements.
Matters on which we are required to report by exceptionAdequacy of explanations received and accounting recordsUnder the Companies Act 2006 we are required to report to you if, in our opinion:
> we have not received all the information and explanations we require for our audit; or
> adequate accounting records have not been kept by the parent company, or returns adequate for our audit have not been received from branches not visited by us; or
> the parent company financial statements are not in agreement with the accounting records and returns.
We have nothing to report in respect of these matters.
Directors’ remuneration Under the Companies Act 2006 we are also required to report if in our opinion certain disclosures of directors’ remuneration have not been made or the part of the Directors’ Remuneration Report to be audited is not in agreement with the accounting records and returns. We have nothing to report arising from these matters.
Corporate Governance Statement Under the Listing Rules we are also required to review the part of the Corporate Governance Statement relating to the company’s compliance with nine provisions of the UK Corporate Governance Code. We have nothing to report arising from our review.
Annual Report 2013 Witan Investment Trust plc 59
Financial Statements
Statutory Information
Strategic ReportReport of the D
irector sC
orporate Governance
Other Inform
ation
Our duty to read other information in the Annual ReportUnder International Standards on Auditing (UK and Ireland), we are required to report to you if, in our opinion, information in the annual report is:
> materially inconsistent with the information in the audited financial statements; or
> apparently materially incorrect based on, or materially inconsistent with, our knowledge of the Group acquired in the course of performing our audit; or
> o therwise misleading.
In particular, we are required to consider whether we have identified any inconsistencies between our knowledge acquired during the audit and the directors’ statement that they consider the annual report is fair, balanced and understandable and whether the annual report appropriately discloses those matters that we communicated to the Audit Committee which we consider should have been disclosed. We confirm that we have not identified any such inconsistencies or misleading statements.
Respective responsibilities of directors and auditor As explained more fully in the Directors’ Responsibilities Statement, the directors are responsible for the preparation of the financial statements and for being satisfied that they give a true and fair view. Our responsibility is to audit and express an opinion on the financial statements in accordance with applicable law and International Standards on Auditing (UK and Ireland). Those standards require us to comply with the Auditing Practices Board’s Ethical Standards for Auditors. We also comply with International Standard on Quality Control 1 (UK and Ireland). Our audit methodology and tools aim to ensure that our quality control procedures are effective, understood and applied. Our quality controls and systems include our dedicated professional standards review team, and independent partner reviews.
This report is made solely to the Company’s members, as a body, in accordance with Chapter 3 of Part 16 of the Companies Act 2006. Our audit work has been undertaken so that we might state to the Company’s members those matters we are required to state to them in an auditor’s report and for no other purpose. To the fullest extent permitted by law, we do not accept or assume responsibility to anyone other than the Company and the Company’s members as a body, for our audit work, for this report, or for the opinions we have formed.
Scope of the audit of the financial statements An audit involves obtaining evidence about the amounts and disclosures in the financial statements sufficient to give reasonable assurance that the financial statements are free from material misstatement, whether caused by fraud or error. This includes an assessment of: whether the accounting policies are appropriate to the Group’s and the parent Company’s circumstances and have been consistently applied and adequately disclosed; the reasonableness of significant accounting estimates made by the directors; and the overall presentation of the financial statements. In addition, we read all the financial and non-financial information in the annual report to identify material inconsistencies with the audited financial statements and to identify any information that is apparently materially incorrect based on, or materially inconsistent with, the knowledge acquired by us in the course of performing the audit. If we become aware of any apparent material misstatements or inconsistencies we consider the implications for our report.
Stuart McLaren (Senior Statutory Auditor)for and on behalf of Deloitte LLPChartered Accountants and Statutory AuditorLondon, United Kingdom
1 1 March 2014

Witan Investment Trust plc Annual Report 201360
Consolidated statement of comprehensive incomefor the year ended 31 December 2013
Year ended 31 December 2013 Year ended 31 December 2012
Notes
Revenue return£’000
Capitalreturn£’000
Total£’000
Revenue return£’000
Capitalreturn£’000
Total£’000
Investment income 2 37,943 – 37,943 35,583 – 35,583
Other income 3 1,449 – 1,449 1,467 – 1,467
Gains on investments held at fair value through profit or loss 10 – 289,871 289,871 – 130,213 130,213
Total income 39,392 289,871 329,263 37,050 130,213 167,263
Expenses
Management fees 4 (1,146) (8,925) (10,071) (845) (5,465) (6,310)
Other expenses 5 (5,216) (101) (5,317) (4,764) (101) (4,865)
Pro t before nance costs and taxation 33,030 280,845 313,875 31,441 124,647 156,088
Finance costs 6 (2,144) (6,185) (8,329) (2,115) (6,092) (8,207)
Pro t before taxation 30,886 274,660 305,546 29,326 118,555 147,881
Taxation 7 (1,623) – (1,623) (1,603) – (1,603)
Pro t attributable to equity holders of the parent company 29,263 274,660 303,923 27,723 118,555 146,278
Earnings per ordinary share 9 15.44p 144.96p 160.40p 14.50p 62.02p 76.52p
The total column of this statement represents the Group’s Statement of Comprehensive Income, prepared in accordance with IFRSs as adopted by the European Union.
The revenue return and capital return columns are supplementary to this and are prepared under guidance published by the Association of Investment Companies.
The Group does not have any other comprehensive income and hence the total pro t, as disclosed above, is the same as the Group’s total comprehensive income.
All items in the above statement derive from continuing operations.
The net pro t for the year of the Company was £303,923,000 (2012: £146,278,000).
All income is attributable to the equity holders of Witan Investment Trust plc, the parent company. There are no minority interests.
The notes on pages 64 to 85 form part of these nancial statements.
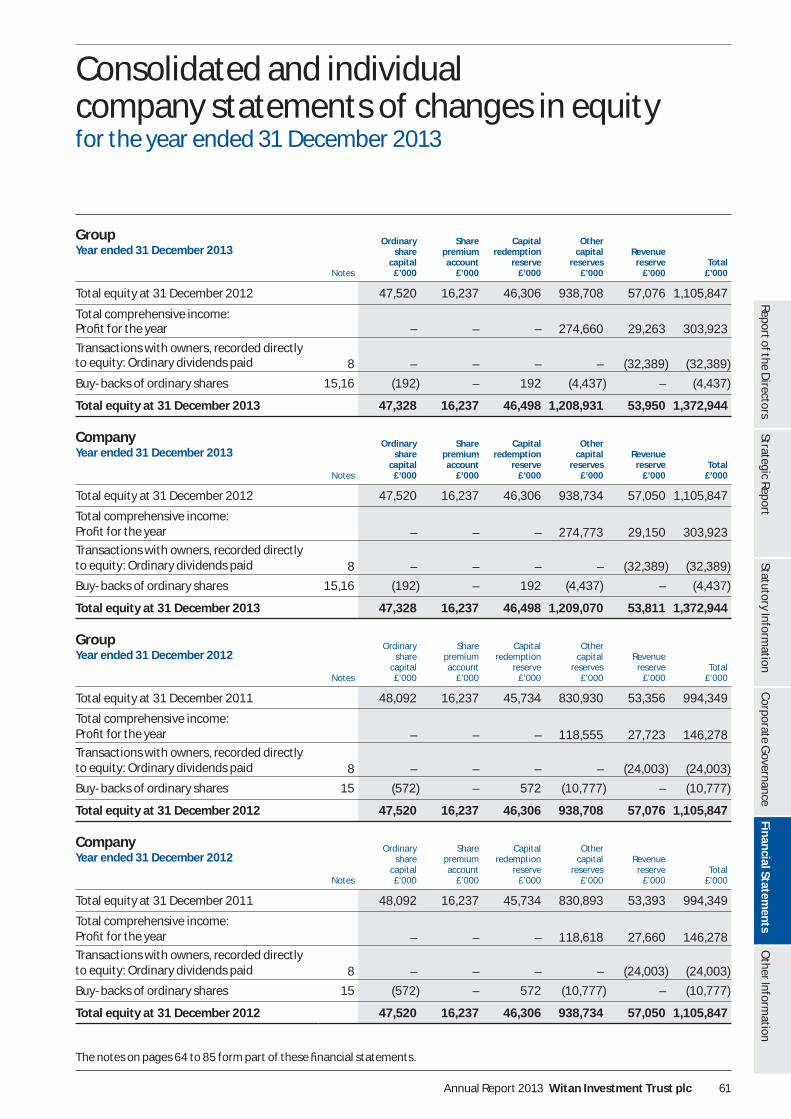
Annual Report 2013 Witan Investment Trust plc 61
Financial Statements
Statutory Information
Strategic ReportReport of the D
irectors C
orporate Governance
Other Inform
ation
Consolidated and individual company statements of changes in equityfor the year ended 31 December 2013
GroupYear ended 31 December 2013
Notes
Ordinary share
capital £’000
Share premium account
£’000
Capital redemption
reserve£’000
Other capital
reserves£’000
Revenue reserve
£’000Total
£’000
Total equity at 31 December 2012 47,520 16,237 46,306 938,708 57,076 1,105,847
Total comprehensive income: Pro t for the year – – – 274,660 29,263 303,923
Transactions with owners, recorded directly to equity: Ordinary dividends paid 8 – – – – (32,389) (32,389)
Buy-backs of ordinary shares 15,16 (192) – 192 (4,437) – (4,437)
Total equity at 31 December 2013 47,328 16,237 46,498 1,208,931 53,950 1,372,944
CompanyYear ended 31 December 2013
Notes
Ordinary share
capital £’000
Share premium account
£’000
Capital redemption
reserve£’000
Other capital
reserves£’000
Revenue reserve
£’000Total
£’000
Total equity at 31 December 2012 47,520 16,237 46,306 938,734 57,050 1,105,847
Total comprehensive income: Pro t for the year – – – 274,773 29,150 303,92 3Transactions with owners, recorded directly to equity: Ordinary dividends paid 8 – – – – (32,389) (32,389)
Buy-backs of ordinary shares 15,16 (192) – 192 (4,437) – (4,437)
Total equity at 31 December 2013 47,328 16,237 46,498 1,209,070 53,811 1,372,944
GroupYear ended 31 December 2012
Notes
Ordinary share
capital £’000
Share premium account
£’000
Capital redemption
reserve£’000
Other capital
reserves£’000
Revenue reserve
£’000Total
£’000
Total equity at 31 December 2011 48,092 16,237 45,734 830,930 53,356 994,349
Total comprehensive income: Pro t for the year – – – 118,555 27,723 146,278Transactions with owners, recorded directly to equity: Ordinary dividends paid 8 – – – – (24,003) (24,003)
Buy-backs of ordinary shares 15 (572) – 572 (10,777) – (10,777)
Total equity at 31 December 2012 47,520 16,237 46,306 938,708 57,076 1,105,847
CompanyYear ended 31 December 2012
Notes
Ordinary share
capital £’000
Share premium account
£’000
Capital redemption
reserve£’000
Other capital
reserves£’000
Revenue reserve
£’000Total
£’000
Total equity at 31 December 2011 48,092 16,237 45,734 830,893 53,393 994,349
Total comprehensive income: Pro t for the year – – – 118,618 27,660 146,278Transactions with owners, recorded directly to equity: Ordinary dividends paid 8 – – – – (24,003) (24,003)
Buy-backs of ordinary shares 15 (572) – 572 (10,777) – (10,777)
Total equity at 31 December 2012 47,520 16,237 46,306 938,734 57,050 1,105,847
The notes on pages 64 to 85 form part of these nancial statements.
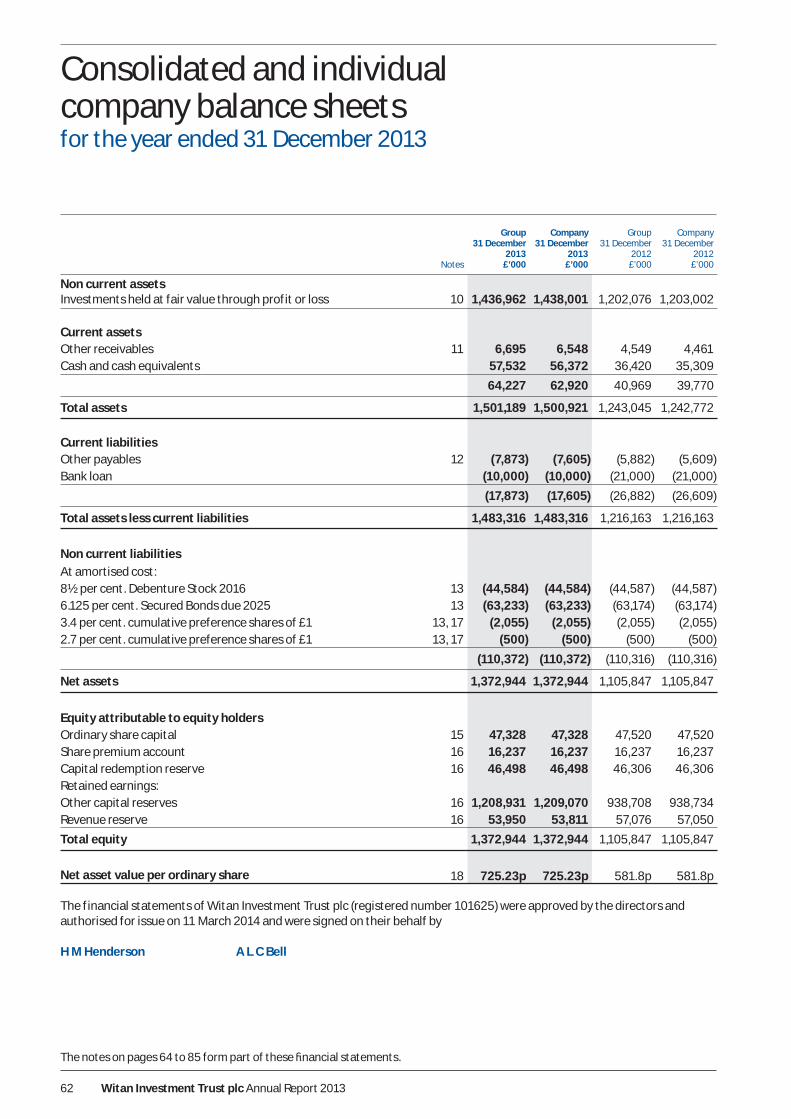
Witan Investment Trust plc Annual Report 201362
Consolidated and individual company balance sheetsfor the year ended 31 December 2013
Notes
Group31 December
2013£’000
Company31 December
2013£’000
Group31 December
2012£’000
Company31 December
2012£’000
Non current assets Investments held at fair value through profit or loss 10 1,436,962 1,438,001 1,202,076 1,203,002
Current assetsOther receivables 11 6,695 6,548 4,549 4,461Cash and cash equivalents 57,532 56,372 36,420 35,309
64,227 62,920 40,969 39,770
Total assets 1,501,189 1,500,921 1,243,045 1,242,772
Current liabilitiesOther payables 12 (7,873) (7,605) (5,882) (5,609)Bank loan (10,000) (10,000) (21,000) (21,000)
(17,873) (17,605) (26,882) (26,609)
Total assets less current liabilities 1,483,316 1,483,316 1,216,163 1,216,163
Non current liabilitiesAt amortised cost:8½ per cent. Debenture Stock 2016 13 (44,584) (44,584) (44,587) (44,587)6.125 per cent. Secured Bonds due 2025 13 (63,233) (63,233) (63,174) (63,174)3.4 per cent. cumulative preference shares of £1 13, 17 (2,055) (2,055) (2,055) (2,055)2.7 per cent. cumulative preference shares of £1 13, 17 (500) (500) (500) (500)
(110, 372) (110, 372) (110,316) (110,316)
Net assets 1,372,944 1,372,944 1,105,847 1,105,847
Equity attributable to equity holdersOrdinary share capital 15 47,328 47,328 47,520 47,520Share premium account 16 16,237 16,237 16,237 16,237Capital redemption reserve 16 46,498 46,498 46,306 46,306Retained earnings:Other capital reserves 16 1,208,931 1,209,070 938,708 938,734Revenue reserve 16 53,950 53,811 57,076 57,050
Total equity 1,372,944 1,372,944 1,105,847 1,105,847
Net asset value per ordinary share 18 725.23p 725.23p 581.8p 581.8p
The financial statements of Witan Investment Trust plc (registered number 101625) were approved by the directors and authorised for issue on 1 1 March 2014 and were signed on their behalf by
H M Henderson A L C Bell
The notes on pages 64 to 85 form part of these nancial statements.

Annual Report 2013 Witan Investment Trust plc 63
Financial Statements
Statutory Information
Strategic ReportReport of the D
irectors C
orporate Governance
Other Inform
ation
Consolidated and individual company cash ow statementsfor the year ended 31 December 2013
Notes
Group2013
£’000
Company2013
£’000
Group2012
£’000
Company2012
£’000
Operating activitiesProfit before taxation 305,546 305,546 147,881 147,881Interest paid 6 8,329 8,329 8,207 8,207Gains on investments held at fair value through profit or loss 10 (289,871) (289,98 4) (130,213) (130,276)Net sales of investments held at fair value through profit or loss 19 50,630 50,630 10,913 10,913Net gain from futures contracts 10 4,465 4,465 2,458 2,458Scrip dividends included in investment income 2 (1,256) (1,256) (1,136) (1,136)(Increase)/decrease in other receivables (6) 53 467 468Increase in other payables 2,752 2,757 605 452Net cash inflow from operating activities before interest and taxation 80,589 80, 540 39,182 38,967Interest paid (8,285) (8,285) (8,161) (8,161)Tax on overseas income (1,624) (1,624) (1,651) (1,651)
Net cash inflow from operating activities 70,680 70,631 29,370 29,155
Financing activitiesEquity dividends paid 8 (32,389) (32,389) (24,003) (24,003)Buy-backs of ordinary shares (4,617) (4,617) (10,899) (10,899) (Repayment)/drawdown of loans (11,000) (11,000) 6,000 6,000
Net cash outflow from financing activities (48,006) (48,006) (28,902) (28,902)
Increase in cash and cash equivalents 22,674 22,625 468 253Cash and cash equivalents at the start of the year 36,420 35,309 37,150 36,254Effect of foreign exchange rate changes (1,562) (1,562) (1,198) (1,198)
Cash and cash equivalents at the end of the year 57,532 56,372 36,420 35,309
The notes on pages 64 to 85 form part of these nancial statements.

Witan Investment Trust plc Annual Report 201364
Notes to the nancial statementsfor the year ended 31 December 2013
1 Accounting policiesThe financial statements of the Group have been prepared in accordance with International Financial Reporting Standards (‘IFRSs’) as adopted by the European Union and therefore the Group financial statements comply with Article 4 of the EU IAS Regulation. These comprise standards and interpretations approved by the International Accounting Standards Board (‘IASB’), together with interpretations of the International Accounting Standards and Standing Interpretations Committee approved by the International Accounting Standards Committee (‘IASC’) that remain in effect, to the extent that they have been adopted by the European Union.
These financial statements are presented in pounds sterling because that is the currency of the primary economic environment in which the Group operates.
(a) Basis of preparationThe financial statements have been prepared on the historical cost basis, except for the revaluation of certain financial instruments. The principal accounting policies adopted are set out below. Where presentational guidance set out in the Statement of Recommended Practice Financial Statements of Investment Trust Companies and Venture Capital Trusts (‘the SORP’) issued by the Association of Investment Companies (‘the AIC’) in January 2009 is consistent with the requirements of IFRSs as adopted by the European Union, the directors have sought to prepare the financial statements on a basis compliant with the recommendations of the SORP.
Sources of estimation uncertaintyIn the application of the Group’s accounting policies, management is required to make judgments, estimates and assumptions about carrying values of assets and liabilities that are not always readily apparent from other sources. The estimates and associated assumptions are based on historical experience and other factors that are considered to be relevant. Actual results may vary from these estimates.
(b) Going concernThe Group’s business activities, together with the factors likely to affect its future development and performance, are set out in the Strategic Report on pages 8 to 23. The financial position of the Group as at 31 December 2013 is shown in the balance sheet on page 62. The cash flows of the Group for the year ended 31 December 2013, which are not untypical, are set out on page 63. The Company had fixed debt and preference share capital totalling £110,3 72,000, as set out in note 13 on page 74; none of the borrowings is repayable before 2016. In 201 3, the Group renewed a one -year secured multi-currency borrowing facility for £50 million, of which £ 10 million was drawn down at 31 December 201 3 (201 2:
£ 21 million). Note 14 on pages 74 to 82 sets out the Group’s risk management policies and procedures, including those covering currency risk, interest rate risk and liquidity risk. As at 31 December 201 3 the Group’s total assets less current liabilities exceeded its total non current liabilities by a multiple of over ten. The assets of the Group consist mainly of securities that are held in accordance with the Company’s investment policy, as set out on the inside front cover. Most of these securities are readily realisable even in volatile markets. The directors, who have reviewed carefully the Group’s budget and forecast for the coming year, consider that the Group has adequate financial resources to enable it to continue in operational existence for the foreseeable future. Accordingly, the directors believe that it is appropriate to continue to adopt the going concern basis in preparing the Group’s accounts.
(c) Basis of consolidationThe consolidated financial statements incorporate the financial statements of the Company and the entity controlled by the Company (its subsidiary) made up to 31 December each year. Control is achieved where the Company has the power to govern the financial and operating policies of an investee entity so as to obtain benefits from its activities. Where necessary, adjustments are made to the financial statements of the subsidiary to bring the accounting policies used by it into line with those used by the Group. All intra-group transactions, balances, income and expenses are eliminated on consolidation.
(d) Presentation of the Statement of Comprehensive IncomeIn order to better reflect the activities of an investment trust company, and in accordance with guidance issued by the AIC, supplementary information which analyses the Statement of Comprehensive Income between items of a revenue and capital nature has been presented alongside the Statement of Comprehensive Income. In accordance with the Company’s Articles of Association, net capital returns may not be distributed by way of dividend. Additionally, the net revenue is the measure the directors believe appropriate in assessing the Group’s compliance with certain requirements set out in section 1158 of the Corporation Tax Act 2010.
(e) IncomeDividends receivable on equity shares are recognised as revenue for the year on an ex-dividend basis. Where no ex-dividend date is available, dividends receivable on or before the year end are treated as revenue for the year. Provision is made for any dividends not expected to be received. The fixed returns on debt securities and non-equity shares are recognised on a time apportionment basis so as to reflect the effective yield on the debt securities and shares. Interest receivable from cash and short-term deposits is accrued to

Annual Report 2013 Witan Investment Trust plc 65
Financial Statements
Statutory Information
Strategic ReportReport of the D
irectors C
orporate Governance
Other Inform
ation
the end of the period. Stock lending fees and underwriting commission are recognised as earned. Any special dividends are looked at individually to ascertain the reason behind the payment. This will determine whether they are treated as income or capital. Where the Group has elected to receive its dividends in the form of additional shares rather than cash, the amount of cash dividend foregone is recognised as income. Any excess in the value of shares received over the amount of cash dividend foregone is recognised as a gain in the Statement of Comprehensive Income.
(f) ExpensesAll expenses and interest payable are accounted for on an accruals basis. Expenses are presented as capital where a connection with the maintenance or enhancement of the value of the investments can be demonstrated. In this respect the investment management fees and finance costs are allocated 25% to revenue and 75% to capital to reflect the Board’s expectations of long-term investment returns. Any performance fees payable are allocated wholly to capital, reflecting the fact that, although they are calculated on a total return basis, they are expected to be attributable largely, if not wholly, to capital performance.
(g) TaxationThe tax expense represents the sum of the tax currently payable and deferred tax.
The tax currently payable is based on the taxable profit for the period. Taxable profit differs from net profit as reported in the Statement of Comprehensive Income because it excludes items of income or expense that are taxable or deductible in other years and it further excludes items that are never taxable or deductible. The Group’s liability for current tax is calculated using tax rates that were applicable at the balance sheet date.
In line with the recommendations of the SORP, the allocation method used to calculate tax relief on expenses presented against capital returns in the supplementary information in the Statement of Comprehensive Income is the ‘marginal basis’. Under this basis, if taxable income is capable of being offset entirely by expenses presented in the revenue return column of the Statement of Comprehensive Income then no tax relief is transferred to the capital return column.
Deferred tax is the tax expected to be payable or recoverable on differences between the carrying amounts of assets andliabilities in the financial statements and the corresponding tax bases used in the computation of taxable profit, and isaccounted for using the balance sheet liability method. Deferred tax liabilities are recognised for all taxable temporary differences and deferred tax assets are recognised to the extent that it is probable that taxable
profits will be available against which deductible temporary differences can be utilised. Investment trusts which have approval as such under section 1158 of the Corporation Tax Act 2010 are not liable for taxation on capital gains.
The carrying amount of deferred tax assets is reviewed at each balance sheet date and reduced to the extent that it is no longer probable that sufficient taxable profits will be available to allow all or part of the asset to be recovered.
Deferred tax is calculated at the tax rates that are expected to apply in the period when the liability is settled or the asset is realised. Deferred tax is charged or credited in the Statement of Comprehensive Income, except when it relates to items charged or credited directly to equity, in which case the deferred tax is also dealt with in equity.
(h) Investments held at fair value through profit or loss When a purchase or sale is made under a contract, the terms of which require delivery within the timeframe of the relevantmarket, the investments concerned are recognised or derecognised on the trade date.
All the Group’s investments are defined by IFRSs asadopted by the European Union as investments held at fair value through profit or loss. All gains and losses areallocated to the capital return within the Statement of Comprehensive Income as “Gains or losses on investments held at fair value through profit or loss”. Also included within this heading are transaction costs in relation to the purchase or sale of investments.
All investments are designated upon initial recognition as held at fair value through profit or loss, and are measured atsubsequent reporting dates at fair value, which is either the bid price or the last traded price, depending on the convention of the exchange on which the investment is quoted. Investments in unit trusts or OEICs are valued at the closing price, the bid price or the single price as appropriate, released by the relevant investment manager.
The Group derecognises a financial asset only when the contractual rights to the cash flows from the asset expire, or when it transfers the financial asset and substantially all the risks and rewards of ownership of the asset to another entity. On derecognition of a financial asset, the difference between the asset’s carrying amount and the sum of the consideration received and receivable and the cumulative gain or loss that had been accumulated in equity is recognised in profit or loss.
Fair values for unquoted investments, or for investments for which there is only an inactive market, are established by using various valuation techniques. These may include recent arm’s length market transactions, the current

Witan Investment Trust plc Annual Report 201366
Notes to the nancial statements continued
for the year ended 31 December 2013
1 Accounting policies continuedfair value of another instrument that is substantially the same, discounted cash flow analysis, option pricing models and reference to similar quoted companies. Where there is a valuation technique commonly used by market participants to price the instrument and that technique has been demonstrated to provide reliable estimates of prices obtained in actual market transactions, that technique is utilised. Where no reliable fair value can be estimated for such instruments, they are carried at cost, subject to any provision for impairment.
The subsidiary company, Witan Investment Services Limited, is held at fair value in the Company balance sheet. This isconsidered to be the net asset value of the shareholder’s funds, as shown in its balance sheet.
(i) Cash and cash equivalents
Cash comprises cash in hand and demand deposits. Cash equivalents are short-term, highly liquid investments that are readily convertible to known amounts of cash and that are subject to an insignificant risk of changes in value.
(j) Dividends payableInterim dividends are recognised in the period in which they are paid. Final dividends are not recognised until approved by the shareholders in general meeting.
(k) Non current liabilitiesAll debentures and secured bonds are initially recognised at cost, being the fair value of the consideration received, less issue costs where applicable. After initial recognition, all interest-bearing loans and borrowings are subsequently measured at amortised cost using the effective interest method, with the interest expense recognised on an effective yield basis. The effective interest method is a method of calculating the amortised cost of a financial liability and of allocating interest expense over the relevant period. The effective interest rate is the rate that exactly discounts estimated future payments over the expected life of the financial liabilities, or, where appropriate, a shorter period, to the net carrying amount on initial recognition.
(l) Foreign currency translationTransactions involving foreign currencies are converted at the rate ruling at the date of the transaction.
Foreign currency monetary assets and liabilities that are fair valued and denominated in foreign currencies arere-translated into sterling at the rate ruling on the balance sheet date. Foreign exchange differences arising on translation are recognised in the Statement of Comprehensive Income and allocated to the capital return.
(m) Adoption of new and revised accounting standards(i) Changes in accounting policy and disclosuresThe accounting policies adopted are consistent with those of the previous financial year.
(ii) Standards and interpretations affecting the reported results or financial positionIFRS 13 Fair Value Measurement The Group has applied IFRS 13 Fair Value Measurement. This standard replaces the guidance on fair value measurement in existing IFRS accounting literature with a single standard. This standard defines fair value, sets out a framework for measurin g fair value and requires disclosure about fair value measurements.
(iii) Standards not affecting the reported results no r the financial positionThe following new and revised Standards and Interpretations have been adopted in the current year. Their adoption has not had any significant impact on the amounts reported in these financial statements.
IFRS 1 0 Consolidated Financial Statements
IFRS 11 Joint Arrangements
IFRS 12 Disclosure of Interests in Other Entities
IAS 19 Employee Bene ts
IAS 27 (revised) Separate Financial Statements
IAS 28 (revised) Investments in Associates and Joint Ventures
IAS 1 (amended) Presentation of items of Other Comprehensive Income
IFRS 7 (amended) Disclosures – O setting Financial Assets and Financial Liabilities
IFRS 1 (amended) Government Loans
Annual Improvements to IFRSs
2009-2011 Cycle
At the date of authorisation of these financial statements, the following Standards and interpretations which have not been applied in these financial statements were in issue but not yet effective (and in some cases had not yet been adopted by the European Union):
IAS 32 (amended) O setting Financial Assets and Financial Liabilities
IFRS 9 Financial Instruments
IFRS 10, IFRS 12 and IAS 27 (amended)
Investment Entities

Annual Report 2013 Witan Investment Trust plc 67
Financial Statements
Statutory Information
Strategic ReportReport of the D
irectors C
orporate Governance
Other Inform
ation
IAS 36 (amended) Recoverable Amount Disclosures for Non-Financial Assets
IAS 39 (amended) Novation of Derivatives and Continuation of Hedge Accounting
The directors do not expect that the adoption of the Standards listed above will have a material impact on the financial statements of the Group in future periods, except as follows:
> IFRS 9 will impact both the measurement and disclosures of Financial Instruments.
Beyond the information above, it is not practicable to provide a reasonable estimate of the effect of these Standards until adetailed review has been completed.
(n) Derivative financial instrumentsThe Group’s activities expose it primarily to the financial risks of changes in market prices, foreign currency exchange rates and interest rates. Derivative transactions which the Company may enter into comprise forward exchange contracts (the purpose of which is to manage currency risks
arising from the Company’s investing activities), quoted options on shares held within the portfolio, or on indices appropriate to sections of the portfolio (the purpose of which is to provide protection against falls in the capital values of the holdings) and futures contracts appropriate to sections of the portfolio (to provide additional market exposure or to provide protection against falls in the capital values of the holdings). The Company may also write options on shares represented in the portfolio where such options are priced attractively relative to the investment managers’ longer-term expectations for the relevant share prices. The Group does not use derivative financial instruments for speculative purposes. Hedge accounting is not used.
The use of financial derivatives is governed by the Group’s policies as approved by the Board, which has set written principles for the use of financial derivatives.
Changes in the fair value of derivative financial instruments are recognised in the Statement of Comprehensive Income as they arise. If capital in nature, the associated change in value is presented as a capital item in the Statement of Comprehensive Income.
2 Investment income2013
£’0002012
£’000
Franked:UK dividends from listed investments 15,529 15,868UK special dividends from listed investments 1,392 209UK dividends from unquoted investments 71 56
16,992 16,133
Unfranked:Overseas dividends from listed investments 18,622 16,322Overseas special dividends from listed investments 372 843Property income dividends 5 5Scrip dividends from listed investments 1,256 1,136Fixed interest and convertible bonds 696 1,144
20,951 19,450
Total investment income 37,943 35,583
2013£’000
2012£’000
Analysis of investment income by geographical segment:United Kingdom 17,815 17,428North America 4,506 3,429Continental Europe 8,214 9,268Japan 922 369Asia Pacific (ex Japan) 4,568 3,302South America 445 444Other 1,473 1,343
Total investment income 37,943 35,583

Witan Investment Trust plc Annual Report 201368
3 Other income2013
£’0002012
£’000
Deposit interest 103 29Stock lending income 147 269Underwriting commission 13 15Income from the subsidiary company’s third party business 1,186 1,154
1,449 1,467
At 31 December 2013 the total value of securities on loan by the Company for stock lending purposes was £36,094,000 (2012: £51,305,000). The maximum aggregate value of securities on loan at any time during the year ended 31 December 2013 was £69,633,000 (2012: £67,693,000). Collateral, revalued on a daily basis at a level equivalent to at least 105% of the market value of the securities lent, was provided against all loans. Collateral i n respect of UK securities is usually in the form of Crest DBVs (Delivery by Values); the content of Crest DBVs is subject to a concentration limit of 10%.
4 Management feesYear ended 31 December 2013 Year ended 31 December 2012
Revenue£’000
Capital£’000
Total£’000
Revenue£’000
Capital£’000
Total£’000
Management fees 1,146 3,438 4,584 845 2,534 3,379Performance fees – 5,487 5,487 – 2,931 2,931
1,146 8,925 10,071 845 5,465 6,310
A summary of the terms of the management agreements is given on pages 15 to 16 in the Strategic Report.
5 Other expensesAuditor’s remunerationThe analysis of the auditor’s remuneration is as follows:
2013Revenue
£’000
2012Revenue
£’000
Fees payable to the Company’s auditor and its associates for the audit of the Company’s annual accounts 48 48Fees payable to the Company’s auditor and its associates for other services to the Group:– the audit of the Company’s subsidiary 5 5
Total audit fees 53 53
Tax services (advice, preparation and submission within local jurisdictions of withholding tax claims)* 15 65Other services 2 4
Total non-audit fees 17 69
Total fees paid 70 122
*The fees for this work were specifically approved by the Audit Committee (see page 43).
Notes to the nancial statements continued
for the year ended 31 December 2013

Annual Report 2013 Witan Investment Trust plc 69
Financial Statements
Statutory Information
Strategic ReportReport of the D
irectors C
orporate Governance
Other Inform
ation
5 Other expenses continued2013
Revenue£’000
2012Revenue
£’000
Auditor’s remuneration (see page 68) 70 122Tax advisory services 9 12Directors’ fees (see the Directors’ Remuneration Report on pages 44 to 54) 235 246Employers’ national insurance contributions on the directors’ fees 30 32Employee costs (including executive director’s remuneration):– salaries and bonuses 1,0 89 647– employers’ national insurance contributions 15 0 88– pension contributions (or payments in lieu thereof) 58 56Advisory, consultancy and legal fees 208 199Investment accounting fees 259 229Company secretarial fees 120 110Insurances 58 60Occupancy costs 115 114Bank charges and overseas safe custody fees 35 8 264Marketing expenses* 950 1,099Savings scheme expenses (Witan Wisdom and Jump Savings) 564 606Other expenses 7 45 673Irrecoverable VAT 198 207
5, 216† 4,764†
* Includes £50,000 sponsorship paid to the Royal Horticultural Society (2012: £50,000).† The total includes costs of £1,276,000 (2012: £1,294,000) in respect of the subsidiary company’s third party business which are offset by the subsidiary company’s
income from that business. The analysis relates to the revenue return column only.
Expenses included in the capital return column for 2013 were £101,000 (2012: £101,000). These related to investment advisory costs.
The average number of employees during the year was 6 (2012: 6).
6 Finance costsYear ended 31 December 2013 Year ended 31 December 2012
Revenue£’000
Capital£’000
Total£’000
Revenue£’000
Capital£’000
Total£’000
Interest payable on overdrafts and loans repayable within one year 115 348 463 85 255 340
Interest payable on the secured bonds and debenture stock repayable between 1 and 5 years 947 2,840 3,787 949 2,844 3,793
Interest payable on the secured bonds and debenture stock repayable in more than 5 years 999 2,997 3,996 998 2,993 3,991Preference share dividends 83 – 83 83 – 83
2,144 6,185 8,329 2,115 6,092 8,207

Witan Investment Trust plc Annual Report 201370
Notes to the nancial statements continued
for the year ended 31 December 2013
7 TaxationYear ended 31 December 2013 Year ended 31 December 2012
Revenue£’000
Capital£’000
Total£’000
Revenue£’000
Capital£’000
Total£’000
(a) Analysis of the charge for the yearUK corporation tax at 23.25% (2012: 24.5%) – – – – – –
– – – – – –Foreign tax suffered 1,88 3 – 1,88 3 2,042 – 2,042Foreign tax recoverable (260) – (260) (439) – (439)
Total current tax for the year (see note 7(b)) 1,62 3 – 1,62 3 1,603 – 1,603
(b) Factors affecting the current tax charge for the yearThe tax assessed for the year is lower than that resulting from applying the effective standard rate of corporation tax in the UK for a large company of 23.25% (2012: 24.5%). The difference is explained below.
Year ended 31 December 2013 Year ended 31 December 2012
Revenue£’000
Capital£’000
Total£’000
Revenue£’000
Capital£’000
Total£’000
Net profit on ordinary activities before taxation 30,886 274,660 305,546 29,326 118,555 147,881Corporation tax at 23.25% (2012: 24.5%) 7,181 63,858 71,039 7,185 29,046 36,231
Effects of:Non-taxable UK dividends (3,951) – (3,951) (3,953) – (3,953)Non-taxable overseas dividends (4,608) – (4,608) (4,407) – (4,407)Withholding tax written off 1, 623 – 1, 623 1,603 – 1,603Non taxable gains on investments held at fair value through profit or loss – (67,395) (67,395) – (31,902) (31,902)Excess management expenses not utilised in year 3, 183 – 3, 183 2,313 – 2,313Unused loan relationship deficits for the year 1, 706 – 1, 706 1,677 – 1,677Preference dividends not deductible in determining taxable profit
19 – 19 21 – 21
Capitalised expenses (3,537) 3,537 – (2,856) 2,856 –Disallowable expenses 7 – 7 20 – 20
Current tax charge 1,623 – 1,623 1,603 – 1,603
(c) Deferred taxDue to the Company’s status as an investment trust, and the intention to continue meeting the conditions required to obtain approval in the foreseeable future, the Company has not provided deferred tax on any capital gains and losses arising on the revaluation or disposal of investments.
No provision has been made for deferred tax on income outstanding at the end of the year as this will be covered by unrelieved business charges and eligible unrelieved foreign tax (2012: £nil).
(d) Factors that may affect future tax chargesThe Company has not recognised a deferred tax asset of £ 2 8,338,000 (2012: £27,727,000) arising as a result of having unrelieved loan relationship deficits and eligible unrelieved foreign tax.
It is unlikely that the Company will obtain relief for these in the future so no deferred tax asset has been recognised.

Annual Report 2013 Witan Investment Trust plc 71
Financial Statements
Statutory Information
Strategic ReportReport of the D
irectors C
orporate Governance
Other Inform
ation
8 Dividends2013
£’0002012
£’000
Amounts recognised as distributions to equity holders in the year:Second interim dividend for the year ended 31 December 2012 of 7.2p (2011: 6.55p) per ordinary share 13,665 12,589First interim dividend for the year ended 31 December 2013 of 3.3p (2012: 6.0p) per ordinary share* 6,229 11,414Second interim dividend for the year ended 31 December 2013 of 3.3p (2012: nil) per ordinary share 6,248 –Third interim dividend for the year ended 31 December 2013 of 3.3p (2012: nil) per ordinary share 6,247 –
32,389 24,003
*Includes a write-back of £ 22,000 (2012: £17,000) of dividends unclaimed for 12 years or more.
Fourth interim dividend for the year ended 31 December 2013 of 4.5p (2012: second interim dividend 7.2p) per ordinary share 8,519 13,665
Total in respect of the year:Set out below is the total dividend to be paid in respect of the year. This is the basis on which the requirements of section 1158 of the Corporation Tax Act 2010 are considered.
2013£’000
2012£’000
Revenue profits available for distribution 29,263 27,723First interim dividend for the year ended 31 December 2013 of 3.3p (2012: 6.0p) per ordinary share (6,229) (11,414)Second interim dividend for the year ended 31 December 2013 of 3.3p (2012: nil) per ordinary share (6,248) – Third interim dividend for the year ended 31 December 2013 of 3.3p (2012: nil) per ordinary share (6,247) –Fourth interim dividend for the year ended 31 December 2013 of 4.5p (2012: second interim dividend 7.2p) per ordinary share (8,519) (13,665)
Revenue retained for the year 2,020 2,644
9 Earnings per ordinary shareThe earnings per ordinary share figure is based on the net profit for the year of £303,92 3,000 (2012: £146,278,000) and on 189,472,414 ordinary shares (2012: 191,174,313), being the weighted average number of ordinary shares in issue during the year.
The earnings per ordinary share figure detailed above can be further analysed between revenue and capital, as below. The Company has no securities in issue that could dilute the return per ordinary share. Therefore the basic and diluted earnings per ordinary share are the same.
2013£’000
2012£’000
Net revenue profit 29, 263 27,723Net capital profit 274, 660 118,555
Net total profit 303,92 3 146,278
Weighted average number of ordinary shares in issue during the year 189,472,414 191,174,313

Witan Investment Trust plc Annual Report 201372
9 Earnings per ordinary share continued2013
Pence2012
Pence
Revenue earnings per ordinary share 15.44 14.50Capital earnings per ordinary share 144.96 62.02
Total earnings per ordinary share 160.40 76.52
10 Investments held at fair value through profit or loss(i) Group changes in investments held at fair value through profit or loss
2013 2012
Group£’000
Company£’000
Group£’000
Company£’000
Listed in the United Kingdom 630,736 630,736 560,328 560,328Listed abroad 806,226 806,226 640,788 640,788Unquoted at directors’ valuation (see note 10(vi)) – – 960 960Investment in subsidiary undertaking – 1,039 – 926
1,436,962 1,438,001 1,202,076 1,203,002
(ii) Group changes in investments held at fair value through profit or loss
Valuation31 December
2012£’000
Purchases£’000
Sales£’000
Movement ininvestment
holdinggains/(losses)
£’000
Valuation31 December
2013£’000
Cost31 December
2013£’000
United Kingdom 561,288 254,829 369, 647 184, 266 630,736 47 1,131North America 233,952 266,221 208,283 59,043 350,933 2 89,009Continental Europe 198,418 112, 579 110, 576 11, 402 211,823 17 2,668Japan 13,486 50, 335 24,240 28, 236 67,817 66,103Asia Pacific ( ex Japan) 136,346 190,793 18 9,339 1,364 139,164 149, 415Latin America 27,954 2, 345 12,081 (1 ,799) 16,419 1 9,019Other 30,632 4,048 17,288 2, 678 20,070 20,255
1,202,076 881,150 9 31,454 285, 190 1,436,962 1, 187,600
The above figures do not include the gains on futures positions.
Included in the above figures are purchase costs of £1,792,000 (2012: £865,000) and sales costs of £984,000 (2012: £411,000). These comprise mainly stamp duty and commission and include £882,000 in respect of changes in portfolio managers (2012: £42,000).
(iii) Gains/(losses) on investments held at fair value though profit or loss2013
£’0002012
£’000
Realised gains on sales of investments 160,414 20,977Realised gain on futures 4,465 2,458Movement in investment holding gains 124,776 107,608Movement in unrealised gain on futures 1,778 368Net movement on foreign exchange on cash and cash equivalents (1,562) (1,198)
289,871 130,213
Notes to the nancial statements continued
for the year ended 31 December 2013

Annual Report 2013 Witan Investment Trust plc 73
Financial Statements
Statutory Information
Strategic ReportReport of the D
irectors C
orporate Governance
Other Inform
ation
(iv) DerivativesOpen future contracts as at year ended 31 December 2013
Contract
Position long
£’000
Settlement value£’000
Nominal exposure
£’000
Unrealised profit£’000
Nikkei Index Future 750 33,497 35,199 1,702
During the period realised gains on closing of futures positions was £4,465,000.
Open future contracts as at year ended 31 December 2012
Contract
Position short
£’000
Settlement value
£’000
Nominal exposure
£’000
Unrealised loss
£’000
Long Gilt Future (250) (29,654) (2 9,730) (76)
During the period realised gains on closing of futures positions was £2,458,000.
( v) Substantial share interestsThe Company has notified interests in 3% or more of the voting rights of three of the investee companies, all of which are closed-ended investment funds. However, the Board does not consider any of the Company’s investments to be individually material in the context of these financial statements.
It is the Company’s stated policy to invest no more than 15% of its gross assets in other listed investment companies (including listed investment trusts).
(vi) Unquoted investmentsThe value of the unquoted investments as at 31 December 2013 was £nil (2012: £960,000 Cazenove Capital Holdings Limited). The holding in Cazenove Capital Holdings Limited was disposed of as a result of the acquisition of Cazenove Capital by Schroders plc. This was effective on 2 July 2013 at 135p per share, which compares with a carrying value of 64p per share at 31 December 2012.
11 Other receivables2013 2012
Group£’000
Company£’000
Group£’000
Company£’000
Sales for future settlement 1,132 1,132 695 695Unrealised gain on derivatives designated as held at fair value through profit or loss* 1,702 1,702 – –Taxation recoverable 919 919 918 918Intercompany account – 396 – 483Prepayments and accrued income 2,343 2,343 2,337 2,337Other debtors 599 56 599 28
6,695 6,548 4,549 4,461
*The unrealised gain on derivatives relates to a long position in Nikkei 225 Futures, nominal value at 31 December 2013: £35,199,000 (2012: £nil).

Witan Investment Trust plc Annual Report 201374
Notes to the nancial statements continued
for the year ended 31 December 2013
12 Other payables2013 2012
Group£’000
Company£’000
Group£’000
Company£’000
Purchases for future settlement 896 896 1,389 1,389Unrealised loss on derivatives designated as held at fair value through profit or loss* – – 76 76Share buy-backs awaiting settlement – – 180 180Preference dividends 38 38 38 38Accruals 6,939 6,671 4,199 3,926
7,873 7,605 5,882 5,609
*The unrealised loss on derivatives is nil (2012 relate d to a short position in Long Gilt Futures, nominal value at 31 December 201 2: £29,730,000).
13 Non current liabilities
2013 2012
Group£’000
Company£’000
Group£’000
Company£’000
Financial instruments redeemable other than in instalments are as follows:8½ per cent. Debenture Stock 2016 44,584 44,584 44,587 44,5876.125 per cent. Secured Bonds due 2025 63,233 63,233 63,174 63,1742,055,000 3.4 per cent. cumulative preference shares of £1 each (see note 17 on page 83) 2,055 2,055 2,055 2,055500,000 2.7 per cent. cumulative preference shares of £1 each (see note 17 on page 83) 500 500 500 500
110, 372 110, 372 110,316 110,316
On 15 December 2000 the Company issued £100,000,000 (nominal) 6.125 per cent. Secured Bonds due 2025, net of discount and issue costs totalling approximately £2,000,000. The discount and the issue costs will be written back over the life of the Secured Bonds. The nominal value of the remaining Secured Bonds in issue (£64,290,000 at 31 December 2013) is redeemable on 15 December 2025. The nominal value of the Debenture Stock is redeemable on 1 October 2016. The Debenture Stock and the Secured Bonds are secured by floating charges over all the undertaking and assets of the Company. The security of the charges applies pari passu to both issues.
14 Financial instrumentsRisk management policies and proceduresAs an investment company, Witan invests in equities and other investments for the long term so as to secure its investment objective as stated on the inside front cover. In pursuing its investment objective, the Group is exposed to a variety of risks that could result in either a reduction in the Group’s net assets or a reduction in the profits available for distribution by way of dividends.
These risks, market risk (comprising price risk, currency risk and interest rate risk), liquidity risk and credit risk, and the directors’ approach to the management of them, are set out below.
The objectives, policies and processes for managing the risks and the methods used to manage the risks, as set out below, have not changed from the previous accounting period, although in some instances additional resources have been allocated to some areas.

Annual Report 2013 Witan Investment Trust plc 75
Financial Statements
Statutory Information
Strategic ReportReport of the D
irectors C
orporate Governance
Other Inform
ation
14.1 Market riskThe fair value or future cash flows of a financial instrument held by the Group may fluctuate due to changes in market prices. This market risk comprises: price risk (see note 14.2), currency risk (see note 14.3) and interest rate risk (see note 14.4). The Board reviews and agrees policies for managing these risks, which policies have remained substantially unchanged from those applying in the year ended 31 December 201 2. The investment managers assess the exposure to market risk when making each investment decision and monitor the overall level of market risk on the whole of their investment portfolios on an ongoing basis.
14.2 Price riskPrice risks (ie changes in market prices other than those arising from interest rate risk or currency risk) may affect the value of the quoted and the unquoted investments.
Management of the riskThe Board manages the risks inherent in the investment portfolios by regularly reviewing relevant information from the investment managers. The Board meets regularly and at each meeting reviews investment performance. The Board monitors the managers’ compliance with their mandates and also whether each mandate and asset allocation is compatible with Witan’s objective.
When appropriate, Witan has the ability to manage its exposure to risk through the controlled use of derivatives.
The Group’s exposure to other changes in market prices at 31 December on its quoted and unquoted equity investments, and on options on indices and investments, was as follows:
2013£’000
2012£’000
Investments held at fair value through profit or loss 1,436,962 1,202,076 Nominal futures exposure (long position) 35,199 –
Concentration of exposure to price risksAn analysis of the Group’s investment portfolio is shown on page 25. This shows that the greater geographical weighting is to UK companies, with significant exposure also to North America, Asia and Continental Europe. Accordingly, there is a concentration of exposure to those regions, although an investment’s country of domicile or of listing does not necessarily equate to its exposure to the economic conditions in that country.
Price risk sensitivityThe following table illustrates the sensitivity of the profit after taxation for the year and the value of the shareholders’ funds to an increase or decrease of 15% in the fair values of the Group’s equity investments (including exposure through futures contracts). This level of change is considered to be reasonably possible based on observation of market conditions and historical trends. The sensitivity analysis is based on the Group’s equities and equity exposure through options at each balance sheet date, with all other variables held constant. The results of these example calculations are significant but not unreasonable, given that most of the Group’s assets are equity investments.
2013 2012
Increasein fair value
£’000
Decreasein fair value
£’000
Increasein fair value
£’000
Decreasein fair value
£’000
Income statement – profit after taxRevenue return – – – –Capital return – investments 215,544 (215,544) 180,311 (180,311)Capital return – futures 5,280 (5,280) – –
220,824 (220,824) 180,311 (180,311)

Witan Investment Trust plc Annual Report 201376
Notes to the nancial statements continued
for the year ended 31 December 2013
14 Financial instruments continued14.3 Currency riskA proportion of the Group’s assets, liabilities and income is denominated in currencies other than sterling (the Group’s functional currency, and the currency in which it reports its results). As a consequence, movements in exchange rates affect the sterling value of those items.
Management of the riskThe investment managers monitor their exposure to currencies as part of their normal investment processes. The Board receives a monthly report on the currency exposures of the entire fund.
Income denominated in foreign currencies is converted into sterling upon receipt. The Group does not normally use financial instruments to mitigate the currency exposure in the period between the time that income is included in the financial statements and its receipt.
Foreign currency exposureThe fair values of the Group’s monetary items that have foreign currency exposure at 31 December are shown below. Where the Group’s equity investments (which are not monetary items) are denominated in a foreign currency, they have been included separately in the analysis so as to show the overall level of exposure.
2013US$
£’000Euro
£’000Yen
£’000Other£’000
Receivables (due from brokers, dividends and other income receivable) 1,525 235 65 713Receivables (unrealised gain on derivatives designated as held at fair value through profit or loss)
– – 1,702 –
Cash at bank and on deposit 857 1,504 8,202 49Payables (due to brokers, accruals and other creditors) (591) – – (144)Total foreign currency exposure on net monetary items 1,791 1,739 9,969 618Investments at fair value through profit or loss that are equities 353,727 141,957 64,929 259,361
Total net foreign currency exposure 355,518 143,696 74,898 259,979
2012US$
£’000Euro
£’000Yen
£’000Other£’000
Receivables (due from brokers, dividends and other income receivable) 276 704 23 796Cash at bank and on deposit 2,214 1,991 1,077 73Payables (due to brokers, accruals and other creditors) (12) (397) – (891)Total foreign currency exposure on net monetary items 2,478 2,298 1,100 (22)Investments at fair value through profit or loss that are equities 250,723 133,054 13,486 181,028
Total net foreign currency exposure 253,201 135,352 14,586 181,006
The above amounts are not representative of the exposure to risk during the year as levels of monetary foreign currency exposure change significantly throughout the year.
Foreign currency sensitivityThe following table illustrates the sensitivity of the profit after tax for the year and the Group’s equity in regard to the Group’s monetary financial assets and financial liabilities and the exchange rates for the £/US dollar, £/Euro and £/Japanese yen. The results of these example calculations are significant but not unreasonable in the context of the majority of the Group’s assets being invested overseas.
It assumes the following changes in exchange rates:£/US dollar +/- 15% (2012: 15%)£/Euro +/- 15% (2012: 15%)£/Japanese yen +/- 15% (2012: 15%)

Annual Report 2013 Witan Investment Trust plc 77
Financial Statements
Statutory Information
Strategic ReportReport of the D
irectors C
orporate Governance
Other Inform
ation
The sensitivity analysis is based on the Group’s monetary foreign currency financial instruments held at the balance sheet date and takes account of any forward foreign exchange contracts that offset the effects of changes in currency exchange rates.
If sterling had depreciated against the currencies shown, this would have had the following effect:
2013 2012
US$£’000
Euro£’000
Yen£’000
US$£’000
Euro£’000
Yen£’000
Income statement – profit after taxRevenue return 1,248 798 140 1,175 828 61Capital return 62,422 25,051 11,458 44,245 23,480 2,380
Change to the profit after tax 63,670 25,849 11,598 45,420 24,308 2,441
Change to the shareholders’ funds 63,670 25,849 11,598 45,420 24,308 2,441
If sterling had appreciated against the currencies shown, this would have had the following effect:
2013 2012
US$£’000
Euro£’000
Yen£’000
US$£’000
Euro£’000
Yen£’000
Income statement – profit after taxRevenue return (923) (590) (103) (868) (612) (45)Capital return (46,138) (18,516) (8,469) (32,703) (17,355) (1,759)
Change to the profit after tax (47,061) (19,106) (8,572) (33,571) (17,967) (1,804)
Change to the shareholders’ funds (47,061) (19,106) (8,572) (33,571) (17,967) (1,804)
In the opinion of the directors, neither of the above sensitivity analyses is representative of the year as a whole since the level of exposure changes frequently, as part of the currency risk management process used to meet the Group’s objective.
14.4 Interest rate riskInterest rate movements may affect the level of income receivable from fixed interest securities and cash at bank and on deposit.
Management of the riskThe possible effects on fair value and cash flows that could arise as a result of changes in interest rates are taken into account when making investment decisions.
The Group holds cash balances, partly to meet payments as they fall due but also when appropriate to offset the long-term borrowings that it has in place.
The Group finances part of its activities through preference shares that do not have redemption dates and through debenture stock and secured bonds that were issued as part of the Company’s planned gearing.
Interest rate exposureThe exposure at 31 December 2013 of financial assets and financial liabilities to interest rate risk is shown by reference to:
> floating interest rates: when the interest rate is due to be re-set; and
> fixed interest rates: when the financial instrument is due be repaid.
The Group’s exposure to floating interest rates on assets is £47,532,000 (2012: £15,420,000). This represents cash holdings minus variable rate borrowing.
The Group’s exposure to fixed interest rates on assets is £15,543,000 (2012: £28,704,000). This represents investments in bonds.

Witan Investment Trust plc Annual Report 201378
Notes to the nancial statements continued
for the year ended 31 December 2013
14 Financial instruments continuedThe Group’s exposure to fixed interest rates on liabilities is £110, 372,000 (2012: £110,316,000). This represents fixed rate borrowing.
Interest receivable and finance costs are at the following rates:
> interest received on cash balances, or paid on bank overdrafts and loans, is at margin under/over LIBOR or its foreign currency equivalent (2012: same);
> the finance charge on the preference shares is at a weighted average interest rate of 3.3% (2012: 3.3%);
> the finance charge on the debenture stock is at a weighted average interest rate of 8.5% (2012: 8.5%); and
> the finance charge on the secured bonds is at a weighted average interest rate of 6.125% (2012: 6.125%).
The above year end amounts are not representative of the exposure to interest rates during the year, as the level of exposure changes as investments are made in fixed interest securities, long-term debt is partially redeemed and as the level of cash balances varies during the year. In the context of the Group’s balance sheet, the exposure to interest rate risk is not considered to be material.
Interest rate sensitivityBased on the Group’s monetary financial instruments at each balance sheet date, an increase or decrease of 200 basis points in interest rates would decrease or increase revenue return after tax by £1,101,000 (2012: £623,000), capital return after tax by £150,000 (2012: £315,000), and total profit after tax and shareholders’ funds by £951,000 (2012: £308,000).
At 31 December 2012, the Group had a short position in Long Gilt Futures with a nominal value of £29,730,000. An increase of 100 basis points in gilt yields would have increased net capital return after tax and shareholders’ funds by £2,081,000. A decrease of 100 basis points in gilt yields would have decreased net capital return after tax and shareholders’ funds by £2,081,000. At 31 December 2013, the Group did not have any interest rate exposure by way of futures contracts.
This level of change is considered to be reasonably possible based on observation of current market conditions. This is not representative of the year as a whole, since the exposure changes as investments are made. In the context of the Group’s balance sheet, the outcome is not considered to be material.
14.5 Liquidity riskThis is the risk that the Group will encounter difficulty in meeting obligations associated with its financial liabilities.
Management of the riskLiquidity risk is not significant as the majority of the Group’s assets are investments in quoted equities and other quoted securities that are readily realisable. The Group has borrowed £44,587,000 by its issue in 1986 of 8½ per cent Debenture Stock 2016 and £63,174,000 by its issue in 2000 of 6.125 per cent Secured Bonds due 2025. The Group is able to draw short-term borrowings of up to the sterling equivalent of £50 million from its secured and committed multi-currency borrowing facility of £50 million with BNP Paribas, London Branch (expiring in December 2014). £10,000,000 was drawn down under the facility at 31 December 2013 (2012: £21,000,000).
The Board gives guidance to the investment managers as to the maximum amount of the Company’s resources that should be invested in any one company. The policy is that the Group should remain fully invested in normal market conditions.
Liquidity risk exposureThe remaining contractual maturities of the financial liabilities at 31 December 2013, based on the earliest date on which payment can be required, were as follows:

Annual Report 2013 Witan Investment Trust plc 79
Financial Statements
Statutory Information
Strategic ReportReport of the D
irectors C
orporate Governance
Other Inform
ation
2013 2012
Within1 year£’000
Between1 and 5 years
£’000
More than5 years
£’000
Within1 year£’000
Between1 and 5 years
£’000
More than5 years
£’000
Debenture stock* 3,790 51,222 – 3,790 55,012 –Secured bonds* 3,938 15,751 91,681 3,938 15,751 95,619Preference shares† 83 332 2,555 83 332 2,555Other creditors and accruals 7,87 3 – – 5,882 – –Bank loan 10,000 – – 21,000 – –
25,68 4 67,305 94,236 34,693 71,095 98,174
* The above figures show interest payable over the remaining terms of each instrument. The figures in the ‘between 1 and 5 years’ and ‘more than 5 years’ columns also include the capital to be repaid.
† The figures in the ‘more than 5 years’ columns do not include the ongoing annual finance cost of £83,000.
14.6 Credit riskThe failure of the counterparty to a transaction to discharge its obligations under that transaction could result in the Group suffering a loss.
Management of the riskThe risk is managed as follows:
> interest received on cash balances, or paid on bank overdrafts and loans, is at margin under/over LIBOR or its foreign currency equivalent;
> transactions involving derivatives are entered into only with investment banks, the credit rating of which is taken into account so as to minimise the risk to the Group of default;
> investment transactions are carried out with a large number of brokers, whose credit standard is reviewed periodically by the investment managers, and limits are set on the amount that may be due from any one broker;
> cash at bank is held only with reputable banks with high quality external credit ratings.
None of the Group’s financial liabilities are past their due dates or impaired.
Credit risk exposureThe table below summarises the credit risk exposure of the Group as at the year end.
2013£’000
2012£’000
Fixed interest securities 15,543 28,704Cash 57,532 36,420Receivables:
Sales for future settlement 1,132 695Unrealised gain on derivatives designated as held at fair value through profit or loss 1,702 –Taxation recoverable 919 918Accrued income 2,343 2,337Other debtors 599 599
79,770 69,673
14.7 Fair values of financial assets and financial liabilitiesExcept for those financial liabilities measured at amortised cost that are shown below, the financial assets and financial liabilities are either carried in the balance sheet at their fair value (investments and derivatives) or the balance sheet amount is a reasonable approximation of fair value (amounts due from brokers, dividends and interest receivable, amounts due to brokers, accruals, cash at bank and bank overdrafts).

Witan Investment Trust plc Annual Report 201380
Notes to the nancial statements continued
for the year ended 31 December 2013
14 Financial instruments continued2013 2012
Fairvalue£’000
Balancesheet
amount£’000
Fairvalue
£’000
Balancesheet
amount£’000
Financial liabilities measured at amortised cost:Non current liabilities
Preference shares 1,379 2,555 1,379 2,555Debenture stock 51,359 44, 584 53,136 44,587Secured bonds 71,992 63,233 80,232 63,174
124,730 110, 372 134,747 110,316
The fair values shown above are derived from the offer price at which the securities are quoted on the London Stock Exchange. Fair value hierarchy disclosures
The table below sets out fair value measurements using the IFRS 7 fair value hierarchy.
Financial assets at fair value through profit or loss
At 31 December 2013Level 1
£’000Level 2
£’000Level 3
£’000Total
£’000
Equity investments 1,320,871 – – 1,320,871Investments in other funds – 116,091 – 116,091Derivatives ( nominal exposure of £35,199,000) 1,702 – – 1,702
Total 1,322,573 116,091 – 1,438,664
At 31 December 2012Level 1£’000
Level 2£’000
Level 3£’000
Total£’000
Equity investments 1,140,648 – 960 1,141,608Investments in other funds – 60,468 – 60,468Derivatives ( gross nominal value of £29,730,000) (76) – – (76)
Total 1,140,572 60,468 960 1,202,000
Categorisation within the hierarchy has been determined on the basis of the lowest level input that is significant to the fair value measurement of the relevant asset as follows:
Level 1 – valued using quoted prices in an active market for identical assets.
Level 2 – valued by reference to valuation techniques using observable inputs other than quoted prices within Level 1.
Level 3 – valued by reference to valuation techniques using inputs that are not based on observable market data.
The valuation techniques used by the Group are explained in the accounting policies in note 1(h). There were no transfers during the year between Level 1 and Level 2. A reconciliation of fair value measurements in Level 3 is set out below.
Level 2 Financial assetsLevel 2 Financial assets refer to investments in Trilogy Emerging Markets Fund, Polar Capital Insurance Fund, Polar Japan funds and iShares MSCI fund (201 2: Trilogy Emerging Markets Fund and Polar Capital Insurance Fund).

Annual Report 2013 Witan Investment Trust plc 81
Financial Statements
Statutory Information
Strategic ReportReport of the D
irectors C
orporate Governance
Other Inform
ation
Level 3 Reconciliation of Level 3 fair value measurement of financial assets
At 31 December 2013 £’000
Opening fair value 960Purchases at cost –Sales proceeds (2,025)Total gains included in gains on investments in the Statement of Comprehensive Income:– on sold assets 1,176– on assets held at the beginning of the year (111)
Closing fair value –
The Group’s capital management objectives are:
> to ensure that it will be able to continue as a going concern; and
> to maximise the income and capital return to its equity shareholders through an appropriate balance of equity capital and debt.
The Group’s total capital employed at 31 December 2013 was £1,493,31 6,000 (2012: £1,237,163,000) comprising £120, 372,000 of debt (2012: £131,316,000) and £1,372,94 4,000 of equity share capital and other reserves (2012: £1,105,847,000).
Gearing
The Group’s policy is to manage the effective gearing in the portfolio to be below 20%, other than temporarily in exceptional circumstances. Effective gearing is defined as the difference between shareholders’ funds and the total market value of the investments (including the nominal value (effective underlying exposure) of futures positions which were £35,119,000 long at 31 December 2013 (2012: £29,730,000 short)) expressed as a percentage of shareholders’ funds. At 31 December 2013 effective gearing was 7. 3% (2012: 6.1%) and the calculation is set out below:
2013£’000
2012£’000
Value of investments per the Balance Sheet 1,438,001 1,203,002Add:Nominal exposure of Gilt Futures – (29,730)Nominal exposure of Nikkei 225 Futures 35,199 –
Adjusted Gross Value of Investments (including Futures nominal exposure) 1,473,200 1,173,272
Shareholders’ funds per the Balance Sheet (A) 1,372,944 1,105,847Excess of Gross Value of Investments over shareholder funds (B) 100,256 67,425Effective gearing (B as a percentage of A) 7.3% 6. 1%
The Board monitors and reviews the broad structure of the Group’s capital on an ongoing basis. This review includes:
> the planned level of gearing, which takes into account the Chief Executive Officer’s view on the market;
> the need to buy back equity shares for cancellation, which takes account of the difference between the net asset value per share and the share price (ie the level of share price discount or premium); and
> the extent to which revenue in excess of that which is required to be distributed should be retained.
The Group’s objectives, policies and processes for managing capital are unchanged from the preceding accounting period.

Witan Investment Trust plc Annual Report 201382
Notes to the nancial statements continued
for the year ended 31 December 2013
14 Financial instruments continuedThe Company is subject to several externally imposed capital requirements:
> the terms of issue of the Company’s debenture stock and secured bonds require the aggregate amount outstanding in respect of borrowings, measured in accordance with the policies used to prepare the annual financial statements, not to exceed a sum equal to the Company’s capital and reserves at any time;
> as a public company, the Company has a minimum issued share capital of £50,000; and
> in order to be able to pay dividends out of profits available for distribution by way of dividends, the Company has to be able to meet one of the two capital restriction tests imposed on investment companies by company law.
These requirements are unchanged since the previous year end and the Company has complied with them.
15 Called up share capitalGroup and
Company2013
£’000
Group andCompany
2012£’000
Called up, issued and fully paid:189,311,000 ordinary shares of 25p each (2012: 190,079,500) 47,328 47,520
During the year, 768,500 ordinary shares were bought back for cancellation at a cost of £4,437,000 (2012: 2,287,500 ordinary shares at a cost of £10,777,000).
16 Share premium account and reserves
Sharepremiumaccount
£’000
Capitalredemption
reserve£’000
Capitalreserve
arising oninvestments
£’000
Capitalreserve
arising onrevaluation
of investments
held£’000
Revenuereserve
£’000
GroupAt 1 January 2013 16,237 46,306 814,198 124,510 57,076Net movement on investments – – 177,622 113,811 –Net movement on foreign exchange – – (1,562) – –Expenses and interest payable charged to capital net of tax relief – – (15,211) – –Buy-backs of ordinary shares – 192 (4,437) – –Profit for the year – – – – 29,263Ordinary dividends paid – – – – (32,389)
At 31 December 2013 16,237 46,498 970,610 238,321 53,950
Company
At 1 January 2013 16,237 46,306 814,198 124,536 57,050Net movement on investments – – 177,622 113,924 –Net movement on foreign exchange – – (1,562) – –Expenses and interest payable charged to capital net of tax relief – – (15,211) – –Buy-backs of ordinary shares – 192 (4,437) – –Profit for the year – – – – 29,150Ordinary dividends paid – – – – (32,389)
At 31 December 2013 16,237 46,498 970,610 238,460 53,811

Annual Report 2013 Witan Investment Trust plc 83
Financial Statements
Statutory Information
Strategic ReportReport of the D
irectors C
orporate Governance
Other Inform
ation
17 Preference sharesIncluded in non current liabilities is £2,555,000 in respect of issued preference shares as follows:
Group andCompany
2013£’000
Group andCompany
2012£’000
2,055,000 3.4 per cent. cumulative preference shares of £1 each 2,055 2,055500,000 2.7 per cent. cumulative preference shares of £1 each 500 500
2,555 2,555
The 3.4 per cent. and 2.7 per cent. cumulative preference shares constitute a single class and confer the right, in priority to any other class of shares:
(i) to receive a fixed cumulative preferential dividend at the respective rates (exclusive of tax credit thereon) of 3.4 per cent. and 2.7 per cent. per annum, such dividend being payable half-yearly on 15 January and 15 July in each year, in respect of the 3.4 per cent. cumulative preference shares, and on 1 February and 1 August in each year, in respect of the 2.7 per cent. cumulative preference shares; and
(ii) to receive repayment of capital at par in a winding up of the Company (but do not confer any further right to participate in profits or assets).
The preference shareholders are entitled to receive notices of general meetings of the Company but are not entitled to attend or vote thereat (except on a resolution for the voluntary liquidation of the Company or for any alteration to the objects of the Company as set out in its Articles of Association).
In the event of a poll at a general meeting of the Company, every member of the Company who is present in person or by proxy and who is entitled to vote thereat, whether an ordinary shareholder or, in the circumstances outlined above, a preference shareholder, has one vote for every £1 nominal value of shares registered in their name. Accordingly, on a poll each ordinary shareholder has one vote for every four shares held.
18 Net asset value per ordinary shareThe net asset value per ordinary share 725.23p (2012: 581.8p) is based on the net assets attributable to the ordinaryshares of £1,372,94 4,000 (2012: £1,105,847,000) and on the 189,311,000 ordinary shares in issue at 31 December 2013(2012: 190,079,500).
The movements during the year of the net assets attributable to the ordinary shares were as follows:
£’000
Total net assets at 1 January 2013 1,105,847Total profit for the year 303,923Dividends paid in the year on the ordinary shares (see note 8) (32,389)Buy-backs of ordinary shares (4,437)
Net assets attributable to the ordinary shares at 31 December 2013 1,372,944
An alternative net asset value per ordinary share can be calculated by deducting from the total assets less current liabilities of the Company the preference shares, the debenture stock and the secured bonds at their market (or fair) values rather than at their par (or book) values. Details of the alternative values are set out in note 14.7. The net asset value per ordinary share at31 December 2013 calculated on this basis is 717. 6p (2012: 568.9p).

Witan Investment Trust plc Annual Report 201384
19 Note to the cash flow statementsPurchases and sales of investments are considered to be operating activities of the Company, given its purpose, rather than investing activities. However, the cash flows associated with these activities are presented below.
Group andCompany
2013£’000
Group andCompany
2012£’000
Proceeds on disposal of fair value through profit or loss investments 9 31,017 315,749Purchases of fair value through profit or loss investments (8 80,387) (304,836)
50,630 10,913
20 Capital commitments and contingent liabilitiesAt 31 December 201 3 there were capital commitments in respect of securities not fully paid up of £nil (201 2: £nil) and underwriting liabilities of £nil (201 2: £nil). In November 2005 the Company took a five year lease on office premises at 14 Queen Anne’s Gate, London SW1 which was renewed for a further five years in October 2010.
21 Operating lease arrangements2013
£’0002012
£’000
Minimum lease payments under operating leases recognised for the year 49 49
At the balance sheet date, the Group had outstanding commitments for the future minimum lease payments undernon-cancellable operating leases, which fall due as follows:
2013£’000
2012£’000
Within one year 49 49In the second to fifth years inclusive 51 100
100 149
The operating lease payments represent rentals payable by the Group for its office property.
The lease was re-negotiated during 2010 for a further term of five years. Rentals are fixed for an average of five years.
22 Subsidiary undertakingThe Company has an investment in the issued ordinary share capital of its wholly-owned subsidiary undertaking, Witan Investment Services Limited, which was incorporated on 28 October 2004, is registered in England and Wales and operates in the United Kingdom.
23 Related party transactions disclosuresBalances and transactions between the Company and its subsidiary, which are related parties, amounting to £286,000 have been eliminated on consolidation and are not disclosed in this note.
Remuneration of key management personnelThe remuneration of the directors, who are the key management personnel of the company for each of the relevant categories specified in IAS 24 Related Party Disclosures is provided in the audited part of the Directors’ Remuneration Report on pages 45 to 46.
Directors’ transactionsDividends totalling £235,000 (2012: £168,000) were paid in the year in respect of ordinary shares held by the Company’s directors.
Notes to the nancial statements continued
for the year ended 31 December 2013

Annual Report 2013 Witan Investment Trust plc 85
Financial Statements
Statutory Information
Strategic ReportReport of the D
irectors C
orporate Governance
Other Inform
ation
24 Segment ReportingThe Group adopted IFRS 8 Operating Segments with effect from 1 January 2009. IFRS 8 requires operating segments to be identified on the basis of internal reports about components of the Group that are reviewed regularly by the Chief Executive Officer and that are used to allocate resources to the segments and to assess their performance. The identification of the Group’s reportable segments did not change as a result of the adoption of IFRS 8.
Geographical segmentsGeographical segments are considered to be the primary reporting segment. An analysis of investment income by geographical segment is set out in note 2 on page 67. Analyses of expenses by geographical segment and of profit by geographical segment have not been given as it is not possible to prepare such information in a meaningful way. An analysis of the investments by geographical segment is set out in note 10 on page 72. Analyses of the remaining assets and liabilities by geographical region have not been given as either it is not possible to prepare such information in a meaningful way or the results are not considered to be significant.
Business segmentsBusiness segments are considered to be the secondary reporting segment. The Group has two business segments: (i) its activity as an investment trust, which is the business of the parent company, Witan Investment Trust plc, and recorded in the accounts of that company; and (ii) the provision of executive and marketing management services and the management of savings schemes, which is the business of the subsidiary company, Witan Investment Services Limited, and recorded in the accounts of that company.
2013 2012
Investmenttrust
£’000
Managementservices
£’000 Total
£’000
Investment trust
£’000
Management services
£’000 Total
£’000
Revenue 38,203 1,189 39,392 35,893 1,157 37,050 Interest expense 8,329 – 8,329 8,207 – 8,207 Net result 303,923 – 303,923 146,278 – 146,278
Carrying amount of assets 1,371,905 1,039 1,372,944 1,104,921 926 1,105,847
2 5 Subsequent events Since the year end, the Board has declared a fourth interim dividend in respect of the year ended 31 December 2013 of 4.5p per ordinary share (see also page 4 and note 8 on page 71).

Witan Investment Trust plc Annual Report 201386
Historical record(unaudited)
Debt at fair value Debt at par value
Market price per ordinary
share in pence
Net assetvalue per
ordinary sharein pence(b)
Share pricediscount
%(b)
Net assetvalue per
ordinary sharein pence(c)
Share pricediscount
%(c)
Earningsper ordinary
share in pence
Dividendsper ordinary
share in pence
31 December 2004 331.5 384.4 13.8 390.2(a) 15.0 8.63(a) 8.60
31 December 2005 414.0 458.9 9.8 469.5(a) 11.8 8.96(a) 8.80
31 December 2006 454.5 508.4 10.6 517.1 12.1 10.24 9.20
31 December 2007 478.5 537.9 11.0 545.7 12.3 11.08 9.90
31 December 2008 351.0 400.3 12.3 410.1 14.4 11.60 10.20
31 December 2009 444.6 497.0 10.5 502.7 11.6 10.63 10.50
31 December 2010 516.5 578.1 10.7 584.4 11.6 9.45 10.90
31 December 2011 450.0 503.7 10.7 516.9 12.9 13.27 12.00
31 December 2012 503.0 568.9 11.6(d) 581.8 13.5 14.50 13.20
31 December 2013 669.0 717. 6 6.8(d) 725.2 7.7 15.44 14.40
(a) The figure for 2005 has been calculated in accordance with International Financial Reporting Standards (‘IFRSs’) as adopted by the European Union and the figure for 2004 has been restated in accordance with IFRSs. The figures for the earlier years have not been restated.
(b) The net asset value per ordinary share is calculated by deducting from the total assets less current liabilities of the Group the fixed borrowings at their fair (or market) values. The share price discount shown reflects this calculation.
(c) The net asset value per ordinary share is calculated by deducting from the total assets less current liabilities of the Group the fixed borrowings at their par (not their market) values. The share price discount shown reflects this calculation.
(d) The average discount to the net asset value, excluding income, with debt at market value, in 2013 was 8.3% (2012: 10.7%). (Source: Datastream)
Unsolicited approaches for shares: warning to Shareholders
Many companies have become aware that their shareholders have received unsolicited phone calls or correspondence concerning investment matters. These are typically from overseas based ‘brokers’ who target UK shareholders offering to sell them what often turn out to be worthless or high risk shares in US or UK investments. They can be very persistent and extremely persuasive. Shareholders are therefore advised to be very wary of any unsolicited advice, offers to buy shares at a discount or offers of free company reports.
Please note that it is very unlikely that either the Company or the Company’s Registrar, Computershare Investor Services PLC, would make unsolicited telephone calls to shareholders and that any such calls would relate only to official documentation already circulated to shareholders and never in respect of investment ‘advice’.
If you are in any doubt about the veracity of an unsolicited phone call, please call either the Company Secretary or the Registrar at the numbers provided on page 88.

Annual Report 2013 Witan Investment Trust plc 87
Financial Statements
Statutory Information
Strategic ReportReport of the D
irector sC
orporate Governance
Other Inform
ation
Witan Wisdom and Jump
How to investThere is a variety of ways to invest in Witan Investment Trust plc. Naturally, Witan’s shares can be traded through any UK stockbroker. Advisers who wish to purchase Witan for their clients can also do so via a growing number of platforms that offer investment trusts including Ascentric, Alliance Trust Savings, Nucleus, Raymond James, Seven IM and Transact. Witan is also available for investment through the two savings schemes managed by Witan Investment Services – Witan Wisdom and Jump Savings.
Witan WisdomShareholders who hold their investment via the Witan Wisdom product have already been notified that from6 April 2014 we will be changing the charging structure of the savings scheme. From 6 April 2014, there will be a single flat annual fee of £30 +VAT for both the Witan Wisdom Share Plan and ISA. There will be no charge other than government stamp duty, for regular savings or dividend reinvestment. Lump sum dealing will be charged at a flat rate of £15.
Witan Wisdom offers two different savings wrappers:
The Witan Wisdom ISA is a stocks and shares ISA that enables investors to buy Witan shares within a tax efficient wrapper. Investors have an annual ISA allowance of up to £11,520 for the 2013/14 tax year, rising to £11,880 for the 2014/15 tax year. The minimum lump sum investment with Witan Wisdom ISA is £2,000, with the regular savings minimum being £100 per month. Investors can also transfer existing ISAs to Witan Wisdom while retaining their tax efficient wrapper during and after transfer.
The Witan Wisdom Share Plan is our straightforward, low-cost savings scheme. The minimum lump sum investment is £500, and the minimum regular contribution is £50 per month or quarter. There is no maximum. Accounts can also be held jointly, or designated to a child.
Jump Savings for childrenJump gives parents, grandparents and other adults the chance to invest in Witan on behalf of a child. This flexible savings plan has a minimum lump sum investment set at £250 and regular contributions can be made from £50 per month or quarter. Jump is available in three different wrappers:
Junior ISA – Is a tax efficient wrapper available to children born before 1 September 2002 or after 3 January 2012, or those who did not qualify for a Child Trust Fund. The account can only be opened by the parent though others can add
to it. It currently has an annual subscription limit of £3,720 for the 2013/14 tax year, which will increase to £ 3,840 for the 2014/15 tax year. You can open a Jump Junior ISA with a minimum lump sum investment of £250 or £50 per month or quarter.
Jump Child Trust Fund – Like the Junior ISA, the Child Trust Fund (CTF) is a tax efficient savings vehicle with an annual limit of £3,720 each year (measured by the child’s birthday), which will increase to £ 3,840 from 6 April 2014. Each child born in the UK from 1 September 2002 up to and including2 January 2012 was eligible for a CTF. You can transfer existing CTFs to Jump subject to a minimum transfer valueof £1,000.
Jump Savings Plan – the Jump Savings Plan offers greater flexibility than the Junior ISA or Child Trust Fund in terms of the limits, access and control of the investment. It can also be opened by grandparents, relatives and other family friends. You can open a Jump Savings Plan with a lump sum investment of £250 or £50 per month or quarter.
(n.b. With a flat rate annual fee of £30 +VAT for Jump, the cost is high for the minimum subscription level. Investors should consider if this is suitable for them if they do not plan to add to the account.)
Brochures and applications for all of our products are available by calling 0800 082 81 80 or online via www.witan.com. If you would prefer to write to request further information, the address details can be found on page 88.
Witan Investment Trust plc is an equity investment. Investors are reminded that past performance is not a guide to future performance and the value of investments and the income from them may go down as well as up and investors may not get back the amount originally invested. Please note that tax assumptions may change if the law changes, and the value of tax relief (if any) will depend upon your individual circumstances. Investors should consult their own tax advisers in order to understand any applicable tax consequences. Issued and approved by Witan Investment Services Limited. Witan Investment Services Limited of 14 Queen Anne’s Gate, London SW1H 9AA is registered in England and Wales number 5272533. Witan Investment Services provides investment products and services and is authorised and regulated by the Financial Conduct Authority. We may record telephone calls for our mutual protection and to improve customer service.

Witan Investment Trust plc Annual Report 201388
Shareholder information
Points of ContactIf you have any questions or need more information concerning Witan, you may contact us in the following ways:
Freephone:0800 082 8180
E-mail: [email protected]
Post:For Witan Wisdom and Jump Savings queries:Witan WisdomPO Box 10550ChelmsfordCM99 2BA
Points of ReferenceYou can follow the progress of your investment through the newspapers. Witan’s share price appears daily in the national press stock exchange listings under ‘Investment Trusts’ or ‘Investment Companies’ and is also included on the Witan website (www.witan.com).
The London Stock Exchange Daily Official List (SEDOL) code is 0974406.
DividendA fourth interim dividend of 4.5 p per share has been declared, payable on 28 March 2014. The record date for the dividend was 28 February 2014 and the ex-dividend date for the dividend was 26 February 2014 (see pages 4 and 28).
Capital Gains TaxThe calculation of the tax on chargeable gains will depend on your personal circumstances. If you are in any doubt about your personal tax position, you are recommended to contact your professional adviser.
Disability ActCopies of this Annual Report and other documents issued by Witan Investment Trust plc are available from the Company Secretary. If needed, copies can be made available in avariety of formats, including Braille, audio tape or larger type as appropriate.
You can contact our Registrar, Computershare Investor Services PLC, which has installed textphones to allow speech and hearing impaired people who have their own telephone to contact them directly, without the need for an intermediate operator, by dialling 0870 702 0005. Specially trained operators are available during normal business hours to answer queries via this service. Alternatively, if you prefer to go through a ‘typetalk’ operator (provided by The Royal National Institute for Deaf People),
you should dial 18001 followed by the number you wishto dial.
Registered Office14 Queen Anne’s GateLondon SW1H 9AA
Company SecretaryFrostrow Capital LLP25 Southampton BuildingsLondon WC2A 1ALTelephone: 020 3008 4910
Registered NumberRegistered as an investment company in England and Wales,Number 101625.
Custodian and Investment AdministratorBNP Paribas Securities Services55 MoorgateLondon EC2R 7PA
RegistrarComputershare Investor Services PLCThe PavilionsBridgwater RoadBristol BS99 6ZZTelephone: 0870 707 1408*
* Calls cost about 7 pence per minute from a BT line; calls from other providers, or from mobile phones, may cost more.
AuditorDeloitte LLPChartered Accountants2 New Street SquareLondon EC4A 3BZ
SolicitorsHerbert Smith Freehills LLPExchange HousePrimrose StreetLondon EC2A 2HS
Dickson Minto W.S.16 Charlotte SquareEdinburgh EH2 4DF
StockbrokerJ.P. Morgan Cazenove25 Bank StreetCanary WharfLondon E14 5JP
The Company is a member of:

Our relationship with the RHS
Witan Investment Trust has enjoyed a fruitful relationship with the Royal Horticultural Society (‘RHS’) for more than 15 years. Over this time Witan has helped the RHS to redevelop a number of new gardens at Wisley including the Walled Garden West, the Herb Garden and most recently the Bowes-Lyon Rose Garden.Witan shareholders who hold their shares through Witan Wisdom or Jump Savings, or on the main register, are eligible to apply for a ballot for a ticket that will allow free entry for
If you would like to request a ticket then please phone us on 0800 082 8180 or email us at [email protected].

Printed by Park Communications on FSC®
®