
CAPITAL ADEQUACY Capital Adequacy (Consolidated) · tation of the fiscal year’s ICAAP and budget...
102
119 ANNUAL REPORT 2018 The Norinchukin Bank CAPITAL ADEQUACY Capital Adequacy (Consolidated) Scope of Consolidation • Reason for discrepancies between companies belong- ing to the Bank’s group that are required to compute a consolidated capital adequacy ratio, as specified in the Notification Regarding Capital Adequacy Ratio, Article 3 (hereinafter, “the Consolidated Group”) and the companies included in the scope of consolidation, based on “Ordinance on Terminology, Forms and Preparation Methods of Consolidated Financial Statement” under Ministerial Ordinance No. 28, issued by the Ministry of Finance in 1976: Not applicable • As of March 31, 2018, the Bank had 13 consolidated subsidiaries. The names and principal lines of business of the primary subsidiaries are as follows: 1. Norinchukin Trust & Banking Co., Ltd.: Trust and banking business 2. Kyodo Housing Loan Co., Ltd.: Loans and guaran- tees for housing • Companies belonging to the Consolidated Group but not included in the scope of consolidation: Not applicable • Companies not belonging to the Consolidated Group but included in the scope of consolidation: Not applicable • Affiliated companies engaged in financial service busi- ness that were subject to the provisions of Article 9 of the Notification Regarding Capital Adequacy Ratio: Not applicable • Restrictions on the transfer of funds and capital between the members of the Consolidated Group: Not applicable Companies with Less than the Regulatory Required Capital and the Amount of Shortfall With regard to the group companies that are subject to capi- tal deduction, as provided for in the Notification Regarding Remarks on Computation of the Consolidated Capital Adequacy Ratio Procedures” (JICPA Industry Committee Report No. 30). It does not constitute part of the audit on consolidated financial statements or financial statements by law, but an inspection of part of the internal control related to the capi- tal ratio calculation, which the Bank recognized as neces- sary, using the procedures that were agreed upon between the Bank and Ernst & Young ShinNihon LLC. The results of the review are reported to the Bank. Accordingly, Ernst & Young ShinNihon LLC does not express any audit opinion regarding the capital ratio itself and/or the internal control regarding the calculation of the capital ratio. The disclosure requirements for the Bank are provided in Notification No. 6 of the 2007 Financial Services Agency and the Ministry of Agriculture, Forestry and Fisheries of Japan entitled “Disclosure Items Related to Capital Adequacy of The Norinchukin Bank” (hereinafter, “Disclosure Notification”). These disclosures as well as the features of regulatory capital instruments can be found in the IR Library of the Bank’s website at http://www. nochubank.or.jp/. Disclosure Regarding Capital Adequacy and Features of Regulatory Capital Instruments The Bank calculates its capital adequacy ratio based on the formula contained in Notification No. 4 of the 2006 Financial Services Agency and the Ministry of Agriculture, Forestry and Fisheries of Japan entitled “Standards for Judging the Soundness of Management of The Norinchukin Bank” (hereinafter, “Notification Regarding Capital Adequacy Ratio”). In addition, to calculate risk- weighted assets for credit risk, the Bank has adopted the “Advanced Internal Ratings-Based Approach (A-IRB) (partially the Foundation Internal Ratings-Based Approach (F-IRB))” and “The Standardized Approach (TSA)” for calculating operational risk capital charges. Regarding the calculation of capital adequacy ratio (on a consolidated and a non-consolidated basis), the Bank has been audited by Ernst & Young ShinNihon LLC pursuant to “Treatment of Inspection of the Capital Ratio Calculation Framework Based on Agreed-upon
Transcript of CAPITAL ADEQUACY Capital Adequacy (Consolidated) · tation of the fiscal year’s ICAAP and budget...

119ANNUAL REPORT 2018 The Norinchukin Bank
CAPITAL ADEQUACY
Capital Adequacy (Consolidated)
Scope of Consolidation
• Reason for discrepancies between companies belong-
ing to the Bank’s group that are required to compute
a consolidated capital adequacy ratio, as specified in
the Notification Regarding Capital Adequacy Ratio,
Article 3 (hereinafter, “the Consolidated Group”) and the
companies included in the scope of consolidation, based
on “Ordinance on Terminology, Forms and Preparation
Methods of Consolidated Financial Statement” under
Ministerial Ordinance No. 28, issued by the Ministry of
Finance in 1976:
Not applicable
• As of March 31, 2018, the Bank had 13 consolidated
subsidiaries. The names and principal lines of business of
the primary subsidiaries are as follows:
1. Norinchukin Trust & Banking Co., Ltd.: Trust and
banking business
2. Kyodo Housing Loan Co., Ltd.: Loans and guaran-
tees for housing
• Companies belonging to the Consolidated Group but not
included in the scope of consolidation:
Not applicable
• Companies not belonging to the Consolidated Group but
included in the scope of consolidation:
Not applicable
• Affiliated companies engaged in financial service busi-
ness that were subject to the provisions of Article 9 of the
Notification Regarding Capital Adequacy Ratio:
Not applicable
• Restrictions on the transfer of funds and capital between
the members of the Consolidated Group:
Not applicable
Companies with Less than the
Regulatory Required Capital and the
Amount of Shortfall
With regard to the group companies that are subject to capi-
tal deduction, as provided for in the Notification Regarding
Remarks on Computation of the Consolidated Capital Adequacy Ratio
Procedures” (JICPA Industry Committee Report No. 30).
It does not constitute part of the audit on consolidated
financial statements or financial statements by law, but an
inspection of part of the internal control related to the capi-
tal ratio calculation, which the Bank recognized as neces-
sary, using the procedures that were agreed upon between
the Bank and Ernst & Young ShinNihon LLC. The results
of the review are reported to the Bank. Accordingly, Ernst
& Young ShinNihon LLC does not express any audit
opinion regarding the capital ratio itself and/or the internal
control regarding the calculation of the capital ratio.
The disclosure requirements for the Bank are provided
in Notification No. 6 of the 2007 Financial Services
Agency and the Ministry of Agriculture, Forestry and
Fisheries of Japan entitled “Disclosure Items Related to
Capital Adequacy of The Norinchukin Bank” (hereinafter,
“Disclosure Notification”). These disclosures as well as
the features of regulatory capital instruments can be found
in the IR Library of the Bank’s website at http://www.
nochubank.or.jp/.
Disclosure Regarding Capital Adequacy
and Features of Regulatory Capital
Instruments
The Bank calculates its capital adequacy ratio based on
the formula contained in Notification No. 4 of the 2006
Financial Services Agency and the Ministry of Agriculture,
Forestry and Fisheries of Japan entitled “Standards
for Judging the Soundness of Management of The
Norinchukin Bank” (hereinafter, “Notification Regarding
Capital Adequacy Ratio”). In addition, to calculate risk-
weighted assets for credit risk, the Bank has adopted the
“Advanced Internal Ratings-Based Approach (A-IRB)
(partially the Foundation Internal Ratings-Based Approach
(F-IRB))” and “The Standardized Approach (TSA)” for
calculating operational risk capital charges.
Regarding the calculation of capital adequacy ratio
(on a consolidated and a non-consolidated basis), the
Bank has been audited by Ernst & Young ShinNihon
LLC pursuant to “Treatment of Inspection of the Capital
Ratio Calculation Framework Based on Agreed-upon

120 ANNUAL REPORT 2018 The Norinchukin Bank
CAPITAL ADEQUACY
Capital Adequacy Ratio, the names of those companies
whose capital is less than the regulatory required capital
and the total amount of shortfall in their capital:
Not applicable
The Bank annually conducts its Internal Capital Adequacy
Assessment Process (ICAAP) regarding the qualitative
and quantitative sufficiency of its internal capital to
demonstrate appropriate management of the risks and
maintenance of sufficient capital to cover the risks in terms
of consistency and the forward-looking robustness of its
capital management framework. Through the ICAAP,
the Bank intends to achieve a balance among “capital,”
“risk” and “return” at an elevated level and gain a deep
understanding from various stakeholders on the soundness
of its business.
The ICAAP process mainly focuses on the following three
points: (1) the current status of the Bank’s capital (regula-
tory capital management and economic capital manage-
ment); (2) the framework for assessing capital adequacy;
and (3) the robustness and flexibility of capital from a
forward-looking viewpoint (comprehensive, medium time
line stress tests and management action). Furthermore, to
ensure comprehensive assessment, the ICAAP also cov-
ers (4) the impact of the “uncertainties” that are difficult
to measure via statistical methods or that might arise in
special circumstances exceeding the quantitative measure-
ment assumptions on capital.
Overview of Internal Capital Adequacy Assessment Process
Overview of the Risk Characteristics
and Risk Management Policies,
Procedures and Framework of the Entire
Consolidated Group
■ Approach to Risk Management
Risk management initiatives by the Bank are stipulated in its
Basic Policies for Risk Management. The policies identify
the types of risks to be managed and the basic framework
for risk management, including organizational structure
and methodology. In accordance with the policies, the Bank
manages individual risks after assessing the materiality
of risks and identifying risks to be managed. The Bank
also implements integrated risk management by measuring
the overall amount of risk using quantitative methods and
comparing it with the Bank’s capital resources.
To implement integrated risk management, the Bank has
set up the Risk Management Committee. At the committee,
the Bank’s management discusses important issues relating
to its risk management framework and capital adequacy,
and determines respective management frameworks. The
committee also ensures that the total risk amount is kept
within capital resource limits. The structure also requires
that the integrated risk management status (such as capi-
tal and risk status, and significant decisions made by the
Risk Management Committee) be reported to the Board
of Directors on a regular basis. The Bank has also estab-
lished a number of committees based on the type of risk,
i.e. the Portfolio Management Committee (market risk,
credit risk and liquidity risk), the Credit Committee, the
Food and Agri Finance Committee (credit risk), and the
Operational Risk Management Committee (operational
risk), to enable the management to discuss and decide what
measures are needed to control risks that arise in the execu-
tion of management strategy and business policies within an
acceptable level. In line with the controls described above,
under the risk management framework including economic
capital management determined by the Risk Management
Committee, and based on the need to carefully maintain a
balance among return, capital and risk, in addition to due
consideration for liquidity, the Bank has built and operated
a forward-looking risk management framework by steadily
grasping the trends in international financial regulations and
exercising effective restraints.
Overview of the Risk Characteristics and Risk Management Policies,
Procedures and Framework of the Entire Consolidated Group

121ANNUAL REPORT 2018 The Norinchukin Bank
CAPITAL ADEQUACY
In line with the Basic Policies for Risk Management,
the Bank’s group companies have established their own
risk management systems by setting effective management
policies and frameworks, etc., according to the content of
their businesses and risk characteristics, in consultation
with the Bank.
■ Integrated Risk Management
Based on the Basic Policies for Risk Management, the
Bank stipulates a core risk management framework that
manages risk quantitatively and comprehensively in
comparison with capital, which represents its financial
strength. The core function in this framework is economic
capital management.
Under economic capital management, risks to be cov-
ered by capital are measured, and the internal capital for
this purpose is applied in advance. The amount of risk is
controlled so as not to exceed the applied internal capital
by monitoring the changes in the amount of risk caused
by market fluctuations and additional risk-taking in a
timely manner during the fiscal year. Any cases where the
amount of risk reaches the applied internal capital need to
be handled by the Board of Directors. To control various
risks, upper limits are set on respective risks according to
their importance and other factors.
The Bank categorizes the types of risks to be controlled
into market risk, credit risk and operational risk. To
maximize the benefit of the globally diversified invest-
ment concept, the Bank manages the economic capital
on an aggregate basis instead of allocating the capital to
each asset class or to each business segment, as the Bank
believes such an approach should fit in the business profile
of the Bank. In addition, the definition of internal capital
applied and the economic capital management framework
are determined by the Board of Directors, while the middle
office is responsible for monitoring the fluctuating capi-
tal levels and the amount of risk during each fiscal year.
These results are reported to management on a timely basis
and used for sharing an awareness of the risk environment
between the middle office and the front office.
Measurement of risks is conducted as to all financial
assets and liabilities in the Bank’s portfolio, in principle.
Market risk is measured primarily using a method which
simulates scenarios such as interest rate and stock price
fluctuations, based on past data (historical simulation
method). Credit risk is mainly measured using simulations
of scenarios such as default, downgrading and greater
credit spread, upon consideration of credit concentration
risk on certain corporate groups, industries and regions. On
that basis, in order that the correlation between the risks of
market and credit are reflected consistently, their Value-at-
Risk (VaR), with a 99.50% confidence interval and one-
year holding period, is centrally simulated to measure the
integrated risk amount. Also, operational risk is measured
by VaR, which is measured using statistical methods with
a 99.90% confidence interval and one-year holding period
and using potential risk event scenarios and risk events that
have come to light.
■ Implementation of Stress Tests
Stress tests are performed together with the implemen-
tation of the fiscal year’s ICAAP and budget planning,
covering the Bank’s entire portfolio. For the stress tests,
detailed stress scenarios are prepared by drafting stress
scenarios from among several stress events reflecting the
Bank’s vulnerability and by reference to the significance
based on the assessment of their impact amounts and prob-
ability of occurrence based on an analysis of the internal
and external environments, and factoring in specific time
lines and the ripple effects of risks regarding interest rates,
stocks and foreign exchange rates in Japan and abroad as
well as credit cost, in consultation with the front office, etc.
In addition, by referring to the impact amounts based
on the capital adequacy ratio, unrealized gains and losses
on securities and other factors under the stress scenarios,
things that the Bank should be mindful of and possible
management actions are discussed at the management
level to help decision making on day-to-day portfolio
management.
■ Market Risk Management
Market risk is the possibility of loss arising from a market
event such as fluctuations in the value of assets and liabili-
ties (including off-balance-sheet items) due to fluctuations
in various market risk factors, including interest rates,
foreign exchange rates and stock prices, and fluctuations
in the income generated from those assets and liabilities.
In its portfolio management under the basic concept

122 ANNUAL REPORT 2018 The Norinchukin Bank
CAPITAL ADEQUACY
of “globally diversified investment,” the Bank positions
market risk as a significant risk factor affecting its earnings
base and aims to retain a stable level of profit through
active risk-taking supported by an appropriate risk man-
agement framework.
■ Market Risk Management Framework
The Bank’s market risk management is conducted
through the Risk Management Committee being respon-
sible for overall integrated risk management, the Portfolio
Management Committee setting market portfolio alloca-
tion policies, the front office executing transactions and the
middle office independent of the front office monitoring
the amount of risk.
The principal market portfolio management process is
as described below.
Decision Making
Material decisions on market investments are made at the
Board level. The Board of Directors formulates the annual
allocation policies. Based on the policies, the Portfolio
Management Committee-composed of the Board members
involved in market portfolio management-makes deci-
sions, together with general managers, on specific policies
related to market investments after discussing them.
Decision making on market investments is carried out
after examining the investment environment including
the financial markets and the economic outlook, current
position of the securities portfolio, and Asset and Liability
Management (ALM) situation of the Bank. The Portfolio
Management Committee holds meetings on a weekly
basis, as well as when needed, to respond to changes in
market conditions in a flexible manner.
Execution
Based on the investment decisions made by the Portfolio
Management Committee, the front office executes securities
transactions and risk hedging. The front office is not only
responsible for executing transactions efficiently but also
monitoring market conditions closely to propose new invest-
ment strategies to the Portfolio Management Committee.
Monitoring
The term “monitoring functions” refers to checking
whether the execution of transactions made by the front
office is compliant with the investment decisions approved
by the Portfolio Management Committee, and to measur-
ing the amount of risk in the Bank’s investment portfolio.
To maintain an appropriate risk balance among asset
classes, various risk indicators as well as risk amount for
economic capital management are measured and moni-
tored. These functions are fulfilled by the middle office,
which is independent of the front office. Matters relevant
to market portfolio management (such as market condi-
tions, major investment decisions made by the Portfolio
Management Committee, condition of the market portfolio
and views on near-term market portfolio management)
are reported to the Board of Directors on a regular basis.
Monitoring reports are used to analyze the current situation
of the market portfolio and as a data source for discussing
the investment strategies in the near future at the Portfolio
Management Committee.
Overview of Credit Risk Characteristics
and Risk Management Policies,
Procedures and Framework
■ Credit Risk Management
Credit risk is the possibility of loss arising from a credit
event such as deterioration in the financial condition of a
borrower and economic environment that causes an asset
(including off-balance sheet items) to lose value or to be
significantly impaired. At the Bank, in its portfolio man-
agement based on “globally diversified investments,” credit
risk, as well as market risk, is positioned as an important
risk in optimizing the portfolio. Specifically, credit risk
arising from investment and loan activities for the “food
and agriculture business” and “investment business” is
appropriately managed by building a management frame-
work centering on the Internal Rating System.
■ Credit Risk Management Framework
The Bank adopts a business model of taking the deposits
received by cooperative members from the JA Bank’s
membership and investing them effectively and consistently
Matters Relating to Credit Risk

123ANNUAL REPORT 2018 The Norinchukin Bank
CAPITAL ADEQUACY
and providing stable returns. Therefore, the Bank not only
conducts traditional loan and deposit businesses but also
develops a broad range of globally diversified investments
in Japanese and international financial markets, centering
on bonds, stocks, credit assets and alternative assets. As a
result, its balance of market assets—mainly securities—
exceeds that of loan assets.
The Bank’s credit risk management framework com-
prises four committees (the Risk Management Committee,
the Credit Committee, the Portfolio Management
Committee and the Food and Agri Finance Committee)
that are managed by the directors and general managers
involved in risk management. These committees determine
the Bank’s credit risk management framework as well as its
credit investment policies. The front office executes loan
transactions and credit investments in accordance with the
credit policies and within the credit limits of these policies.
The middle office, which is independent of the front office,
monitors changes in the credit risk portfolio and reports
them to the committees. Feedback is then used for upgrad-
ing the risk management framework and for future credit
investment planning.
Each of the four committees has a specific role assigned to
it by the management. The Risk Management Committee,
with the Risk Management Division serving as the secre-
tariat, is responsible for deliberation and decision making
on the basic framework for overall credit risk management,
including the Internal Rating System, self-assessment,
economic capital management and credit ceiling for
credit overconcentration risk. The Portfolio Management
Committee and the Food and Agri Finance Committee,
with the Financial Planning & Control Division serving
as the secretariat, formulate basic strategies and deliberate
on the execution policies regarding loans and investments,
and deliberate and decide on business strategies for impor-
tant or large transactions. Moreover, the Credit Committee
functions as a venue for deliberation and decision making
of policies about how to deal with the obligations of bor-
rowers whose financial condition has deteriorated.
The middle office monitors the credit risk portfolio
status and other items. In addition, the status of credit
risk management (such as market overview; important
decisions made by the Credit Committee, the Portfolio
Management Committee and the Food and Agri Finance
Committee; overview of the credit risk portfolio; current
approach to risk management) is regularly reported to the
Board of Directors. The Compliance Division checks the
appropriateness of business operations from the aspect of
compliance by attending various meetings and, if finding
any significant fact, reports that to an Audit & Supervisory
Board Member.
Under the direction of the Board of Directors, the
Internal Audit Division audits the operational status of such
meetings and reports the results to the Board of Directors.
Overview of the Criteria for Write-Offs
and Provisions to Reserves
■ Self-Assessment Based on
Internal Rating
The Bank conducts self-assessment on a quarterly basis at
the end of March, June, September and December.
The self-assessment process initially classifies debtors
in line with the Bank’s debtor ratings. There are five debtor
classifications: standard, substandard, doubtful, debtors in
default, and debtors in bankruptcy.
Subsequently, within each of these classifications, the
credit for each individual debtor is classified into four
categories (I, II, III and IV) according to its recoverability.
■ Write-Offs and Provisions to Reserves
Write-offs and provisions to reserves for possible loan
losses are made according to the criteria set by the Bank for
each debtor classification by self-assessment. For exposure
to standard debtors and substandard debtors, the Bank
makes provisions to general reserves for possible loan
losses for each category of borrower based on the expected
loss ratio, which is calculated mainly from historical loss
ratio. For substandard debtors with substantial exposure,
provisions to specific reserves for possible loan losses are
calculated by the Discounted Cash Flow (DCF) method
on an individual basis. For exposure to doubtful debtors
or lower, provisions to specific reserves for possible loan
losses are made, or write-offs are performed, for the neces-
sary amount classified as Category III and IV which are
not recovered by collateral or guarantee.
Details on Loans and Bills Discounted and other items
are described in the Notes to the Financial Statements.

124 ANNUAL REPORT 2018 The Norinchukin Bank
CAPITAL ADEQUACY
Relationship among Internal Rating, Self-Assessment, and Exposure Requiring Mandatory Disclosure under the Financial Revitalization Law
Internal
Rating
Self-Assessment Exposure Requiring Mandatory
Disclosure under the Financial
Revitalization LawDebtor Classification Asset Category Definition of Asset Category
1-1 4
Standard Category I
Debtors who maintain favorable operating conditions
and have no particular financial difficulties. Internal rat-
ings 1-1 to 4 are equivalent to investment grades of
credit rating agencies.Standard
1-2 5
2 6
3 7
8-1 Other
substandard
debtors
Ⅱ Debtors requiring close monitoring going forward
8-2
8-3 Debtors under
requirement of
control
Special attention
8-4
9 Doubtful Ⅲ Debtors who are highly likely to fall into bankruptcy Doubtful
10-1 Debtors in default
Ⅳ
Debtor who have effectively fallen into bankruptcy,
although no facts have emerged to indicate legal or
formal bankruptcyBankrupt or de
facto bankrupt
10-2Debtors in
bankruptcy Debtors who are legally and formally bankrupt
On the other hand, the credit risk parameters used to
calculate the capital adequacy ratio are different from the
parameters used to calculate the general reserves for pos-
sible loan losses and are calculated based on a transition
to the default (substandard debtors or below) under the
Internal Rating System. Among the credit risk parameters,
the Probability of Default (PD) is estimated by the Bank
based on historical default ratios corresponding to the inter-
nal ratings, whereas the Loss Given Default (LGD) is esti-
mated by the Bank based on internal loss data after default.
For the Exposure at Default (EAD), the value specified in
the Notification Regarding Capital Adequacy Ratio is used.
■ Exposure Subject to Standardized
Approach
For the assets listed below, the Bank partially applies the
Standardized Approach specifically to those assets.
• The on-balance sheet assets and off-balance sheet items
of the Bank’s consolidated subsidiaries, with the excep-
tion of Kyodo Housing Loan Co., Ltd.
• The following assets held by the Bank and Kyodo
Housing Loan: Suspense payments (with the exception of
the account for securities), prepaid expenses, foreign cur-
rency forward contracts for foreign currency deposits of
cooperative organizations, and current account overdrafts
(to holders of the Bank’s debentures).
The Bank plans to apply the Internal Ratings-Based
Approach to Norinchukin Australia Pty Limited from
March 31, 2020.
The Bank applies the ratings of five qualified credit
rating agencies (External Credit Assessment Institution
(ECAI)) in computing its risk assets, namely S&P,
Moody’s Investors Service, Fitch Ratings, Rating &
Investment Information and Japan Credit Rating Agency.
The Bank applies a risk weight of 100% to its exposure to
corporate, sovereign and bank exposures (excluding past
due exposure for three months or more) in accordance
with the Notification Regarding Capital Adequacy Ratio,
Article 44, regardless of the ratings assigned by these
qualified rating agencies.
Sub
sta
nd
ard

125ANNUAL REPORT 2018 The Norinchukin Bank
CAPITAL ADEQUACY
Exposure Subject to the Internal
Ratings-Based Approach
■ Scope of Internal Ratings-Based
(IRB) Approach
The Bank adopts the IRB Approach in computing credit risk
assets. The scope of the IRB Approach was defined at the
time of adoption as applying to all exposures in principle.
However, insignificant business units and asset cat-
egories in computing the amount of credit risk assets are
excluded from the application of the IRB Approach, and
the Standardized Approach is applied. Whether to apply
the Standardized Approach is decided on consideration of
the qualitative aspect of credit business, among other fac-
tors, in addition to the quantitative requirements specified
in the Notification.
Outline of the Internal Rating System
The Internal Rating System is introduced and operated as
a crucial tool to ensure a good balance between active risk
taking and keeping the credit risk amount under control
within the limits of the Bank’s financial strength such as
capital under appropriate risk management.
Types of Exposure by Portfolio and
Overview of Internal Rating Procedures
■ Corporate, Sovereign and Bank
Exposure
Types of Exposure
The types of corporate exposure include general business
corporate exposure, bank exposure, sovereign (country)
exposure and specialized lending exposure.
Within these categories, general business corporate
exposure is subdivided into resident and non-resident
corporate, depending on head office location. Specialized
lending is subdivided into Income-Producing Real
Estate (IPRE), High-Volatility Commercial Real Estate
(HVCRE), Object Finance (OF) and Project Finance (PF).
Overview of Debtor Rating Procedure
In the Bank’s general procedure for assigning a debtor
rating for corporate, sovereign and bank exposure, the front
office is in charge of applying for a rating and then the
credit risk management section reviews and approves it.
Moreover, the debtor rating is reviewed at least once a year.
In addition, when an event occurs that could cause a change
in the rating, the Bank conducts an “ad-hoc review.”
Overview of Loan Recovery Rating Procedures
At the Bank, a loan recovery rating is assigned to each
transaction with corporate, sovereign and bank exposure
according to the conservation status of the collateral.
Moreover, the loan recovery rating is reviewed on a
quarterly basis.
■ Equity Exposure
The Bank assigns debtor ratings to equity exposures
according to the same process used in assigning ratings to
corporate exposures whenever possible.
■ Retail Exposure
Retail exposures, such as retail exposure secured by resi-
dential retail properties, qualifying revolving retail expo-
sure and other retail exposures, are managed by grouping
individual exposures into eligible retail pools the Bank
stipulates and assigning ratings at the pool level.
Parameter Estimates and Validation Framework
■ Corporate, Sovereign and Bank
Exposures
• PD
For the Probability of Default (PD) for corporate, sover-
eign and bank exposures, the Bank uses internal estimates
corresponding to the debtor rating grades for four cat-
egories—resident corporate, non-resident corporate, bank
and sovereign.
Among the above exposures, the resident corporate uses
default data by the Bank’s internal rating, whereas the
non-resident corporate, bank and sovereign categories use
default data by external ratings mapped to the internal rating
grades to calculate long-term average default ratios corre-
sponding to the debtor rating grades, to which the correction
and capital floors stipulated in the Notification Regarding
Capital Adequacy Ratio are applied to estimate the PDs.
For the bank and sovereign exposures, which are low
default portfolios (LDPs), it is difficult to make consistent
PD estimates from long-term average default data, which
is the case with general corporate exposures. Therefore,
after estimating the rating transition matrix, the probability
126 ANNUAL REPORT 2018 The Norinchukin Bank
CAPITAL ADEQUACY
of default that could occur after several years’ rating tran-
sitions is calculated to estimate the PDs. In addition, a
floor is applied to the upper ratings with the default ratio
being below the floor level, among the resident corporate,
non-resident corporate and bank exposures, thereby raising
the PDs.
For the PDs applied in calculating the capital adequacy
ratio, more conservative PDs are applied, compared to the
long-term average default ratios to ensure stable manage-
ment. To confirm the validity and conservativeness of the
PDs, benchmarking and validation of the assumptions
underlying the PD estimation method are conducted,
in addition to back-testing using the default data by the
Bank’s internal ratings and validation by comparing to
long-term average default ratios. The continuation of a
low-default environment, except for some industries in
Japan and globally for the past three fiscal years, led to a
discrepancy with the conservative PDs applied in calculat-
ing capital adequacy ratio.
• LGD
For the Loss Given Default (LGD) for the Bank’s general
business corporate exposure, internal estimates corre-
sponding to the loan recovery ratings are used.
LGDs are estimated by formulating the long-term aver-
age loss ratio and the collateral coverage ratio based on
internal loss data after default and reflecting various cor-
rection requirements. In particular, a correction concerning
the economic slowdown period is measured by applying a
certain amount of stress through yearly regression using
the average loss ratio and macroeconomic indicators.
For bank and sovereign exposures, which are low-default
portfolios, the Bank’s internal estimates are not used.
For the LGDs applied in calculating the capital adequacy
ratio, validation using back-testing and other methods,
based on internal loss data; benchmarking; and validation
of the assumptions underlying the LGD estimation method
are conducted to confirm the validity and conservativeness
of the LGDs.
Although the length of time from default to the liquida-
tion (conclusion) of exposures varies to a certain degree
according to the reasons for the liquidation of each indi-
vidual exposure, the average length of such a period has
stayed about the same. Therefore, the average period of
conclusion is set and used to estimate the LGDs.
• EAD
For the Exposure at Default (EAD) relating to corporate,
sovereign and bank exposures, the Bank’s internal esti-
mates are not used.
■ Retail Exposure
For the Probability of Default (PD) and the Loss Given
Default (LGD) for the Bank’s retail exposures, internal
estimates are used for each pool level classified by the
characteristics of exposure and the status of credit risk.
The PDs are estimated by calculating long-term average
default ratios based on historical default data for each
pool level and applying the correction and capital floor
stipulated in the Notification Regarding Capital Adequacy
Ratio. To confirm the validity and conservativeness of the
PDs, benchmarking and validation concerning the years
elapsed and the effect during the year of execution are
conducted, in addition to back-testing using default data
for each pool level.
The LGDs are estimated for each pool level by calculat-
ing the loss ratio using a method appropriate for the default
situation in question, based on the loss data after defaults
occurring in the past, taking into account the uncertain-
ties during the recovery process, and reflecting various
corrections. Regarding a correction factor concerning the
economic slowdown, changes in the value of collateral
occurred during a certain economic cycle and its loss ratio
are reflected in the LGDs.
Because the periods from the time of default to the
liquidation (conclusion) of exposures vary depending
on the pool due to the difference in the characteristics of
each pool, the average period until conclusion for each
pool level is set based on historical loss data and used to
estimate the LGDs.
The applicable EAD is the end-of-period balance, since
the Bank has no exposure for revolving products, with
which balances may be changed within the predetermined
credit lines at the discretions of the obligors.
■ Framework for the Implementation of
the Internal Rating System as Well as
the Development and Management
of Models Used
At the Bank, the middle office, which is independent of
the front office, designs the Internal Rating System based

127ANNUAL REPORT 2018 The Norinchukin Bank
CAPITAL ADEQUACY
on the characteristics of the credit portfolio and establishes
rules concerning the internal rating objectives, each rating
grade criteria, evaluation methods and mapping criteria,
approval authority, and review and validation of rating.
Validation and monitoring of the Internal Rating System
to ensure appropriate implementation is performed on a
regular basis.
The middle office conducts validation, monitoring and
implementation of the internal rating framework, and
engages in the development of models as well. The Credit
Risk Management Division handles the implementation of
models, whereas the Risk Management Division conducts
validation thereof and formulates a model maintenance plan,
considering opinions from the related Departments, which
is to be discussed at the Risk Management Committee.
The design, implementation and validation of the
Internal Rating System as well as the formulation of
model maintenance plans are audited by the Internal Audit
Division independent of the Risk Management Division.
Overview of Risk Characteristics, Risk
Management Policies, Procedures
and Framework Related to Credit Risk
Mitigation Techniques
■ Overview
Credit Risk Mitigation (CRM) Techniques refer to the
method to reduce the amounts of credit risk assets by using
collateral, guarantees or other means for the recovery of
claims. The Bank adjusts the amounts of credit risk assets
using eligible financial collateral, guarantees or other
means in accordance with the Notification Regarding
Capital Adequacy Ratio.
A major eligible type of financial collateral is securities.
For securities with market value such as listed stocks, a
decline in market value means a reduction in the recover-
able amount. The recovery effect is not recognized for
stocks of the parent company.
Regarding guarantees, the types of guarantors in such
transactions are mainly sovereigns, including central and
local governments, financial institutions and corporates. To
evaluate the creditworthiness of a guarantor, in principle,
the Bank evaluates the entity’s financial soundness as a
guarantor after assigning a debtor rating and assessing the
guarantor’s creditworthiness. The effectiveness of CRM is
not recognized if the debtor rating of a guarantor declines
and falls below that of a guarantee.
To recognize the effectiveness of CRM using collateral
and a guarantee, the legal effectiveness and appropriate
assessment of the collateral and guarantee are important.
Concerning the adequacy of collateral and guarantees, the
front office and the Risk Management Division maintain
their legal effectiveness and ensure their recoverability, and
regularly confirm the marketability (liquidity) of collateral
through timely and appropriate assessments.
■ Remarks on Policies for the Use of
Netting and Basic Features of the
Process and the Usage Status of
Netting
For eligible financial collateral (excluding repo-type
transactions and secured derivative transactions), the
effectiveness of CRM can be recognized if it satisfies
the relevant requirements stipulated in the Notification
Regarding Capital Adequacy Ratio. The Bank recognizes
the effectiveness of CRM only for deposits with the Bank
(including Norinchukin Bank Debentures) or stocks, etc.
On the other hand, for deposits held with the Bank that are
not pledged as collateral, as deposits and loans are not offset,
the Bank does not take into account the effects of CRM.
For the application of netting, the Bank specifies detailed
procedures in its internal rules, confirms legal efficacy at
the time of a collateral pledge and periodically confirms and
revaluates whether the function of protection from credit
risks is maintained. To calculate the effectiveness of CRM,
the amount of eligible financial collateral is used with con-
sideration of the standard volatility adjustment ratios.
Credit Risk Mitigation Techniques

128 ANNUAL REPORT 2018 The Norinchukin Bank
CAPITAL ADEQUACY
■ Basic Features of Evaluation
of Collateral and Collateral
Administrative Policies and Processes
The Bank regards future cash flows generated from the
businesses of debtors as funds for recovery of its claims.
Collateral is viewed as supplementary for the recovery of its
claims. The Bank applies a collateral evaluation method to
ensure that the amount recovered from collateral is not less
than the assessed value of the collateral, even in the case
that it becomes necessary to recover claims from collateral.
Specifically, the Bank values collateral based on objec-
tive evidence such as appraisals, official land valuations
for inheritance tax purposes, and market value. Further, it
has established detailed valuation procedures that make
up its internal rules. In addition, the procedures stipulate
the frequency of valuation reviews according to collateral
type and the creditworthiness of debtors, which routinely
reflects changes in value. The Bank conducts verification
whenever possible, even when setting policies for debtors
and during self-assessment. The Bank also estimates the
recoverable amount by multiplying the weighing factor
based on collateral type, and then uses that estimate as a
secured amount for the depreciation allowance.
As a part of collateral management, the Bank stipulates
the procedures of reviewing the legal efficacy and enforce-
ability of collateral not only at the time of the collateral
pledge but also periodically through the term of contract.
■ Remarks on the Status of Market
Risk or Credit Risk Concentrations
Arising from the Application of CRM
Techniques
For exposures where the credit risk of guaranteed exposure
is being transferred from a guaranteed party to a guaran-
tor as a result of CRM techniques, the Bank monitors the
concentrations of credit risk, and manages the exposures
accordingly. Regarding market risk, there is no exposure of
credit derivatives in the Bank’s trading accounts.
Overview of Risk Characteristics and
Risk Management Policies, Procedures
and Framework for Counterparty Credit
Risk in Derivatives and Repo-Type
Transactions
■ Policies for Allocation of Risk Capital
and Credit Ceiling Concerning
Exposures to Counterparties and CCP
The Bank manages credit risk involving derivative transac-
tions with financial institutions within the risk limits (Bank
Ceiling) established in each group financial institution.
A Bank Ceiling is established for each front section on
the basis of each entity within the group and each type of
transaction (derivatives, financial transactions, loans, etc.).
Credit exposures related to derivative transactions are man-
aged so as not to exceed the limits. Under the Bank Ceiling
system, the exposure of derivatives that are to be managed
is calculated utilizing the current exposure method (the
replacement cost (mark-to-market) of the transaction plus
an add-on deemed to reflect the potential future exposure).
Counterparty Credit Risk in Derivative Transactions
■ Assessment on Collateral,
Guarantee, Netting and Other Credit
Risk Mitigation (CRM) Techniques
and Overview of Management
Policies and Disposal Procedures for
Collateral, etc.
For derivative transactions, the Bank has concluded a CSA
contract with major counterparties. In some cases, the Bank
receives collateral from these counterparties. The collateral
posted may vary depending on the terms of the CSA con-
tract, but mainly it consists of Japanese government bonds
(JGBs), Japanese yen cash, U.S. Treasury bonds, and U.S.
dollar cash. If the counterparty is not a core company of
the group it belongs to, the Bank concludes a guarantee
agreement with the core company of the group.
The Bank considers legally binding bilateral netting
contracts for derivatives subject to netting in the ISDA
Master Agreement as a means of CRM. Legally binding
netting contracts are managed by verifying the necessity
of the contract itself and scope of transactions on a regular
and as-needed basis.

129ANNUAL REPORT 2018 The Norinchukin Bank
CAPITAL ADEQUACY
Regarding repo transactions, etc., in some cases, the
Bank receives collateral such as various types of bonds,
depending on the agreements that are concluded with its
major counterparties.
The effectiveness of CRM techniques in these transac-
tions is evaluated by the appropriate transaction unit. In
case the amounts of collateral, etc., received are insuf-
ficient, according to the details of the agreement, the Bank
receives additional collateral, thereby managing collateral,
etc. In addition, in case of the disposal of collateral, such
is executed based on the specifics of the agreement with
each counterparty.
■ Policies for Recognition, Monitoring
and Management of Wrong-Way Risk
“Wrong-way risk” refers to a risk of an increase in loss
through interaction with the counterparty, which occurs in
case the exposure of derivative transactions to the counter-
party is adversely co-dependent with the credit quality of
that counterparty.
Regarding risks related to financial institutions, which
account for a majority of counterparty credit risks, the
Bank conducts appropriate management of such risks
including a wrong-way risk, by establishing credit limits
for each financial institution based on the Bank Ceiling
system and via monitoring on a daily basis.
■ Remarks on Impact in Case the
Bank is Required to Post Additional
Collateral when its Credit Standing
Deteriorates
If the Bank’s credit rating is downgraded, the Bank’s finan-
cial institution counterparty will reduce its credit risk limit
and may demand the Bank to post collateral. However, the
Bank has a sufficiently high level of liquid assets, such
as government bonds that can be used as collateral, and
the amount of those assets is periodically checked by the
Portfolio Management Committee. For this reason, even
if the Bank is required to post additional collateral, the
impact on the Bank will be minimal.
Overview of Risk Characteristics, Risk
Management Policies, Procedures and
Framework Related to Securitization
Exposure
From the standpoint of globally diversified investments,
the Bank invests in securitized (structured finance) trans-
actions. Securitized exposure is a tool enabling the Bank to
effectively and efficiently mitigate and acquire credit risk
and other forms of risk of underlying assets. The Bank’s
policy is to continuously utilize securitized transactions
while managing the risk arising from those transactions
appropriately. The Bank does not plan to conduct securi-
tized transactions in trading accounts.
Securitization exposure is managed mainly by operating
the following cycle: After a management framework and
an investment policy for each asset class are determined
by the four committees consisting of the management—the
Risk Management Committee, the Credit Committee,
the Portfolio Management Committee and the Food and
Agri Finance Committee—the front office executes the
Securitization Exposure
transaction through individual analysis during initial
investment research (due diligence) and credit screen-
ing. The middle office, which is independent of the front
office, reports the status of the credit risk portfolio and
other related matters to the committees for further review
of the management framework, leading to planning and
formulation of an investment policy.
During individual analysis, in general, because of
complex investment structures with different risk-return
profiles than the underlying assets, after identifying items
of due diligence and monitoring of each asset class as
well as securitization and re-securitization, the Bank
carefully examines risk in underlying assets and structure
and conducts quantitative analysis of repayment capacity.
After investment, the Bank monitors the credit condition,
including underlying asset performance of each project,
and analyzes and assesses the market environment taking
into account underlying asset trends of each asset class.
In the event of credit deterioration, etc., is being seen, a
framework of risk management is created including revis-
ing investment and holding policies.

130 ANNUAL REPORT 2018 The Norinchukin Bank
CAPITAL ADEQUACY
The securitization exposure which contains securitiza-
tion exposure as an underlying asset is called re-securiti-
zation exposure. Among the re-securitization exposures,
wherein the majority of underlying assets are comprised of
securitization exposures, the Bank treats them as second-
ary and tertiary re-securitization exposures and manages
them separately from other re-securitization exposures
in order to monitor and manage them closely. The Bank
does not plan to acquire new secondary or tertiary re-
securitization exposures.
For securitization transactions, as described above,
the Bank has been mainly be involved as an investor,
and also involved in arranging securitization and liquid-
ity schemes such as using loan debt as the Group. As of
March 31, 2018, the Bank engaged in no securitization
transactions in which the Bank acted as an originator and
recognized regulatory risk asset mitigation effects. In
addition, the Bank’s subsidiaries (excluding consolidated
subsidiaries) or affiliates have no securitization exposure
involving securitization transactions performed by the
Bank in fiscal 2017.
As of March 31, 2018, the Bank had not provided credit
support, etc., other than contracts.
Accounting Policies for Securitization
Exposure
The Bank treats securitized instruments in accordance
with the “Accounting Standard for Financial Instruments”
(ASBJ Statement No. 10) and “Practical Guidelines on
Accounting Standards for Financial Instruments” (JICPA
Laws and Regulations Committee Report No. 14) for
accounting purposes.
For securitization exposures to which RBA is applied,
the Bank relies on the following five qualified credit rat-
ing agencies: S&P, Moody’s Investors Service, Fitch
Ratings, Rating & Investment Information and Japan
Credit Rating Agency.
The Bank does not use the “Internal Assessment
Approach (IAA).”
Characteristics of Market Risks and
Market Risk Management Policies,
Procedures and Framework
The Bank’s trading operations refer to operations of
trading accounts, etc., to generate profits from short-term
fluctuations in market prices and utilizing price or other
gaps between markets. The section of the front office in
charge of execution of trades is organizationally separated
from other sections of the front office handling other
transactions. The front office executes trades within the
approved position and loss limits predetermined from a
risk-return perspective. The middle office, which is inde-
pendent of the front office, measures the risk amounts
including VaR and monitors the status of risk taking by the
front office. The results of such monitoring are regularly
reported to the Portfolio Management Committee, etc. For
risk measurements, the Bank uses internal models based
on a variance-covariance method with a one-tailed 99%
confidence interval and a 10-business day holding period,
and measures VaR on a daily basis.
Market Risk
Computation of Market Risk Amount by
Internal Models Approach
■ VaR and Stress VaR
(1) Scope of Internal Models Approach
An internal models approach based on a variance-covari-
ance method is used, covering general market risk in the
trading accounts.
(2) In case multiple models are used at different business
bases of the Group, explanation on the models used by
each operational base:
Not applicable
(3) Overview of the Models
VaR is measured using the variance-covariance matrix.
Regarding the volatility of the variance-covariance matrix,
after estimating a long-term stable value by weighing
historical data using the exponential weighted moving
average (EWMA) method, the generalized autoregressive
conditional heteroskedasticity (GARCH) model is used
to adjust the variables. For the remaining differences, a
“T-distribution” is assumed, taking into account the

131ANNUAL REPORT 2018 The Norinchukin Bank
CAPITAL ADEQUACY
market’s fat-tailed distribution.
(4) Difference between the model used for internal man-
agement and the legally stipulated model
There is no difference.
(5) Value at Risk
• Frequency of updates of historical data: daily
• Period of observation of historical data: the most recent
1,000 business days
• Method for weighing historical data: risk-weighing of
historical data using the EWMA method.
• VaR calculated based on a holding period of fewer than 10
business days was converted to a VaR for a 10-business
day holding period by adjusting the holding period based
on the VaR per business day. To adjust the holding period,
volatility during one business day is adjusted to volatility
during 10 business days using the GARCH model.
• VaR summing method: General market risks and indi-
vidual risks are simply summed. Different risk factor
values are summed, reflecting a correlation that is esti-
mated using the variance-covariance method based on
historical data.
• Price reevaluation method: Prices are revaluated by sen-
sitivity analysis.
• Measurement of fluctuations in risk factors: risks related
to interest rate are determined via absolute return,
whereas risks related to currency exchange rates and
bond futures, etc., are determined via bilateral returns.
(6) Remarks on stress VaR
• Stress period selection method and the basis for the selec-
tion: Based on the daily profit/loss fluctuations since
1999, the variance of profit/loss fluctuations during 250
days was computed and the period with the largest vari-
ance was selected as a stress period.
• Price reevaluation method: Prices are revaluated using
price sensitivity analysis.
• For stress VaR computed based on the holding period
of fewer than 10 business days, the holding period is
adjusted by multiplying by √t.
(7) Remarks on stress tests
The Bank conducts stress tests monthly based on multiple
stress scenarios assuming radical market changes such as the
largest fluctuations in interest rates for the past five years.
(8) Back-testing
The VaR of one business day that is calculated using a
model is compared to daily profit/loss fluctuations. In case
more than a certain excess was seen due to the model’s fac-
tors, those factors are analyzed and the model is reviewed
on an as-needed basis.
(9) Validation framework for parameters used for
internal models
For validation of the parameters used for internal models,
the following items are validated on a regular basis:
• Statistical validation concerning suitability with the
hypothetical distribution assumed for the variance-
covariance matrix
• Statistical validation concerning the significance of the
parameters estimated by the GARCH model
• Statistical validation concerning how close the prices
revaluated by a sensitivity analysis are to actual profit/
loss fluctuations
Based on the analysis results from the Division in
charge of management of the internal models, if there
any problems, the Risk Management Division discusses
whether to review the model.
(10) Other remarks on model validation methods
Not applicable
■ Additional risk
Not applicable
■ Comprehensive risk
Not applicable

132 ANNUAL REPORT 2018 The Norinchukin Bank
CAPITAL ADEQUACY
Overview of Risk Management Policies and
Procedures Related to Operational Risk
■ Operational Risk Management
For operational risk management, the Bank has established
its basic policies including definitions of the risk, manage-
ment framework and management processes, which have
been approved by the Board of Directors.
■ Definition of Operational Risk
The Bank defines operational risk as the risk that arises
in the course of business operations which per se do not
generate profit. Operational risk is different from market
risk, credit risk and liquidity risk, or the types of risks the
Bank actively takes to generate profits. Operational risk is
further broken down into subcategories, such as processing
risk, IT systems risk, legal risk, personnel risk, tangible
assets risk, information security risk, business continuity
risk, reputational risk and regulatory risk.
■ Basic Approach of Operational
Risk Management
The Bank has established policies and procedures to
manage and control individual operational risks such as
processing risk, IT systems risk, legal risk, personnel
risk, tangible assets risk and information security risk, for
which the Bank’s key management strategy is the preven-
tion of risk event occurrence. The Bank also employs the
following common risk management methods in order to
Operational Risk
identify, analyze, assess, manage and mitigate risks effec-
tively: the operational risk reporting system for collection
and analysis of risk events which have come to light, as
well as Risk & Control Self-Assessment (RCSA) system
for the evaluation of potential risks. To counter business
continuity risk, for which the Bank’s key management
strategy is the mitigation of the impact and effect of risk
events following their occurrence, the Bank has estab-
lished the Policies and Procedures for Risk Management
and other rules to address the situation after occurrence
of a disaster and countermeasures to take when a disaster
is predicted to occur. In addition, the Bank has worked
to verify and enhance the effectiveness of its business
continuity framework through regular drills.
Risks other than the above, such as reputational risk and
regulatory risk, are defined as risks which should be dealt
in accordance with the Bank’s business judgment. The
Bank strives to take proactive action in order to prevent the
occurrence of risk events while continuously monitoring
these risks for signs of changes, and endeavors to incor-
porate those changes in the Bank’s management strategy.
The Bank’s current status in operational risk manage-
ment is reported to the Operational Risk Management
Committee and the Board of Directors periodically, and
the basic policies for operational risk management are
reviewed based on these reports when necessary. In addi-
tion, the overall operational risk management framework
is subject to thorough internal audit on a regular basis, in
order to continuously improve its effectiveness.
Overview of Risk Characteristics, Risk
Management Policies, Procedures and
Framework Related to Equity Exposure
■ Framework for Correct Recognition,
Evaluation, Measurement and
Reporting of Risks
Risk measurements are conducted by the middle office,
which is independent of the front office. The Bank’s
Equity Exposure
exposure to equity comprises stocks classified as other
securities and stocks of subsidiaries and affiliates. The
amount of risk-weighted asset for credit risk is computed
by the methods specified by the Notification Regarding
Capital Adequacy Ratio. For internal management pur-
poses, the Bank conducts comprehensive risk management
within its economic capital management framework.

133ANNUAL REPORT 2018 The Norinchukin Bank
CAPITAL ADEQUACY
■ Risk Management Policies for Other
Securities and Stocks of Subsidiaries
and Affiliates by Category
Risk management of equities classified as other securities
is managed under a framework of market risk manage-
ment (including interest rate risk and foreign currency
exchange risk). That framework mainly consists of the
economic capital management framework. Concerning the
stocks of subsidiaries and affiliates, such are recognized as
credit risk assets and managed within the economic capital
management framework.
■ Principal Accounting Policies for
Exposures Including Evaluation
of Exposure to Equity and Other
Investments (Including the items in
line with Article 8, Paragraph 3, of the
“Ordinance on Terminology, Forms
and Preparation Methods of Financial
Statement” in case the accounting
policies are changed)
For accounting purposes, among exposure to equity and
other investments, stocks of subsidiaries and affiliates are
valued at cost, determined by the moving average method.
Exposure to equity and other investments classified in
other securities is valued at the market value prevailing on
the date of the closing of accounts, in the case of equities
with quoted market values (with book values mainly deter-
mined by the moving average method). Equities which
are extremely difficult to determine the fair value of are
valued at cost, determined by the moving average method.
In addition, the valuation difference on other securities is
entered directly in the net assets account.
Overview of Risk Management Policies
and Procedures Related to Exposure
Subject to Risk-Weighted Asset
Calculation for Investment Funds
Exposure subject to risk-weighted asset calculation for
investment funds consists mainly of assets managed in
investment trusts and money trusts. Assets under manage-
ment include equities, bonds and credit assets, which are
the Bank’s primary investment assets. Risk management
policies are stipulated for each of the asset’s risk. An
outline is provided in the section “Risk Management.” In
addition to assets managed by the Bank itself, the Bank
Exposure Subject to Risk-Weighted Asset Calculation for Investment Funds
utilizes investment funds in which asset management is
entrusted to management firms. Risk is managed by apply-
ing methods appropriate for each type of fund in accor-
dance with the Bank’s internal rules. In order to select
managers and entrust assets with them, the Bank performs
thorough due diligence on the manager’s ability, includ-
ing operating organization, risk management, compliance
framework, management philosophy and strategies, as
well as past performance. In addition, during entrusting
assets to managers, the Bank monitors their performance
from quantitative and qualitative perspectives and con-
ducts reviews of performance on a regular basis to assess
whether to maintain or replace individual managers.

134 ANNUAL REPORT 2018 The Norinchukin Bank
CAPITAL ADEQUACY
Overview of Risk Management Policies
and Procedures Related to Interest
Rate Risk
The “globally diversified investment” concept is the basis
of the Bank’s portfolio management. With bonds (interest
rate), stocks and credit assets as major asset classes, this
concept aims to establish a portfolio with high sound-
ness and profitability and a good balance among risks as
a whole by controlling profits from each asset and related
risks within the range of the assets, taking into account the
correlation among asset classes and other related points.
Therefore, the Bank deems market risk, such as inter-
est rate risk and the risk of stock price volatility, to be a
significant risk factor affecting the Bank’s earnings base.
Through active and appropriate risk-taking supported
by a robust risk management framework, the Bank aims
to retain a stable level of profit. The Bank also utilizes
hedge transactions such as derivatives from a perspective
of controlling market risks including interest rate risk and
maintaining such risks at an adequate level.
For risk management, from the perspective of control-
ling market risks including interest rate risk and credit
risk, etc., while keeping an appropriate risk balance, so
that such risks are kept within a range of its capital-based
financial strength, the Bank has established capital man-
agement checkpoints. For monitoring, ⊿EVE and VaR are
measured on a daily basis to grasp the impact of interest
rate fluctuations on current market values and NII and
⊿NII to grasp the impact of interest rate fluctuations on
the level of earnings. Such data are reported to the man-
agement of the Bank.
Moreover, interest risk volume based on VaR is measured
using the VaR model by the historical simulation method,
with a 99.50% confidence interval and one-year holding
period, in the same way as economic capital is measured.
In addition to the above, the Bank conducts periodic
stress tests, etc., to perform profit-and-loss simulation
analyses under a wide range of scenarios, such as a
scenario in which interest rates rise and fall based on a
dynamic portfolio. Furthermore, the Bank has established
Interest Rate Risk
a framework to properly monitor the multifaceted effects
of interest rate risk, including various interest rate sensitiv-
ity analyses, such as BPV and yield-curve risk, and static
and dynamic revenue and expenditure impact analyses by
major currencies.
The Bank applies the deferral method of hedge account-
ing to the hedge transactions to manage interest rate risk
associated with various financial assets and liabilities,
which is described in “Accounting and Auditing Treatment
relating to the Adoption of the ‘Accounting for Financial
Instruments’ for Banks,” issued by the Japanese Institute of
Certified Public Accountants (“JICPA”), (JICPA Industry
Audit Committee Report No. 24, issued on February
13, 2002). Hedge effectiveness of a fair value hedge is
assessed by identified groups of hedged items, such as
loans and deposits, and the corresponding groups of hedg-
ing instruments, such as interest rate swaps within the
same maturity bucket. Hedge effectiveness of a cash flow
hedge is assessed based on the correlation of the interest
rate risk indicators of the hedged items and that of the
hedging instruments.
Overview of Interest Rate Risk
Calculation Methods
■ Average/longest maturity for a revi-
sion of the interest rate allotted to
liquid deposits
For deposits without a contractual maturity that the Bank
accepts, without applying an internal model, such are
instead evaluated as overnight deposits to measure their
interest rate risks.
■ Assumptions related to early repay-
ment, etc., before the loan maturity
To evaluate mortgage-backed bonds and housing loans,
related interest rate risks are measured, taking potential
early repayments into account. In such measurements,
the midterm cancellation ratio is estimated by a statistical
analysis based on the interest rate situation and the histori-
cal repayment and cancellation data.

135ANNUAL REPORT 2018 The Norinchukin Bank
CAPITAL ADEQUACY
■ Method to tabulate multiple differ-
ent currencies and the underlying
assumption
Regarding the Economic Value of Equity (⊿EVE), from the
perspective of consistency with economic capital manage-
ment, by estimating a correlation structure among different
currencies based on historical interest rate fluctuations,
⊿EVE is tabulated for multiple currencies using a method
similar to a variance-covariance method, taking the variance
effect into account. In case currencies with losses occurred
and currencies with profits generated both existed in specific
scenarios, from the perspective of carefully estimating the
offsetting effect between currencies with profits and cur-
rencies with losses, after factoring in the cross-currency
offsetting effect into the analysis of the profit-generating
currencies, the ⊿EVE of currencies with gains and that of
currencies with losses are summed and tabulated.
Concerning Net Interest Income (⊿NII), the ⊿NII
among different currencies is simply summed.
■ Assumptions regarding the spread
(whether to include in the discount
interest and/or cash flow, etc., at the
time of calculation)
Discounted interest rates are established, considering the
appropriate spread for each product. Such spread is set as
invariable despite interest rate shocks.
■ Other assumptions that pose serious
impact on ⊿EVE and/or ⊿NII such as
utilization of internal models
Most time deposits with the Bank are cooperative depos-
its from JA and JA Shinnoren. Cooperative deposits are
time deposits that are continually deposited by JA and
JA Shinnoren based on the JA Bank Basic Policy from
the perspective of safe and efficient management by the
entire JA Bank. A source of part of such time deposits is
the liquid deposits received by JA and JA Shinnoren from
their individual customers.
Therefore, of the cooperative deposits, regarding the
balance of liquid deposits that JA and JA Shinnoren
receive from their individual customers, statistical analysis
is conducted, and projected interest rate, Japan’s popula-
tion dynamics and the trend of deposits and savings are
analyzed. Then, maturity—with the average maturity for
revision of the interest rate being five years and the longest
maturity for revising the interest rate being 10 years—is
allotted to each such deposit (core deposit) to recognize the
interest rate risks in terms of the ⊿EVE and ⊿NII.
■ Remarks on fluctuations since the
disclosure at the end of the previous
fiscal year
Not applicable
■ Other remarks on the interpretation
and significance of measured values
Not applicable

136 ANNUAL REPORT 2018 The Norinchukin Bank
CAPITAL ADEQUACY
Capital Ratio Information (Consolidated)
Composition of Capital (Consolidated)(Millions of Yen, %)
Basel III Template No. Items As of March 31,
2018
Amounts excluded under
transitional arrangements
As of March 31, 2017
Amounts excluded under
transitional arrangements
Ref. No.
Common Equity Tier 1 capital: instruments and reserves
1a+2-26Directly issued qualifying common share capital plus related capital surplus and retained earnings
5,373,368 5,296,239
1a of which: capital and capital surplus 3,455,509 3,455,509 E1.1-E1.2+E1.3
2 of which: retained earnings 1,988,359 1,910,262 E2
26 of which: cash dividends to be paid 70,500 69,531
of which: other than the above — — E3
3Accumulated other comprehensive income and other disclosed reserves
1,242,763 1,267,699 316,924 E4
5Common share capital issued by subsidiaries and held by third parties (amount allowed in group CET1)
— — E8.1
Total of items included in Common Equity Tier 1 capital: instruments and reserves under phase-out arrangements
960
of which: minority interests and other items corresponding to common share capital issued by consolidated subsidiaries (amount allowed to be included in group Common Equity Tier 1)
960
6Common Equity Tier 1 capital: instruments and reserves (A)
6,616,132 6,564,899
Common Equity Tier 1 capital: regulatory adjustments
8+9Total intangible assets (net of related tax liability, excluding those relating to mortgage servicing rights)
37,007 29,690 7,422
8of which: goodwill (net of related tax liability, including those equivalent)
4,638 11,087 2,771 A1.1+A1.2
9of which: other intangible assets other than goodwill and mortgage servicing rights (net of related tax liability)
32,368 18,602 4,650 A2.1-A2.2
10Deferred tax assets that rely on future profitability excluding those arising from temporary differ-ences (net of related tax liability)
— — — A3
11Deferred gains or losses on derivatives under hedge accounting
89,100 15,538 3,884 E7
12 Shortfall of eligible provisions to expected losses 21,227 14,971 3,742
13 Securitization gain on sale — — —
14Gains and losses due to changes in own credit risk on fair valued liabilities
— — —
15 Net defined-benefit asset 37,938 26,354 6,588 A4-D3
16Investments in own shares (excluding those reported in the Net Assets section)
— — — A5
17 Reciprocal cross-holdings in common equity — — — A6
18
Investments in the capital of banking, financial and insurance entities that are outside the scope of regulatory consolidation (“Other Financial Institutions”), net of eligible short positions, where the bank does not own more than 10% of the issued share capital
— — — A7

137ANNUAL REPORT 2018 The Norinchukin Bank
CAPITAL ADEQUACY
(Millions of Yen, %)
Basel III Template No. Items As of March 31,
2018
Amounts excluded under
transitional arrangements
As of March 31, 2017
Amounts excluded under
transitional arrangements
Ref. No.
19+20+21Amount exceeding the 10% threshold on speci-fied items
— — — —
19of which: significant investments in the com-mon stock of financials
— — — — A8
20 of which: mortgage servicing rights — — — — A9
21of which: deferred tax assets arising from tem-porary differences (net of related tax liability)
— — — — A10
22Amount exceeding the 15% threshold on speci-fied items
— — — —
23of which: significant investments in the com-mon stock of financials
— — — — A11
24 of which: mortgage servicing rights — — — — A12
25of which: deferred tax assets arising from tem-porary differences (net of related tax liability)
— — — — A13
27Regulatory adjustments applied to Common Equity Tier 1 due to insufficient Additional Tier 1 and Tier 2 to cover deductions
— —
28Common Equity Tier 1 capital: regulatory adjust-ments (B)
185,274 86,555
Common Equity Tier 1 capital (CET1)
29Common Equity Tier 1 capital (CET1)((A)-(B)) (C)
6,430,858 6,478,344
Additional Tier 1 capital: instruments
30
31a
Directly issued qualifying Additional Tier 1 instruments plus related capital surplus of which: classified as equity under applicable accounting standards and the breakdown
49,973 49,000 E5.1+E5.2
31bSubscription rights to Additional Tier 1 instruments
— —
32
Directly issued qualifying Additional Tier 1 instruments plus related capital surplus of which: classified as liabilities under applicable account-ing standards
— — D1
Qualifying Additional Tier 1 instruments plus related capital surplus issued by special purpose vehicles and other equivalent entities
— —
34-35Additional Tier 1 instruments issued by subsidiar-ies and held by third parties (amount allowed in group Additional Tier 1)
3,543 3,254 E8.2
33+35Eligible Tier 1 capital instruments under phase-out arrangements included in Additional Tier 1 capital: instruments
— 424
33of which: instruments issued by banks and their special purpose vehicles
— 424
35of which: instruments issued by subsidiaries (excluding banks’ special purpose vehicles)
— —
Total of items included in Additional Tier 1 capital: instruments under phase-out arrangements
(10)
of which: amounts of counted in to base instru-ments of Additional Tier 1 under phase-out arrangements that related other comprehensive income
(10)
36 Additional Tier 1 capital: instruments (D) 53,517 52,668

138 ANNUAL REPORT 2018 The Norinchukin Bank
CAPITAL ADEQUACY
(Millions of Yen, %)
Basel III Template No. Items As of March 31,
2018
Amounts excluded under
transitional arrangements
As of March 31, 2017
Amounts excluded under
transitional arrangements
Ref. No.
Additional Tier 1 capital: regulatory adjustments
37 Investments in own Additional Tier 1 instruments — — — — A14
38Reciprocal cross-holdings in Additional Tier 1 instruments
— — — — A15
39
Investments in the capital of banking, financial and insurance entities that are outside the scope of regulatory consolidation, net of eligible short positions, where the bank does not own more than 10% of the issued common share capital of the entity (amount above the 10% threshold)
— — — — A16
40
Significant investments in the capital of banking, financial and insurance entities that are outside the scope of regulatory consolidation (net of eligible short positions)
51,754 40,027 10,006 A17
Total of items included in Additional Tier 1 capital: regulatory adjustments under phase-out arrangements
1,871
of which: 50% of balance due to pay of eligible provisions
1,871
42Regulatory adjustments applied to Additional Tier 1 due to insufficient Tier 2 to cover deductions
— —
43 Additional Tier 1 capital: regulatory adjustments (E) 51,754 41,898
Additional Tier 1 capital (AT1)
44 Additional Tier 1 capital (AT1) ((D)-(E)) (F) 1,763 10,769
Tier 1 capital (T1=CET1+AT1)
45 Tier 1 capital (T1=CET1+AT1) ((C)+(F)) (G) 6,432,621 6,489,114
Tier 2 capital: instruments and provisions
46
Directly issued qualifying Tier 2 instruments plus related capital surplus of which: classified as equity under applicable accounting standards and its breakdown
— — E6
Subscription rights to Tier 2 instruments — —
Directly issued qualifying Tier 2 instruments plus related capital surplus of which: classified as liabilities under applicable accounting standards
1,415,480 1,415,480 D2
Tier 2 instruments plus related capital surplus issued by special purpose vehicles and other equivalent entities
— —
48-49Tier 2 instruments issued by subsidiaries and held by third parties (amount allowed in group Tier 2)
121 96 E8.3
47+49Eligible Tier 2 capital instruments under phase-out arrangements included in Tier 2: instruments and provisions
97,816 97,816
47of which: instruments issued by banks and their special purpose vehicles
97,816 97,816
49of which: instruments issued by subsidiaries (excluding banks’ special purpose vehicles)
— —
50Total of general reserve for possible loan losses and eligible provisions included in Tier 2
72 12
50a of which: general reserve for possible loan losses 72 12 A18
50b of which: eligible provisions — — A19
Total of items included in Tier 2 capital: instruments and provisions under phase-out arrangements
192,795
of which: amounts of counted in to base instru-ments of Additional Tier 1 under phase-out arrangements that related other comprehensive income
192,795
51 Tier 2 capital: instruments and provisions (H) 1,513,489 1,706,199

139ANNUAL REPORT 2018 The Norinchukin Bank
CAPITAL ADEQUACY
(Millions of Yen, %)
Basel III Template No. Items As of March 31,
2018
Amounts excluded under
transitional arrangements
As of March 31, 2017
Amounts excluded under
transitional arrangements
Ref. No.
Tier 2 capital: regulatory adjustments
52 Investments in own Tier 2 instruments — — — — A20
53 Reciprocal cross-holdings in Tier 2 instruments — — — — A21
54
Investments in the capital of banking, financial and insurance entities that are outside the scope of regulatory consolidation, net of eligible short positions, where the bank does not own more than 10% of the issued common share capital of the entity (amount above the 10% threshold)
— — — — A22
55
Significant investments in the capital banking, financial and insurance entities that are outside the scope of regulatory consolidation (net of eligible short positions)
— — — — A23
Total of items included in Tier 2 capital: regulatory adjustments under phase-out arrangements
14,592
of which: intangibles assets other than mortgage servicing rights
2,771
of which: 50% of balance due to pay of eligible provisions
1,871
of which: significant investments in the additional Tier 1 capital of other financial institutions
9,948
57 Tier 2 capital: regulatory adjustments (I) — 14,592
Tier 2 capital (T2)
58 Tier 2 capital (T2) ((H)-(I)) (J) 1,513,489 1,691,607
Total capital (TC=T1+T2)
59 Total capital (TC=T1+T2) ((G) + (J)) (K) 7,946,110 8,180,721
Risk weighted assets
Total of items included in risk weighted assets under phase-out arrangements
11,533
of which: intangibles assets other than mortgage servicing rights
4,650
of which: net defined-benefit asset 6,588
of which: significant investments in the Additional Tier 1 capital of Other Financial Institutions (net of eligible short positions)
294
60 Risk weighted assets (L) 33,810,329 33,539,401
Capital ratio (consolidated)
61Common Equity Tier 1 capital ratio (consoli-dated) ((C)/(L))
19.02% 19.31%
62 Tier 1 capital ratio (consolidated) ((G)/(L)) 19.02% 19.34%
63 Total capital ratio (consolidated) ((K)/(L)) 23.50% 24.39%
Regulatory adjustments
72Non-significant investments in the capital of Other Financial Institutions that are below the thresholds for deduction (before risk weighting)
315,503 348,985 A24.1+A24.2
73Significant investments in the common stock of Other Financial Institutions that are below the thresholds for deduction (before risk weighting)
24,445 46,493 A25
74Mortgage servicing rights that are below the thresholds for deduction (before risk weighting)
— — A26
75Deferred tax assets arising from temporary differ-ences that are below the thresholds for deduction (before risk weighting)
— — A27

140 ANNUAL REPORT 2018 The Norinchukin Bank
CAPITAL ADEQUACY
(Millions of Yen, %)
Basel III Template No. Items As of March 31,
2018
Amounts excluded under
transitional arrangements
As of March 31, 2017
Amounts excluded under
transitional arrangements
Ref. No.
Provisions included in Tier 2 capital: instruments and provisions
76Provisions (general reserve for possible loan losses)
72 12
77Cap on inclusion of provisions (general reserve for possible loan losses)
892 143
78
Provisions eligible for inclusion in Tier 2 in respect of exposures subject to internal ratings-based approach (prior to application of cap) (if the amount is negative, report as “nil”)
— —
79Cap for inclusion of provisions in Tier 2 under internal ratings-based approach
189,429 183,999
Capital instruments under phase-out arrangements
82Current cap on Additional Tier 1 instruments under phase-out arrangements
— 424
83
Amount excluded from Additional Tier 1 due to cap (excess over cap after redemptions and maturities) (if the amount is negative, report as “nil”)
— 424
84Current cap on Tier 2 instruments under phase-out arrangements
614,402 768,003
85Amount excluded from Tier 2 due to cap (excess over cap after redemptions and maturities) (if the amount is negative, report as “nil”)
— —

141ANNUAL REPORT 2018 The Norinchukin Bank
CAPITAL ADEQUACY
OV1: Overview of RWA (Consolidated)(Millions of Yen)
Basel IIITemplate
No.
a b c dRWA Minimum capital requirements
March 31, 2018 March 31, 2017 March 31, 2018 March 31, 2017
1 Credit risk (excluding counterparty credit risk) 5,115,398 4,904,497 432,755 415,104
2 Of which: standardized approach (SA) 71,423 11,445 5,713 915
3 Of which: internal rating-based (IRB) approach 4,900,735 4,738,491 415,582 401,824
Of which: significant investments — — — —
Of which: estimated residual value of lease transactions — — — —
Others 143,239 154,560 11,459 12,364
4 Counterparty credit risk (CCR) 478,053 427,523 39,309 34,981
5Of which: standardized approach for counterparty credit risk (SA-CCR)
— — — —
Of which: current exposure method (CEM) 42,302 37,480 3,587 3,178
6 Of which: expected positive exposure (EPE) method — — — —
Of which: credit valuation adjustment (CVA) 64,705 57,766 5,176 4,621
Of which: Central counterparty related exposure (CCP) 191,435 207,338 15,314 16,587
Others 179,609 124,938 15,230 10,594
7 Equity positions in banking book under market-based approach 1,587,104 1,404,425 134,586 119,095
Equity investments in funds (SA) — — — —
Equity investments in funds (IRB) 22,365,018 21,861,347 1,896,529 1,853,819
11 Settlement risk 0 — 0 —
12 Securitization exposures in banking book 518,665 496,098 43,982 42,069
13Of which: IRB ratings-based approach (RBA) or IRB internal assessment approach (IAA)
518,665 494,333 43,982 41,919
14 Of which: IRB Supervisory Formula Approach (SFA) — 1,764 — 149
15 Of which: Standardized approach (SA) — — — —
Of which: 1,250% risk weight is applied 0 0 0 0
16 Market risk 1,197,002 1,702,320 95,760 136,185
17 Of which: standardized approach (SA) 1,171,398 1,692,705 93,711 135,416
18 Of which: internal model approaches (IMA) 25,604 9,614 2,048 769
19 Operational risk 709,217 889,187 56,737 71,135
20 Of which: Basic Indicator Approach — — — —
21 Of which: Standardized Approach 709,217 889,187 56,737 71,135
22 Of which: Advanced Measurement Approach — — — —
23 Amounts below the thresholds for deduction 60,904 116,022 5,164 9,838
Risk weighted assets subject to transitional arrangements 11,533 922
24 Floor adjustment — — — —
25 Total 32,031,365 31,812,957 2,704,826 2,683,152

142 ANNUAL REPORT 2018 The Norinchukin Bank
CAPITAL ADEQUACY
(Millions of Yen)
ItemsConsolidated balance sheet
amount
Balance sheetamount based on regulatory
scope of consolidation
Ref. No.
(Assets)
Loans and Bills Discounted 11,858,949of which: non-significant investments in the capital instruments of other financial institutions 103,000
Tier 2 capital instruments —Significant investments in the common stock of Other Financial Institutions that are below the thresholds for deduction (before risk weighting)
103,000 A24.1
Foreign Exchanges Assets 324,698Securities 52,321,859 52,321,859Money Held in Trust 7,439,710 7,439,710
Securities and Money Held in Trust of which: goodwill and those equivalents (excluding those reported in the Intangible Fixed Assets)
4,638 A1.1
Securities and Money Held in Trust of which: investments in own capital instruments —Common Equity (excluding those reported in the Net Assets section) — A5
Additional Tier 1 capital — A14
Tier 2 capital — A20
Securities and Money Held in Trust of which: reciprocal cross-holdings in capital instruments
—
Common Equity — A6
Additional Tier 1 capital — A15
Tier 2 capital — A21
Securities and Money Held in Trust of which: investments in the capital of banking, financial and insurance entities that are outside the scope of regulatory consolidation, where the bank does not own more than 10% of the issued share capital
212,503
Common Equity — A7
Additional Tier 1 capital — A16
Tier 2 capital — A22
Non-significant investments in the capital of other financials that are below the thresholds for deduction (before risk weighting)
212,503 A24.2
Securities and Money Held in Trust of which: significant investments in the capital of banking, financial and insurance entities that are outside the scope of regulatory consolidation (net of eligible short positions)
76,199
Amount exceeding the 10% threshold on specified items — A8
Amount exceeding the 15% threshold on specified items — A11
Additional Tier 1 capital 51,754 A17
Tier 2 capital — A23
Significant investments in the common stock of financials that are below the thresholds for deduction (before risk weighting)
24,445 A25
Trading Assets 8,582Monetary Claims Bought 354,872Call Loans and Bills Bought 630,000Receivables under Securities Borrowing Transactions —Cash and Due from Banks 28,756,371Other Assets 1,585,342
Explanation on Reconciliation between Balance Sheet Items and
Regulatory Capital Elements (Consolidated)
As of March 31, 2018

143ANNUAL REPORT 2018 The Norinchukin Bank
CAPITAL ADEQUACY
(Millions of Yen)
ItemsConsolidated balance sheet
amount
Balance sheetamount based on regulatory
scope of consolidation
Ref. No.
Tangible Fixed Assets 122,356Buildings 47,443Land 47,545Lease Assets 23,347Construction in Progress 5Other 4,014
Intangible Fixed Assets 43,480 43,480Software 24,550 24,550Lease Assets 6,275 6,275Other 12,654 12,654
of which: goodwill and those equivalents (excluding those reported in the Net Assets section)
— A1.2
of which: other intangible assets other than goodwill and mortgage servicing rights 43,480 A2.1
of which: amount that corresponds to effective tax rate to other intangible assets other than goodwill and mortgage servicing rights
11,112 A2.2
of which: mortgage servicing rights (net of related deferred tax liabilities) —Amount exceeding the 10% threshold on specified items — A9
Amount exceeding the 15% threshold on specified items — A12
Amount below the thresholds for deduction (before risk weighting) — A26
Amounts of assets related to retirement benefits 52,510 52,510 A4
Deferred Tax Assets 2,026 2,026of which: deferred tax assets that rely on future profitability excluding those arising from temporary differences (net of related deferred tax liabilities)
— A3
of which: deferred tax assets arising from temporary differences —Amount exceeding the 10% threshold on specified items — A10
Amount exceeding the 15% threshold on specified items — A13
Amount below the thresholds for deduction (before risk weighting) — A27
Customers’ Liabilities for Acceptances and Guarantees 1,474,730Reserve for Possible Loan Losses (47,716) (47,716)
of which: general reserve for possible loan losses includes Tier 2 (72) A18
of which: eligible provisions includes Tier 2 — A19
Reserve for Possible Investment Losses (4)Total Assets 104,927,769(Liabilities)
Deposits 65,799,561Negotiable Certificates of Deposit 2,920,656Debentures 1,766,498Trading liabilities 5,034Borrowed Money 4,641,504 4,641,504
of which: qualifying Additional Tier 1 instruments — D1
of which: qualifying Tier 2 instruments 1,415,480 D2
Call Money and Bills Sold —Payables under Repurchase Agreements 15,080,638Payables under Securities Lending Transactions —Foreign Exchanges Liabilities 38Trust Money 1,405,187Other Liabilities 4,569,727

144 ANNUAL REPORT 2018 The Norinchukin Bank
CAPITAL ADEQUACY
(Millions of Yen)
ItemsConsolidated balance sheet
amount
Balance sheetamount based on regulatory
scope of consolidation
Ref. No.
Reserve for Bonus Payments 7,591Reserve for Employees’ Retirement Benefits 35,481Reserve for Directors’ Retirement Benefits 1,508Reserve for Agriculture, Fishery and Forestry Industry Subsidies —Deferred Tax Liabilities 464,915 464,915
of which: assets related to retirement benefits 14,571 D3
Deferred Tax Liabilities for Land Revaluation 8,607Acceptances and Guarantees 1,474,730Total Liabilities 98,181,681(Net Assets)
Paid-in Capital 3,480,488 3,480,488 E1.1
of which: preferred stock 24,999 E1.2
of which: directly issued qualifying Additional Tier 1 instruments plus related capital surplus of which classified as equity under applicable accounting standards
24,999 E5.1
Capital Surplus 24,993 24,993of which: other capital surplus 20 E1.3
of which: directly issued qualifying Additional Tier 1 instruments plus related capital surplus of which classified as equity under applicable accounting standards
24,973 E5.2
Retained Earnings 1,988,359 1,988,359 E2
Treasury Preferred Stock — —Total Owners’ Equity 5,493,842 5,493,842
of which: others — E3
of which: directly issued qualifying Tier 2 instruments plus related capital surplus of which classified as equity under applicable accounting standards
— E6
Net Unrealized Gains on Other Securities 1,152,861 1,152,861Net Deferred Losses on Hedging Instruments 59,823 59,823
of which: net deferred losses on hedge 89,100 E7
Revaluation Reserve for Land 14,312 14,312Foreign Currency Translation Adjustment (110) (110)Remeasurements of Defined Benefit Plans 15,876 15,876Total Accumulated Other Comprehensive Income 1,242,763 1,242,763 E4
Minority Interests 9,482 9,482of which: common equity issued by subsidiaries and held by third parties (amount allowed in group CET1) — E8.1
of which: Additional Tier 1 instruments issued by subsidiaries and held by third parties (amount allowed in group AT1) 3,543 E8.2
of which: Tier 2 instruments issued by subsidiaries and held by third parties (amount allowed in group Tier 2)
121 E8.3
Total Net Assets 6,746,088Total Liabilities and Net Assets 104,927,769
Note: “Balance sheet amount based on regulatory scope of consolidation” refers only to the items used in calculating capital adequacy.

145ANNUAL REPORT 2018 The Norinchukin Bank
CAPITAL ADEQUACY
LI1: Differences between accounting and regulatory scopes of consolidation and
mapping of financial statement categories with regulatory risk categories
Fiscal 2017 (Ended March 31, 2018) (Millions of Yen)
a b c d e f g
Carrying values as reported in
published finan-cial statements
Carrying values under scope of regulatory con-
solidation
Carrying values of items:
Subject to credit risk framework
Subject to coun-terparty credit risk framework
Subject to the securitization
framework
Subject to the market risk framework
Not subject to capi-tal requirements or subject to deduction
from capital
Assets
Loans and Bills Discounted 11,858,949 11,858,949 11,844,939 — 14,009 1,379,541 —Foreign Exchange Assets 324,698 324,698 324,698 — — 240,551 —Securities 52,321,859 52,321,859 45,288,837 21,381,791 6,976,629 36,173,302 56,392Money Held in Trust 7,439,710 7,439,710 7,439,710 2,421,431 — 6,841,086 —Trading Assets 8,582 8,582 — 5,526 — 8,582 —Monetary Claims Bought 354,872 354,872 138,088 — 216,784 — —Call Loans and Bills Bought 630,000 630,000 630,000 — — — —Cash and Due from Banks 28,756,371 28,756,371 28,756,371 — — 76,818 —Other Assets 1,585,342 1,585,342 226,275 835,810 25,273 767,549 497,982Tangible Fixed Assets 122,356 122,356 122,356 — — — —Intangible Fixed Assets 43,480 43,480 — — — — 43,480Net Defined Benefit Asset 52,510 52,510 — — — — 52,510Deferred Tax Assets 2,026 2,026 — — — — 2,026Customers’ Liabilities for Acceptances and Guarantees
1,474,730 1,474,730 1,474,730 — — 10,640 —
Reserve for Possible Loan Losses (47,716) (47,716) (47,716) — — — —Reserve for Possible Investment Losses
(4) (4) (4) — — — —
Total assets 104,927,769 104,927,769 96,198,285 24,644,560 7,232,697 45,498,073 652,392Liabilities
Deposits 65,799,561 65,799,561 — 4,424,474 — 5,070,005 60,729,555Negotiable Certificates of Deposit 2,920,656 2,920,656 — — — — 2,920,656Debentures 1,766,498 1,766,498 — — — — 1,766,498Trading Liabilities 5,034 5,034 — 5,034 — 5,034 —Borrowed Money 4,641,504 4,641,504 — — — 272,647 4,368,856Payables under Repurchase Agreements
15,080,638 15,080,638 — 15,080,638 — — —
Foreign Exchange Liabilities 38 38 — — — 30 8Short-term Entrusted Funds 1,405,187 1,405,187 — — — — 1,405,187Other Liabilities 4,569,727 4,569,727 — 634,456 — 3,891,211 150,280Reserve for Bonus Payments 7,591 7,591 — — — — 7,591Net Defined Benefit Liability 35,481 35,481 — — — — 35,481Reserve for Directors’ Retirement Benefits
1,508 1,508 — — — — 1,508
Deferred Tax Liabilities 464,915 464,915 — — — — 464,915Deferred Tax Liabilities for Land Revaluation
8,607 8,607 — — — — 8,607
Acceptances and Guarantees 1,474,730 1,474,730 — — — 10,640 1,474,730Total liabilities 98,181,681 98,181,681 — 20,144,604 — 9,249,570 73,333,877
Notes: 1. Repo-type transactions are classified into two categories of credit risk of securities and counterparty credit risk.2. Foreign currency assets are classified into two categories of market risk at the amount corresponding to the foreign exchange risk and credit risk of the
assets that are subject to transactions.

146 ANNUAL REPORT 2018 The Norinchukin Bank
CAPITAL ADEQUACY
Fiscal 2017 (Ended March 31, 2018)
Geographic Distribution of Exposure, Details in Significant Areas
by Major Types of Credit Exposure (Billions of Yen)
ItemsLoans, commit-
ments, off-balance sheet exposure
Securities Others Total credit risk exposure
Default exposure
Reserve for default exposure
Write-off of default exposure
Japan 11,397 13,260 28,712 53,370 40 15 3Asia except Japan 321 145 2 470 — — —Europe 340 8,672 203 9,216 — — —The Americas 931 10,066 999 11,997 1 1 —Other areas 404 162 242 809 0 — 0Amounts held by consolidated subsidiaries 1,548 31 61 1,641 4 0 0Offsets on consolidation (160) (63) (28) (252) — — —Total 14,783 32,275 30,193 77,252 46 17 3
Credit Risk (Consolidated)
(Investment Fund, securitization exposures, repo-type transactions and derivatives transactions are excluded.)
1. Credit Risk Exposure
LI2: Main sources of differences between regulatory exposure amounts and carrying
values in financial statements
Fiscal 2017 (Ended March 31, 2018) (Millions of Yen)
No.
a b c d e
Total
Items subject to:
Credit risk framework
Securitization framework
Counterparty credit risk framework
Market risk framework
1Asset carrying value amount under scope of regula-tory consolidation (as per template LI1)
104,275,376 96,198,285 24,644,560 7,232,697 45,498,073
2Liabilities carrying value amount under regulatory scope of consolidation (as per template LI1)
24,847,803 — 20,144,604 — 9,249,570
3Total net amount under regulatory scope of consoli-dation
79,427,573 96,198,285 4,499,956 7,232,697 36,248,503
4 Off-balance sheet amounts (12,014,712) 1,380,924 — — (13,395,636)5 Differences in valuations — — — — —
6Differences due to different netting rules, other than those already included in row 2
— — — — —
7 Differences due to consideration of provisions 47,721 47,721 — — —8 Differences due to prudential filters — — — — —9 Others (202,956) 56,217 21,396,688 — (21,655,863)
of which: repo-type transactions differences 20,438,541 — 20,438,541 — —of which: derivative transactions differences 958,147 — 958,147 — —
10 Exposure amounts considered for regulatory purposes 132,009,494 97,683,148 25,896,645 7,232,697 1,197,002
Notes: 1. As differences related to repo-type transactions, mainly the differences arising from a method used to measure the effectiveness of CRM.2. In 9. “Others” market risk, the differences in the foreign currency positions are stated in the amount corresponding to foreign exchange risk.

147ANNUAL REPORT 2018 The Norinchukin Bank
CAPITAL ADEQUACY
Industry Distribution of Exposure, Details by Major Types of Credit Exposure (Billions of Yen)
ItemsLoans, commit-
ments, off-balance sheet exposure
Securities Others Total credit risk exposure
Default exposure
Reserve for default exposure
Write-off of default exposure
Manufacturing 2,819 509 140 3,469 16 3 2Agriculture 63 0 0 64 5 4 0Forestry 6 — 0 6 0 0 —Fishing 17 0 0 18 9 4 0Mining 17 — 0 17 — — —Construction 86 12 0 98 0 — —Utility 464 5 1 471 — — —Information/telecommunications 133 12 0 146 — — —Transportation 661 180 0 841 1 1 —Wholesaling, retailing 1,551 129 1 1,682 3 1 —Finance and insurance 3,208 4,346 29,664 37,219 0 0 —Real estate 701 45 3 750 0 0 —Services 1,591 70 3 1,664 3 1 —Municipalities 30 0 0 30 — — —Others 2,040 26,994 346 29,381 0 — 0Amounts held by consolidated subsidiaries 1,548 31 61 1,641 4 0 0Offsets on consolidation (160) (63) (28) (252) — — —Total 14,783 32,275 30,193 77,252 46 17 3
Notes: 1. “Others” within “Finance and insurance” includes due from the Bank of Japan in Cash and certain other items.2. “Securities” within “Others” includes bonds issued by central government.
Residual Contractual Maturity Breakdown of Credit Risk Exposure (Billions of Yen)
Items Loans, commitments, off-balance sheet exposure Securities Others Total credit
risk exposure
In 1 year 5,807 3,071 29,794 38,673Over 1 year to 3 years 2,375 11,701 51 14,128Over 3 years to 5 years 2,860 4,460 9 7,330Over 5 years to 7 years 1,006 2,557 17 3,581Over 7 years 1,334 9,653 46 11,034No term to maturity 11 863 240 1,114Amounts held by consolidated subsidiaries 1,548 31 61 1,641Offsets on consolidation (160) (63) (28) (252)Total 14,783 32,275 30,193 77,252
Notes: 1. The amount of credit exposure at the end of the period does not substantially differ from the average-risk position during fiscal 2017.2. The amounts of credit-risk exposure held by consolidated subsidiaries are extremely limited, amounting only to about 2% of consolidated risk exposure, so
only the total amounts held by these subsidiaries are shown.3. Default exposure is classified in the Bank’s self-assessment as being under “Debtor Under Requirement of Control.”

148 ANNUAL REPORT 2018 The Norinchukin Bank
CAPITAL ADEQUACY
Delinquent Maturity Exposure (Billions of Yen)
Items As of March 31, 2018
Less than One Month 0From One Month to less than Two Months 0From Two Months to less than Three Months 0Three Months or More 0Amounts held by consolidated subsidiaries 1Total 1
Note: “One Month or less” excludes loans that are not delinquent.
Special Attention (Billions of Yen)
Items As of March 31, 2018
Amounts of the reserves that were increased to address the exposure 14Amounts of other than the above —Amounts held by consolidated subsidiaries 1Total 15
Ratio of the EAD for each asset class to the total amount of EAD
Fiscal 2017 (Ended March 31, 2018) (Millions of Yen, %)
Items EAD Percentage of total amount of EAD
Subject to Standardized Approach 115,403 0.15%Subject to Internal Ratings-Based Approach (IRB) 76,191,129 99.59%
Corporate exposure (excluding Specialized Lending Products) 7,895,751 10.32%Corporate exposure (Specialized Lending) 817,055 1.07%Bank exposure 4,988,616 6.52%Sovereign exposure 59,731,756 78.07%Equity portfolios subject to PD/LGD approaches 818,712 1.07%Retail exposure 1,511,613 1.98%Other debt purchased 427,623 0.56%Important investments — —Lease transactions — —
Other assets 199,112 0.26%Total 76,505,645 100.00%
CR1: Credit quality of assets
Fiscal 2017 (Ended March 31, 2018) (Millions of Yen)
No.
a b c dGross carrying values of
Allowances/impairments
Net values (a+b-c)Defaulted
exposuresNon-defaulted
exposures
On-balance sheet assets
1 Loans 39,987 11,656,941 44,203 11,652,726 2 Debt Securities — 31,462,991 — 31,462,991 3 Off-balance sheet exposures 16 30,008,705 40 30,008,681 4 Total on-balance sheet assets (1+2+3) 40,004 73,128,639 44,244 73,124,399
Off-balance sheet assets
5 Acceptances and Guarantees 1,409 1,473,208 1,427 1,473,190 6 Commitments — 1,008,888 205 1,008,683 7 Total off-balance sheet assets (5+6) 1,409 2,482,097 1,632 2,481,873
Total
8 Total (4+7) 41,414 75,610,736 45,877 75,606,273
Note: Default exposure is classified in the Bank’s self-assessment as being under “Debtor Under Requirement of Control.”

149ANNUAL REPORT 2018 The Norinchukin Bank
CAPITAL ADEQUACY
CR2: Changes in stock of defaulted loans and debt securities
Fiscal 2017 (Ended March 31, 2018) (Millions of Yen)
No. a
1 Defaulted loans and debt securities at end of the previous reporting period 57,0642
Changes in the amounts of per factor during fiscal 2017
Default 24,2363 Returned to non-defaulted status 6,0594 Amounts written off 3,069
5Other changes (Decrease in the balance due to a recovery of exposure at default)
(32,167)
6 Defaulted loans and debt securities at end of the reporting period (1+2-3-4+5) 40,004
CR3: Credit risk mitigation techniques – overview
Fiscal 2017 (Ended March 31, 2018) (Millions of Yen)
No.
a b c d e
Exposures unsecured
Exposures totally secured
Exposures secured by collateral, of which:
secured amount
Exposures secured by financial
guarantees, of which: secured
amount
Exposures secured by cred-it derivatives, of which: secured
amount
1 Loans 11,318,701 334,024 335,814 341,371 —2 Debt securities 30,930,862 532,129 — 562,129 —3 Other on-balance sheet assets 30,007,377 1,304 474 1,588 —4 Total 72,256,941 867,458 336,288 905,088 —5 Of which defaulted 36,495 3,508 7,480 — —

150 ANNUAL REPORT 2018 The Norinchukin Bank
CAPITAL ADEQUACY
CR4: Standardized approach – credit risk exposure and Credit Risk Mitigation
(CRM) effects
Fiscal 2017 (Ended March 31, 2018) (Millions of Yen, %)
No.
a b c d e f
Exposures before CCF and CRM
Exposures post-CCF and CRM
RWA RWA densityAsset classes On-balance
sheet amountOff-balance
sheet amountOn-balance
sheet amountOff-balance
sheet amount
1 Cash — — — — — —
2 Japanese government and the Bank of Japan — — — — — —
3 Foreign central government and their central banks — — — — — —
4 Bank for International Settlements — — — — — —
5 Japanese regional municipal bodies — — — — — —
6 Non-central government public sector entities — — — — — —
7 Multilateral Development Bank — — — — — —
8 Japan Finance Organization for Municipalities — — — — — —
9 Japanese government institutions — — — — — —
10 Regional third-sector company — — — — — —
11 Banks and securities firms — — — — — —
12 Corporates — — — — — —
13 SMEs and individuals — — — — — —
14 Residential Mortgage — — — — — —
15Exposures to corporates, SMEs and individuals (acquisition of real estate)
— — — — — —
16Loans with principal or interest payments three months or more in arrears (excluding residential mortgage)
— — — — — —
17Extension of three months or more in mortgage loan terms
— — — — — —
18 Bills in process of collection — — — — — —
19 Guarantee by Credit Guarantee Corporations — — — — — —
20Guarantee by Regional Economy Vitalization Corporation of Japan (REVIC)
— — — — — —
21 Investment (excluding important investment) — — — — — —
22 Total — — — — — —
Notes: 1. Assets subject to the Standardized Approach are a) the on-balance and off-balance sheet assets of the Bank’s consolidated subsidiaries, with the exception of Kyodo Housing Loan Co., Ltd., and b) the suspense payments and prepaid expenses on the consolidated balance sheet of the Bank and Kyodo Housing Loan Co., Ltd.
2. The total of the credit risk assets subject to the Standardized Approach (above a+b) is ¥71.4 billion, which is not shown in these statements due to its extremely limited amount—only about 0.22% of the credit risk assets on a consolidated basis (¥31,904.1 billion).

151ANNUAL REPORT 2018 The Norinchukin Bank
CAPITAL ADEQUACY
CR5: Standardized approach – exposures by asset classes and risk weights
Fiscal 2017 (Ended March 31, 2018) (Millions of Yen)
No.
a b c d e f g h i j kTotal credit exposures amount (post CCF and post-CRM)
Risk weightAsset classes 0% 10% 20% 35% 50% 75% 100% 150% 250% 1,250% Total
1 Cash — — — — — — — — — — —
2Japanese government and the Bank of Japan
— — — — — — — — — — —
3Foreign central government and their central banks
— — — — — — — — — — —
4 Bank for International Settlements — — — — — — — — — — —5 Japanese regional municipal bodies — — — — — — — — — — —
6Non-central government public sector entities
— — — — — — — — — — —
7 Multilateral Development Bank — — — — — — — — — — —
8Japan Finance Organization for Municipalities
— — — — — — — — — — —
9 Japanese government institutions — — — — — — — — — — —10 Regional third-sector company — — — — — — — — — — —11 Banks and securities firms — — — — — — — — — — —12 Corporates — — — — — — — — — — —13 SMEs and individuals — — — — — — — — — — —14 Residential Mortgage — — — — — — — — — — —
15Exposures to corporates, SMEs and individuals (acquisition of real estate)
— — — — — — — — — — —
16Loans with principal or interest pay-ments three months or more in arrears (excluding residential mortgage)
— — — — — — — — — — —
17Extension of three months or more in mortgage loan terms
— — — — — — — — — — —
18 Bills in process of collection — — — — — — — — — — —
19Guarantee by Credit Guarantee Corporations
— — — — — — — — — — —
20Guarantee by Regional Economy Vitalization Corporation of Japan (REVIC)
— — — — — — — — — — —
21Investment (excluding important invest-ment)
— — — — — — — — — — —
22 Total — — — — — — — — — — —
Notes: 1. Assets subject to the Standardized Approach are a) the on-balance sheet assets and off-balance sheet items of the Bank’s consolidated subsidiaries, with the exception of Kyodo Housing Loan Co., Ltd., and b) the suspense payments and prepaid expenses on the consolidated balance sheet of the Bank and Kyodo Housing Loan Co., Ltd.
2. The total of the credit risk assets subject to the Standardized Approach (above a+b) is ¥71.4 billion, which is not shown in these statements due to its extremely limited amount—only about 0.22% of the credit risk assets on a consolidated basis (¥31,904.1 billion).

152 ANNUAL REPORT 2018 The Norinchukin Bank
CAPITAL ADEQUACY
CR6: IRB – Credit risk exposures by portfolio and PD range
■ Foundation Internal Ratings-Based Approach (F-IRB)
Fiscal 2017 (Ended March 31, 2018) (Millions of Yen, %, Thousands, Year)
a b c d e f g h i j k l
No. PD scale
Original on-balance sheet gross exposure
Off-balance
sheet exposures pre CCF
Average CCF
EAD post CRM and post-CCF
Average PD
Number of obligors
Average LGD
Average maturity RWA RWA
density EL Provisions
Sovereign exposure
1 0.00 to 0.15 or less 59,590,829 15,000 — 60,116,894 0.00 0.0 45.00 2.2 233 0.00 0 2 Exceeding 0.15 to 0.25 or less — — — — — — — — — — —3 Exceeding 0.25 to 0.50 or less 27,927 — — 79 0.28 0.0 45.00 4.6 59 74.37 0 4 Exceeding 0.50 to 0.75 or less — — — — — — — — — — —5 Exceeding 0.75 to 2.50 or less — — — — — — — — — — —6 Exceeding 2.50 to 10.00 or less 113,000 — — 116 3.21 0.0 45.00 5.0 187 161.71 1 7 Exceeding 10.00 to 100.00 or less — — — — — — — — — — —8 100.00 (default) — — — — — — — — — — —9 Subtotal 59,731,756 15,000 — 60,117,090 0.00 0.0 45.00 2.2 481 0.00 1 —
Bank exposure
1 0.00 to 0.15 or less 4,779,827 — — 4,779,827 0.03 0.1 45.63 1.8 773,150 16.17 854 2 Exceeding 0.15 to 0.25 or less — — — — — — — — — — —3 Exceeding 0.25 to 0.50 or less 115,350 1,000 0.75 17,122 0.40 0.0 42.73 2.5 10,360 60.50 29 4 Exceeding 0.50 to 0.75 or less — — — — — — — — — — —5 Exceeding 0.75 to 2.50 or less 54,966 7,595 0.82 56,939 1.14 0.0 23.93 1.7 30,059 52.79 163 6 Exceeding 2.50 to 10.00 or less 30,777 704 1.00 30,394 4.30 0.0 25.20 2.0 25,493 83.87 359 7 Exceeding 10.00 to 100.00 or less — — — — — — — — — — —8 100.00 (default) — — — — — — — — — — —9 Subtotal 4,980,920 9,300 0.82 4,884,283 0.07 0.2 45.24 1.8 839,063 17.17 1,406 —
Corporate exposure (excluding SMEs exposure and specialized lending)
1 0.00 to 0.15 or less 477,317 — — 275,190 0.05 0.1 62.60 4.1 118,426 43.03 86 2 Exceeding 0.15 to 0.25 or less 15,081 2,000 0.75 16,581 0.15 0.0 65.80 3.7 13,490 81.36 16 3 Exceeding 0.25 to 0.50 or less 27 — — 27 0.42 0.0 45.00 2.4 17 63.95 0 4 Exceeding 0.50 to 0.75 or less 1 — — 1 0.63 0.0 45.00 5.0 1 107.26 0 5 Exceeding 0.75 to 2.50 or less 27,854 — — 3 1.44 0.0 45.00 5.0 4 134.59 0 6 Exceeding 2.50 to 10.00 or less 1,742 — — 1,742 4.80 0.0 45.00 4.4 2,988 171.51 37 7 Exceeding 10.00 to 100.00 or less 182 — — 182 15.84 0.0 45.00 4.6 454 248.48 13 8 100.00 (default) 1,648 — — 1,648 100.00 0.0 45.00 4.0 — 0.00 741 9 Subtotal 523,856 2,000 0.75 295,378 0.65 0.3 62.56 4.0 135,384 45.83 895 127
SMEs exposure
1 0.00 to 0.15 or less — — — — — — — — — — —2 Exceeding 0.15 to 0.25 or less — — — — — — — — — — —3 Exceeding 0.25 to 0.50 or less — — — — — — — — — — —4 Exceeding 0.50 to 0.75 or less — — — — — — — — — — —5 Exceeding 0.75 to 2.50 or less — — — — — — — — — — —6 Exceeding 2.50 to 10.00 or less — — — — — — — — — — —7 Exceeding 10.00 to 100.00 or less — — — — — — — — — — —8 100.00 (default) — — — — — — — — — — —9 Subtotal — — — — — — — — — — — —
Specialized lending exposure
1 0.00 to 0.15 or less — — — — — — — — — — —2 Exceeding 0.15 to 0.25 or less — — — — — — — — — — —3 Exceeding 0.25 to 0.50 or less — — — — — — — — — — —4 Exceeding 0.50 to 0.75 or less — — — — — — — — — — —5 Exceeding 0.75 to 2.50 or less — — — — — — — — — — —6 Exceeding 2.50 to 10.00 or less — — — — — — — — — — —7 Exceeding 10.00 to 100.00 or less — — — — — — — — — — —8 100.00 (default) — — — — — — — — — — —9 Subtotal — — — — — — — — — — — —

153ANNUAL REPORT 2018 The Norinchukin Bank
CAPITAL ADEQUACY
(Millions of Yen, %, Thousands, Year)
a b c d e f g h i j k l
No. PD scale
Original on-balance sheet gross exposure
Off-balance
sheet exposures pre CCF
Average CCF
EAD post CRM and post-CCF
Average PD
Number of obligors
Average LGD
Average maturity RWA RWA
density EL Provisions
Equity Exposure for Credit Risk Using Internal Ratings: PD/LGD Approach
1 0.00 to 0.15 or less 642,332 — — 642,332 0.04 0.1 90.00 5.0 643,608 100.19 280 2 Exceeding 0.15 to 0.25 or less 149,391 — — 149,391 0.15 0.1 90.00 5.0 179,233 119.97 202 3 Exceeding 0.25 to 0.50 or less 19,950 — — 19,950 0.41 0.0 90.00 5.0 37,525 188.08 74 4 Exceeding 0.50 to 0.75 or less — — — — — — — — — — —5 Exceeding 0.75 to 2.50 or less 5,725 — — 5,725 1.08 0.0 90.00 5.0 15,203 265.51 55 6 Exceeding 2.50 to 10.00 or less 428 — — 428 4.26 0.0 90.00 5.0 1,682 393.03 16 7 Exceeding 10.00 to 100.00 or less 851 — — 851 15.84 0.0 90.00 5.0 5,812 682.49 121 8 100.00 (default) 32 — — 32 100.00 0.0 90.00 5.0 362 1,125.00 29 9 Subtotal 818,712 — — 818,712 0.10 0.3 90.00 5.0 883,427 107.90 779 —
Debt purchased for corporate (Default risk)
1 0.00 to 0.15 or less 97,541 — — 97,502 0.00 0.0 45.00 1.0 691 0.70 1 2 Exceeding 0.15 to 0.25 or less 8,283 — — 8,283 0.15 0.0 45.00 1.0 2,052 24.77 5 3 Exceeding 0.25 to 0.50 or less — — — — — — — — — — —4 Exceeding 0.50 to 0.75 or less — — — — — — — — — — —5 Exceeding 0.75 to 2.50 or less — — — — — — — — — — —6 Exceeding 2.50 to 10.00 or less — — — — — — — — — — —7 Exceeding 10.00 to 100.00 or less — — — — — — — — — — —8 100.00 (default) — — — — — — — — — — —9 Subtotal 105,825 — — 105,786 0.01 0.0 45.00 1.0 2,743 2.59 6 —
Debt purchased for corporate (Dilution risk)
1 0.00 to 0.15 or less — — — 14,064 0.00 0.0 45.00 1.0 — 0.00 —2 Exceeding 0.15 to 0.25 or less — — — 1,852 0.15 0.0 45.00 1.0 458 24.77 1 3 Exceeding 0.25 to 0.50 or less — — — — — — — — — — —4 Exceeding 0.50 to 0.75 or less — — — — — — — — — — —5 Exceeding 0.75 to 2.50 or less — — — — — — — — — — —6 Exceeding 2.50 to 10.00 or less — — — — — — — — — — —7 Exceeding 10.00 to 100.00 or less — — — — — — — — — — —8 100.00 (default) — — — — — — — — — — —9 Subtotal — — — 15,917 0.01 0.0 45.00 1.0 458 2.88 1 —
Loan participation (corporate) (Default risk of seller)
1 0.00 to 0.15 or less — — — 40,339 0.01 0.0 45.00 3.0 2,525 6.26 2 2 Exceeding 0.15 to 0.25 or less — — — — — — — — — — —3 Exceeding 0.25 to 0.50 or less — — — — — — — — — — —4 Exceeding 0.50 to 0.75 or less — — — — — — — — — — —5 Exceeding 0.75 to 2.50 or less — — — — — — — — — — —6 Exceeding 2.50 to 10.00 or less — — — — — — — — — — —7 Exceeding 10.00 to 100.00 or less — — — — — — — — — — —8 100.00 (default) — — — — — — — — — — —9 Subtotal — — — 40,339 0.01 0.0 45.00 3.0 2,525 6.26 2 —
Debt purchased for retail
1 0.00 to 0.15 or less — — — — — — — — — — —2 Exceeding 0.15 to 0.25 or less — — — — — — — — — — —3 Exceeding 0.25 to 0.50 or less — — — — — — — — — — —4 Exceeding 0.50 to 0.75 or less — — — — — — — — — — —5 Exceeding 0.75 to 2.50 or less — — — — — — — — — — —6 Exceeding 2.50 to 10.00 or less — — — — — — — — — — —7 Exceeding 10.00 to 100.00 or less — — — — — — — — — — —8 100.00 (default) — — — — — — — — — — —9 Subtotal — — — — — — — — — — — —
Qualifying revolving retail exposure
1 0.00 to 0.15 or less — — — — — — — — — — —2 Exceeding 0.15 to 0.25 or less — — — — — — — — — — —3 Exceeding 0.25 to 0.50 or less — — — — — — — — — — —4 Exceeding 0.50 to 0.75 or less — — — — — — — — — — —5 Exceeding 0.75 to 2.50 or less — — — — — — — — — — —6 Exceeding 2.50 to 10.00 or less — — — — — — — — — — —7 Exceeding 10.00 to 100.00 or less — — — — — — — — — — —8 100.00 (default) — — — — — — — — — — —9 Subtotal — — — — — — — — — — — —

154 ANNUAL REPORT 2018 The Norinchukin Bank
CAPITAL ADEQUACY
(Millions of Yen, %, Thousands, Year)
a b c d e f g h i j k l
No. PD scale
Original on-balance sheet gross exposure
Off-balance
sheet exposures pre CCF
Average CCF
EAD post CRM and post-CCF
Average PD
Number of obligors
Average LGD
Average maturity RWA RWA
density EL Provisions
Retail exposure secured by residential properties
1 0.00 to 0.15 or less — — — — — — — — — — —2 Exceeding 0.15 to 0.25 or less — — — — — — — — — — —3 Exceeding 0.25 to 0.50 or less — 1,329,530 1.00 1,329,530 0.32 71.9 53.26 — 401,297 30.18 2,265 4 Exceeding 0.50 to 0.75 or less — — — — — — — — — — —5 Exceeding 0.75 to 2.50 or less 130,680 — — 130,680 0.78 10.5 68.35 — 94,734 72.49 696 6 Exceeding 2.50 to 10.00 or less — — — — — — — — — — —7 Exceeding 10.00 to 100.00 or less 1,264 2,863 1.00 4,127 21.56 0.3 57.88 — 13,612 329.77 520 8 100.00 (default) 1,571 543 1.00 2,115 100.00 0.3 92.61 — 2,907 137.44 1,959 9 Subtotal 133,516 1,332,938 1.00 1,466,454 0.56 83.1 54.67 — 512,552 34.95 5,442 1,894
Other retail exposure
1 0.00 to 0.15 or less — — — — — — — — — — —2 Exceeding 0.15 to 0.25 or less — — — — — — — — — — —3 Exceeding 0.25 to 0.50 or less 274 717 1.00 992 0.28 1.0 88.28 — 443 44.67 2 4 Exceeding 0.50 to 0.75 or less 38,870 — — 38,870 0.71 1.5 58.33 — 19,661 50.58 160 5 Exceeding 0.75 to 2.50 or less 644 2,906 1.00 3,551 2.21 2.6 95.53 — 4,480 126.14 76 6 Exceeding 2.50 to 10.00 or less — — — — — — — — — — —7 Exceeding 10.00 to 100.00 or less 173 3 1.00 177 23.15 0.0 58.83 — 244 138.07 23 8 100.00 (default) 1,562 4 1.00 1,567 100.00 0.1 98.63 — 3,228 206.02 1,545 9 Subtotal 41,526 3,632 1.00 45,158 4.35 5.3 63.31 — 28,058 62.13 1,809 618
Total 66,336,114 1,362,871 0.98 67,789,121 0.02 89.5 45.85 2.2 2,404,696 3.54 10,345 2,640
CR6: IRB – Credit risk exposures by portfolio and PD range
■ Advanced Internal Ratings-Based Approach (A-IRB)
Fiscal 2017 (Ended March 31, 2018) (Millions of Yen, %, Thousands, Year)
a b c d e f g h i j k l
No. PD scale
Original on-balance sheet gross exposure
Off-balance
sheet exposures pre CCF
Average CCF
EAD post CRM and post-CCF
Average PD
Number of obligors
Average LGD
Average maturity RWA RWA
density EL Provisions
Sovereign exposure
1 0.00 to 0.15 or less — — — 35,719 0.01 0.0 30.34 4.0 1,582 4.43 1 2 Exceeding 0.15 to 0.25 or less — — — — — — — — — — —3 Exceeding 0.25 to 0.50 or less — — — — — — — — — — —4 Exceeding 0.50 to 0.75 or less — — — — — — — — — — —5 Exceeding 0.75 to 2.50 or less — — — — — — — — — — —6 Exceeding 2.50 to 10.00 or less — — — — — — — — — — —7 Exceeding 10.00 to 100.00 or less — — — — — — — — — — —8 100.00 (default) — — — — — — — — — — —9 Subtotal — — — 35,719 0.01 0.0 30.34 4.0 1,582 4.43 1 —
Bank exposure
1 0.00 to 0.15 or less — — — — — — — — — — —2 Exceeding 0.15 to 0.25 or less — — — — — — — — — — —3 Exceeding 0.25 to 0.50 or less — — — — — — — — — — —4 Exceeding 0.50 to 0.75 or less — — — — — — — — — — —5 Exceeding 0.75 to 2.50 or less — — — — — — — — — — —6 Exceeding 2.50 to 10.00 or less — — — — — — — — — — —7 Exceeding 10.00 to 100.00 or less — — — — — — — — — — —8 100.00 (default) — — — — — — — — — — —9 Subtotal — — — — — — — — — — — —

155ANNUAL REPORT 2018 The Norinchukin Bank
CAPITAL ADEQUACY
(Millions of Yen, %, Thousands, Year)
a b c d e f g h i j k l
No. PD scale
Original on-balance sheet gross exposure
Off-balance
sheet exposures pre CCF
Average CCF
EAD post CRM and post-CCF
Average PD
Number of obligors
Average LGD
Average maturity RWA RWA
density EL Provisions
Corporate exposure (excluding SMEs exposure and specialized lending)
1 0.00 to 0.15 or less 3,688,885 1,118,849 0.48 4,413,834 0.05 0.3 29.79 2.9 724,512 16.41 691 2 Exceeding 0.15 to 0.25 or less 2,070,635 271,785 0.58 2,083,418 0.16 0.5 29.62 2.8 627,471 30.11 1,035 3 Exceeding 0.25 to 0.50 or less 272,339 65,693 0.57 312,862 0.42 0.2 29.84 2.6 139,833 44.69 392 4 Exceeding 0.50 to 0.75 or less 94,206 3,117 0.75 60,824 0.63 0.0 25.19 3.5 30,338 49.87 96 5 Exceeding 0.75 to 2.50 or less 284,639 24,274 0.41 279,506 1.21 0.5 27.71 2.5 170,534 61.01 939 6 Exceeding 2.50 to 10.00 or less 46,012 21,786 0.46 47,934 4.79 0.4 27.91 2.9 45,284 94.47 642 7 Exceeding 10.00 to 100.00 or less 92,608 23,068 0.74 102,126 15.82 0.3 24.66 1.8 122,096 119.55 3,986 8 100.00 (default) 38,762 3,060 0.28 34,170 100.00 0.1 26.78 1.7 — 0.00 9,151 9 Subtotal 6,588,091 1,531,635 0.51 7,334,676 0.86 2.6 29.53 2.8 1,860,072 25.35 16,935 13,717
SMEs exposure
1 0.00 to 0.15 or less — — — — — — — — — — —2 Exceeding 0.15 to 0.25 or less — — — — — — — — — — —3 Exceeding 0.25 to 0.50 or less — — — — — — — — — — —4 Exceeding 0.50 to 0.75 or less — — — — — — — — — — —5 Exceeding 0.75 to 2.50 or less — — — — — — — — — — —6 Exceeding 2.50 to 10.00 or less — — — — — — — — — — —7 Exceeding 10.00 to 100.00 or less — — — — — — — — — — —8 100.00 (default) — — — — — — — — — — —9 Subtotal — — — — — — — — — — — —
Specialized lending exposure
1 0.00 to 0.15 or less — — — — — — — — — — —2 Exceeding 0.15 to 0.25 or less — — — — — — — — — — —3 Exceeding 0.25 to 0.50 or less — — — — — — — — — — —4 Exceeding 0.50 to 0.75 or less — — — — — — — — — — —5 Exceeding 0.75 to 2.50 or less — — — — — — — — — — —6 Exceeding 2.50 to 10.00 or less — — — — — — — — — — —7 Exceeding 10.00 to 100.00 or less — — — — — — — — — — —8 100.00 (default) — — — — — — — — — — —9 Subtotal — — — — — — — — — — — —
Equity Exposure for Credit Risk Using Internal Ratings: PD/LGD Approach
1 0.00 to 0.15 or less — — — — — — — — — — —2 Exceeding 0.15 to 0.25 or less — — — — — — — — — — —3 Exceeding 0.25 to 0.50 or less — — — — — — — — — — —4 Exceeding 0.50 to 0.75 or less — — — — — — — — — — —5 Exceeding 0.75 to 2.50 or less — — — — — — — — — — —6 Exceeding 2.50 to 10.00 or less — — — — — — — — — — —7 Exceeding 10.00 to 100.00 or less — — — — — — — — — — —8 100.00 (default) — — — — — — — — — — —9 Subtotal — — — — — — — — — — — —
Debt purchased for corporate (Default risk)
1 0.00 to 0.15 or less 172,833 36,500 1.00 216,279 0.05 0.0 30.35 1.3 19,273 8.91 322 Exceeding 0.15 to 0.25 or less 30,687 16,793 0.90 38,992 0.18 0.0 30.35 2.2 11,153 28.60 22 3 Exceeding 0.25 to 0.50 or less — — — — — — — — — — —4 Exceeding 0.50 to 0.75 or less 4,787 1,595 0.74 7,047 0.63 0.0 30.35 1.2 2,963 42.04 13 5 Exceeding 0.75 to 2.50 or less 4,323 — — 3,259 0.83 0.0 30.35 1.0 1,481 45.44 8 6 Exceeding 2.50 to 10.00 or less — — — — — — — — — — —7 Exceeding 10.00 to 100.00 or less — — — — — — — — — — —8 100.00 (default) — — — — — — — — — — —9 Subtotal 212,632 54,888 0.96 265,579 0.09 0.0 30.35 1.4 34,872 13.13 76 —
Debt purchased for corporate (Dilution risk)
1 0.00 to 0.15 or less — — — — — — — — — — —2 Exceeding 0.15 to 0.25 or less — — — — — — — — — — —3 Exceeding 0.25 to 0.50 or less — — — — — — — — — — —4 Exceeding 0.50 to 0.75 or less — — — — — — — — — — —5 Exceeding 0.75 to 2.50 or less — — — — — — — — — — —6 Exceeding 2.50 to 10.00 or less — — — — — — — — — — —7 Exceeding 10.00 to 100.00 or less — — — — — — — — — — —8 100.00 (default) — — — — — — — — — — —
9 Subtotal — — — — — — — — — — — —

156 ANNUAL REPORT 2018 The Norinchukin Bank
CAPITAL ADEQUACY
(Millions of Yen, %, Thousands, Year)
a b c d e f g h i j k l
No. PD scale
Original on-balance sheet gross exposure
Off-balance
sheet exposures pre CCF
Average CCF
EAD post CRM and post-CCF
Average PD
Number of obligors
Average LGD
Average maturity RWA RWA
density EL Provisions
Loan participation (corporate) (Default risk of seller)
1 0.00 to 0.15 or less — — — — — — — — — — —2 Exceeding 0.15 to 0.25 or less — — — — — — — — — — —3 Exceeding 0.25 to 0.50 or less — — — — — — — — — — —4 Exceeding 0.50 to 0.75 or less — — — — — — — — — — —5 Exceeding 0.75 to 2.50 or less — — — — — — — — — — —6 Exceeding 2.50 to 10.00 or less — — — — — — — — — — —7 Exceeding 10.00 to 100.00 or less — — — — — — — — — — —8 100.00 (default) — — — — — — — — — — —9 Subtotal — — — — — — — — — — — —
Debt purchased for retail
1 0.00 to 0.15 or less — — — — — — — — — — —2 Exceeding 0.15 to 0.25 or less — — — — — — — — — — —3 Exceeding 0.25 to 0.50 or less — — — — — — — — — — —4 Exceeding 0.50 to 0.75 or less — — — — — — — — — — —5 Exceeding 0.75 to 2.50 or less — — — — — — — — — — —6 Exceeding 2.50 to 10.00 or less — — — — — — — — — — —7 Exceeding 10.00 to 100.00 or less — — — — — — — — — — —8 100.00 (default) — — — — — — — — — — —9 Subtotal — — — — — — — — — — — —
Qualifying revolving retail exposure
1 0.00 to 0.15 or less — — — — — — — — — — —2 Exceeding 0.15 to 0.25 or less — — — — — — — — — — —3 Exceeding 0.25 to 0.50 or less — — — — — — — — — — —4 Exceeding 0.50 to 0.75 or less — — — — — — — — — — —5 Exceeding 0.75 to 2.50 or less — — — — — — — — — — —6 Exceeding 2.50 to 10.00 or less — — — — — — — — — — —7 Exceeding 10.00 to 100.00 or less — — — — — — — — — — —8 100.00 (default) — — — — — — — — — — —9 Subtotal — — — — — — — — — — — —
Retail exposure secured by residential properties
1 0.00 to 0.15 or less — — — — — — — — — — —2 Exceeding 0.15 to 0.25 or less — — — — — — — — — — —3 Exceeding 0.25 to 0.50 or less — — — — — — — — — — —4 Exceeding 0.50 to 0.75 or less — — — — — — — — — — —5 Exceeding 0.75 to 2.50 or less — — — — — — — — — — —6 Exceeding 2.50 to 10.00 or less — — — — — — — — — — —7 Exceeding 10.00 to 100.00 or less — — — — — — — — — — —8 100.00 (default) — — — — — — — — — — —9 Subtotal — — — — — — — — — — — —
Other retail exposure
1 0.00 to 0.15 or less — — — — — — — — — — —2 Exceeding 0.15 to 0.25 or less — — — — — — — — — — —3 Exceeding 0.25 to 0.50 or less — — — — — — — — — — —4 Exceeding 0.50 to 0.75 or less — — — — — — — — — — —5 Exceeding 0.75 to 2.50 or less — — — — — — — — — — —6 Exceeding 2.50 to 10.00 or less — — — — — — — — — — —7 Exceeding 10.00 to 100.00 or less — — — — — — — — — — —8 100.00 (default) — — — — — — — — — — —9 Subtotal — — — — — — — — — — — —
Total 6,800,723 1,586,523 0.52 7,635,975 0.83 2.6 29.56 2.8 1,896,527 24.83 17,013 13,717

157ANNUAL REPORT 2018 The Norinchukin Bank
CAPITAL ADEQUACY
CR7: IRB – Effect on RWA of credit derivatives used as CRM techniques
Fiscal 2017 (Ended March 31, 2018) (Millions of Yen)
No. Portfolioa b
Pre-credit derivatives RWA Actual RWA
1 Sovereign – FIRB — —2 Sovereign – AIRB — —3 Banks – FIRB — —4 Banks – AIRB — —5 Corporate – FIRB — —6 Corporate – AIRB — —7 Specialised lending – FIRB — —8 Specialised lending – AIRB — —9 Retail – qualifying revolving (QRRE) — —10 Retail – residential mortgage exposures — —11 Other retail exposures — —12 Equity – FIRB — —13 Equity – AIRB — —14 Purchased receivables – FIRB — —15 Purchased receivables – AIRB — —16 Total — —
Note: Because the Bank did not use credit derivatives as credit risk mitigation techniques as of March 31, 2018, credit derivatives are not shown in these statements.
CR8: RWA flow statements of credit risk exposures under IRB
Fiscal 2017 (Ended March 31, 2018) (Millions of Yen)
No. RWA amounts
1 RWA as at end of previous reporting period 4,738,4912
Changes in the amounts per factor during fiscal 2017
Asset size 464,6553 Asset quality (274,900)4 Model updates 05 Methodology and policy 06 Acquisitions and disposals 07 Foreign exchange movements (27,511)8 Other 09 RWA as at end of reporting period 4,900,735

158 ANNUAL REPORT 2018 The Norinchukin Bank
CAPITAL ADEQUACY
CR9: IRB – Backtesting of probability of default (PD) per portfolio
Fiscal 2017 (Ended March 31, 2018) (%, the Number of Items)
a b c d e f g h i
Portfolio PD Range
External rating equivalent
Weighted average
PD
Arithmetic average PD by obligors
Number of obligorsDefaulted obligors
in the year
of which: new
defaulted obligors
in the year
Average historical
annual default
rate (5 years)
S&P Moody’s Fitch R&I JCREnd of
previous period
End of current period
Sovereign exposure
1-1 to 2 AAA—A- Aaa—A3 AAA—A- AAA—A- AAA—A- 0.00% 0.00% 92 90 0 0 0.00%3 to 4 BBB+—BBB- Baa1—Baa3 BBB+—BBB- BBB+—BBB- BBB+—BBB- 0.06% 0.06% 32 21 0 0 0.00%5 to 6 BB+—BB- Ba1—B1 BB+—BB- BB+—BB- BB+—BB- 0.86% 0.86% 3 2 0 0 0.00%7 B+ B2 B+ B+ B+ — — — — — — —8-1 to 8-2 B—CCC- B3—Caa3 B—CCC- B—CCC- B—CCC 9.88% 9.88% 1 1 0 0 0.00%
Bank exposure
1-1 to 2 AAA—A- Aaa—A3 AAA—A- AAA—A- AAA—A- 0.03% 0.03% 177 177 0 0 0.00%3 to 4 BBB+—BBB- Baa1—Baa3 BBB+—BBB- BBB+—BBB- BBB+—BBB- 0.10% 0.17% 103 102 0 0 0.00%5 to 6 BB+—BB- Ba1—B1 BB+—BB- BB+—BB- BB+—BB- 2.21% 1.83% 115 119 0 0 0.00%7 B+ B2 B+ B+ B+ 4.95% 4.95% 22 21 0 0 0.00%8-1 to 8-2 B—CCC- B3—Caa3 B—CCC- B—CCC- B—CCC 8.94% 8.94% 5 3 0 0 0.00%
Corporate exposure
1-1 to 2 AAA—A- Aaa—A3 AAA—A- AAA—A- AAA—A- 0.05% 0.05% 448 510 0 0 0.00%3 to 4 BBB+—BBB- Baa1—Baa3 BBB+—BBB- BBB+—BBB- BBB+—BBB- 0.23% 0.26% 927 993 2 1 0.04%5 to 6 BB+—BB- Ba1—B1 BB+—BB- BB+—BB- BB+—BB- 1.11% 1.32% 703 719 0 0 0.08%7 B+ B2 B+ B+ B+ 4.51% 4.75% 501 561 2 0 0.86%8-1 to 8-2 B—CCC- B3—Caa3 B—CCC- B—CCC- B—CCC 15.84% 15.84% 336 374 11 2 4.29%
Retail exposure
Standard loans 0.36% 0.44% 72,656 78,431 99 0 0.14%Delinquent loans 22.07% 22.95% 368 398 47 0 12.81%
Notes: 1. Although most tallied data are about consolidated assets, in principle, as to the “Number of obligors,” “Defaulted obligors in the year” and “Average historical annual default rate (5 years)” of corporate, sovereign and bank exposure, only non-consolidated data are tallied, taking into account that the PDs are estimated mainly for the group of obligors of the Bank as a non-consolidated entity and a majority of such obligors are borrowers of the Bank alone on a non-consolidated basis.
2. Although the Bank has applied the Advanced Internal Ratings-Based Approach (A-IRB) to corporate, sovereign and bank exposure, beginning with the standard capital adequacy ratio calculation as of March 31, 2017, because the average PD and the average historical annual default rates, which are subject to back-testing, were calculated including the data prior to the transition to the A-IRB, the sum of the investment funds under the A-IRB and those under the Foundation Internal Ratings-Based Approach (F-IRB) were tallied and disclosed.
3. Back-testing is not applied to Specialized Lending Products because the slotting criteria method is adopted for them. Moreover, the data on equity exposure and debt purchased for corporate, for which the PD/LGD approaches are applied, are not tallied for each classification because the number of defaults is recognized in one of the above categories in case default occurs.
4. Retail exposure, the balance of which is insignificant against total assets, is disclosed as a whole in a single portfolio category.5. Because related back-testing is conducted and tallied using the PD values used to calculate the capital adequacy ratio for estimation and validation, with
the “previous year-end” for corporate, sovereign and bank exposure being September 30, 2016, and the “current year-end” as September 30, 2017, and with the “previous year-end” for retail exposure being the end of a reference month on an exposure pool basis in estimation and validation for 2016 and the “current year-end” being the end of the same reference month for 2017, the “Number of obligors” and “Defaulted obligors in the year” were tallied. Also, the “Weighted-average PD” and “Arithmetic average PD by obligors” are calculated, considering the purpose of this disclosure, using the PD values that were applied to compute the risk-weighted asset data used to calculate the capital adequacy ratio as of the reference date of March 31, 2016.
6. Concerning the “Average historical annual default rate (5 years),” the five-year average value is computed with the reference date of September 30 of each year for corporate exposure, and that for retail exposure with the reference date being the end of the reference month of each exposure pool for estimation and validation, using the internal past default data.
7. For retail exposure, calculation was conducted not by obligor but also by loan.

159ANNUAL REPORT 2018 The Norinchukin Bank
CAPITAL ADEQUACY
■ Establishment of the Debtor Rating System and Categories for Estimating PDs
Related to Corporate, Sovereign and Bank Exposure
Portfolio Evaluation methods for assigning debtor ratings Category for estimating PDsRatio to the
entire credit RWA
Sovereign exposureInternal development methodsMethods to refer to credit ratings by external agencies
Sovereign 0.01%
Bank exposureInternal development methodsMethods to refer to credit ratings by external agencies
Bank 3.40%
Corporate exposure (excluding Specialized Lending Products)
Internal development methodsMethods to refer to credit ratings by external agenciesCredit rating agencies estimating models approach
Resident corporateNon-resident corporate
6.76%
Specialized Lending Products Internal development methodsNot applicable because the slot-ting criteria method is applied
1.95%
Equity Exposure to the PD/LGD Approaches are applied
Internal development methodsMethods to refer to credit ratings by external agencies
Categorized as resident corpo-rate, non-resident corporate, bank or sovereign
3.01%
Other debt purchased for cor-porate, sovereign and bank exposure
Internal development methodsMethods to refer to credit ratings by external agencies
Categorized as resident corporate, non-resident corporate, bank or sovereign
0.18%
Note: The “Category for estimating PDs” are Resident corporate, Non-resident corporate, Bank and Sovereign under the Debtor Rating System. PDs are assigned corresponding to the debtor rankings in each category.
■ Remarks on the Evaluation Methods for Assigning Ratings to Corporate,
Sovereign and Bank ExposureEvaluation methods
Overview of the evaluation methods
Method to allocate exposures to the evaluation methods to be applied
Internal development methods
Evaluation method combining quantitative and qualitative methods, in principle, using a quantitative model
1. Allocation of ratings based on the quantitative financial information and qualitative information available via transactions mainly with credit risk in financing, etc.
2. Allocation of ratings to debtors of which evaluation by the internal development method is possible because there is a sufficient level of quality and quantity of information obtained from disclosure data and fund manag-ers in case of investing in specific bonds and loans mainly with credit risk (including fund and other indirect investments)
Methods to refer to credit ratings by external agencies
Evaluation methods utilizing mainly S&P or Moody’s credit rating information
Allocation of ratings to debtors of which rating information from external credit rating agencies is availableProvided, however, the use of this method shall be limited to either of the following.1. In case of investing in bonds or loans mainly with market risks such as price volatility and interest risk (includ-
ing fund and other indirect investments)2. In case of investing in credit risk-born funds, etc., with inferior quality and quantity of information on the
investment targets constituting the fund available from disclosure data and fund managers compared to the information obtained on debtors to whom the Bank’s internal development method is applied, thereby the alter-native use of rating information from external credit rating agencies as major information rather than the use of the internal development method being judged to be more appropriate
Credit rating agencies esti-mating mod-els approach
Evaluation method utilizing quantitative evaluation by a vendor model for estimating the external rating as major information
In case of investing in specific bonds and loans (including investment types commissioned to external firms) mainly with credit risk and allotment of ratings to debtors who satisfy both of the following:1. In case it is impossible to obtain rating information by external credit rating agencies2. In case the quality and quantity of information available from disclosure data and fund managers is inferior
compared to that of debtors to whom internal development methods are applied, thereby the alternative use of quantitative evaluation by a vendor model of estimating external rating as major information rather than the use of internal development methods being judged to be more appropriate
■ Establishment of Pools Related to Retail Exposure
PortfolioPools Ratio to the
entire RWANon-consolidated Consolidated subsidiaries
Retail exposure secured by residential properties
Cooperative mortgage loanMortgage loan that is not backed by a loan guarantee company, JA Bank mortgage loan guarantee
1.70%
Qualifying revolving retail exposure
— — —
Other debt purchased (retail)
Purchased mortgage loans, purchased personal loans
Purchased retail receivables 0.00%
Other retail exposure
Forestry funds for individual forestry business operators, agricultural funds for individual agricultural business operators, educational loans in trust
Business loans not backed by a loan guarantee company, non-businesses loans not backed by a loan guarantee company, JA Bank unsecured loan guarantee
0.09%

160 ANNUAL REPORT 2018 The Norinchukin Bank
CAPITAL ADEQUACY
■ Remarks on the Scope of Application of Retail Exposure PoolsPortfolio Method to apply exposure pools
Retail exposure secured by residential properties
Credit of an individual who resides on the real estate owned by the Bank
Qualifying revolving retail exposures
Exposures with all the characteristics listed below1. Exposure with the debt balance changeable depending on the debtor’s arbitrary judgments within
the upper limit stipulated in the contract, with no collateral, and no contract regarding the mainte-nance of credit lines, thereby allowing the Bank to cancel without cause
2. Exposure to individual person-related risks3. The upper limit of the balance for an individual is ¥10 million or lower.4. Low volatility in the loss ratio of low-PD exposures in the portfolio to which the exposure belongs5. It is possible to verify the volatility rate using the loss ratio data of the exposure.
Other debt purchased (retail) Loans for individuals purchased from outside the consolidated group of the Bank
Other retail exposureNon-business loans for individuals that are not categorized in the above loans for individuals (e.g., educational funds, auto loans and funds for living) or business loans mainly by credit guarantee asso-ciations in the amount of less than ¥100 million after subtracting the portion of the guarantee
CR10: IRB (specialised lending and equities under the simple risk-weight method)
Fiscal 2017 (Ended March 31, 2018) (Millions of Yen, %)
a b c d e f g h i j k lSpecialized Lending Products (supervisory slotting criteria)
Other than Lending for High-Volatility Commercial Real Estate (HVCRE)
Regulatory categories
Residual contractual maturity
On-balance sheet
amount
Off-balance sheet
amountRW
Exposure amount (EAD)RWA Expected
lossesPF OF CF IPRE Total
StrongLess than 2.5 years 41,990 19,705 50% 50,352 — — 6,416 56,769 28,384 —Equal to or more than 2.5 years 513,966 47,645 70% 470,338 21,458 — 38,901 530,698 371,488 2,122
GoodLess than 2.5 years 6,545 17,541 70% 17,675 — — — 17,675 12,372 70 Equal to or more than 2.5 years 96,718 31,624 90% 92,648 — — — 92,648 83,383 741
Satisfactory 37,208 11,561 115% 18,188 27,691 — — 45,879 52,761 1,284 Weak 22,654 — 250% 20,447 — — — 20,447 51,119 1,635 Default 753 — — — 1,912 — — 1,912 — 956 Total 719,837 128,078 — 669,652 51,061 — 45,318 766,032 599,512 6,811
High-Volatility Commercial Real Estate (HVCRE)
Regulatory categories
Residual contractual maturity
On-balance sheet
amount
Off-balance sheet
amountRW
Exposure amount (EAD)
RWA Expected losses
StrongLess than 2.5 years — — 70% — — —Equal to or more than 2.5 years — — 95% — — —
GoodLess than 2.5 years — — 95% — — —Equal to or more than 2.5 years — — 120% — — —
Satisfactory — — 140% — — —Weak — — 250% — — —Default — — — — — —Total — — — — — —
Equity Exposure (Method of the Market-Based Approach)Equity Exposure to which the Market-Based Approach is applied
CategoriesOn-balance
sheet amount
Off-balance sheet
amountRW
Exposure amount (EAD)
RWA
Exchange-traded equity exposures — — 300% — —Private equity exposures 134,271 — 400% 134,271 537,085 Other equity exposures 371,098 — 283% 371,098 1,050,019 Total 505,370 — — 505,370 1,587,104
Equity Exposure to which a risk weight of 100%
Equity Exposure to which a risk weight of 100% is applied as set forth in the proviso of Notification Regarding Capital Adequacy Ratio, Article 143-1
— — 100% — —

161ANNUAL REPORT 2018 The Norinchukin Bank
CAPITAL ADEQUACY
CCR1: Analysis of counterparty credit risk (CCR) exposure by approach
Fiscal 2017 (Ended March 31, 2018) (Millions of Yen)
No.
a b c d e f
Replacement cost
Potential future
exposureEEPE
Alpha used for computing
regulatory EAD
EAD post-CRM RWA
1 SA-CCR — — 1.4 — —Current exposure method 240,271 389,179 635,131 42,302
2 Expected positive exposure method — — — —3 Simple Approach for credit risk mitigation — —4 Comprehensive Approach for credit risk mitigation 15,517,250 179,609 5 VaR — —6 Total 221,912
CCR2: Credit valuation adjustment (CVA) capital charge
Fiscal 2017 (Ended March 31, 2018) (Millions of Yen)
No.a b
EAD post-CRM RWA
1Total portfolios subject to the Advanced CVA capital charge
— —
2 (i) VaR component (including the 3×multiplier) —
3(ii) Stressed VaR component (including the
3×multiplier)—
4All portfolios subject to the Standardized CVA capital charge
284,862 64,705
5 Total subject to the CVA capital charge 284,862 64,705
CCR3: Standardized approach – CCR exposures by regulatory portfolio and risk weights
Fiscal 2017 (Ended March 31, 2018) (Millions of Yen)
No.
a b c d e f g h iAmount of Credit Exposure (Consideration the effect of credit risk mitigation techniques)
Risk weightItems 0% 10% 20% 50% 75% 100% 150% Others Total
1Japanese government and the Bank of Japan
— — — — — — — — —
2Foreign central government and their central banks
— — — — — — — — —
3 Bank for International Settlements — — — — — — — — —4 Japanese regional municipal bodies — — — — — — — — —
5Non-central government public sector entities
— — — — — — — — —
6 Multilateral Development Bank — — — — — — — — —
7Japan Finance Organization for Municipalities
— — — — — — — — —
8 Japanese government institutions — — — — — — — — —9 Regional third-sector company — — — — — — — — —10 Banks and securities firms — — — — — — — — —11 Corporates — — — — — — — — —12 SMEs and individuals — — — — — — — — —13 Other than above — — — — — — — — —14 Total — — — — — — — — —
Note: The Bank had no counterparty credit risk exposure subject to the Standardized Approach as of March 31, 2018.

162 ANNUAL REPORT 2018 The Norinchukin Bank
CAPITAL ADEQUACY
CCR4: IRB – CCR exposures by portfolio and PD scale
■ Foundation Internal Ratings-Based Approach (F-IRB)
Fiscal 2017 (Ended March 31, 2018) (Millions of Yen, %, Thousands, Year)
No.a b c d e f g
PD scale EAD post-CRM Average PD Number of obligors Average LGD Average
maturity RWA RWA density
Sovereign exposure
1 0.00 to 0.15 or less 2,109,525 0.00 0.0 45.00 0.9 — 0.00 2 Exceeding 0.15 to 0.25 or less — — — — — — —3 Exceeding 0.25 to 0.50 or less — — — — — — —4 Exceeding 0.50 to 0.75 or less — — — — — — —5 Exceeding 0.75 to 2.50 or less — — — — — — —6 Exceeding 2.50 to 10.00 or less — — — — — — —7 Exceeding 10.00 to 100.00 or less — — — — — — —8 100.00 (default) — — — — — — —9 Subtotal 2,109,525 0.00 0.0 45.00 0.9 — 0.00
Bank exposure
1 0.00 to 0.15 or less 12,923,542 0.03 0.0 5.06 0.2 183,575 1.42 2 Exceeding 0.15 to 0.25 or less — — — — — — —3 Exceeding 0.25 to 0.50 or less — — — — — — —4 Exceeding 0.50 to 0.75 or less — — — — — — —5 Exceeding 0.75 to 2.50 or less — — — — — — —6 Exceeding 2.50 to 10.00 or less — — — — — — —7 Exceeding 10.00 to 100.00 or less — — — — — — —8 100.00 (default) — — — — — — —9 Subtotal 12,923,542 0.03 0.0 5.06 0.2 183,575 1.42
Corporate exposure
1 0.00 to 0.15 or less — — — — — — —2 Exceeding 0.15 to 0.25 or less — — — — — — —3 Exceeding 0.25 to 0.50 or less — — — — — — —4 Exceeding 0.50 to 0.75 or less — — — — — — —5 Exceeding 0.75 to 2.50 or less — — — — — — —6 Exceeding 2.50 to 10.00 or less — — — — — — —7 Exceeding 10.00 to 100.00 or less — — — — — — —8 100.00 (default) — — — — — — —9 Subtotal — — — — — — —
Total 15,033,068 0.03 0.0 12.41 0.3 183,575 1.22
Note: The number of counterparties is less than 100 in each portfolio.

163ANNUAL REPORT 2018 The Norinchukin Bank
CAPITAL ADEQUACY
CCR4: IRB – CCR exposures by portfolio and PD scale
■ Advanced Internal Ratings-Based Approach (A-IRB)
Fiscal 2017 (Ended March 31, 2018) (Millions of Yen, %, Thousands, Year)
No.a b c d e f g
PD scale EAD post-CRM Average PD Number of obligors Average LGD Average
maturity RWA RWA density
Sovereign exposure
1 0.00 to 0.15 or less — — — — — — —2 Exceeding 0.15 to 0.25 or less — — — — — — —3 Exceeding 0.25 to 0.50 or less — — — — — — —4 Exceeding 0.50 to 0.75 or less — — — — — — —5 Exceeding 0.75 to 2.50 or less — — — — — — —6 Exceeding 2.50 to 10.00 or less — — — — — — —7 Exceeding 10.00 to 100.00 or less — — — — — — —8 100.00 (default) — — — — — — —9 Subtotal — — — — — — —
Bank exposure
1 0.00 to 0.15 or less — — — — — — —2 Exceeding 0.15 to 0.25 or less — — — — — — —3 Exceeding 0.25 to 0.50 or less — — — — — — —4 Exceeding 0.50 to 0.75 or less — — — — — — —5 Exceeding 0.75 to 2.50 or less — — — — — — —6 Exceeding 2.50 to 10.00 or less — — — — — — —7 Exceeding 10.00 to 100.00 or less — — — — — — —8 100.00 (default) — — — — — — —9 Subtotal — — — — — — —
Corporate exposure
1 0.00 to 0.15 or less 1,115,931 0.05 0.0 17.31 0.1 36,462 3.26 2 Exceeding 0.15 to 0.25 or less 1,359 0.15 0.0 30.35 2.4 349 25.72 3 Exceeding 0.25 to 0.50 or less 220 0.42 0.0 30.35 3.2 107 48.69 4 Exceeding 0.50 to 0.75 or less — — — — — — —5 Exceeding 0.75 to 2.50 or less 1,802 0.83 0.0 30.35 4.9 1,416 78.60 6 Exceeding 2.50 to 10.00 or less — — — — — — —7 Exceeding 10.00 to 100.00 or less — — — — — — —8 100.00 (default) — — — — — — —9 Subtotal 1,119,314 0.05 0.0 17.35 0.1 38,336 3.42
Total 1,119,314 0.05 0.0 17.35 0.1 38,336 3.42
Note: The number of counterparties is less than 100 in each portfolio.
CCR5: Composition of collateral for CCR exposure
Fiscal 2017 (Ended March 31, 2018) (Millions of Yen)
No.
a b c d e fCollateral used in derivative transactions Collateral used in SFTs
Fair value of collateral received Fair value of posted collateral Fair value of collateral
received
Fair value of posted col-
lateralSegregated Unsegregated Segregated Unsegregated
1 Cash – domestic currency — 358,073 — 137,906 — 7,000 2 Cash – other currencies — 15,548 — 3,858 19,505,157 82,463 3 Domestic sovereign debt 544 — 626,028 — 12,529 5,313,085 4 Other sovereign debt — — 1,099 — 54,202 12,616,048 5 Government agency debt — — — — 3,484 3,913,397 6 Corporate bonds — — — — 334 575,795 7 Equity securities — — 29,008 — — —8 Other collateral — — — — — 1,533,730 9 Total 544 373,622 656,136 141,765 19,575,708 24,041,520

164 ANNUAL REPORT 2018 The Norinchukin Bank
CAPITAL ADEQUACY
CCR6: Credit derivatives exposures
Fiscal 2017 (Ended March 31, 2018) (Millions of Yen)
No.a b
Protection bought Protection sold
Notionals
1 Single-name credit default swaps — —2 Index credit default swaps — —3 Total return swaps — —4 Credit options — —5 Other credit derivatives — —6 Total notionals — —
Fair values
7 Positive fair value (asset) — —8 Negative fair value (liability) — —
Note: The Bank had no amount of credit derivative instruments exposure as of March 31, 2018.
CCR7: RWA flow statements of CCR exposures under Expected Positive
Exposure Method
Fiscal 2017 (Ended March 31, 2018) (Millions of Yen)
No. Amounts
1 RWA as at end of previous reporting period —2
Changes in the amounts of per factor during fiscal 2017
Asset size —3 Credit quality of counterparties —4 Model updates (Expected positive exposure method only) —5 Methodology and policy (Expected positive exposure method only) —6 Acquisitions and disposals —7 Foreign exchange movements —8 Other —9 RWA as at end of current reporting period —
Note: The Bank had not applied the Expected Positive Exposure Method as of March 31, 2018.

165ANNUAL REPORT 2018 The Norinchukin Bank
CAPITAL ADEQUACY
CCR8: Exposures to central counterparties
Fiscal 2017 (Ended March 31, 2018) (Millions of Yen)
No.a b
EAD (post-CRM) RWA
1 Exposures to QCCPs (total) 191,435
2Exposures for trades at QCCPs (excluding initial margin and default fund contribu-tions); of which
9,163,365 13,854
3 (i) OTC derivatives 738,061 13,832 4 (ii) Exchange-traded derivatives 563 22 5 (iii) Securities financing transactions 8,424,740 —
6(iv) Netting sets where cross-product
netting has been approved— —
7 Segregated initial margin —8 Non-segregated initial margin 415,357 605 9 Pre-funded default fund contributions 165,474 176,975 10 Unfunded default fund contributions — —11 Exposures to non-QCCPs (total) —
12Exposures for trades at non-QCCPs (exclud-ing initial margin and default fund contribu-tions); of which
— —
13 (i) OTC derivatives — —14 (ii) Exchange-traded derivatives — —15 (iii) Securities financing transactions — —
16(iv) Netting sets where cross-product
netting has been approved— —
17 Segregated initial margin —18 Non-segregated initial margin — —19 Pre-funded default fund contributions — —20 Unfunded default fund contributions —
SEC1: Securitization exposures in the banking book
Fiscal 2017 (Ended March 31, 2018) (Millions of Yen)
No. Types of underlying assetsa b c d e f g h iBank acts as originator Bank acts as sponsor Banks acts as investor
Traditional Synthetic Sub-total Traditional Synthetic Sub-total Traditional Synthetic Sub-total
1 Retail (total) – of which — — — — — — 3,235,840 — 3,235,8402 residential mortgage — — — — — — 2,391,192 — 2,391,1923 credit card — — — — — — 304,455 — 304,4554 other retail exposures — — — — — — 540,192 — 540,1925 re-securitization — — — — — — 0 — 06 Wholesale (total) – of which — — — — — — 3,996,856 — 3,996,8567 loans to corporates — — — — — — 3,925,191 — 3,925,1918 commercial mortgage — — — — — — 63,379 — 63,3799 lease and receivables — — — — — — 8,285 — 8,28510 other wholesale — — — — — — — — —11 re-securitization — — — — — — — — —

166 ANNUAL REPORT 2018 The Norinchukin Bank
CAPITAL ADEQUACY
SEC2: Securitization exposures in the trading book
Fiscal 2017 (Ended March 31, 2018) (Millions of Yen)
No. Types of underlying assetsa b c d e f g h iBank acts as originator Bank acts as sponsor Banks acts as investor
Traditional Synthetic Sub-total Traditional Synthetic Sub-total Traditional Synthetic Sub-total
1 Retail (total) – of which — — — — — — — — —2 residential mortgage — — — — — — — — —3 credit card — — — — — — — — —4 other retail exposures — — — — — — — — —5 re-securitization — — — — — — — — —6 Wholesale (total) – of which — — — — — — — — —7 loans to corporates — — — — — — — — —8 commercial mortgage — — — — — — — — —9 lease and receivables — — — — — — — — —10 other wholesale — — — — — — — — —11 re-securitization — — — — — — — — —
SEC3: Securitization exposures in the banking book and associated regulatory capital
requirements – bank acting as originator or as sponsor
Fiscal 2017 (Ended March 31, 2018) (Millions of Yen)
No.
a b c d e f g h i j k l m n oTotal exposures
Traditional securitization Synthetic securitizationOf which securitization Of which re-securitization Of which securitization Of which re-securitization
Of which retail
underly-ing
Of which wholesale
Of which senior
Of which non-
senior
Of which retail
underly-ing
Of which wholesale
Of which senior
Of which non-
senior
Exposure values (by RW bands)
1 ≤20% RW — — — — — — — — — — — — — — —2 >20% to 50% RW — — — — — — — — — — — — — — —
3>50% to 100% RW
— — — — — — — — — — — — — — —
4>100% to <1,250% RW
— — — — — — — — — — — — — — —
5 1,250% RW — — — — — — — — — — — — — — —Exposure values (by regulatory approach)
6IRB RBA (including IAA)
— — — — — — — — — — — — — — —
7 IRB SFA — — — — — — — — — — — — — — —8 SA/SSFA — — — — — — — — — — — — — — —9 1,250% — — — — — — — — — — — — — — —
RWA (by regulatory approach)
10IRB RBA (including IAA)
— — — — — — — — — — — — — — —
11 IRB SFA — — — — — — — — — — — — — — —12 SA/SSFA — — — — — — — — — — — — — — —13 1,250% — — — — — — — — — — — — — — —
Capital charge after cap
14IRB RBA (including IAA)
— — — — — — — — — — — — — — —
15 IRB SFA — — — — — — — — — — — — — — —16 SA/SSFA — — — — — — — — — — — — — — —17 1,250% — — — — — — — — — — — — — — —

167ANNUAL REPORT 2018 The Norinchukin Bank
CAPITAL ADEQUACY
SEC4: Securitization exposures in the banking book and associated capital
requirements – bank acting as investor
Fiscal 2017 (Ended March 31, 2018) (Millions of Yen)
No.
a b c d e f g h i j k l m n oTotal exposures
Traditional securitization Synthetic securitizationOf which securitization Of which re-securitization Of which securitization Of which re-securitization
Of which retail
underly-ing
Of which wholesale
Of which senior
Of which non-
senior
Of which retail
underly-ing
Of which wholesale
Of which senior
Of which non-
senior
Exposure values (by RW bands)
1 ≤20% RW 7,228,828 7,228,828 7,228,828 3,231,972 3,996,856 — — — — — — — — — —2 >20% to 50% RW 2,735 2,735 2,735 2,735 — — — — — — — — — — —
3>50% to 100% RW
1,133 1,133 1,133 1,133 — — — — — — — — — — —
4>100% to <1,250% RW
— — — — — — — — — — — — — — —
5 1,250% RW 0 0 — — — 0 — 0 — — — — — — —Exposure values (by regulatory approach)
6 IRB SFA 7,232,697 7,232,697 7,232,697 3,235,840 3,996,856 — — — — — — — — — —7 IRB SFA — — — — — — — — — — — — — — —8 SA/SSFA — — — — — — — — — — — — — — —9 1,250% 0 0 — — — 0 — 0 — — — — — — —
RWA (by regulatory approach)
10 IRB SFA 518,665 518,665 518,665 230,646 288,019 — — — — — — — — — —11 IRB SFA — — — — — — — — — — — — — — —12 SA/SSFA — — — — — — — — — — — — — — —13 1,250% 0 0 — — — 0 — 0 — — — — — — —
Capital charge after cap
14 IRB SFA 43,982 43,982 43,982 19,558 24,424 — — — — — — — — — —15 IRB SFA — — — — — — — — — — — — — — —16 SA/SSFA — — — — — — — — — — — — — — —17 1,250% 0 0 — — — 0 — 0 — — — — — — —
MR1: Market risk under standardized approach
Fiscal 2017 (Ended March 31, 2018) (Millions of Yen)
No. RWA
1 Interest rate risk (general and specific) —2 Equity risk (general and specific) —3 Foreign exchange risk 1,171,398 4 Commodity risk —
Options
5 Simplified approach —6 Delta-plus method —7 Scenario approach —8 Securitization —9 Total 1,171,398

168 ANNUAL REPORT 2018 The Norinchukin Bank
CAPITAL ADEQUACY
MR2: RWA flow statements of market risk exposures under an IMA
Fiscal 2017 (Ended March 31, 2018) (Millions of Yen)
No.a b c d e f
VaR Stressed VaR IRC CRM Other Total RWA
1aRisk-weighted assets at the end of the previous fiscal year
2,440 7,174 — — 9,614
1bAdjustment of the amounts of risk-weighted assets given the regulatory required capital ratio at the end of the previous fiscal year
1.79 2.21 — — 2.08
1cAmounts calculated under the Internal Models Approach as of the reference date prior to the previous year-end calculation
1,361 3,239 — — 4,601
2
Amounts of volatilities by factor during fiscal 2017
Movement in risk levels 342 4,668 — — 5,0103 Model updates/changes — — — — —4 Methodology and policy — — — — —5 Acquisitions and disposals — — — — —6 Foreign exchange movements 14 627 — — 6417 Other (872) — — — (872)
8aAmounts calculated under the Internal Models Approach as of the reference date for computation at the end of fiscal 2017
845 8,535 — — 9,380
8bAdjustment of the amounts of risk-weighted assets given the regulatory required capital ratio at the end of fiscal 2017
5.01 2.50 — — 2.72
8c RWA at end of reporting period 4,236 21,367 — — 25,604
MR3: IMA values for trading portfolios
Fiscal 2017 (Ended March 31, 2018) (Millions of Yen)
No.
VaR (10 day 99%)
1 Maximum value 1942 Average value 843 Minimum value 244 Period end 67
Stressed VaR (10 day 99%)
5 Maximum value 7146 Average value 3507 Minimum value 868 Period end 682
Incremental Risk Charge (99.9%)
9 Maximum value —10 Average value —11 Minimum value —12 Period end —
Comprehensive Risk capital charge (99.9%)
13 Maximum value —14 Average value —15 Minimum value —16 Period end —17 Floor (standardized measurement method) —

169ANNUAL REPORT 2018 The Norinchukin Bank
CAPITAL ADEQUACY
MR4: Comparison of VaR estimates with gains/losses
Fiscal 2017 (Ended March 31, 2018)
-80
-60
-40
-20
0
20
40
60
80
March 31, 2017 March 31, 2018
(Millions of Yen)
Daily profit and loss Daily VaR
Note: The Bank conducted one excess back-test in fiscal 2017. The excess back-testing was conducted on February 2, 2018, resulting in a loss of ¥39 million with a VaR of ¥35 million. The reason for the excess back-testing was market factors.
Exposure Subject to Risk-Weighted Asset Calculation for Investment Funds (Consolidated)
Amount of Exposure Subject to Risk-Weighted Asset Calculation for
Investment Fund (Billions of Yen)
Classification
As of March 31, 2018 As of March 31, 2017
Exposure(For reference)
Weighted-average risk weight
Exposure(For reference)
Weighted-average risk weight
Look-through approach 18,187 65% 17,571 64%
Majority approach 939 386% 713 388%
Mandate approach — — — —
Market-based approach 1,330 327% 1,670 325%
Others (simple approach) 380 425% 306 428%
Total 20,837 94% 20,261 94%
Notes: 1. The “Look-through approach” is a method for computing the risk-weighted assets in fund by totaling the amount of risk-weighted assets for credit risk in individual asset categories. (Please refer to Notification Regarding Capital Adequacy Ratio, Article 144-1.)
2. The “Majority approach” is a method for computing the risk-weighted assets in fund by applying risk weight to the fund as well as equity exposure when the exposure of equity, in terms of value, is major in a fund. (Please refer to the Notification Regarding Capital Adequacy Ratio, Article 144-2.)
3. The “Mandate approach” is a method for computing the risk-weighted assets in fund where only the investment mandate of the fund is known. The risk-weighted assets are computed as follows: It is assumed that the fund first invests, to the maximum extent allowed under its mandate, in the asset classes attracting the highest capital requirement, and then continues making investments in descending order until the maximum total investment level is reached. (Please refer to the Notification Regarding Capital Adequacy Ratio, Article 144-3.)
4. The “Market-based approach” is a method for computing the credit risk of exposure regarded as credit risk assets using the Bank’s internal model (which is a value-at-risk (VaR) model based on the historical simulation method). (Please refer to the Notification Regarding Capital Adequacy Ratio, Article 144-4.)
5. The “Others (simple approach)” is a method for computing the risk-weighted assets in fund by applying risk weight of 400%, when it is judged the probability that the weighted-average risk weight will be less than 400%. In all other cases, risk weight of 1,250% is applied to funds. (Please refer to the Notification Regarding Capital Adequacy Ratio, Article 144-5.)
6. (For reference) The sum of the amount of risk-weighted assets (excluding CVA risk amount) and the amount resulting from dividing the expected loss by 8% are divided by EAD to yield the risk weight value.

170 ANNUAL REPORT 2018 The Norinchukin Bank
CAPITAL ADEQUACY
IRRBB1 – Quantitative information on IRRBB (Millions of Yen)
No.a b c d
⊿EVE ⊿NIIFiscal 2017 Fiscal 2016 Fiscal 2017 Fiscal 2016
1 Parallel up 2,414,759 215,4872 Parallel down (910,955) (134,632)3 Steepener 744,2334 Flattener (75,925)5 Short rate up 635,8736 Short rate down (246,169)7 Maximum 2,414,759 215,487
e f
Fiscal 2017 Fiscal 2016
8 Tier 1 capital 6,432,621 6,489,114

171ANNUAL REPORT 2018 The Norinchukin Bank
CAPITAL ADEQUACY
Indicators for Assessing Global Systemically Important
Banks (G-SIBs)
(In 0.1 Billion Yen)
Description As of March 31, 2018
1 Total exposures (A)+(B)+(C)+(D): (A) On-balance assets (other than assets specifically identified below (B), (C) and contra-account of guarantees) (B) Sum of counterparty exposure of derivatives contracts, capped notional amount of credit derivatives and
potential future exposure of derivatives contracts (C) Adjusted gross value of securities financing transactions (SFTs) and counterparty exposure of SFTs (D) Gross notional amount of off-balance sheet items (other than derivatives contracts and SFTs)
1,067,002
2 Intra-financial system assets (A)+(B)+(C)+(D): (A) Funds deposited with or lent to other financial institutions and undrawn committed lines extended to other
financial institutions (B) Holdings of securities issued by other financial institutions (Note 1) (C) Net positive current exposure of SFTs with other financial institutions (D) Over-the-counter (OTC) derivatives with other financial institutions that have a net positive fair value
94,193
3 Intra-financial system liabilities (A)+(B)+(C): (A) Deposits and debt due to, and undrawn committed lines obtained from, other financial institutions (B) Net negative current exposure of SFTs with other financial institutions (C) OTC derivatives with other financial institutions that have a net negative fair value
46,910
4 Securities outstanding (Note 1) 46,871 5 Assets under custody 52,911 6 Notional amount of OTC derivatives 280,135 7 Held-for-trading (HFT) securities and available-for-sale (AFS) securities, excluding HFT and AFS securities that
meet the definition of Level 1 assets and Level 2 assets with haircuts (Note 2) 137,714
8 Level 3 assets (Note 3) 14,823 9 Cross-jurisdictional claims 465,36410 Cross-jurisdictional liabilities 184,617
Description Fiscal 2017
11 Payments (settled through the BOJ-NET, the Japanese Banks’ Payment Clearing Network and other similar settlement systems, excluding intragroup payments)
9,240,002
12 Underwritten transactions in debt and equity markets (Note 4) 334
Notes: 1. Securities refer to secured debt securities, senior unsecured debt securities, subordinated debt securities, commercial paper, certificate of deposits, and common equities.
2. Level 1 and Level 2 assets with haircuts are defined in the Basel III Liquidity Coverage Ratio (LCR).3. The amount is calculated in accordance with the International Financial Reporting Standards.4. This refers to underwriting of securities defined in Article 2 Paragraph 8 Item 6 of the Financial Instruments and Exchange Act.

172 ANNUAL REPORT 2018 The Norinchukin Bank
CAPITAL ADEQUACY
(Millions of Yen)
ItemsConsolidated balance sheet
amount
Balance sheetamount based on regulatory
scope of consolidation
Ref. No.
(Assets)
Loans and Bills Discounted 12,058,289
of which: non-significant investments in the capital instruments of other financial institutions 103,000
Tier 2 capital instruments —
Significant investments in the common stock of Other Financial Institutions that are below the thresholds for deduction (before risk weighting)
103,000 A24.1
Foreign Exchanges Assets 224,101
Securities 62,079,090 62,079,090
Money Held in Trust 6,983,612 6,983,612
Securities and Money Held in Trust of which: goodwill and those equivalents (excluding those reported in the Intangible Fixed Assets)
13,858 A1.1
Securities and Money Held in Trust of which: investments in own capital instruments —
Common Equity (excluding those reported in the Net Assets section) — A5
Additional Tier 1 capital — A14
Tier 2 capital — A20
Securities and Money Held in Trust of which: reciprocal cross-holdings in capital instruments
—
Common Equity — A6
Additional Tier 1 capital — A15
Tier 2 capital — A21
Securities and Money Held in Trust of which: investments in the capital of banking, financial and insurance entities that are outside the scope of regulatory consolidation, where the bank does not own more than 10% of the issued share capital
245,985
Common Equity — A7
Additional Tier 1 capital — A16
Tier 2 capital — A22
Non-significant investments in the capital of other financials that are below the thresholds for deduction (before risk weighting)
245,985 A24.2
Securities and Money Held in Trust of which: significant investments in the capital of banking, financial and insurance entities that are outside the scope of regulatory consolidation (net of eligible short positions)
96,526
Amount exceeding the 10% threshold on specified items — A8
Amount exceeding the 15% threshold on specified items — A11
Additional Tier 1 capital 50,033 A17
Tier 2 capital — A23
Significant investments in the common stock of financials that are below the thresholds for deduction (before risk weighting)
46,493 A25
Trading Assets 10,715
Monetary Claims Bought 257,888
Call Loans and Bills Bought 146,220
Receivables under Resale Agreements —
Receivables under Securities Borrowing Transactions 1,173
Cash and Due from Banks 22,939,086
Other Assets 1,001,888
Tangible Fixed Assets 117,791
Buildings 45,206
Land 48,100
Lease Assets 21,394
Construction in Progress 158
Other 2,931
Explanation on Reconciliation between Balance Sheet Items and
Regulatory Capital Elements (Consolidated)
As of March 31, 2017

173ANNUAL REPORT 2018 The Norinchukin Bank
CAPITAL ADEQUACY
(Millions of Yen)
ItemsConsolidated balance sheet
amount
Balance sheetamount based on regulatory
scope of consolidation
Ref. No.
Intangible Fixed Assets 31,141 31,141
Software 11,639 11,639
Lease Assets 5,882 5,882
Other 13,618 13,618
of which: goodwill and those equivalents (excluding those reported in the Net Assets section)
— A1.2
of which: other intangible assets other than goodwill and mortgage servicing rights 31,141 A2.1
of which: amount that corresponds to effective tax rate to other intangible assets other than goodwill and mortgage servicing rights
7,888 A2.2
of which: mortgage servicing rights (net of related deferred tax liabilities) —
Amount exceeding the 10% threshold on specified items — A9
Amount exceeding the 15% threshold on specified items — A12
Amount below the thresholds for deduction (before risk weighting) — A26
Amounts of assets related to retirement benefits 45,596 45,596 A4
Deferred Tax Assets 7,010 7,010
of which: deferred tax assets that rely on future profitability excluding those arising from temporary differences (net of related deferred tax liabilities)
— A3
of which: deferred tax assets arising from temporary differences —
Amount exceeding the 10% threshold on specified items — A10
Amount exceeding the 15% threshold on specified items — A13
Amount below the thresholds for deduction (before risk weighting) — A27
Customers’ Liabilities for Acceptances and Guarantees 1,215,882
Reserve for Possible Loan Losses (56,730) (56,730)
of which: general reserve for possible loan losses includes Tier 2 (12) A18
of which: eligible provisions includes Tier 2 — A19
Reserve for Possible Investment Losses (10)
Total Assets 107,062,747
(Liabilities)
Deposits 61,886,185
Negotiable Certificates of Deposit 3,689,270
Debentures 2,412,824
Bonds — —
of which: qualifying Additional Tier 1 instruments — D1.1
of which: qualifying Tier 2 instruments — D2.1
Trading liabilities 6,150
Borrowed Money 4,371,611 4,371,611
of which: qualifying Additional Tier 1 instruments — D1.2
of which: qualifying Tier 2 instruments 1,415,480 D2.2
Call Money and Bills Sold 3,365
Payables under Repurchase Agreements 19,645,010
Payables under Securities Lending Transactions 1,013
Foreign Exchanges Liabilities 2
Trust Money 1,257,432
Other Liabilities 4,929,423
Reserve for Bonus Payments 7,894
Reserve for Employees’ Retirement Benefits —
Liabilities related to retirement benefits 38,624
Reserve for Directors’ Retirement Benefits 1,286
Reserve for Agriculture, Fishery and Forestry Industry Subsidies 523
Deferred Tax Liabilities 578,827 578,827
of which: assets related to retirement benefits 12,652 D3
Deferred Tax Liabilities for Land Revaluation 8,607 8,607
Acceptances and Guarantees 1,215,882
Total Liabilities 100,053,934

174 ANNUAL REPORT 2018 The Norinchukin Bank
CAPITAL ADEQUACY
(Millions of Yen)
ItemsConsolidated balance sheet
amount
Balance sheetamount based on regulatory
scope of consolidation
Ref. No.
(Net Assets)
Paid-in Capital 3,480,488 3,480,488 E1.1
of which: preferred stock 24,999 E1.2
of which: directly issued qualifying Additional Tier 1 instruments plus related capital surplus of which classified as equity under applicable accounting standards
24,500 E5.1
Capital Surplus 24,993 24,993
of which: other capital surplus 20 E1.3
of which: directly issued qualifying Additional Tier 1 instruments plus related capital surplus of which classified as equity under applicable accounting standards
24,500 E5.2
Retained Earnings 1,910,262 1,910,262 E2
Treasury Preferred Stock (150) (150)
Total Owners’ Equity 5,415,594 5,415,594
of which: others — E3
of which: directly issued qualifying Tier 2 instruments plus related capital surplus of which classified as equity under applicable accounting standards
— E6
Net Unrealized Gains on Other Securities 1,584,281 1,584,281
Net Deferred Losses on Hedging Instruments (26,550) (26,550)
of which: net deferred losses on hedge 19,422 E7
Revaluation Reserve for Land 14,312 14,312
Foreign Currency Translation Adjustment (53) (53)
Remeasurements of Defined Benefit Plans 12,635 12,635
Total Accumulated Other Comprehensive Income 1,584,624 1,584,624 E4
Minority Interests 8,594 8,594of which: common equity issued by subsidiaries and held by third parties (amount allowed in group CET1) — E8.1
of which: Additional Tier 1 instruments issued by subsidiaries and held by third parties (amount allowed in group AT1) 3,254 E8.2
of which: Tier 2 instruments issued by subsidiaries and held by third parties (amount allowed in group Tier 2)
96 E8.3
Total Net Assets 7,008,813Total Liabilities and Net Assets 107,062,747
Notes: 1. “Balance sheet amount based on regulatory scope of consolidation” refers only to the items used in calculating capital adequacy. 2. “Balance sheet amount based on regulatory scope of consolidation” does not reflect transitional arrangements so that the amount of the column consists
of the amount included in capital adequacy and the amount excluded under transitional arrangements in “Composition of Capital.”

175ANNUAL REPORT 2018 The Norinchukin Bank
CAPITAL ADEQUACY
Capital Adequacy (Consolidated)
(Minimum amount of regulatory required capital and breakdown for each risk category)
Regulatory Required Capital (Billions of Yen)
Items
As of March 31, 2017
EADRegulatoryRequiredCapital
Amount of regulatory required capital for credit risk 141,673 2,551
Exposure subject to Internal Ratings-Based Approach 125,678 2,527
Corporate exposure (excluding Specialized Lending) 7,454 188
Corporate exposure (Specialized Lending) 513 39
Sovereign exposure 66,106 0
Bank exposure 16,901 108
Retail exposure 1,268 40
Retail exposure secured by residential properties 1,224 36
Qualifying revolving retail exposure — —
Other retail exposure 44 4
Securitization and re-securitization exposure 6,513 42
Equity portfolios 1,250 200
Equity portfolios subject to PD/LGD approaches 802 80
Equity portfolios subject to simple risk-weighted method 100 34
Equities under the internal models approach 346 85
Exposure subject to risk-weighted asset calculation for investment fund 25,111 1,892
Other debt purchased 308 4
Other exposures 249 12
Exposure subject to Standardized Approach 50 0
Assets subject to Standardized Approach on a non-consolidated basis 7 0
Assets subject to Standardized Approach in consolidated companies (excluding securitization exposure)
43 0
Assets subject to Standardized Approach in consolidated companies (securitization exposure) — —
Amount corresponding to CVA risk 547 4
CCP-related exposures 15,375 16
Items that included by transitional arrangements 21 0
Amount of regulatory required capital for market risk / 136
Standardized Approach / 135
Interest rate risk category / —
Equity risk category / —
Foreign exchange risk category / 135
Commodity risk category / —
Option transactions / —
Internal models Approach / 0
Amount of regulatory required capital for operational risk / 71
Offsets on consolidation / 2,758
Notes: 1. Regulatory required capital for credit risk = 8% of risk-weighted assets for credit risk + Expected losses2. Within the Exposure Subject to the Internal Ratings-Based Approach (excluding retail), the EAD subject to the Advanced Internal Ratings-Based
Approach and the amount of regulatory required capital are ¥7,910.6 billion and ¥189.1 billion, respectively.3. “Risk-weighted asset calculation for investment fund” is risk-weighted assets as calculated according to the method specified in Notification Regarding
Capital Adequacy Ratio, Article 144.4. Risk-weighted asset calculation for investment fund includes ¥172.7 billion EAD and ¥0.3 billion of Required Capital of CPP-related exposures.5. Under “The Standardized Approach (TSA),” which is a method for computing the amount corresponding to operational risk, the gross profit for one year
is allocated among the business activities as specified in Appendix Table 1 of the Notification Regarding Capital Adequacy Ratio. The multiplier specified for each business activity classification is multiplied by the gross profit, and the average of the annual totals for the past three years is taken to be the amount corresponding to operational risk (Notification Regarding Capital Adequacy Ratio, Article 282).
(Billions of Yen)
Item As of March 31, 2017
Consolidated total required capital 2,683
Note: Consolidated total required capital is an amount that results from multiplying the denominator of the formula by 8% as stipulated in Notification Regarding Capital Adequacy Ratio, Article 2.

176 ANNUAL REPORT 2018 The Norinchukin Bank
CAPITAL ADEQUACY
Fiscal 2016 (Ended March 31, 2017)
Geographic Distribution of Exposure, Details in Significant Areas
by Major Types of Credit Exposure (Billions of Yen)
RegionsLoans, commit-
ments, off-balance sheet exposure
Securities Derivatives OthersTotal credit
risk exposureDefault
exposure
Japan 11,830 15,146 30 23,930 50,938 59
Asia except Japan 291 146 12 388 838 —
Europe 284 10,268 218 10,009 20,781 —
The Americas 841 18,012 38 15,239 34,131 —
Other areas 258 407 14 258 938 —
Amounts held by consolidated subsidiaries 1,268 28 — 54 1,352 5
Total 14,774 44,010 314 49,880 108,980 64
Industry Distribution of Exposure, Details by Major Types of Credit Exposure (Billions of Yen)
IndustriesLoans, commit-
ments, off-balancesheet exposure
Securities Derivatives OthersTotal credit risk
exposureDefault
exposure
Write-off of loans(amounts of partial
direct write-off)
Manufacturing 2,708 466 1 0 3,176 23 —
Agriculture 47 0 0 0 48 5 0
Forestry 6 — — — 6 0 —
Fishing 19 0 — 0 19 11 —
Mining 13 — — 0 13 — —
Construction 85 11 — 0 96 0 —
Utility 356 5 — 0 361 — —
Information/telecommunications 118 8 — 0 127 — —
Transportation 622 124 2 0 750 7 —
Wholesaling, retailing 1,500 121 0 0 1,622 7 —
Finance and insurance 2,696 7,824 310 49,566 60,396 0 —
Real estate 636 143 — 2 783 0 —
Services 1,482 82 0 1 1,565 3 0
Municipalities 39 0 — 0 39 — —
Other 3,171 35,192 — 255 38,619 0 —
Amounts held by consolidated subsidiaries 1,268 28 — 54 1,352 5 0
Total 14,774 44,010 314 49,880 108,980 64 1
Note: “Others” within “Finance and insurance” includes repo-type transactions, call loans, and certain other items.
Residual Contractual Maturity Breakdown of Credit Risk Exposure (Billions of Yen)
Terms to maturityLoans, commitments,
off-balance sheet exposure
Securities Derivatives OthersTotal credit
risk exposure
In 1 year 7,116 5,358 66 49,043 61,583
Over 1 year to 3 years 1,847 14,622 78 0 16,547
Over 3 years to 5 years 2,432 12,043 1 0 14,477
Over 5 years to 7 years 961 3,077 0 0 4,039
Over 7 years 1,146 7,133 168 0 8,448
No term to maturity 2 1,747 — 782 2,532
Amounts held by consolidated subsidiaries 1,268 28 — 54 1,352
Total 14,774 44,010 314 49,880 108,980
Credit Risk (Consolidated)
(Funds and securitization exposures are excluded)
1. Credit Risk Exposure

177ANNUAL REPORT 2018 The Norinchukin Bank
CAPITAL ADEQUACY
Notes: 1. The amount of credit exposure at the end of the period does not substantially differ from the average-risk position during fiscal 2016.2. The amounts of credit-risk exposure held by consolidated subsidiaries are extremely limited, amounting only to about 1% of consolidated risk exposure,
so only the total amounts held by these subsidiaries are shown.3. Within credit risk exposure, credit risk exposure subject to the Standardized Approach was ¥51.3 billion.4. Default exposure is classified in the Bank’s self-assessment as being under “Debtor Under Requirement of Control.”
2. Reserves for Possible Loan Losses
Increase/Decrease in General Reserve for Possible Loan Losses, Specific Reserve
for Possible Loan Losses and the Specific Reserve for Loans to Countries with
Financial Problems by Region (Billions of Yen)
Regions As of March 31, 2017 Increase/(decrease)
General reserve for possible loan losses 28 13
Specific reserve for possible loan losses 22 (12)
Japan 22 (12)
Asia except Japan — —
Europe — —
The Americas — —
Other areas — —
Amounts held by consolidated subsidiaries 3 0
Offsets on consolidation (1) 0
Specified reserve for loans to countries with financial problems — —
Total 53 1
Increase/Decrease in General Reserve for Possible Loan Losses, Specific Reserve
for Possible Loan Losses and the Specified Reserve for Loans to Countries with
Financial Problems by Industry (Billions of Yen)
Industries As of March 31, 2017 Increase/(decrease)
General reserve for possible loan losses 28 13
Specific reserve for possible loan losses 22 (12)
Manufacturing 7 2
Agriculture 4 0
Forestry 0 (0)
Fishing 5 (0)
Mining — —
Construction — (0)
Utility — —
Information/telecommunications — —
Transportation 1 (1)
Wholesaling, retailing 1 (0)
Finance and insurance 0 (0)
Real estate — (9)
Services 1 (3)
Municipalities — —
Other — —
Others — —
Amount held by consolidated subsidiaries 3 0
Offsets on consolidation (1) 0
Specified reserve for loans to countries with financial problems — —
Total 53 1
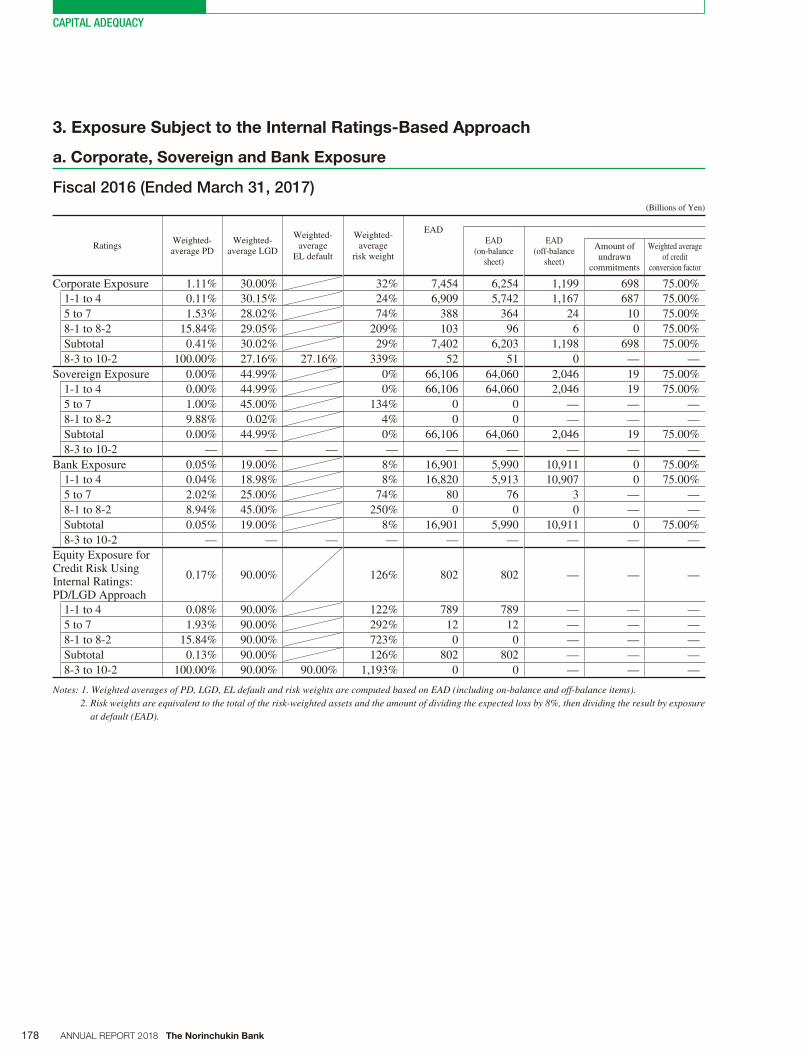
178 ANNUAL REPORT 2018 The Norinchukin Bank
CAPITAL ADEQUACY
Fiscal 2016 (Ended March 31, 2017)(Billions of Yen)
RatingsWeighted-average PD
Weighted-average LGD
Weighted-average
EL default
Weighted-average
risk weight
EAD EAD
(on-balance sheet)
EAD (off-balance
sheet)
Amount of undrawn
commitments
Weighted average of credit
conversion factor
Corporate Exposure 1.11% 30.00% 32% 7,454 6,254 1,199 698 75.00%
1-1 to 4 0.11% 30.15% 24% 6,909 5,742 1,167 687 75.00%
5 to 7 1.53% 28.02% 74% 388 364 24 10 75.00%
8-1 to 8-2 15.84% 29.05% 209% 103 96 6 0 75.00%
Subtotal 0.41% 30.02% 29% 7,402 6,203 1,198 698 75.00%
8-3 to 10-2 100.00% 27.16% 27.16% 339% 52 51 0 — —
Sovereign Exposure 0.00% 44.99% 0% 66,106 64,060 2,046 19 75.00%
1-1 to 4 0.00% 44.99% 0% 66,106 64,060 2,046 19 75.00%
5 to 7 1.00% 45.00% 134% 0 0 — — —
8-1 to 8-2 9.88% 0.02% 4% 0 0 — — —
Subtotal 0.00% 44.99% 0% 66,106 64,060 2,046 19 75.00%
8-3 to 10-2 — — — — — — — — —
Bank Exposure 0.05% 19.00% 8% 16,901 5,990 10,911 0 75.00%
1-1 to 4 0.04% 18.98% 8% 16,820 5,913 10,907 0 75.00%
5 to 7 2.02% 25.00% 74% 80 76 3 — —
8-1 to 8-2 8.94% 45.00% 250% 0 0 0 — —
Subtotal 0.05% 19.00% 8% 16,901 5,990 10,911 0 75.00%
8-3 to 10-2 — — — — — — — — —
Equity Exposure for Credit Risk Using Internal Ratings: PD/LGD Approach
0.17% 90.00% 126% 802 802 — — —
1-1 to 4 0.08% 90.00% 122% 789 789 — — —
5 to 7 1.93% 90.00% 292% 12 12 — — —
8-1 to 8-2 15.84% 90.00% 723% 0 0 — — —
Subtotal 0.13% 90.00% 126% 802 802 — — —
8-3 to 10-2 100.00% 90.00% 90.00% 1,193% 0 0 — — —
Notes: 1. Weighted averages of PD, LGD, EL default and risk weights are computed based on EAD (including on-balance and off-balance items).2. Risk weights are equivalent to the total of the risk-weighted assets and the amount of dividing the expected loss by 8%, then dividing the result by exposure
at default (EAD).
a. Corporate, Sovereign and Bank Exposure
3. Exposure Subject to the Internal Ratings-Based Approach

179ANNUAL REPORT 2018 The Norinchukin Bank
CAPITAL ADEQUACY
Details on PD, LGD, RW and EAD Assets
Fiscal 2016 (Ended March 31, 2017) (Billions of Yen)
Type of exposureWeighted-
average PD
Weighted-average
LGD
Weighted-average
ELdefault
Weighted-average
risk weight
EADEAD (on-balance sheet)
EAD (off-balancesheet)
Amount of undrawn
commitments
Weighted average of credit conversion factor
Retail exposure secured by residential properties
0.89% 49.00% 73.26% 39% 1,327 233 1,094 — —
Not default Not delinquent 0.36% 49.00% 32% 1,313 222 1,090 — —
Not default Delinquent 24.92% 47.91% 425% 9 6 2 — —
Not default Subtotal 0.53% 49.00% 35% 1,322 229 1,093 — —
Default 100.00% 73.26% 1,049% 4 4 0 — —
Qualifying revolving retail exposure — — — — — — — — —
Not default Not delinquent — — — — — — — —
Not default Delinquent — — — — — — — —
Not default Subtotal — — — — — — — —
Default — — — — — — — —
Other retail exposure 5.76% 60.01% 97.15% 128% 44 41 3 — —
Not default Not delinquent 0.81% 60.02% 61% 42 38 3 — —
Not default Delinquent 23.36% 57.47% 304% 0 0 0 — —
Not default Subtotal 0.91% 60.01% 63% 42 39 3 — —
Default 100.00% 97.15% 1,408% 2 2 0 — —
Total 1.05% 49.34% 80.73% 42% 1,372 274 1,097 — —
Not default Not delinquent 0.37% 49.35% 33% 1,355 261 1,094 — —
Not default Delinquent 24.90% 48.09% 423% 9 6 2 — —
Not default Subtotal 0.54% 49.34% 36% 1,365 268 1,096 — —
Default 100.00% 80.73% 1,161% 6 6 0 — —
Notes: 1. Purchased retail receivables in investment funds using estimated parameters have been included in the amount subject to quantitative disclosure.2. “Not default Delinquent” does not fall under the default definition in the Notification Regarding Capital Adequacy Ratio, but past-due.3. Risk weights are equivalent to the total of the risk-weighted assets and the amount of dividing the expected loss by 8%, then dividing the result by exposure
at default (EAD).4. For defaulted exposure, the risk weights have been computed taking account of the unexpected losses on default (LGD default) and the expected losses on
default (EL default).5. As of March 31, 2017, the Bank held no Qualifying revolving retail exposure for which net withdrawals of commitments had occurred.
c. Actual Losses on Exposure to Corporate, Sovereign, Bank and Retail Exposure
Actual Losses by Exposure Types (Billions of Yen)
Type of exposure As of March 31, 2017 Increase/(decrease)
Corporate exposure 4 2
Sovereign exposure — —
Bank exposure — —
Equity exposure subject to PD/LGD approach — (0)
Retail exposure secured by residential properties 0 (0)
Qualifying revolving retail exposure — —
Other retail exposure 0 0
Total 4 2
Note: Actual losses are defined as losses due to direct write-offs, partial direct write-offs, specific reserve for possible loan losses, general reserve for possible loan losses and loan sales of exposure that defaulted up to the end of the previous period.
b. Retail Exposure

180 ANNUAL REPORT 2018 The Norinchukin Bank
CAPITAL ADEQUACY
Comparison between Actual Losses in the Previous Fiscal Year and Past Financial
Results and Analysis of Causes
Comparison of Estimated Losses and Actual Losses (Billions of Yen)
Type of exposure
As of March 31, 2017 As of March 31, 2016 As of March 31, 2015
Estimated losses
Actual losses
Estimated losses
Actual losses
Estimated losses
Actual losses
Corporate exposure 14 4 15 1 17 3
Sovereign exposure 0 — 0 — 0 —
Bank exposure 1 — 0 — 0 —
Equity exposure subject to PD/LGD approach 0 — 0 0 0 1
Retail exposure secured by residential properties 2 0 2 0 2 0
Qualifying revolving retail exposure — — — — — —
Other retail exposure 0 0 0 0 0 0
Type of exposure
As of March 31, 2014 As of March 31, 2013 As of March 31, 2012
Estimated losses
Actual losses
Estimated losses
Actual losses
Estimated losses
Actual losses
Corporate exposure 20 0 24 1 42 9
Sovereign exposure 0 — 0 — 0 —
Bank exposure 1 — 0 — 0 —
Equity exposure subject to PD/LGD approach 0 — 0 — 2 0
Retail exposure secured by residential properties 2 0 1 0 1 1
Qualifying revolving retail exposure — — — — — —
Other retail exposure 0 0 1 0 0 0
Type of exposure
As of March 31, 2011 As of March 31, 2010 As of March 31, 2009
Estimated losses
Actual losses
Estimated losses
Actual losses
Estimated losses
Actual losses
Corporate exposure 73 7 55 43 46 25
Sovereign exposure 0 — 0 — 1 —
Bank exposure 0 — 0 — 0 —
Equity exposure subject to PD/LGD approach 3 0 1 0 0 0
Retail exposure secured by residential properties 1 0 1 0 1 0
Qualifying revolving retail exposure — — — — — —
Other retail exposure 0 0 0 0 0 0
Type of exposure
As of March 31, 2008
Estimated losses
Actual losses
Corporate exposure 29 7
Sovereign exposure 1 —
Bank exposure 0 —
Equity exposure subject to PD/LGD approach 1 0
Retail exposure secured by residential properties 1 0
Qualifying revolving retail exposure — —
Other retail exposure 0 0
Notes: 1. The scope of estimated and actual losses includes the following accounts on balance sheet: loans, foreign exchange, accrued interests in other assets, suspense payable and customers’ liabilities for acceptances and guarantees, as well as securities without quoted market values, money trusts without quoted market values, and monetary claims purchased.
2. Estimated losses of each year are amount of expected losses.
Although credit conditions have generally remained
favorable due to the recording of reserves for possible
loan losses caused by worsened credit conditions of some
entities for which the Bank provided loans, the total
value of actual losses for fiscal 2016 were up ¥2.3 billion
year-on-year.

181ANNUAL REPORT 2018 The Norinchukin Bank
CAPITAL ADEQUACY
d. Exposure to Specialized Lending Products Subject to Supervisory Slotting Criteria
by Risk Weight
Amount of Specialized Lending Exposure Subject to Supervisory Slotting Criteria
by Risk Weight (Billions of Yen)
Classification As of March 31, 2017
Specialized Lending exposure subject to supervisory slotting criteria 587
Specialized Lending, excluding High-Volatility Commercial Real Estate (HVCRE) 587
Risk weight of 50% 57
Risk weight of 70% 366
Risk weight of 90% 91
Risk weight of 115% 16
Risk weight of 250% 17
Risk weight of 0% (default) 38
High-Volatility Commercial Real Estate (HVCRE) —
Risk weight of 70% —
Risk weight of 95% —
Risk weight of 120% —
Risk weight of 140% —
Risk weight of 250% —
Risk weight of 0% (default) —
Notes: 1. “Specialized Lending” refers to loans for Project Finance (PF), Object Finance (OF), Commodity Finance (CF) and Income-Producing Real Estate (IPRE) (as defined in the Notification Regarding Capital Adequacy Ratio, Article 1-1-41).
2. “High-Volatility Commercial Real Estate (HVCRE)” refers to loans that are the financing of commercial real estate that exhibits a higher rate of loss volatility compared to other types of Specialized Lending, as specified in the Notification Regarding Capital Adequacy Ratio, Article 1-1-43.
3. “Specialized Lending exposure subject to supervisory slotting criteria” refers to the amounts of Specialized Lending, subject to the Bank’s internal rating system, and have been allotted to the risk asset classifications given in the Notification Regarding Capital Adequacy Ratio, Article 130-4 and Article 130-6, after taking account of risk weights.
4. For risk weights, the Bank has applied the stipulations contained in the Notification Regarding Capital Adequacy Ratio, Article 130-4 and Article 130-6.
e. Equity Exposure Subject to the Simple Risk-Weighted Method of the Market-Based
Approach by Risk Weight
Amount of Equity Exposure Subject to the Simple Risk-Weighted Method
of the Market-Based Approach (Billions of Yen)
Classification As of March 31, 2017
Equity exposure subject to the simple risk-weighted method of the market-based approach by RW 100
Risk weight of 300% —
Risk weight of 400% 100
Note: The “simple risk-weighted method of the market-based approach by RW” is a method for computing the amount of risk-weighted assets of equity and other investments. Under this method, the market value of listed stocks is multiplied by a risk weight of 300%, and the estimated value of unlisted stocks is multiplied by a risk weight of 400% (Notification Regarding Capital Adequacy Ratio, Article 143-4).

182 ANNUAL REPORT 2018 The Norinchukin Bank
CAPITAL ADEQUACY
4. Exposure Subject to Standardized Approach
Amount of Exposure Subject to Standardized Approach (Billions of Yen)
Classification
As of March 31, 2017
ExposureRefer to ECAI
Exposure subject to Standardized Approach 51 —
Risk weight of 0% 37 —
Risk weight of 10% — —
Risk weight of 20% 2 —
Risk weight of 35% — —
Risk weight of 50% — —
Risk weight of 75% — —
Risk weight of 100% 10 —
Risk weight of 150% — —
Risk weight of 1,250% — —
Others 1 —
Note: Others include investment funds which are measured credit risk assets by look-through approach and the assets which are more than 150% and less than 1,250% risk weight.
Credit Risk Mitigation Techniques (Consolidated)
Amount of Exposure Subject to Credit Risk Mitigation Techniques
(Eligible Financial Collateral, Other Eligible IRB Collateral, Guarantees, Credit
Derivatives) (Billions of Yen)
Classification As of March 31, 2017
Foundation Internal Ratings-Based Approach 9,692
Eligible financial collateral 8,940
Corporate exposure —
Sovereign exposure 0
Bank exposure 8,940
Other eligible IRB collateral —
Corporate exposure —
Sovereign exposure —
Bank exposure —
Guarantees, Credit Derivatives 751
Corporate exposure 405
Sovereign exposure 256
Bank exposure 89
Retail exposure secured by residential properties —
Qualifying revolving retail exposure —
Other retail exposure —
Standardized Approach —
Eligible financial collateral —
Guarantees, Credit Derivatives —
Note: Exposure subject to risk-weighted asset calculation for investment fund is not included.

183ANNUAL REPORT 2018 The Norinchukin Bank
CAPITAL ADEQUACY
Methods Used for Calculating Amount of Credit Exposure
The current exposure method has been adopted.
Breakdown of the Amount of Credit Exposure (Billions of Yen)
Classification As of March 31, 2017
Total gross replacement costs (limited to items with a value of greater than zero) (A) 420
Total gross add-ons (B) 576
Gross credit exposure (C) = (A)+(B) 997
Foreign exchange related 719
Interest rate related 277
Equity related 0
Credit derivatives —
Transactions with a long settlement period —
Reduction in credit exposure due to netting contracts (including collateral pledged for CSA)
(D) 250
Amount of credit exposure before taking into account credit risk mitigation techniques due to collateral
(E) = (C)–(D) 746
Amount of collateral (F) 292
Eligible financial collateral 292
Amount of credit exposure after taking into account credit risk mitigation techniques due to collateral
(G) = (E)–(F) 453
Notes: 1. Derivatives transactions included in risk-weighted assets calculation for investment funds are not included.2. Under the stipulations of the Notification Regarding Capital Adequacy Ratio, Article 56-1, the amount of credit exposure not computed has not been included.
Notional Principal Amount of Credit Derivatives Included in Computation of
Credit Exposure (Billions of Yen)
Classification As of March 31, 2017
To buy protection —
Credit default swaps —
Total return swaps —
To sell protection —
Credit default swaps —
Total return swaps —
Notional principal amount of credit derivatives taking into consideration the effect of credit risk mitigation techniques
—
Notes: 1. Credit derivatives included in risk-weighted assets for investment funds have not been taken into consideration.2. Under the stipulations of the Notification Regarding Capital Adequacy Ratio, Article 10-2, 3 and Article 56, the amount of credit risk assets not computed
has not been included.
Counterparty Credit Risk in Derivative Transactions (Consolidated)

184 ANNUAL REPORT 2018 The Norinchukin Bank
CAPITAL ADEQUACY
Securitization Exposure (Consolidated)
Details of Securitization Exposure Held as Originator (Billions of Yen)
Classification As of March 31, 2017
Total amount of underlying assets —
Amounts of assets held by securitization transactions purpose —
Amounts of securitized exposure —
Gains (losses) on sales of securitization transactions —
Amounts of securitization exposure —
Amounts of re-securitization exposure —
Increase in capital due to securitization transactions —
Amounts of securitization exposure that applied risk weight 1,250% —
Amounts of re-securitization exposure subject to credit risk mitigation techniques —
Details of Securitization Exposure Held as Investor by Exposure Type
Fiscal 2016 (Ended March 31, 2017) (Billions of Yen)
Classification
Total amount of securitization exposure
Amount of exposure Risk weight 1,250%
Re-securitization exposure
Amount of exposure
Risk weight 1,250%
Re-securitization products
(Secondary, tertiary)
Re-securitization products peculiar
to regulation
Amount of exposure 6,513 ( 0) 0 (—) 51 0 51 0
Individuals
Asset-Backed Securities (ABS) 1,071 (—) — (—) — — — —
Residential Mortgage-Backed Securities (RMBS) 2,336 (—) — (—) — — — —
Real estate
Commercial Mortgage-Backed Securities (CMBS) 66 (—) — (—) — — — —
Corporates
Subtotal of CDOs (CLO, ABS-CDO, CBO) 3,038 (—) 0 (—) 51 0 51 0
Collateralized Loan Obligations (CLO) 3,038 (—) — (—) 51 — 51 —
Asset-Backed Securities CDOs (ABS-CDO) 0 (—) 0 (—) 0 0 — 0
Collateralized Bond Obligations (CBO) — (—) — (—) — — — —
Others 0 ( 0) — (—) — — — —
Notes: 1. Re-securitization exposure refers to securitization exposure which contains securitization exposure as an underlying asset.2. The off-balance exposure has been described in parentheses. There is no re-securitization exposure of the off-balance.
1. Items to Calculate Risk-Weighted Asset for Credit Risk

185ANNUAL REPORT 2018 The Norinchukin Bank
CAPITAL ADEQUACY
Amount of Securitization Exposure Held as Investor and
Regulatory Required Capital by Risk-Weighted Category
Fiscal 2016 (Ended March 31, 2017) (Billions of Yen)
ClassificationAmount of exposure Regulatory required capital
On-balance Off-balance On-balance Off-balance
Amount of securitization exposure 6,461 6,461 0 40 40 0
Risk weight: 20% or less 6,442 6,442 — 39 39 —
Risk weight: exceeding 20% to 50% or less 6 6 — 0 0 —
Risk weight: exceeding 50% to 100% or less 12 12 — 1 1 —
Risk weight: exceeding 100% to 250% or less — — — — — —
Risk weight: exceeding 250% to less than 1,250% 0 — 0 0 — 0
Risk weight: 1,250% — — — — — —
Amount of re-securitization exposure 51 51 — 1 1 —
Risk weight: 20% or less — — — — — —
Risk weight: exceeding 20% to 50% or less 51 51 — 1 1 —
Risk weight: exceeding 50% to 100% or less — — — — — —
Risk weight: exceeding 100% to 250% or less — — — — — —
Risk weight: exceeding 250% to less than 1,250% — — — — — —
Risk weight: 1,250% 0 0 — 0 0 —
Amount of Re-Securitization Exposure Held as Investor and
Subject to Credit Risk Mitigation Techniques (Billions of Yen)
Classification
As of March 31, 2017
Amount of exposure
Regulatory required capital
Amount of re-securitization exposure — —
Risk weight applied to guarantor: 20% or less — —
Risk weight applied to guarantor: exceeding 20% to 50% or less — —
Risk weight applied to guarantor: exceeding 50% to 100% or less — —
Risk weight applied to guarantor: exceeding 100% to 250% or less — —
Risk weight applied to guarantor: exceeding 250% to less than 1,250% — —
Risk weight applied to guarantor: 1,250% — —
2. Securitization Exposure Subject to Market Risk
Not applicable

186 ANNUAL REPORT 2018 The Norinchukin Bank
CAPITAL ADEQUACY
■ VaR (Millions of Yen)
Fiscal 2016
Base date of computation 2017. 3. 31
VaR (For the most recent 60 business days)
Base date of computation 108
Maximum 128
Minimum 40
Average 65
■ Stress VaR (Millions of Yen)
Fiscal 2016
Base date of computation 2017. 3. 31
Stress VaR (For the most recent 60 business days)
Base date of computation 259
Maximum 311
Minimum 83
Average 191
■ Amount of Market Risk (Millions of Yen)
Fiscal 2016
For the portion computed with the internal models approach (B)+(G)+(J) (A) 769
Value at Risk (MAX (C, D)) (B) 195
Amount on base date of computation (C) 108
Amount determined by multiplying (E) by the average for the most recent 60 business days
(D) 195
(Multiplier) (E) 3.0
(Times exceeding VaR in back testing) (F) 2
Stress Value at Risk (MAX (H, I)) (G) 573
Amount on base date of computation (H) 259
Amount determined by multiplying (E) by the average for the most recent 60 business days
( I ) 573
Additional amount at the time of measuring individual risk ( J ) 0
Notes: 1. As a result of back testing conducted in fiscal 2016, actual gains and losses did not diverge substantially downward from the VaR value. 2. When discrepancies between the model’s estimates and actual results go beyond a certain number of times due to the design of the model, the Bank
scrutinizes the relevant model factors and revises the model if necessary.3. Since the Bank adopts a standardized approach, neither an additional risk nor a comprehensive risk of specific risks of trading account are the measure-
ment objects.
Market Risk (Consolidated)

187ANNUAL REPORT 2018 The Norinchukin Bank
CAPITAL ADEQUACY
Equity Exposure (Consolidated)
(Includes items such as shares; excludes items in trading accounts)
Amount on the Balance Sheet and Market Value (Billions of Yen)
Classification
As of March 31, 2017
Amount on the balance sheet
Market value
Equity exposure 1,250 /
Exposure to publicly traded equity 1,062 1,062
Exposure to privately held equity 187 /
Note: Regulatory adjustments in numerator provided for by Notification Regarding Capital Adequacy Ratio, Article 2 were not included.
Amount of Gain (Loss) due to Sale or Write-Off (Billions of Yen)
Item
Fiscal 2016
Gains from saleof equities, etc.
Losses from sales of equities, etc.
Write-offs of equities, etc.
Equity exposure 34 0 0
Note: Amounts reflect relevant figures posted in the consolidated income statements.
Amount of Valuation Gains (Losses) (Billions of Yen)
Item As of March 31, 2017
Amount of valuation gains (losses) recognized on the balance sheet and not recognized in the statements of operations
436
Notes: 1. Exposure is to equity shares issued by both domestic and overseas companies.2. Regulatory adjustments in numerator provided for by Notification Regarding Capital Adequacy Ratio, Article 2 were not included.
Unrealized Gains (Losses) Not Recognized on Consolidated Balance Sheets or
Consolidated Statements of Income
Not applicable
Equity Exposures for Each Portfolio Classification (Billions of Yen)
ClassificationAs of March 31, 2017
EAD
Equity portfolios 1,250
Equity portfolios subject to PD/LGD approaches 802
Equity portfolios subject to simple risk-weighted method 100
Equities under the internal models approach 346

188 ANNUAL REPORT 2018 The Norinchukin Bank
CAPITAL ADEQUACY
Interest Rate Risk Volume Computed with the Internal Model
in Core Business Accounts (Excluding Trading Accounts) (Billions of Yen)
Classification As of March 31, 2017
Interest rate risk 2,299
Yen interest rate risk 132
U.S. dollar interest rate risk 1,714
Euro interest rate risk 437
Interest rate risk in other currencies 14
Notes: 1. Interest rate risk, without taking into account inter-grid factors and correlations with other assets, calculates a one-year holding period and a historical observation period from 1995 to the most recent year of interest rate volatility. The Bank calculated declines in economic value corresponding to a 99% confidence interval for interest rate volatility. Because the interest rate risk of consolidated subsidiaries is limited from the standpoint of the asset value of subsidiaries, the non-consolidated risk of the Bank is calculated.
2. Regarding core deposits, since the balances of deposits, etc., without maturity dates are limited, the Bank does not currently measure their risk volume. In addition, regarding repayments of mortgage-backed securities and callable securities before maturity, risk volume is measured after taking account of negative convexity due to call conditions and other factors.
Interest Rate Risk (Consolidated)
(The increase or decrease of the profit and loss or in the economic value from interest rate shocks which are used for internal management purpose, in terms of interest rate risk excluding trading accounts.)

189ANNUAL REPORT 2018 The Norinchukin Bank
CAPITAL ADEQUACY
Indicators for Assessing Global Systemically Important
Banks (G-SIBs)
(In 0.1 Billion Yen)
Description As of March 31, 2017
1 Total exposures (A)+(B)+(C)+(D): (A) On-balance assets (other than assets specifically identified below (B), (C) and contra-account of guarantees) (B) Sum of counterparty exposure of derivatives contracts, capped notional amount of credit derivatives and
potential future exposure of derivatives contracts (C) Adjusted gross value of securities financing transactions (SFTs) and counterparty exposure of SFTs (D) Gross notional amount of off-balance sheet items (other than derivatives contracts and SFTs)
1,084,445
2 Intra-financial system assets (A)+(B)+(C)+(D): (A) Funds deposited with or lent to other financial institutions and undrawn committed lines extended to other
financial institutions (B) Holdings of securities issued by other financial institutions (Note 1) (C) Net positive current exposure of SFTs with other financial institutions (D) Over-the-counter (OTC) derivatives with other financial institutions that have a net positive fair value
104,631
3 Intra-financial system liabilities (A)+(B)+(C): (A) Deposits and debt due to, and undrawn committed lines obtained from, other financial institutions (B) Net negative current exposure of SFTs with other financial institutions (C) OTC derivatives with other financial institutions that have a net negative fair value
41,658
4 Securities outstanding (Note 1) 61,020 5 Assets under custody 42,906 6 Notional amount of OTC derivatives 305,733 7 Held-for-trading (HFT) securities and available-for-sale (AFS) securities, excluding HFT and AFS securities that
meet the definition of Level 1 assets and Level 2 assets with haircuts (Note 2) 136,410
8 Level 3 assets (Note 3) 11,703 9 Cross-jurisdictional claims 536,49210 Cross-jurisdictional liabilities 228,377
Description Fiscal 2016
11 Payments (settled through the BOJ-NET, the Japanese Banks’ Payment Clearing Network and other similar settlement systems, excluding intragroup payments)
8,236,236
12 Underwritten transactions in debt and equity markets (Note 4) 170
Notes: 1. Securities refer to secured debt securities, senior unsecured debt securities, subordinated debt securities, commercial paper, certificate of deposits, and common equities.
2. Level 1 and Level 2 assets with haircuts are defined in the Basel III Liquidity Coverage Ratio (LCR).3. The amount is calculated in accordance with the International Financial Reporting Standards.4. This refers to underwriting of securities defined in Article 2 Paragraph 8 Item 6 of the Financial Instruments and Exchange Act.

190 ANNUAL REPORT 2018 The Norinchukin Bank
CAPITAL ADEQUACY
(In Million Yen, %)
Corresponding line # on Basel III
disclosure template (Table 2) (*)
Corresponding line # on Basel III
disclosure template (Table 1) (*)
Items As of March 31, 2018
As of March 31, 2017
On-balance sheet exposures (1)
1 On-balance sheet exposures before deducting adjustment items 102,618,948 105,152,671
1a 1 Total assets reported in the consolidated balance sheet 104,927,769 107,062,747
1b 2The amount of assets of subsidiaries that are not included in the scope of the leverage ratio on a consolidated basis (–)
1c 7The amount of assets of subsidiaries that are included in the scope of the leverage ratio on a consolidated basis (except those included in the total assets reported in the consolidated balance sheet)
— —
1d 3The amount of assets that are deducted from the total assets reported in the consolidated balance sheet (except adjustment items) (–)
2,308,820 1,910,076
2 7 The amount of adjustment items pertaining to Tier 1 capital (–) 147,928 112,915
3 Total on-balance sheet exposures (a) 102,471,020 105,039,756
Exposures related to derivative transactions (2)
4 Replacement cost associated with derivatives transactions, etc. 487,036 314,857
5 Add-on amount associated with derivatives transactions, etc. 442,777 428,062
The amount of receivables arising from providing cash marginin relation to derivatives transactions, etc.
141,765 154,189
6The amount of receivables arising from providing cash margin, provided where deducted from the consolidated balance sheet pursuant to the operative accounting framework
— —
7The amount of deductions of receivables (out of those arising from providing cash variation margin) (–)
— —
8The amount of client-cleared trade exposures for which a bank or bank holding company acting as clearing member is not obliged to make any indemnification (–)
9 Adjusted effective notional amount of written credit derivatives — —
10The amount of deductions from effective notional amount of writtencredit derivatives (–)
— —
11 4 Total exposures related to derivative transactions (b) 1,071,579 897,109
Exposures related to repo transactions (3)
12 The amount of assets related to repo transactions, etc. 89,463 118,494
13 The amount of deductions from the assets above (line 12) (–) — —
14 The exposures for counterparty credit risk for repo transactions, etc. 599,252 486,837
15 The exposures for agent repo transaction
16 5 The Total exposures related to repo transactions, etc. (c) 688,716 605,332
Exposures related to off-balance sheet transactions (4)
17 Notional amount of off-balance sheet transactions 3,848,872 3,333,877
18The amount of adjustments for conversion in relation to off-balance sheet transactions (–)
1,527,861 1,390,219
19 6 Total exposures related to off-balance sheet transactions (d) 2,321,011 1,943,657
Leverage ratio on a consolidated basis (5)
20 The amount of capital (Tier 1 capital) (e) 6,432,621 6,489,114
21 8 Total exposures ((a)+(b)+(c)+(d)) (f) 106,552,327 108,485,856
22 Leverage ratio on a consolidated basis ((e)/(f)) 6.03% 5.98%
Composition of Leverage Ratio Disclosure (Consolidated)

191ANNUAL REPORT 2018 The Norinchukin Bank
CAPITAL ADEQUACY
(Unit: Millions of Yen, %, the Number of Items)
Items The current quarter (January 1 to March 31, 2018)
The previous quarter (October 1 to December 31, 2017)
High-quality liquid assets (1)
1 Total high-quality liquid assets 35,326,846 36,412,857
Cash outflows (2)
Amount before multiplying a cash outflow
ratio
Amount after multiplying a cash outflow
ratio
Amount before multiplying a cash outflow
ratio
Amount after multiplying a cash outflow
ratio
2 Cash outflows relating to unsecured retail funding 64,950 6,482 59,263 5,941
3 of which: stable deposits 362 11 359 11
4 of which: quasi-stable deposits 64,587 6,471 58,904 5,930
5 Cash outflows relating to unsecured wholesale funding 10,950,578 8,046,631 11,053,588 8,149,139
6 of which: qualifying operational deposits 0 0 0 0
7of which: capital relating to unsecured wholesale funding, excluding qualifying operational deposits and debt securities
9,707,695 6,803,749 9,928,897 7,024,447
8 of which: debt securities 1,242,883 1,242,883 1,124,692 1,124,692
9 Cash outflows relating to secured funding, etc. 231,830 259,727
10Cash outflows relating to funding programs and credit/liquidity facilities such as derivative transactions, etc.
2,597,219 1,554,316 2,733,287 1,693,107
11 of which: cash outflows relating to derivative transactions 1,310,321 1,310,321 1,445,176 1,445,176
12 of which: cash outflows relating to funding programs 0 0 0 0
13 of which: cash outflows relating to credit/liquidity facilities 1,286,898 243,995 1,288,111 247,931
14 Cash outflows based on an obligation to provide capital 4,753,481 483,955 4,511,656 235,344
15 Cash outflows relating to contingencies 4,487,830 187,672 4,293,695 165,037
16 Total cash outflows 10,510,886 10,508,295
Cash inflows (3)
Amount before multiplying a cash outflow
ratio
Amount after multiplying a cash outflow
ratio
Amount before multiplying a cash outflow
ratio
Amount after multiplying a cash outflow
ratio
17 Cash inflows relating to secured fund management, etc. 1,217,183 0 1,139,727 0
18 Cash inflows relating to collections of advances, etc. 4,481,538 3,925,059 4,442,392 3,924,015
19 Other cash inflows 5,825,485 774,977 5,890,927 483,352
20 Total cash inflows 11,524,205 4,700,036 11,473,046 4,407,366
Liquidity coverage ratio on a consolidated basis (4)
21 Sum of high-quality liquid assets that can be included 35,326,846 36,412,857
22 Net cash outflows 5,810,850 6,100,928
23 Liquidity coverage ratio on a consolidated basis 607.9% 596.8%
24 The number of data for calculating the average value 59 62
Quantitative Disclosure Items Concerning a Liquidity Coverage Ratio on a
Consolidated Basis
Items concerning a change in the con-
solidated liquidity coverage ratio on a
time-series basis
The consolidated liquidity coverage ratio for the current
quarter maintained a high and stable level.
Items concerning evaluation of the level of
the consolidated liquidity coverage ratio
The consolidated liquidity coverage ratio for the current
quarter has tended to be well above the minimum level.
Qualitative Disclosure Items Concerning a Liquidity Coverage Ratio on a
Consolidated BasisItems concerning the details of the sum
of high-quality liquid assets that can be
included
In light of the Bank’s liquidity coverage ratio, there is no
material item.
Other items concerning the consolidated
liquidity coverage ratio
In light of the Bank’s liquidity coverage ratio, there is no
material item.

192 ANNUAL REPORT 2018 The Norinchukin Bank
CAPITAL ADEQUACY
(Millions of Yen, %)
Basel III Template No. Items As of March 31,
2018
Amounts excluded under
transitional arrangements
As of March 31, 2017
Amounts excluded under
transitional arrangements
Ref. No.
Common Equity Tier 1 capital: instruments and reserves
1a+2-26Directly issued qualifying common share capital plus related capital surplus and retained earnings
5,308,106 5,248,636
1a of which: capital and capital surplus 3,455,509 3,455,509 E1.1+E1.2
2 of which: retained earnings 1,923,097 1,862,634 E2
26 of which: cash dividends to be paid 70,500 69,507
of which: other than the above — — E3
3Valuation and translation adjustments and other disclosed reserves
1,225,668 1,256,883 314,220 E4
Total of items included in Common Equity Tier 1 capital: instruments and reserves under phase-out arrangements
—
6Common Equity Tier 1 capital: instruments and reserves (A)
6,533,774 6,505,519
Common Equity Tier 1 capital: regulatory adjustments
8+9Total intangible assets (net of related tax liability, excluding those relating to mortgage servicing rights)
28,931 16,429 4,107
8of which: goodwill (net of related tax liability, including those equivalent)
— — — A1.1+A1.2
9of which: other intangible assets other than goodwill and mortgage servicing rights (net of related tax liability)
28,931 16,429 4,107 A2.1-A2.2
10Deferred tax assets that rely on future profit-ability excluding those arising from temporary differences (net of related tax liability)
— — —
11Deferred gains or losses on derivatives under hedge accounting
88,989 15,423 3,855 E7
12 Shortfall of eligible provisions to expected losses 14,701 11,506 2,876
13 Securitization gain on sale — — —
14Gains and losses due to changes in own credit risk on fair valued liabilities
— — —
15Defined-benefit pension fund net assets (prepaid pension costs)
15,043 7,458 1,864 A3-D3
16Investments in own shares (excluding those reported in the Net Assets section)
— — — A4
17 Reciprocal cross-holdings in common equity — — — A5
18
Investments in the capital of banking, financial and insurance entities that are outside the scope of regulatory consolidation (“Other Financial Institutions”), net of eligible short positions, where the bank does not own more than 10% of the issued share capital
— — — A6
19+20+21Amount exceeding the 10% threshold on speci-fied items
— — —
19of which: significant investments in the com-mon stock of financials
— — — A7
20 of which: mortgage servicing rights — — — A8
21of which: deferred tax assets arising from temporary differences (net of related tax liability)
— — —
Capital Ratio Information (Non-Consolidated)
Composition of Capital (Non-Consolidated)
Capital Adequacy (Non-Consolidated)

193ANNUAL REPORT 2018 The Norinchukin Bank
CAPITAL ADEQUACY
(Millions of Yen, %)
Basel III Template No. Items As of March 31,
2018
Amounts excluded under
transitional arrangements
As of March 31, 2017
Amounts excluded under
transitional arrangements
Ref. No.
22Amount exceeding the 15% threshold on speci-fied items
— — —
23of which: significant investments in the com-mon stock of financials
— — — A9
24 of which: mortgage servicing rights — — — A10
25of which: deferred tax assets arising from tem-porary differences (net of related tax liability)
— — —
27Regulatory adjustments applied to Common Equity Tier 1 due to insufficient Additional Tier 1 and Tier 2 to cover deductions
— —
28Common Equity Tier 1 capital: regulatory adjust-ments (B)
147,666 50,818
Common Equity Tier 1 capital (CET1)
29Common Equity Tier 1 capital (CET1) ((A)-(B)) (C)
6,386,108 6,454,700
Additional Tier 1 capital: instruments
30
31a
Directly issued qualifying Additional Tier 1 instruments plus related capital surplus of which: classified as equity under applicable accounting standards and the breakdown
49,999 49,000 E5.1+E5.2
32
Directly issued qualifying Additional Tier 1 instruments plus related capital surplus of which: classified as liabilities under applicable account-ing standards
— — D1
Qualifying Additional Tier 1 instruments plus related capital surplus issued by special purpose vehicles and other equivalent entities
— —
33+35Eligible Tier 1 capital instruments under phase-out arrangements included in Additional Tier 1 capital: instruments
— 499
Total of items included in Additional Tier 1 capital: instruments under phase-out arrangements
2
of which: amounts of counted in to base instru-ments of Additional Tier 1 under phase-out arrangements that related valuation and transla-tion adjustments
2
36 Additional Tier 1 capital: instruments (D) 49,999 49,502
Additional Tier 1 capital: regulatory adjustments
37 Investments in own Additional Tier 1 instruments — — — A11
38Reciprocal cross-holdings in Additional Tier 1 instruments
— — — A12
39
Investments in the capital of banking, financial and insurance entities that are outside the scope of regulatory consolidation, net of eligible short positions, where the bank does not own more than 10% of the issued common share capital of the entity (amount above 10% threshold)
— — — A13
40
Significant investments in the capital of banking, financial and insurance entities that are outside the scope of regulatory consolidation (net of eligible short positions)
39,041 31,233 7,808 A14
Total of items included in Additional Tier 1 capital: regulatory adjustments under phase-out arrangements
1,438
of which: 50% of balance due to pay of eligible provisions
1,438

194 ANNUAL REPORT 2018 The Norinchukin Bank
CAPITAL ADEQUACY
(Millions of Yen, %)
Basel III Template No. Items As of March 31,
2018
Amounts excluded under
transitional arrangements
As of March 31, 2017
Amounts excluded under
transitional arrangements
Ref. No.
42Regulatory adjustments applied to Additional Tier 1 due to insufficient Tier 2 to cover deductions
— —
43Additional Tier 1 capital: regulatory adjustments (E)
39,041 32,671
Additional Tier 1 capital (AT1)
44 Additional Tier 1 capital (AT1) ((D)-(E)) (F) 10,958 16,830
Tier 1 capital (T1=CET1+AT1)
45 Tier 1 capital (T1=CET1+AT1) ((C)+(F)) (G) 6,397,066 6,471,531
Tier 2 capital: instruments and provisions
46
Directly issued qualifying Tier 2 instruments plus related capital surplus of which: classified as equity under applicable accounting standards and its breakdown
— — E6
Directly issued qualifying Tier 2 instruments plus related capital surplus of which: classified as liabilities under applicable accounting standards
1,415,480 1,415,480 D2
Tier 2 instruments plus related capital surplus issued by special purpose vehicles and other equivalent entities
— —
47+49Eligible Tier 2 capital instruments under phase-out arrangements included in Tier 2: instruments and provisions
97,816 97,816
50Total of general reserve for possible loan losses and eligible provisions included in Tier 2
30 7
50aof which: general reserve for possible loan losses
30 7 A15
50b of which: eligible provisions — — A16
Total of items included in Tier 2 capital: instruments and provisions under phase-out arrangements
192,720
of which: amounts of counted in to base instruments of Tier 2 under phase-out arrange-ments that related valuation and translation adjustments
192,720
51 Tier 2 capital: instruments and provisions (H) 1,513,326 1,706,023
Tier 2 capital: regulatory adjustments
52 Investments in own Tier 2 instruments — — — A17
53 Reciprocal cross-holdings in Tier 2 instruments — — — A18
54
Investments in the capital of banking, financial and insurance entities that are outside the scope of regulatory consolidation, net of eligible short positions, where the bank does not own more than 10% of the issued common share capital of the entity (amount above the 10% threshold)
— — — A19
55
Significant investments in the capital banking, financial and insurance entities that are outside the scope of regulatory consolidation (net of eligible short positions)
— — — A20
Total of items included in Tier 2 capital: regula-tory adjustments under phase-out arrangements
1,438
of which: 50% of balance due to pay of eligible provisions
1,438
57 Tier 2 capital: regulatory adjustments (I) — 1,438

195ANNUAL REPORT 2018 The Norinchukin Bank
CAPITAL ADEQUACY
(Millions of Yen, %)
Basel III Template No. Items As of March 31,
2018
Amounts excluded under
transitional arrangements
As of March 31, 2017
Amounts excluded under
transitional arrangements
Ref. No.
Tier 2 capital (T2)
58 Tier 2 capital (T2) ((H)-(I)) (J) 1,513,326 1,704,585
Total capital (TC=T1+T2)
59 Total capital (TC=T1+T2) ((G) + (J)) (K) 7,910,393 8,176,116
Risk weighted assets
Total of items included in risk weighted assets under phase-out arrangements
17,926
of which: intangibles assets other than mortgage servicing rights
4,107
of which: prepaid pension costs 1,864
of which: significant investments in the Additional Tier 1 capital of Other Financial Institutions (net of eligible short positions)
11,954
60 Risk weighted assets (L) 33,259,570 33,231,785
Capital ratio (non-consolidated)
61Common Equity Tier 1 capital ratio (non-consolidated) ((C)/(L))
19.20% 19.42%
62 Tier 1 capital ratio (non-consolidated) ((G)/(L)) 19.23% 19.47%
63 Total capital ratio (non-consolidated) ((K)/(L)) 23.78% 24.60%
Regulatory adjustments
72Non-significant investments in the capital of Other Financial Institutions that are below the thresholds for deduction (before risk weighting)
314,254 347,726 A21.1+A21.2
73Significant investments in the common stock of Other Financial Institutions that are below the thresholds for deduction (before risk weighting)
18,489 67,401 A22
74Mortgage servicing rights that are below the thresholds for deduction (before risk weighting)
— — A23
75Deferred tax assets arising from temporary differ-ences that are below the thresholds for deduction (before risk weighting)
— —
Provisions included in Tier 2 capital: instruments and provisions
76Provisions (general reserve for possible loan losses)
30 7
77Cap on inclusion of provisions (general reserve for possible loan losses)
374 89
78
Provisions eligible for inclusion in Tier 2 in respect of exposures subject to internal ratings-based approach (prior to application of cap) (if the amount is negative, report as “nil”)
— —
79Cap for inclusion of provisions in Tier 2 under internal ratings-based approach
186,541 182,328
Capital instruments under phase-out arrangements
82Current cap on Additional Tier 1 instruments under phase-out arrangements
— 499
83
Amount excluded from Additional Tier 1 due to cap (excess over cap after redemptions and maturities) (if the amount is negative, report as “nil”)
— 499
84Current cap on Tier 2 instruments under phase-out arrangements
614,402 768,003
85Amount excluded from Tier 2 due to cap (excess over cap after redemptions and maturities) (if the amount is negative, report as “nil”)
— —

196 ANNUAL REPORT 2018 The Norinchukin Bank
CAPITAL ADEQUACY
OV1: Overview of RWA (Non-Consolidated)(Millions of Yen)
Basel IIITemplate
No.
a b c dRWA Minimum capital requirements
March 31, 2018 March 31, 2017 March 31, 2018 March 31, 2017
1 Credit risk (excluding counterparty credit risk) 4,629,601 4,575,347 391,761 387,220
2 Of which: standardized approach (SA) 29,963 7,147 2,397 571
3 Of which: internal rating-based (IRB) approach 4,456,982 4,415,063 377,952 374,397
Of which: significant investments — — — —
Of which: estimated residual value of lease transactions — — — —
Others 142,656 153,136 11,412 12,250
4 Counterparty credit risk (CCR) 480,954 429,984 39,555 35,190
5Of which: standardized approach for counterparty credit risk (SA-CCR)
— — — —
Of which: current exposure method (CEM) 42,302 37,480 3,587 3,178
6 Of which: expected positive exposure (EPE) method — — — —
Of which: credit valuation adjustment (CVA) 64,705 57,765 5,176 4,621
Of which: Central counterparty related exposure (CCP) 191,435 207,338 15,314 16,587
Others 182,511 127,400 15,476 10,803
7 Equity positions in banking book under market-based approach 1,589,624 1,406,741 134,800 119,291
Equity investments in funds (SA) — — — —
Equity investments in funds (IRB) 22,364,471 21,860,102 1,896,483 1,853,713
11 Settlement risk 0 — 0 —
12 Securitization exposures in banking book 518,665 496,098 43,982 42,069
13Of which: IRB ratings-based approach (RBA) or IRB internal assessment approach (IAA)
518,665 494,333 43,982 41,919
14 Of which: IRB Supervisory Formula Approach (SFA) — 1,764 — 149
15 Of which: Standardized approach (SA) — — — —
Of which: 1,250% risk weight is applied 0 0 0 0
16 Market risk 1,197,002 1,702,320 95,760 136,185
17 Of which: standardized approach (SA) 1,171,398 1,692,705 93,711 135,416
18 Of which: internal model approaches (IMA) 25,604 9,614 2,048 769
19 Operational risk 681,275 864,361 54,502 69,148
20 Of which: Basic Indicator Approach — — — —
21 Of which: Standardized Approach 681,275 864,361 54,502 69,148
22 Of which: Advanced Measurement Approach — — — —
23 Amounts below the thresholds for deduction 46,223 168,503 3,919 14,289
Risk weighted assets subject to transitional arrangements 17,926 1,434
24 Floor adjustment — — — —
25 Total 31,507,820 31,521,385 2,660,765 2,658,542

197ANNUAL REPORT 2018 The Norinchukin Bank
CAPITAL ADEQUACY
Explanation on Reconciliation between Balance Sheet Items and
Regulatory Capital Elements (Non-Consolidated)
As of March 31, 2018 (Millions of Yen)
Items
Non-Consolidated balance sheet
amount
Balance sheet amount based on regulatory
scope of consolidation
Ref. No.
(Assets)
Loans and Bills Discounted 11,742,630Loans on deeds 10,168,870Loans on bills 401,018Overdrafts 1,169,670Bills discounted 3,070
Including non-significant investments in the capital instruments of other financial institutions 103,000Tier 2 capital instruments — Non-significant investments in the capital instruments of other financial institutions not subject to deduction
103,000 A21.1
Foreign Exchanges Assets 324,698Due from foreign banks 324,698
Securities 52,332,765 52,332,759Japanese government bonds 11,612,797 11,612,797Municipal government bonds 83 83Short-term corporate bonds — —Corporate bonds 679,893 679,893Stocks 891,488 891,488Other securities 39,148,501 39,148,495
Money Held in Trust 7,438,320 7,438,320Securities and Money Held in Trust of which: goodwill and those equivalents (excluding those reported in the Intangible Fixed Assets)
— A1.1
Securities and Money Held in Trust of which: investments in own capital instruments — —
Common Equity (excluding those reported in the Net Assets section) — A4
Additional Tier 1 capital — A11
Tier 2 capital — A17
Securities and Money Held in Trust of which: reciprocal cross-holdings in capital instruments
— —
Common Equity — A5
Additional Tier 1 capital — A12
Tier 2 capital — A18
Securities and Money Held in Trust of which: investments in the instruments of banking, financial and insurance entities that are outside the scope of regulatory consolidation, where the bank does not own more than 10% of the issued share capital
211,254 —
Common Equity — A6
Additional Tier 1 capital — A13
Tier 2 capital — A19
Non-significant investments in the capital of other financials that are below the thresh-olds for deduction (before risk weighting)
211,254 A21.2
Securities and Money Held in Trust of which: significant investments in the common stock of banking, financial and insurance entities that are outside the scope of regulatory consolidation (net of eligible short positions)
57,530 —
Amount exceeding the 10% threshold on specified items A7
Amount exceeding the 15% threshold on specified items — A9
Additional Tier 1 capital 39,041 A14
Tier 2 capital — A20
Significant investments in the common stock of financials that are below the thresholds for deduction (before risk weighting)
18,489 A22

198 ANNUAL REPORT 2018 The Norinchukin Bank
CAPITAL ADEQUACY
(Millions of Yen)
Items
Non-Consolidated balance sheet
amount
Balance sheet amount based on regulatory
scope of consolidation
Ref. No.
Trading Assets 8,582Trading securities 3,064Derivatives of trading securities —Derivatives of securities related to trading transactions 24Trading-related financial derivatives 5,493
Monetary Claims Bought 354,872Call Loans 630,000Receivables under Resale Agreements —Cash and Due from Banks 28,729,996
Cash 55,871Due from banks 28,674,125
Other Assets 1,580,600Domestic exchange settlement account, debit 35Prepaid expenses 411Accrued income 172,228Initial margins of futures markets 4,063Valuation margins of futures markets —Derivatives other than for trading 597,343Cash collateral paid for financial instruments 137,702Others 668,814
Tangible Fixed Assets 120,920Buildings 46,873Land 47,280Lease assets 23,099Construction in progress 5Other 3,661
Intangible Fixed Assets 40,043 40,043Software 22,145 22,145Lease assets 6,274 6,274Other 11,623 11,623
of which: goodwill and those equivalents (excluding those reported in the Net Assets section)
— A1.2
of which: other intangible assets other than goodwill and mortgage servicing rights 40,043 A2.1
of which: amount that corresponds to effective tax rate to other intangible assets other than goodwill and mortgage servicing rights
11,112 A2.2
of which: mortgage servicing rights (net of related deferred tax liabilities) — —
Amount exceeding the 10% threshold on specified items — A8
Amount exceeding the 15% threshold on specified items — A10
Amount below the thresholds for deduction (before risk weighting) — A23
Defined-benefit pension fund net assets (prepaid pension costs) 20,821 20,821 A3
Customers’ Liabilities for Acceptances and Guarantees 141,073Reserve for Possible Loan Losses (46,681) (46,681)
of which: general reserve for possible loan losses includes Tier 2 (30) A15
of which: eligible provisions includes Tier 2 — A16
Reserve for Possible Investment Losses (1,032)Total Assets 103,417,613

199ANNUAL REPORT 2018 The Norinchukin Bank
CAPITAL ADEQUACY
(Millions of Yen)
Items
Non-Consolidated balance sheet
amount
Balance sheet amount based on regulatory
scope of consolidation
Ref. No.
(Liabilities)
Deposits 65,823,858Time deposits 56,839,908Deposits at notice 32,094Ordinary deposits 3,442,679Current deposits 97,820Other deposits 5,411,355
Negotiable Certificates of Deposit 2,920,656Debentures 1,774,498
Debentures issued 1,774,498Trading Liabilities 5,034
Derivatives of securities related to trading transactions 18Trading-related financial derivatives 5,015
Borrowed Money 4,585,004 4,585,004Borrowings 4,585,004 4,585,004
of which: qualifying Additional Tier 1 instruments — D1
of which: qualifying Tier 2 instruments 1,415,480 D2
Call Money —Payables under Repurchase Agreements 15,080,638Payables under Securities Lending Transactions —Foreign Exchanges Liabilities 38
Foreign bills payable 38Trust Money 1,405,187Other Liabilities 4,528,441
Domestic exchange settlement account, credit 613Accrued expenses 66,461Income taxes payable 613Unearned income 1,103Employees’ deposits 8,672Variation margins of futures markets 64Derivatives other than for trading 214,744Cash collateral received for financial instruments 419,712Lease liabilities 27,100Account payables for securities purchased 3,773,492Others 15,863
Reserve for Bonus Payments 6,022Reserve for Employees’ Retirement Benefits 24,614Reserve for Directors’ Retirement Benefits 1,121Reserve for Agriculture, Fishery and Forestry Industry Subsidies —Deferred Tax Liabilities 458,731 458,731
of which: prepaid pension cost 5,777 D3
Deferred Tax Liabilities for Land Revaluation 8,607Acceptances and Guarantees 141,073Total Liabilities 96,763,528

200 ANNUAL REPORT 2018 The Norinchukin Bank
CAPITAL ADEQUACY
(Millions of Yen)
Items
Non-Consolidated balance sheet
amount
Balance sheet amount based on regulatory
scope of consolidation
Ref. No.
(Net Assets)
Paid-in Capital 3,480,488 3,480,488Common equity 3,455,488 3,455,488 E1.1
of which: lower dividend rate stock 3,029,771 3,029,771Preferred stock 24,999 24,999
of which: directly issued qualifying Additional Tier 1 instruments plus related capital surplus of which classified as equity under applicable accounting standards
24,999 E5.1
Capital Surplus 25,020 25,020Capital surplus 24,999 24,999
of which: directly issued qualifying Additional Tier 1 instruments plus related capital surplus of which classified as equity under applicable accounting standards
24,999 E5.2
Other capital surplus 20 20 E1.2
Reserve for revaluation 20 20Retained Earnings 1,922,906 1,923,097 E2
Legal reserves 709,566 709,566Voluntary reserves 1,213,340 1,213,531
Special reserves 277,500 277,500General reserves 559,403 559,403Reserves for tax basis adjustments of fixed assets 7,343 7,343Others 7 7Unappropriated retained earnings 369,086 369,277
Net income 129,960 129,970Total Owners’ Equity 5,428,416 5,428,612
of which: others — E3
of which: directly issued qualifying Tier 2 instruments plus related capital surplus of which classified as equity under applicable accounting standards
— E6
Net Unrealized Gains on Other Securities 1,151,642 1,151,642Net Deferred Losses on Hedging Instruments 59,713 59,713
of which: net deferred losses on hedge 88,989 E7
Revaluation Reserve for Land, net of taxes 14,312 14,312Foreign Currency Translation Adjustment (0)Total Valuation and Translation Adjustment 1,225,668 1,225,668 E4
Total Net Assets 6,654,084Total Liabilities and Net Assets 103,417,613
Note: “Balance sheet amount based on regulatory scope of consolidation” refers only to the items used in calculating capital adequacy.
IRRBB1 – Quantitative information on IRRBB (Millions of Yen)
No.a b c d
⊿EVE ⊿NIIFiscal 2017 Fiscal 2016 Fiscal 2017 Fiscal 2016
1 Parallel up 2,414,759 215,4872 Parallel down (910,955) (134,632)3 Steepener 744,2334 Flattener (75,925)5 Short rate up 635,8736 Short rate down (246,169)7 Maximum 2,414,759 215,487
e fFiscal 2017 Fiscal 2016
8 Tier 1 capital 6,397,066 6,471,531

201ANNUAL REPORT 2018 The Norinchukin Bank
CAPITAL ADEQUACY
Explanation on Reconciliation between Balance Sheet Items and
Regulatory Capital Elements (Non-Consolidated)
As of March 31, 2017 (Millions of Yen)
Items
Non-Consolidated balance sheet
amount
Balance sheet amount based on regulatory
scope of consolidation
Ref. No.
(Assets)
Loans and Bills Discounted 11,948,542
Loans on deeds 10,476,391
Loans on bills 370,443
Overdrafts 1,099,295
Bills discounted 2,411
Including non-significant investments in the capital instruments of other financial institutions 103,000
Tier 2 capital instruments —
Non-significant investments in the capital instruments of other financial institutions not subject to deduction
103,000 A21.1
Foreign Exchanges Assets 224,101
Due from foreign banks 224,101
Securities 62,108,251 62,108,246
Japanese government bonds 13,166,759 13,166,759
Municipal government bonds 148 148
Short-term corporate bonds 150,000 150,000
Corporate bonds 272,622 272,622
Stocks 881,571 881,571
Other securities 47,637,150 47,637,144
Money Held in Trust 6,982,774 6,982,774Securities and Money Held in Trust of which: goodwill and those equivalents (excluding those reported in the Intangible Fixed Assets)
— A1.1
Securities and Money Held in Trust of which: investments in own capital instruments — —
Common Equity (excluding those reported in the Net Assets section) — A4
Additional Tier 1 capital — A11
Tier 2 capital — A17
Securities and Money Held in Trust of which: reciprocal cross-holdings in capital instruments
— —
Common Equity — A5
Additional Tier 1 capital — A12
Tier 2 capital — A18
Securities and Money Held in Trust of which: investments in the instruments of banking, financial and insurance entities that are outside the scope of regulatory consolidation, where the bank does not own more than 10% of the issued share capital
244,726 —
Common Equity — A6
Additional Tier 1 capital — A13
Tier 2 capital — A19
Non-significant investments in the capital of other financials that are below the thresh-olds for deduction (before risk weighting)
244,726 A21.2
Securities and Money Held in Trust of which: significant investments in the common stock of banking, financial and insurance entities that are outside the scope of regulatory consolidation (net of eligible short positions)
106,442 —
Amount exceeding the 10% threshold on specified items — A7
Amount exceeding the 15% threshold on specified items — A9
Additional Tier 1 capital 39,041 A14
Tier 2 capital — A20
Significant investments in the common stock of financials that are below the thresholds for deduction (before risk weighting)
67,401 A22

202 ANNUAL REPORT 2018 The Norinchukin Bank
CAPITAL ADEQUACY
(Millions of Yen)
Items
Non-Consolidated balance sheet
amount
Balance sheet amount based on regulatory
scope of consolidation
Ref. No.
Trading Assets 10,715
Trading securities 3,913
Derivatives of trading securities 4
Derivatives of securities related to trading transactions 8
Trading-related financial derivatives 6,787
Monetary Claims Bought 257,888
Call Loans 146,220
Payables under Repurchase Agreements —
Receivables under Resale Agreements 1,173
Cash and Due from Banks 22,912,982
Cash 95,371
Due from banks 22,817,610
Other Assets 997,741 997,741
Domestic exchange settlement account, debit 194 194
Prepaid expenses 418 418
Accrued income 196,382 196,382
Initial margins of futures markets 3,944 3,944
Valuation margins of futures markets 617 617
Derivatives other than for trading 414,707 414,707
Cash collateral paid for financial instruments 149,628 149,628
Others 231,847 231,847
Defined-benefit pension fund net assets (prepaid pension costs) 12,903 12,903 A3
Tangible Fixed Assets 115,392
Buildings 44,345
Land 47,280
Lease assets 21,119
Construction in progress 44
Other 2,601
Intangible Fixed Assets 28,425 28,425
Software 9,844 9,844
Lease assets 5,880 5,880
Other 12,700 12,700
of which: goodwill and those equivalents (excluding those reported in the Net Assets section)
— A1.2
of which: other intangible assets other than goodwill and mortgage servicing rights 28,425 A2.1
of which: amount that corresponds to effective tax rate to other intangible assets other than goodwill and mortgage servicing rights
7,888 A2.2
of which: mortgage servicing rights (net of related deferred tax liabilities) — —
Amount exceeding the 10% threshold on specified items — A8
Amount exceeding the 15% threshold on specified items — A10
Amount below the thresholds for deduction (before risk weighting) — A23
Customers’ Liabilities for Acceptances and Guarantees 120,867
Reserve for Possible Loan Losses (54,203) (54,203)
of which: general reserve for possible loan losses includes Tier 2 (7) A15
of which: eligible provisions includes Tier 2 — A16
Reserve for Possible Investment Losses (1,344)
Total Assets 105,812,432
203ANNUAL REPORT 2018 The Norinchukin Bank
CAPITAL ADEQUACY
(Millions of Yen)
Items
Non-Consolidated balance sheet
amount
Balance sheet amount based on regulatory
scope of consolidation
Ref. No.
(Liabilities)
Deposits 61,904,218
Time deposits 54,444,528
Deposits at notice 36,227
Ordinary deposits 2,988,208
Current deposits 90,932
Other deposits 4,344,321
Negotiable Certificates of Deposit 3,689,270
Debentures 2,423,827
Debentures issued 2,423,827
Bonds Payable —
of which: qualifying Additional Tier 1 instruments of which: classified as liabilities — D1.1
of which: qualifying Tier 2 instruments of which: classified as liabilities — D2.1
Trading Liabilities 6,150
Derivatives of trading securities —
Derivatives of securities related to trading transactions 9
Trading-related financial derivatives 6,141
Borrowed Money 4,315,111 4,315,111
Borrowings 4,315,111 4,315,111
of which: qualifying Additional Tier 1 instruments — D1.2
of which: qualifying Tier 2 instruments 1,415,480 D2.2
Call Money 3,365
Payables under Repurchase Agreements 19,645,010
Payables under Securities Lending Transactions 1,013
Foreign Exchanges Liabilities 2
Foreign bills payable 2
Trust Money 1,257,432
Other Liabilities 4,894,665
Domestic exchange settlement account, credit 936
Accrued expenses 62,989
Income taxes payable 11,348
Unearned income 671
Employees’ deposits 9,070
Variation margins of futures markets —
Derivatives other than for trading 228,773
Cash collateral received for financial instruments 433,362
Lease liabilities 24,045
Others 4,123,467
Reserve for Bonus Payments 6,302
Reserve for Employees’ Retirement Benefits 22,301
Reserve for Directors’ Retirement Benefits 938
Reserve for Agriculture, Fishery and Forestry Industry Subsidies 523
Deferred Tax Liabilities 573,768 573,768
of which: prepaid pension cost 3,580 D3
Deferred Tax Liabilities for Land Revaluation 8,607 8,607
Acceptances and Guarantees 120,867
Total Liabilities 98,873,376

204 ANNUAL REPORT 2018 The Norinchukin Bank
CAPITAL ADEQUACY
(Millions of Yen)
Items
Non-Consolidated balance sheet
amount
Balance sheet amount based on regulatory
scope of consolidation
Ref. No.
(Net Assets)
Paid-in Capital 3,480,488 3,480,488
Common equity 3,455,488 3,455,488 E1.1
of which: lower dividend rate stock 3,029,771 3,029,771
Preferred stock 24,999 24,999
of which: directly issued qualifying Additional Tier 1 instruments plus related capital surplus of which classified as equity under applicable accounting standards
24,500 E5.1
Capital Surplus 25,020 25,020
Capital surplus 24,999 24,999
of which: directly issued qualifying Additional Tier 1 instruments plus related capital surplus of which classified as equity under applicable accounting standards
24,500 E5.2
Other capital surplus 20 20 E1.2
Reserve for revaluation 20 20
Retained Earnings 1,862,453 1,862,634 E2
Legal reserves 668,466 668,466
Voluntary reserves 1,193,987 1,194,168
Special reserves 236,400 236,400
General reserves 559,403 559,403
Reserves for tax basis adjustments of fixed assets 7,596 7,596
Others 7 7
Unappropriated retained earnings 390,580 390,761
Net income 203,414 203,342
Total Owners’ Equity 5,367,962 5,368,149
of which: others — E3
of which: directly issued qualifying Tier 2 instruments plus related capital surplus of which classified as equity under applicable accounting standards
— E6
Net Unrealized Gains on Other Securities 1,583,476 1,583,476
Net Deferred Losses on Hedging Instruments (26,695) (26,695)
of which: net deferred losses on hedge 19,278 E7
Revaluation Reserve for Land, net of taxes 14,312 14,312
Foreign Currency Translation Adjustment 10
Total Valuation and Translation Adjustment 1,571,093 1,571,103 E4
Total Net Assets 6,939,055
Total Liabilities and Net Assets 105,812,432
Notes: 1. “Balance sheet amount based on regulatory scope of consolidation” refers only to the items used in calculating capital adequacy. 2. “Balance sheet amount based on regulatory scope of consolidation” does not reflect transitional arrangements so that the amount of the column consists
of the amount included in capital adequacy and the amount excluded under transitional arrangements in “Composition of Capital.”

205ANNUAL REPORT 2018 The Norinchukin Bank
CAPITAL ADEQUACY
Capital Adequacy (Non-Consolidated)
(Minimum amount of regulatory required capital and breakdown for each risk category)
Regulatory Required Capital (Billions of Yen)
Items
As of March 31, 2017
EADRegulatoryRequiredCapital
Amount of regulatory required capital for credit risk 140,505 2,521
Exposure subject to Internal Ratings-Based Approach 124,561 2,498
Corporate exposure (excluding Specialized Lending) 7,514 188
Corporate exposure (Specialized Lending) 513 39
Sovereign exposure 66,106 0
Bank exposure 16,925 108
Retail exposure 3 1
Retail exposure secured by residential properties 0 0
Qualifying revolving retail exposure — —
Other retail exposure 3 1
Securitization and re-securitization exposure 6,513 42
Equity portfolios 1,316 209
Equity portfolios subject to PD/LGD approaches 869 90
Equity portfolios subject to simple risk-weighted method 100 34
Equities under the internal models approach 346 85
Exposure subject to risk-weighted asset calculation for investment fund 25,110 1,891
Other debt purchased 308 4
Other exposures 248 12
Exposure subject to Standardized Approach 7 0
Overdrafts — —
Prepaid expenses 0 0
Suspense payments 6 0
Other — —
Amount corresponding to CVA risk 547 4
CCP-related exposures 15,375 16
Items that included by transitional arrangements 13 1
Amount of regulatory required capital for market risk / 136
Standardized Approach / 135
Interest rate risk category / —
Equity risk category / —
Foreign exchange risk category / 135
Commodity risk category / —
Option transactions / —
Internal models Approach / 0
Amount of regulatory required capital for operational risk / 69
Offsets on consolidation / 2,727
Notes: 1. Regulatory required capital for credit risk = 8% of risk-weighted assets for credit risk + Expected losses2. Within the Exposure Subject to the Internal Ratings-Based Approach (excluding retail), the EAD subject to the Advanced Internal Ratings-Based
Approach and the amount of regulatory required capital are ¥7,973.4 billion and ¥190.3 billion, respectively.3. “Risk-weighted asset calculation for investment fund” is risk-weighted assets as calculated according to the method specified in Notification Regarding
Capital Adequacy Ratio, Article 144.4. Risk-weighted asset calculation for investment fund includes ¥172.6 billion EAD and ¥0.3 billion of Required Capital of CPP-related exposures.5. Under “The Standardized Approach (TSA),” which is a method for computing the amount corresponding to operational risk, the gross profit for one year
is allocated among the business activities as specified in Appendix Table 1 of the Notification Regarding Capital Adequacy Ratio. The multiplier specified for each business activity classification is multiplied by the gross profit, and the average of the annual totals for the past three years is taken to be the amount corresponding to operational risk (Notification Regarding Capital Adequacy Ratio, Article 282).
(Billions of Yen)
Item As of March 31, 2017
Non-consolidated total required capital 2,658
Note: Non-consolidated total required capital is an amount that results from multiplying the denominator of the formula by 8% as stipulated in Notification Regarding Capital Adequacy Ratio, Article 14.

206 ANNUAL REPORT 2018 The Norinchukin Bank
CAPITAL ADEQUACY
Fiscal 2016 (Ended March 31, 2017)
Geographic Distribution of Exposure, Details in Significant Areas
by Major Types of Credit Exposure (Billions of Yen)
RegionsLoans, commit-
ments, off-balancesheet exposure
Securities Derivatives OthersTotal credit
risk exposureDefault
exposure
Japan 11,830 15,146 30 23,930 50,938 59
Asia except Japan 291 146 12 388 838 —
Europe 284 10,268 218 10,009 20,781 —
The Americas 841 18,012 38 15,239 34,131 —
Other areas 258 407 14 258 938 —
Total 13,506 43,981 314 49,826 107,628 59
Industry Distribution of Exposure, Details by Major Types of Credit Exposure (Billions of Yen)
IndustriesLoans, commit-
ments, off-balancesheet exposure
Securities Derivatives OthersTotal credit risk
exposureDefault
exposure
Write-off of loans(amounts of partial
direct write-off)
Manufacturing 2,708 466 1 0 3,176 23 —
Agriculture 47 0 0 0 48 5 0
Forestry 6 — — — 6 0 —
Fishing 19 0 — 0 19 11 —
Mining 13 — — 0 13 — —
Construction 85 11 — 0 96 0 —
Utility 356 5 — 0 361 — —
Information/telecommunications 118 8 — 0 127 — —
Transportation 622 124 2 0 750 7 —
Wholesaling, retailing 1,500 121 0 0 1,622 7 —
Finance and insurance 2,696 7,824 310 49,566 60,396 0 —
Real estate 636 143 — 2 783 0 —
Services 1,482 82 0 1 1,565 3 0
Municipalities 39 0 — 0 39 — —
Other 3,171 35,192 — 255 38,619 0 —
Total 13,506 43,981 314 49,826 107,628 59 1
Note: “Others” within “Finance and insurance” includes repo-type transactions, call loans, and certain other items.
Residual Contractual Maturity Breakdown of Credit Risk Exposure (Billions of Yen)
Terms to maturityLoans, commitments,
off-balancesheet exposure
Securities Derivatives OthersTotal credit
risk exposure
In 1 year 7,116 5,358 66 49,043 61,583
Over 1 year to 3 years 1,847 14,622 78 0 16,547
Over 3 years to 5 years 2,432 12,043 1 0 14,477
Over 5 years to 7 years 961 3,077 0 0 4,039
Over 7 years 1,146 7,133 168 0 8,448
No term to maturity 2 1,747 — 782 2,532
Total 13,506 43,981 314 49,826 107,628
Notes: 1. The amount of credit exposure at the end of the period does not substantially differ from the average-risk position during fiscal 2016.2. Within credit risk exposure, credit risk exposure subject to the Standardized Approach was ¥7.1 billion.3. Default exposure is classified in the Bank’s self-assessment as being under “Debtor Under Requirement of Control.”
Credit Risk (Non-Consolidated)
(Funds and securitization exposures are excluded)
1. Credit Risk Exposure

207ANNUAL REPORT 2018 The Norinchukin Bank
CAPITAL ADEQUACY
Increase/Decrease in General Reserve for Possible Loan Losses, Specific Reserve
for Possible Loan Losses and the Specific Reserve for Loans to Countries with
Financial Problems by Region (Billions of Yen)
Regions As of March 31, 2017 Increase/(decrease)
General reserve for possible loan losses 28 13
Specific reserve for possible loan losses 22 (12)
Japan 22 (12)
Asia except Japan — —
Europe — —
The Americas — —
Other areas — —
Specified reserve for loans to countries with financial problems — —
Total 51 0
Increase/Decrease in General Reserve for Possible Loan Losses, Specific Reserve
for Possible Loan Losses and the Specified Reserve for Loans to Countries with
Financial Problems by Industry (Billions of Yen)
Industries As of March 31, 2017 Increase/(decrease)
General reserve for possible loan losses 28 13
Specific reserve for possible loan losses 22 (12)
Manufacturing 7 2
Agriculture 4 0
Forestry 0 (0)
Fishing 5 (0)
Mining — —
Construction — (0)
Utility — —
Information/telecommunications — —
Transportation 1 (1)
Wholesaling, retailing 1 (0)
Finance and insurance 0 (0)
Real estate — (9)
Services 1 (3)
Municipalities — —
Other — —
Others — —
Specified reserve for loans to countries with financial problems — —
Total 51 0
2. Reserves for Possible Loan Losses

208 ANNUAL REPORT 2018 The Norinchukin Bank
CAPITAL ADEQUACY
a. Corporate, Sovereign and Bank Exposure
Fiscal 2016 (Ended March 31, 2017) (Billions of Yen)
RatingsWeighted-average PD
Weighted-average LGD
Weighted-average
EL default
Weighted-average
risk weight
EAD EAD
(on-balance sheet)
EAD (off-balance
sheet)
Amount of undrawn
commitments
Weighted average of credit
conversion factor
Corporate Exposure 1.08% 30.00% 31% 7,514 6,314 1,199 698 75.00%
1-1 to 4 0.11% 30.15% 24% 6,972 5,805 1,167 687 75.00%
5 to 7 1.52% 27.98% 74% 387 363 24 10 75.00%
8-1 to 8-2 15.84% 29.02% 208% 103 96 6 0 75.00%
Subtotal 0.40% 30.02% 29% 7,463 6,265 1,198 698 75.00%
8-3 to 10-2 100.00% 26.54% 26.54% 332% 50 49 0 — —
Sovereign Exposure 0.00% 44.99% 0% 66,106 64,060 2,046 19 75.00%
1-1 to 4 0.00% 44.99% 0% 66,106 64,060 2,046 19 75.00%
5 to 7 1.00% 45.00% 134% 0 0 — — —
8-1 to 8-2 9.88% 0.02% 4% 0 0 — — —
Subtotal 0.00% 44.99% 0% 66,106 64,060 2,046 19 75.00%
8-3 to 10-2 — — — — — — — — —
Bank Exposure 0.05% 19.04% 8% 16,925 5,989 10,935 0 75.00%
1-1 to 4 0.04% 19.01% 8% 16,844 5,912 10,931 0 75.00%
5 to 7 2.02% 25.00% 74% 80 76 3 — —
8-1 to 8-2 8.94% 45.00% 250% 0 0 0 — —
Subtotal 0.05% 19.04% 8% 16,925 5,989 10,935 0 75.00%
8-3 to 10-2 — — — — — — — — —
Equity Exposure for Credit Risk Using Internal Ratings: PD/LGD Approach
0.17% 90.00% 130% 869 869 — — —
1-1 to 4 0.09% 90.00% 127% 854 854 — — —
5 to 7 2.08% 90.00% 293% 13 13 — — —
8-1 to 8-2 15.84% 90.00% 723% 0 0 — — —
Subtotal 0.13% 90.00% 130% 868 868 — — —
8-3 to 10-2 100.00% 90.00% 90.00% 1,193% 0 0 — — —
Notes: 1. Weighted averages of PD, LGD, EL default and risk weights are computed based on EAD (including on-balance and off-balance items).2. Risk weights are equivalent to the total of the risk-weighted assets and the amount of dividing the expected loss by 8%, then dividing the result by exposure
at default (EAD).
3. Exposure Subject to the Internal Ratings-Based Approach

209ANNUAL REPORT 2018 The Norinchukin Bank
CAPITAL ADEQUACY
b. Retail Exposure
Details on PD, LGD, RW and EAD Assets
Fiscal 2016 (Ended March 31, 2017) (Billions of Yen)
Type of exposureWeighted-
average PD
Weighted-average
LGD
Weighted-average
ELdefault
Weighted-average
riskweight
EAD
EAD (on-balance sheet)
EAD (off-balancesheet)
Amount of undrawn
commitments
Weighted average of credit conversion factor
Retail exposure secured by residential properties 4.79% 43.92% 59.39% 86% 103 103 — — —
Not default Not delinquent 0.64% 43.92% 43% 94 94 — — —
Not default Delinquent 27.39% 43.92% 407% 5 5 — — —
Not default Subtotal 2.12% 43.92% 63% 100 100 — — —
Default 100.00% 59.39% 902% 2 2 — — —
Qualifying revolving retail exposure — — — — — — — — —
Not default Not delinquent — — — — — — — —
Not default Delinquent — — — — — — — —
Not default Subtotal — — — — — — — —
Default — — — — — — — —
Other retail exposure 20.55% 89.55% 97.78% 378% 3 1 2 — —
Not default Not delinquent 2.15% 89.62% 143% 3 0 2 — —
Not default Delinquent 26.36% 42.79% 246% 0 0 0 — —
Not default Subtotal 2.19% 89.55% 143% 3 0 2 — —
Default 100.00% 97.78% 1,395% 0 0 0 — —
Total 5.34% 45.25% 67.00% 96% 107 104 2 — —
Not default Not delinquent 0.68% 45.32% 46% 97 95 2 — —
Not default Delinquent 27.39% 43.92% 407% 5 5 0 — —
Not default Subtotal 2.13% 45.25% 66% 103 101 2 — —
Default 100.00% 67.00% 1,000% 3 3 0 — —
Notes: 1. As of March 31, 2017, the majority of retail exposure is purchased retail receivables which are included in investment funds. Purchased retail receivables in investment funds using estimated parameters have been included in the amount subject to quantitative disclosure.
2. “Not default Delinquent” does not fall under the default definition in the Notification Regarding Capital Adequacy Ratio, but past-due.3. Risk weights are equivalent to the total of the risk-weighted assets and the amount of dividing the expected loss by 8%, then dividing the result by exposure
at default (EAD).4. For defaulted exposure, the risk weights have been computed taking account of the unexpected losses on default (LGD default) and the expected losses on
default (EL default).5. As of March 31, 2017, the Bank held no Qualifying revolving retail exposure for which net withdrawals of commitments had occurred.
c. Actual Losses on Exposure to Corporate, Sovereign, Bank and Retail Exposure
Actual Losses by Exposure Types (Billions of Yen)
Type of exposure As of March 31, 2017 Increase/(decrease)
Corporate exposure 4 2
Sovereign exposure — —
Bank exposure — —
Equity exposure subject to PD/LGD approach — (0)
Retail exposure secured by residential properties — (0)
Qualifying revolving retail exposure — —
Other retail exposure 0 0
Total 4 2
Note: Actual losses are defined as losses due to direct write-offs, partial direct write-offs, specific reserve for possible loan losses, general reserve for possible loan losses and loan sales of exposure that defaulted up to the end of the previous period.

210 ANNUAL REPORT 2018 The Norinchukin Bank
CAPITAL ADEQUACY
Comparison between Actual Losses in the Previous Fiscal Year and Past Financial
Results and Analysis of Causes
Comparison of Estimated Losses and Actual Losses (Billions of Yen)
Type of exposure
As of March 31, 2017 As of March 31, 2016 As of March 31, 2015
Estimated losses
Actual losses
Estimated losses
Actual losses
Estimated losses
Actual losses
Corporate exposure 14 4 15 1 17 3
Sovereign exposure 0 — 0 — 0 —
Bank exposure 1 — 0 — 0 —
Equity exposure subject to PD/LGD approach 0 — 0 0 0 1
Retail exposure secured by residential properties 0 — 0 0 — —
Qualifying revolving retail exposure — — — — — —
Other retail exposure 0 0 0 0 0 0
Type of exposure
As of March 31, 2014 As of March 31, 2013 As of March 31, 2012
Estimated losses
Actual losses
Estimated losses
Actual losses
Estimated losses
Actual losses
Corporate exposure 20 0 24 1 42 9
Sovereign exposure 0 — 0 — 0 —
Bank exposure 1 — 0 — 0 —
Equity exposure subject to PD/LGD approach 0 — 0 — 2 0
Retail exposure secured by residential properties — — — — — —
Qualifying revolving retail exposure — — — — — —
Other retail exposure 0 0 0 0 0 0
Type of exposure
As of March 31, 2011 As of March 31, 2010 As of March 31, 2009
Estimated losses
Actual losses
Estimated losses
Actual losses
Estimated losses
Actual losses
Corporate exposure 73 7 55 42 45 23
Sovereign exposure 0 — 0 — 1 —
Bank exposure 0 — 0 — 0 —
Equity exposure subject to PD/LGD approach 3 0 1 0 0 0
Retail exposure secured by residential properties — — — — — —
Qualifying revolving retail exposure — — — — — —
Other retail exposure 0 0 0 0 0 0
Type of exposure
As of March 31, 2008
Estimated losses
Actual losses
Corporate exposure 28 6
Sovereign exposure 1 —
Bank exposure 0 —
Equity exposure subject to PD/LGD approach 1 0
Retail exposure secured by residential properties — —
Qualifying revolving retail exposure — —
Other retail exposure 0 0
Notes: 1. The scope of estimated and actual losses includes the following accounts on balance sheet: loans, foreign exchange, accrued interests in other assets, suspense payable and customers’ liabilities for acceptances and guarantees, as well as securities without quoted market values, money trusts without quoted market values, and monetary claims purchased.
2. Estimated losses of each year are amount of expected losses.
Although credit conditions have generally remained
favorable due to the recording of reserves for possible
loan losses caused by worsened credit conditions of some
entities for which the Bank provided loans, the total
value of actual losses for fiscal 2016 were up ¥2.4 billion
year-on-year.

211ANNUAL REPORT 2018 The Norinchukin Bank
CAPITAL ADEQUACY
d. Exposure to Specialized Lending Products Subject to Supervisory Slotting Criteria
by Risk Weight
Amount of Specialized Lending Exposure Subject to Supervisory Slotting Criteria
by Risk Weight (Billions of Yen)
Classification As of March 31, 2017
Specialized Lending exposure subject to supervisory slotting criteria 587
Specialized Lending, excluding High-Volatility Commercial Real Estate (HVCRE) 587
Risk weight of 50% 57
Risk weight of 70% 366
Risk weight of 90% 91
Risk weight of 115% 16
Risk weight of 250% 17
Risk weight of 0% (default) 38
High-Volatility Commercial Real Estate (HVCRE) —
Risk weight of 70% —
Risk weight of 95% —
Risk weight of 120% —
Risk weight of 140% —
Risk weight of 250% —
Risk weight of 0% (default) —
Notes: 1. “Specialized Lending” refers to loans for Project Finance (PF), Object Finance (OF), Commodity Finance (CF) and Income-Producing Real Estate (IPRE) (as defined in the Notification Regarding Capital Adequacy Ratio, Article 1-1-41).
2. “High-Volatility Commercial Real Estate (HVCRE)” refers to loans that are the financing of commercial real estate that exhibits a higher rate of loss volatility compared to other types of Specialized Lending, as specified in the Notification Regarding Capital Adequacy Ratio, Article 1-1-43.
3. “Specialized Lending exposure subject to supervisory slotting criteria” refers to the amounts of Specialized Lending, subject to the Bank’s internal rating system, and have been allotted to the risk asset classifications given in the Notification Regarding Capital Adequacy Ratio, Article 130-4 and Article 130-6, after taking account of risk weights.
4. For risk weights, the Bank has applied the stipulations contained in the Notification Regarding Capital Adequacy Ratio, Article 130-4 and Article 130-6.
e. Equity Exposure Subject to the Simple Risk-Weighted Method of the Market-Based
Approach by Risk Weight
Amount of Equity Exposure Subject to the Simple Risk-Weighted Method
of the Market-Based Approach (Billions of Yen)
Classification As of March 31, 2017
Equity exposure subject to the simple risk-weighted method of the market-based approach by RW 100
Risk weight of 300% —
Risk weight of 400% 100
Note: The “simple risk-weighted method of the market-based approach by RW” is a method for computing the amount of risk-weighted assets of equity and other investments. Under this method, the market value of listed stocks is multiplied by a risk weight of 300%, and the estimated value of unlisted stocks is multiplied by a risk weight of 400% (Notification Regarding Capital Adequacy Ratio, Article 143-4).

212 ANNUAL REPORT 2018 The Norinchukin Bank
CAPITAL ADEQUACY
Amount of Exposure Subject to Standardized Approach (Billions of Yen)
Classification
As of March 31, 2017
Exposure
Refer to ECAI
Exposure subject to Standardized Approach 7 —
Risk weight of 0% — —
Risk weight of 10% — —
Risk weight of 20% — —
Risk weight of 35% — —
Risk weight of 50% — —
Risk weight of 75% — —
Risk weight of 100% 7 —
Risk weight of 150% — —
Risk weight of 1,250% — —
Others — —
Note: Others include investment funds which are measured credit risk assets by look-through approach and the assets which are more than 150% and less than 1,250% risk weight.
Credit Risk Mitigation Techniques (Non-Consolidated)
Amount of Exposure Subject to Credit Risk Mitigation Techniques
(Eligible Financial Collateral, Other Eligible IRB Collateral, Guarantees, Credit
Derivatives) (Billions of Yen)
Classification As of March 31, 2017
Foundation Internal Ratings-Based Approach 9,692
Eligible financial collateral 8,940
Corporate exposure —
Sovereign exposure 0
Bank exposure 8,940
Other eligible IRB collateral —
Corporate exposure —
Sovereign exposure —
Bank exposure —
Guarantees, Credit Derivatives 751
Corporate exposure 405
Sovereign exposure 256
Bank exposure 89
Retail exposure secured by residential properties —
Qualifying revolving retail exposure —
Other retail exposure —
Standardized Approach —
Eligible financial collateral —
Guarantees, Credit Derivatives —
Note: Exposure subject to risk-weighted asset calculation for investment fund is not included.
4. Exposure Subject to Standardized Approach

213ANNUAL REPORT 2018 The Norinchukin Bank
CAPITAL ADEQUACY
Counterparty Credit Risk in Derivative Transactions (Non-Consolidated)
Methods Used for Calculating Amount of Credit Exposure
The current exposure method has been adopted.
Breakdown of the Amount of Credit Exposure (Billions of Yen)
Classification As of March 31, 2017
Total gross replacement costs (limited to items with a value of greater than zero) (A) 420
Total gross add-ons (B) 576
Gross credit exposure (C) = (A)+(B) 997
Foreign exchange related 719
Interest rate related 277
Equity related 0
Credit derivatives —
Transactions with a long settlement period —
Reduction in credit exposure due to netting contracts (including collateral pledged for CSA)
(D) 250
Amount of credit exposure before taking into account credit risk mitigation techniques due to collateral
(E) = (C)–(D) 746
Amount of collateral (F) 292
Eligible financial collateral 292
Amount of credit exposure after taking into account credit risk mitigation techniques due to collateral
(G) = (E)–(F) 453
Notes: 1. Derivatives transactions included in risk-weighted assets calculation for investment funds are not included.2. Under the stipulations of the Notification Regarding Capital Adequacy Ratio, Article 56-1, the amount of credit exposure not computed has not been included.
Notional Principal Amount of Credit Derivatives Included in Computation of
Credit Exposure (Billions of Yen)
Classification As of March 31, 2017
To buy protection —
Credit default swaps —
Total return swaps —
To sell protection —
Credit default swaps —
Total return swaps —
Notional principal amount of credit derivatives taking into consideration the effect of credit risk mitigation techniques
—
Notes: 1. Credit derivatives included in risk-weighted assets for investment funds have not been taken into consideration.2. Under the stipulations of the Notification Regarding Capital Adequacy Ratio, Article 21-2, 3 and Article 56, the amount of credit risk assets not computed
has not been included.

214 ANNUAL REPORT 2018 The Norinchukin Bank
CAPITAL ADEQUACY
Details of Securitization Exposure Held as Originator (Billions of Yen)
Classification As of March 31, 2017
Total amount of underlying assets —
Amounts of assets held by securitization transactions purpose —
Amounts of securitized exposure —
Gains (losses) on sales of securitization transactions —
Amounts of securitization exposure —
Amounts of re-securitization exposure —
Increase in capital due to securitization transactions —
Amounts of securitization exposure that applied risk weight 1,250% —
Amounts of re-securitization exposure subject to credit risk mitigation techniques —
Details of Securitization Exposure Held as Investor by Exposure Type
Fiscal 2016 (Ended March 31, 2017) (Billions of Yen)
Classification
Total amount of securitization exposure
Amount of exposure Risk weight 1,250%
Re-securitization exposure
Risk weight 1,250%
Amount of exposure
Re-securitization products
(Secondary, tertiary)
Re-securitization products peculiar
to regulation
Amount of exposure 6,513 ( 0) 0 (—) 51 0 51 0
Individuals
Asset-Backed Securities (ABS) 1,071 (—) — (—) — — — —
Residential Mortgage-Backed Securities (RMBS) 2,336 (—) — (—) — — — —
Real estate
Commercial Mortgage-Backed Securities (CMBS) 66 (—) — (—) — — — —
Corporates
Subtotal of CDOs (CLO, ABS-CDO, CBO) 3,038 (—) 0 (—) 51 0 51 0
Collateralized Loan Obligations (CLO) 3,038 (—) — (—) 51 — 51 —
Asset-Backed Securities CDOs (ABS-CDO) 0 (—) 0 (—) 0 0 — 0
Collateralized Bond Obligations (CBO) — (—) — (—) — — — —
Others 0 ( 0) — (—) — — — —
Notes: 1. Re-securitization exposure refers to securitization exposures of the underlying assets in the securitization exposure.2. The off-balance exposure has been described in parentheses. There is no re-securitization exposure of the off-balance.
Securitization Exposure (Non-Consolidated)
1. Items to Calculate Risk-Weighted Asset for Credit Risk

215ANNUAL REPORT 2018 The Norinchukin Bank
CAPITAL ADEQUACY
Amount of Securitization Exposure Held as Investor and
Regulatory Required Capital by Risk-Weighted Category
Fiscal 2016 (Ended March 31, 2017) (Billions of Yen)
ClassificationAmount of exposure Regulatory required capital
On-balance Off-balance On-balance Off-balance
Amount of securitization exposure 6,461 6,461 0 40 40 0
Risk weight: 20% or less 6,442 6,442 — 39 39 —
Risk weight: exceeding 20% to 50% or less 6 6 — 0 0 —
Risk weight: exceeding 50% to 100% or less 12 12 — 1 1 —
Risk weight: exceeding 100% to 250% or less — — — — — —
Risk weight: exceeding 250% to less than 1,250% 0 — 0 0 — 0
Risk weight: 1,250% — — — — — —
Amount of re-securitization exposure 51 51 — 1 1 —
Risk weight: 20% or less — — — — — —
Risk weight: exceeding 20% to 50% or less 51 51 — 1 1 —
Risk weight: exceeding 50% to 100% or less — — — — — —
Risk weight: exceeding 100% to 250% or less — — — — — —
Risk weight: exceeding 250% to less than 1,250% — — — — — —
Risk weight: 1,250% 0 0 — 0 0 —
Amount of Re-Securitization Exposure Held as Investor and
Subject to Credit Risk Mitigation Techniques (Billions of Yen)
Classification
As of March 31, 2017
Amount of exposure
Regulatory required capital
Amount of re-securitization exposure — —
Risk weight applied to guarantor: 20% or less — —
Risk weight applied to guarantor: exceeding 20% to 50% or less — —
Risk weight applied to guarantor: exceeding 50% to 100% or less — —
Risk weight applied to guarantor: exceeding 100% to 250% or less — —
Risk weight applied to guarantor: exceeding 250% to less than 1,250% — —
Risk weight applied to guarantor: 1,250% — —
2. Securitization Exposure Subject to Market Risk
Not applicable

216 ANNUAL REPORT 2018 The Norinchukin Bank
CAPITAL ADEQUACY
Market Risk (Non-Consolidated)
Computation of Market Risk Amount by Internal Models Approach
■ VaR (Millions of Yen)
Fiscal 2016
Base date of computation 2017. 3. 31
VaR (For the most recent 60 business days)
Base date of computation 108
Maximum 128
Minimum 40
Average 65
■ Stress VaR (Millions of Yen)
Fiscal 2016
Base date of computation 2017. 3. 31
Stress VaR (For the most recent 60 business days)
Base date of computation 259
Maximum 311
Minimum 83
Average 191
■ Amount of Market Risk (Millions of Yen)
Fiscal 2016
For the portion computed with the internal models approach (B)+(G)+(J) (A) 769
Value at Risk (MAX (C, D)) (B) 195
Amount on base date of computation (C) 108
Amount determined by multiplying (E) by the average for the most recent 60 business days
(D) 195
(Multiplier) (E) 3.0
(Times exceeding VaR in back testing) (F) 2
Stress Value at Risk (MAX (H, I)) (G) 573
Amount on base date of computation (H) 259
Amount determined by multiplying (E) by the average for the most recent 60 business days
( I ) 573
Additional amount at the time of measuring individual risk ( J ) 0
Notes: 1. As a result of back testing conducted in fiscal 2016, actual gains and losses did not diverge substantially downward from the VaR value.2. When discrepancies between the model’s estimates and actual results go beyond a certain number of times due to the design of the model, the Bank
scrutinizes the relevant model factors and revises the model if necessary.3. Since the Bank adopts a standardized approach, neither an additional risk nor a comprehensive risk of specific risks of trading account are the measure-
ment objects.
Equity Exposure (Non-Consolidated)
(Includes items such as shares; excludes items in trading accounts)
Amount on the Balance Sheet and Market Value (Billions of Yen)
Classification
As of March 31, 2017
Amount on the balance sheet
Market value
Equity exposure 1,316 /
Exposure to publicly traded equity 1,062 1,062
Exposure to privately held equity 253 /
Note: Regulatory adjustments in numerator provided for by Notification Regarding Capital Adequacy Ratio, Article 14 were not included.

217ANNUAL REPORT 2018 The Norinchukin Bank
CAPITAL ADEQUACY
Amount of Gain (Loss) due to Sale or Write-Off (Billions of Yen)
Item
Fiscal 2016
Gains from saleof equities, etc.
Losses from sales of equities, etc.
Write-offs of equities, etc.
Equity exposure 34 0 0
Note: Amounts reflect relevant figures posted in the income statements.
Amount of Valuation Gains (Losses) (Billions of Yen)
Item As of March 31, 2017
Amount of valuation gains (losses) recognized on the balance sheet and not recognized in the statements of operations
436
Notes: 1. Exposure is to equity shares issued by both domestic and overseas companies.2. Regulatory adjustments in numerator provided for by Notification Regarding Capital Adequacy Ratio, Article 14 were not included.
Unrealized Gains (Losses) Not Recognized on Non-Consolidated Balance Sheets or
Non-Consolidated Statements of Income
Not applicable
Equity Exposures for Each Portfolio Classification (Billions of Yen)
ClassificationAs of March 31, 2017
EAD
Equity portfolios 1,316
Equity portfolios subject to PD/LGD approaches 869
Equity portfolios subject to simple risk-weighted method 100
Equities under the internal models approach 346

218 ANNUAL REPORT 2018 The Norinchukin Bank
CAPITAL ADEQUACY
Exposure Subject to Risk-Weighted Asset Calculation for Investment Funds (Non-Consolidated)
Amount of Exposure Subject to Risk-Weighted Asset Calculation for
Investment Fund (Billions of Yen)
Classification
As of March 31, 2017
Exposure(For reference)
Weighted-average risk weight
Look-through approach 17,570 64%
Majority approach 713 388%
Mandate approach — —
Market-based approach 1,670 325%
Others (simple approach) 306 428%
Total 20,260 94%
Notes: 1. The “Look-through approach” is a method for computing the risk-weighted assets in fund by totaling the amount of risk-weighted assets for credit risk in individual asset categories. (Please refer to Notification Regarding Capital Adequacy Ratio, Article 144-1.)
2. The “Majority approach” is a method for computing the risk-weighted assets in fund by applying risk weight to the fund as well as equity exposure when the exposure of equity, in terms of value, is major in a fund. (Please refer to the Notification Regarding Capital Adequacy Ratio, Article 144-2.)
3. The “Mandate approach” is a method for computing the risk-weighted assets in fund where only the investment mandate of the fund is known. The risk-weighted assets are computed as follows: It is assumed that the fund first invests, to the maximum extent allowed under its mandate, in the asset classes attracting the highest capital requirement, and then continues making investments in descending order until the maximum total investment level is reached. (Please refer to the Notification Regarding Capital Adequacy Ratio, Article 144-3.)
4. The “Market-based approach” is a method for computing the credit risk of exposure regarded as credit risk assets using the Bank’s internal model (which is a value-at-risk (VaR) model based on the historical simulation method). (Please refer to the Notification Regarding Capital Adequacy Ratio, Article 144-4.)
5. The “Others (simple approach)” is a method for computing the risk-weighted assets in fund by applying risk weight of 400%, when it is judged the probability that the weighted-average risk weight will be less than 400%. In all other cases, risk weight of 1,250% is applied to funds. (Please refer to the Notification Regarding Capital Adequacy Ratio, Article 144-5.)
6. (For reference) The sum of the amount of risk-weighted assets (excluding CVA risk amount) and the amount resulting from dividing the expected loss by 8% are divided by EAD to yield the risk weight value.
Interest Rate Risk (Non-Consolidated)
(The increase or decrease of the profit and loss or in the economic value from interest rate shocks which are used for internal management purpose, in terms of interest rate risk excluding trading accounts.)
Interest Rate Risk Volume Computed with the Internal Model
in Core Business Accounts (Excluding Trading Accounts) (Billions of Yen)
Classification As of March 31, 2017
Interest rate risk 2,299
Yen interest rate risk 132
U.S. dollar interest rate risk 1,714
Euro interest rate risk 437
Interest rate risk in other currencies 14
Notes: 1. Interest rate risk, without taking into account inter-grid factors and correlations with other assets, calculates a one-year holding period and a historical observation period from 1995 to the most recent year of interest rate volatility. The Bank calculated declines in economic value corresponding to a 99% confidence interval for interest rate volatility.
2. Regarding core deposits, since the balances of deposits, etc., without maturity dates are limited, the Bank does not currently measure their risk volume. In addition, regarding repayments of mortgage-backed securities and callable securities before maturity, risk volume is measured after taking account of negative convexity due to call conditions and other factors.

219ANNUAL REPORT 2018 The Norinchukin Bank
CAPITAL ADEQUACY
(Unit: Millions of Yen, %, the Number of Items)
Items The current quarter (January 1 to March 31, 2018)
The previous quarter (October 1 to December 31, 2017)
High-quality liquid assets (1)
1 Total high-quality liquid assets 35,326,846 36,412,857
Cash outflows (2)
Amount before multiplying a cash outflow
ratio
Amount after multiplying a cash outflow
ratio
Amount before multiplying a cash outflow
ratio
Amount after multiplying a cash outflow
ratio
2 Cash outflows relating to unsecured retail funding 64,950 6,482 59,264 5,941
3 of which: stable deposits 362 11 359 11
4 of which: quasi-stable deposits 64,588 6,471 58,904 5,930
5 Cash outflows relating to unsecured wholesale funding 10,915,725 8,011,778 11,017,072 8,112,622
6 of which: qualifying operational deposits 0 0 0 0
7of which: capital relating to unsecured wholesale funding, excluding qualifying operational deposits and debt securities
9,672,753 6,768,806 9,892,304 6,987,854
8 of which: debt securities 1,242,972 1,242,972 1,124,769 1,124,769
9 Cash outflows relating to secured funding, etc. 231,830 259,727
10Cash outflows relating to funding programs and credit/liquidity facilities such as derivative transactions, etc.
2,597,219 1,554,316 2,733,287 1,693,107
11 of which: cash outflows relating to derivative transactions 1,310,321 1,310,321 1,445,176 1,445,176
12 of which: cash outflows relating to funding programs 0 0 0 0
13 of which: cash outflows relating to credit/liquidity facilities 1,286,898 243,995 1,288,111 247,931
14 Cash outflows based on an obligation to provide capital 4,753,466 483,940 4,511,643 235,331
15 Cash outflows relating to contingencies 3,403,961 164,047 3,270,516 142,613
16 Total cash outflows 10,452,393 10,449,341
Cash inflows (3)
Amount before multiplying a cash outflow
ratio
Amount after multiplying a cash outflow
ratio
Amount before multiplying a cash outflow
ratio
Amount after multiplying a cash outflow
ratio
17 Cash inflows relating to secured fund management, etc. 1,217,183 0 1,139,727 0
18 Cash inflows relating to collections of advances, etc. 4,536,149 3,980,067 4,498,245 3,980,188
19 Other cash inflows 5,823,806 773,299 5,890,625 483,049
20 Total cash inflows 11,577,139 4,753,366 11,528,597 4,463,237
Liquidity coverage ratio on a non-consolidated basis (4)
21 Sum of high-quality liquid assets that can be included 35,326,846 36,412,857
22 Net cash outflows 5,699,028 5,986,104
23 Liquidity coverage ratio on a non-consolidated basis 619.8% 608.2%
24 The number of data for calculating the average value 59 62
Quantitative Disclosure Items Concerning a Liquidity Coverage Ratio on a Non-
Consolidated Basis

220 ANNUAL REPORT 2018 The Norinchukin Bank
CAPITAL ADEQUACY
Items concerning a change in the non-
consolidated liquidity coverage ratio on
a time-series basis
The non-consolidated liquidity coverage ratio for the cur-
rent quarter maintained a high and stable level.
Items concerning evaluation of the level
of the non-consolidated liquidity cover-
age ratio
The non-consolidated liquidity coverage ratio for the cur-
rent quarter has tended to be well above the minimum level.
Qualitative Disclosure Items Concerning a Liquidity Coverage Ratio on a Non-
Consolidated Basis
Items concerning the details of the sum
of high-quality liquid assets that can be
included
In light of the Bank’s liquidity coverage ratio, there is no
material item.
Other items concerning the non-consoli-
dated liquidity coverage ratio
In light of the Bank’s liquidity coverage ratio, there is no
material item.