Capacitive imaging of impact damage in composite material · · 2017-01-11used as complementary...
19
MANUSCRIPT ACCEPTED ACCEPTED MANUSCRIPT Capacitive Imaging of Impact Damage in Composite Material Maxim Morozov, William Jackson and S.G.Pierce Department of Electronic and Electrical Engineering, University of Strathclyde Technology & Innovation Centre, 99 George Street, Glasgow, G1 1RD, UK +44 (0)141 444 7406 [email protected] Abstract This work presents capacitive non-destructive imaging of impact damage in woven fibre CFRP using a coplanar capacitive sensor. Novelty of the approach consists in that spectral characteristics of the capacitive sensor response to CFRP properties are firstly used to establish excitation frequencies for optimum imaging of delamination. For the tested samples optimum excitation frequencies were found to be above 200MHz. Clear capacitive images of delaminations were obtained on each sample. Ultrasonic (UT) C- scans of delaminations due to impacts were acquired using phased array technique to confirm presence and extent of the delaminations. Capacitive imaging technique can be used as complementary to UT for imaging shallow defects in composite materials at depths where UT has insufficient time domain resolution. Keywords. Carbon fibre, delamination, non-destructive testing, capacitive imaging. 1. Introduction Composite laminated materials find increasing use in modern engineering structures, such as wind turbine blades and especially airframes, due to their high specific strength and stiffness. However, such materials, e.g. carbon fibre-reinforced plastics (CFRP), are
Transcript of Capacitive imaging of impact damage in composite material · · 2017-01-11used as complementary...

MANUSCRIP
T
ACCEPTED
ACCEPTED MANUSCRIPTCapacitive Imaging of Impact Damage in Composite Material
Maxim Morozov, William Jackson and S.G.Pierce
Department of Electronic and Electrical Engineering, University of Strathclyde
Technology & Innovation Centre, 99 George Street, Glasgow, G1 1RD, UK
+44 (0)141 444 7406
Abstract
This work presents capacitive non-destructive imaging of impact damage in woven fibre
CFRP using a coplanar capacitive sensor. Novelty of the approach consists in that
spectral characteristics of the capacitive sensor response to CFRP properties are firstly
used to establish excitation frequencies for optimum imaging of delamination. For the
tested samples optimum excitation frequencies were found to be above 200MHz. Clear
capacitive images of delaminations were obtained on each sample. Ultrasonic (UT) C-
scans of delaminations due to impacts were acquired using phased array technique to
confirm presence and extent of the delaminations. Capacitive imaging technique can be
used as complementary to UT for imaging shallow defects in composite materials at
depths where UT has insufficient time domain resolution.
Keywords. Carbon fibre, delamination, non-destructive testing, capacitive imaging.
1. Introduction
Composite laminated materials find increasing use in modern engineering structures,
such as wind turbine blades and especially airframes, due to their high specific strength
and stiffness. However, such materials, e.g. carbon fibre-reinforced plastics (CFRP), are
MANUSCRIP
T
ACCEPTED
ACCEPTED MANUSCRIPTbrittle and have no significant strength in the thickness direction. Therefore, composite
laminates are particularly susceptible to damage caused by transverse impacts [1]. The
common damage modes inside the panel are delamination (separation of plies), matrix
cracking, and fibre breakages [2]. A delamination is a crack which runs in the resin
component (approximately 0.0007 mm in graphite/epoxy laminates) between plies of
different fibre orientation and not between lamina in the same ply group [3].
Upon low or intermediate velocity impacts the damage inside the target panel could be
large and the laminated composite panel can suffer a significant loss of its designed
strength sometimes without a visible indication of damage on the impacted surface [4],
thus this is considered to be the most detrimental damage; the impact damage being
difficult to detect and often leading to a serious reduction of the structural integrity and
mechanical properties [5]. Inter-laminar stresses or mismatching of bending stiffness
between two adjacent laminate have been suggested as causes of delamination in the
composite laminates subjected to low velocity impact [6] and it has been reported that
the apparent damaged area increases monotonically with impact energy [7]. Tolerance
to damage is an important requirement in the design and fabrication of composite
structural components. The ability of a component to contain a flaw of a given size
without serious loss of its structural integrity is of prime concern [1]. Since the full
extent of damage due to low-velocity impacts in composite structures is not generally
visible to the unaided eye, Non-Destructive Testing and Evaluation (NDT&E) methods
are needed for delamination detection and quantification [8].
A comprehensive overview of existing methods of non-destructive evaluation of
polymer matrix composites is given in [9]. NDT&E methods for composite materials
can roughly be classified according to the underlying physical principles as follows:
visual, acoustic/ultrasonic, electromagnetic (inductive, capacitive, microwave and
thermography), radiographic (X-rays, gamma-rays) [9]. It has been pointed out above
MANUSCRIP
T
ACCEPTED
ACCEPTED MANUSCRIPTthat visual methods are of limited benefit for low energy impact damage detection as a
flaw produced, if any, is smaller than the subsurface delamination. Radiographic testing
methods involve radiation hazard. Moreover, delaminations and planar cracks are
difficult to detect using radiography. Ultrasonic Testing (UT), particularly by means of
Phased Arrays (PA), naturally offers itself for detecting discontinuities such as
delaminations since these represent effective reflectors of ultrasonic waves [10-12].
Minor limitation of PA UT might be related to the requirement to have an acoustic
couplant, in many cases water, which adds cost and complexity to the inspection
procedure or might be undesirable altogether depending on the structure to be inspected.
Use of guided wave imaging to detect hidden delamination in multi-layer composites
has been presented in [13-16] and Lamb waves have been successfully demonstrated
for the case of internal delaminations initiated by low-velocity impacts [17]. Additional
ultrasonics techniques include noncontact laser ultrasonic imaging which has been
deployed for detection and visualization of delaminations, debonding as well as
porosity [14, 18, 19]. The limitation of ultrasound NDT when testing thin layered
structures arises from necessity to use high frequencies (in the range of tens of MHz).
At high frequencies attenuation in composite tends to be strong.
Owing to their compound material structure, carbon fibre composites have also complex
electromagnetic properties: electrically conductive carbon fibre is embedded into a
dielectric resin matrix. Therefore, CFRPs lend themselves to a range of electromagnetic
non-destructive techniques: eddy current testing (ECT), capacitive sensing, and
inductive thermography. These techniques are complementary to the traditional UT
since they enable NDT of very thin layers and can be applied to dry, wet and
consolidated carbon based materials [20]. They offer possibility of imaging (either
using arrays of inductors/electrodes or a thermal camera) and can also be easily
automated/robotised. Since carbon is a reasonably good electrical conductor, ECT is

MANUSCRIP
T
ACCEPTED
ACCEPTED MANUSCRIPTsuitable for inspection of integrity of fibres and their quality (fibre density, orientation,
undulation etc.) [21-25]. Importantly, electrical conductivity of unidirectional single
layered CFRP is anisotropic and is reported to be approximately 5MS/m in the
longitudinal direction and 1kS/m in the transversal direction [22]. An NDT system that
relates eddy-current sensor responses to the fibre layup of a composite structure, the
presence of impact damage on a composite structure with or without a metal liner,
volumetric stress within the composite and fibre tow density has been patented [26].
Due to the relatively low electrical conductivity of carbon fibre, inductors used for ECT
of composites operate at high excitation frequencies from 100kHz to 100MHz [20, 21].
Therefore, beside the eddy currents, displacement currents become very pronounced and
thus capacitance effects become pronounced.The reported systems can frequently
determine material properties related to the presence of buried defects in the dielectric
phase of composite materials (resin), such as moisture ingress, aging of the material due
to service or environmental/thermal exposure, voids and delaminations [26]. However,
it has been noted that delaminations in CFRP cannot be detected by means of ECT
because the eddy currents flow parallel to the surface, unless there are inter-laminar
fibre contacts [27]. Capacitive Imaging (CI), which is based on the variation of
dielectric properties of the resin matrix, enables detection of delaminations caused by
impact damage [28]. There has been extensive research in the field of capacitive
imaging of concrete structures [29, 30] and glass fibre composites [31, 32] by means of
coplanar contiguous electrodes. A concentric coplanar capacitive sensor including a
charged central disc forming a first electrode, an outer annular ring coplanar with and
outer to the charged central disc, and a method providing for determining
transcapacitance between the first electrode and the second electrode using the
transcapacitance in a model that accounts for a dielectric test piece to inversely
determine the properties of the dielectric test piece has been patented [33]. However,

MANUSCRIP
T
ACCEPTED
ACCEPTED MANUSCRIPTthere are very few publications regarding capacitive imaging of CFRP, mainly of
surface features at excitation frequencies from 10kHz to 1MHz [34].
A limitation is believed to be due to electrical conductivity of carbon fibre which
produces electromagnetic shielding since the electric field lines are attracted to the
conductive fibres and result in surface electric currents. Since electrical conductivity is
anisotropic, orientating coplanar electrodes so that the injected electric field is
perpendicular to fibres will reduce this shielding effect. Another effect consists in the
fact that in similar way as high frequency ECT generate considerable displacement
currents, alternating current CI will induce alternating magnetic field in the CFRP
which in turn will generate eddy currents in the carbon fibre. Therefore CI can be
sensitive not only to defects in the dielectric matrix, but also to defects of fibre. This
work presents a demonstration of capacitive non-destructive imaging of impact damage
in woven fibre CFRP using a coplanar capacitive sensor. Spectral characteristics of the
capacitive sensor response to CFRP properties and choice of excitation frequency for
optimum imaging of delamination are discussed. This approach represents improvement
of CI of composite materials.
2. Samples and Experimental Setup
2.1 Samples
Samples represented square slabs of woven fabric CFRP with side of 100mm and
thickness of 10mm. Each sample had 25 layers of twill weave fabric with alternating
orientation. Three of the samples had a polymer film applied to the impact surfaces.
Figure 1 shows photographs of the CFRP samples taken from the impact side. Table 1
shows impact energies for each sample. A woven fabric CFRP sample with drilled holes
of 6mm diameter has been capacitively imaged for reference. Comparison of capacitive

MANUSCRIP
T
ACCEPTED
ACCEPTED MANUSCRIPTimages of drilled holes with those of impact damage demonstrated that CI of the latter
reveals bigger area due to the subsurface damage than due to the visible impact dent.
2.2 Ultrasonic Phased Array Setup
Reference NDT scans of the samples were carried out using an ultrasonic phased array
(PA) instrument, Olympus Omni-Scan MX2 and a wheel PA probe RollerFORM
(central frequency 5MHz, 64 elements, element pitch 0.8mm). Samples were scanned
using an XYZ CNN scanner from the surface opposite to the impact.
2.3 Capacitive Imaging Setup
The capacitive probe consisted of two coplanar rectangular electrodes parallel to the
sample surface, as shown in Figure 2. An impedance analyser Agilent 4395A was used
to measure impedance variation (series resistance and series capacitance) of the
coplanar capacitor in the range of swept excitation frequencies from 100kHz to
500MHz. The CI probe was moved above sample surface in a stepwise motion utilising
a XYZ scanner. The scanned are was 70mm × 70mm. The steps were 1mm in X and
2mm in Y directions.
Figure 2. Drawing of the capacitive probe

MANUSCRIP
T
ACCEPTED
ACCEPTED MANUSCRIPT
(a) (b)
(c) (d)
(e) (f)
Figure 1. Photographs of the CFRP samples, impact side: (a) IG4J-08A, (b) IG4Q-04H, (c) IG4Q-04N,
(d) IG4J-08G, (e) IG4A-01C, (f) IG4J-08B
3. Results and discussion
MANUSCRIP
T
ACCEPTED
ACCEPTED MANUSCRIPT
(a)
(b)
(c)

MANUSCRIP
T
ACCEPTED
ACCEPTED MANUSCRIPT
(d)
(e)
(f)
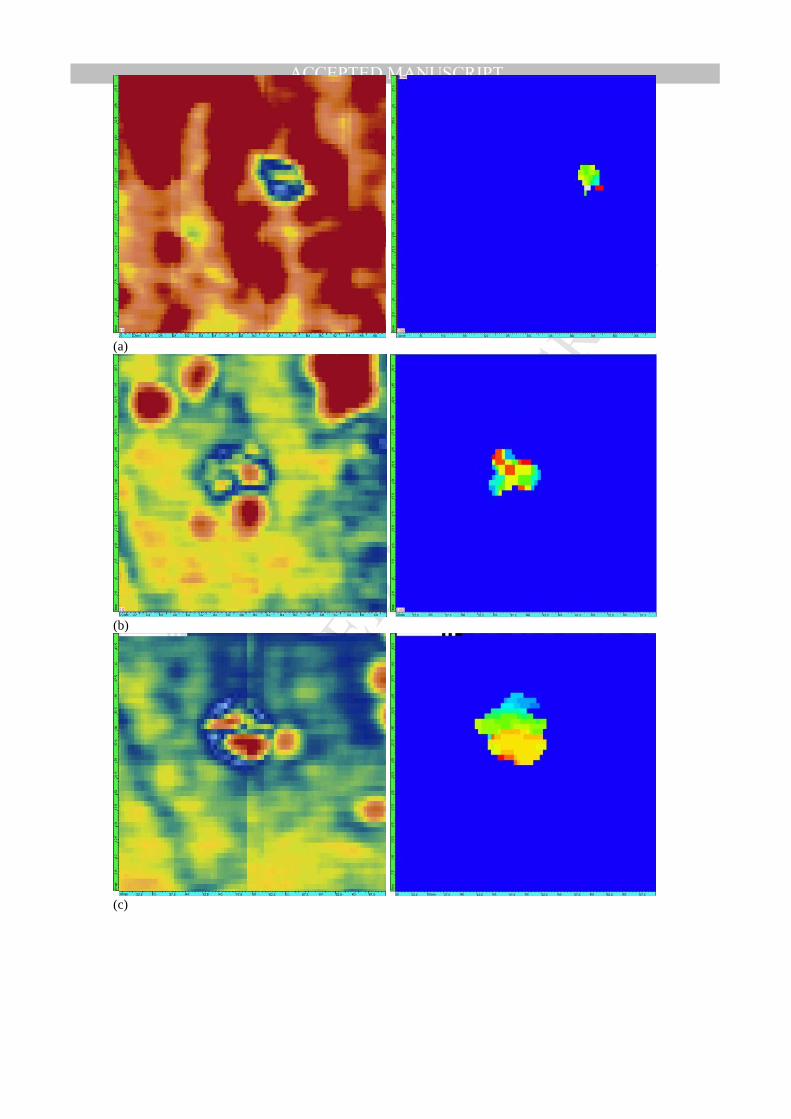
Figure 3. Ultrasonic C-scans (40mm X 40mm) of delamination due to impact in the CFRP samples, left
column represents peak amplitude, right column represents thickness: (a) IG4J-08A, (b) IG4Q-04H, (c)
IG4Q-04N, (d) IG4J-08G, (e) IG4A-01C, (f) IG4J-08B
MANUSCRIP
T
ACCEPTED
ACCEPTED MANUSCRIPTFigure 3 shows ultrasonic C-scans of delaminations due to impacts in the CFRP samples
acquired from the reverse sides of the samples. Areas of the C-scans are 40mm X
40mm. Left column represents peak amplitude and right column represents thickness C-
scans. The delamination area grows with increasing impact energy.
Notice that samples (b), (c) and (e) which had polymer films on the impact surfaces (see
Fig. 1) have peak amplitude backgrounds which differ from the rest of the samples due
to reduced acoustic impedance on the interfaces with the films.
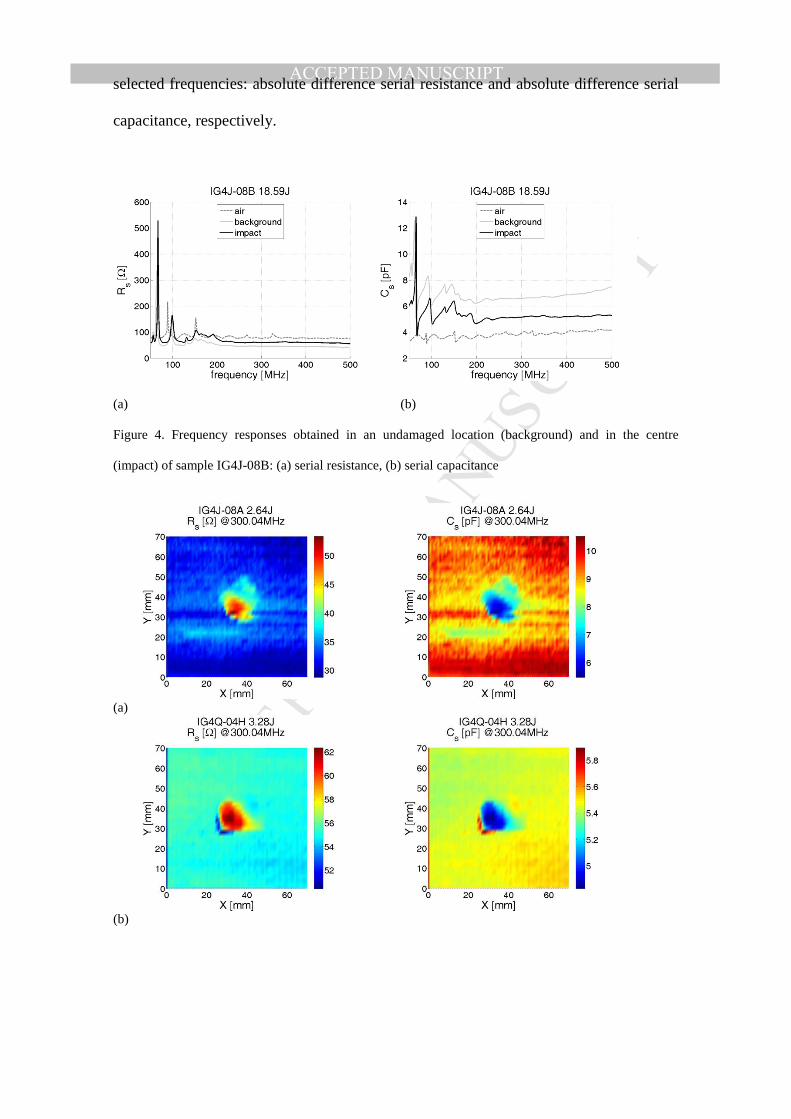
Responses of the CI transducer are obtained in form of a capacitor impedance Z = Rs +
1/jωCs, where Rs is the series resistance (real part), ω=2πf, f being the excitation
frequency, Cs is the series capacitance. Figures 4(a&b) show frequency responses
obtained in an undamaged location (background) and in the centre (impact) of sample
IG4J-08B: serial resistance and serial capacitance, respectively. As expected,
capacitance between the coplanar electrodes increases with approach of a dielectric
material. Resistance also increases due to eddy currents losses in the conductive carbon
fibre. Multiple resonances can be observed between 100kHz and 200MHz. Certainly,
the real electric circuit of the coplanar capacitor electromagnetically coupled with the
CFRP material is much more complex than the simplified lumped component model
consisting of series resistance and series capacitance assumed by the impedance
analyser. Moreover, such a model depends on simplifying assumptions appropriate for a
particular excitation frequency. The material structure of CFRP is very complex from
the electromagnetic point of view [20, 22], carbon fibres insulated by resin represent a
complex network of capacitances. Electrical contact between woven fibres effectively
represents a network of mesoscopic coils in which eddy currents are induced. Moreover,
taking into account that depth of penetration of electromagnetic field into the sample
decreases with increasing frequency, it is obvious that at lower frequencies the
capacitive transducer is electromagnetically coupled with thicker layer of CFRP.

MANUSCRIP
T
ACCEPTED
ACCEPTED MANUSCRIPTHowever, evaluating the skin depth in CFRP is very challenging due to its
inhomogeneous and anisotropic properties. Spectral analysis of CI response is a simple
experimental way to determine appropriate excitation frequency of inspection of given
material. Based on frequency responses shown in Figure 4 it can be concluded that
stable capacitive images can be obtained above 200MHz, since capacitive images at or
near resonance frequencies offer low sensitivity/resolution.
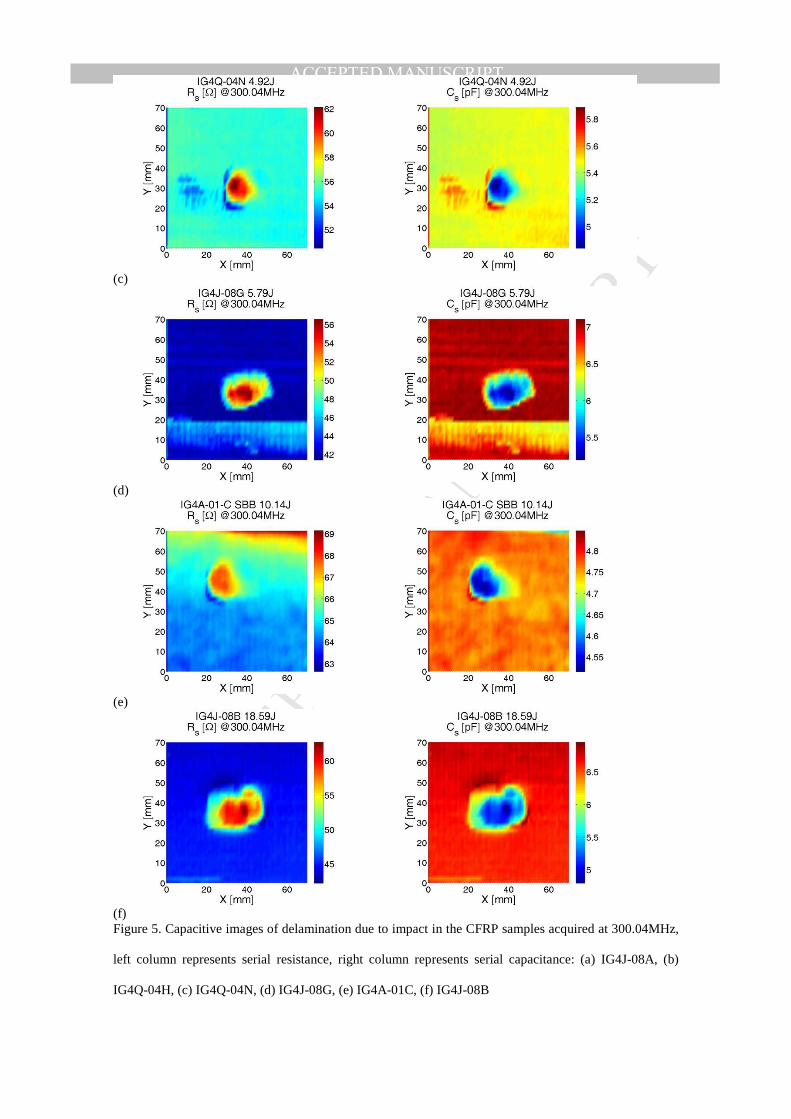
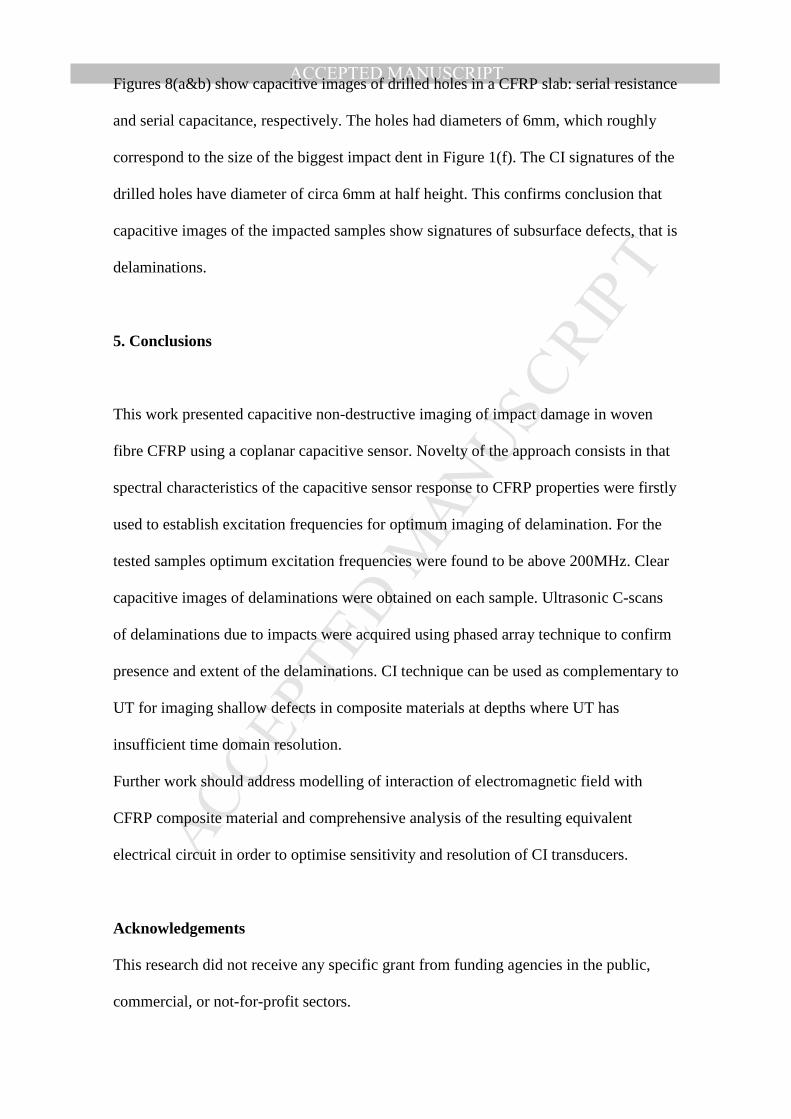
Figures 5(a-f) show capacitive images of delaminations caused by impact in the CFRP
samples acquired at 300.04MHz, the left column representing series resistance and the
right column representing series capacitance. For each sample a clear image of damage
is obtained with the area of the defect response being much bigger than area of the
visible flaw on the samples’ surfaces caused by impact. The sizes of the impact damage
signatures in the capacitive images are comparable with those shown in ultrasonic PA
C-scans, Fig.3. This indicates that capacitive images of the impacted samples show
signatures of subsurface defects, that is the delaminations. It has to be pointed out that
the edges of impact dents were flat for the most of the samples, therefore the CI
responses are not due to tilting of the transducer. Notice that samples (b), (c) and (e)
which had polymer films on the impact surfaces (see Fig. 1) have background signals
which differ from the rest of the samples due to different dielectric properties on the
interfaces with the films.
Figures 6(a&b) show spectrograms obtained along a single line scan in X direction
across sample IG4J-08B at Y = 35mm (B-scans): relative difference serial resistance
and relative difference serial capacitance, respectively. A spectrogram is a 2D
representation of the spectrum of frequencies in the CI response as they vary with the
scan distance across a sample. Top of a spectrogram (highest frequency) corresponds to
the sample surface due to the skin depth. Figures 7(a&b) illustrate line scans obtained
along a single line scan in X direction across sample IG4J-08B at Y = 35mm at three
MANUSCRIP
T
ACCEPTED
ACCEPTED MANUSCRIPTselected frequencies: absolute difference serial resistance and absolute difference serial
capacitance, respectively.
(a) (b)
Figure 4. Frequency responses obtained in an undamaged location (background) and in the centre
(impact) of sample IG4J-08B: (a) serial resistance, (b) serial capacitance
(a)
(b)
MANUSCRIP
T
ACCEPTED
ACCEPTED MANUSCRIPT
(c)
(d)
(e)
(f) Figure 5. Capacitive images of delamination due to impact in the CFRP samples acquired at 300.04MHz,
left column represents serial resistance, right column represents serial capacitance: (a) IG4J-08A, (b)
IG4Q-04H, (c) IG4Q-04N, (d) IG4J-08G, (e) IG4A-01C, (f) IG4J-08B

MANUSCRIP
T
ACCEPTED
ACCEPTED MANUSCRIPT
(a) (b)
Figure 6. Spectrograms obtained along a single line scan in X direction across sample IG4J-08B at Y =
35mm (B-scans): (a) relative difference serial resistance, (b) relative difference serial capacitance
Figure 7. Line scans obtained along a single line scan in X direction across sample IG4J-08B at Y =
35mm at three selected frequencies: (a) absolute difference serial resistance, (b) absolute difference serial
capacitance
(a) (b)
Figure 8. Capacitive images of drilled holes in a CFRP slab: (a) serial resistance, (b) serial capacitance
MANUSCRIP
T
ACCEPTED
ACCEPTED MANUSCRIPTFigures 8(a&b) show capacitive images of drilled holes in a CFRP slab: serial resistance
and serial capacitance, respectively. The holes had diameters of 6mm, which roughly
correspond to the size of the biggest impact dent in Figure 1(f). The CI signatures of the
drilled holes have diameter of circa 6mm at half height. This confirms conclusion that
capacitive images of the impacted samples show signatures of subsurface defects, that is
delaminations.
5. Conclusions
This work presented capacitive non-destructive imaging of impact damage in woven
fibre CFRP using a coplanar capacitive sensor. Novelty of the approach consists in that
spectral characteristics of the capacitive sensor response to CFRP properties were firstly
used to establish excitation frequencies for optimum imaging of delamination. For the
tested samples optimum excitation frequencies were found to be above 200MHz. Clear
capacitive images of delaminations were obtained on each sample. Ultrasonic C-scans
of delaminations due to impacts were acquired using phased array technique to confirm
presence and extent of the delaminations. CI technique can be used as complementary to
UT for imaging shallow defects in composite materials at depths where UT has
insufficient time domain resolution.
Further work should address modelling of interaction of electromagnetic field with
CFRP composite material and comprehensive analysis of the resulting equivalent
electrical circuit in order to optimise sensitivity and resolution of CI transducers.
Acknowledgements
This research did not receive any specific grant from funding agencies in the public,
commercial, or not-for-profit sectors.
MANUSCRIP
T
ACCEPTED
ACCEPTED MANUSCRIPTReferences
1. Grady, J.E., Impact Damage in Composite Laminates, 1988.
2. Chung-Yue, W. and C.H. Yew, Impact damage in composite laminates. Computers &
Structures, 1990. 37(6): p. 967-982.
3. Richardson, M.O.W. and M.J. Wisheart, Review of low-velocity impact properties of
composite materials. Composites Part A: Applied Science and Manufacturing, 1996.
27(12 PART A): p. 1123-1133.
4. Adams, R.D. and P. Cawley, A review of defect types and nondestructive testing
techniques for composites and bonded joints. NDT International, 1988. 21(4): p. 208-
222.
5. Suemasu, H., Impact Damage in Composite Laminates, in POLYMER COMPOSITES From
Nano- to Macro-Scale, K. Friedrich, S. Fakirov, and Z. Zhang, Editors. 2005, Springer
Science. p. 289-307.
6. Liu, D., Impact-Induced Delamination-A View of Bending Stiffness Mismatching. Journal
of Composite Materials, 1988. 22(7): p. 674-692.
7. Sultan, M.T.H., et al., On impact damage detection and quantification for CFRP
laminates using structural response data only. Mechanical Systems and Signal
Processing, 2011. 25(8): p. 3135-3152.
8. Gaudenzi, P., et al., On the evaluation of impact damage on composite materials by
comparing different NDI techniques. Composite Structures, 2014. 118(1): p. 257-266.
9. Karbhari, V., ed. Non-Destructive Evaluation (NDE) of Polymer Matrix Composites.
2013, Woodhead Publishing. 716.
10. Katunin, A., K. Dragan, and M. Dziendzikowski, Damage identification in aircraft
composite structures: A case study using various non-destructive testing techniques.
Composite Structures, 2015. 127: p. 1-9.
11. Dong, J., et al., Nondestructive evaluation of forced delamination in glass fiber-
reinforced composites by terahertz and ultrasonic waves. Composites Part B:
Engineering, 2015. 79: p. 667-675.
12. Meola, C., et al., Nondestructive evaluation of carbon fibre reinforced composites with
infrared thermography and ultrasonics. Composite Structures, 2015. 134: p. 845-853.
13. Sohn, H., et al., Delamination detection in composites through guided wave field image
processing. Composites Science and Technology, 2011. 71(9): p. 1250-1256.
14. Flynn, E.B., et al., Imaging and characterizing structural defects through the estimation
of local dispersion curves, in Key Engineering Materials2013. p. 956-961.
15. Rogge, M.D. and C.A.C. Leckey, Characterization of impact damage in composite
laminates using guided wavefield imaging and local wavenumber domain analysis.
Ultrasonics, 2013. 53(7): p. 1217-1226.
16. Leckey, C.A.C., M.D. Rogge, and F. Raymond Parker, Guided waves in anisotropic and
quasi-isotropic aerospace composites: Three-dimensional simulation and experiment.
Ultrasonics, 2014. 54(1): p. 385-394.
17. Manson, G., et al., Some experimental observations on the detection of composite
damage using lamb waves. Strain, 2011. 47(SUPPL. 1): p. e254-e268.
18. Park, B., Y.K. An, and H. Sohn, Visualization of hidden delamination and debonding in
composites through noncontact laser ultrasonic scanning. Composites Science and
Technology, 2014. 100: p. 10-18.
19. Karabutov, A.A. and N.B. Podymova, Quantitative analysis of the influence of voids and
delaminations on acoustic attenuation in CFRP composites by the laser-ultrasonic
spectroscopy method. Composites Part B: Engineering, 2014. 56: p. 238-244.
20. Heuer, H., et al. Process monitoring for resins, carbon fiber fabrics, preforms and
consolidated CFRPS by HF radio wave techniques. in 54th Annual British Conference of
Non-Destructive Testing, NDT 2015. 2015.

MANUSCRIP
T
ACCEPTED
ACCEPTED MANUSCRIPT21. Heuer, H., M. Schulze, and R. Heere. Non-destructive flaw detection in in-situ carbon
fibre reinforced composites using eddy-current. in Proceedings of the 7th International
Conference on FRP Composites in Civil Engineering, CICE 2014. 2014.
22. Heuer, H., M.H. Schulze, and N. Meyendorf, Non-destructive evaluation (NDE) of
composites: Eddy current techniques, in Non-Destructive Evaluation (NDE) of Polymer
Matrix Composites: Techniques and Applications2013. p. 33-55.
23. Mizukami, K., et al., Detection of in-plane fiber waviness in cross-ply CFRP laminates
using layer selectable eddy current method. Composites Part A: Applied Science and
Manufacturing, 2016. 82: p. 108-118.
24. Mizukami, K., et al., Detection of in-plane and out-of-plane fiber waviness in
unidirectional carbon fiber reinforced composites using eddy current testing.
Composites Part B: Engineering, 2016. 86: p. 84-94.
25. Salski, B., et al., Non-destructive testing of carbon-fibre-reinforced polymer materials
with a radio-frequency inductive sensor. Composite Structures, 2015. 122: p. 104-112.
26. Goldfine, N.J., et al., Method and apparatus for non-destructive evaluation of
materials, 2015: USA. p. 25.
27. Mook, G., R. Lange, and O. Koeser, Non-destructive characterisation of carbon-fibre-
reinforced plastics by means of eddy-currents. Composites Science and Technology,
2001. 61(6): p. 865-873.
28. Diamond, G.G., D.A. Hutchins, and T.H. Gan. Defect location using capacitative
imaging. in AIP Conference Proceedings. 2008.
29. Sharma, D., et al., Non-destructive testing of materials using capacitive sensing
technique. MIT International Journal of Electronics and Communication Engineering,
2011. 1(2): p. 73-77.
30. Yin, X., et al., Non-destructive evaluation of concrete using a capacitive imaging
technique: Preliminary modelling and experiments. Cement and Concrete Research,
2010. 40(12): p. 1734-1743.
31. Asmatulu, R., B. Venishetty, and E. Asmatulu. Non-destructive testing of fiber
reinforced composite materials using a capacitance bridge. in ASME International
Mechanical Engineering Congress and Exposition, Proceedings. 2010.
32. Yin, X., et al., Preliminary studies on the design principles of capacitive imaging probes
for non-destructive evaluation. International Journal of Applied Electromagnetics and
Mechanics, 2013. 42(3): p. 447-470.
33. Bowler, N. and T. Chen, Concentric coplanar capacitive sensor for nondestructive
evaluation, 2012, Iowa state university research foundation: USA.
34. Yin, X. and D.A. Hutchins, Non-destructive evaluation of composite materials using a
capacitive imaging technique. Composites Part B: Engineering, 2012. 43(3): p. 1282-
1292.
MANUSCRIP
T
ACCEPTED
ACCEPTED MANUSCRIPTFigure Captions
Figure 1. Photographs of the CFRP samples, impact side: (a) IG4J-08A, (b) IG4Q-04H,
(c) IG4Q-04N, (d) IG4J-08G, (e) IG4A-01C, (f) IG4J-08B
Figure 2. Drawing of the capacitive probe
Figure 3. Ultrasonic C-scans (40mm X 40mm) of delamination due to impact in the
CFRP samples, left column represents peak amplitude, right column represents
thickness: (a) IG4J-08A, (b) IG4Q-04H, (c) IG4Q-04N, (d) IG4J-08G, (e) IG4A-01C,
(f) IG4J-08B
Figure 4. Frequency responses obtained in an undamaged location (background) and in
the centre (impact) of sample IG4J-08B: (a) serial resistance, (b) serial capacitance
Figure 5. Capacitive images of delamination due to impact in the CFRP samples
acquired at 300.04MHz, left column represents serial resistance, right column represents
serial capacitance: (a) IG4J-08A, (b) IG4Q-04H, (c) IG4Q-04N, (d) IG4J-08G, (e)
IG4A-01C, (f) IG4J-08B
Figure 6. Spectrograms obtained along a single line scan in X direction across sample
IG4J-08B at Y = 35mm (B-scans): (a) relative difference serial resistance, (b) relative
difference serial capacitance
Figure 7. Line scans obtained along a single line scan in X direction across sample
IG4J-08B at Y = 35mm at three selected frequencies: (a) absolute difference serial
resistance, (b) absolute difference serial capacitance
Figure 8. Capacitive images of drilled holes in a CFRP slab: (a) serial resistance, (b)
serial capacitance

MANUSCRIP
T
ACCEPTED
ACCEPTED MANUSCRIPTTables
Table 1. Impact energies
Sample ID IG4J-08A IG4Q-04H IG4Q-04N IG4J-08G IG4A-01C IG4J-08B
Impact energy (J) 2.64 3.28 4.92 5.79 10.14 18.59