
Canonical Correlation Analysis: An overview with application to learning methods By David R....
22
Correlation Correlation Analysis: An Analysis: An overview with overview with application to application to learning methods learning methods By David R. Hardoon, Sandor Szedmak, John Shawe- By David R. Hardoon, Sandor Szedmak, John Shawe- Taylor Taylor School of Electronics and Computer Science, School of Electronics and Computer Science, University of Southampton University of Southampton Published in Neural Computaion, 2004 Published in Neural Computaion, 2004 Presented by: Presented by: Shankar Bhargav Shankar Bhargav
-
date post
21-Dec-2015 -
Category
Documents
-
view
213 -
download
0
Transcript of Canonical Correlation Analysis: An overview with application to learning methods By David R....
Canonical Correlation Canonical Correlation Analysis: An overview with Analysis: An overview with
application to learning application to learning methodsmethods
By David R. Hardoon, Sandor Szedmak, John Shawe-TaylorBy David R. Hardoon, Sandor Szedmak, John Shawe-TaylorSchool of Electronics and Computer Science, University of School of Electronics and Computer Science, University of
SouthamptonSouthamptonPublished in Neural Computaion, 2004Published in Neural Computaion, 2004
Presented by:Presented by:Shankar BhargavShankar Bhargav

Measuring the linear relationship between Measuring the linear relationship between two multi dimensional variablestwo multi dimensional variables
Finding two sets of basis vectors such that Finding two sets of basis vectors such that the correlation between the projections of the correlation between the projections of the variables onto these basis vectors is the variables onto these basis vectors is maximizedmaximized
Determine Correlation CoefficientsDetermine Correlation Coefficients
Canonical Correlation AnalysisCanonical Correlation Analysis

More than one canonical correlations will More than one canonical correlations will be found each corresponding to a different be found each corresponding to a different set of basis vectors/Canonical variatesset of basis vectors/Canonical variatesCorrelations between successively Correlations between successively extracted canonical variates are smaller extracted canonical variates are smaller and smallerand smallerCorrelation coefficients : Proportion of Correlation coefficients : Proportion of correlation between the canonical variates correlation between the canonical variates accounted for by the particular variable. accounted for by the particular variable.
Canonical Correlation AnalysisCanonical Correlation Analysis

Differences with CorrelationDifferences with Correlation
Not dependent on the coordinate system Not dependent on the coordinate system of variablesof variables
Finds direction that yield maximum Finds direction that yield maximum correlationscorrelations

Find basis vectors for two sets of variables x, y Find basis vectors for two sets of variables x, y such that the correlations between the such that the correlations between the projections of the variables onto these basis projections of the variables onto these basis vectorvector
Sx = (x.wx) and Sy = (y.wy)
ρ = E[Sx Sy ]
√ E[Sx2] E[Sy
2]
ρ = E[(xT wx yT wy)]
√E[(xT wx xT wx) ] E[(yT wy yT wy)]
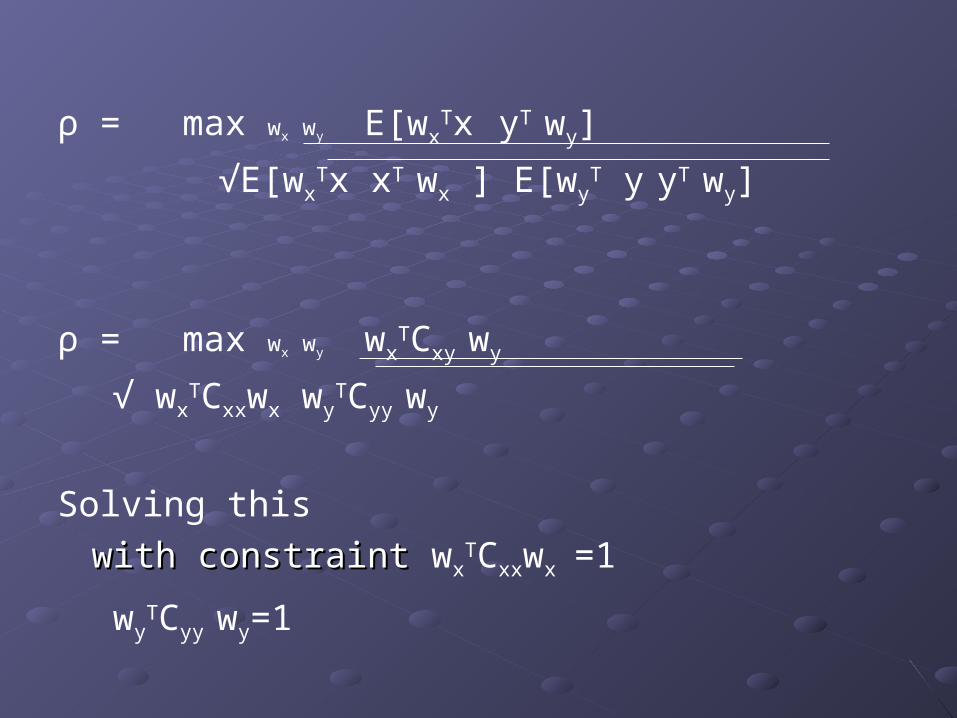
ρ = max wx wy E[wxTx
yT wy]
√E[wxTx xT wx ] E[wy
T y yT wy]
ρ = max wx wy wxTCxy
wy
√ wxTCxxwx wy
TCyy wy
Solving this
with constraint with constraint wxTCxxwx =1
wyTCyy
wy=1

Cxx-1CxyCyy
-1Cyx wx = ρ2 wx
Cyy-1CyxCxx
-1Cxy wy= ρ2 wy
Cxy wy = ρλx Cxx wx
Cyx wx = ρλy Cyy wy
λx=λy-1= wy
TCyywy
√√ wxTCxxwx

CCA in MatlabCCA in Matlab
[ A, B, r, U, V ] = canoncorr(x, y)[ A, B, r, U, V ] = canoncorr(x, y)
x, y : set of variables in the form of matricesx, y : set of variables in the form of matrices Each row is an observationEach row is an observation Each column is an attribute/featureEach column is an attribute/feature
A, B: Matrices containing the correlation coefficientA, B: Matrices containing the correlation coefficientr : Column matrix containing the canonical r : Column matrix containing the canonical
correlations (Successively decreasing)correlations (Successively decreasing)U, V: Canonical variates/basis vectors for A,B U, V: Canonical variates/basis vectors for A,B
respectivelyrespectively

Interpretation of CCAInterpretation of CCA
Correlation coefficient represents unique Correlation coefficient represents unique contribution of each variable to relationcontribution of each variable to relationMulticollinearity may obscure relationshipsMulticollinearity may obscure relationshipsFactor Loading : Correlations between the Factor Loading : Correlations between the canonical variates (basis vector) and the canonical variates (basis vector) and the variables in each setvariables in each setProportion of variance explained by the Proportion of variance explained by the canonical variates can be inferred by canonical variates can be inferred by factor loadingfactor loading

Redundancy CalculationRedundancy Calculation
Redundancy Redundancy leftleft =[ ∑ (loadings =[ ∑ (loadingsleftleft22)/p]*R)/p]*Rcc
22
Redundancy Redundancy rightright =[ ∑ (loadings =[ ∑ (loadingsrightright22)/q]*R)/q]*Rcc
22
p – Number of variable in the first (left) set of variablesp – Number of variable in the first (left) set of variables q – Number of variable in the second (right) set of q – Number of variable in the second (right) set of
variablesvariablesRc2 – Respective squared canonical correlationRc2 – Respective squared canonical correlation
Since successively extracted roots are uncorrelated we Since successively extracted roots are uncorrelated we can sum the redundancies across all correlations to can sum the redundancies across all correlations to get a single index of redundancy.get a single index of redundancy.
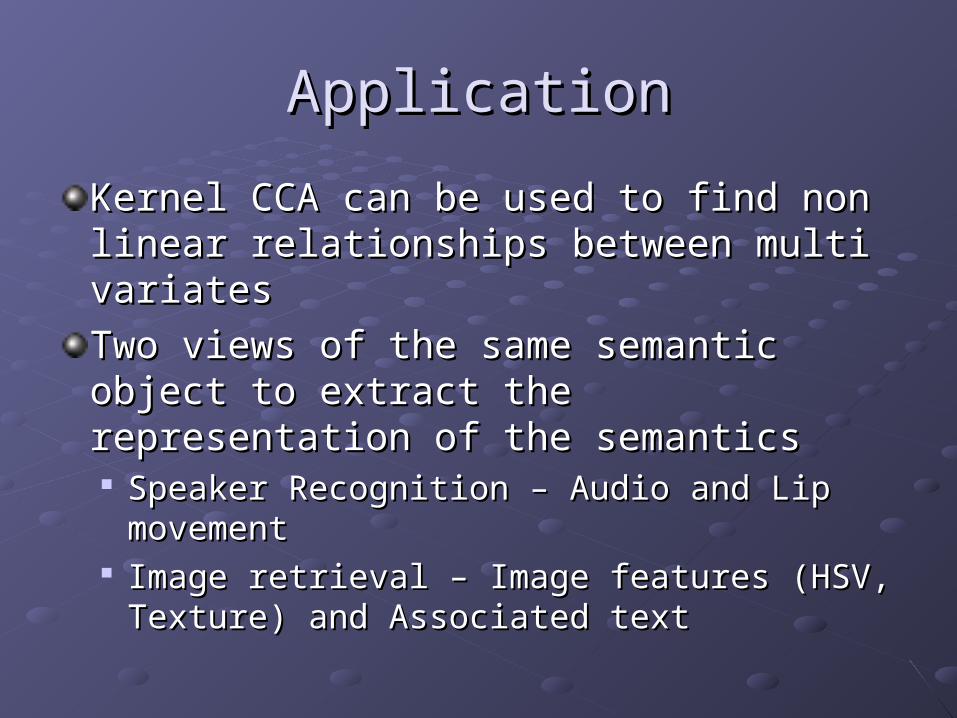
ApplicationApplication
Kernel CCA can be used to find non linear Kernel CCA can be used to find non linear relationships between multi variatesrelationships between multi variates
Two views of the same semantic object to Two views of the same semantic object to extract the representation of the semanticsextract the representation of the semantics Speaker Recognition – Audio and Lip Speaker Recognition – Audio and Lip
movementmovement Image retrieval – Image features (HSV, Image retrieval – Image features (HSV,
Texture) and Associated textTexture) and Associated text

Use of KCCA in cross-modal Use of KCCA in cross-modal retrievalretrieval
400 records of JPEG images for each class 400 records of JPEG images for each class with associated text and a total of 3 classeswith associated text and a total of 3 classes
Data was split randomly into 2 parts for Data was split randomly into 2 parts for training and testtraining and test
Features Features Image – HSV Color, Gabor textureImage – HSV Color, Gabor texture
Text – Term frequenciesText – Term frequencies Results were taken for an average of 10 runsResults were taken for an average of 10 runs


Cross-modal retrievalCross-modal retrieval
Content based retrieval: Retrieve images Content based retrieval: Retrieve images in the same classin the same classTested with 10 and 30 images setsTested with 10 and 30 images sets
where countwhere countjjkk = 1 if the image k in the set is of = 1 if the image k in the set is of
the same label as the text query present in the same label as the text query present in the set, else countthe set, else count jj
kk = 0. = 0.
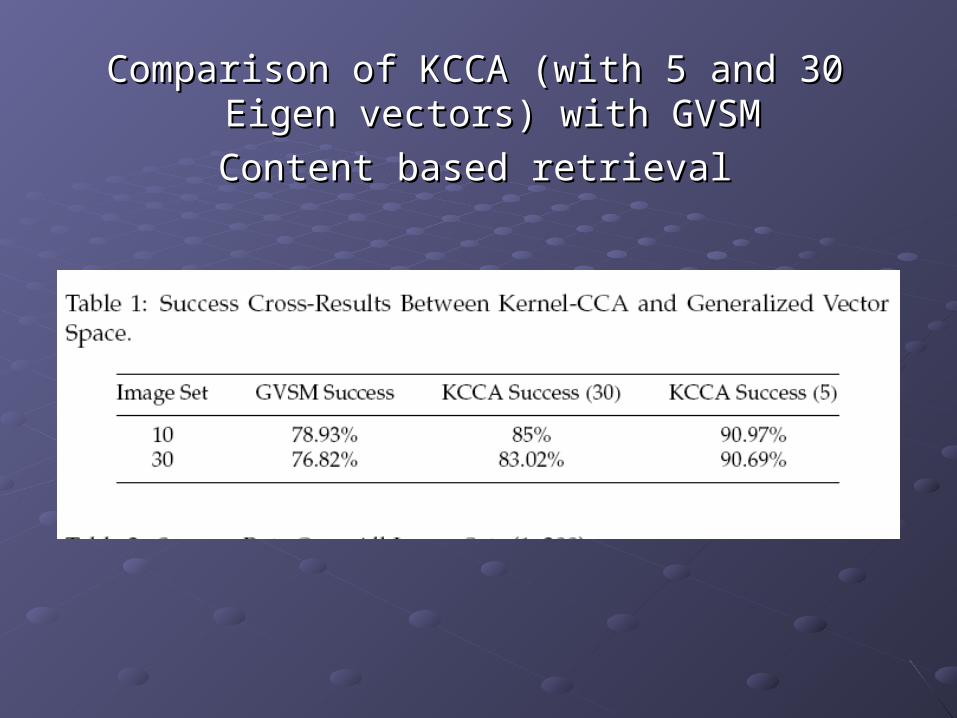
Comparison of KCCA (with 5 and 30 Eigen Comparison of KCCA (with 5 and 30 Eigen vectors) with GVSMvectors) with GVSM
Content based retrievalContent based retrieval

`̀

Mate based retrievalMate based retrieval
Match the exact image among the Match the exact image among the selected retrieved imagesselected retrieved images
Tested with 10 and 30 images setsTested with 10 and 30 images sets
where countwhere countjj = 1 if the exact matching image = 1 if the exact matching image
was present in the set else it is 0was present in the set else it is 0


Comparison of KCCA (with 30 and 150 Eigen Comparison of KCCA (with 30 and 150 Eigen vectors) with GVSMvectors) with GVSMMate based retrievalMate based retrieval

CommentsComments
The goodThe good Good explanation of CCA and KCCAGood explanation of CCA and KCCA Innovative use of KCCA in image retrieval applicationInnovative use of KCCA in image retrieval application
The badThe bad The data set and the number of classes used The data set and the number of classes used
were smallwere small The image set size is not taken into account The image set size is not taken into account
while calculating accuracy in Mate based while calculating accuracy in Mate based retrievalretrieval
Could have done cross-validation testsCould have done cross-validation tests

Limitations and Assumptions of Limitations and Assumptions of CCACCA
At least 40 to 60 times as many cases as At least 40 to 60 times as many cases as variables is recommended to get relliable variables is recommended to get relliable estimates for two roots– estimates for two roots– BarciKowski &BarciKowski & Stevens(1986)Stevens(1986)
Outliers can greatly affect the canonical Outliers can greatly affect the canonical correlationcorrelation
Variables in two sets should not be Variables in two sets should not be completely redundantcompletely redundant

Thank youThank you