Cand.scient thesis By Marianne Aastebøl Minge
107
Chromalveolate evolution: chloroplast replacements in dinoflagellates and the deep phylogeny of Telonema Cand.scient thesis By Marianne Aastebøl Minge Cand.scient thesis University of Oslo The Faculty of Mathematics and Natural Sciences Department of Molecular Biosciences 2005
Transcript of Cand.scient thesis By Marianne Aastebøl Minge

Chromalveolate evolution:
chloroplast replacements in dinoflagellates
and the deep phylogeny of Telonema
Cand.scient thesis
By Marianne Aastebøl Minge
Cand.scient thesis
University of Oslo
The Faculty of Mathematics and Natural Sciences
Department of Molecular Biosciences
2005
2
CONTENTS
ACKNOWLEDGEMENTS 5
1. INTRODUCTION
1.1 The eukaryotic tree of life and its implications for interpretations of evolutionary processes 6
1.2 Exploring eukaryotic bio-diversity by molecular approaches 11
1.3 Organelle evolution: The endosymbiotic origin of the primary plastid 13
1.4 Secondary and tertiary endosymbiosis: recycling of plastids 14
1.5 Dinoflagellates 17
1.6 Dinoflagellates as a model group for investigations of plastid evolution 18
1.7 The chromalveolates: a supergroup defined by a common plastid ancestry 21
1.8 Telonema: a possible early chromalveolate lineage 22
1.9 AIMS AND RATIONALE OF THE STUDY 26
2. MATERIALS AND METHODS
2.1 DNA isolation assays and PCR-based sequence analyses applying small-sclae protist culture 28
2.1.1 Biological material and small-scale culture conditions 28
2.1.2 DNA-isolation assays 30
2.1.3 DNA amplification 31
2.1.4 TOPO-TA cloning 32
2.1.5 Analyzing positive clones 35
2.1.6 Plasmid isolation 35
2.1.7 DNA sequencing 35
2.2 cDNA library constructions from large-scale cultures of dinoflagellates 37
2.2.1 Biological material and large-scale culturing 37
2.2.2 Construction of cDNA libraries 38
2.3 Bioinformatic tools and phylogenetic analyses 39
3
2.3.1 Single-gene and concatenated alignments 39
2.3.2 Primer design 40
2.3.3 Intron folding 41
2.3.4 Selecting protein substitution models for phylogenetic analyses 41
2.3.5 Phylogenetic analyses 41
2.3.6 Analyzing the cDNA-library sequences 43
3. RESULTS
3.1 Testing magnetic bead-based DNA-isolation systems for potential use in environmental sampling 44
3.1.1 Qualitative results using the kits ChlamCAP And DNA direct 45
3.1.2 Detection limit of the ChlamCAP kit 46
3.2 Genomic diversity of dinoflagellates: cDNA libraries from two aberrantly pigmented taxa 47
3.2.1 Karlodinium micrum cDNA library 47
3.2.2 Gymnodinium chlorophorum cDNA library 50
3.3 Specific PCR-amplification of molecular markers and phylogenetic inference of
dinoflagellate sequences 51
3.3.1 Dinoflagellate sequences of possible use in phylogenetic analyses generated in this study 51
3.3.2 A large insertion was found in the Alexandrium tamarense hsp90 gene 52
3.3.3 Finding the best model for phylogenetic inference of dinoflagellate phylogeny 53
3.3.4 Phylogenetic inference of dinoflagellates using HSP90, SSU, LSU, actin and GAPDH sequences 56
3.4 Phylogenetic analyses of Telonema 64
3.4.1 Phylogenetic markers generated from Telonema in this study 64
3.4.2 Phylogenetic inference using HSP90, alpha-tubulin and beta-tubulin 64
4. DISCUSSION
4.1 Molecular surveys of environmental samples provide increased knowledge about eukaryotic diversity 69
4.1.1 Environmental sequences can reveal unknown eukaryotic diversity 69
4.1.2 Testing of the kit ChlamCAP (Genpoint) for potential use in environmental surveys 70
4.1.3 Measuring differences in PCR-yield between two magnetic bead-based kits 70

4
4.2 Insight to the genomics of the dinflagellates applying sequences from cDNA libraries
and targeted PCR 72
4.2.1 cDNA libraries from two dinoflagellates with aberrant plastids 72
4.2.2 Dinoflagellate introns have various branching sequences 74
4.3 Investigations of chromalveolate evolution 75
4.3.1 Dinoflagellate phylogeny inferred by nuclear encoded protein genes 75
4.3.2 Dinoflagellate haptophyte- and prasinophyte-derived plastids were each acquired only once,
replacing the ancestral peridinin plastid 77
4.3.3 Phylogenetic inference of the recently re-discovered Telonema clade 80
4.3.4 Establishing Telonema as a deep, diverging eukaryotic lineage by combining phylogenetic
inference of gene sequence and morphological traits 81
4.3.5 Chromalveolate monophyly are not shown in the phylogenetic analyses including the
Telonema lineage 83
4.3.6 Plastid evolution and the putative monophyly of chromalveolates 84
4.4 Concluding remarks and future work 89
REFERENCES 92
APPENDIX 1 –Accession numbers of used sequences 100
APPENDIX 2 – Culture medias 106
APPENDIX 3 – Paper 1: Telonemia, a new protist phylum with ultrastructual affinities
to chromalveolates
Paper 2: Combined HSP90 and rRNA sequence phylogeny supports multiple
replacements of dinoflagellate plastids

5
ACKNOWLEDGEMENTS
The laboratory and bioinformatical work was carried out at the at Centre for Ecological
and Evolutionary Synthesis (CEES) at the University of Oslo, and at Tom Cavalier-
Smith’s lab at the Zoology building, University of Oxford in the period from November
2003-June 2005.
During the work on my thesis, I have enjoyed interaction with many inspiring and
wonderful people. I want to thank Kjetill S. Jakobsen, who has been an enthusiastic and
encouraging supervisor. Kamran Shalchian-Tabrizi has been a great support, and he
deserves thanks for always being remarkably patient, extremely helpful and for teaching
me so much about protist phylogeny. I also want to express my gratitude to both of them
for giving me the opportunity to accompany Kamran’s visit to Oxford University.
Dag Klaveness have taught me all I know about algal-culturing, and has always patiently
answered all my questions. Emelita Nerli, Lise Broch and Sissel Brubak have been
helping me at the DNA-lab and the algal culturing lab. I am also grateful to Nils-
Christian Stenseth at CEES for financial support for my Oxford visit.
I also very much want to thank Tom Cavalier-Smith, Ema Chao, and the others at lab F7
at Oxford University. Tanja Auren, Trym and Folke also deserve big hugs for their
friendliness and hospitality.
I also want to thank my parents and my sister, my grandparents and my friends for their
support.
Finally, I want to thank Espen, for always being there for me.
Marianne Aastebøl Minge, June 2005

6
1. INTRODUCTION
1.1 THE EUKARYOTIC TREE OF LIFE AND ITS IMPLICATIONS FOR
INTERPRETATIONS OF EVOLUTIONARY PROCESSES
The interpretation of the evolutionary history of eukaryotes and their internal phylogeny
has changed dramatically the last few years due to extensive research applying molecular
and morphological methods. The current understanding of eukaryote bio-diversity states
that the eukaryotic tree of life can be divided into five hypothesized supergroups of
related organisms (Cavalier-Smith 2004b; Harper et al. 2005; Keeling 2004b), as shown
in figure 1.1. This interpretation is based on gene analyses of multiple and combined gene
sequences, biochemical features, structural characters and rare genomic events such as
insertions and gene replacements (Cavalier-Smith 2003b; Keeling 2004b). The
supergroups are presently holding only informal names, as no universally accepted names
yet have been determined, and a closer description of the supergroups is given in box 1.1.
Animals, fungi (together: opisthokonts) and amoebozoa are found in one of these
supergroups, the unikont group (Baldauf 1999; Baldauf et al. 2000; Stechmann and
Cavalier-Smith 2002). The remaining four supergroups together constitute the bikonts
(Cavalier-Smith 2003b), comprising the recently discovered rhizaria group, (Archibald et
al. 2003; Cavalier-Smith 2003b; Keeling 2001; Nikolaev et al. 2004), the well-known
plant group, (Baldauf et al. 2000; Moreira et al. 2000), the excavate group (Simpson
2003; Simpson and Patterson 2001) and finally, the chromalveolate supergroup, including
the chromists and alveolates (Baldauf et al. 2000; Cavalier-Smith 1998; Fast et al. 2001;
Harper and Keeling 2003; Harper et al. 2005; Yoon et al. 2002b), which will be the main
subject matter in this study. The precise position of the last common ancestor of all extant
eukaryotic lineages (i.e. the root) of the eukaryotic tree is unclear, however, the root have
been postulated, based on two single amino-acid deletions in the enolase gene, to be
among the excavate lineage (Keeling and Palmer 2000). This suggestion have later been
contradicted in a paper by Stechmann and Cavalier-Smith (Stechmann and Cavalier-
Smith 2002), demonstrating a derived gene-fusion shared by all bikonts, hence indicating
a root near the bifurcation between the unikonts and the bikonts.

7
FIGURE 1.1
Figure 1.1: The hypothesized five divisions (supergroups) of eukaryotes representing the currently known
eukaryotic diversity, consists of the unikonts, comprising the amoebozoa and the opisthokonta (fungi and
animals). The remaining eukaryotic supergroups together comprise the bikonts: the recently recognized
group rhizaria, including the chlorarachniophytes and the cercozoa; the well-known and well-supported
plant-group comprising the red- and green algae, the glaucophytes and the land-plants; the chromalveolates
consisting of dinoflagellates, apicomplexans, ciliates, cryptophytes, haptophytes and heterokonts; and the
excavates, probably the loosest assembly of the supergroups, including the euglenoids and the diplomonads
(Baldauf et al. 2000; Keeling 2004b). Lineages in which plastids are known are marked by green squares.
Figure adapted from Keeling, 2004 (Keeling 2004b). A closer description of the supergroups is given in
box 1.1.
Box 1.1
Unikonts: The unikonts, robustly united by numerous phylogenies, protein insertions and a gene fusion,
comprise the opisthokonts (animals, fungi, choanoflagellates and a range of parasitic and free-living
groups) and the amoebozoa (free-living heterotrophs feeding by use of a pseudopodia)(Simpson and Roger
2004). These organisms all originate from a putative heterotrophic uniciliate ancestor (Cavalier-Smith
2003b).
8
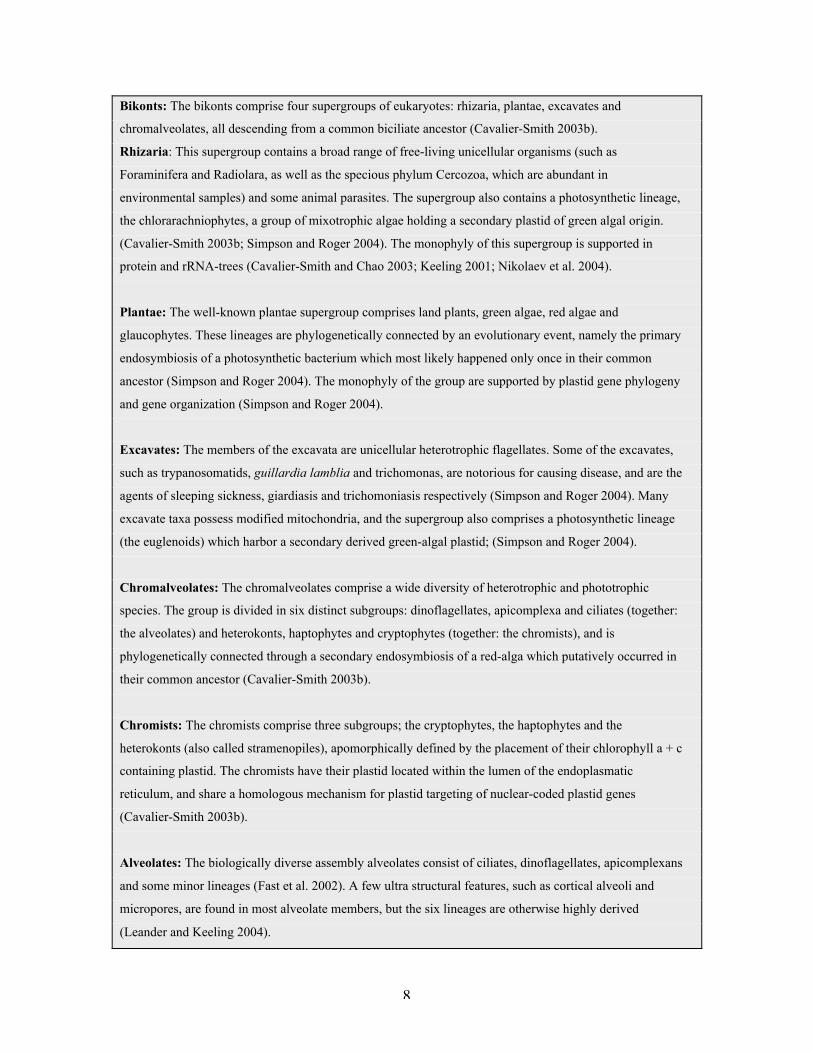
Bikonts: The bikonts comprise four supergroups of eukaryotes: rhizaria, plantae, excavates and
chromalveolates, all descending from a common biciliate ancestor (Cavalier-Smith 2003b).
Rhizaria: This supergroup contains a broad range of free-living unicellular organisms (such as
Foraminifera and Radiolara, as well as the specious phylum Cercozoa, which are abundant in
environmental samples) and some animal parasites. The supergroup also contains a photosynthetic lineage,
the chlorarachniophytes, a group of mixotrophic algae holding a secondary plastid of green algal origin.
(Cavalier-Smith 2003b; Simpson and Roger 2004). The monophyly of this supergroup is supported in
protein and rRNA-trees (Cavalier-Smith and Chao 2003; Keeling 2001; Nikolaev et al. 2004).
Plantae: The well-known plantae supergroup comprises land plants, green algae, red algae and
glaucophytes. These lineages are phylogenetically connected by an evolutionary event, namely the primary
endosymbiosis of a photosynthetic bacterium which most likely happened only once in their common
ancestor (Simpson and Roger 2004). The monophyly of the group are supported by plastid gene phylogeny
and gene organization (Simpson and Roger 2004).
Excavates: The members of the excavata are unicellular heterotrophic flagellates. Some of the excavates,
such as trypanosomatids, guillardia lamblia and trichomonas, are notorious for causing disease, and are the
agents of sleeping sickness, giardiasis and trichomoniasis respectively (Simpson and Roger 2004). Many
excavate taxa possess modified mitochondria, and the supergroup also comprises a photosynthetic lineage
(the euglenoids) which harbor a secondary derived green-algal plastid; (Simpson and Roger 2004).
Chromalveolates: The chromalveolates comprise a wide diversity of heterotrophic and phototrophic
species. The group is divided in six distinct subgroups: dinoflagellates, apicomplexa and ciliates (together:
the alveolates) and heterokonts, haptophytes and cryptophytes (together: the chromists), and is
phylogenetically connected through a secondary endosymbiosis of a red-alga which putatively occurred in
their common ancestor (Cavalier-Smith 2003b).
Chromists: The chromists comprise three subgroups; the cryptophytes, the haptophytes and the
heterokonts (also called stramenopiles), apomorphically defined by the placement of their chlorophyll a + c
containing plastid. The chromists have their plastid located within the lumen of the endoplasmatic
reticulum, and share a homologous mechanism for plastid targeting of nuclear-coded plastid genes
(Cavalier-Smith 2003b).
Alveolates: The biologically diverse assembly alveolates consist of ciliates, dinoflagellates, apicomplexans
and some minor lineages (Fast et al. 2002). A few ultra structural features, such as cortical alveoli and
micropores, are found in most alveolate members, but the six lineages are otherwise highly derived
(Leander and Keeling 2004).
9
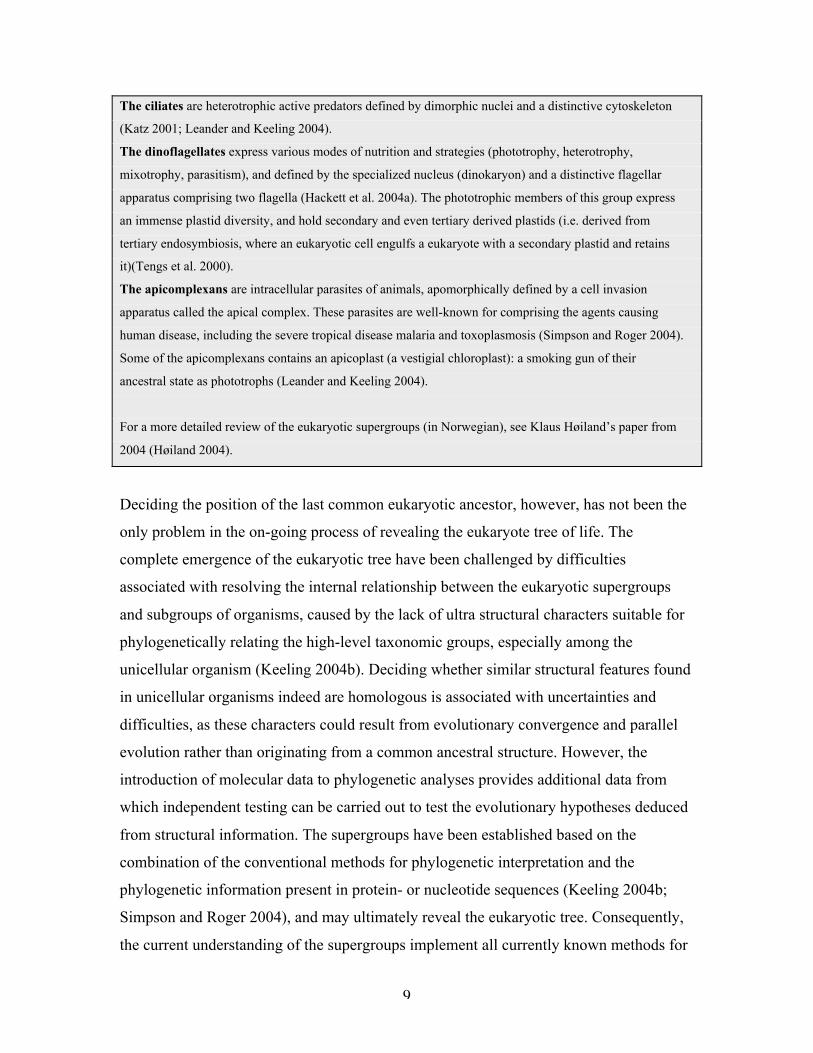
The ciliates are heterotrophic active predators defined by dimorphic nuclei and a distinctive cytoskeleton
(Katz 2001; Leander and Keeling 2004).
The dinoflagellates express various modes of nutrition and strategies (phototrophy, heterotrophy,
mixotrophy, parasitism), and defined by the specialized nucleus (dinokaryon) and a distinctive flagellar
apparatus comprising two flagella (Hackett et al. 2004a). The phototrophic members of this group express
an immense plastid diversity, and hold secondary and even tertiary derived plastids (i.e. derived from
tertiary endosymbiosis, where an eukaryotic cell engulfs a eukaryote with a secondary plastid and retains
it)(Tengs et al. 2000).
The apicomplexans are intracellular parasites of animals, apomorphically defined by a cell invasion
apparatus called the apical complex. These parasites are well-known for comprising the agents causing
human disease, including the severe tropical disease malaria and toxoplasmosis (Simpson and Roger 2004).
Some of the apicomplexans contains an apicoplast (a vestigial chloroplast): a smoking gun of their
ancestral state as phototrophs (Leander and Keeling 2004).
For a more detailed review of the eukaryotic supergroups (in Norwegian), see Klaus Høiland’s paper from
2004 (Høiland 2004).
Deciding the position of the last common eukaryotic ancestor, however, has not been the
only problem in the on-going process of revealing the eukaryote tree of life. The
complete emergence of the eukaryotic tree have been challenged by difficulties
associated with resolving the internal relationship between the eukaryotic supergroups
and subgroups of organisms, caused by the lack of ultra structural characters suitable for
phylogenetically relating the high-level taxonomic groups, especially among the
unicellular organism (Keeling 2004b). Deciding whether similar structural features found
in unicellular organisms indeed are homologous is associated with uncertainties and
difficulties, as these characters could result from evolutionary convergence and parallel
evolution rather than originating from a common ancestral structure. However, the
introduction of molecular data to phylogenetic analyses provides additional data from
which independent testing can be carried out to test the evolutionary hypotheses deduced
from structural information. The supergroups have been established based on the
combination of the conventional methods for phylogenetic interpretation and the
phylogenetic information present in protein- or nucleotide sequences (Keeling 2004b;
Simpson and Roger 2004), and may ultimately reveal the eukaryotic tree. Consequently,
the current understanding of the supergroups implement all currently known methods for

10
phylogeny, interpreting the internal relationship based on ultra-structures, biochemistry
and nuclear sequences.
Despite the extensive research resulting in the establishment of the supergroups, the
evolutionary relationships between the groups remains unclear (Keeling 2004b). The
deficient resolution of the eukaryotic phylogeny has implications for the current
understanding of evolutionary processes, as a complete comprehension of evolutionary
events requires knowledge about the phylogenetic relationships among the organisms in
which the processes are found, making the task of unveiling the eukaryotic phylogeny the
most important for correctly interpreting major evolutionary processes (Keeling 2004b).
The introduction of molecular sequences to phylogenetic inference provided a new and
promising method for taxonomical classification, and in the initial attempts of
reconstructing the eukaryotic tree, a resolved phylogenetic tree was reconstructed based
on the small ribosomal subunit (SSU) gene sequence (Sogin 1991). However, as more
extensive analyses applying larger data-sets and several molecular markers were carried
out, the rRNA phylogeny was shown to suffer from several limitations, mostly due to
major systematic biases in the evolutionary mode of the SSU gene sequence that caused
ambiguous placement of derived species with long branches (Cavalier-Smith 2004b).
Long-branch attraction (LBA) artifacts are caused by variable evolution rate between
species, as sequences with high evolution rate artificially attract to each other and to early
diverging sequences (Dacks and Doolittle 2001). The practical problems associated with
the erroneous LBA constructs are illustrated in the early rRNA phylogeny, where the
mitochondrial-lacking lineages such as parabasalia, metamonads and Microsporidia were
placed as early diverging lineages in the eukaryotic tree (Sogin and Silberman 1998). As
the interpretation of the macroevolutionary eukaryotic history was based on this
topology, the archezoa hypothesis was postulated, claiming an amitochondriate origin of
eukaryotes (Cavalier-Smith 1998; Roger 1999). However, when long-branched outgroup
taxa archaebacteria were removed from the analyses, the early divergence of these
lineages was rejected, and the potentially deep-branching eukaryotic lineages were placed
within the supergroup excavates and even among the opisthokonta, as the lineage
Microsporidia was placed as close relative to fungi (Roger and Silberman 2002;
Silberman et al. 2002). Despite the difficulties related to the phylogenetic use of the small
ribosomal gene sequence, this is still used as an important marker for investigation of

11
eukaryotic phylogeny. However, as every gene sequence probably suffer from systematic
biases and random errors (but most likely not the same biases and errors), analyses based
on multiple gene sequences have been shown to provide increased support and
phylogenetic resolution in several parts of the eukaryotic tree (Baldauf et al. 2000;
Bapteste et al. 2002; Yoon et al. 2002b), and may contribute to a complete reconstruction
of a global eukaryotic tree.
In addition to find molecular and structural markers appropriate for interpretation of the
eukaryotic evolution, the incorporation of a broad taxon sample to the phylogenetic
analyses is also of significant importance for resolving the eukaryotic tree of life, as a
correct resolution probably requires members representing all extant major lineages to be
included. One approach for screening for novel eukaryotic taxa, are by molecular surveys
of environmental samples.
1.2 EXPLORING EUKARYOTIC BIO-DIVERSITY BY MOLECULAR
APPROACHES
The phylogenetic placement of novel taxa is decided by combining information about
gene sequences and investigation of ultra structural features. However, due to difficulties
associated with laboratory culturing of protists, another method used for investigations of
biodiversity is by screening for novel taxa by analyzing DNA from various environments.
Hence, ensuing the introduction of molecular applications for phylogenetic inference,
molecular surveys of various environments have been carried out using samples from
extreme- and common-place environments from which total DNA are extracted and a
phylogenetic marker, usually the small subunit ribosomal (SSU) gene, is amplified and
subsequently used for construction of clone libraries (Richards and Bass 2005). The
environmental sampling approach has revealed many eukaryotic lineages not previously
described, some of which potentially belong to higher taxonomical levels, implying a
substantial existence of unknown eukaryotic diversity (Lopez-Garcia et al. 2001;
Richards and Bass 2005). Thus, the environmental sampling approach represents a
powerful tool for unveiling this putative unknown reservoir of biodiversity.
Some of the novel sequences reported from two of these environmental surveys were
initially reported to place outside all known eukaryotic supergroups, indicating that there

12
might be as much as eight new eukaryotic kingdoms (Dawson and Pace 2002; Stoeck et
al. 2003), suggesting a massive amount of hidden eukaryotic high-level diversity. The
number of suggested new kingdoms was astonishing, considering that only five
supergroups of eukaryotes are currently known (Cavalier-Smith 2004b). However, more
extensive analyses of these environmental sequences utilizing a dataset that included a
wider range of eukaryotic taxa showed that all the novel sequences in fact could be
placed among established phyla and classes (Berney et al. 2004; Cavalier-Smith 2004b),
hence emphasizing the critical importance of a broad and representative taxon sampling
for correct interpretation of phylogeny.
Even though these sequences did not represent novel eukaryotic kingdoms, they are
examples of an immense undescribed diversity among eukaryotes also reported from
several other environmental surveys. In an study including sampling of picoplankton
from the Pacific ocean, a large diversity of sequences from unknown taxa was revealed,
most of which could be assigned to known phyla including prasinophytes (green alga,
viridiplantae), haptophytes (chromists), dinoflagellates (alveolates), heterokonts
(chromists) and choanoflagellates (opisthokonts) (see figure 1.1 and box 1)(Moon-van
der Staay et al. 2001). Additionally, in a similar survey utilizing samples from deep-seas
a range of novel sequences was discovered, which were placed phylogenetically among
the alveolates as sisters to dinoflagellates (Lopez-Garcia et al. 2001; Moon-van der Staay
et al. 2001). These findings, as well as the results achieved by other environmental
surveys, indicate that eukaryotic supergroups may already be discovered (Cavalier-Smith
2004b; Simpson and Roger 2004). However, a few sequences generated from
environmental samples do not cluster within known eukaryotic phyla (Richards and Bass
2005), suggesting that there are higher-level eukaryotic lineages not yet discovered.
Revealing these “missing links” in the eukaryote tree of life is probably necessary for
resolving the global phylogeny, but will require efficient methods for environmental
sampling and laboratory culturing.

13
1.3 ORGANELLE EVOLUTION: THE ENDOSYMBIOTIC ORIGIN OF THE
PRIMARY PLASTID
One of the key evolutionary events in the history of eukaryotes is the incorporation of the
chloroplast. The plastids are the organelles of plants and algae responsible for
photosynthesis and various biochemical pathways in the cell, and it is now widely
accepted that the first plastid arose from a merge between photosynthetic bacteria,
possibly similar to modern cyanobacterium, and a non-photosynthetic host (Archibald
and Keeling 2002; Howe et al. 2003; McFadden 2001). It remains unclear whether the
primary uptake and integration of a photosynthetic bacterium happened only once or if
this happened repeatedly. However, the currently favored scenario is a monophyletic
model of primary plastid evolution, where the primary endosymbiotic event happened
only once, although several uptakes from related cyanobacteria cannot be ruled out as
multiple uptakes of closely related taxa probably are impossible to recognize in
phylogenetic trees (Howe et al. 2003; McFadden 2001; Palmer 2003). As a consequence
of the plastid incorporation, massive gene-transfer from the endosymbiont nucleus to the
eukaryotic host occurs, only retaining a fraction of the endosymbiont genome in the
plastid (Martin et al. 1998).
Three extant lineages harbor primary plastids from this first plastid endosymbiosis: the
glaucophytes, the red algae and the green algae/land plants, found in the eukaryotic
supergroup plantae (Palmer 2003). The great success of the plastid-bearing organisms is
obvious when considering the eukaryotic tree of life, as plastid-bearing groups are
scattered across four of the five major eukaryotic groups (viridiplantae, chromalveolates,
excavates and rhizaria, see figure 1.1) (Keeling 2004b). However, only a fraction of these
groups harbor plastids derived from the primary plastid uptake, as most photosynthetic
eukaryotes, including the members of the chromalveolates, hold plastids of secondary
endosymbiotic origin (Bhattacharya et al. 2004; Cavalier-Smith 2002; Delwiche 1999).

14
1.4 SECONDARY AND TERTIARY ENDOSYMBIOSIS: RECYCLING OF
PLASTIDS
Secondary endosymbiosis is a phenomenon where a eukaryote engulfs a photosynthetic
alga and permanently retains its originally primary plastid (see figure 1.2) (Cavalier-
Smith 2002).
FIGURE 1.2
Figure 1.2: Primary and secondary endosymbiosis. In a primary endosymbiosis, a bacteria is taken up by a
eukaryote. In a secondary endosymbiosis, a photosynthetic eukaryotic is engulfed by another eukaryote. No
secondary endosymbiont of glaucophyte origin is found. The number of secondary endosymbiotic events
involving red- and green algae is controversial, and the postulated number ranges from two to seven
independent plastid uptakes.
Following the uptake of a secondary plastid is a massive gene transfer from
endosymbiont to the host genome, as seen subsequent to a primary endosymbiosis
(Cavalier-Smith 2002). The secondary plastids are characterized by the presence of three

15
or four bounding membranes, and two of the groups that harbor secondary plastids, the
chlorarachniophytes and the cryptophytes, still retain a remnant nucleus of the algal
symbiont (Bhattacharya et al. 2004). Both red and green plastids have been subject to
secondary endosymbiosis, as plastids with a putative red algal origin is found in
dinoflagellates, cryptophytes, haptophytes and stramenopiles (chromalveolates), and
green-algal derived plastids are found in euglenoids (excavates) and chlorarachniophytes
(rhizaria) (Falkowski et al. 2004; Keeling et al. 2004). In addition to these plastids, a
vestigial plastid (i.e. an apicoplast) is found in the apicomplexans (Fast et al. 2001; Lang-
Unnasch et al. 1998), putatively of red algal origin, even though indications of a green-
algal origin also have been reported (Fast et al. 2001; Funes et al. 2002; Funes et al.
2004). There is an ongoing controversy associated with the number of secondary
endosymbiosis that have occurred through the evolutionary history, and the postulated
numbers of uptakes differ from two to seven (Cavalier-Smith 1999; Falkowski et al.
2004; Keeling 2004b). A common ancestry of the lineages holding green algal derived
plastids have been postulated in the cabozoan hypothesis (Cavalier-Smith 1999; Cavalier-
Smith 2000), however, current evidence indicates two independent secondary uptakes of
a green plastid in the ancestral lineages of euglenoids and chlorarachniophytes, as a
common ancestry of these lineages would imply a merge of the rhizaria and excavate
supergroups not supported by molecular or structural data (Archibald and Keeling 2002;
Baldauf et al. 2000). However, the main controversy is associated with the uptake of the
red algal plastid in the chromists and alveolates, and two of the proposed models for
plastid evolution in these lineages are shown in figure 1.3. Plastids of putative red algal
origin are found in five of the chromist and alveolate lineages (dinoflagellates,
apicomplexa, haptophytes, heterokonts and cryptophytes), and different evolutionary
models have been postulated for explaining this diversity. Among these models are the
chromalveolate hypothesis postulated by Tom Cavalier-Smith (Cavalier-Smith 1999),
stating that despite the diversity of organisms carrying red algal derived plastids, all these
plastids originated in a single endosymbiotic event that occurred in the common ancestor
of all these lineages. Others claim that the numerous and diverse distribution of red
plastids proves that secondary endosymbiosis has been a far more common event during
the eukaryotic evolutionary history than implied in the chromalveolate theory, and

16
postulate an individual uptake in each of the lineages containing a plastid of red algal
origin (Falkowski et al. 2004; Taylor 2004).
FIGURE 1.3
Figure 1.3. Two hypotheses of plastid evolution in chromists and alveolates, representing the “few” and
the “many” controversy. A: The chromalveolate theory. The plastid harbored by chromists and alveolates
was engulfed in one single endosymbiotic event. B: The red alga derived plastids found in chromists and
alveolates were obtained by five separate secondary endosymbiotic events.
In the dinoflagellate group, even tertiary endosymbiosis have occurred (Tengs et al.
2000). In tertiary endosymbiosis, a photosynthetic eukaryote with a secondary plastid is
engulfed by another eukaryote, a process that has only been shown to have happened
among the dinoflagellate taxa Karenia brevis, Karenia mikimotoi, Karlodinium micrum
and their close relatives (Tengs et al. 2000). The tertiary endosymbiont in these
dinoflagellates have pigmentation and plastid ultra-structure that indicate that they are
derived from a haptophyte, and this assumption have been supported in several molecular
analyses (Takishita et al. 2004; Tengs et al. 2000).
17
1.5 DINOFLAGELLATES
Dinoflagellates (subphylum Dinoflagellata, phylum dinozoa) are a diverse group of
organisms, constituting one of the tree major groups together forming the alveolates (see
box 1.1). The dinoflagellates are ubiquitous in marine and fresh-water environments and
flourish under favorable conditions, they are common as ecto-parasites, endo-parasites
and symbionts, some of them are bioluminescent and many members are capable of
producing toxins causing human illness, fish death and mortality of other marine fauna
(Hackett et al. 2004a; Taylor 2004). The dinoflagellates are remarkable organisms in
many aspects, as they express an immense diversity in form and nutrition that have
stimulated a great deal of interest for this group. The dinoflagellates were once
incorrectly thought to be so-called mesokaryotes constituting a separate intermediate
kingdom between eukaryotes and prokaryotes, because of the amount of unique features
present in the group, including a distinctive pattern of mitosis and nucleus, absence of
histones and two unequal flagella (Hackett et al. 2004a). However, more extensive
investigations of their phylogeny placed the dinoflagellates robustly among the
eukaryotes (Hackett et al. 2004a). Two sets of characters have traditionally been used as
taxonomical characters defining this group (Saldarriaga et al. 2004; Taylor 2004). One of
these synapomorphic features is the dinokaryon, a uniquely designed nucleus containing
permanently condensed chromosomes without histones, while the theca (the presence of
cellulose or other polysaccharides in the vesicles found beneath the cell surface) is the
other character used as a taxonomical fingerprint for this group, as different cell types can
be recognized on the basis of presence or absence of theca tabulation (Taylor 2004). The
thecal plates give the cells a distinct external pattern, and this pattern, as well as the
number of theca, is used to distinguish between the different dinoflagellate orders.
Dinoflagellates devoid of theca are said to be “naked” or unarmored (Saldarriaga et al.
2004). The dinoflagellate genome is organized in a high number of chromosomes,
reflecting the exceptionally large amounts of DNA contained in each cell. A
dinoflagellate cell can hold 3-250 pg DNA/cell, equivalent with a genome of around
3000-215000 MB, or 1-70 times the human genome (Hackett et al. 2004b).
Among the photosynthetic members of the dinoflagellates, constituting about one half of
the dinoflagellate species, the vast majority hold a plastid containing chlorophyll a and c2,

18
beta-carotene and peridinin (Hackett et al. 2004a). This synapomorphic dinoflagellate
secondary plastid is surrounded by three membranes, is of putative red-algal origin and
express an unique organization of the plastid genome, which is found on plastid
minicircles each containing usually only one or two genes (Taylor 2004; Zhang et al.
2002). Many genes normally found in the plastid genome have in the peridinin-
containing dinoflagellates been transferred to the nucleus, and only 16 protein genes are
currently believed to have been retained in the chloroplast genome (Howe et al. 2003;
Zhang et al. 2002).
In addition to the peridinin plastid, several other plastid types are also found among the
dinoflagellates (Hackett et al. 2004a; Saldarriaga et al. 2004; Taylor 2004), illustrating
the unique plastid diversity found in this group, a feature that makes the dinoflagellates
ideal for investigations of the processes involved in plastid evolution. In this study, the
dinoflagellates will be used for investigations of plastid evolution, an evolutionary event
of particular interest and with large implications for the supergroup chromalveolates, as
the putative common ancestry of this group is based on a very specific model of plastid
evolution.
1.6 DINOFLAGELLATES AS A MODEL GROUP FOR INVESTIGATIONS OF
PLASTID EVOLUTION
The extraordinary plastid diversity expressed in the dinoflagellates reflects evolutionary
processes such as secondary and tertiary endosymbiosis, kleptoplastidy (i.e. temporarily
uptake of plastids), plastid loss and plastid replacements (Hackett et al. 2004a), making
the dinoflagellates an ideal group for investigation of plastid evolution.In addition to the
predominating peridinin-plastid, the phototrophic dinoflagellates also harbor a variety of
other plastids, as four additional plastids are known in this group. Karenia brevis,
Karenia mikimotoi, Karlodinium micrum and their close relatives contain a chlorophyll a
+ c and 19’-hexanoyloxy-fucoxanthin containing plastid of putative haptophyte origin,
bound by three membranes and most likely acquired by tertiary endosymbiosis (Takishita
et al. 2004; Tengs et al. 2000). Lepidodinium viride and Gymnodinium chlorophorum are
the only dinoflagellates that hold a plastid of putative green-algal origin, and their plastid
of possible prasinophyte origin (a chlorophyte/green algae) contains chlorophyll a + b
and the photopigment prasinoxanthin (Elbrächter and Schnepf 1996; Watanabe et al.

19
1990). The Dinophysis group have plastids with chlorophyll a + c and phycobilin of
putative cryptophyte origin, surrounded by only two membranes (Schnepf and Elbrachter
1988). The plastid found in Kryptoperidinium foliaceum and Peridinium balticum is of
plausible diatom origin, holding fucoxanthin as the main carotenoid (Chesnick et al.
1997; Chesnick et al. 1996).
Only the 19’-hexanoyloxy-fucoxanthin (hereafter 19’) and chlorophyll a + b containing
plastids are considered to be “true” plastids, i.e. fully established in the host (Cavalier-
Smith 2003a). In the group holding a plastid of putative diatom-origin (including
Kryptoperidinium foliaceum and Peridinium balticum), the endosymbiont still retains a
nucleus, mitochondria and ribosomes, and no gene transfer appears to have occurred
between the host and the endosymbiont even though the plastid seems to be permanent
(McEwan and Keeling 2004). This clearly suggests that this plastid is not completely
integrated in the cell, hence representing an intermediate stage of endosymbiosis
(McEwan and Keeling 2004). An even earlier stage of endosymbiosis is demonstrated in
the Dinophysis group, where the cryptophyte plastid probably is acquired by
kleptoplastidy, a phenomenon whereby the host digests the algae while retaining the
plastid structurally intact (Janson 2004; Takishita et al. 2002).
The origin of the peridinin plastid is a controversial issue of dinoflagellate evolution.
Two of the postulated models for plastid evolution in dinoflagellates are shown in figure
1.4. Traditionally, the predominance of the peridinin-containing plastid have been
considered as evidence for this plastid being the ancestral for dinoflagellates (Taylor
2004). If this is the case, the remaining plastid-types found in extant groups of
dinoflagellates must have been obtained by replacement of the original peridinin-plastid
or by uptake by a heterotrophic dinoflagellate belonging to a lineage that already had lost
the peridinin-plastid (Saldarriaga et al. 2001). However, as the basal position of the
peridinin-containing species are not robustly supported in phylogenetic analyses of
ribosomal and protein genes (Saldarriaga et al. 2004; Saldarriaga et al. 2001; Zhang et al.
2005), the ancestral state of the peridinin plastid is not clearly demonstrated in molecular
studies. Additionally, analyses of plastid genes done by Yoon et al. in 2002 indicated the

20
19’-plastid as the ancestral one in the dinoflagellate lineage, subsequently evolving into
the peridinin plastid in all lineages except the Karlodinium/Karenia clade (Yoon et al.
2002a). Even though these analyses probably was mislead by codon use heterogeneity in
plastid genes (Inagaki et al. 2004; Yoon et al. 2005), this enforces the uncertainty
associated with the ancestral state of the dinoflagellate plastid. Due to these incongruent
phylogenies, it is difficult to rule out any hypothesis of the origin of the peridinin-plastid.
FIGURE 1.4
Figure 1.4. Two alternative hypotheses for plastid evolution in dinoflagellates. In tree A, peridinin is
shown as the ancestral plastid. The remaining plastids are acquired by tertiary or secondary endosymbiosis
by replacing the peridinin-plastid. In tree B, 19’ is shown as the ancestral plastid, from which the peridinin
plastid evolved. The prasinophyte-, cryptophyte- and heterokont-plastids were acquired by tertiary or
secondary endosymbiosis, replacing the peridinin plastid. (Figure adapted from Kamran Shalchian-Tabrizi:
“Studies on the Evolution of Chromists and Alveolates”, dr.scient thesis, 2003 (Shalchian-Tabrizi 2003)).
21
1.7 THE CHROMALVEOLATES: A SUPERGROUP DEFINED BY A COMMON
PLASTID ANCESTRY
A large fraction of known eukaryotic diversity is found within the supergroup
chromalveolates, comprising the chromists (haptophytes, heterokonts and cryptophytes)
and the alveolates (dinoflagellates, ciliates and apicomplexa) (see figure 1.1 and box 1.1).
This group of organisms accounts for about half of the currently recognized species of
protists and algae (Cavalier-Smith 2004a).
The photosynthetic members of the chromists (haptophytes, heterokonts and
cryptophytes) share the pigment c2 and have their plastid located within the
endoplasmatic reticulum, and cluster as a monophyletic group in concatenated analyses
of plastid-genes (Yoon et al. 2002b), indicating a common ancestry of this plastid.
The alveolates (dinoflagellates, apicomplexans and ciliates) all hold cortical alveoli or
related structures beneath the plasma membrane, and have been shown to group as a
monophyletic clade in several phylogenetic analyses of rRNA and protein-genes (Fast et
al. 2002; Harper et al. 2005; Van de Peer and De Wachter 1997).
The members of the chromalveolate assembly share a few features supporting the
postulated monophyly of this group; the photosynthetic members of chromists and the
alveolates share a chlorophyll c containing plastid, as well as fundamentally similar
mechanisms for plastid targeting of nuclear encoded proteins (Cavalier-Smith 2003a;
Cavalier-Smith 2003b). The chromalveolates also share unique replacements of the
plastid-targeted genes glyceraldehyde-3-phosphate dehydrogenase (GAPDH) and
Fructose-1,6-bisphosphate (Fast et al. 2001; Harper and Keeling 2003; Patron et al.
2004), indicating that chromists and alveolates together constitute a monophyletic clade,
the chromalveolates, with a common photosynthetic ancestor that engulfed a red alga in a
secondary endosymbiotic event (Cavalier-Smith 1999). Despite these shared features and
indications of a common ancestry, the chromalveolate supergroup has never been shown
as a monophyletic clade in phylogenetic analyses of ribosomal- or protein coding genes
(Harper et al. 2005). However, several molecular analyses suggest a close relationship
between members of the chromists and the alveolates, as a relationship between the
heterokonts and the alveolates have been indicated (Baldauf et al. 2000; Harper et al.
2005).

22
1.8 TELONEMA: A POSSIBLE EARLY CHROMALVEOLATE LINEAGE
As mentioned earlier, environmental surveys have revealed many sequences from
unknown taxa indicating a massive amount of hidden eukaryote biodiversity, however,
the number of undiscovered higher-level lineages remains unclear (Berney et al. 2004;
Richards and Bass 2005). One potential high-level taxonomic lineage, of possible
chromalveolate affiliation, was re-discovered in environmental sampling surveys of the
pico-plankton diversity of the English Channel and Mediterranian Sea (Romari and
Vaulot 2004; Shalchian-Tabrizi et al. 2005) Present in the clone libraries constructed
from these surveys were sequences shown to belong to the unclassified organism
Telonema subtilis, a heterotrophic taxon first described in 1913 by Griesmann from
Roscoff and Naples (Shalchian-Tabrizi et al. 2005). Another possible member of the
Telonema lineage with a SSU sequence similar to Telonema subtilis: Telonema
antarcticum, was in parallel with the environmental sampling isolated from the Oslofjord
and kept in culture for further molecular and morphological investigations (Klaveness et
al. 2005; Shalchian-Tabrizi et al. 2005). The indications of the putative chromalveolate
affiliation of the Telonema lineage are shown in phylognenetic SSU analyses (shown in
figure 1.5). In this tree, Telonema subtilis, Telonema antarcticum and their related
environmental sequences are placed as a distinct group outside all known clades,
branching off at the base of a group consisting of stramenopiles, alveolates and
cercozoans. This suggests that the Telonema lineage could comprise a new deep-
branching phylum of possible chromalveolate origin.

23
FIGURE 1.5
Figure 1.5: Phylogenetic analyses of SSU sequences. The numbers at the nodes represent from top to
bottom posterior probability values >0.90, and bootstrap values >50% received from analyses with
parsimony and distance (LogDet) methods, respectively. The asterisk indicates the bootstrap value for the
clade except for the Cercozoa that clustered to the Haptophyta in the parsimony tree. The dotted line shows
the placement of the haptophyte clade in ML, parsimony and distance analyses. (Figure and figure text
from Shalchian-Tabrizi et al. 2005).

24
Unlike other environmental surveys, where the species from which the obtained
sequences originate are unknown, the Telonema sequences could be identified to belong
to a particular group of organisms, hence enabling morphological investigations
necessary for a more accurate taxonomical placement. The morphological investigations
showed that the two cultured Telonema species hold features also supporting the
indicated relationship between Telonema and the chromalveolates (Shalchian-Tabrizi et
al. 2005). Morphology and fine structure of Telonema are shown in figure 1.6. Traits
supporting that Telonema is a close relative to the chromalveolates are the presence of
mitochondria with tubular cristae and a complex cytoskeleton composed of layers of
microtubuli and microfilaments (Shalchian-Tabrizi et al. 2005). Additionally, in
Telonema antarcticum, tripartite tubular hairs and cortical alveoli are present (Klaveness
et al. 2005), traits also found in different groups of chromalveolates (Andersen 2004;
Taylor 2004).
However, as mentioned earlier, as phylogeny based only on SSU analyses have been
shown to be unreliable for several species, additional analyses are necessary for deciding
whether Telonema indeed comprise a separate phylum, possibly within or at the base of
the chromalveolate supergroup. A discovery of a new deep-branching chromalveolate
phylum will contribute significant information to the on-going controversy over the
postulated chromalveolate monophyly, and will be of importance in the work searching
to resolve the eukaryotic tree of life.

25
FIGURE 1.6
Figure 1.6: Morphology and fine structure of Telonema. Whole cell (a,b,c); a, Telonema subtilis scanning
electron micrograph from natural sample (Guld or Naples). b, Cultured T.antarcticum from the Oslofjord,
showing cortical alveoli (grey arrow); c, Light micrograph of cultures cell (RCC 404 from Roscoff)
fv=food vacuole; Sub-cellular components (d,e,f); d, Section through cortical alveoli and cytoskeleton
(white arrows); e, Detail of flagellum with tubular tripartite hairs as revealed by shadow cast whole-mount
(see white arrow: distal filament; arrowhead: shaft; black arrow:base); f, Longitudinal section of embedded
T.antarcticum, showing the cortical alveoli, complex cytoskeleton (white arrows), m=mitochondrium with
tubular cristae. a, b, c – scale bar 5 µm; d, e, f – scale bar 1 µm. (Figure and figure text adapted from
Shalchian-Tabrizi et al. 2005

26
1.9 AIMS AND RATIONALE FOR THE STUDY:
The overall objective of this thesis was to gain further understanding about the evolution,
the diversity and the genomes of protists in general and the supergroup chromalveolates
in particular.
The evolutionary history of chromalveolates will be addressed by two approaches,
namely investigations of plastid evolution by investigating chloroplast replacement
events in dinoflagellates, as well as analyzing the phylogeny of the potential deep-
branching chromalveolate lineage Telonema for further understanding of the early
evolution and putative monophyly of the group.
The following questions were formulated to address the main aim of the study:
• Is a magnetic bead based cell-surface binding DNA extraction kit suitable for use
in molecular surveys of environmental samples and hitherto unknown species?
• Can phylogenetic inferences of multiple nuclear encoded genes be used to resolve
dinoflagellate phylogeny, and thus the relationships between groups harboring
different types of plastids?
• What is the ancestral plastid for dinoflagellates and how many times have
anomaly pigmented plastids been acquired among this group?
• Can a revised dinoflagellate phylogeny and the discovery of novel groups, such as
Telonema, give insight to processes in chromalveolate plastid evolution and
provide information about the putative monophyletic origin of chromalveolates?
To investigate the aims, the following experimental approaches were utilized:
• Methods for investigation of protist bio-diversity will be addressed by testing a
DNA kit with potential use for automated environmental sampling, putatively
providing pure PCR-ready DNA of better quality than existing DNA-extraction
kits, hence improving the efficiency of environmental sampling and DNA
investigations of new species.

27
• cDNA libraries from two aberrantly pigmented dinoflagellates, Gymnodinium
chlorophorum and Karlodinium micrum will be constructed to investigate the
expressed genome of these species and generate genes of possible use in resolving
the phylogeny of dinoflagellates.
• PCR-amplification and sequencing of nuclear encoded proteins that have shown
to be useful for phylogenetic inference of eukaryotes will be carried out on the
Telonemia phylum and a range of dinoflagellates.

28
2. MATERIALS AND METHODS
In this study, molecular approaches and bioinformatics tools have been used to address
the aims described in the introduction.
• Two magnetic bead-based DNA extraction kits, using different protocols for
DNA isolation, were tested qualitatively. To test the kit’s possible usefulness in
environmental sampling, DNA extraction and subsequent amplification of the
small ribosomal subunit gene were carried out applying a range of laboratory
cultures of protists. For one of the kits, the detection limit for algal cultures was
tested.
• PCR amplification of the hsp90 gene from a range of dinoflagellates as well as
construction of cDNA libraries from two aberrantly pigmented dinoflagellate taxa
were carried out for investigating genomic diversity and phylogenetic inference of
dinoflagellates.
• PCR amplifications of the protein encoding genes hsp90, alpha-tubulin and beta-
tubulin from Telonema subtilis and Telonema antarcticum were carried out.
• Phylogenies of dinoflagellates were inferred using Bayesian inference of
phylogeny (described in 2.3), based on HSP90, small-ribosomal subunit (SSU),
large ribosomal subunit (LSU), actin and GAPDH gene and amino acid
sequences.
• Phylogenies of eukaryotes (including Telonema), based on the protein sequences
generated in this study (HSP90, alpha-tubulin and beta-tubulin) were carried out
by Kamran Shalchian-Tabrizi.
2.1 DNA ISOLATION ASSAYS AND PCR-BASED SEQUENCE ANALYSIS
APPLYING SMALL-SCALE PROTIST CULTURES
2.1.1 Biological material and small-scale culture conditions
A variety of autotrophic and heterotrophic protist cultures were used in this study. Most
of the cultures were provided from the culture collection at Program for Marine
Biodiversity, Department of Biology, University of Oslo (UoO), except the

29
Chlamydomonas culture (kindly provided by Uwe Klein, Department of Molecular
Sciences, University of Oslo). The small-scale cultures used are listed in table 2.1.
TABLE 2.1 Biological material used in this study
Species Phylum
Gymnodinium chlorophorum Dinophyceae
Karlodinium micrum Dinophyceae
Alexandrium tamarense Dinophyceae
Pyramimonas sp. Prasinophyte
Isochrysis galbana Haptophyta
Telonema subtilis Telonemia
Rhinomonas sp. Cryptophyta
Tetraselmis sp. Cryptophyta
Ditylum brightwelli Stramenopila
Chlamydomonas reinhardtii Chlorophyceae
Table 2.1: Small-scale cultures used in DNA extraction experiments.
The majority of the cultures was grown in Erdschreiber seawater medium (Føyn 1934) at
15°C under illumination (12/12 h LD cycle), except for Gymnodinium chlorophorum and
Karlodinium micrum which were grown in IMR/2 medium (Eppley et al. 1967), and
Chlamydomonas reinhardtii which was grown in HS medium (see appendix 2). The
heterotrophic protist Telonema subtilis was cultured with the haptophyte Imatonia
rotunda as prey-organism.
The algal cultures used in the DNA-isolation experiments were enumerated by preserving
an aliquot of the cultures in Lugol`s solution (0.6 M KI, 0.2 M I2) before deciding the cell
densities by counting individual cells in a Palmer-Malloney counting chamber using a
light microscope.
The small-scale cultures were used directly for DNA extraction without centrifugation.

30
2.1.2 DNA-isolation assays
DNA was extracted from fresh cultures using two different magnetic-bead based systems;
Dynabeads DNA DIRECT Universal from Dynal Biotech and ChlamCAP from
Genpoint. All reagents used for DNA extraction, except ethanol and dsH20, were
supplied in the kits.
The DNA-isolation kit ChlamCAP (Genpoint AS, Norway) is a magnetic bead-based
isolation kit that isolates the DNA in two steps by first associating the cells to the beads
due to the bead’s specially coated surface, followed by a subsequent washing step to
eliminate PCR-inhibiting agents. After cell lysis, the DNA is captured to the same beads.
The DNA was isolated according to the manufacturer’s instructions. 700 µL of the
cultures were used, and the DNA was eluted in 50 µL dH2O.
The DNA DIRECT Universal kit (Dynal Biotech ASA, Norway) is also a magnetic bead-
based isolation kit, developed for isolation of PCR-ready DNA from a variety of sample
materials, e.g. cultured cells and tissues. With this system, the cells are lysed and the
DNA subsequently captured to the surface of the Dynabeads and washed to eliminate
PCR-inhibitors.
The DNA was extracted following the manufacturer’s instructions. However, to be able
to compare the results from this extraction to the ChlamCAP DNA isolation, the same
amount of culture was used in this extraction as used in the ChlamCAP isolation, hence
700 µL of culture were used directly for extraction without prior centrifugation. The
DNA/Dynabeads complex was then resuspended in 50 µL resuspension buffer, and the
DNA was eluted off the Dynabeads by incubation at 65°C for 5 minutes.
As a high sensitivity of the DNA-isolation systems is required for efficient use in
environmental sampling, the detection limit of the ChlamCAP kit was investigated. The
algal cultures tested in this quantitative experiment were diluted 1:9 with BW-buffer
(Genpoint AS, Norway) seven times before DNA-extraction was carried out on all
dilutions to test the sensitivity of this kit.
All DNA samples were used directly for PCR or stored at -20°C.

31
2.1.3 DNA amplification
DNA from both isolation methods, as well as DNA from three additional species of
dinoflagellates and Telonema antarcticum (some of the DNA isolations kindly provided
from Emelita Nerli and Kamran Shalchian-Tabrizi) was amplified by use of Polymerase
Chain Reaction (PCR). To measure a possible difference in the PCR-amplification yield
between the Genpoint and the Dynal kit, as well as testing the sensitivity for the Genpoint
kit, the small ribosomal subunit (SSU/18S) was generated from variety of laboratory
algal cultures.
Several genes with possible use in phylogenetic inference of chromalveolates were
amplified from the potential deep-branching lineage Telonema and several
dinoflagellates. The 90-dDa heat shock protein (HSP90) gene sequence was amplified
from Telonema subtilis, Telonema antarcticum, Gymnodinium chlorophorum,
Karlodinium micrum, Karenia brevis, Karenia mikimotoi and Alexandrium tamarense,
and alpha-tubulin and beta-tubulin were amplified from Telonema subtilis and Telonema
antarcticum.
All together, 19 genes from a variety of species were amplified.
All PCRs included a negative control to check for contaminants in the reagents, and a
positive control when possible. All PCR products were loaded and separated on a 1%
agarose/0.5 TBE gel stained with ethidium bromide, visualized under UV-light and
excised from the gel for cloning. All PCR-primers used in this study are shown in table
2.2.
The PCR-products were used directly in cloning, or they were stored at –20°C.
Small ribosomal subunit amplification:
The small ribosomal subunit (SSU) was amplified by PCR using eukaryote-specific
primers. The SSU amplifications were performed on a Biometra T1 thermocycler in 25 or
50 µL volumes with following temperature cycles: 15 min at 95°C; 45 cycles of 15 s at
95°C, 30 s at 53°C and 1 min and 30 s at 72°C; and 10 min at 72°C. 1-10 µL of DNA
template was used. The PCR-volumes contained 10 pmol of each primer, 200 µM dNTP,
1X HotStar Taq PCR buffer with MgCl and 1.5 U HotStar Taq DNA polymerase (Qiagen
Sciences, USA).

32
Hsp90 amplification:
When amplifying the hsp90 gene, degenerate primers were used in a semi-nested system.
The PCRs were carried out in two rounds, where the primers HSP90-100F and HSP90-
970R (Simpson et al. 2002) were used initially to make amplicons, invisible on the gel,
that were reamplified using the same forward primer and reverse primer 8-HSP90-
KeelinginnerR (Leander and Keeling 2004). The primer sequences are shown in table
2.2. The following temperature cycles were used in the reactions: 2-15 min at 95°C; 35-
45 cycles of 15 s at 95°C, 20 s at 48-52°C and 1 min and 30 s at 72°C; and 10 min at
72°C. An annealing temperature of 48 °C was used in the initial round of PCR, and raised
to 52 °C in the second round. All hsp90 amplifications were carried out on a Perkin-
Elmer thermocycler (GeneAmp PCR System 2400, Perkin-Elmer, USA) using 1 µL of
template (of DNA-extraction or a 1:10 dilution of the initial PCR product), 40 pmol of
each primer, 200 µM dNTP, 1x PCR buffer, 0.25 µg BSA and 1.5 U enzyme in a 25 µL
PCR-volume. Different enzymes were used; HotStar Tag (Qiagen Sciences USA),
HotMaster Taq (Eppendorf, Germany) and Taq DNA polymerase (Invitrogen, USA). In
reactions where Taq DNA polymerase was used, 1.5 mM MgCl2 was added, however in
reactions using HotStar or HotMaster, MgCl2 was supplied with the PCR-buffer. In
reactions where HotMaster Taq polymerase was used, the elongation temperature was set
to 68° instead of 72°.
Alpha- and beta-tubulin amplification:
Amplification of alpha-tubulin and beta-tubulin from Telonema was carried out using a
Biometra T1 thermocycler, with following temperature cycles: 15 min at 95°C; 45 cycles
of 15 s at 95°C, 30 s at 59-61°C and 1 min and 30 s at 72°C; and 10 min at 72°C. PCR
volumes were 25 µL, and contained 40 pmol of each primer, 200 µM dNTP, 1X HotStar
Taq PCR buffer with MgCl, 25 pmol BSA and 1.5 U HotStar Taq DNA polymerase
(Qiagen, USA). The degenerate primers -tubulin A, -tubulin B, -tubulin A and -
tubulin B were used (Edgcomb et al. 2001).

33
TABLE 2.2 Primers used for PCR
Target Forward primer Reverse primer
SSU 1F*:
AACCTGGTTGATCCTGCCAGT
1528R*:
TGATCCTTCTGCAGGTTCACCTAC
Hsp90 100F:
CAGCTGATGTCCCTGATCATYAAYACNTTYTA
970R:
TCGAGGGAGAGRCCNARCTTRATCAT
Hsp90 100F:
CAGCTGATGTCCCTGATCATYAAYACNTTYTA
8KEELINGINNER:
CGCCTTCATDATNCKYTCCATTRTTNGC
-TUB A:
RTGNGGNAAYGCNTGYTG
B:
CCATNCCYTCNCCNACRTACCA
-TUB A:
GCAGGNCARTGYGGNAAYCA
B:
AGTRAAYTCCATYTCRTCCAT
*1F and 1528R are universal eukaryotic 18s primers
Table 2.2: The primers used for targeted PCR amplification of rRNA and protein encoding genes
2.1.4 TOPO-TA cloning
Before carrying out the cloning reaction, PCR products of the protein genes hsp90, alpha-
and beta-tubulin from the Telonema species and the dinoflagellate species were gel-
purified using the Wizard SV Gel and PCR clean-up system (Promega, USA). All
reagents and tubes used were supplied in the kit.
The band of predicted length was excised of the gel using a clean razor blade, and the
PCR-products were extracted from the gel following the manufacturer’s instructions.
The purified PCR product was loaded on a 1% agarose/0.5 M TBE-buffer gel stained
with ethidium bromide and visualized in ultraviolet light for deciding the yield.
The purified PCR-products were ligated into the pCR-2.1 TOPO vector using the TOPO-
TA cloning kit (Invitrogen, USA). A further description of the TOPO-cloning method is
found in box 2.1.
The cloning reactions were set up according to table 2.3. The quantity of PCR-products
used was adjusted according to the yield from the gel purification process.
34
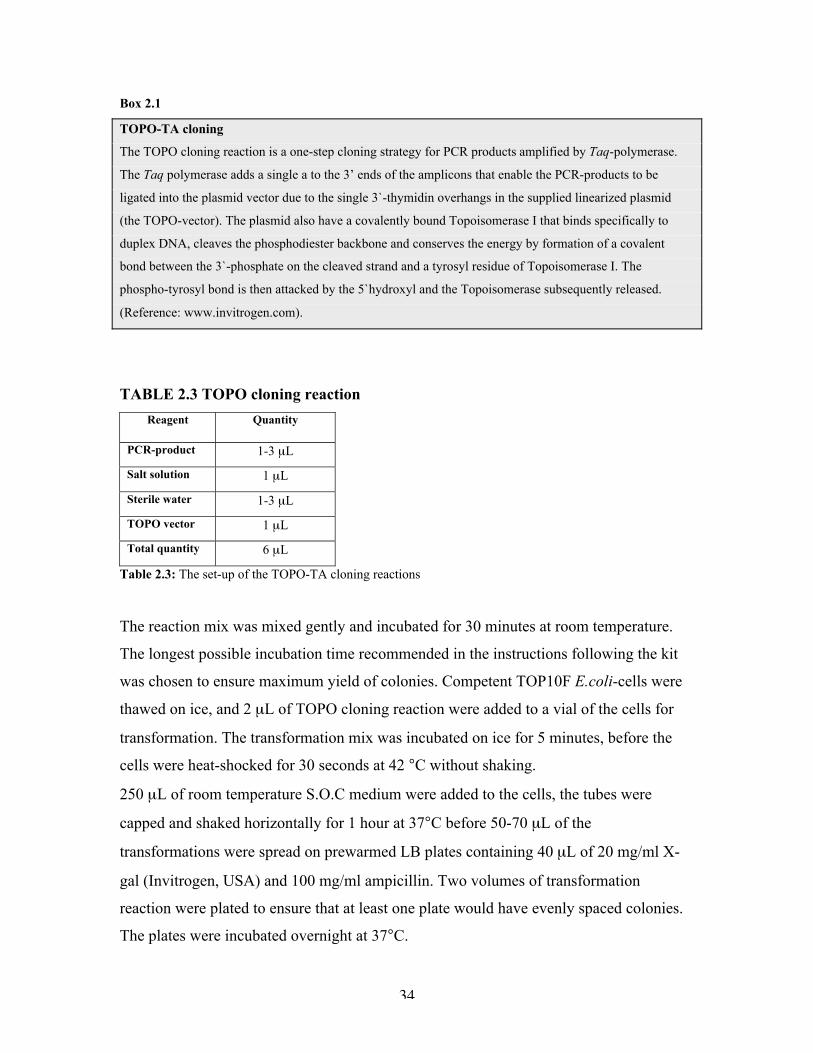
Box 2.1
TOPO-TA cloning
The TOPO cloning reaction is a one-step cloning strategy for PCR products amplified by Taq-polymerase.
The Taq polymerase adds a single a to the 3’ ends of the amplicons that enable the PCR-products to be
ligated into the plasmid vector due to the single 3`-thymidin overhangs in the supplied linearized plasmid
(the TOPO-vector). The plasmid also have a covalently bound Topoisomerase I that binds specifically to
duplex DNA, cleaves the phosphodiester backbone and conserves the energy by formation of a covalent
bond between the 3`-phosphate on the cleaved strand and a tyrosyl residue of Topoisomerase I. The
phospho-tyrosyl bond is then attacked by the 5`hydroxyl and the Topoisomerase subsequently released.
(Reference: www.invitrogen.com).
TABLE 2.3 TOPO cloning reaction
Reagent Quantity
PCR-product 1-3 µL
Salt solution 1 µL
Sterile water 1-3 µL
TOPO vector 1 µL
Total quantity 6 µL
Table 2.3: The set-up of the TOPO-TA cloning reactions
The reaction mix was mixed gently and incubated for 30 minutes at room temperature.
The longest possible incubation time recommended in the instructions following the kit
was chosen to ensure maximum yield of colonies. Competent TOP10F E.coli-cells were
thawed on ice, and 2 µL of TOPO cloning reaction were added to a vial of the cells for
transformation. The transformation mix was incubated on ice for 5 minutes, before the
cells were heat-shocked for 30 seconds at 42 °C without shaking.
250 µL of room temperature S.O.C medium were added to the cells, the tubes were
capped and shaked horizontally for 1 hour at 37°C before 50-70 µL of the
transformations were spread on prewarmed LB plates containing 40 µL of 20 mg/ml X-
gal (Invitrogen, USA) and 100 mg/ml ampicillin. Two volumes of transformation
reaction were plated to ensure that at least one plate would have evenly spaced colonies.
The plates were incubated overnight at 37°C.

35
2.1.5 Analyzing positive clones
The TOPO-TA pCR-2.1 kit utilize blue-white selection to screen for transformed
colonies, hence light blue and white colonies were picked and analyzed for insert by PCR
with the primers HR/HU and M13F/M13R, flanking the insert site. A standard PCR
protocol was used, and colonies with correct insertion were used to make bacterial
overnight cultures that were incubated overnight at 37°C in LB-medium with ampicillin.
2.1.6 Plasmid isolation
The plasmids from the overnight cultures of transformed bacteria were purified using the
BIO-RAD Quantum Prep Plasmid Miniprep Kit (BIO-RAD, USA). The BIO-RAD kit
uses the traditional alkaline lysis technology for plasmid DNA isolation, and utilizes the
silicon dioxide exoskeleton of diatoms as the DNA binding matrix.
Overnight cultures of 2 ml transformed cells in LB-medium were used. The isolation was
done according to the manufacturer’s instructions.
2.1.7 DNA sequencing
Sequencing was carried out using plasmids with PCR-insert rather that directly
sequencing of PCR-products. As initial sequencing tests where PCR-products were used
directly proved not to be successful, cloning was carried out before all the following
sequencing reactions (see box 2.2).
Box 2.2
Sequencing of plasmids versus direct sequencing of PCR-products
Sequencing of plasmids with inserted PCR-products has the benefit that it produces high quality sequence
reads, and the problem with mixed peaks on the sequencing chromatogram due to non-pure PCR-products
is avoided. On the other hand, this method increases the effect of additional errors that incorporates during
plasmid copying in the bacteria, since all plastids may contain the same error.
Some of the plasmids were sent to MWG Biotech AG, Germany, for sequencing while
others were sequenced at the MegaBACE lab at University of Oslo, or at the sequencing
facility at department of Zoology, University of Oxford. Samples for MWG Biotech and
MegaBACE lab were delivered the sequencing labs as isolated plasmids, however, the

36
sequencing reactions analyzed at the sequencing lab at Oxford University were carried
out on the lab before delivering the reaction to the sequencing lab for gel analysis. The
sequencing reaction utilized ABI BIGDYETM
Terminator Cycle Sequencing Ready
Reaction Kit (Applied Biosystems, USA), and was set up as shown in table 2.4.
TABLE 2.4 Sequencing reaction set-up
Reagent Quantity
Template 2-6 µL
Primer 3 pmol
Sequencing buffer 5X
Sterile water -
Table 2.4: The set-up of the sequencing reactions carried out at the sequencing facility at the University of
Oxford. The sequencing buffer contains BIGDYE dye terminator cycle sequencing pre-mix contains
labeled A-dye terminator, C-dye terminator, G-dye terminator and T-dye terminator, dNTP, AmpliTaq
DNA polymerase, MgCl2 and Tris-HCl buffer, pH 9.0.
The cycling conditions for the sequencing reactions were: 25 cycles of 10 s at 96°C, 5 s
at 50°C and 4 minutes at 60°C.
The reactions were cleaned by adding 25 µL 95% ethanol and 1 µL NaOAc to each
sample, leaving the samples in room temperature for 15 minutes and then centrifuged at
3000 rpm for 30 minutes before discarding the supernatant.
Sequence analyzes were carried out on sequencing machines ABI3700/ABI3730
(Applied Biosystems, USA).
Different primers were used for sequencing. Initial sequences were obtained by using
M13R and M13F sequencing primers, and additional internal sequencing primers were
designed for those sequences that were needed to be full-length. The primer sequences
are shown in table 2.5.
37
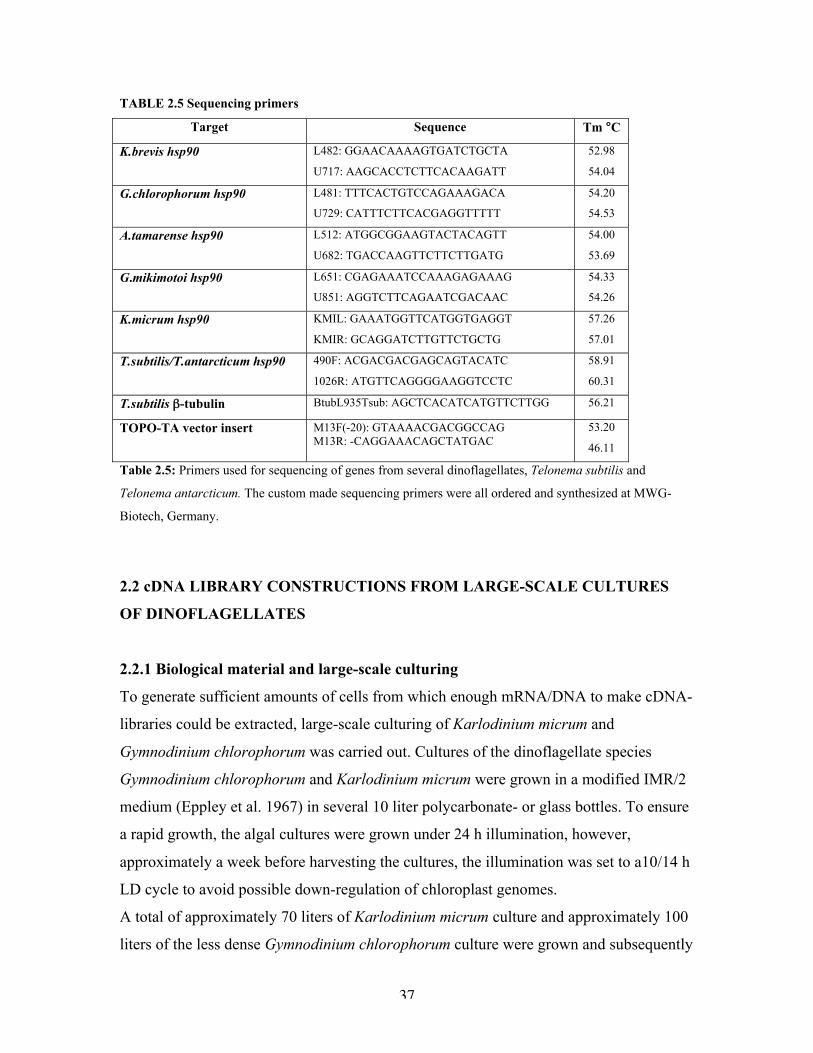
TABLE 2.5 Sequencing primers
Target Sequence Tm °C
K.brevis hsp90 L482: GGAACAAAAGTGATCTGCTA
U717: AAGCACCTCTTCACAAGATT
52.98
54.04
G.chlorophorum hsp90 L481: TTTCACTGTCCAGAAAGACA
U729: CATTTCTTCACGAGGTTTTT
54.20
54.53
A.tamarense hsp90 L512: ATGGCGGAAGTACTACAGTT
U682: TGACCAAGTTCTTCTTGATG
54.00
53.69
G.mikimotoi hsp90 L651: CGAGAAATCCAAAGAGAAAG
U851: AGGTCTTCAGAATCGACAAC
54.33
54.26
K.micrum hsp90 KMIL: GAAATGGTTCATGGTGAGGT
KMIR: GCAGGATCTTGTTCTGCTG
57.26
57.01
T.subtilis/T.antarcticum hsp90 490F: ACGACGACGAGCAGTACATC
1026R: ATGTTCAGGGGAAGGTCCTC
58.91
60.31
T.subtilis -tubulin BtubL935Tsub: AGCTCACATCATGTTCTTGG 56.21
TOPO-TA vector insert M13F(-20): GTAAAACGACGGCCAG
M13R: -CAGGAAACAGCTATGAC
53.20
46.11
Table 2.5: Primers used for sequencing of genes from several dinoflagellates, Telonema subtilis and
Telonema antarcticum. The custom made sequencing primers were all ordered and synthesized at MWG-
Biotech, Germany.
2.2 cDNA LIBRARY CONSTRUCTIONS FROM LARGE-SCALE CULTURES
OF DINOFLAGELLATES
2.2.1 Biological material and large-scale culturing
To generate sufficient amounts of cells from which enough mRNA/DNA to make cDNA-
libraries could be extracted, large-scale culturing of Karlodinium micrum and
Gymnodinium chlorophorum was carried out. Cultures of the dinoflagellate species
Gymnodinium chlorophorum and Karlodinium micrum were grown in a modified IMR/2
medium (Eppley et al. 1967) in several 10 liter polycarbonate- or glass bottles. To ensure
a rapid growth, the algal cultures were grown under 24 h illumination, however,
approximately a week before harvesting the cultures, the illumination was set to a10/14 h
LD cycle to avoid possible down-regulation of chloroplast genomes.
A total of approximately 70 liters of Karlodinium micrum culture and approximately 100
liters of the less dense Gymnodinium chlorophorum culture were grown and subsequently

38
harvested in log-face and centrifuged in a continuous-flow centrifuge by adding small
amounts of algal culture through a pasteur pipette. After centrifugation, the supernatant
was discarded and the algal samples were immediately frozen in liquid nitrogen and
subsequently preserved at -80° or freeze dried.
2.2.2 Construction of cDNA libraries
Cells from 40 liters of K.micrum and 40 liters of G.chlorophorum were sent to
GENterprise GENOMICS in Germany for construction of cDNA-libraries.
The cDNA library from Karlodinium micrum was constructed applying an oligo (dT)
primer with an internal NotI site. The ligation of the Sal I adapters and the subsequent
restriction using NotI allowed directional cloning into the vector pSport1 x SalI x NotI as
shown in figure 2.1. This vector contains the lacZ gene, hence enabling blue-white
screening of clones with insert.
FIGURE 2.1
Vector Vector
Not I Not I – primer-adapter Sal I – Adapter Sal I
CCTCTAGAGC GGCCGCCC(T)x – cDNA – CGGACGCGTGGG TCGACCCGGG
GGAGATCTCGCCGG CGGG(A)x – cDNA – GCCTGCGCACCCAGCT GGGCCC
Figure 2.1: The restriction sites and primer adapters used for construction of Karlodinium micrum library
The constructed K.micrum cDNA library was returned to us for sequencing.
Approximately 200 clones from the K.micrum cDNA-library were grown in 2 ml LB-
medium, and the plasmids were isolated with Eppendorf FastPlasmid isolation kit
(Eppendorf, Germany). This kit lyses and resuspends bacterial cells in one step, and the
released plasmid DNA is captured directly from the lysate on a filter device during
centrifugation. As over 200 clones were to be sequenced, the rapid and simple protocol of
FastPlasmid was preferred for extracting plasmids from the cDNA-library clones instead
of the BIO-RAD kit described in chapter 2.1.7. 5’-end sequencing of the cDNA was done
at the sequencing facility at University of Oxford, as described in chapter 2.4.5.

39
The cDNA-library from Gymnodinium chlorophorum was constructed using the SMART
technology, selectively priming the mRNA by their poly-A tail using an oligo(dT) primer
containing a built-in sequence for restriction and PCR-amplification. Full-length
sequences were generated using primer extension. By this method, synthetic adapter
sequences incorporates at both ends of the cDNA: by the oligo(dT) primer at the 5’-end,
and by a specialized SMART oligo that hybridizes to the cytosines added by the reverse
transcriptase at the 3’-end. The fragments were then cut using restriction enzymes and
cloned into the vector psport1.
2.3 BIOINFORMATIC TOOLS AND PHYLOGENETIC ANALYSES
2.3.1 Single-gene and concatenated alignments
Protein- and nucleotide sequences of HSP90 from a wide range of organisms, and actin-
and GAPDH sequences of different alveolates were obtained from GenBank
(http://www.ncbi.nlm.nih.gov/). The sequences were edited and assembled using BBEdit
6.1 for OS X, aligned in ClustalX and manually inspected and adjusted in MacClade
version 4.0 PPC.
Initial alignments for alpha-, beta-tubulin, SSU and LSU were provided by Kamran
Shalchian-Tabrizi, and were further enlarged by adding additional sequences from
GenBank.
The new sequences generated in this study were checked for identity using NCBI BLAST
(http://www.ncbi.nlm.nih.gov/BLAST/) and added to the nucleotide alignments using
MacClade, before they were translated into protein sequences (in MacClade) and added
to the protein alignments for phylogenetic analysis.
Ambiguously aligned areas were excluded from the alignments before the phylogenetic
analysis.
The HSP90, alpha- and beta-tubulin alignments that were used in the phylogenetic
analyses of Telonema contained sequences from a wide range of eukaryotes, representing
all main eukaryotic groups from which these sequences were available. The HSP90
alignments used for investigating dinoflagellate phylogeny were constrained to contain

40
only dinoflagellate species, Oxyrrhis marina, Perkinsus marinus and 3 apicomplexan and
ciliate outgroup taxa. The alignment dimensions are shown in table 2.6. Individual SSU
and LSU alignments were also constructed, containing sequences from the same species
represented in the HSP90 alignment.
Concatenated alignments combining different gene alignments were made using BBEdit
6.1 for OS X. The large HSP90 alignment, including representatives from all major
eukaryotic supergroups and Telonema, was combined with small ribosomal subunit
(SSU), alpha- and beta-tubulin alignments. The dinoflagellate HSP90 alignment was
combined with SSU and large ribosomal subunit LSU. The species missing available
LSU sequence were filled with question marks.
The alignment dimensions are shown in table 2.6.
TABLE 2.6 Alignment dimensions
Alignment Number of taxa Number of characters
HSP90 (dinoflagellate) 17 523
HSP90+SSU+LSU 15 2398
SSU 17 1448
LSU 12 400
Actin 19 250
GAPDH 26 235
Alpha-tubulin 40 355
Beta-tubulin 39 383
HSP90 (Telonema) 33 465
HSP90+alpha-tubulin+beta-tubulin 30 1203
HSP90+SSU (Telonema) 33 1813
Table 2.6: Alignment dimensions of single-gene and concatenated alignments.
2.3.2 Primer design
The custom made sequencing primers were designed using Primer3 Input
(primer3_www.cgi v 0.2) (http://frodo.wi.mit.edu/cgi-bin/primer3/primer3_www.cgi)

41
2.3.3 Intron folding
The secondary structure of the insertion found in Alexandrium tamarense was estimated
using the web interface of the Vienna RNA Secondary Structure Prediction
(http://rna.tbi.univie.ac.at/cgi-bin/RNAfold.cgi).
2.3.4 Selecting protein substitution models for phylogenetic analyses
The dinoflagellate protein gene alignments were tested in Prottest
(http://darwin.uvigo.es/software/prottest.html). This is a program for finding the most
appropriate protein evolution model for a given alignment. As different models can be
applied for estimating the relative rates of amino acid substitution, this program estimates
the best fitting candidate models for the datasets based on two different criterions based
on two different criteria: the Akaike Information Criterion (AIC) and the Bayesian
Information Criterion (BIC).
The general time reversible (GTR) model of nucleotide substitution was used in the
single-gene SSU and LSU analyses, as well as in the SSU and LSU partition of the
combined HSP90 + SSU + LSU dataset
The WAG amino acid substitution model was used in the Telonema analyses.
2.3.5 Phylogenetic analyses
PAUP*v4.0b10 for Macintosh was used to construct neighbor-joining trees used to
ensure that the DNA-sequences obtained from the Telonema/Imantonia culture belonged
to Telonema subtilis, and not the haptophyte prey-organism, before doing more accurate
and extensive analyses.
The large HSP90 alignment including Telonema, as well as the concatenated alignments
containing this protein gene sequences, was analyzed by parsimony, distance, maximum
likelihood and Bayesian methods. (Analyses done by Kamran Shalchian-Tabrizi.)
The alignments with alveolate amono acid sequences from actin, GAPDH, HSP90 and
the concatenated alignments were analyzed in a Bayesian framework. For more
information about Bayesian inference, see Box 2.3.

42
Box 2.3
BAYESIAN INFERENCE OF PHYLOGENY
Bayesian inference of phylogeny is based on the posterior probability distribution of trees. The posterior
probability is approximated using a simulation technique called Markov chain Monte Carlo (MCMC), takes
account of the prior probability, the model and the data. The prior distributions of the parameters are
formulated before the analyses, and shows beliefs about the parameters before any data has been sampled.
The posterior probability of a tree shows the probability of the tree according to the phylogenetic
observations, and is proportional to the likelihood times the prior probability of that tree. When the prior
probability distribution is flat, i.e. if all parameters have the same prior probability, the posterior
distribution is proportional to the likelihood distribution. The prior distribution can be decided using earlier
analysis results, i.e. by using the posterior probability of one analysis as the prior probability in the
following analysis (Felsenstein 2003).
The stochastic simulation used by MCMC samples topologies from the posterior distribution of trees, and
inferences are calculated using the Bayesian formula. The posterior probability distribution of trees can
contain multiple peaks, and because of this, the MCMC can become trapped in a local optima separated by
deep valleys from other, possible higher peaks. A heated chain sees the tree landscape as flattened relative
to the cold chain, and by applying multiple heated chains to the analyses, the deep valleys can be more
readily crossed. This is called Metropolis-coupled MCMC (MC)3, and allows multiple peaks in the tree
landscape be explored more extensively (Nylander et al. 2004).
Bayesian analyses were carried out using MrBayes*v3.0b4 on the Bioportal
(http://www.bioportal.uio.no/). Different among-site rate variation models were tested in
the phylogenetic inferences: gamma distributed rates across sites ( ), a combination of
gamma-distributed rates across sites with a covarion substitution model ( + COV), a
proportion of the sites invariable and the remaining sites of gamma-distributed rates ( +
I) or a combination of these settings ( +I + COV). The covarion-like model of
substitution allows the rate at a site to change over its evolutionary history, allowing the
sites to be either on or off. Three heated and one cold chain was used in the Metropolis
coupled Markov chain Monte Carlo (MCMC), and 1,000,000-2,000,000 generations was
carried out. Randomly generated trees were used as starting point for the MCMC chains,
and burn-in trees was set to 3,000-5,000 trees based on assessment of the likelihood plots.
Sampling of trees was done every 100 generations, and the consensus of the sampled
trees was used to calculate the posterior probability for the tree topology. In the analyses
of the concatenated alignments one char set per gene was defined, and these char sets

43
were defined as the partition and used in the analyses. Different model parameters were
unlinked across the partitions of the data to allow parameters to be different across
partitions. The parameters unlinked in the HSP90+SSU+LSU concatenated alignments
were the parameters for gamma shape, branch lengths, switching rate for the covarion
model, substitution rates of the GTR model and the character state frequencies.
2.3.6 Analyzing the cDNA-library sequences
The sequenced cDNAs were analyzed using the Salmon Gene Project (SGP) pipeline
(Analyses done by Torgeir Ruden Andersen) for automatic quality check, vector-
trimming and GO-annotation. The sequences were aligned with public database
sequences applying the SGP standalone version of NCBI BLAST. Each query sequence
was run against different databases: Blastx (translated query vs protein database) was run
against the pdb, swissprot and nr protein databases, and blastn (nucleotide query vs
nucleotide database) was run against the nr polynucleotide sequence database. Automatic
annotation of the gene products was carried out, based on Gene Ontology (GO) terms
from the Gene Ontology Consortium (http://www.geneontology.org/). Sequences with
BLAST hit E-values lower than 1.0e-10
against the pdb database (blastx) or lower than
1.0e-15
against the swp (blastx) and nr (blastx and blastn) database were annotated by
applying the GO assignments for the UniProt database produced by the GOA-project
(http://www.ebi.ac.uk/GOA/) of the European Bioinformatics Institute.
The cDNA-sequences also were aligned against the NCBI EST-database
(http://www.ncbi.nlm.nih.gov/dbEST/).

44
3. RESULTS
The results of this study comprise several parts, somewhat independent, but also
connected as incorporated building blocks together contributing to decipher the overall
aim addressed in the introduction of this thesis. A novel DNA isolation method will be
tested, cDNA sequences from cDNA libraries will be analyzed and phylogenetic analyses
will be carried out using different molecular markers. The investigated protist groups are
the dinoflagellates, addressing plastid evolution, and a deep-branching organism,
Telonema, whose ancestor possibly diverged from its relatives early in the evolution of
the chromalveolate lineage.
3.1 TESTING MAGNETIC BEAD-BASED DNA-ISOLATION SYSTEMS FOR
POTENTIAL USE IN ENVIRONMENTAL SAMPLING
Efficient DNA isolation and PCR-amplification of molecular markers are required for
preventing random errors and systematic biases in molecular surveys of environmental
samples. Magnetic bead-based extraction methods provides a faster, more efficient and
less hazardous protocol for isolation of PCR-ready DNA compared to the traditional
DNA-isolating methods involving organic solvents, and the method is also well suited for
automation, a feature of use in surveys of biodiversity and surveillance of harmful algal
blooms. In this study, initial testing of two different magnetic bead-based DNA-isolation
systems (ChlamCAP, Genpoint AS, Norway and DNA Direct, Dynal Biotech AS,
Norway) of potential use in environmental sampling was carried out.
As the Genpoint kit not previously had been applied to eukaryotes, and the Dynal kit only
had been tested on a few protist taxa, the kits were tested qualitatively by extracting PCR-
ready DNA from a broad range of laboratory cultures of autotrophic and heterotrophic
eukaryotes. Both kits tested utilize magnetic beads for DNA extraction. However, as the
protocols and the rationale behind the procedures are quite different (see introduction),
there could possibly be differences between the two kits considering DNA-yield and
DNA purity, features affecting the PCR-amplification efficiency and thereby the utility of
the kits in environmental sampling.

45
For the kits to be useful in molecular surveys of environmental samples, high sensitivity
is required. As the detection limit of the ChlamCAP kit not earlier had been tested on
algal-cultures, quantitative experiments were carried out in this study applying several
species representing major algal groups.
3.1.1 Qualitative results using the kits ChlamCAP and DNA Direct
DNA was isolated and PCR-amplification was carried out on the species listed in table
3.1 (Chlamydomonas reinhardtii, Karlodinium micrum, Gymnodinium chlorophorum,
Alexandrium tamarense, Isochrysis galbana, Rhinomonas sp., Tetraselmis sp.,
Pyramimonas sp., Telonema subtilis and Ditylum brightwellii), representing a wide
selection of algal and protist groups. Agarose gels with the SSU PCR-amplification
products from the some of the DNA-extraction experiments are shown in figure 3.1.
Both kits gave sufficient DNA yield for PCR amplification of the small ribosomal
subunit (SSU) in all the species tested.
FIGURE 3.1: Qualitative results
Figure 3.1: The agarose gel pictures show the PCR-amplifications of the small ribosomal subunit (SSU) using ChlamCAP and
Dynal DNA-extraction kits. DNA marker used is HaeIIIphi174. Dilutions of the DNA-extraction used in the PCR-reaction range
from 100 (0) to 10
-5 (-5).

46
3.1.2 Detection limit of the ChlamCAP kit
The sensitivity of the ChlamCAP kit was tested using a total of five species from four
different phyla (Chlamydomonas reinhardtii, Karlodinium micrum, Isochrysis galbana,
Tetraselmis sp. and Pyramimonas sp.). The quantitative results are listed in table 3.1, and
agarose gels with PCR-amplification products from some of the quantitative experiments
are shown in figure 3.2. The detection limit of four of the species tested (C.reinhardtii,
K.micrum, Tetraselmis sp. and Pyramimonas sp.) was measured to be between 1.5 x 10³
and 2.8 x 10³ cells/ml. For one of the species, the sensitivity was measured to be 1.6x10
5
cells/ml (I.galbana) – an unexpected low sensitivity.
TABLE 3.1 Species from which PCR amplifiable DNA was extracted
Species Group Amplicon Sensitivity*
Chlamydomonas reinhardthii Chlorophyceae 18S rDNA 1.5x10³ cells/ml
Karlodinium micrum Dinophyceae 18S rDNA 2.0x10³ cells/ml
Gymnodinium chlorophorum Dinophyceae 18s rDNA N/A**
Alexandrium tamarense Dinophyceae 18s rDNA N/A**
Isochrysis galbana Haptophyta 18S rDNA 1.6x10⁵ cells/ml
Rhinomonas sp. Cryptophytes 18s rDNA N/A**
Tetraselmis sp. Prasinophyta 18S rDNA 2.1x10³cells/ml
Pyramimonas sp. Prasinophyta 18S rDNA 2.8x10³ cells/ml
Telonema subtilis Telonemia 18s rDNA N/A**
Ditylum brightwellii Stramenopile 18s rDNA N/A**
*: Measured using ChlamCAP
**: Not measured in this study
Table 3.1: Table showing species from which PCR amplifiable DNA was extracted using ChlamCAP
(Genpoint AS) and DNA direct (Dynal Biotech AS).
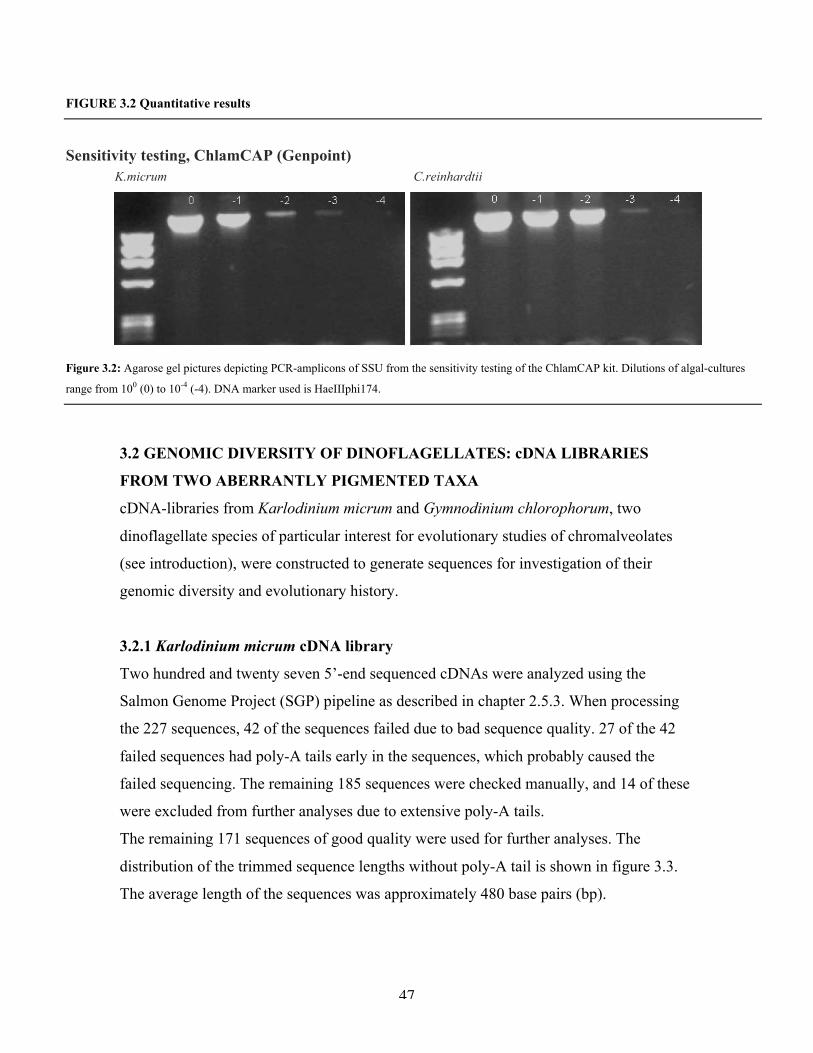
47
FIGURE 3.2 Quantitative results
Sensitivity testing, ChlamCAP (Genpoint)
K.micrum C.reinhardtii
Figure 3.2: Agarose gel pictures depicting PCR-amplicons of SSU from the sensitivity testing of the ChlamCAP kit. Dilutions of algal-cultures
range from 100 (0) to 10
-4 (-4). DNA marker used is HaeIIIphi174.
3.2 GENOMIC DIVERSITY OF DINOFLAGELLATES: cDNA LIBRARIES
FROM TWO ABERRANTLY PIGMENTED TAXA
cDNA-libraries from Karlodinium micrum and Gymnodinium chlorophorum, two
dinoflagellate species of particular interest for evolutionary studies of chromalveolates
(see introduction), were constructed to generate sequences for investigation of their
genomic diversity and evolutionary history.
3.2.1 Karlodinium micrum cDNA library
Two hundred and twenty seven 5’-end sequenced cDNAs were analyzed using the
Salmon Genome Project (SGP) pipeline as described in chapter 2.5.3. When processing
the 227 sequences, 42 of the sequences failed due to bad sequence quality. 27 of the 42
failed sequences had poly-A tails early in the sequences, which probably caused the
failed sequencing. The remaining 185 sequences were checked manually, and 14 of these
were excluded from further analyses due to extensive poly-A tails.
The remaining 171 sequences of good quality were used for further analyses. The
distribution of the trimmed sequence lengths without poly-A tail is shown in figure 3.3.
The average length of the sequences was approximately 480 base pairs (bp).

48
FIGURE 3.3 Distribution of trimmed cDNA lengths
Fig,3.3: Distribution of readable sequence length for cDNAs from Karlodinium micrum. The total number
of analyzed good-quality sequences was 171, and the average sequence length was approximately 480 base
pairs.
BLAST searches were carried out using the quality-checked cDNA sequences, and
sequences were identified by BLASTx and BLASTn searches against different databases
(swissprot, pdb and nr). Table 3.2 lists the tentatively identified clones according to the
BLAST searches sorted in functional categories, based on the modified EGAD-categories
as presented in Kuo et al 2004 (Kuo et al. 2004). The average length of the annotated
sequences was longer than the average sequence length, 615 bp.
TABLE 3.3: List of tentatively identified clones
Functional category Clone no. Putative product
Cell structure/motility38 Actin
97 Dynein light chain
RNA synthesis/transcription factors 85 DEAD BOX RNA helicase
199 Ribonucleoprotein
1-39 Major basic nuclear protein,Hcc
Protein synthesis/turnover 106 Ubiquitin
4 Heat shock protein 70
1-54 Polyubiquitin
118 Elongation factor 3
143 60S ribosomal protein L34-a
1-29 Proteasome subunit

49
Metabolism 138 Qin-induced kinase
35 Flavin-binding family monooxygenase
139 Phosphoglycerate mutase 1
44 Triose Phosphate Isomerase
173 Fumarate reductase, NADH
68 Pyridine nucleotide transhydrogenase
95 Vacuolar ATP synthetase
16 S-adenosyl-L-homocystein hydrolase
168 Nucleoside phosphorylase* (pdb)
20 GTP-binding protein era* (pdb)
1-41 Oxidoreductase
1-52 Glyceraldehydes-3-phosphate dehydrogenase
1-31 Protease
Unclassified 24 Unnamed protein product
80 Putative protein Arabidopsis thaliana
9 16S small subunit ribosomal RNA gene* (nt)
97 Hypothetical protein str0548
*: no significant hit in nr database, based hit in other database
Table 3.3: The table shows the annotated cDNAs in functional categories. The annotation is based on the
hit in the nr database. 3 of the sequences did not have significant hits in the nr database (marked with
asterisks), and these are annotated based on another database. The average length of the annotated
sequences was 615 base pairs.
Figure 3.4 shows the distribution of cDNAs sorted in functional categories. 143 (83.6%)
of the sequences had no BLAST hits lower than the threshold value (1.0e-10
for
blastx/pdb and 1.0e-15
for blastx/swissprot, blastx/nr and blastn/nr), 2 (1.2%) was
involved in cell structure and motility, 3 (1.8%) in RNA synthesis, 6 (3.5%) in protein
synthesis, 13 (7.6%) in metabolism and 4 sequences (2.3%) were unclassified. The
annotation output, including best BLAST hits for all sequences in nr, nt, pdb and
swissprot databases are found at the following webpages:
http://www.salmongenome.no/htdocs/km_res/blast_all_trimmed/blastSum_km_all_trimm
ed.html
http://www.salmongenome.no/htdocs/km_res/new/blast_new/blastSum_km_new.html

50
FIGURE 3.4 Distribution of cDNAs in different functional categories
Figure 3.4: The chart shows the distribution of cDNAs in functional categories calculated from the total
number of good-quality sequences.
The sequences were also manually blasted against the NCBI EST-database. In this blast
search, 8 of annotated sequences (actin, DEAD box helicase, ubiquitin, elongation factor
3, phosphoglycerat mutase, fumarat reductase, ATP synthase and S-adenosyl-L-
homocystein hydrolase) and 5 of the unidentified sequences had significant hits against
ESTs generated from the dinoflagellate libraries of Karenia brevis, Alexandrium
tamarense, Amphidinium carterae and Lingulodinium polyedra, while one of the
sequences had hits against an EST-library from apricot fruit, a viridiplantae.
Two of the generated sequences were used for phylogenetic analyses of dinoflagellate
phylogeny (actin and GAPDH).
3.2.2 Gymnodinium chlorophorum cDNA-library
The SMART protocol (see materials and methods) was applied to construct a cDNA
library from Gymnodinium chlorophorum. However, this construction was not very
successful as a large fraction of the clones generated contained only very short inserts. A
few of the inserts were of proper length, and four of these were sequenced at Genterprise
AG. Three of these sequences were approximately 1000 bp, and one was approximately
800 bp.

51
When aligned using BLAST, three of the sequences did not have hits with E-value lower
than the threshold value (1.0e-10
). One sequence was identified as actin, a cytoskeletal
protein involved in filament formation, also found in the K.micrum library. This sequence
was used in phylogenetic inference.
3.3 SPECIFIC PCR-AMPLIFICATION OF MOLECULAR MARKERS AND
PHYLOGENETIC INFERENCE OF DINOFLAGELLATE SEQUENCES
For interpretation of the complex plastid-evolution in dinoflagellates, a phylogeny
resolving the relationship between the heterotrophic-, the peridinin-containing and the
aberrantly pigmented species are necessary. The nuclear protein HSP90 has recently been
shown to be useful for phylogenetic inference of protists in general as well as for
alveolates (Leander and Keeling 2004; Stechmann and Cavalier-Smith 2003). In this
study, new sequences from the hsp90 gene were generated from both peridinin-
containing and anomaly pigmented dinoflagellate species, and used in single-gene and
concatenated analyses with SSU and LSU from public databases for inference of
dinoflagellate phylogeny.
Dinoflagellate phylogeny was also inferred based on actin and GAPDH sequences
generated from the cDNA-libraries.
3.3.1 Dinoflagellate sequences of possible use in phylogenetic analyses generated in
this study
As the public databases at this date (June 2005) only contain five hsp90-sequences from
dinoflagellates, five new dinoflagellate hsp90-sequences were generated in this study
(listed in table 3.1), and an additional unpublished dinoflagellate hsp90 sequence
(Amphidinium carterae) was kindly provided by T.Bachvaroff and used in the analyses.
Three sequences of potential use for phylogenetic inference were generated from the
cDNA libraries (actin from Gymnodinium chlorophorum and Karlodinium micrum, and
GAPDH from Karlodinium micrum).

52
TABLE 3.4: Sequences generated by PCR or cDNA libraries used in dinoflagellate phylogeny
Taxa Sequences generated by PCR or cDNA libraries
PCR cDNA
Gymnodinium chlorophorum Hsp90 Actin
Karlodinium micrum Hsp90 Actin, GAPDH-C2
Karenia brevis Hsp90
Karenia mikimotoi Hsp90
Alexandrium tamarense Hsp90
Table 3.4: A summary of the new sequences generated in this study used for phylogenetic analyses of
dinoflagellates
3.3.2 A large insertion was found in the Alexandrium tamarense hsp90 gene
A large insertion, possibly an intron, was found in one of the hsp90 sequences, as the
Alexandrium tamarense hsp90 sequence was interrupted by a 358 bp sequence flanked by
canonical GT-AG sequences. The nucleotide distribution of the putative intron was
slightly different than the rest of the gene, as G and C comprise 45.2% of the insertion
and 50.8% in the remaining gene sequence. Folding of the intron was carried out the web
interface Vienna RNA Secondary Structure Prediction (http://rna.tbi.univie.ac.at/cgi-
bin/RNAfold.cgi). The predicted secondary structure of the whole intron (A, 358 bp) and
the 5’-end of the intron only (B, approximately 180 bp) are shown in figure 3.5,
illustrating that the whole insertion, as well as the first part of the insertion have strong
palindromic properties. The palindromic structure of the may suggest that the insertion
can comprise a hierarchy of palindromic sequences. Hence, the secondary structure of the
5’ end (approximately 90 bp) of the putatively duplicated sequence (i.e. 5’ end of the
whole insertion, approximately 180 bp) of the intron sequence was also predicted (see
figure 3.5 C), and showed that this sequence also contains palindromic sequences. The
putative branching site of the entire intron is found 31 bp upstream of the 3’ intron
boundary with sequence GACTAAT, a sequence similar to the branching points of
Saccharomyces cerevisiae (TACTAAC) and G.lamblia/T.vaginalis (AACTAAC) (Nixon
et al. 2002; Vanacova et al. 2005). The insertion contains an open reading frame (ORF)
in-frame with the hsp90 gene with a putative start codon 7 bp downstream the 5’
boundary and a stop codon positioned 25 bp upstream the 3’ intron boundary. BLAST
searches of the putative ORF were carried out without significant hits.

53
FIGURE 3.5
Figure 3.5: A: Predicted secondary structure of the 358
bp insertion found in Alexandrium tamarense. B:
Predicted secondary structure of the 5’-end of the 358
bp insertion. C: Predicted secondary structure of the 5’-
end (90 bp) of B.
Canonical AG-GT splicing sequences marked in red,
putative branching site marked in green and start/stop
codon of putative ORF marked in blue.
3.3.3 Finding the best model for
phylogenetic inference of dinoflagellate
phylogeny
Phylogenetic inference of the alignments was
done in a Bayesian framework (See box 2.3).
The SSU and LSU phylogenies were inferred
using a dataset comprising the same taxon-
sampling as the HSP90 dataset, using
sequences available in public gene banks.
Covarion structure (where homological sites
evolve with different rate in different
sequences) have recently been suggested to be
a substitution pattern in gene sequences
(Huelsenbeck et al. 2002; Lopez et al. 1999).
Hence, for each dataset, the estimated model
fit were estimated with and without applied
covarion parameters and compared by
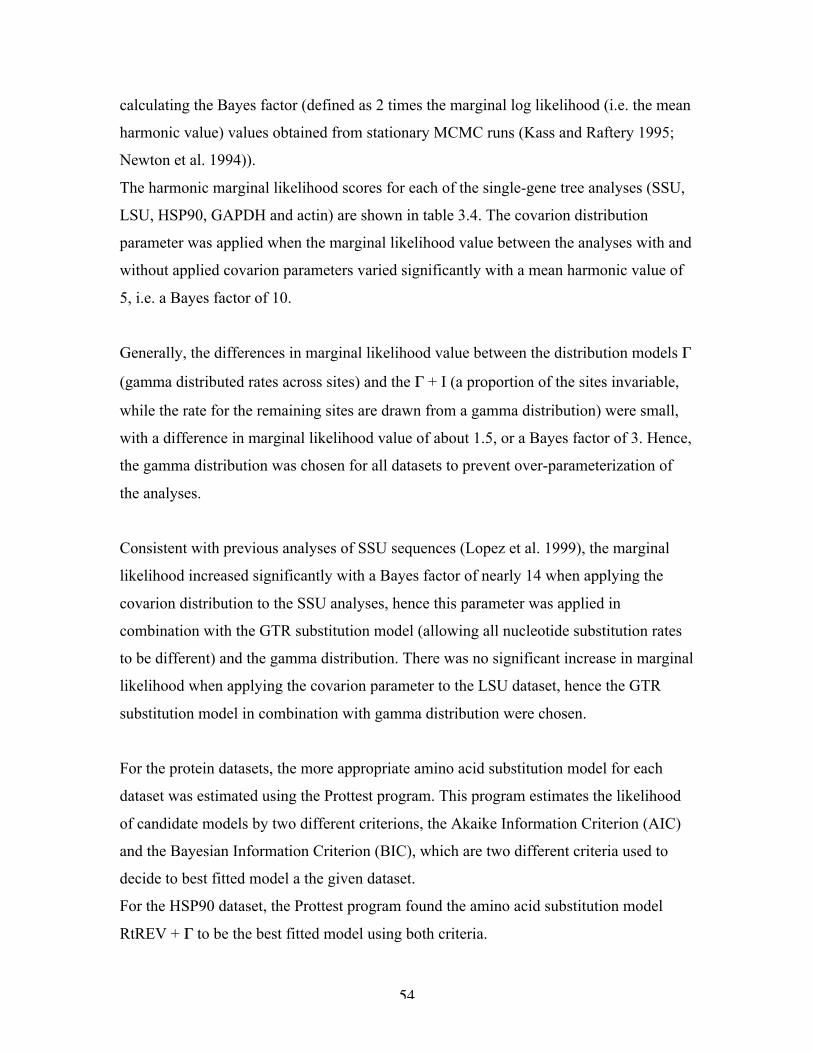
54
calculating the Bayes factor (defined as 2 times the marginal log likelihood (i.e. the mean
harmonic value) values obtained from stationary MCMC runs (Kass and Raftery 1995;
Newton et al. 1994)).
The harmonic marginal likelihood scores for each of the single-gene tree analyses (SSU,
LSU, HSP90, GAPDH and actin) are shown in table 3.4. The covarion distribution
parameter was applied when the marginal likelihood value between the analyses with and
without applied covarion parameters varied significantly with a mean harmonic value of
5, i.e. a Bayes factor of 10.
Generally, the differences in marginal likelihood value between the distribution models
(gamma distributed rates across sites) and the + I (a proportion of the sites invariable,
while the rate for the remaining sites are drawn from a gamma distribution) were small,
with a difference in marginal likelihood value of about 1.5, or a Bayes factor of 3. Hence,
the gamma distribution was chosen for all datasets to prevent over-parameterization of
the analyses.
Consistent with previous analyses of SSU sequences (Lopez et al. 1999), the marginal
likelihood increased significantly with a Bayes factor of nearly 14 when applying the
covarion distribution to the SSU analyses, hence this parameter was applied in
combination with the GTR substitution model (allowing all nucleotide substitution rates
to be different) and the gamma distribution. There was no significant increase in marginal
likelihood when applying the covarion parameter to the LSU dataset, hence the GTR
substitution model in combination with gamma distribution were chosen.
For the protein datasets, the more appropriate amino acid substitution model for each
dataset was estimated using the Prottest program. This program estimates the likelihood
of candidate models by two different criterions, the Akaike Information Criterion (AIC)
and the Bayesian Information Criterion (BIC), which are two different criteria used to
decide to best fitted model a the given dataset.
For the HSP90 dataset, the Prottest program found the amino acid substitution model
RtREV + to be the best fitted model using both criteria.

55
When testing the actin data set, the AIC and the BIC favored different substitution
models, RtREV + + I and WAG + respectively. As the latter model has fewer
parameters than the first, this was applied in the analyses.
For the GAPDH dataset, the AIC favored the model WAG+ +I, while the BIC found the
model WAG+ to be the best fitting model. According to the principle of choosing the
model with the fewest parameters, WAG+ was used in the analyses.
In table 3.4, the applied model used for phylogenetic inference is shown in italics.
In the combined SSU+LSU+HSP90 analyses, the parameter-combination estimated to be
best fitted for the datasets was applied to each partition.
TABLE 3.5 Values of harmonic mean of the marginal likelihood
Sequence data Harmonic mean of the marginal likelihood Bayes factor
+I +cov +I+cov
HSP90 -4438.42 -4439.28 -4433.95 -4435.63 8.94
SSU -7760.78 -7757.94 -7751.45 -7750.99 13.9
LSU -2991.40 -2994.56 -2992.83 -2991.34 0.12
actin -1566.80 -1566.00 -1566.59 -1566.59 0
GAPDH-C2 -4584.45 -4586.28 N/A* N/A* NA*
Table 3.5: Harmonic mean of the marginal likelihood for evolutionary models estimated in Bayesian
MCMC and Bayes factors between the best model with or without the COV parameters (best fitting model
in bold and applied model in italics). The applied amino acid substitution models were RtREV (HSP90)
and WAG (actin and GAPDH). The applied nucleotide substitution model was general time reversible
model (GTR) (SSU and LSU).

56
3.3.4 Phylogenetic inference of dinoflagellates using HSP90, SSU, LSU, actin and
GAPDH sequences
Dinoflagellate phylogeny was inferred in a Bayesian framework using HSP90, SSU,
LSU, actin and GAPDH sequences.
SSU:
The reconstructed tree based on SSU sequences is shown in figure 3.6. The taxon sample
and accession numbers are listed in appendix 1, table 1.
In this phylogeny, the ciliate and apicomplexan species branches off as basal species
excluding the remaining protalveolate and dinoflagellate species with posterior
probability (hereafter pp) 0.66. Perkinsus marinus branches off as a sister to Oxyrrhis
marina and the dinoflagellates sensu stricto with pp=0.80, and Oxyrrhis marina branches
off as a sister to the dinoflagellates with pp= 0.65. The monophyly of dinoflagellates are
supported by pp=0.51. The haptophyte-plastid containing species cluster together as a
monophyletic clade with pp=0.84, while the prasinophyte-plastid harboring species
Gymnodinium chlorophorum and Lepidodinium viride form a monophyletic clade with
pp=1.0. The remaining nodes in the tree are poorly supported with low posterior
probability values. The species belonging to the Gonyaulacales cluster together in a
group with pp=0.28 consisting of, in addition to the gonyaulacalean-species, the diatom-
plastid containing Kryptoperidinium foliaceum and the peridinin-plastid harboring
Amphidinium carterae, belonging to the Peridiniales and the Gymnodiniales,
respectively. Prorocentrum micans, taxonomically placed among the Prorocentrales,
branches off as a sister to the haptophyte-containing species with pp=0.59. The remaining
peridinialean-species, Heterocapsa triquetra and the heterotrophic Lessardia elongata,
branches off as a sistergroup to the prasinophyte-plastid containing clade with pp=0.52.

57
FIGURE 3.6 SSU
Figure 3.6: Phylogenetic tree of dinoflagellates based on SSU rRNA sequences (1448 nucleotides) from 17
species of alveolates constructed in a Bayesian framework (GTR+ +COV model). Dinoflagellates plastid
types are indicated with a black circle. Di: Putative diatom-derived plastid Pe: Peridinin containing plastid
Pr: Putative prasinophyte derived plastid Ha: Putative haptophyte derived plastid
LSU:
The reconstructed phylogenetic tree based on LSU sequences is shown in figure 3.7. The
taxon sample and accession numbers are listed in appendix 1, table 1.
In this tree, only a few branches are supported with values exceeding pp=0.50. The
apicomplexan and ciliate species are excluded from the dinoflagellates sensu stricto
(pp=0.87), and two of the haptophyte-plastid containing species (Karenia brevis and

58
Karenia mikimotoi) group together with pp=0.88. The rest of the tree was unresolved,
with posterior probability values on some nodes as low as 0.07.
FIGURE 3.7 LSU
Figure 3.7: Phylogenetic tree of dinoflagellates based on LSU rRNA sequences (400 nucleotides) from 17
species of alveolates constructed in a Bayesian framework applying the GTR+ model. Dinoflagellates
plastid types are indicated with a black circle. Di: Putative diatom-derived plastid Pe: Peridinin containing
plastid Pr: Putative prasinophyte derived plastid Ha: Putative haptophyte derived plastid

59
HSP90:
The reconstructed dinoflagellate phylogeny inferred based on HSP90 protein sequences,
is shown in figure 3.8. The taxon sample and accession numbers are listed in appendix 1,
table 1.
In this phylogeny, the protalveolates and dinoflagellates sensu stricto clustered together
excluding the ciliate and apicomplexan species with posterior probability value 1.0. The
protalveolate species Perkinsus marinus and Oxyrrhis marina branch off as basal
lineages with high support (pp=1.0). The Gymnodiniales forms the basal group, and the
peridinin-plastid containing taxa Amphidinium carterae branches off as the most basal of
the dinoflagellates with posterior probability 1.0. The species holding a plastid of
haptophyte origin (K.brevis, K.mikimotoi and K.micrum) (Tengs et al. 2000) form a
monophyletic clade with high support (pp=1.0) and branches off within the peridinin-
plastid containing Gymnodiniales with posterior probability 0.97. The green
dinoflagellate Gymnodinium chlorophorum, containing a plastid of possible prasinophyte
origin (Watanabe et al. 1987) also branches off within the peridinin-containing species
with support 0.97, while Prorocentrum micans branches off as a sister to the clade
consisting of gonyaulacalean- and peridinialean-species with pp=0.99. Lessardia
elongata branches off as the most basal of the polyphyletic Gonyaulacales/Peridiniales
group. The Peridiniales and the Gonyaulacales form a polyphyletic clade excluding the
Gymnidiniales and Prorocentrales with pp=0.95. The heterotrophic dinoflagellates
represented in the data set, Crypthecodinium cohnii and Lessardia elongata do not form a
monophyletic clade, as Crypthecodinium cohnii groups with the dinoflagellate
Kryptoperidinium foliaceum, harboring a plastid of diatom-origin, with pp=0.98.
Together, these two taxa constitute a sister clade to Heterocapsa triquetra with pp=0.96.
60
FIGURE 3.8 HSP90
Figure 3.8: The evolutionary relationships of dinoflagellates based on HSP90 amino acid sequences j(17
taxa, 523 amino acids), applying the rtRev+ model in a Bayesian framework. Sequences generated in this
study marked in bold. Dinoflagellates plastid types are indicated with a black circle. Di: Putative diatom-
derived plastid Pe: Peridinin containing plastid Pr: Putative prasinophyte derived plastid Ha: Putative
haptophyte derived plastid
HSP90+SSU+LSU
The taxon-sampling is listed in table 1, appendix 1, and the reconstructed phylogeny is
shown in figure 3.9. The topology and node-support of the concatenated phylogeny
combining SSU, LSU and HSP90 is congruent to the HSP90 single-gene tree. The only
topological difference is the placement of Lessardia elongata, which is placed together
with the Gonyaulacales in the concatenated tree.

61
FIGURE 3.9 HSP90+SSU+LSU
Figure 3.9: Phylogenetic tree of dinoflagellates constructed in a Bayesian framework based on combined
SSU+LSU+HSP90 sequences (1848 nucleotides+523 aminoacids) from 17 species of alveolates.
Dinoflagellates plastid types are indicated with a black circle. Di: Putative diatom-derived plastid Pe:
Peridinin containing plastid Pr: Putative prasinophyte derived plastid Ha: Putative haptophyte derived
plastid
Actin:
The dataset used in this inference is different than the SSU, LSU and HSP90 datasets,
and includes a heterokont (here called stramenopile) outgroup in addition to the
alveolates (the taxa used are listed in table 2 in appendix 1). The reconstructed
phylogenetical tree is shown in figure 3.9. As with the SSU and LSU trees, many nodes
in the actin tree have low support. In this phylogeny, Perkinsus marinus, Oxyrrhis
marinus and the dinoflagellates sensu stricto excludes the apicomplexan and ciliate
outgroups with pp=0.98, with Perkinsus marinus and Oxyrrhis marinus branching off as
the basal lineages in the protalveolate/dinoflagellate lineage. Gymnodinium
chlorophorum branches off as the most basal off the dinoflagellates excluding the other
dinoflagellates with pp=0.99. Karlodinium micrum cluster with Karena brevis with

62
pp=0.94, this haptophyte-plastid containing clade constituting a sister clade to all
remaining dinoflagellates. The peridinin containing Lingulodinium polyedra and the
heterotrophic Cryphecodinium cohnii, both belonging to the Gonyaulacales, cluster
together with pp=0.89.
FIGURE 3.10 Actin
Figure 3.10: Phylogenetic tree inferred in a Bayesian framework based on 19 actin sequences (250
aminoacids) from alveolates and chromists. Three of the taxa belong to unidentified dinoflagellate species
(“uncultured dinoflagellate”, “unidentified dinoflagellate” and CCMP42fd).
GAPDH:
The GAPDH dataset comprises a different taxon-sampling than the other phylogenetic
trees in this study, including the available cytosolic isoforms of GAPDH from
dinoflagellates and a few ciliate and apicomplexan outgroups (see table 3 in appendix 1).
The phylogenetic tree inferred based on cytosolic GAPDH sequences (shown in figure
3.11) reflects the presence of multiple versions of this gene (4 cytosolic isoforms in
Karenia brevis), as it splits into two distinct clades comprising the C1 and C2 isoforms of

63
the gene commonly found among phototrophic dinoflagellates (Takishita et al. 2003).
The Karlodinium micrum sequence from the cDNA library robustly clusters (pp=1.0)
with Karenia brevis in the grouping comprising the C2-versions of GAPDH. The
apicomplexan taxa branches off as the basal group in the C2 clade with pp=0.80, before a
clade comprising two symbiodinium taxa and Gymnodinium simplex (Gymnodiniales)
branches off with pp=1.0. Gonyaulax polyedra (Gonyaulacales), Heterocapsa triquetra
(Peridiniales), Scrippsiella (Peridiniales) and Akashiwo sanguinea groups with pp= 0.50,
and Polarella glacialis (Suessiales) branches off before the gymnodinialean species
(Karenia brevis, Karlodinium micrum and Amphidinum operculatum), which group
together with pp=0.69.
FIGURE 3.11 GAPDH
Figure 3.11: Phylogenetic tree of dinoflagellates reconstructed by Bayesian inference of phylogeny ( +
WAG model), using 26 cytosolic GAPDH sequences (235 aminoacids).
64
3.4 PHYLOGENETIC ANALYSES OF TELONEMA
Telonema was recently identified in molecular surveys of the pico-plankton diversity of
the English Channel and Mediterranian Sea (Romari and Vaulot 2004; Shalchian-Tabrizi
et al. 2005), isolated and kept in laboratory culture for further molecular and
morphological investigations. The initial analyses of the lineage, based on SSU rRNA
gene sequence, indicate that the Telonema lineage is a deep-branching eukaryote related
to the chromalveolates (Shalchian-Tabrizi et al, 2005). However, as phylogenies based on
SSU sequences have been shown to give ambiguous and potentially misleading trees,
additional molecular investigations are required for firmly placing the Telonema lineage
in the eukaryotic tree of life.
3.4.1 Phylogenetic markers generated from Telonema in this study
In this study, the protein gene markers hsp90, alpha-tubulin and beta-tubulin were
generated from Telonema subtilis and Telonema antarcticum and used in phylogenetic
analyses. The taxon-samples in these analyses included a range of taxa representing all
major eukaryotic supergroups (described in box 1). The taxon sampling is listed in table 4
in appendix 1.
3.4.2 Phylogenetic inference using HSP90, alpha- and beta-tubulin
The analyses of the eukaryotic phylogenies including the Telonema sequences were
carried out by Kamran Shalchian-Tabrizi.
For all new sequences generated, initial trees were reconstructed to ensure that the
sequence did not originate from contaminating DNA from the prey organism in the
Telonema cultures (Imantonia rotunda (haptophyte) and Rhodomonas (cryptophyte)).
The Telonema sequences clustered together with pp= 1.00 in all single gene trees as well
as the tree constructed using the concatenated alignments.
Model testing was carried out in a Bayesian framework, comparing the likelihood for
models allowing for variable substitution rates across sites ( + I) and variable
substitution rates across sites and across sequences ( + I + COV) by calculating the
Bayes factor, which is defined as 2 times the difference of the harmonic mean of

65
marginal log likelihood scored of competing evolution models. For alpha- and beta-
tubulin, the datasets applying the covarion parameter were favored over the dataset
without this parameter, hence this was applied in these analyses. Consistent with the
analyses carried out in chapter 3.4.2, the dataset comprising the HSP90 amino acid
sequences was not sensitive to model choice.
TABLE 3.6 Values of harmonic mean of the marginal likelihood
Sequence data Harmonic mean of the marginal likelihood Bayes factor
+I +cov +I+cov
HSP90 --10979.60 -10982.57 -10983.41 5.94
Alpha-tubulin -5474.19 5449.08 -5478.75 50.22
Beta-tubulin -5178.84 -5158.56 -5158.97 40.56
HSP90+alpha-tubulin+beta-tubulin -17140.44 -17091.61 N/U* 97.66
*: Not used model
Table 3.6: Harmonic mean of the marginal likelihood for evolutionary models estimated in Bayesian
MCMC. The Bayes factor (2 times the difference of the harmonic mean of the marginal log likelihood
scores) between the competing model with or without the COV parameters are calculated.
Alpha- and beta-tubulin:
The trees constructed based on alpha- and beta-tubulin gene sequences are depicted in
figure 3.12. The taxon sampling is listed in table 4 in appendix 1.The excavates,
including kinetoplastids, euglenoids and jakobidae, are scattered around both trees. In the
alpha-tubulin tree, the alveolates have split into to groups where the ciliates groups with
the excavates and Telonema, while the apicomplexan and dinoflagellates form a
monophyletic group with cryptophytes, and the Cercozoa are not monophyletic. In the
beta-tubulin tree, the alveolates are monophyletic with pp=0.92, and the Cercozoan
species are grouped together with the haptophytes. Telonema is placed together as a
group in both trees, however, their placement are different in the two trees, as the
Telonema group is placed in a group consisting of euglenids/kinotoplastids/Jakoba libera
(excavates) and ciliophora, while in the beta-tubulin tree, the Telonema group is placed in
a clade together with plants, cryptomonads and euglenoids/kinetoplastids (excavates).

66
FIGURE 3.12 Alpha- and beta-tubulin
Figure 3.12: Phylogenetic trees reconstructed using Bayesian inference of phylogeny ( + WAG model).
Tree A is based on alpha-tubulin sequences from 40 eukaryotic taxa (355 amino acids). Tree B is based on
beta-tubulin sequences from 39 eukaryotic taxa (383 amino acids).
HSP90 and concatenated trees:
The taxa included in the analyses are listed in table 4 in appendix 1. The concatenated
trees and the HSP90 single-gene tree showed congruent topology, and resulted in
different tree topology compared to the tubulin trees. The inferred phylogeny hold the
features found in most eukaryotic phylogenetic trees, including the monophyly of
alveolates, excavates, plants and opisthoconta. The concatenated trees are shown in figure
3.13 (HSP90+alpha+beta-tubulin) and 3.14 (HSP90+SSU). The chromalveolates do not
form a monophyletic clade as Thaumatomonas sp. (Cercozoa) branches off as sisters to

67
the alveolates, and the chromists splits in two subgroups in which cryptophytes and
haptophytes group as sister groups, and the stramenopiles is placed closer to alveolates
and Cercozoa.
The Telonema clade does not cluster within any of the known groups in the HSP90 and
HSP90 + SSU concatenated phylogeny, but branches off within the bikont part of the
eukaryotic tree forming a clade together with plants, cryptophytes and haptophytes. In the
HSP90+alpha+beta-tubulin concatenated tree, the Telonema clade branches off within the
same clade as in the HSP90 + SSU tree, but as a sistergroup to the cryptophytes after the
divergence of the haptophyte clade instead of a basal branch.
FIGURE 3.13 HSP90 + alpha- + beta-tubulin
Figure 3.13: Phylogeny of Telonema from concatenated HSP90+alpha+beta-tubulin sequences from 30
taxa (1203 aminoacids) reconstructed using Bayesian inference ( + COV). Posterior probability values
>0.9 are depicted as numbers of thick branches. Some of the taxa are chimeric and assembled from
different species (see table 4 in appendix 1). The sequences used in concatenated analyses are written in
parentheses: H=HSP90, A=alpha-tubulin, B=beta-tubulin.

68
FIGURE 3.14 HSP90+SSU
Figure 3.14: Concatenated HSP90+SSU trees from 33 taxa (1813 characters) using +I model for the
HSP90 partition and +I+COV for the SSU partition of the alignment.
69
4. DISCUSSION
4.1 MOLECULAR SURVEYS OF ENVIRONMENTAL SAMPLES PROVIDES
INCREASED KNOWLEDGE ABOUT EUKARYOTIC DIVERSITY
4.1.1 Environmental sequences can reveal unknown eukaryotic diversity
Amplification of molecular markers, such as the SSU gene, from DNA sampled from
extreme and common-place eukaryotic communities has revealed a larger eukaryotic
diversity than previously known (Lopez-Garcia et al. 2001; Moon-van der Staay et al.
2001; Richards and Bass 2005). Some of these sequences represent deep-branching
lineages or sister-groups of known eukaryotic clades (Richards and Bass 2005), such as
the potentially deep-branching chromalveolate lineage Telonema (discussed later in this
study) and the putatively early diverging dinoflagellate lineages revealed by
environmental surveys of coastal- and deep-sea communities (Lopez-Garcia et al. 2001;
Romari and Vaulot 2004; Shalchian-Tabrizi et al. 2005). Applying sequences obtained
from the environment has also contributed to the global phylogeny of eukaryotes since
the hidden microbiological diversity may include high-level taxon groups required for
recovering the eukaryotic tree of life (Lopez-Garcia et al. 2002).
However, a major problem in obtaining sequences directly from the environment is the
huge biases in the PCR towards amplification of certain groups, and virtually lack of
amplification of abundant but diverged groups (Richards and Bass 2005). Some of the
problems can be caused by mismatch of the applied primers and use of non-optimal PCR
and cloning strategies (Richards and Bass 2005). Another crucial point is to use proper
DNA extraction protocol, as high quality of the isolated DNA is required for an efficient
PCR amplification of the majority of the present DNA diversity. Thus, improvement of
the DNA isolation method for extracting sufficiently pure PCR-ready DNA from
environmental samples could provide a valuable contribution in the work to expand the
current knowledge about eukaryotic diversity.

70
4.1.2 Testing of the kit ChlamCAP (Genpoint) for potential use in environmental
surveys
The magnetic-bead based DNA-extraction kit ChlamCAP is designed to isolate pure
PCR-ready DNA. The protocol of the kit is rapid and no centrifugation is needed. In
contrast to other available commercial kits, the magnetic beads in the ChlamCAP kit
binds the outer surface of bacterial cells and allows an additional washing step prior to
cell lysis. Since samples taken from the environment could contain PCR inhibiting
particles, the washing step in ChlamCAP should in principle improve the quality of the
extracted DNA. However, as the kit has only been optimized for bacterial cells, the kit
needs to be tested on eukaryotes. As the protocol used in this kit involves capturing of the
cells by a mutual attraction between molecules on surface of the cells and beads, the
DNA yield could differ among protist species due to variable affinity between the cells
surface and beads. Thus, the sensitivity of the kit could vary between different types of
species.
To test whether this kit could be applied to eukaryotes, DNA extractions with subsequent
PCR-amplifications of the eukaryotic small ribosomal subunit (SSU) were carried out
applying a wide range of different autotrophic and heterotrophic protist phyla from
laboratory cultures. DNA was successfully isolated and SSU amplified from all the
cultures tested without changing the manufacturer’s general instructions for bacterial
DNA-extraction, suggesting that the specially coated surface on the ChlamCAP magnetic
beads are able to attract and capture cells from a wide range of eukaryotic phyla.
To investigate the sensitivity of the ChlamCAP kit, DNA was extracted from diluted
cultures of five different marine- and fresh-water species. Four of the species
(Karlodinium micrum, Tetraselmis sp., Pyramimonas sp. and Chlamydomonas
reinhardtii) showed a sensitivity ranging from 1.5 x 10³
cells/ml and 2.8 x 10³ cells/ml,
indicating a sufficient sensitivity of the kit for use of PCR on environmental samples.
One of the species (Isochrysis galbana) had sensitivity significantly lower than this:
1.6x10⁵ cells/ml. The lower sensitivity for this species could be due to either inefficient
attraction between the magnetic beads and the surface of Isochysis galbana or sub-

71
optimal PCR conditions for this particular alga. Further optimization of the DNA
extraction and PCR protocols may reduce the sensitivity differences between the species.
As these results show, the ChlamCAP kit designed for extraction of PCR-ready DNA
from bacteria can also be applied to a broad range of micro-eukaryotic lineages. The
sensitivity of the kit is shown to be as low 1500 cells/ml, which makes the kit suitable for
PCR amplification of environmental sequences, thus providing possibilities for a
simplified protocol for clone library construction.
4.1.3 Measuring differences in PCR-yield between two magnetic bead-based kits
In parallel with testing of the ChlamCAP kit, DNA was extracted using another
magnetic-bead based DNA isolation kit: Dynabeads DNA direct from Dynal. The Dynal
kit has previously been shown to extract DNA efficiently from some algal groups
(dinophyceae, chlorophyceae, phaeo-phyceae (stramenopiles), crysophyceae
(stramenopiles) and rhodophyceae (red algae) (Rudi et al. 1997), but have never been
systematically tested for application of other types of organisms. Hence, the range of
groups was in this study extended to include dinophyceae, chlorophyceae (green algae),
stramenopiles, cryptophytes, haptophytes, prasinophytes and a heterotrophic eukaryote
(Telonema).
The Genpoint kit is expected to produce lower yield than the Dynal kit, because it uses an
additional cleaning-step prior to lysis that may cause substantial loss of cells. On the
other hand, the Genpoint kit should in principle give purer DNA that is easier to amplify
in a subsequent PCR-reaction. However, both kits gave successfully amplified PCR-
products from all species tested, and none of the kits could be concluded to provide DNA
more suitable for PCR than the other when considering the amount of PCR-products
obtained.
Further experiments are required to conclude whether the ChlamCAP kit or the Dynal kit
is the most appropriate for use in molecular surveys of environmental samples. The
results shown in this study have demonstrated that both kits apply to eukaryotes of
interest for environmental sampling, and that the high sensitivity requirement is

72
submitted by the Genpoint kit. DNA extractions from mixed cultures and real
environmental samples are needed for concluding whether protocol the Genpoint kit is
appropriate and better compared to other protocols for DNA extraction from
environmental samples, and the kit is currently being tested in environmental surveys of
fresh-water lakes in a project searching for additional taxa. with affiliation to the
Telonema clade.
4.2 INSIGHT TO THE GENOMICS OF THE DINOFLAGELLATES APPLYING
SEQUENCES FROM cDNA LIBRARIES AND TARGETED PCR
Only a few sequences were available from aberrantly pigmented dinoflagellates when
this study was initiated, hence targeted PCR and construction of cDNA libraries were
carried out to investigate the expressed genomic diversity among this group.
Due to the exceptionally high DNA content of dinoflagellates (Hackett et al. 2004a),
whole genome projects are difficult to carry out for this group cDNA and Expressed
sequence tag (EST), however, have earlier been constructed from other species of
dinoflagellates, including the peridinin-containing species Gonyaulax polyedra,
Amphidinium carterae and Alexandrium tamarense and the 19’-containing Karenia
brevis (Bachvaroff et al. 2004; Hackett et al. 2004b; Takishita et al. 2004; Yoon et al.
2005).
4.2.1 cDNA libraries from two dinoflagellates with aberrant plastids.
In this study, cDNA libraries from the aberrantly pigmented dinoflagellates Karlodinium
micrum and Gymnodinium chlorophorum were constructed. During the work on these
libraries, we got to know that another research-group already had constructed a
Karlodinium micrum library and generated more than 10,000 sequences that would be
public available in short time. Knowing this, we decided not to do as extensive research
on our Karlodinium micrum library as originally planned. The first attempts of
constructing a library from the Gymnodinium chlorophorum was not successful, and only
four sequences have currently been generated from this library.
231 sequences were generated from the cDNA libraries. 56 were discarded from the
gene-annotation pipeline due to low sequence quality. Most of the discarded sequences
73
were useless due to polymerase slippage in long stretches of poly-A tails in the clones. As
the sequences were read from the 5’ end, poly-A tails early in the sequence would be due
to either very short inserts or unsuccessful directional cloning.
All the good-quality sequences were singletons, and approximately 16% of these were
annotated using the BLAST algorithm (at National Center for Biotechnology
Information, NCBI) and the Salmon Gene Project (SGP) pipeline. This is slightly lower
than the percentage identified in the Alexandrium tamarense library where 20% of the
sequences were annotated (Hackett et al. 2005), however, it is difficult to conclude about
the sequence quality of our library based on this difference, as dissimilar threshold values
for significant hits may have been utilized in the annotation pipelines.
Most of the annotated sequences were identified as proteins involved in cell metabolism
(7%), including several proteins involved in transferase (kinase, phosphorylase) and
energy production (triose-phosphate isomerase). This is inconsistent with the results of
other EST libraries from dinoflagellates, where the most abundant sequences are
associated with protein synthesis, histone-like proteins or luciferin-like genes (Hackett et
al. 2005; Hackett et al. 2004b) However, consistent with the high abundance of histone-
like proteins in dinoflagellates indicated in the Alexandrium tamarense EST-library , one
histone-like protein was also identified in out dataset. Additionally, three sequences
involved in RNA synthesis and transcription regulation were identified, including a
putative DEAD box helicase, which is a protein associated with preRNA splicing and
other RNA associated processes.
Nearly 84% of the sequences were not identified using BLAST against the swissprot, pdb
and nr databases, and only a few of these had hits against other dinoflagellate sequences
when blasting against the NCBI EST-database. The low hit percentage against other
generated EST-libraries was unexpected, as the sequences were predicted to hit against
sequences of previously constructed dinoflagellate cDNA libraries, especially from
Karenia brevis, a close relative to Karlodinium micrum from which over 6000 ESTs have
been sequenced (Yoon et al. 2005). The low frequency of hits against the EST-database
may indicate that there are sequences obtained in our cDNA library not earlier found in
dinoflagellate cDNA libraries. However, this could also be due to non-overlapping
sequences: that different parts of the genes have been sequenced in the different EST

74
projects, as the Alexandrium tamarense library (Hackett et al. 2005), with 11,000
published sequences (Hackett et al. 2005), was sequenced from the 3’ end and may have
contributed to the unexpected low hit percentage against this library.
The papers published based on other EST-surveys of dinoflagellates have foremost
concentrated on plastid-targeted genes (Hackett et al. 2004b), which were also our major
interest, however, no plastid-targeted genes were identified among the 175 good-quality
sequences generated (171 from Karlodinium micrum and 4 from Gymnodinium
chlorophorum).
Three of the genes present in the EST libraries are genes previously used for phylogenetic
analyses (GAPDH, actin and HSP70) (Harper and Keeling 2003; Harper et al. 2005).
Two of these (GAPDH and actin) were used for phylogenetic inference of dinoflagellates
in this study. HSP70 has earlier been shown to be useful for phylogenetic analyses
(Harper et al. 2005), but the number of public dinoflagellate sequences from this gene is
low and therefore not suitable for phylogenetic studies.
4.2.2 Dinoflagellate introns have various branching sequences
When sequencing the Alexandrium tamarense hsp90 gene, a 358 bp insertion was found.
The other dinoflagellate hsp90 sequences did not contain this insertion. The insertion is
most likely a spliceosomal intron, as the insertion was bordered with the canonical GT-
AG dinucleotides, as well as containing a stop-codon.
The putative branchpoint sequence was found 30 bp upstream of the 3’end of the
insertion. The branchpoint sequence (GACTAAT) is similar to the conserved branch-
point sequence required for splicing in yeast (TACTAAC) and in the deep branching
parabasilid and diplomonad (excavates) lineages Giardia lamblia and Trichomonas
vaginalis (AACTAAC; (Johnson 2002; Nixon et al. 2002; Vanacova et al. 2005), and
have not earlier been reported from dinoflagellate introns. The finding of the canonical 3’
and 5’ splicing-site sequences as well as the conserved branching-point sequence are
untypical for the hitherto described dinoflagellate introns, as these often lack conserved
sequences (Okamoto et al. 2001; Schott et al. 2003), suggesting that different recognition
mechanisms for introns are present in the spliceosomal apparatus in dinoflagellates.
75
The putative intron also expresses another feature not earlier reported from dinoflagellate
introns, as the intron seems to consist of a palindromic sequence, where one part of the
intron is an inverted duplication of the other part. The folding of the 3’-part and the 5’
part of the insertion separately shows that these parts also possess palindromic properties
(data shown only for the 5’-end (180 bp) of the intron), and when the 5’-end (90 bp) of
one of these 180 bp sequences are folded, even more complementary sequences are seen,
indicating that the intron may comprise a hierarchy of repeated palindrome sequences.
The insertion contains an open reading-frame, putatively encoding a protein consisting of
108 aminoacids. However, when this possible ORF was blasted against public databases,
no homologues were found. This could possibly be due to few available genomic
sequences from dinoflagellates in public databases.
4.3 INVESTIGATIONS OF CHROMALVEOLATE EVOLUTION
Investigations of the evolution in the eukaryotic supergroup chromalveolates were carried
out by different approaches. The phylogeny and plastid evolution of dinoflagellates were
investigated using nuclear protein-encoding genes alone and multi-gene alignments
combined with ribosomal DNA sequences, and large-scale eukaryotic phylogeny was
inferred including the putative deep-branching Telonema lineage.
4.3.1 Dinoflagellate phylogeny inferred by nuclear encoded protein genes
The dinoflagellates are famous for their remarkable plastid diversity, resulting from
evolutionary events such as secondary and even tertiary endosymbioses, plastid losses
and chloroplast replacements (Hackett et al. 2004a). The peridinin plastid is postulated to
be the ancestral plastid type in the group (Takishita et al. 2004; Taylor 2004) and
according to the chromalveolate hypothesis, this originates from the ancestral
chromalveolate plastid engulfed in the common ancestor of dinoflagellates, apicomplexa,
ciliates, haptophytes, cryptophytes and heterokonts. As described in the introduction, the
unveiling of the complex plastid evolution history in the dinoflagellates requires a
resolution of the dinoflagellate phylogeny.

76
The SSU and LSU sequences are common markers for inferring eukaryote phylogeny,
but these rRNA markers seem to contain deficient phylogenetic information for complete
resolution of the dinoflagellate phylogeny (Saldarriaga et al. 2004; Saldarriaga et al.
2001), probably due to the rapid and early divergence of this group. Additionally, the
asymmetry of the evolutionary rates and the potential covarion substitution pattern found
in various rRNA gene sequences may contribute to the resolution problems associated
with these markers (Galtier 2001; Lopez et al. 1999). Consistent with this, the Bayesian
tree based on dinoflagellate SSU sequences in this study applying the covarion parameter
were a Bayes factor of 14 better than the best model without applied covarion model,
which is substantially higher than 10 usually regarded as good evidence for the model
(Kass and Raftery 1995; Newton et al. 1994). However, despite the improved likelihood
obtained when applying the covarion parameter, the dinoflagellate SSU tree was poorly
resolved. Thus, due to the limitations of the rRNA gene markers, other phylogenetic
markers are needed for a complete resolution of dinoflagellate phylogeny. In this study,
the dinoflagellate phylogeny has been inferred using the nuclear encoded protein genes
hsp90, actin and GAPDH. The 90 kDA cytosolic heat shock protein HSP90, a highly
conserved molecular chaperone (Stechmann and Cavalier-Smith 2004), is useful for
phylogenetic inference because of the uniform evolution and length of the protein,
making the protein especially interesting for analyses including species with rapidly
evolving rRNA (e.g.Oxyrrhis marina), and deep-branching alveolates, such as Perkinsus
marinus (Leander and Keeling 2004; Stechmann and Cavalier-Smith 2003). Hence, this
gene was amplified from several dinoflagellates and subsequently sequences from three
species holding a 19’-hexanoyloxy-fucoxanthin plastid (Karenia brevis, Karlodinium
micrum and Karenia mikimotoi), the chlorophyll a+b containing Gymnodinium
chlorophorum and a peridinin-holding dinoflagellate (Alexandrium tamarense). The
phylogenetic inference of the dinoflagellates based on the HSP90 protein sequences
resulted in resolved phylogenetic trees with higher posterior probability than the rRNA
gene trees on almost all internal nodes and basal branches. The support of the nodes in
the trees constructed on basis of HSP90 sequences, and grouping of species in agreement
with morphology-based classification of dinoflagellates suggest that this gene is a good
marker for inferring dinoflagellate phylogeny, and that this protein gene can be used as a

77
useful addition to rRNA and cytochrom b sequences for inferring dinoflagellate
phylogeny (Zhang et al. 2005). However, since the taxon sampling is relatively poor in
the HSP90-tree, further sequencing of a wider taxon sampling is needed before it can be
concluded that this gene resolves the dinoflagellate phylogeny better than the rRNA
genes.
The two other genes applied for dinoflagellate phylogeny, the actin and GAPDH, were
obtained from the cDNA-libraries constructed from Karlodinium micrum and
Gymnodinium chlorophorum. Actin was generated from both libraries, while GAPDH
was generated from Karlodinium micrum only. Phylogenetic analyses based on actin
gave an unresolved tree with only a few supported nodes. This low support indicates that
this gene may not be suitable for inferring dinoflagellate phylogeny . The tree
reconstructed based on GAPDH sequences had some nodes with relatively strong
support, but the many gene duplication events of the gene may obstruct extensive use of
this marker for phylogenetic inference (Fast et al. 2001; Takishita et al. 2003; Takishita et
al. 2004). Hence, of the three genes tested for use in dinoflagellate phylogeny, HSP90
seems to be the most appropriate.
4.3.2 Dinoflagellate haptophyte- and prasinophyte-derived plastids were each
acquired only once, replacing the ancestral peridinin-plastid
The phylogenetic trees constructed from SSU, HSP90 and concatenated
HSP90+SSU+LSU gene sequences contained five species of dinoflagellates with true
aberrantly pigmented plastids; Gymnodinium chlorophorum holding a putative
prasinophyte-plastid, and Karlodinium micrum, Karenia brevis and Karenia mikimotoi,
holding a haptophyte derived plastid (Chesnick et al. 1997; Chesnick et al. 1996;
Elbrächter and Schnepf 1996; Tengs et al. 2000). Additionally, Lepidodinium viride,
harboring a plastid of putative green-algal origin (Watanabe et al. 1990), were included in
the SSU analysis. The SSU tree, although poorly resolved in many nodes, grouped the
green colored species Gymnodinium chlorophorum and Lepidodinium viride with high
support (pp=1.0), strongly implying a monophyletic origin ofboth the species and their
plastid.
78
The HSP90 single gene tree and the concatenated HSP90+SSU+LSU tree showed
congruent topology with slightly different node support. The haptophyte-containing
species clustered together as a monophyletic clade with high support, establishing the
prediction of a common ancestry for these species belonging to the order Gymnodiniales,
which earlier have been supported by variable degrees of bootstrap support (de Salas et
al. 2003; Takishita et al. 2004; Tengs et al. 2000; Zhang et al. 2005).
The clustering of the two groups of dinoflagellates holding 19’ hexanoyloxy-fucoxanthin
and the chlorophyll a + b respectively in two separate monophyletic groups indicates that
the true aberrant plastids (i.e. fully integrated plastids) most likely were acquired in two
endosymbiotic events, where a haptophyte was engulfed and established as a tertiary
plastid in the ancestor of Karlodinium and Karenia, and a putative prasinophyte-like
algae was incorporated in the ancestor of the green-colored species in a serial secondary
endosymbiosis (i.e. replacement of a secondary plastid by another secondary plastid
(Keeling 2004b)). The phylogenetic trees indicate that these endosymbioses occurred
relatively early in the dinoflagellate evolution in approximately the same time period
after the divergence of the earliest peridinin-containing species. The peridinin-containing
taxon Amphidinium carterae branches off as the most basal of the dinoflagellates sensu
stricto (i.e. dinoflagellates with dinokaryon). The divergence of the haptophyte and
prasinophyte plastid-containing clades within the peridinin-containing species indicates a
peridinin-containing ancestor of the dinoflagellates, which in some lineages substituted
the original plastid with a new plastid in a replacement event. These results are consistent
with the previous indications supporting that the last common ancestor of all
dinoflagellates harbored a peridinin-plastid (Ishida and Green 2002; Saldarriaga et al.
2001; Takishita et al. 2004; Tengs et al. 2000; Yoon et al. 2005; Zhang et al. 2005), and
are thereby contradictory with the hypothesis postulated by Yoon et al in 2002,
suggesting that the haptophyte-plastid was the ancestral plastid in dinoflagellates (Yoon
et al. 2002a). The trees also indicate an early divergence of the unarmored taxa in the
order Gymnodiniales, suggesting an evolution of the dinoflagellates from naked into
armored lineages (Prorocentrales, Gonuaylacales and Peridiniales). This is contradictory
to the interpretations deduced from previous phylogenetic inference of SSU, where the
naked Gymnodiniales is suggested to be derived from thecate orders (i.e. armored),

79
presumably by plate loss during the dinoflagellate radiation (Saldarriaga et al. 2004;
Saldarriaga et al. 2001; Taylor 2004).
In addition to the photosynthetic groups holding 19’ or chlorophyll a+b plastids, there are
also other groups of phototrophic dinoflagellates harboring other plastids than the
ancestral peridinin-plastid. One of these was represented in the analyses carried out in
this study: Kryptoperidinium foliaceum, which harbors a plastid of putative diatom
origin. This plastid is not considered to be completely integrated in the host, since it
retains several traits usually lost during integration in the host cell, such as the nucleus
and mitochondria. In addition, no genes have been shown to have been transferred from
the symbiont to the host, and several genes (e.g. HSP90, tubulin and actin) that have been
lost in the true secondary plastids still retains in the nucleus of this plastid (Chesnick et
al. 1997; Chesnick et al. 1996; McEwan and Keeling 2004). In the HSP90 and
concatenated analyses, Kryptoperidinium foliaceum does not group with the haptophyte
or the prasinophyte plastid-containing clades, but clusters with Crypthecodinium cohnii, a
heterotrophic dinoflagellate which earlier have proven to be difficult to place in
phylogenetic trees (Saldarriaga et al. 2001; Zhang et al. 2005).
Other dinoflagellates holding anomaly pigmented plastids not represented in these
analyses includes Dinophysis and Noctiluca (Saldarriaga et al. 2004). These species have
in earlier analyses shown to group in separate clades (Edvardsen et al. 2003; Saldarriaga
et al. 2004; Saldarriaga et al. 2001), suggesting that separate plastid replacements have
occurred in these lineages, indicating that plastid replacements are a widely distributed
process among dinoflagellates
Perkinsus marinus and Oxyrrhis marina branches off as basal lineages prior to the
dinoflagellates sensu stricto in the HSP90 and concatenated HSP90+SSU+LSU trees,
robustly placing Oxyrrhis as a sister group to the remaining dinoflagellates. Due to a very
divergent SSU sequence, Oxyrrhis has proven difficult to place in large-scale rRNA
analyses, where it tends to strongly affiliate with the Gonyaulacales (Saldarriaga et al.
2004). However, the phylogenetic placement shown in our analyses, where Oxyrrhis
branches off as a basally diverging protalveolate, is consistent with morphological
investigations and several other phylogenetic analyses of protein genes (Leander and
Keeling 2004; Saldarriaga et al. 2003).

80
4.3.3 Phylogenetic inference of the recently re-discovered Telonema clade
Phylogenetic analyses of the small ribosomal subunit as well as morphological
investigations of the Telonema clade suggest that this lineage is a deep branching
eukaryotic lineage related to the supergroup chromalveolates. This indication was further
established in the analyses carried out in this study, where single-gene and concatenated
protein alignments were subject for phylogenetic inferences.
The phylogenetic analyses of the protein gene sequences HSP90, alpha-tubulin and beta-
tubulin placed Telonema as a single, distinct group with no clear relationship to any other
group. However, the alpha- and beta-tubulin trees were incongruent and did not group
alveolates, cercozoa and excavate species as monophyletic clades, characteristics often
seen in other phylogenetic eukaryote trees (Baldauf et al. 2000; Harper et al. 2005).
These topological discrepancies could result from these genes having an evolutionary
history that violate the assumptions in the underlying model used in the phylogenetic
inferences. In general, if sequences have evolved differently in separate phyla, large-scale
phylogenies would be difficult to deduce (Lopez et al. 1999). Applying the covarion
model on the concatenated HSP90+alpha-tubulin+beta-tubulin sequences, the excavates
were grouped together with considerable increased support values, supporting a
heterogeneous evolution of sequences in some of the groups. This is also consistent with
the emerging consensus that the tubulin genes are not suitable for large-scale eukaryotic
phylogenies. (Tom Cavalier-Smith and Andrew Roger, personal communication).
However, the trees based on the HSP90 single-gene alignment and the alignments
combining HSP90 with SSU hold the features often robustly supported in eukaryotic
trees, such as the monophyly of alveolates, opisthokonts, excavates, heterokonts and
plants (Baldauf et al. 2000). Due to this, the HSP90 single-gene tree and the HSP90 +
SSU concatenated tree were used for interpretation of the phylogenetic placement of the
Telonema lineage in the eukaryotic tree.

81
4.3.4 Establishing Telonema as a deep, diverging eukaryotic lineage by combining
phylogenetic inference of gene sequences and morphological traits
The Telonema lineage groups on its own in both the HSP90 and the concatenated
HSP90+alpha tubulin+beta tubulin phylogenies, hence confirming the phylogeny seen in
the SSU trees. All the trees are also consistent in placing Telonema together with one or
several chromalveolates. However, since Telonema was placed either close to the
haptophytes and cryptophytes in the HSP90 trees (both single-gene and concatenated
trees) and the close to the alveolates and stramenopiles1 in the SSU tree, the exact origin
of the group remains unclear.
Consistent with the phylogenetic inference, the morphological investigations of the
Telonema species indicate a relation to members of the chromalveolates. Structural
features supporting the evolutionary affinity to chromalveolates are mitochondria with
tubular cristae (also found in also called stramenopiles, haptophytes and the alveolates), a
complex cytoskeleton (also found in alveolates, but not in chromists), tripartite hairs; a
trait regarded as a synapomorphic trait for stramenopiles, as well as characteristic alveoli;
a trait also seen in the alveolate, stramenopiles and glaucophytes (Andersen 2004;
Shalchian-Tabrizi et al. 2005). Of these features, the tripartite tubular hairs on the long
flagellum probably constitute the strongest link to the chromalveolates, since this trait is
regarded as the only synapomorphic character defining the stramenopiles (Andersen
2004). The stramenopile tripartite hairs are tubular, composed of a hollow base and
tubular shaft as well as none-tubular distal fibers (see figure 1.6d), and the synthesis of
this structure involves complex processes including synthesis, assembly and transport
(Andersen 2004). The structure of these hairs causes a swimming behavior in
stramenopiles that is different from many other protist group, as it involves the forward
directed flagellum pulling the cell by means of the tripartite tubular hairs that is attached
to it (Andersen 2004), a swimming behavior also seen in Telonema. The complex
biosynthetic pathway such as the one required to construct tripartite hairs is unlikely to
have evolved several times, and together with the shared mechanism for movement, this
indicates that Telonema belongs to the stramenopile clade. Although the tubular shape of
1 In this part of the discussion, the term stramenopiles is used to describe the heterokonts, mainly because the term
heterokont often refers to photosynthetic species, while the term stramenopiles often refers to both phototrophic and
heterotrophic species.

82
the hairs in Telonema has never been confirmed, the partition of the hairs, and the
peculiar movement, suggests a close relationship between the Telonema and the
stramenopiles. However, the placement of Telonema within the stramenopiles is rejected
in all inferred single-gene protein trees, where Telonema are placed closer to the
haptophytes and cryptophytes than to the stramenopiles. This is interesting, since
bipartite tubular flagella hair similar to the tripartite hairs found in stramenopiles are also
found in the cryptophytes (Andersen 2004), suggesting that this type of tubular hairs may
have been inherited from the common ancestor of Telonema, cryptophytes and
stramenopiles.
The alveoli found just beneath the cell membrane in Telonema antarcticum is another
feature connecting Telonema to the chromalveolates (Baldauf et al. 2000), however, this
trait suggests a relationship to either alveolates or glaucophytes (plantae) . Based on
phylogenetic analyses and the presence of tubulocristate mitochondria, it is not likely that
Telonema is closely related to the Glaucophytes. Instead, the phylogenetic and
morphological features (tubulocristate mitochondria, tripartite hairs, a complex
cytoskeleton and alveoli) suggest that Telonema is a distinct, deep branching lineage
related to both chromists and alveolates. The tripartite hairs found in both chromists and
Telonema could possibly be an inheritance from a common ancestor of stramenopiles and
the Telonema-lineage. Given that the chromist lineage is monophyletic, as several papers
have suggested (Cavalier-Smith 2003b; Keeling 2004a; Yoon et al. 2002b), the tripartite
hairs could have derived from a common ancestor of all chromists and the Telonema-
lineage. This feature would then have been lost in the lineages leading to the haptophytes
and possibly changed in the cryptophytes, resulting in bipartite hairs in these genera.
However, at the current stage it is difficult to rule out the possibility that both the
tripartite hairs and the cortical alveoli are structures that have been developed
independently or converges from different flagellar hair types. The Telonema lineages
express a alveolate-like discrete cytoskeleton that has not been found in other chromist
lineages, hence, the lineage most likely separated from the chromist-lineage prior to the
reduction of the cytoskeleton seen in extant chromist groups, suggesting that the
Telonema group is a deep branching chromist lineage. As the cryptophytes currently is
regarded the earliest diverging lineage among the three known chromist groups, a deep-

83
branching lineage comprising tubular mitochondrial cristae challenge the view that the
flattened mitochondrial cristae found in cryptophytes constitute the ancestral state for
chromists (Yoon et al. 2002b), however, the indications confirming Telonema as a basal
chromist also imply that the tubular cristae is the ancestral state in chromists, while the
flattened cristae is a derived state. Another intriguing possibility is that the Telonema
lineage may have separated from chromist lineage even earlier, preceding the separation
of chromists and alveolates. This would make Telonema a deep branching
chromalveolate group, actually constituting one of the earliest diverging chromalveolates
known. This scenario is supported by the fact the alveolates, like Telonema,
stramenopiles and haptophytes, also hold tubular cristae, suggesting that this could be the
ancestral state for all chromalveolates.
Telonema is on basis of these phylogenetic and morphological results now suggested to
constitute a new phylum called Telonemia (Shalchian-Tabrizi et al. 2005).
4.3.5 Chromalveolate monophyly is not supported in the phylogenetic analyses
including the Telonema lineage
The chromalveolate hypothesis has been supported by numerous data, including a
number of morphological and biochemical characters such as plastid membrane topology,
storage carbohydrates, flagellar structure and accessory pigments shared by all or some of
the chromalveolates (Keeling et al. 2004), as well as by the replacement of the plastid-
targeted nuclear genes glyceraldehyde-3-phosphatase (GAPDH) and fructose-1,6-
bisphosphate aldolase (FBA) uniquely shared by the chromalveolates (Fast et al. 2001;
Harper and Keeling 2003; Patron et al. 2004). However, despite this indirect evidence of
common ancestry, this supergroup assembly has so far never been shown to cluster as a
monophyletic group in phylogenetic trees from nuclear encoded gene sequences (Keeling
2004b; Keeling et al. 2004). Consistent with this, our analyses using SSU and three
protein-encoding genes (HSP90, alpha- and beta-tubulin) also show the chromalveolates
(including Telonema) as a polyphyletic group. In these analyses, the chromists are split
into two lineages, and are incompatible with both the chromalveolate hypothesis as well
as the assumption of the chromists as a monophyletic group (Yoon et al. 2002b). In the
SSU phylogeny, the placement of Thaumatomonas (Cercozoa), branching off within a
84
clade comprising the alveolates, stramenopiles and Telonema, is probably misleading as
no morphological features suggest a near relationship between Cercozoa and
chromalveolates, and the suggested relationship is hence probably due to the lack of
sequences from other close-related Rhizaria-members or reflect the deep and rapid
divergence of these species
4.3.6 Plastid evolution and the putative monophyly of chromalveolates
The assumed chromalveolate monophyly manifested in the chromalveolate hypothesis is
deduced from a particular model of plastid evolution, stating that the chromalveolate
plastid originated from a single secondary endosymbiotic event where a red plastid was
acquired in the common ancestor of all chromalveolates (Cavalier-Smith 1999). This
model of plastid evolution is controversial as the number of secondary endosymbiotic
events remains under debate. However, several findings are consistent with the
chromalveolate hypothesis, and support that the plastid found in extant chromalveolates
originated in only one secondary endosymbiotic event. Among the evidence supporting
this model of plastid evolution are the unique gene-replacements of plastid-targeted genes
GAPDH and FBA mentioned earlier, shared by apicomplexans, cryptophytes,
dinoflagellates, haptophytes and heterokonts, which implies a common origin for these
plastids (Fast et al. 2001; Harper and Keeling 2003; Patron et al. 2004). Additionally, a
common origin of the chromist plastids rather than several independent secondary
acquirements in cryptophytes, haptophytes and heterokonts is indicated in analyses of
concatenated plastid genes (Yoon et al. 2002b). Despite the lack of monophyletic
clustering of the chromalveolate groups in phylogenetic trees, analyses have indirectly
supported the chromalveolate hypothesis by grouping different chromalveolate members,
indicating the alveolates as sister group to the heterokonts and clustering haptophytes and
cryptophytes (Baldauf et al. 2000; Ben Ali et al. 2001; Harper et al. 2005; Van de Peer
and De Wachter 1997). In our protein and SSU analyses, these relationships are also
established, including the Telonema as an early branching lineage the heterokont-
alveolate clade in the SSU phylogeny, while affiliating with the haptophytes and the
cryptophytes in the protein phylogeny. The phylogenetic placement in the protein-gene
phylogenies is hence consistent with the previous SSU analyses and the classification

85
based on morphological investigation in affiliating the Telonema lineage to the
chromalveolates, indicating that Telonema is a deeply diverging chromist or
chromalveolate.
As a consequence of the phylogenetic placement of Telonema one should, according to
the chromalveolate hypothesis, expect that the members of this lineage once harbored a
red-algal derived plastid originating from the first secondary uptake in the common
ancestor of chromalveolates, from which remnants may be traced as a vestigial plastid (as
found in e.g. apicomplexa (McFadden et al. 1997) or as plastid-derived genes in the
nuclear genome transferred by horizontal gene transfer, as reported in Trypanosomes
(excavates(Hannaert et al. 2003) However a chloroplast or a vestigial plastid was not seen
when investigating Telonema.
The absence of plastids in the basal chromalveolate branches is a challenge to the plastid-
evolution model implicated in the chromalveolate hypothesis. Among the chromalveolate
lineages devoid of plastids are ciliates, oomycetes and other deep-branching
stramenopiles, Cryptosporidium parvum (apicomplexa), the deep-branching
protalveolates Oxyrrhis marina, Perkinsus marinus and Parvilucifera and the putatively
early branching dinoflagellate group syndinians (Taylor 2004). For this distribution of
heterotrophy to be coherent with the chromalveolate hypothesis, independent plastid loss
in all this lineages is required. This requirement is one of the major arguments opposing
the chromalveolate hypothesis, as multiple plastid losses by some are considered
unparsimonious and implausible (Grzebyk et al. 2004; Taylor 2004). These opponents of
the chromalveolate theory recognize a more parsimonious and likely model of plastid
evolution to be separate acquisitions of red algal derived plastids in haptophytes,
cryptophytes, heterokonts, dinoflagellates and apicomplexa (Falkowski et al. 2004;
Grzebyk et al. 2004; Grzebyk et al. 2003; Taylor 2004), and in consistence with this,
there has been postulated a theory rejecting a common origin of chromalveolate plastids,
providing a different explanation of the high distribution of secondary red plastids present
in modern phytoplankton. This model is called “The portable plastid hypothesis”
(Falkowski et al. 2004; Grzebyk et al. 2003), and is a theory based on the assumption of
separate endosymbiotic uptakes of the red plastid, claiming that the wide distribution of

86
secondary, red plastids among phytoplankton is due to this plastid being more portable
than the green plastid. The difference in portability is claimed to be caused by the amount
of critically important genes retained in the red plastid, increasing this plastid’s ability to
integrate into a new host by secondary endosymbiosis compared to the green plastid
which have less retained genes (Falkowski et al. 2004; Grzebyk et al. 2003). However,
this theory is also under criticism, as it rests on assumptions that is not well supported or
even contradicted. This hypothesis assumes that the red algal plastids retain more genes
than do green, which is criticized as only a small number of red algal plastids hitherto has
been investigated (Keeling et al. 2004). It also assumes that secondary endosymbiosis
involving red plastids have happened more often than endosymbiosis involving green
plastids, however, this is contradictory to the chromalveolate hypothesis (Keeling et al.
2004). Additionally, the hypothesis rests on an assumption that gene transfer from the
endosymbiont nucleus to the host nucleus occurs rarely, but there are evidence that a
large amount of genes are transferred from the endosymbiont to the nucleus after
incorporation of a plastid (Keeling et al. 2004; Stegemann et al. 2003). There are also
disagreements regarding whether five independent secondary uptakes of a red-algal
plastid are a more parsimonious evolutionary event compared to the repeated plastid loss
implicit in the chromalveolate hypothesis. The establishment of secondary plastids is a
evolutionary complex event, where a novel organelle-specific protein-targeting
machinery and the acquisition by over a thousand genes of appropriate targeting signals
are required (Cavalier-Smith 2000; Cavalier-Smith 2002). Plastid losses, however, have
happened repeatedly among dinoflagellates, heterokonts, cryptophytes and euglenoids,
indicating that this is a relatively common feature in eukaryote algae (Cavalier-Smith
2002; Hoef-Emden et al. 2002; Preisfeld et al. 2001; Saldarriaga et al. 2001).
Thus, in the current debate regarding the origin of the red algal plastids, we have on one
hand the opponents of the chromalveolate hypothesis stating that the plastid loss implicit
in this theory is unlikely and un-parsimonious (Taylor 2004), while on the other hand, we
have the supporters of the chromalveolate hypothesis stating that the scenario where five
protist lineages independently engulf and incorporate a secondary red plastid is even
87
more unlikely and un-parsimonious, and that the portable-plastid hypothesis “does not
hold up to scrutiny”(Keeling et al. 2004).
So, how does Telonema contribute to the debate concerning the putative monophyly of
chromalveolates? As discussed earlier, several of the indications of the Telonema
investigations contradicts the chromalveolate hypothesis, including the lack of a plastid in
this lineage and the phylogenetic inference showing the chromalveolates as a
polyphyletic group. However, the Telonema lineage also expresses morphological
features found in both chromists and alveolate lineages, in support of the chromalveolate
hypothesis. Among the major arguments opposing the chromalveolate hypothesis is the
assumption of multiple plastid loss in all heterotrophic chromalveolate lineages.
However, as demonstrated in this study and other reports (Hackett et al. 2004b; Yoon et
al. 2005), a dynamic and complex evolutionary history have formed the diverse
distribution of plastids and heterotrophy among dinoflagellates, probably due to the
extensive distribution of mixotrophy (i.e. the ability to utilize both phagotrophy and
phototrophy) expressed in this group. This feature is also reported to be present in all
photosynthetic chromalveolate lineages (Andersen 2004; Hackett et al. 2004a; Hoef-
Emden et al. 2002), indicating that this mixotrophic ability is one of the underlying
causes of the dynamic evolution of plastids seen in chromalveolates. The chromalveolate
hypothesis, as postulated by Tom Cavalier-Smith (Cavalier-Smith 1999), rests on the
assumption of a single uptake of a red-algal plastid in the common ancestor of
chromalveolates. However, the variety of nutritional strategies and the plastid diversity
seen in extant chromalveolate lineages could imply a more complex scenario of plastid
evolution than described in Cavalier-Smith’s hypothesis. In a recent paper, the possibility
of a serial transfer of the red-algal derived plastid among the chromalveolates is
suggested, implying a tertiary or even quaternary origin of some of the red-algal derived
plastids (Bachvaroff et al. 2005). An intriguing scenario is presented in this paper
(depicted in figure 4.1), as the first acquisition of the red-algal plastid is suggested to
have occurred in a cryptophyte, which subsequently was engulfed by a heterokont,
haptophyte and/or a dinoflagellate.

88
FIGURE 4.1
Figure 4.1: Depicting a possible
scenario of the evolution of the
chromalveolate plastid as presented in
Bachvaroff et al. 2005, where a
cryptophyte engulfs a red-algae, and
later are engulfed by a heterokont,
haptophyte and/dinoflagellate. The
haptophyte-derived plastid in the
Karlodinium/Karenia clade will in this
scenario be of quaternary origin.
89
This scenario may seem speculative, but it is not contradicted by available data. The
incongruent host-gene trees and plastid-gene trees may be consistent with this suggestion,
and the shared chromalveolate GAPDH replacement can be explained by a transfer of
this feature from the cryptophyte endosymbiont to the chromalveolate host lineages
(Bachvaroff et al. 2005). Additionally, this scenario explains the occurrence of the basal
heterotrophic heterokont, haptophyte and dinoflagellate lineages, as these may have
diverged prior to the plastid uptake.
In this study, chloroplast replacements have been shown to be a relatively common event
among dinoflagellates. The closest relatives to the dinoflagellates, the apicomplexans,
have lost their photosynthetic ability, but still retain a vestigial plastid (McFadden, Waller
et al. 1997). Even though this plastid often is presumed to be of red-algal origin, there are
controversy about the origin of this plastid, as it is highly diverged and difficult to place
in phylogenetic trees (Funes et al. 2004). There are however indications of both a green-
algal and red-algal origin of the vestigial plastid in the apicomplexan (Funes et al. 2002;
Funes et al. 2004; McFadden et al. 1997; Waller et al. 2003), indicating a chloroplast
replacement event in this lineage. This might indicate that the ability of substituting
plastids have been established in these lineages before the splitting of the apicomplexan
and dinoflagellate lineages, which makes it tempting to speculate whether the peridinin-
plastid also could have replaced another chloroplast.
These indications and speculations imply a more complex evolutionary history of the red-
algal derived plastid among the chromalveolates than described in the chromalveolate
hypothesis.
4.4 CONCLUDING REMARKS AND FUTURE WORK
The number of research projects applying molecular approaches for investigating
microbiological eukaryotic diversity, phylogeny and evolution has increased substantially
the last few years. However, extensive research is needed to extend the current
knowledge about unicellular protist genomes, biological diversity and to reveal the
internal relationship between the eukaryotic supergroups. The eukaryotic biological and
genomic diversity can be investigated using different approaches, four of which have
90
been addressed in this study, namely environmental sampling, cDNA library
construction, targeted PCR-amplifications and phylogenetic inference.
Further studies on the members of the Telonema lineage is necessary for robustly
establish this group as a deep-branching chromalveolate. This can be carried out by
extending the group by environmental sampling and by investigating the genomic
diversity by constructing a cDNA library. Currently, specific Telonema PCR-primers are
utilized for isolation of Telonema sequences from environmental samples of eukaryotic
communities in freshwater lakes in order to investigate the distribution and abundance of
this lineage. The pipeline for cDNA-library construction of photosynthetic eukaryotes
that has been developed in this study includes culturing, harvesting, sequencing, analyses
and annotation. Similar protocols could also be used to generate cDNA information from
Telonema, but this has to be done in a slightly modified version because of the
contaminating prey organism necessary for laboratory culturing of Telonema.
Replacement of the current prey organism with a complete genome sequenced green alga
would make it easier to distinguish genes obtained from Telonema and the prey.
The putative intron found in the hsp90 sequence of Alexandrium tamarense could be of
phylogenetic and functional importance. The features of the intron give indications of the
properties of the dinoflagellate spliceosomal apparatus, and could also provide
phylogenetic information, as it may be a specific insertion for the Alexandrium or
gonyaulacalean species. Hence, amplification and sequencing of additional hsp90 genes
from this group are needed.
Further investigations of dinoflagellate phylogeny and genomic features have to be
carried out for resolution of the internal relationship between the orders of this group, but
the phylogenetic inference based on the HSP90 protein sequences suggests that this gene
sequence could be a valuable contribution to this work. Extending the range of available
dinoflagellate sequences and use of concatenated analyses will hopefully provide enough
information to resolve phylogenetic trees, and thereby provide further information about
the complex plastid evolution that has occurred in this group. Extended knowledge about
the processes that have formed the plastid diversity in dinoflagellates may give important
insight about general processes involved in establishment and loss of plastids. This may
be the key to the understanding of the evolutionary relationships of the chromalveolates

91
and the other deeply related eukaryotic supergroups (unikonts, rhizaria, plantae,
chromalveolates and excavates, see figure 1.1).

92
REFERENCES
Andersen, R. A. 2004. Biology and systematics of heterokont and haptophyte algae.American Journal of Botany 91:1508-1522.
Archibald, J. M., and P. J. Keeling. 2002. Recycled plastids: a 'green movement' ineukaryotic evolution. Trends in Genetics 18:577-584.
Archibald, J. M., D. Longet, J. Pawlowski, and P. J. Keeling. 2003. A novel polyubiquitinstructure in Cercozoa and Foraminifera: Evidence for a new eukaryoticsupergroup. Molecular Biology and Evolution 20:62-66.
Bachvaroff, T. R., G. T. Concepcion, C. R. Rogers, E. M. Herman, and C. F. Delwiche.2004. Dinoflagellate expressed sequence tag data indicate massive transfer ofchloroplast genes to the nuclear genome. Protist 155:65-78.
Bachvaroff, T. R., M. V. Sanchez Puerta, and C. F. Delwiche. 2005. Chlorophyll ccontaining plastid relationships based on analyses of a multi-gene dataset with allfour chromalveolate lineages. Molecular Biology and Evolution Epub ahead ofprint.
Baldauf, S. L. 1999. A search for the origins of animals and fungi: Comparing andcombining molecular data. American Naturalist 154:S178-S188.
Baldauf, S. L., A. J. Roger, I. Wenk-Siefert, and W. F. Doolittle. 2000. A kingdom-levelphylogeny of eukaryotes based on combined protein data. Science 290:972-977.
Bapteste, E., H. Brinkmann, J. A. Lee, D. V. Moore, C. W. Sensen, P. Gordon, L.Durufle et al. 2002. The analysis of 100 genes supports the grouping of threehighly divergent amoebae: Dictyostelium, Entamoeba, and Mastigamoeba.Proceedings of the National Academy of Sciences of the United States of America99:1414-1419.
Ben Ali, A., R. De Baere, G. Van der Auwera, R. De Wachter, and Y. Van de Peer. 2001.Phylogenetic relationships among algae based on complete large-subunit rRNAsequences. International Journal of Systematic and Evolutionary Microbiology51:737-749.
Berney, C., J. Fahrni, and J. Pawlowski. 2004. How many novel eukaryotic 'kingdoms'?Pitfalls and limitations of environmental DNA surveys. BMC Biology 4;2(1).
Bhattacharya, D., H. S. Yoon, and J. D. Hackett. 2004. Photosynthetic eukaryotes unite:endosymbiosis connects the dots. Bioessays 26:50-60.
Cavalier-Smith, T. 1998. A revised six-kingdom system of life. Biological Reviews73:203-266.
Cavalier-Smith, T. 1999. Principles of protein and lipid targeting in secondarysymbiogenesis: Euglenoid, dinoflagellate, and sporozoan plastid origins and theeukaryote family tree. Journal of Eukaryotic Microbiology 46:347-366.
Cavalier-Smith, T. 2000. Membrane heredity and early chloroplast evolution. Trends inPlant Science 5:174-182.
Cavalier-Smith, T. 2002. Chloroplast evolution: Secondary symbiogenesis and multiplelosses. Current Biology 12:R62-R64.
Cavalier-Smith, T. 2003a. Genomic reduction and evolution of novel genetic membranesand protein-targeting machinery in eukaryote-eukaryote chimaeras (meta-algae).Philosophical Transactions of the Royal Society of London Series B-BiologicalSciences 358:109-133.

93
Cavalier-Smith, T. 2003b. Protist phylogeny and the high-level classification of Protozoa.European Journal of Protistology 39:338-348.
Cavalier-Smith, T. 2004a. Chromalveolate diversity and cell megaevolution: interplay ofmembranes, genomes and cytoskeleton, Pages 71-103 in H. R. a. H. D, ed.Organelles, Genomes and Eukaryotic Evolution. London, Taylor and Francis.
Cavalier-Smith, T. 2004b. Only six kingdoms of life. Proceedings of the Royal Society ofLondon Series B-Biological Sciences 271:1251-1262.
Cavalier-Smith, T., and E. E. Y. Chao. 2003. Phylogeny and classification of phylumCercozoa (Protozoa). Protist 154:341-358.
Chesnick, J. M., W. Kooistra, U. Wellbrock, and L. K. Medlin. 1997. Ribosomal RNAanalysis indicates a benthic pennate diatom ancestry for the endosymbionts of thedinoflagellates Peridinium foliaceum and Peridinium balticum (Pyrrhophyta).Journal of Eukaryotic Microbiology 44:314-320.
Chesnick, J. M., C. W. Morden, and A. M. Schmieg. 1996. Identity of the endosymbiontof Peridinium foliaceum (Pyrrophyta): Analysis of the rbcLS operon. Journal ofPhycology 32:850-857.
Dacks, J. B., and W. F. Doolittle. 2001. Reconstructing/deconstructing the earliesteukaryotes: How comparative genomics can help. Cell 107:419-425.
Dawson, S. C., and N. R. Pace. 2002. Novel kingdom-level eukaryotic diversity in anoxicenvironments. Proceedings of the National Academy of Sciences of the UnitedStates of America 99:8324-8329.
de Salas, M. F., C. J. S. Bolch, L. Botes, G. Nash, S. W. Wright, and G. M. Hallegraeff.2003. Takayama gen. nov (Gymnodiniales, Dinophyceae), a new genus ofunarmored dinoflagellates with sigmoid apical grooves, including the descriptionof two new species. Journal of Phycology 39:1233-1246.
Delwiche, C. F. 1999. Tracing the thread of plastid diversity through the tapestry of life.American Naturalist 154:S164-S177.
Edgcomb, V. P., A. J. Roger, A. G. B. Simpson, D. T. Kysela, and M. L. Sogin. 2001.Evolutionary relationships among "jakobid" flagellates as indicated by alpha- andbeta-tubulin phylogenies. Molecular Biology and Evolution 18:514-522.
Edvardsen, B., K. Shalchian-Tabrizi, K. S. Jakobsen, L. K. Medlin, E. Dahl, S. Brubak,and E. Paasche. 2003. Genetic variability and molecular phylogeny of Dinophysisspecies (Dinophyceae) from Norwegian waters inferred from single cell analysesof rDNA. Journal of Phycology 39:395-408.
Elbrächter, M., and E. Schnepf. 1996. Gymnodinium chlorophorum, a new, green, bloom-forming dinoflagellate (Gymnodiniales, Dinophyceae) with a vestigialprasinophyte endosymbiont. Phycologia 35:381-393.
Eppley, R. W., R. W. Holmes, and J. D. H. Strickland. 1967. Sinking rates of marinephytoplankton measured with a fluorometer. Journal of Experimental MarineBiologi and Ecology 1:191-208.
Falkowski, P. G., M. E. Katz, A. H. Knoll, A. Quigg, J. A. Raven, O. Schofield, and F. J.R. Taylor. 2004. The evolution of modern eukaryotic phytoplankton. Science305:354-360.
Fast, N. M., J. C. Kissinger, D. S. Roos, and P. J. Keeling. 2001. Nuclear-encoded,plastid-targeted genes suggest a single common origin for apicomplexan anddinoflagellate plastids. Molecular Biology and Evolution 18:418-426.

94
Fast, N. M., L. R. Xue, S. Bingham, and P. J. Keeling. 2002. Re-examining alveolateevolution using multiple protein molecular phylogenies. Journal of EukaryoticMicrobiology 49:30-37.
Felsenstein, J. 2003, Inferring Phylogenies, Sinauer.Føyn, B. 1934. Lebenszyklus, cytologie und sexualität der Chlorophycee Cladophora
suhriana Kützing. Archiv fuer Protistenkunde 83:1-56.Funes, S., E. Davidson, A. Reyes-Prieto, S. Magallon, P. Herion, M. P. King, and D.
Gonzalez-Halphen. 2002. A green algal apicoplast ancestor. Science 298:2155-2155.
Funes, S., A. Reyes-Prieto, X. Perez-Martinez, and D. Gonzalez-Halphen. 2004. On theevolutionary origins of apicoplasts: revisiting the rhodophyte vs. chlorophytecontroversy. Microbes and Infection 6:305-311.
Galtier, N. 2001. Maximum-likelihood phylogenetic analysis under a covarion-likemodel. Molecular Biology and Evolution 18:866-873.
Grzebyk, D., M. E. Katz, A. H. Knoll, A. Quigg, J. A. Raven, O. Schofield, F. J. R.Taylor et al. 2004. Response to comment on "The evolution of modern eukaryoticphytoplankton". Science 306:2191.
Grzebyk, D., O. Schofield, C. Vetriani, and P. G. Falkowski. 2003. The mesozoicradiation of eukaryotic algae: The portable plastid hypothesis. Journal ofPhycology 39:259-267.
Hackett, J. D., D. M. Anderson, D. L. Erdner, and D. Bhattacharya. 2004a.Dinoflagellates: A remarkable evolutionary experiment. American Journal ofBotany 91:1523-1534.
Hackett, J. D., T. E. Sheetz, H. S. Yoon, M. B. Soares, M. F. Bonaldo, T. L. Casavant,and D. Bhattacharya. 2005. Insights into a dinoflagellate genome through aexpressed sequence tag analysis. BMC Genomics 29:80.
Hackett, J. D., H. S. Yoon, M. B. Soares, M. F. Bonaldo, T. L. Casavant, T. E. Scheetz,T. Nosenko et al. 2004b. Migration of the plastid genome to the nucleus in aperidinin dinoflagellate. Current Biology 14:213-218.
Hannaert, V., E. Saavedra, F. Duffieux, J. P. Szikora, D. J. Rigden, P. A. M. Michels, andF. R. Opperdoes. 2003. Plant-like traits associated with metabolism ofTrypanosoma parasites. Proceedings of the National Academy of Sciences of theUnited States of America 100:1067-1071.
Harper, J. T., and P. J. Keeling. 2003. Nucleus-encoded, plastid-targeted glyceraldehyde-3-phosphate dehydrogenase (GAPDH) indicates a single origin forchromalveolate plastids. Molecular Biology and Evolution 20:1730-1735.
Harper, J. T., E. Waanders, and P. J. Keeling. 2005. On the monophyly ofchromalveolates using a six-protein phylogeny of eukaryotes. InternationalJournal of Systematic and Evolutionary Microbiology 55:487-496.
Hoef-Emden, K., B. Marin, and M. Melkonian. 2002. Nuclear and nucleomorph SSUrDNA phylogeny in the cryptophyta and the evolution of cryptophyte diversity.Journal of Molecular Evolution 55:161-179.
Høiland, K. 2004. Rikenes slektskap - tre motstridende hypoteser, eller én samlende?Blyttia 6:215-222.
Howe, C. J., A. C. Barbrook, V. L. Koumandou, R. E. R. Nisbet, H. A. Symington, andT. F. Wightman. 2003. Evolution of the chloroplast genome. Philosophical

95
Transactions of the Royal Society of London Series B-Biological Sciences358:99-106.
Huelsenbeck, J. P., B. Larget, R. E. Miller, and F. Ronquist. 2002. Potential applicationsand pitfalls of Bayesian inference of phylogeny. Systematic Biology 51:673-688.
Inagaki, Y., A. G. B. Simpson, J. B. Dacks, and A. J. Roger. 2004. Phylogenetic artifactscan be caused by leucine, serine, and arginine codon usage heterogeneity:Dinoflagellate plastid origins as a case study. Systematic Biology 53:582-593.
Ishida, K., and B. R. Green. 2002. Second- and third-hand chloroplasts in dinoflagellates:Phylogeny of oxygen-evolving enhancer 1 (PsbO) protein reveals replacement ofa nuclear-encoded plastid gene by that of a haptophyte tertiary endosymbiont.Proceedings of the National Academy of Sciences of the United States of America99:9294-9299.
Janson, S. 2004. Molecular evidence that plastids in the toxin-producing dinoflagellategenus Dinophysis originate from the free-living cryptophyte Teleaulaxamphioxeia. Environmental Microbiology 6:1102-1106.
Johnson, P. J. 2002. Spliceosomal introns in a deep-branching eukaryote: The splice oflife. Proceedings of the National Academy of Sciences of the United States ofAmerica 99:3359-3361.
Kass, R. E., and A. E. Raftery. 1995. Bayes Factors. Journal of the American StatisticalAssociation 90:773-795.
Katz, L. A. 2001. Evolution of nuclear dualism in ciliates: a reanalysis in light of recentmolecular data. International Journal of Systematic and EvolutionaryMicrobiology 51:1587-1592.
Keeling, P. 2004a. A brief history of plastids and their hosts. Protist 155:3-7.Keeling, P. J. 2001. Foraminifera and Cercozoa are related in actin phylogeny: Two
orphans find a home? Molecular Biology and Evolution 18:1551-1557.Keeling, P. J. 2004b. Diversity and evolutionary history of plastids and their hosts.
American Journal of Botany 91:1481-1493.Keeling, P. J., J. M. Archibald, N. M. Fast, and J. D. Palmer. 2004. Comment on "The
evolution of modern eukaryotic phytoplankton". Science 306:2191.Keeling, P. J., and J. D. Palmer. 2000. Phylogeny - Parabasalian flagellates are ancient
eukaryotes. Nature 405:635-637.Klaveness, D., K. Shalchian-Tabrizi, H. A. Thomsen, W. Eikrem, and K. S. Jakobsen.
2005. Telonema antarcticum sp.nov., a common marine phagotrophic flagellate.International Journal of Systematic and Evolutionary Microbiology In press.
Kuo, J., M. C. Chen, C. H. Lin, and L. S. Fang. 2004. Comparative gene expression in thesymbiotic and aposymbiotic Aiptasia pulchella by expressed sequence taganalysis. Biochem Biophys Res Commun 318:176-186.
Lang-Unnasch, N., M. E. Reith, J. Munholland, and J. R. Barta. 1998. Plastids arewidespread and ancient in parasites of the phylum Apicomplexa. InternationalJournal for Parasitology 28:1743-1754.
Leander, B. S., and P. J. Keeling. 2004. Early evolutionary history of dinoflagellates andapicomplexans (Alveolata) as inferred from hsp90 and actin phylogenies. Journalof Phycology 40:341-350.
Lopez, P., P. Forterre, and H. Philippe. 1999. The root of the tree of life in the light of thecovarion model. Journal of Molecular Evolution 49:496-508.
96
Lopez-Garcia, P., F. Rodriguez-Valera, and D. Moreira. 2002. Toward the monophyly ofHaeckel's Radiolaria: 18S rRNA environmental data support the sisterhood ofPolycystinea and Acantharea. Molecular Biology and Evolution 19:118-121.
Lopez-Garcia, P., F. Rodriguez-Valera, C. Pedros-Alio, and D. Moreira. 2001.Unexpected diversity of small eukaryotes in deep-sea Antarctic plankton. Nature409:603-607.
Martin, W., B. Stoebe, V. Goremykin, S. Hansmann, M. Hasegawa, and K. V. Kowallik.1998. Gene transfer to the nucleus and the evolution of chloroplasts. Nature393:162-165.
McEwan, M. L., and P. J. Keeling. 2004. HSP90, tubulin and actin are retained in thetertiary endosymbiont genome of Kryptoperidinium foliaceum. Journal ofEukaryotic Microbiology 51:651-659.
McFadden, G. I. 2001. Chloroplast origin and integration. Plant Physiology 125:50-53.McFadden, G. I., R. E. Waller, M. E. Reith, and N. Lang-Unnasch. 1997. Plastids in
apicomplexan parasites. Plant Systematics and Evolution:261-287.Moon-van der Staay, S. Y., R. De Wachter, and D. Vaulot. 2001. Oceanic 18S rDNA
sequences from picoplankton reveal unsuspected eukaryotic diversity. Nature409:607-610.
Moreira, D., H. Le Guyader, and H. Philippe. 2000. The origin of red algae and theevolution of chloroplasts. Nature 405:69-72.
Newton, M. A., A. E. Raftery, A. C. Davison, M. Bacha, G. Celeux, B. P. Carlin, P.Clifford et al. 1994. Approximate Bayesian-Inference with the WeightedLikelihood Bootstrap. Journal of the Royal Statistical Society Series B-Methodological 56:3-48.
Nikolaev, S. I., C. Berney, J. F. Fahrni, I. Bolivar, S. Polet, A. P. Mylnikov, V. V.Aleshin et al. 2004. The twilight of Heliozoa and rise of Rhizaria, an emergingsupergroup of amoeboid eukaryotes. Proceedings of the National Academy ofSciences of the United States of America 101:8066-8071.
Nixon, J. E. J., A. Wang, H. G. Morrison, A. G. McArthur, M. L. Sogin, B. J. Loftus, andJ. Samuelson. 2002. A spliceosomal intron in Giardia lamblia. Proceedings of theNational Academy of Sciences of the United States of America 99:3701-3705.
Nylander, J. A. A., F. Ronquist, J. P. Huelsenbeck, and J. L. Nieves-Aldrey. 2004.Bayesian phylogenetic analysis of combined data. Systematic Biology 53:47-67.
Okamoto, O. K., L. Y. Liu, D. L. Robertson, and J. W. Hastings. 2001. Members of adinoflagellate luciferase gene family differ in synonymous substitution rates.Biochemistry 40:15862-15868.
Palmer, J. D. 2003. The symbiotic birth and spread of plastids: How many times andwhodunit? Journal of Phycology 39:4-11.
Patron, N. J., M. B. Rogers, and P. J. Keeling. 2004. Gene replacement of fructose-1,6-bisphosphate aldolase supports the hypothesis of a single photosynthetic ancestorof chromalveolates. Eukaryot Cell 3:1169-1175.
Preisfeld, A., I. Busse, M. Klingberg, S. Talke, and H. G. Ruppel. 2001. Phylogeneticposition and inter-relationships of the osmotrophic euglenids based on SSU rDNAdata, with emphasis on the Rhabdomonadales (Euglenozoa). International Journalof Systematic and Evolutionary Microbiology 51:751-758.

97
Richards, T. A., and D. Bass. 2005. Molecular screening of free-living microbialeukaryotes: diversity and distribution using a meta-analysis. Current opinion inMicrobiology In press.
Roger, A. J. 1999. Reconstructing early events in eukaryotic evolution. AmericanNaturalist 154:S146-S163.
Roger, A. J., and J. D. Silberman. 2002. Cell evolution: Mitochondria in hiding. Nature418:827-829.
Romari, K., and D. Vaulot. 2004. Composition and temporal variability of picoeukaryotecommunities at a coastal site of the English Channel from 18S rDNA sequences.Limnology and Oceanography 49:784-798.
Rudi, K., M. Kroken, O. J. Dahlberg, A. Deggerdal, K. S. Jakobsen, and F. Larsen. 1997.Rapid, universal method to isolate PCR-ready DNA using magnetic beads.Biotechniques 22:506-511.
Saldarriaga, J. F., M. L. McEwan, N. M. Fast, F. J. R. Taylor, and P. J. Keeling. 2003.Multiple protein phylogenles show that Oxyrrhis marina and Perkinsus marinusare early branches of the dinoflagellate lineage. International Journal ofSystematic and Evolutionary Microbiology 53:355-365.
Saldarriaga, J. F., F. Taylor, T. Cavalier-Smith, S. Menden-Deuer, and P. J. Keeling.2004. Molecular data and the evolutionary history of dinoflagellates. EuropeanJournal of Protistology 40:85-111.
Saldarriaga, J. F., F. J. Taylor, P. J. Keeling, and T. Cavalier-Smith. 2001. Dinoflagellatenuclear SSU rRNA phylogeny suggests multiple plastid losses and replacements.J Mol Evol 53:204-213.
Schnepf, E., and M. Elbrachter. 1988. Cryptophycean-Like Double Membrane-BoundChloroplast in the Dinoflagellate, Dinophysis Ehrenb. - Evolutionary,Phylogenetic and Toxicological Implications. Botanica Acta 101:196-203.
Schott, E. J., J. A. F. Robledo, A. C. Wright, A. M. Silva, and G. R. Vasta. 2003. Geneorganization and homology modeling of two iron superoxide dismutases of theearly branching protist Perkinsus marinus. Gene 309:1-9.
Shalchian-Tabrizi, K. 2003. Studies on the evolution of chromists and alveolates.Dr.scient thesis, University of Oslo.
Shalchian-Tabrizi, K., W. Eikrem, D. Klaveness, D. Vaulot, M. A. Minge, F. Le Gall, K.Romari et al. 2005. Telonemia, a new protist phylum with ultrastructural affinitiesto chromalveolates. Submitted to Proceedings of the Royal Society of LondonSeries B-Biological Sciences.
Silberman, J. D., A. G. B. Simpson, J. Kulda, I. Cepicka, V. Hampl, P. J. Johnson, and A.J. Roger. 2002. Retortamonad flagellates are closely related to diplomonads -Implications for the history of mitochondrial function in eukaryote evolution.Molecular Biology and Evolution 19:777-786.
Simpson, A. G. B. 2003. Cytoskeletal organization, phylogenetic affinities andsystematics in the contentious taxon Excavata (Eukaryota). International Journalof Systematic and Evolutionary Microbiology 53:1759-1777.
Simpson, A. G. B., J. Lukes, and A. J. Roger. 2002. The evolutionary history ofkinetoplastids and their kinetoplasts. Molecular Biology and Evolution 19:2071-2083.

98
Simpson, A. G. B., and D. J. Patterson. 2001. On core jakobids and excavate taxa: Theultrastructure of Jakoba incarcerata. Journal of Eukaryotic Microbiology 48:480-492.
Simpson, A. G. B., and A. J. Roger. 2004. The real 'kingdoms' of eukaryotes. CurrentBiology 14:R693-R696.
Sogin, M. L. 1991. Early evolution and the origin of eukaryotes. Current Opinion inGenetics & Development 1:457-463.
Sogin, M. L., and J. D. Silberman. 1998. Evolution of the protists and protistan parasitesfrom the perspective of molecular systematics. International Journal forParasitology 28:11-20.
Stechmann, A., and T. Cavalier-Smith. 2002. Rooting the eukaryote tree by using aderived gene fusion. Science 297:89-91.
Stechmann, A., and T. Cavalier-Smith. 2003. Phylogenetic analysis of eukaryotes usingheat-shock protein Hsp90. Journal of Molecular Evolution 57:408-419.
Stechmann, A., and T. Cavalier-Smith. 2004. Evolutionary origins of Hsp90 chaperonesand a deep paralogy in their bacterial ancestors. Journal of EukaryoticMicrobiology 51:364-373.
Stegemann, S., S. Hartmann, S. Ruf, and R. Bock. 2003. High-frequency gene transferfrom the chloroplast genome to the nucleus. Proceedings of the NationalAcademy of Sciences of the United States of America 100:8828-8833.
Stoeck, T., G. T. Taylor, and S. S. Epstein. 2003. Novel eukaryotes from the permanentlyanoxic Cariaco Basin (Caribbean sea). Applied and Environmental Microbiology69:5656-5663.
Sueoka, N. 1960. Mitotic replication of deoxxyribonucleic adis in Chlamydomonasreinhardi. Proceedings of the National Academy of Sciences of the United Statesof America 46:83-91.
Takishita, K., K. Ishida, and T. Maruyama. 2003. An enigmatic GAPDH gene in thesymbiotic dinoflagellate genus Symbiodinium and its related species (the ordersuessiales): Possible lateral gene transfer between two eukaryotic algae,dinoflagellate and euglenophyte. Protist 154:443-454.
Takishita, K., K. I. Ishida, and T. Maruyama. 2004. Phylogeny of nuclear-encodedplastid-targeted GAPDH gene supports separate origins for the peridinin- and thefucoxanthin derivative-containing plastids of dinoflagellates. Protist 155:447-458.
Takishita, K., K. Koike, T. Maruyama, and T. Ogata. 2002. Molecular evidence forplastid robbery (Kleptoplastidy) in Dinophysis, a dinoflagellate causing diarrheticshellfish poisoning. Protist 153:293-302.
Taylor, F. J. R. 2004. Illumination or confusion? Dinoflagellate molecular phylogeneticdata viewed from a primarily morphological standpoint. Phycological Research52:308-324.
Tengs, T., O. J. Dahlberg, K. Shalchian-Tabrizi, D. Klaveness, K. Rudi, C. F. Delwiche,and K. S. Jakobsen. 2000. Phylogenetic analyses indicate that the 19 'hexanoyloxy-fucoxanthin-containing dinoflagellates have tertiary plastids ofhaptophyte origin. Molecular Biology and Evolution 17:718-729.
Van de Peer, Y., and R. De Wachter. 1997. Evolutionary relationships among theeukaryotic crown taxa taking into account site-to-site rate variation in 18S rRNA.Journal of Molecular Evolution 45:619-630.
99
Vanacova, S., W. H. Yan, J. M. Carlton, and P. J. Johnson. 2005. Spliceosomal introns inthe deep-branching eukaryote Trichomonas vaginalis. Proceedings of the NationalAcademy of Sciences of the United States of America 102:4430-4435.
Waller, R. F., P. J. Keeling, G. G. van Dooren, and G. I. McFadden. 2003. Comment on"A green algal apicoplast ancestor". Science 301:49.
Watanabe, M. M., S. Suda, I. Inouye, T. Sawaguchi, and M. Chihara. 1990. Lepidodiniumviride gen. et sp. nov (Gymnodiniales, Dinophyta), a green dinoflagellate with achlorophyll A- and B-containing endosymbiont. Journal of Phycology 26:741-751.
Watanabe, M. M., Y. Takeda, T. Sasa, I. Inouye, S. Suda, T. Sawaguchi, and M. Chihara.1987. A green dinoflagellate with chlorophylls A and B: morphology, finestrucure of the chloroplast and chlorophyll composition. Journal of Phycology23:382-389.
Yoon, H. S., J. D. Hackett, and D. Bhattacharya. 2002a. A single origin of the peridinin-and fucoxanthin-containing plastids in dinoflagellates through tertiaryendosymbiosis. Proceedings of the National Academy of Sciences of the UnitedStates of America 99:11724-11729.
Yoon, H. S., J. D. Hackett, G. Pinto, and D. Bhattacharya. 2002b. The single, ancientorigin of chromist plastids. Proceedings of the National Academy of Sciences ofthe United States of America 99:15507-15512.
Yoon, H. S., J. D. Hackett, F. M. Van Dolah, T. Nosenko, L. Lidie, and D. Bhattacharya.2005. Tertiary endosymbiosis driven genome evolution in dinoflagellate algae.Molecular Biology and Evolution 22:1299-1308.
Zhang, H., D. Bhattacharya, and S. Lin. 2005. Phylogeny of dinoflagellates based onmitochondrial cytochrome b and nuclear small subunit rDNA sequencecomparisons. Journal of Phycology 41:411-420.
Zhang, Z. D., T. Cavalier-Smith, and B. R. Green. 2002. Evolution of dinoflagellateunigenic minicircles and the partially concerted divergence of their putativereplicon origins. Molecular Biology and Evolution 19:489-500.

100
APPENDIX 1
PHYLOGENETIC INFERENCE OF DINOFLAGELLATES
TABLE 1
HSP90, SSU AND LSU ACCESSION NUMBERS:
Datasets used for reconstructing tree depicted in figure 3.6 – 3.9.
SPECIES HSP90 SSU LSU
Alexandrium tamarense XXX** AJ415510 AB088245
Amphidinium carterae T.B*. AJ415512 AF260380
Crypthecodinium cohnii AAM02974.1| M64245
Cryptosporidium parvum AAR83923 AF093494.1 AF015773
Gymnodinium chlorophorum XXX** XXX*** AF200669
Heterocapsa triquetra AAR27541 AJ415514.1 AF260401.1
Karenia brevis XXX** AJ415518 AF200677
Karenia mikimotoi XXX** AF022195 U92247
Karlodinium micrum XXX** AJ415516.1 AF200675.1
Kryptoperidinium foliaceum AAV32830 AF274268
Lepidodinium viride AF022199
Lessardia elongata AAR27542 AF521100.1
Oxyrrhis marina AAR27544 AF482425.1 AY460596
Perkinsus marinus AAR27545 L07375
Prorocentrum micans AAR27546 AJ415519.1 AY822609.1
Pyrocystis lunula BQ254029 AF274274
Tetrahymena pyriformis AAG00567 X56171.1 X54004
Toxoplasma gondii AAQ24837 L37415.1 AF076901.1
*: Unpublished sequence kindly provided by Tsvetan Bachvaroff
**: Unpublished sequences generated in this study
***: Unpublished sequence generated by Joachim Nedreklepp

101
TABLE 2
Actin accession numbers:
Dataset used for reconstructing tree depicted in figure 3.10
SPECIES and protein version Accession number
Actinophrys sol AAP93829.1
CCMP421d AAO49352.1
Crypthecodinium cohnii AAM02969.1
Cryptosporidium parvum AAA28295.1
Gymnodinium chlorophorum XXX*
Heterocapsa triquetra AAO49340.1
Karenia brevis actin 2 AAO49345.1
Karenia brevis actin 3 AAO49346.1
Karenia brevis actin 4 AAO49347.1
Karlodinium micrum XXX*
Lingulodinium polyedrum AAQ99154.1
Oxyrrhis marina AAO49331.1
Peridinium willei AAO49349.1
Perkinsus marinus 1 AAR11389.1
Perkinsus marinus 2 AAR11390.1
Perkinsus marinus 3 AAR11391.1
Toxoplasma gondii AAC13766.1
Uncultured dinflagellate BAC44870
Unidentified dinoflagellate BAC44867
*: Unpublished sequences generated in this study
TABLE 3
GAPDH accession numbers:
Dataset used to reconstruct tree depicted in figure 3.11
SPECIES AND ISOFORM OF
GAPDH
Accession no.
Akashiwo sanguinea GapC2 BAC87931
Amphidinium operculatum GapC1 BAC87932.1

102
Amphidinium operculatum GapC2 BAC87935.1
Cryptosporidium parvum CAD98421
Gonyaulax polyedra AAD01872
Gonyaulax polyedra isoform2 AAD01871.1
Gymnodinium simplex GapC1 BAC87927.1
Gymnodinium simplex GapC2 BAC87928
Heterocapsa triquetra GapC1 BAC87934.1
Heterocapsa triquetra GapC2 BAC87935.1
Heterosigma akashiwo AAK20727.1
Karenia brevis GapC1 BAD72934.1
Karenia brevis GapC2 BAD72935.1
Karenia brevis GapC3 BAD72936.1
Karenia brevis GapC4 BAD72937.1
Polarella glacialis GapC2 BAC87925
Scrippsiella trochoidea GapC1 BAC87936.1
Scrippsiella trochoidea GapC2 BAC87937
Symbiodinium sp. CS-156 GapC1 BAC87921.1
Symbiodinium sp. CS-156 GapC2 BAC87922
Symbiodinium sp. JCUCS-1 GapC1 BAC87918.1
Symbiodinium sp. JCUCS-1 GapC2 BAC87919
Tetrahymena pyriformis AAK20727.1
Toxoplasma gondii AAK20420.1
Karlodinium micrum XXX*
*: Unpublished sequence generated in this study
PHYLOGENETIC INFERENCE OF EUKARYOTES, INCLUDING TELONEMA
TABLE 4
HSP90. alpha-tubulin and beta-tubulin accession numbers:
Dataset used to reconstruct trees depicted in figure 3.12 and 3.13
SPECIES SSU HSP90 Alpha-tubulin Beta-tubulin
Achlya ambisexualis (1) M32705 AAM90674
Achlya klebsiana (1) A35885
Arabidopsis thaliana AC006837 AC174363.1 BAB09283 AAM10035
Babesia microti BAC66504.1

103
Bodo saltans AAM93754
Bombyx mori CAA58465.1
Candida tropicalis AAF63792
Cercomonas ATCC50316(2) AAD55354
Cercomonas ATCC50319(2) AAC67375
Chlorarachnion CCMP621 AAC68504.
Colpoda sp. CAA64074.1 CAA64075.1
Crypthecodinium cohnii M64245 AAM02974 AAM02970
Cryptosporidium parvum L16997 AAR83923 BAC07246
Danio rerio AAH65359 NP919369 AAN33030
Drosophila melanogaster AY037174 AAM52592 P06604 B27810
Eimeria acervulina CAA61255.1
Eimeria tenella AAB41262
Euglena gracilis M12677 AAQ24862 CAA80497 AAK37834
Euplotes focardii AAL73386.1
Giardia intestinalis AAN78305.1 CAA29923.1
Goniomonas sp. (3) AAP72158
Goniomonas truncata (3) U03072 AAD02566 AAD02567
Guillardia theta AAD02569.1 AAD02571.1
Heterocapsa triquetra AJ415514 AAR27541 AAO49341 AA049343
Hexamita inflata AAR26695
Homo sapiens M10098 XP08514 NP006073 AAH24038
Imantonia rotunda (4) XXX XXX
Isochrysis sp. XXX
Jakoba_incarcerata AAK27844 AAK37434
Jakoba_libera AAK27845 AAK37435
Leishmania_donovani (5) X07773 X07773 A44888
Leishmania_major (5) CAA63780
Malawimonas jakobiformis AAK27846.1
Monosiga_brevicollis AF100940 AAP51213 AAK27410 AAK27411
Naegleria_gruberi M18732 AAM93756 P11237C AA78362
Neurospora crassa CAA55940.1 P05220
Ochromonas danica (6) M32704.1
Ochromonas_sp.(6) AAP72159
Oomycete-like MacKay 2000 CAA91941.1
Oryza sativa AF069218.1 BAD33406 CAA62916 BAC82429
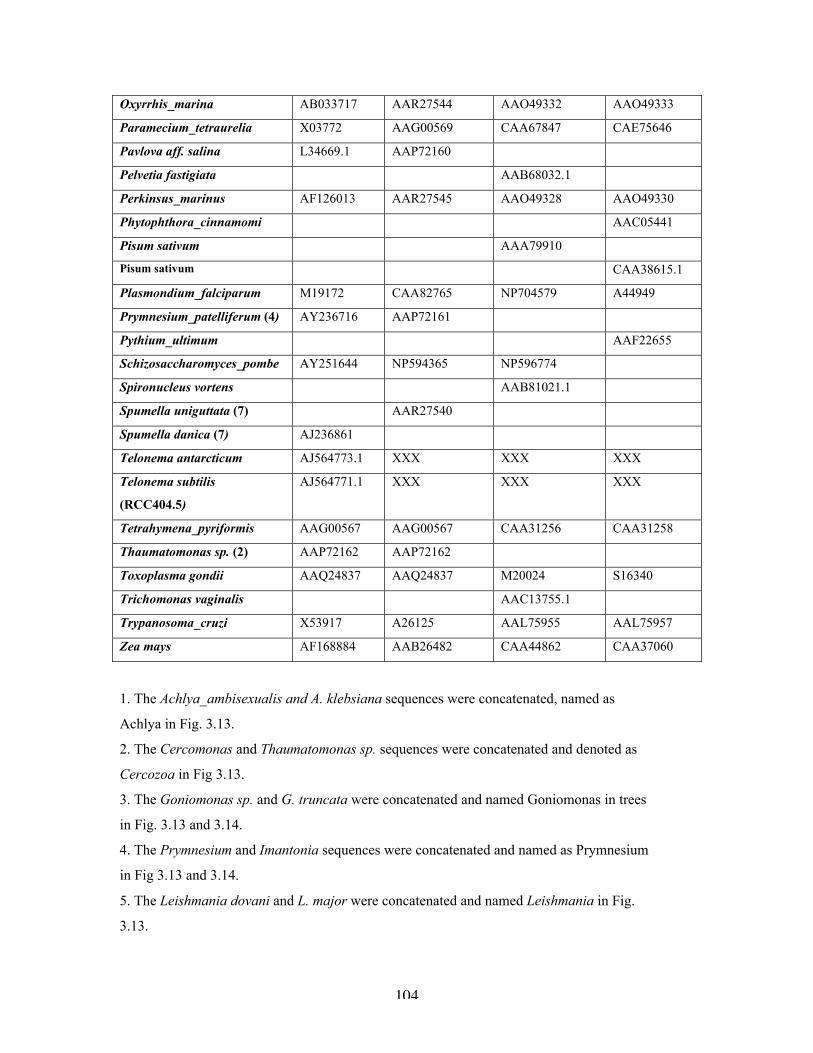
104
Oxyrrhis_marina AB033717 AAR27544 AAO49332 AAO49333
Paramecium_tetraurelia X03772 AAG00569 CAA67847 CAE75646
Pavlova aff. salina L34669.1 AAP72160
Pelvetia fastigiata AAB68032.1
Perkinsus_marinus AF126013 AAR27545 AAO49328 AAO49330
Phytophthora_cinnamomi AAC05441
Pisum sativum AAA79910
Pisum sativum CAA38615.1
Plasmondium_falciparum M19172 CAA82765 NP704579 A44949
Prymnesium_patelliferum (4) AY236716 AAP72161
Pythium_ultimum AAF22655
Schizosaccharomyces_pombe AY251644 NP594365 NP596774
Spironucleus vortens AAB81021.1
Spumella uniguttata (7) AAR27540
Spumella danica (7) AJ236861
Telonema antarcticum AJ564773.1 XXX XXX XXX
Telonema subtilis
(RCC404.5)
AJ564771.1 XXX XXX XXX
Tetrahymena_pyriformis AAG00567 AAG00567 CAA31256 CAA31258
Thaumatomonas sp. (2) AAP72162 AAP72162
Toxoplasma gondii AAQ24837 AAQ24837 M20024 S16340
Trichomonas vaginalis AAC13755.1
Trypanosoma_cruzi X53917 A26125 AAL75955 AAL75957
Zea mays AF168884 AAB26482 CAA44862 CAA37060
1. The Achlya_ambisexualis and A. klebsiana sequences were concatenated, named as
Achlya in Fig. 3.13.
2. The Cercomonas and Thaumatomonas sp. sequences were concatenated and denoted as
Cercozoa in Fig 3.13.
3. The Goniomonas sp. and G. truncata were concatenated and named Goniomonas in trees
in Fig. 3.13 and 3.14.
4. The Prymnesium and Imantonia sequences were concatenated and named as Prymnesium
in Fig 3.13 and 3.14.
5. The Leishmania dovani and L. major were concatenated and named Leishmania in Fig.
3.13.

105
6. The Ochromonas danica and Ochromonas sp. sequences were concatenated and named
Ocromonas in figure 3.14
7. Spumella uniguttata and S.danica sequences were concatenated and named Spumella in figure
3.14.

106
APPENDIX 2
CULTURE MEDIA
Erdschreiber medium (Føyn 1934)
1 liter filtrated seawater
5 ml soilwater supernatant
2 ml NaNO3
2 ml Na2HPO4 x 12H2O
2 ml vitamins 100 mg thiamin, 1 mg biotin, 1 mg B12 pr liter
0.5 ml NaFeEDTA 150 mg/100ml
Pasteurized at 80°C for 15 minutes.
IMR/2 medium (Eppley et al. 1967)
1 liter filtrated seawater
0.5 ml KNO3 5g / 100 ml
0.5 ml KH2PO4 0.68g/ 100 ml
0.5 ml vitamins 100 mg thiamin pr 1000 ml
1 mg biotin pr 1000 ml
1 mg B12 pr 1000 ml
0.5 ml trace metals: 6 g Na2EDTA / 1000 ml
1000 mg FeCl3 x 6H2O
620 mg MnSO4 x H2O
250 mg ZnSO4 x 7 H2O
130 mg Na2MoO4 x 2 H2O
4 mg CoCl2 x 6 H2O
4 mg CuSO4 x 5 H2O
Autoclaved at 111°C for 15 minutes.

107
HS medium (high salt) (Sueoka 1960)
1 liter
20 ml salt stock (see below)
20 ml phosphate stock (see below)
1 ml trace elements (Hutner)
Salt stock (50X): Phosphate stock (50X):
For 500 ml For 500 ml
12.50 g NH4Cl 47 g K2HPO4 . 3 H2O
0.50 g MgSO4 . 7 H2O 18 g KH2PO4
0.25 g CaCl2 . 2 H2O