Candlestick Trading Strategy - Stock Screener
30
as Find Trending Stocks @ www.Stock-Screener.org 2 https://www.stock-screener.org
Transcript of Candlestick Trading Strategy - Stock Screener
as
df
as
df
Find Trending Stocks @ www.Stock-Screener.org 2
https://www.stock-screener.org
as
df
as
df
Find Trending Stocks @ www.Stock-Screener.org 3
Disclaimer
The information provided is not to be considered as a recommendation to
buy certain stocks and is provided solely as an information resource to help
traders make their own decisions. Past performance is no guarantee of
future success. It is important to note that no system or methodology has
ever been developed that can guarantee profits or ensure freedom from
losses. No representation or implication is being made that using this eBook
will provide information that guarantees profits or ensures freedom from losses.
Copyright © 2009-2020. All rights reserved. No part of this book may be
reproduced or transmitted in any form or by any means, electronic or
mechanical, without written prior permission from the author.
as
df
as
df
Find Trending Stocks @ www.Stock-Screener.org 4
Candlestick Patterns
Using candlestick patterns is an effective trading strategy for technical analysts.
A candlestick chart reveals many insights using well-known Japanese candlestick
formations and can be a leading indicator of market activity. Although many people are
aware of Candlestick analysis, few actually understand how or why it actually works.
Understanding candlesticks can improve trader’s investment profitability and is useful for
those who swing trade.
How to Read Candlestick Charts
What is the difference between candlestick charts and bar charts?
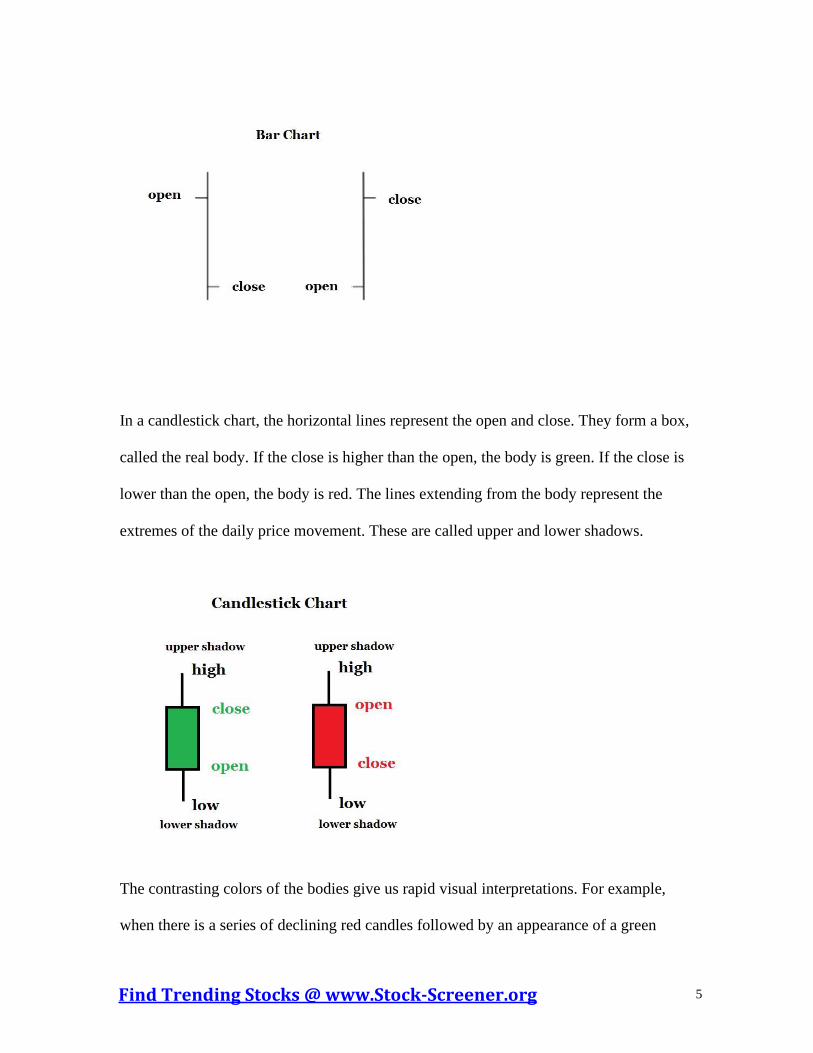
Once you start using candlestick charts, you will realize that bar charts do not provide
the same clarity. A vertical line, as shown in the below picture, represents the daily price
movement on a bar chart. The bottom of the line is the low of the day while the top of the
line is the high of the day. A notch to the right side shows the closing price while a notch
to the left side shows the opening price.
as
df
as
df
Find Trending Stocks @ www.Stock-Screener.org 5
In a candlestick chart, the horizontal lines represent the open and close. They form a box,
called the real body. If the close is higher than the open, the body is green. If the close is
lower than the open, the body is red. The lines extending from the body represent the
extremes of the daily price movement. These are called upper and lower shadows.
The contrasting colors of the bodies give us rapid visual interpretations. For example,
when there is a series of declining red candles followed by an appearance of a green
as
df
as
df
Find Trending Stocks @ www.Stock-Screener.org 6
candle, we would notice that immediately. That may not be something we notice right
away when looking at conventional bar charts. These colors are for illustration only.
Some charts will use white instead of green and black instead of red.
Also, keep in mind that a green body does not mean that price was up from previous day
and a red body does not mean that the price was down from the previous day. The body
color only indicates where the close was compared to the open.
Candlesticks give us clues to price action and the market’s mood. For example, bullish
candles form when a stock opens, moves lower, tests support, and then bounces back to
close at a high.
Candlesticks may be created for any time period – monthly, weekly, hourly, and even a
minute. However, they should not be judged in isolation. Traders should see if there is a
follow-up action to confirm the buy or sell signal.
Top 10 Candlestick Patterns
There are more than 100 candlesticks and candlestick patterns. This may seem daunting,
but rest assured, we will focus on the candlestick patterns that are most popular and
useful.
Each candle formation has a unique name. Some have English names and some have
Japanese names. Let’s learn about the most common candlestick patterns.
as
df
as
df
Find Trending Stocks @ www.Stock-Screener.org 7
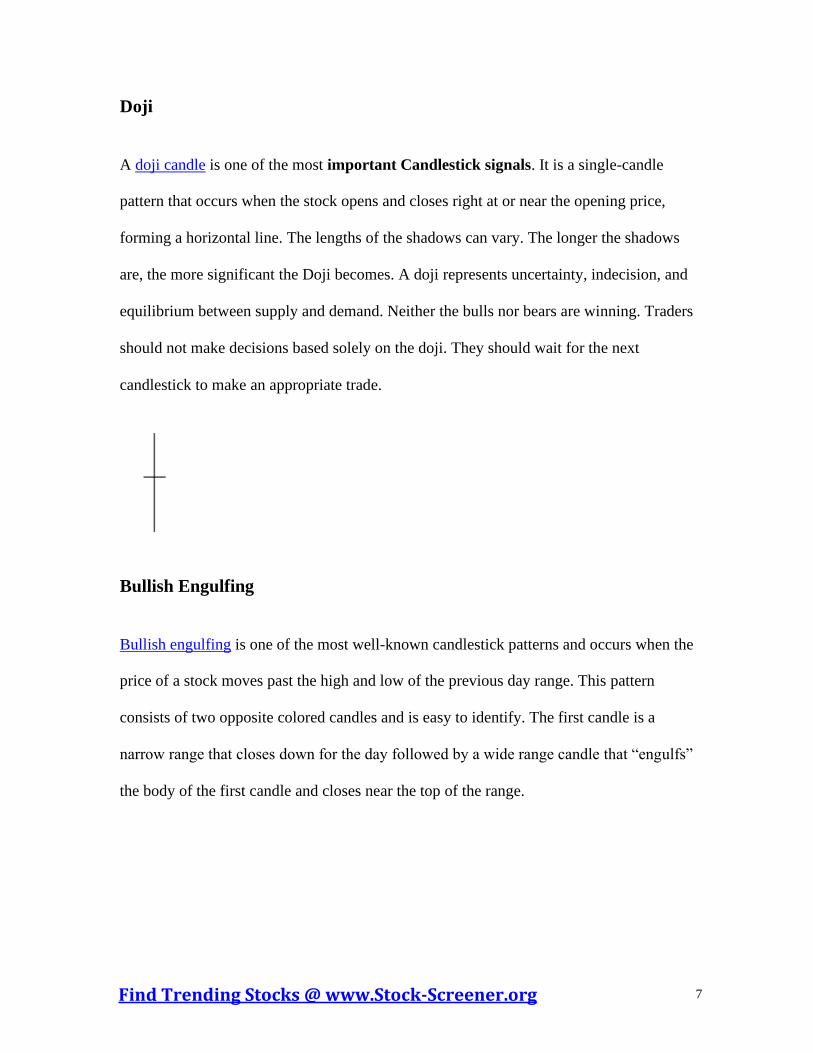
Doji
A doji candle is one of the most important Candlestick signals. It is a single-candle
pattern that occurs when the stock opens and closes right at or near the opening price,
forming a horizontal line. The lengths of the shadows can vary. The longer the shadows
are, the more significant the Doji becomes. A doji represents uncertainty, indecision, and
equilibrium between supply and demand. Neither the bulls nor bears are winning. Traders
should not make decisions based solely on the doji. They should wait for the next
candlestick to make an appropriate trade.
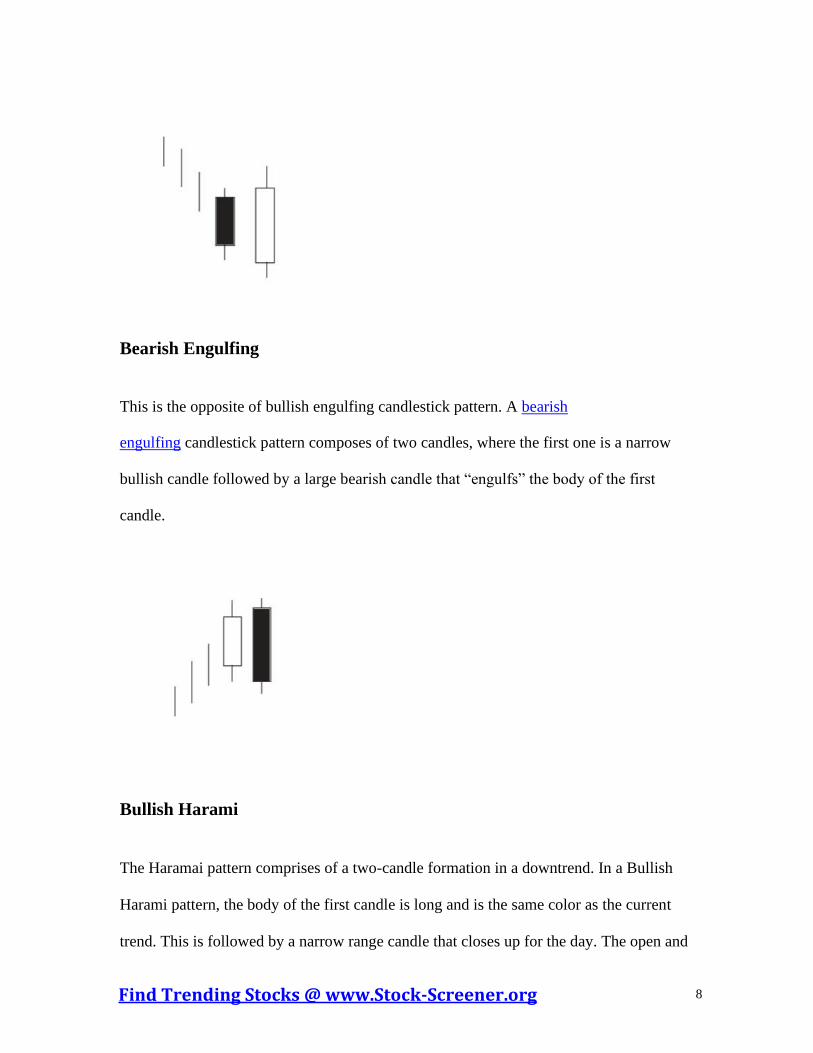
Bullish Engulfing
Bullish engulfing is one of the most well-known candlestick patterns and occurs when the
price of a stock moves past the high and low of the previous day range. This pattern
consists of two opposite colored candles and is easy to identify. The first candle is a
narrow range that closes down for the day followed by a wide range candle that “engulfs”
the body of the first candle and closes near the top of the range.
as
df
as
df
Find Trending Stocks @ www.Stock-Screener.org 8
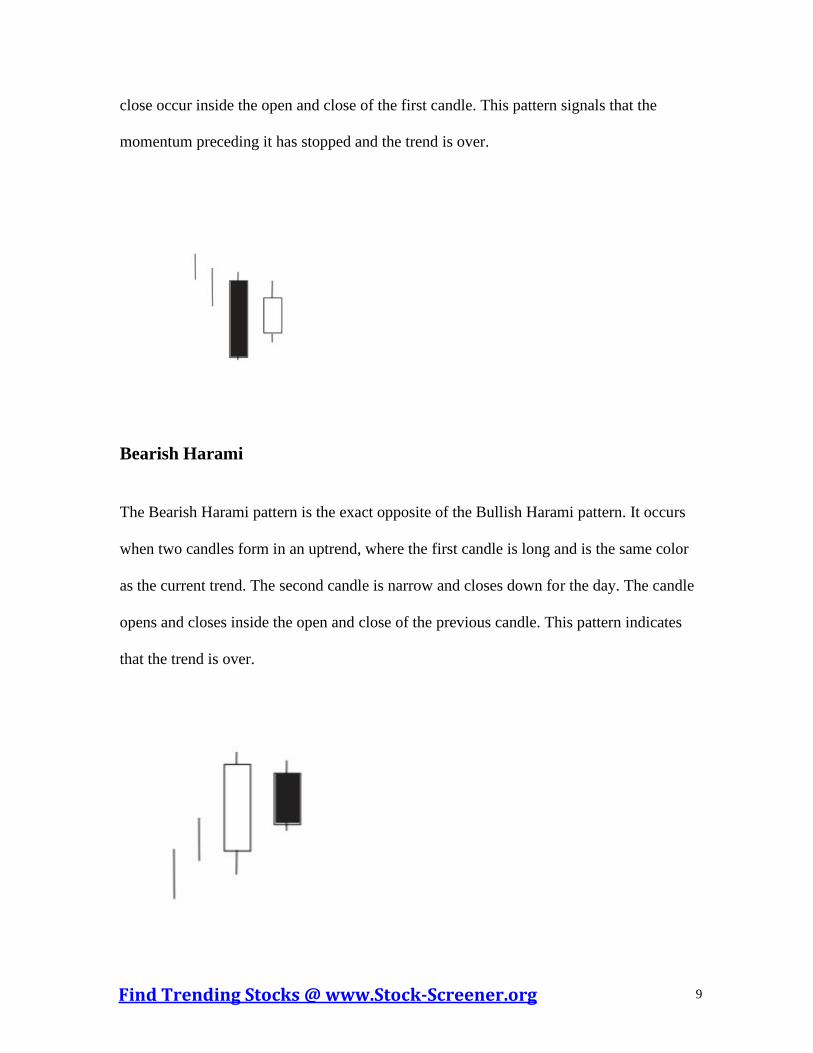
Bearish Engulfing
This is the opposite of bullish engulfing candlestick pattern. A bearish
engulfing candlestick pattern composes of two candles, where the first one is a narrow
bullish candle followed by a large bearish candle that “engulfs” the body of the first
candle.
Bullish Harami
The Haramai pattern comprises of a two-candle formation in a downtrend. In a Bullish
Harami pattern, the body of the first candle is long and is the same color as the current
trend. This is followed by a narrow range candle that closes up for the day. The open and
as
df
as
df
Find Trending Stocks @ www.Stock-Screener.org 9
close occur inside the open and close of the first candle. This pattern signals that the
momentum preceding it has stopped and the trend is over.
Bearish Harami
The Bearish Harami pattern is the exact opposite of the Bullish Harami pattern. It occurs
when two candles form in an uptrend, where the first candle is long and is the same color
as the current trend. The second candle is narrow and closes down for the day. The candle
opens and closes inside the open and close of the previous candle. This pattern indicates
that the trend is over.
as
df
as
df
Find Trending Stocks @ www.Stock-Screener.org 10
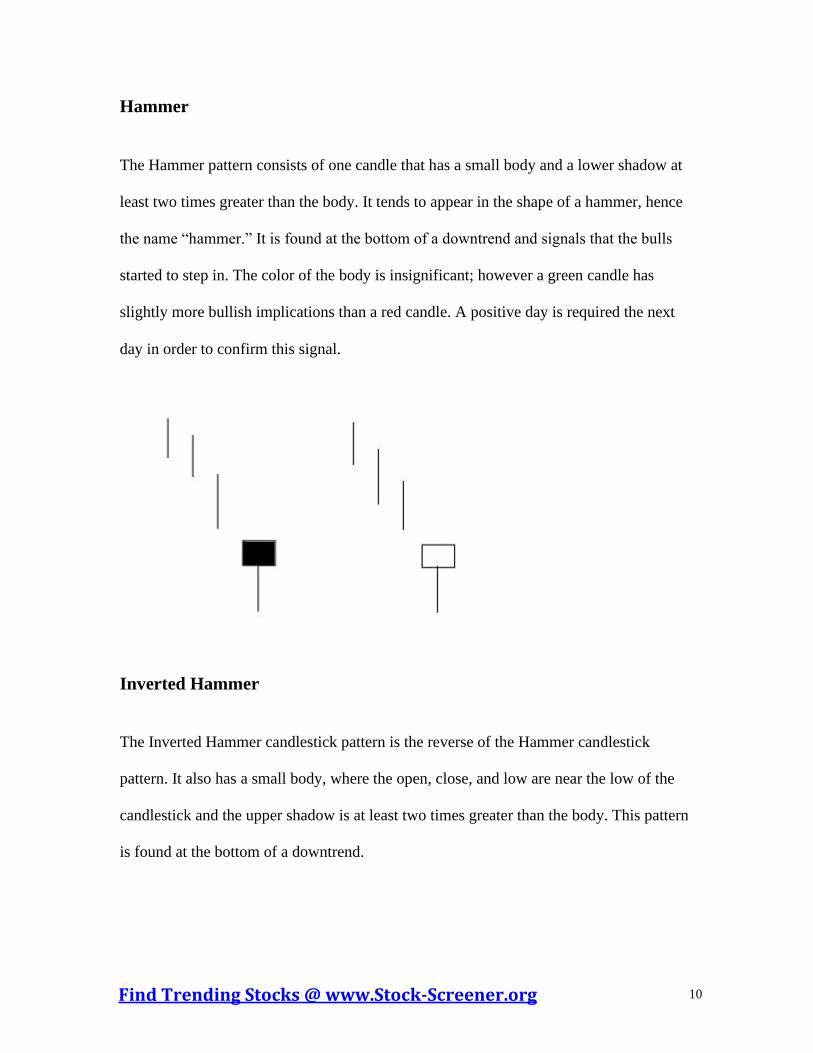
Hammer
The Hammer pattern consists of one candle that has a small body and a lower shadow at
least two times greater than the body. It tends to appear in the shape of a hammer, hence
the name “hammer.” It is found at the bottom of a downtrend and signals that the bulls
started to step in. The color of the body is insignificant; however a green candle has
slightly more bullish implications than a red candle. A positive day is required the next
day in order to confirm this signal.
Inverted Hammer
The Inverted Hammer candlestick pattern is the reverse of the Hammer candlestick
pattern. It also has a small body, where the open, close, and low are near the low of the
candlestick and the upper shadow is at least two times greater than the body. This pattern
is found at the bottom of a downtrend.
as
df
as
df
Find Trending Stocks @ www.Stock-Screener.org 11
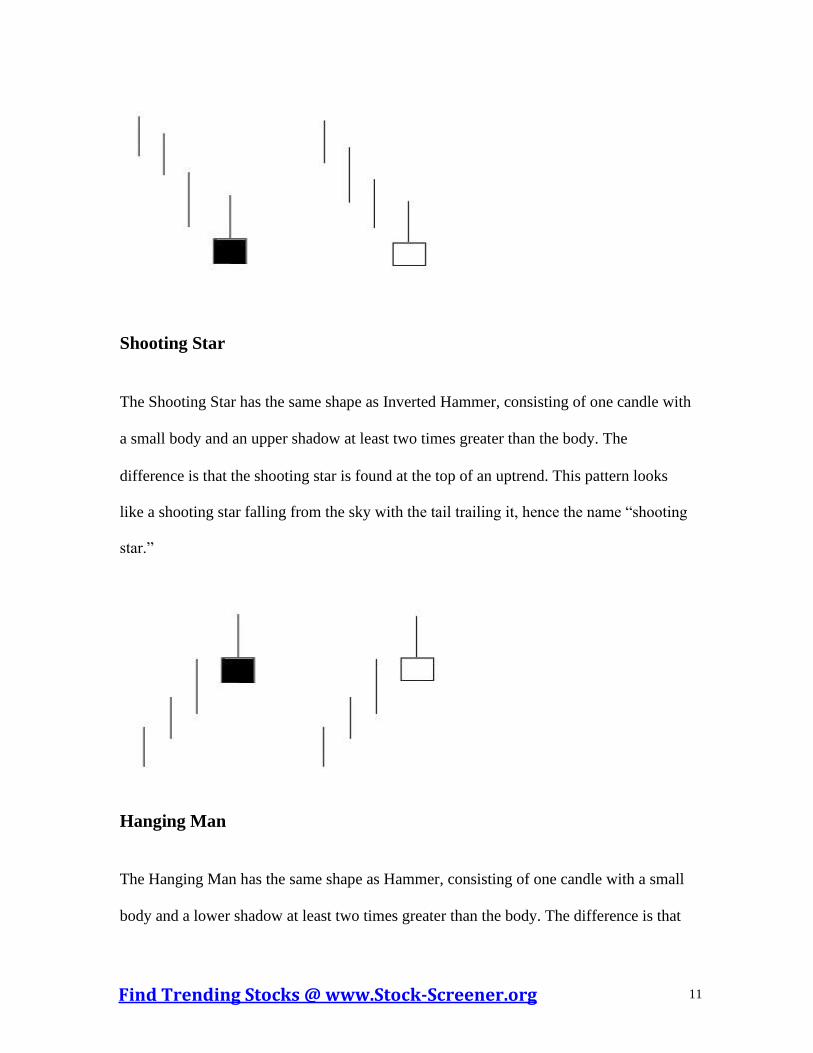
Shooting Star
The Shooting Star has the same shape as Inverted Hammer, consisting of one candle with
a small body and an upper shadow at least two times greater than the body. The
difference is that the shooting star is found at the top of an uptrend. This pattern looks
like a shooting star falling from the sky with the tail trailing it, hence the name “shooting
star.”
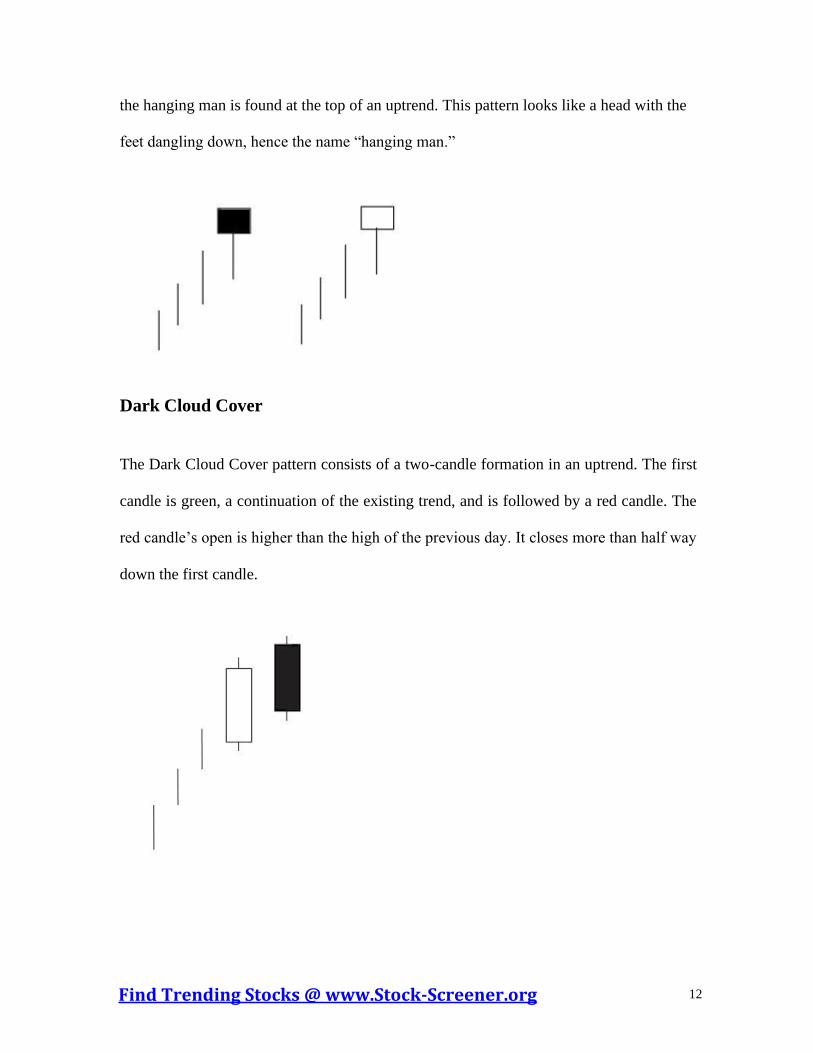
Hanging Man
The Hanging Man has the same shape as Hammer, consisting of one candle with a small
body and a lower shadow at least two times greater than the body. The difference is that
as
df
as
df
Find Trending Stocks @ www.Stock-Screener.org 12
the hanging man is found at the top of an uptrend. This pattern looks like a head with the
feet dangling down, hence the name “hanging man.”
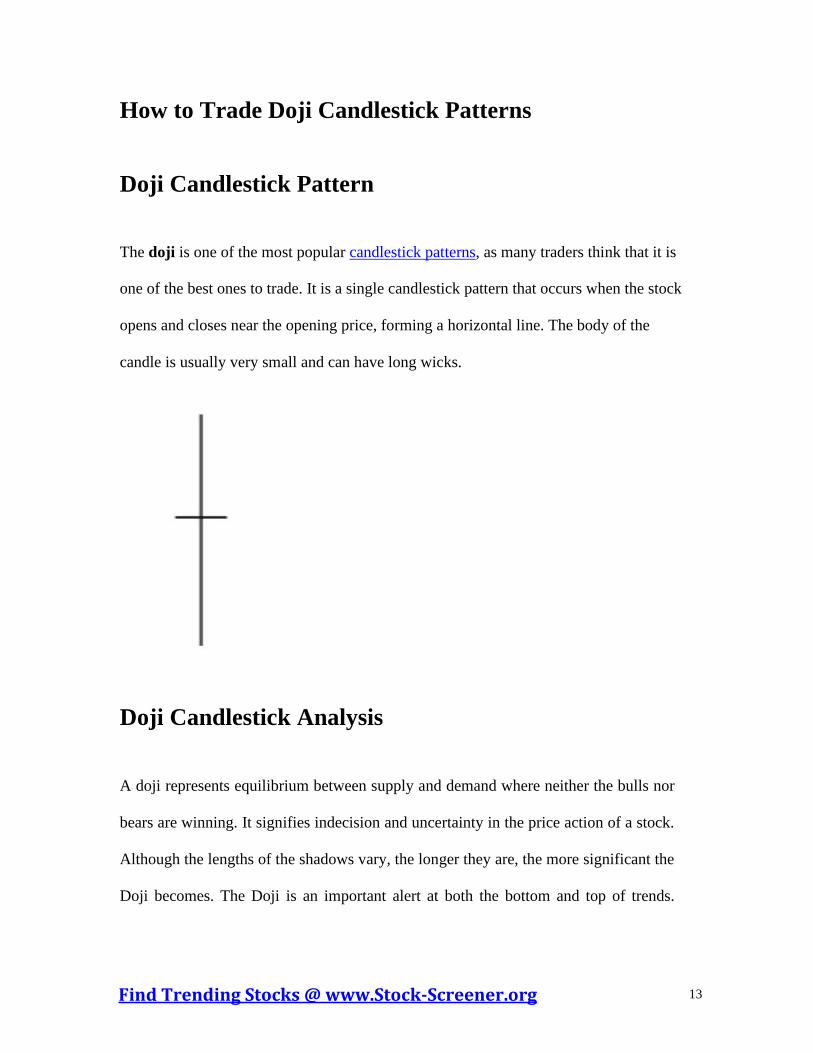
Dark Cloud Cover
The Dark Cloud Cover pattern consists of a two-candle formation in an uptrend. The first
candle is green, a continuation of the existing trend, and is followed by a red candle. The
red candle’s open is higher than the high of the previous day. It closes more than half way
down the first candle.
as
df
as
df
Find Trending Stocks @ www.Stock-Screener.org 13
How to Trade Doji Candlestick Patterns
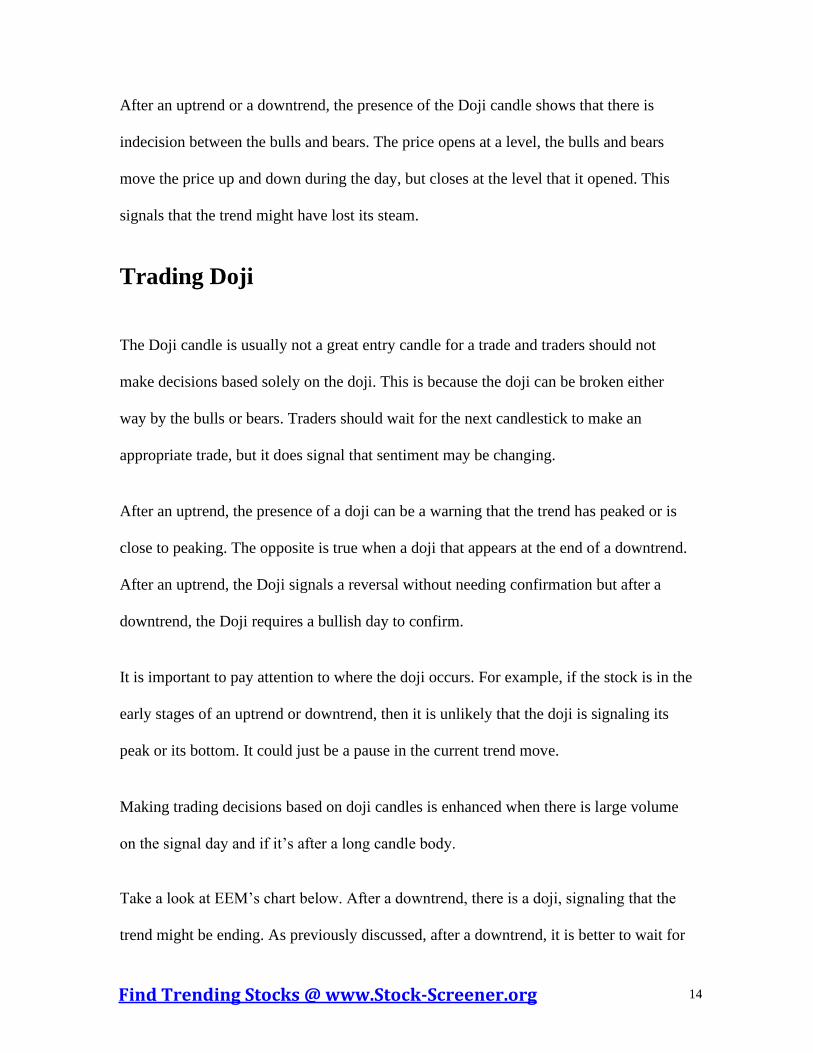
Doji Candlestick Pattern
The doji is one of the most popular candlestick patterns, as many traders think that it is
one of the best ones to trade. It is a single candlestick pattern that occurs when the stock
opens and closes near the opening price, forming a horizontal line. The body of the
candle is usually very small and can have long wicks.
Doji Candlestick Analysis
A doji represents equilibrium between supply and demand where neither the bulls nor
bears are winning. It signifies indecision and uncertainty in the price action of a stock.
Although the lengths of the shadows vary, the longer they are, the more significant the
Doji becomes. The Doji is an important alert at both the bottom and top of trends.
as
df
as
df
Find Trending Stocks @ www.Stock-Screener.org 14
After an uptrend or a downtrend, the presence of the Doji candle shows that there is
indecision between the bulls and bears. The price opens at a level, the bulls and bears
move the price up and down during the day, but closes at the level that it opened. This
signals that the trend might have lost its steam.
Trading Doji
The Doji candle is usually not a great entry candle for a trade and traders should not
make decisions based solely on the doji. This is because the doji can be broken either
way by the bulls or bears. Traders should wait for the next candlestick to make an
appropriate trade, but it does signal that sentiment may be changing.
After an uptrend, the presence of a doji can be a warning that the trend has peaked or is
close to peaking. The opposite is true when a doji that appears at the end of a downtrend.
After an uptrend, the Doji signals a reversal without needing confirmation but after a
downtrend, the Doji requires a bullish day to confirm.
It is important to pay attention to where the doji occurs. For example, if the stock is in the
early stages of an uptrend or downtrend, then it is unlikely that the doji is signaling its
peak or its bottom. It could just be a pause in the current trend move.
Making trading decisions based on doji candles is enhanced when there is large volume
on the signal day and if it’s after a long candle body.
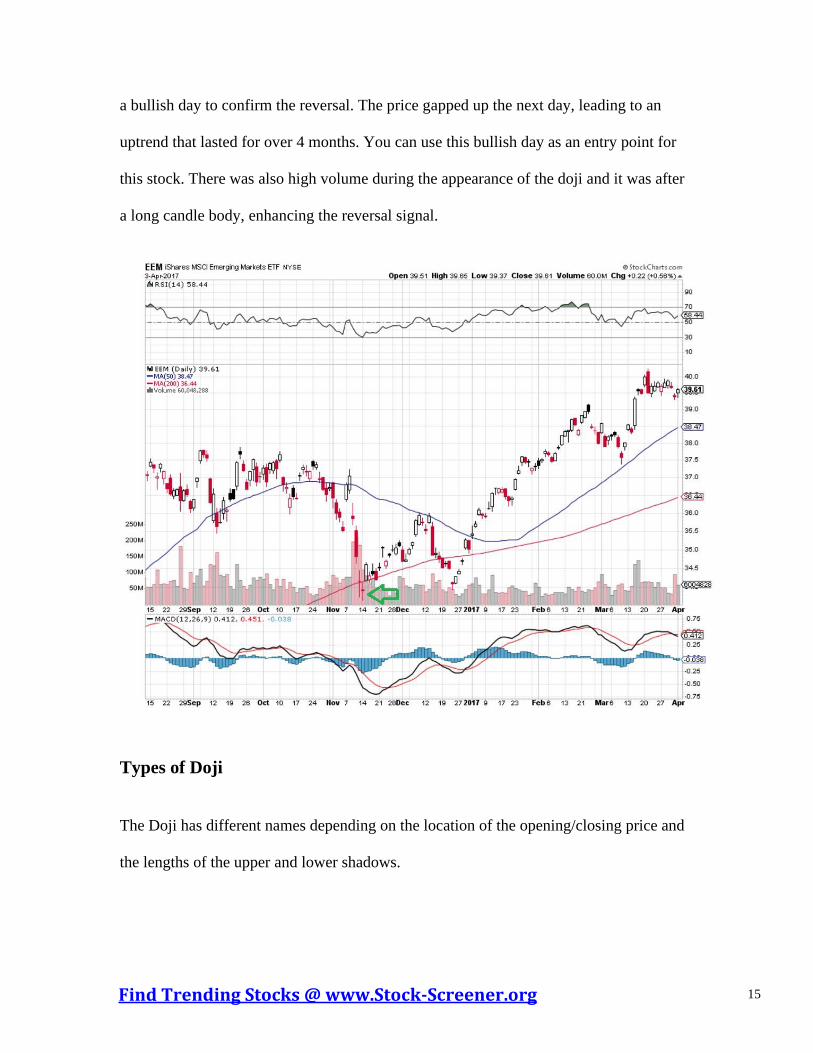
Take a look at EEM’s chart below. After a downtrend, there is a doji, signaling that the
trend might be ending. As previously discussed, after a downtrend, it is better to wait for
as
df
as
df
Find Trending Stocks @ www.Stock-Screener.org 15
a bullish day to confirm the reversal. The price gapped up the next day, leading to an
uptrend that lasted for over 4 months. You can use this bullish day as an entry point for
this stock. There was also high volume during the appearance of the doji and it was after
a long candle body, enhancing the reversal signal.
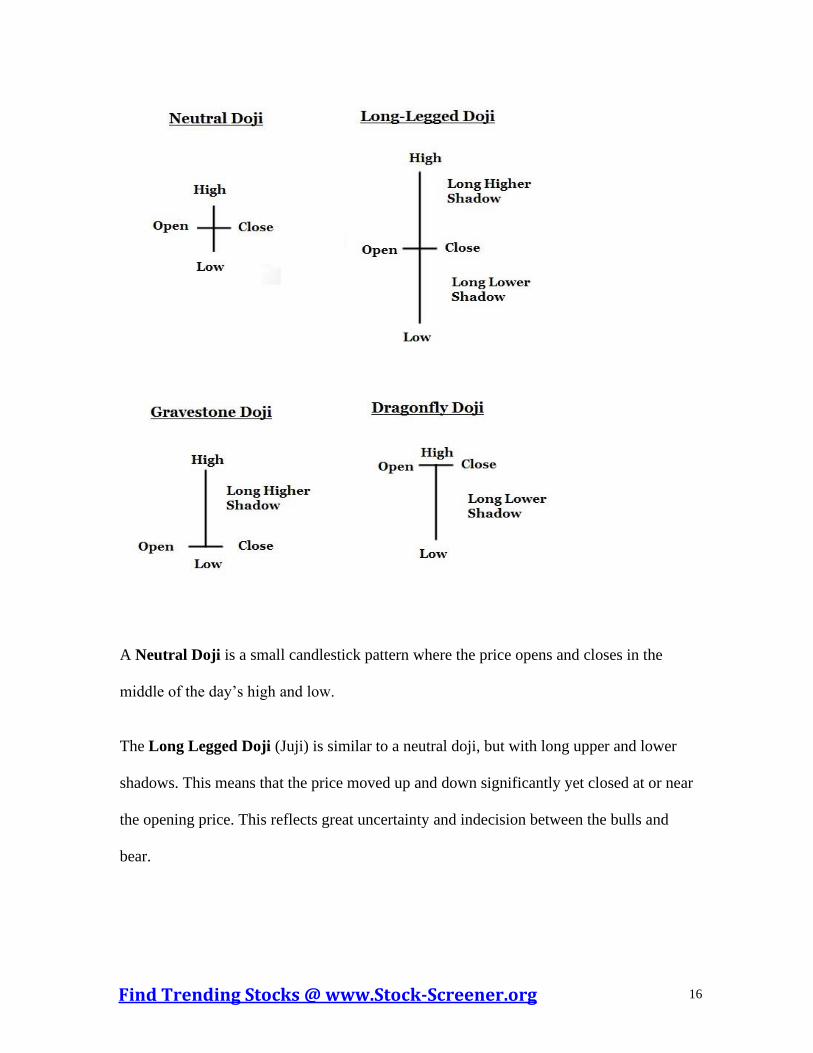
Types of Doji
The Doji has different names depending on the location of the opening/closing price and
the lengths of the upper and lower shadows.
as
df
as
df
Find Trending Stocks @ www.Stock-Screener.org 16
A Neutral Doji is a small candlestick pattern where the price opens and closes in the
middle of the day’s high and low.
The Long Legged Doji (Juji) is similar to a neutral doji, but with long upper and lower
shadows. This means that the price moved up and down significantly yet closed at or near
the opening price. This reflects great uncertainty and indecision between the bulls and
bear.
as
df
as
df
Find Trending Stocks @ www.Stock-Screener.org 17
The Gravestone Doji is when the open and close is at the low of the trading range. The
price opens at the low of the day, rallies, and then closes back down to the opening price.
It signifies that all victories of the day have been lost by the end of the day, hence the
name “Gravestone Doji.” At the top of a trend, a Gravestone Doji is a variation of
the Shooting Star. At the bottom, it is a variation of the Inverted Hammer.
How do you trade a Gravestone Doji? A Gravestone Doji is a reversal pattern which can
be either bullish or bearish depending on the position of the candlestick. If a Gravestone
Doji appears after an uptrend, it may signal that the trend may start to reverse to a
downtrend. Wait to see if the doji low is broken on the next candlestick. If it does, it
gives you a sell signal.
The Doji’s Dragonfly is when trading opens at the high of the day, trades lower, and the
closes at the open price. A long shadow at the bottom of a trend is very bullish. At the top
of a trend, it is a variation of the Hanging Man. At the bottom of a trend, it is a variation
of a Hammer.
How do you trade a Doji’s Dragonfly? Although a Dragonfly Doji can be either bullish or
bearish, the pattern works better for bullish reversals. If a Dragonfly Doji appears after a
downtrend, it may signal that the trend may start to reverse to an uptrend. If the doji high
is broken on the next candlestick, it gives you a buy signal.
as
df
as
df
Find Trending Stocks @ www.Stock-Screener.org 18
How to Trade Bullish Engulfing Candlestick
Chart Pattern
Bullish Engulfing and bearish engulfing are amongst the top reversal patterns that
traders use. They are one of the most popular candlestick trading strategies. Both patterns
consist of two opposite colored bodies. The bullish engulfing pattern forms after a
downtrend, where its price opens lower than the previous day’s close and closes higher
than the previous day’s open, thus “engulfing” the body of the first candle. The first
candle is a black colored body that closes down for the day and the second candle is a
white colored body that closes past the previous day’s open. This pattern has to appear at
a support level, after a bearish swing. Otherwise, if it appears at a resistance level, it is
not a bullish engulfing.
The bearish engulfing pattern is the exact opposite. It forms after an uptrend, where its
price opens higher than the previous day’s close and closes lower than the previous day’s
open. In other words, the black candle engulfs the previous day’s white candle. This
pattern has to appear at resistance level, after a bullish swing. If it appears at a support, it
is not a bearish engulfing.
as
df
as
df
Find Trending Stocks @ www.Stock-Screener.org 19
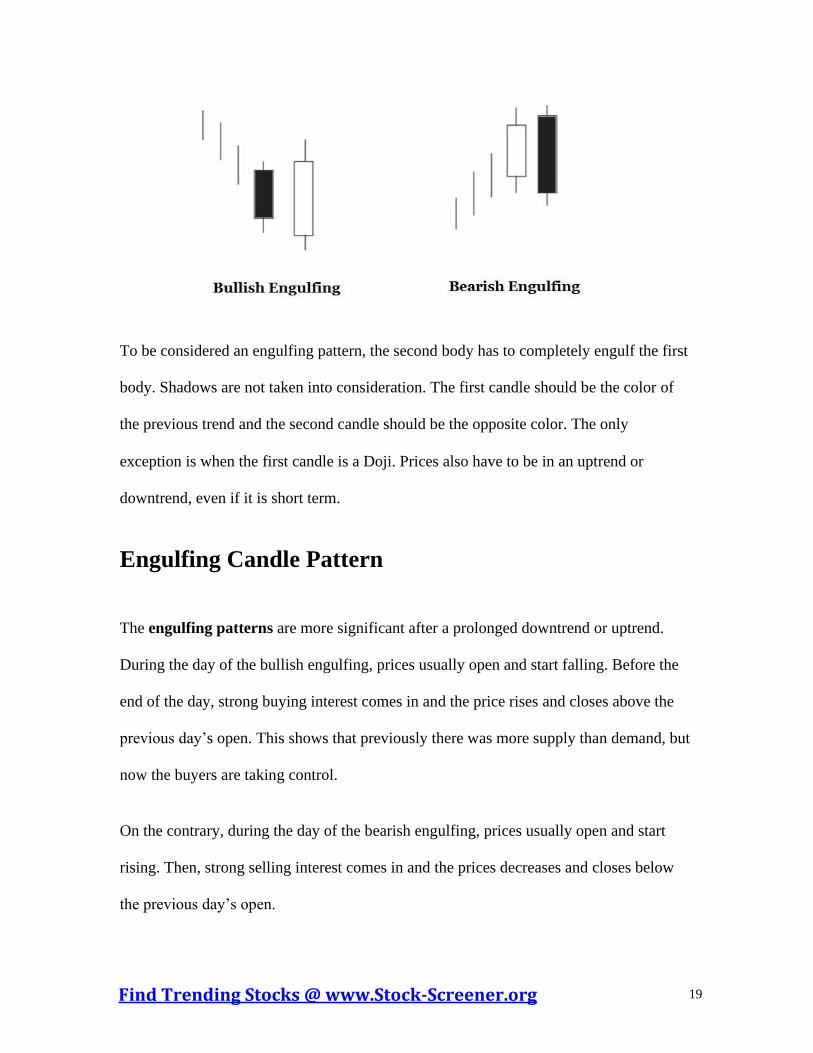
To be considered an engulfing pattern, the second body has to completely engulf the first
body. Shadows are not taken into consideration. The first candle should be the color of
the previous trend and the second candle should be the opposite color. The only
exception is when the first candle is a Doji. Prices also have to be in an uptrend or
downtrend, even if it is short term.
Engulfing Candle Pattern
The engulfing patterns are more significant after a prolonged downtrend or uptrend.
During the day of the bullish engulfing, prices usually open and start falling. Before the
end of the day, strong buying interest comes in and the price rises and closes above the
previous day’s open. This shows that previously there was more supply than demand, but
now the buyers are taking control.
On the contrary, during the day of the bearish engulfing, prices usually open and start
rising. Then, strong selling interest comes in and the prices decreases and closes below
the previous day’s open.
as
df
as
df
Find Trending Stocks @ www.Stock-Screener.org 20
Engulfing Candle Trading Strategy
Trading the engulfing candle patterns is a common swing trading strategy. Like
most reversal patterns, when you see these engulfing candles, it is a signal that the trend
is about to reverse. You should considering exiting any positions you’re holding or
tighten your stops. Also, determine what additional confirmations you need to confirm
the new trend.
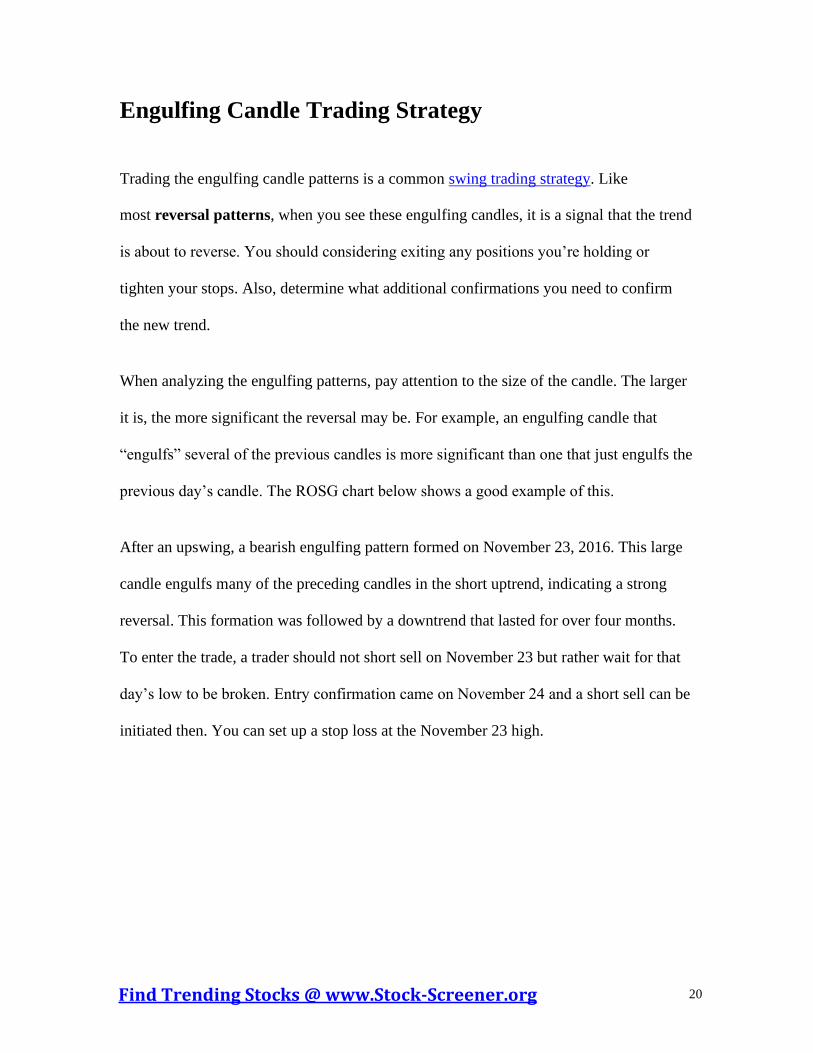
When analyzing the engulfing patterns, pay attention to the size of the candle. The larger
it is, the more significant the reversal may be. For example, an engulfing candle that
“engulfs” several of the previous candles is more significant than one that just engulfs the
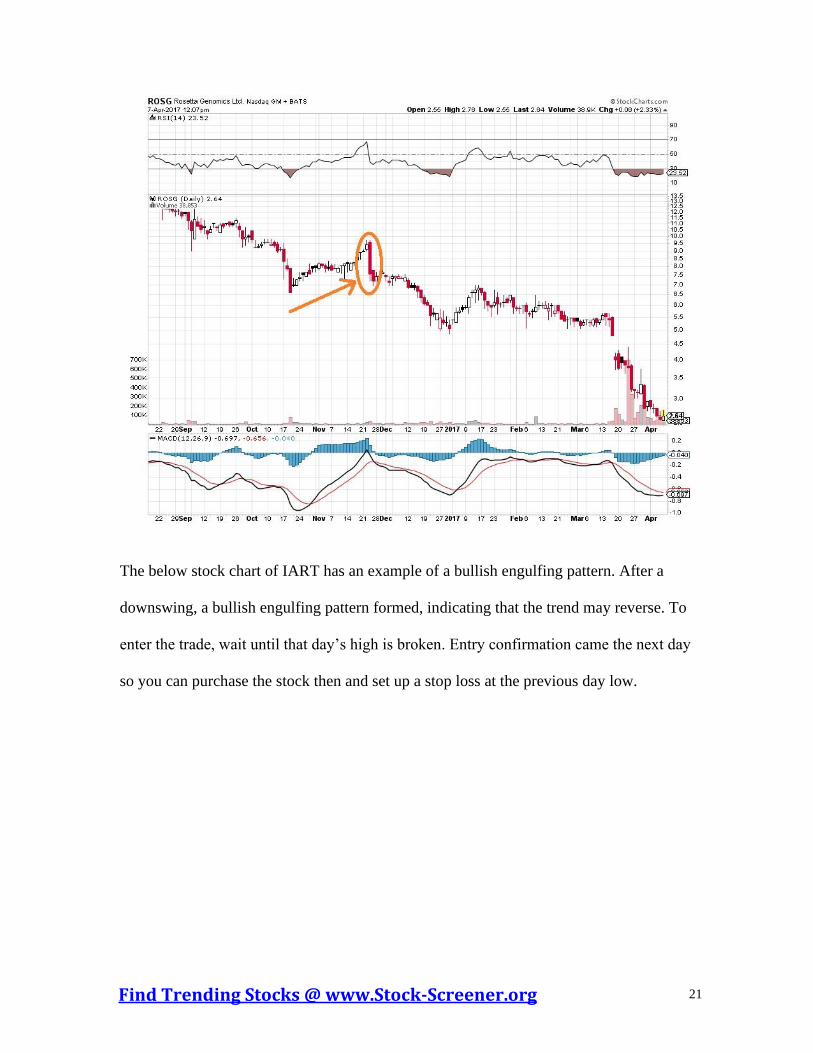
previous day’s candle. The ROSG chart below shows a good example of this.
After an upswing, a bearish engulfing pattern formed on November 23, 2016. This large
candle engulfs many of the preceding candles in the short uptrend, indicating a strong
reversal. This formation was followed by a downtrend that lasted for over four months.
To enter the trade, a trader should not short sell on November 23 but rather wait for that
day’s low to be broken. Entry confirmation came on November 24 and a short sell can be
initiated then. You can set up a stop loss at the November 23 high.
as
df
as
df
Find Trending Stocks @ www.Stock-Screener.org 21
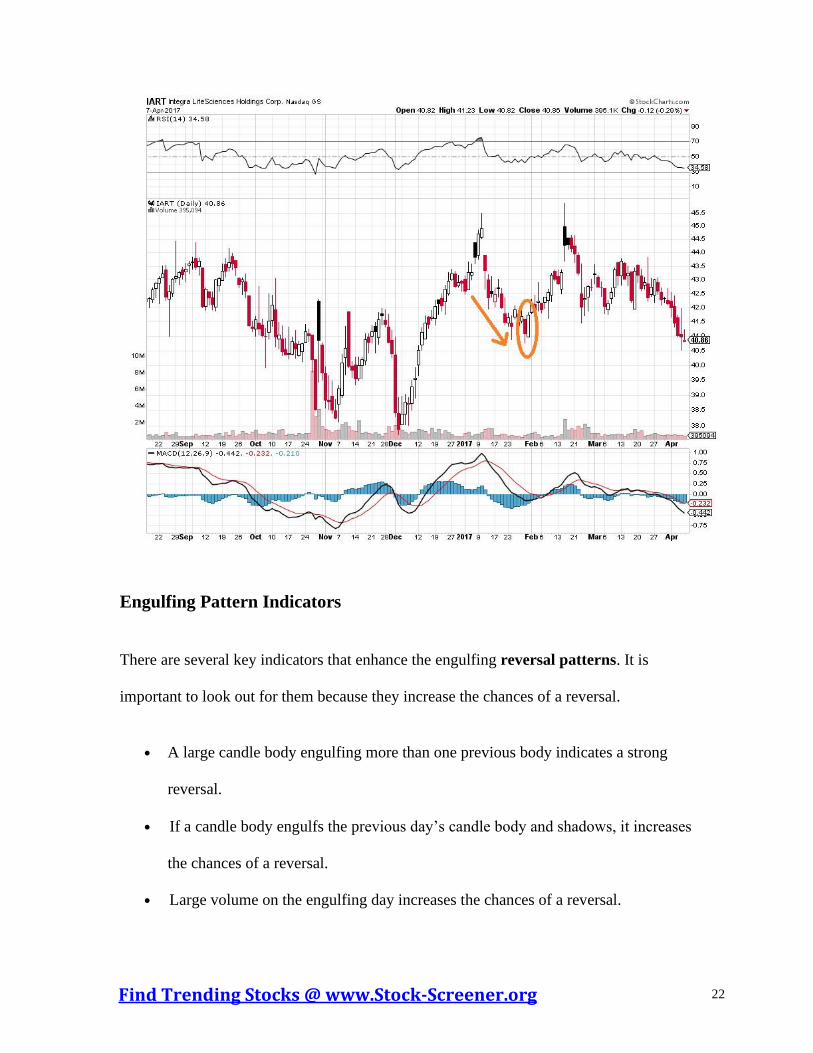
The below stock chart of IART has an example of a bullish engulfing pattern. After a
downswing, a bullish engulfing pattern formed, indicating that the trend may reverse. To
enter the trade, wait until that day’s high is broken. Entry confirmation came the next day
so you can purchase the stock then and set up a stop loss at the previous day low.
as
df
as
df
Find Trending Stocks @ www.Stock-Screener.org 22
Engulfing Pattern Indicators
There are several key indicators that enhance the engulfing reversal patterns. It is
important to look out for them because they increase the chances of a reversal.
• A large candle body engulfing more than one previous body indicates a strong
reversal.
• If a candle body engulfs the previous day’s candle body and shadows, it increases
the chances of a reversal.
• Large volume on the engulfing day increases the chances of a reversal.
as
df
as
df
Find Trending Stocks @ www.Stock-Screener.org 23
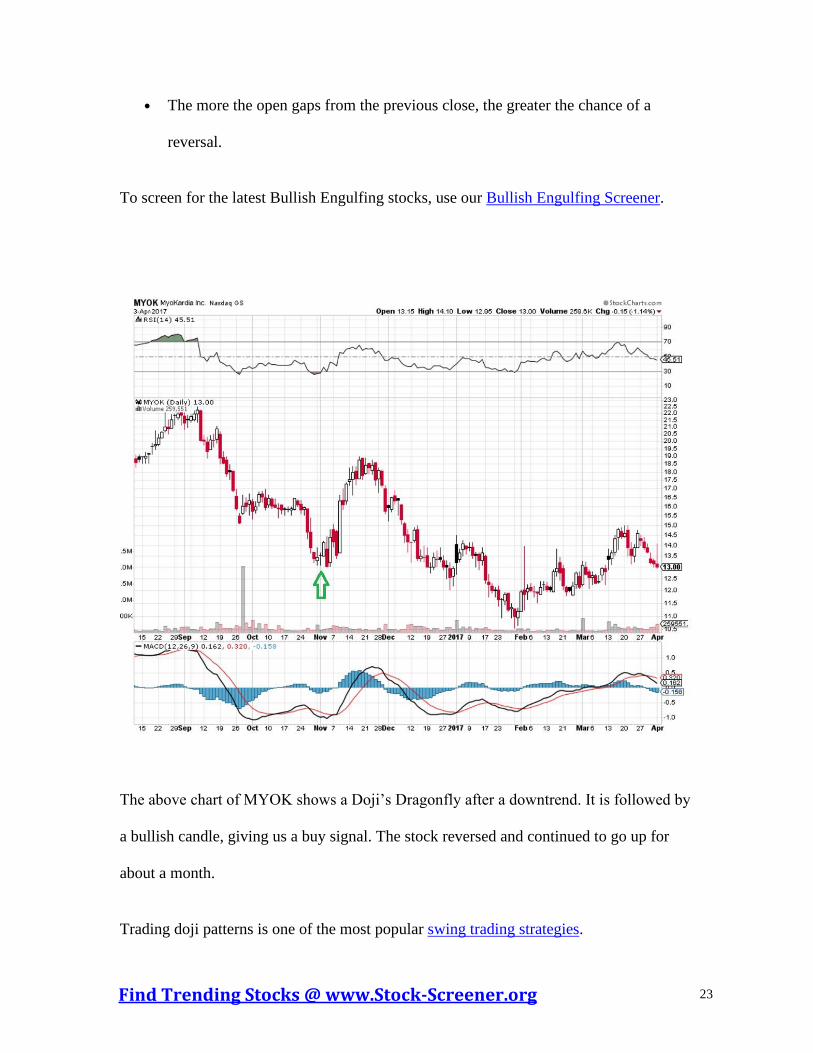
• The more the open gaps from the previous close, the greater the chance of a
reversal.
To screen for the latest Bullish Engulfing stocks, use our Bullish Engulfing Screener.
The above chart of MYOK shows a Doji’s Dragonfly after a downtrend. It is followed by
a bullish candle, giving us a buy signal. The stock reversed and continued to go up for
about a month.
Trading doji patterns is one of the most popular swing trading strategies.
as
df
as
df
Find Trending Stocks @ www.Stock-Screener.org 24
Doji Screener
To find a list of stocks with a doji pattern, try the doji screener.
How to Trade the Inverted Hammer Candlestick
Pattern
Hammer and inverted hammer are amongst the top candlestick patterns. They are key
reversal signals that traders look out for. First, let’s understand the differences between a
hammer candlestick pattern and an inverted hammer candlestick pattern.
Hammer Candlestick Pattern
The Hammer candlestick looks like a hammer, with a small body and a lower shadow at
least two times greater than the body. The body is at the upper end of the trading range
and there should be no upper shadow or a very small upper shadow. Overall, the shape
looks like a hammer, hence its name. A hammer candlestick is found at the bottom of a
downtrend and signals that, although the selling is still going on, the bulls have started to
step in. The color of the candle body is insignificant but a white candle provides a more
bullish signal than a black candle. A strong bullish day is needed the following day in
order to confirm the Hammer signal.
as
df
as
df
Find Trending Stocks @ www.Stock-Screener.org 25
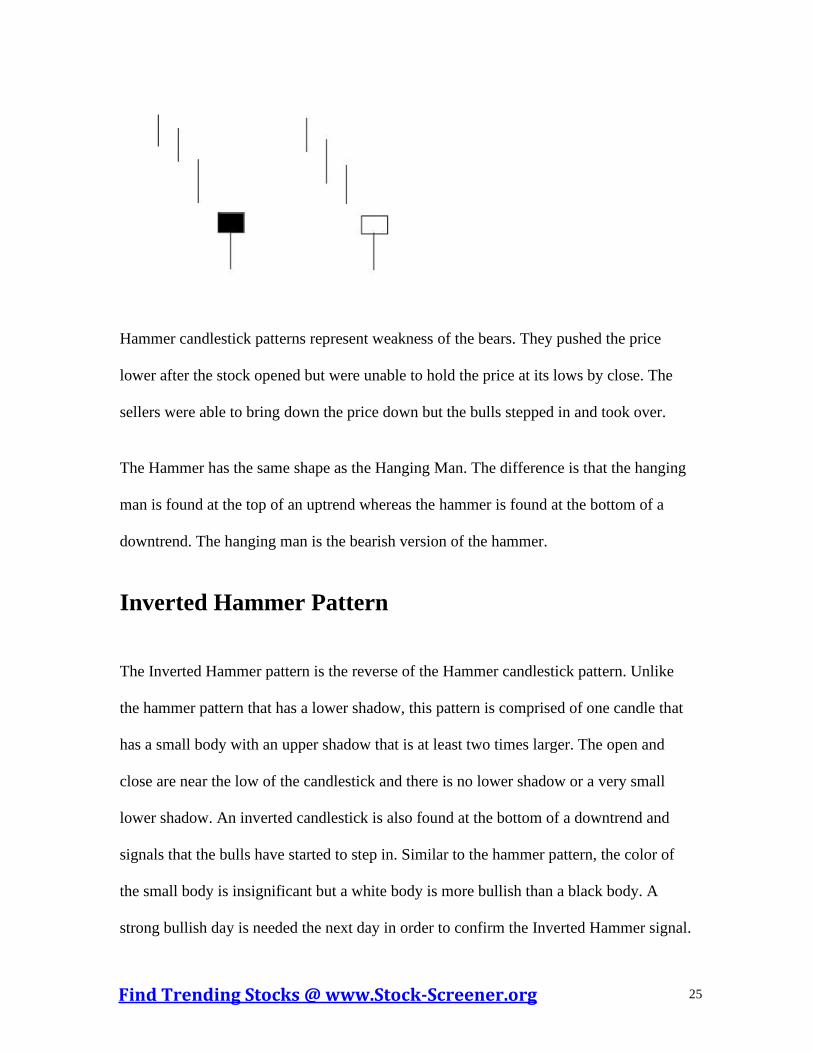
Hammer candlestick patterns represent weakness of the bears. They pushed the price
lower after the stock opened but were unable to hold the price at its lows by close. The
sellers were able to bring down the price down but the bulls stepped in and took over.
The Hammer has the same shape as the Hanging Man. The difference is that the hanging
man is found at the top of an uptrend whereas the hammer is found at the bottom of a
downtrend. The hanging man is the bearish version of the hammer.
Inverted Hammer Pattern
The Inverted Hammer pattern is the reverse of the Hammer candlestick pattern. Unlike
the hammer pattern that has a lower shadow, this pattern is comprised of one candle that
has a small body with an upper shadow that is at least two times larger. The open and
close are near the low of the candlestick and there is no lower shadow or a very small
lower shadow. An inverted candlestick is also found at the bottom of a downtrend and
signals that the bulls have started to step in. Similar to the hammer pattern, the color of
the small body is insignificant but a white body is more bullish than a black body. A
strong bullish day is needed the next day in order to confirm the Inverted Hammer signal.
as
df
as
df
Find Trending Stocks @ www.Stock-Screener.org 26
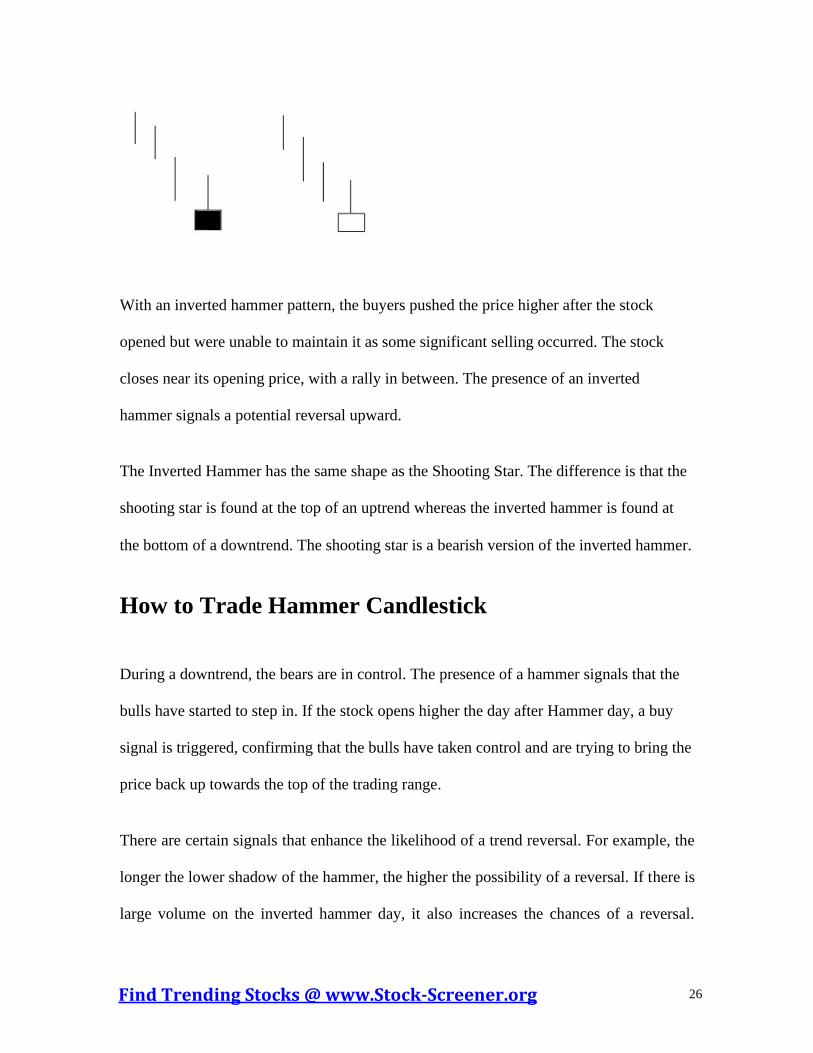
With an inverted hammer pattern, the buyers pushed the price higher after the stock
opened but were unable to maintain it as some significant selling occurred. The stock
closes near its opening price, with a rally in between. The presence of an inverted
hammer signals a potential reversal upward.
The Inverted Hammer has the same shape as the Shooting Star. The difference is that the
shooting star is found at the top of an uptrend whereas the inverted hammer is found at
the bottom of a downtrend. The shooting star is a bearish version of the inverted hammer.
How to Trade Hammer Candlestick
During a downtrend, the bears are in control. The presence of a hammer signals that the
bulls have started to step in. If the stock opens higher the day after Hammer day, a buy
signal is triggered, confirming that the bulls have taken control and are trying to bring the
price back up towards the top of the trading range.
There are certain signals that enhance the likelihood of a trend reversal. For example, the
longer the lower shadow of the hammer, the higher the possibility of a reversal. If there is
large volume on the inverted hammer day, it also increases the chances of a reversal.
as
df
as
df
Find Trending Stocks @ www.Stock-Screener.org 27
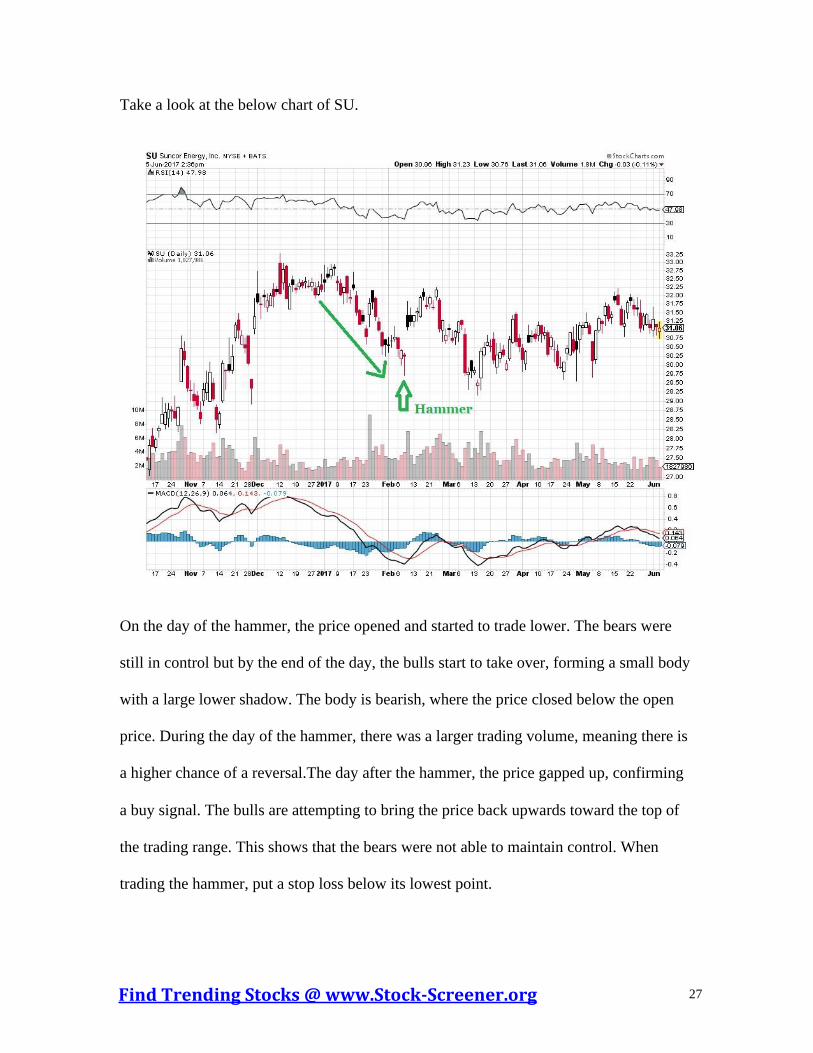
Take a look at the below chart of SU.
On the day of the hammer, the price opened and started to trade lower. The bears were
still in control but by the end of the day, the bulls start to take over, forming a small body
with a large lower shadow. The body is bearish, where the price closed below the open
price. During the day of the hammer, there was a larger trading volume, meaning there is
a higher chance of a reversal.The day after the hammer, the price gapped up, confirming
a buy signal. The bulls are attempting to bring the price back upwards toward the top of
the trading range. This shows that the bears were not able to maintain control. When
trading the hammer, put a stop loss below its lowest point.
as
df
as
df
Find Trending Stocks @ www.Stock-Screener.org 28
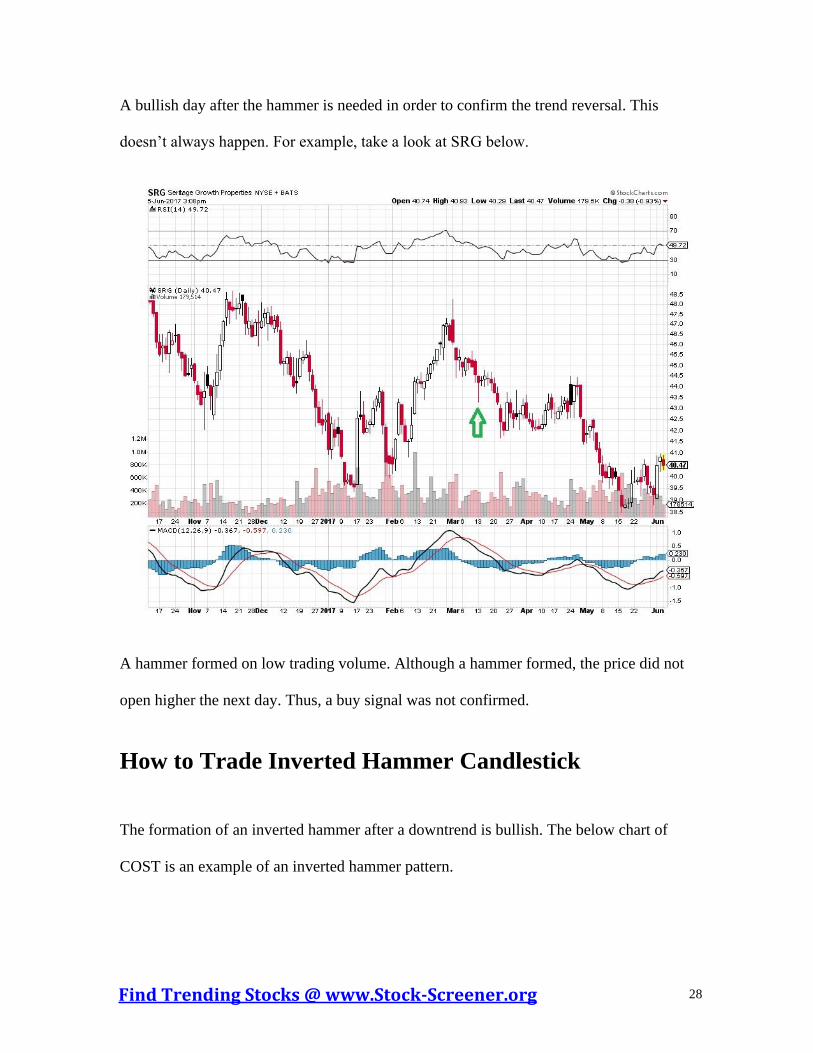
A bullish day after the hammer is needed in order to confirm the trend reversal. This
doesn’t always happen. For example, take a look at SRG below.
A hammer formed on low trading volume. Although a hammer formed, the price did not
open higher the next day. Thus, a buy signal was not confirmed.
How to Trade Inverted Hammer Candlestick
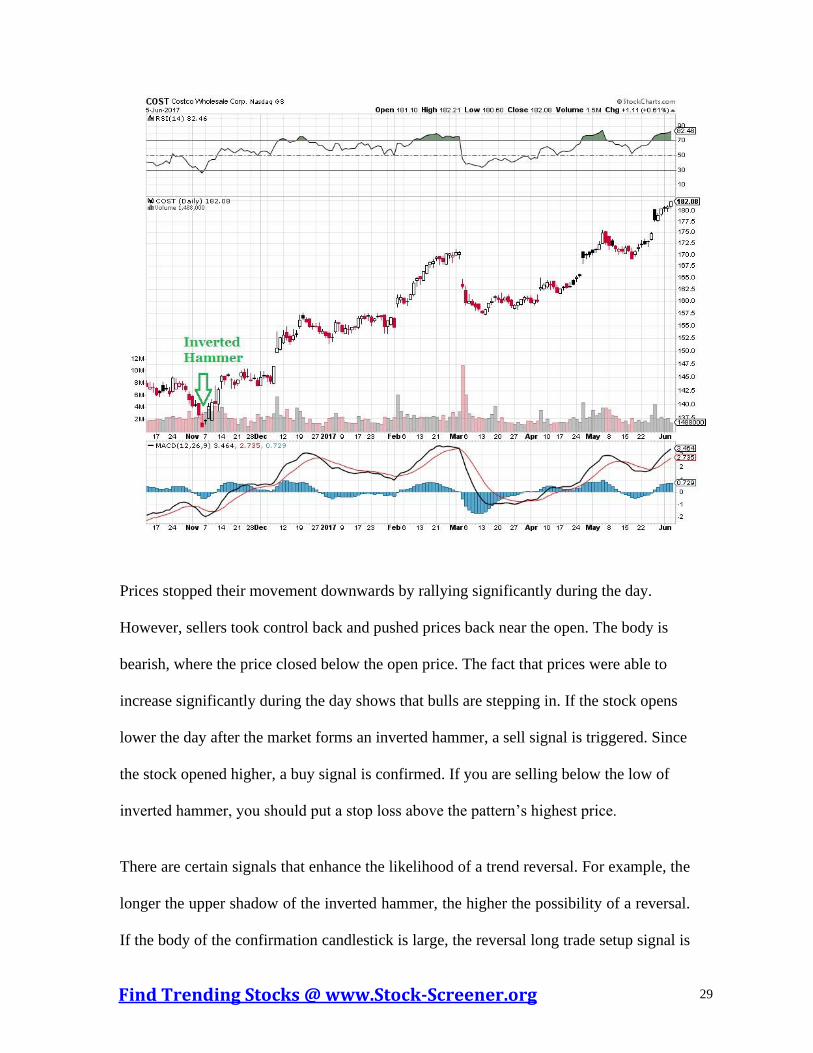
The formation of an inverted hammer after a downtrend is bullish. The below chart of
COST is an example of an inverted hammer pattern.
as
df
as
df
Find Trending Stocks @ www.Stock-Screener.org 29
Prices stopped their movement downwards by rallying significantly during the day.
However, sellers took control back and pushed prices back near the open. The body is
bearish, where the price closed below the open price. The fact that prices were able to
increase significantly during the day shows that bulls are stepping in. If the stock opens
lower the day after the market forms an inverted hammer, a sell signal is triggered. Since
the stock opened higher, a buy signal is confirmed. If you are selling below the low of
inverted hammer, you should put a stop loss above the pattern’s highest price.
There are certain signals that enhance the likelihood of a trend reversal. For example, the
longer the upper shadow of the inverted hammer, the higher the possibility of a reversal.
If the body of the confirmation candlestick is large, the reversal long trade setup signal is
as
df
as
df
Find Trending Stocks @ www.Stock-Screener.org 30
stronger. If there is large volume on the inverted hammer day, it also increases the
chances of a reversal.
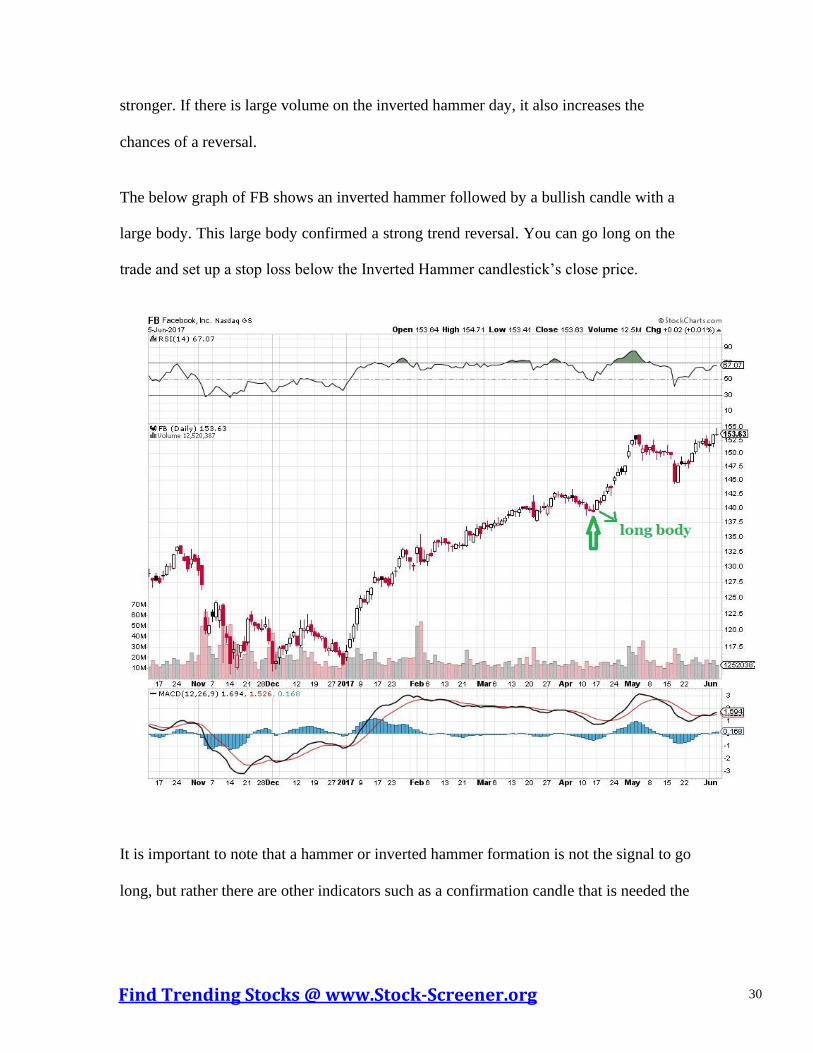
The below graph of FB shows an inverted hammer followed by a bullish candle with a
large body. This large body confirmed a strong trend reversal. You can go long on the
trade and set up a stop loss below the Inverted Hammer candlestick’s close price.
It is important to note that a hammer or inverted hammer formation is not the signal to go
long, but rather there are other indicators such as a confirmation candle that is needed the
following day to confirm a buy signal. Although hammers and inverted hammers
are reversal signals, they are not strong by themselves and need confirmation.
Understanding the hammer and inverted hammer patterns is one of the many swing
trading strategies.
Signup Up Free
Signup free to use our advanced stock screener, get stock trading tips and ideas. Become a better and more
profitable trader today.


![Trading Candlestick Patterns Ron William[1]](https://static.fdocuments.in/doc/165x107/5466acc9b4af9ff9748b492f/trading-candlestick-patterns-ron-william1.jpg)


![Japanese Candlestick Charting Techniques [1991 330p S. Nison] [Trading eBook]](https://static.fdocuments.in/doc/165x107/55cf87f555034664618be125/japanese-candlestick-charting-techniques-1991-330p-s-nison-trading-ebook.jpg)