Working Paper: Candlestick Reversal Patterns · Candlestick Reversal Pattern: Engulfing The first...
10
Market Ideas: Fact or Fiction? A a Remember to welcome all ideas in trading. AND remember to reserve your opinion until you have independently validated the idea! Copyright © and all Rights Reserved 2001-2018 Brent Penfold www.IndexTrader.com.au Helping traders since 2001 1 Working Paper: Candlestick Reversal Patterns Working Paper In this paper I want to review and (hopefully) validate a number of popular candlestick patterns. I want to determine whether or not they have a positive expectancy (an edge). By going through this exercise I want to show you how I review and validate ideas with the hope to encourage you to do the same when considering a new trading approach. Market Idea Many books, people and pundits believe certain patterns can identify a market turning point. I will be reviewing the following popular candlestick reversal patterns; Engulfing Hammer and Shooting Star Harami Piercing and Dark Cloud Cover Market Data Every trader’s twin evils when developing ideas and strategies are curve fitting and data mining. One is always present while the other can be eliminated. Curve fitting will always be present. All traders do it to some degree. Most traders over do it. The good traders always look to minimise it. Data mining can be avoided by objectively selecting a universal portfolio of markets that are well diversified and have minimal correlation. For my trading and research I use a universal portfolio of 24 diverse markets spread across 8 market segments; currencies, interest rates, indices, energy, metals, grains, softs and meats. Within each market segment I select the 3 most liquid futures contracts based on their average daily volume. Using diversification and volume as the selection process provides me with an objectively and independently selected portfolio of diversified markets. A portfolio of markets that is absent of data mining or market cherry picking. Market Data Data: I use futures data. Period: 1980 – 2017, 37 years. Source: I use Premium Data from Norgate Investor Services; www.premiumdata.net Format: I use the back-adjusted continuous future contract data. Sessions: I use the combined all-sessions data. Data rollover: I used Premium Data’s default rollover days that attempt to roll over when the daily volume shifts. Software I do all my own programming using VBA (Visual Basic Application) for Excel. To view the VBA editor in Excel simply open a workbook and hit “Alt F11”.
Transcript of Working Paper: Candlestick Reversal Patterns · Candlestick Reversal Pattern: Engulfing The first...
Market Ideas: Fact or Fiction? A
a
Remember to welcome all ideas in trading. AND remember to reserve your opinion until you have independently validated the idea!
Copyright © and all Rights Reserved 2001-2018 Brent Penfold
www.IndexTrader.com.au Helping traders since 2001
1
Working Paper: Candlestick Reversal Patterns Working Paper In this paper I want to review and (hopefully) validate a number of popular candlestick patterns. I want to determine whether or not they have a positive expectancy (an edge). By going through this exercise I want to show you how I review and validate ideas with the hope to encourage you to do the same when considering a new trading approach. Market Idea Many books, people and pundits believe certain patterns can identify a market turning point. I will be reviewing the following popular candlestick reversal patterns;
Engulfing Hammer and Shooting Star Harami Piercing and Dark Cloud Cover
Market Data Every trader’s twin evils when developing ideas and strategies are curve fitting and data mining. One is always present while the other can be eliminated. Curve fitting will always be present. All traders do it to some degree. Most traders over do it. The good traders always look to minimise it. Data mining can be avoided by objectively selecting a universal portfolio of markets that are well diversified and have minimal correlation. For my trading and research I use a universal portfolio of 24 diverse markets spread across 8 market segments; currencies, interest rates, indices, energy, metals, grains, softs and meats. Within each market segment I select the 3 most liquid futures contracts based on their average daily volume. Using diversification and volume as the selection process provides me with an objectively and independently selected portfolio of diversified markets. A portfolio of markets that is absent of data mining or market cherry picking. Market Data Data: I use futures data. Period: 1980 – 2017, 37 years. Source: I use Premium Data from Norgate Investor Services; www.premiumdata.net Format: I use the back-adjusted continuous future contract data. Sessions: I use the combined all-sessions data. Data rollover: I used Premium Data’s default rollover days that attempt to roll over when the
daily volume shifts. Software I do all my own programming using VBA (Visual Basic Application) for Excel. To view the VBA editor in Excel simply open a workbook and hit “Alt F11”.
Market Ideas: Fact or Fiction? A
a
Remember to welcome all ideas in trading. AND remember to reserve your opinion until you have independently validated the idea!
Copyright © and all Rights Reserved 2001-2018 Brent Penfold
www.IndexTrader.com.au Helping traders since 2001
2
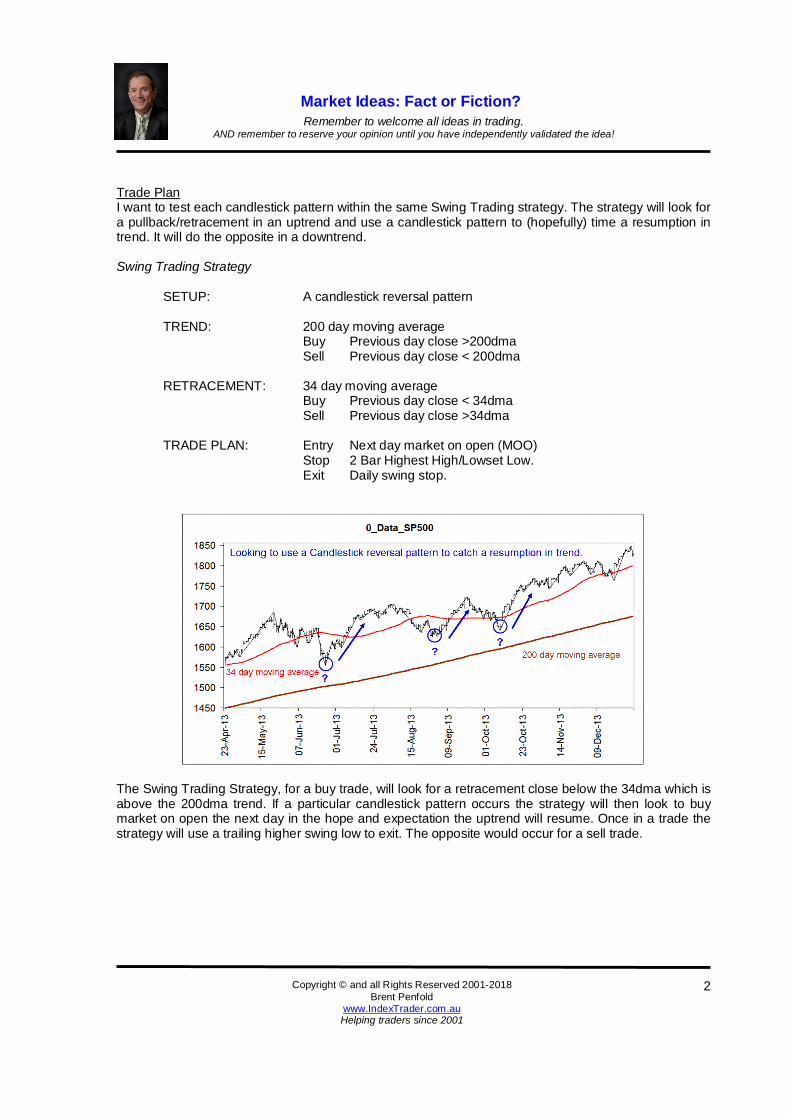
Trade Plan I want to test each candlestick pattern within the same Swing Trading strategy. The strategy will look for a pullback/retracement in an uptrend and use a candlestick pattern to (hopefully) time a resumption in trend. It will do the opposite in a downtrend. Swing Trading Strategy
SETUP: A candlestick reversal pattern TREND: 200 day moving average
Buy Previous day close >200dma Sell Previous day close < 200dma
RETRACEMENT: 34 day moving average Buy Previous day close < 34dma Sell Previous day close >34dma
TRADE PLAN: Entry Next day market on open (MOO) Stop 2 Bar Highest High/Lowset Low. Exit Daily swing stop.
The Swing Trading Strategy, for a buy trade, will look for a retracement close below the 34dma which is above the 200dma trend. If a particular candlestick pattern occurs the strategy will then look to buy market on open the next day in the hope and expectation the uptrend will resume. Once in a trade the strategy will use a trailing higher swing low to exit. The opposite would occur for a sell trade.
Market Ideas: Fact or Fiction? A
a
Remember to welcome all ideas in trading. AND remember to reserve your opinion until you have independently validated the idea!
Copyright © and all Rights Reserved 2001-2018 Brent Penfold
www.IndexTrader.com.au Helping traders since 2001
3
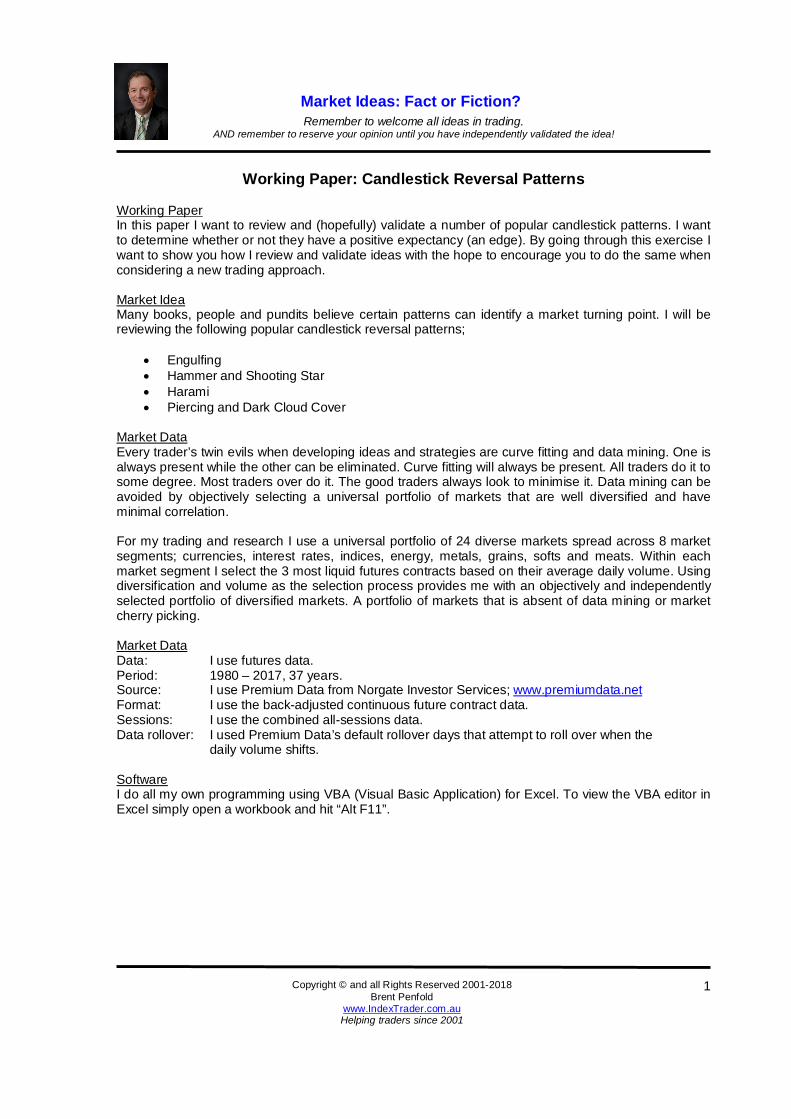
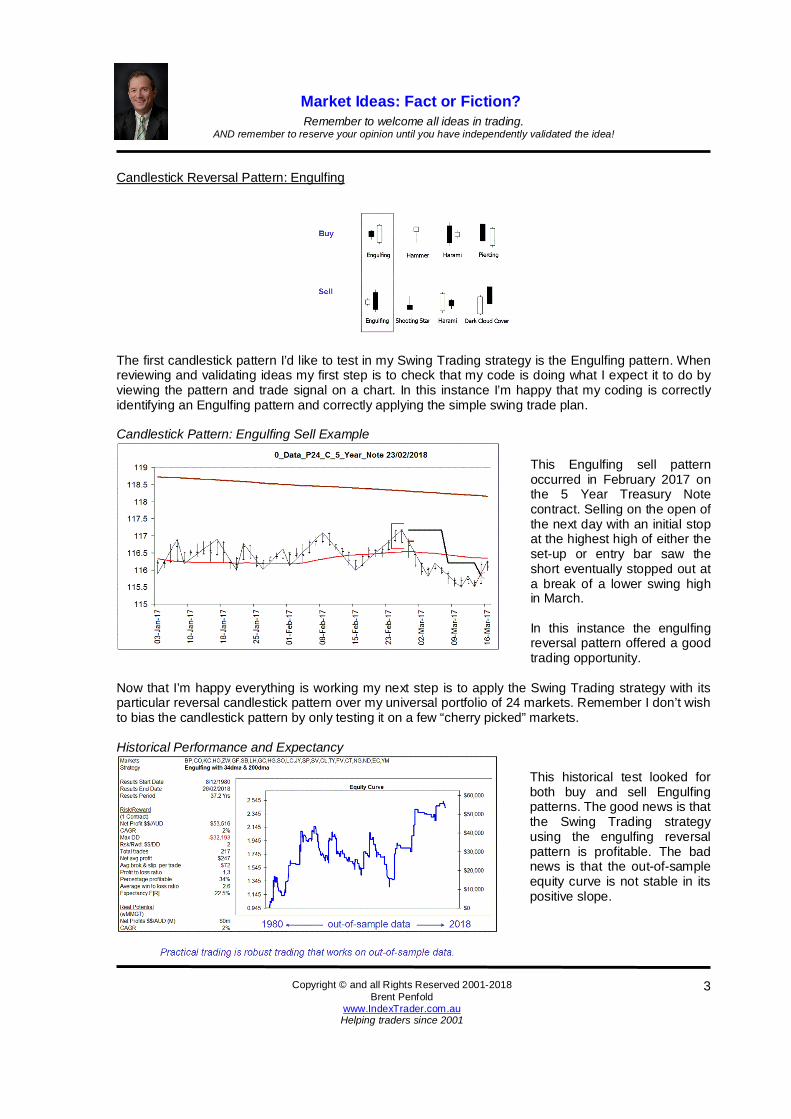
Candlestick Reversal Pattern: Engulfing
The first candlestick pattern I’d like to test in my Swing Trading strategy is the Engulfing pattern. When reviewing and validating ideas my first step is to check that my code is doing what I expect it to do by viewing the pattern and trade signal on a chart. In this instance I’m happy that my coding is correctly identifying an Engulfing pattern and correctly applying the simple swing trade plan. Candlestick Pattern: Engulfing Sell Example
This Engulfing sell pattern occurred in February 2017 on the 5 Year Treasury Note contract. Selling on the open of the next day with an initial stop at the highest high of either the set-up or entry bar saw the short eventually stopped out at a break of a lower swing high in March. In this instance the engulfing reversal pattern offered a good trading opportunity.
Now that I’m happy everything is working my next step is to apply the Swing Trading strategy with its particular reversal candlestick pattern over my universal portfolio of 24 markets. Remember I don’t wish to bias the candlestick pattern by only testing it on a few “cherry picked” markets. Historical Performance and Expectancy
This historical test looked for both buy and sell Engulfing patterns. The good news is that the Swing Trading strategy using the engulfing reversal pattern is profitable. The bad news is that the out-of-sample equity curve is not stable in its positive slope.
Market Ideas: Fact or Fiction? A
a
Remember to welcome all ideas in trading. AND remember to reserve your opinion until you have independently validated the idea!
Copyright © and all Rights Reserved 2001-2018 Brent Penfold
www.IndexTrader.com.au Helping traders since 2001
4
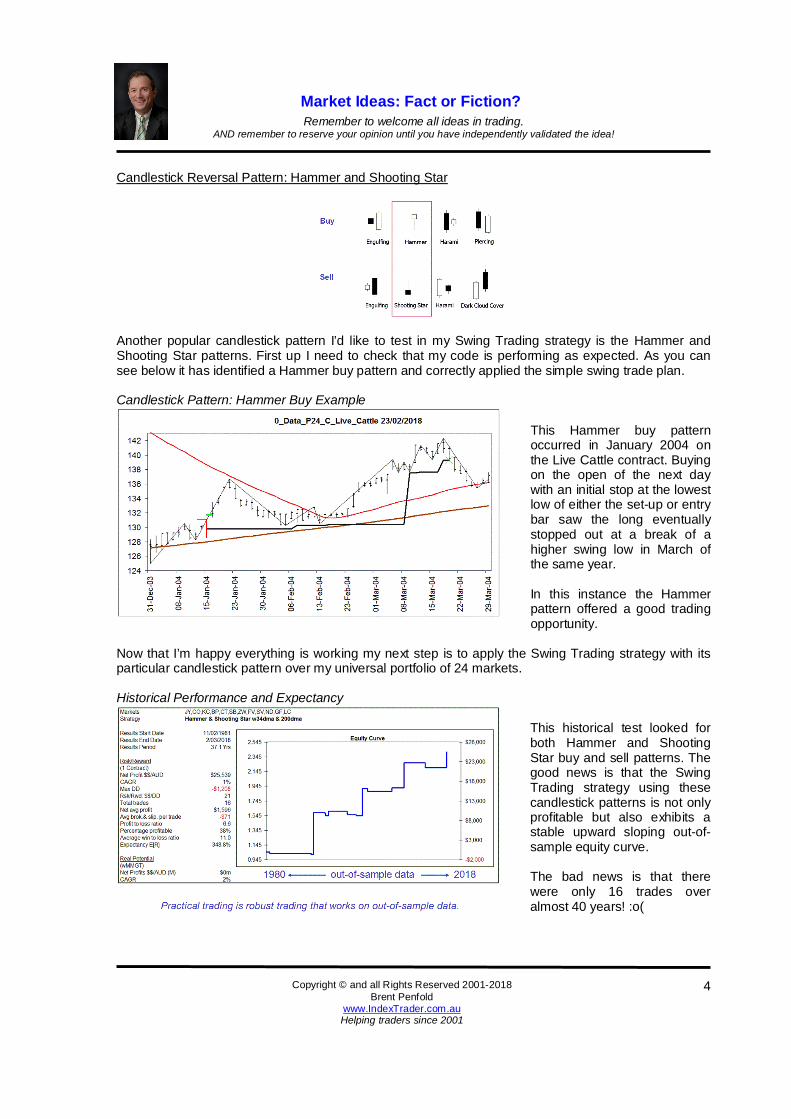
Candlestick Reversal Pattern: Hammer and Shooting Star
Another popular candlestick pattern I’d like to test in my Swing Trading strategy is the Hammer and Shooting Star patterns. First up I need to check that my code is performing as expected. As you can see below it has identified a Hammer buy pattern and correctly applied the simple swing trade plan. Candlestick Pattern: Hammer Buy Example
This Hammer buy pattern occurred in January 2004 on the Live Cattle contract. Buying on the open of the next day with an initial stop at the lowest low of either the set-up or entry bar saw the long eventually stopped out at a break of a higher swing low in March of the same year. In this instance the Hammer pattern offered a good trading opportunity.
Now that I’m happy everything is working my next step is to apply the Swing Trading strategy with its particular candlestick pattern over my universal portfolio of 24 markets. Historical Performance and Expectancy
This historical test looked for both Hammer and Shooting Star buy and sell patterns. The good news is that the Swing Trading strategy using these candlestick patterns is not only profitable but also exhibits a stable upward sloping out-of-sample equity curve. The bad news is that there were only 16 trades over almost 40 years! :o(
Market Ideas: Fact or Fiction? A
a
Remember to welcome all ideas in trading. AND remember to reserve your opinion until you have independently validated the idea!
Copyright © and all Rights Reserved 2001-2018 Brent Penfold
www.IndexTrader.com.au Helping traders since 2001
5
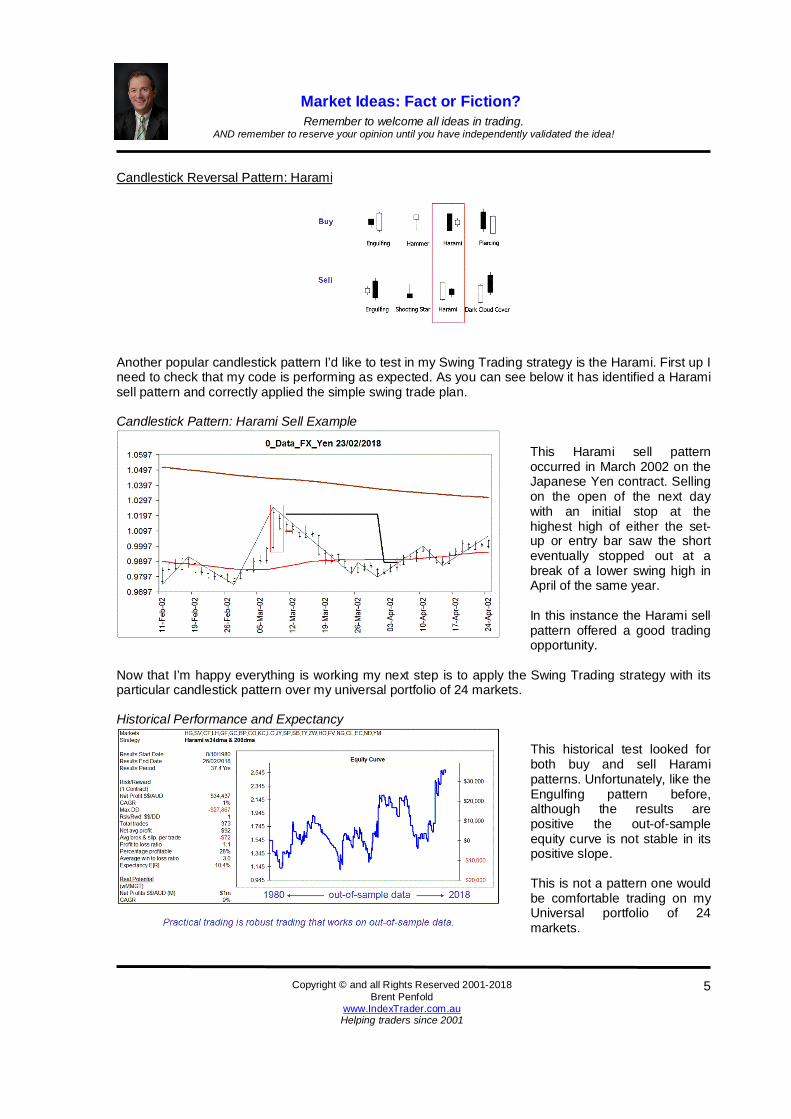
Candlestick Reversal Pattern: Harami
Another popular candlestick pattern I’d like to test in my Swing Trading strategy is the Harami. First up I need to check that my code is performing as expected. As you can see below it has identified a Harami sell pattern and correctly applied the simple swing trade plan. Candlestick Pattern: Harami Sell Example
This Harami sell pattern occurred in March 2002 on the Japanese Yen contract. Selling on the open of the next day with an initial stop at the highest high of either the set-up or entry bar saw the short eventually stopped out at a break of a lower swing high in April of the same year. In this instance the Harami sell pattern offered a good trading opportunity.
Now that I’m happy everything is working my next step is to apply the Swing Trading strategy with its particular candlestick pattern over my universal portfolio of 24 markets. Historical Performance and Expectancy
This historical test looked for both buy and sell Harami patterns. Unfortunately, like the Engulfing pattern before, although the results are positive the out-of-sample equity curve is not stable in its positive slope. This is not a pattern one would be comfortable trading on my Universal portfolio of 24 markets.
Market Ideas: Fact or Fiction? A
a
Remember to welcome all ideas in trading. AND remember to reserve your opinion until you have independently validated the idea!
Copyright © and all Rights Reserved 2001-2018 Brent Penfold
www.IndexTrader.com.au Helping traders since 2001
6
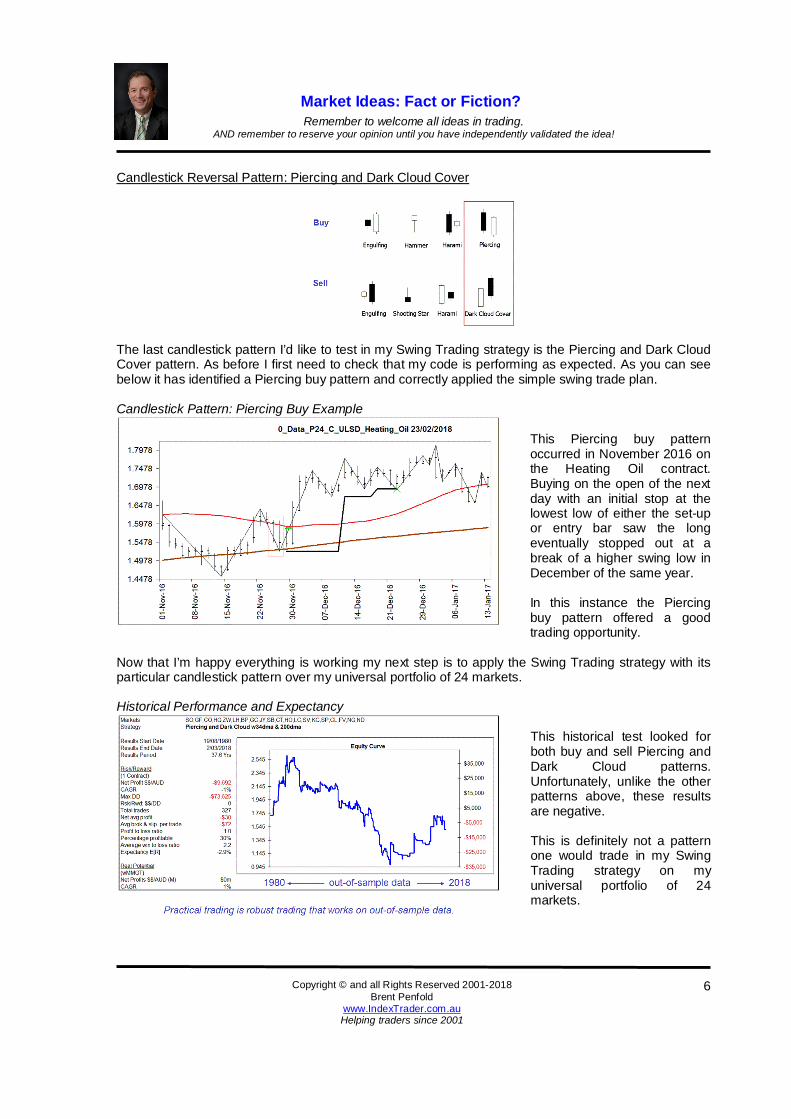
Candlestick Reversal Pattern: Piercing and Dark Cloud Cover
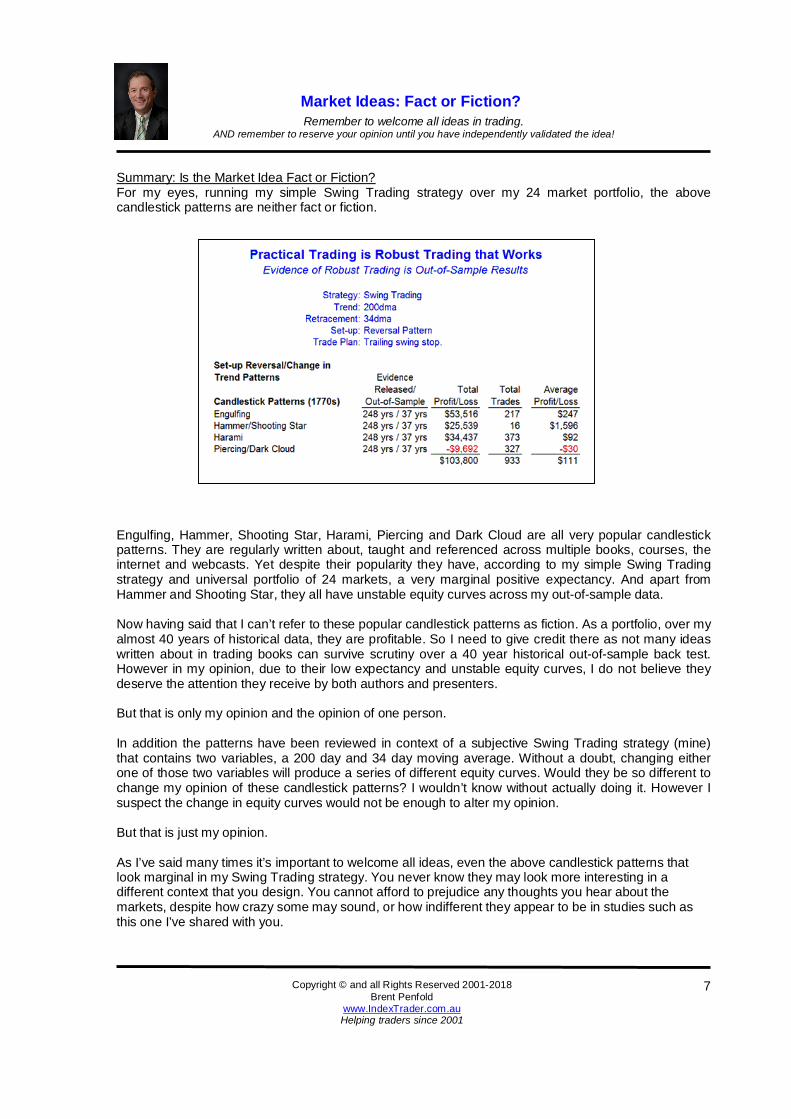
The last candlestick pattern I’d like to test in my Swing Trading strategy is the Piercing and Dark Cloud Cover pattern. As before I first need to check that my code is performing as expected. As you can see below it has identified a Piercing buy pattern and correctly applied the simple swing trade plan. Candlestick Pattern: Piercing Buy Example
This Piercing buy pattern occurred in November 2016 on the Heating Oil contract. Buying on the open of the next day with an initial stop at the lowest low of either the set-up or entry bar saw the long eventually stopped out at a break of a higher swing low in December of the same year. In this instance the Piercing buy pattern offered a good trading opportunity.
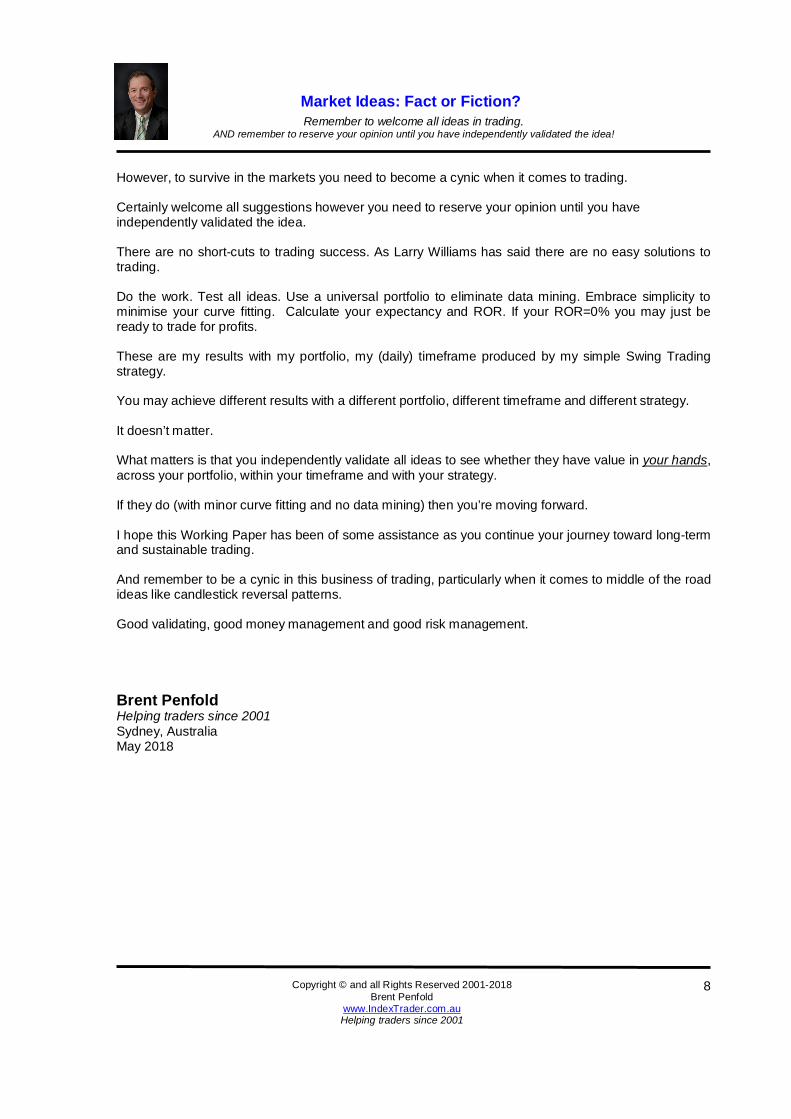
Now that I’m happy everything is working my next step is to apply the Swing Trading strategy with its particular candlestick pattern over my universal portfolio of 24 markets. Historical Performance and Expectancy
This historical test looked for both buy and sell Piercing and Dark Cloud patterns. Unfortunately, unlike the other patterns above, these results are negative. This is definitely not a pattern one would trade in my Swing Trading strategy on my universal portfolio of 24 markets.
Market Ideas: Fact or Fiction? A
a
Remember to welcome all ideas in trading. AND remember to reserve your opinion until you have independently validated the idea!
Copyright © and all Rights Reserved 2001-2018 Brent Penfold
www.IndexTrader.com.au Helping traders since 2001
7
Summary: Is the Market Idea Fact or Fiction? For my eyes, running my simple Swing Trading strategy over my 24 market portfolio, the above candlestick patterns are neither fact or fiction.
In Summary
Engulfing, Hammer, Shooting Star, Harami, Piercing and Dark Cloud are all very popular candlestick patterns. They are regularly written about, taught and referenced across multiple books, courses, the internet and webcasts. Yet despite their popularity they have, according to my simple Swing Trading strategy and universal portfolio of 24 markets, a very marginal positive expectancy. And apart from Hammer and Shooting Star, they all have unstable equity curves across my out-of-sample data. Now having said that I can’t refer to these popular candlestick patterns as fiction. As a portfolio, over my almost 40 years of historical data, they are profitable. So I need to give credit there as not many ideas written about in trading books can survive scrutiny over a 40 year historical out-of-sample back test. However in my opinion, due to their low expectancy and unstable equity curves, I do not believe they deserve the attention they receive by both authors and presenters. But that is only my opinion and the opinion of one person. In addition the patterns have been reviewed in context of a subjective Swing Trading strategy (mine) that contains two variables, a 200 day and 34 day moving average. Without a doubt, changing either one of those two variables will produce a series of different equity curves. Would they be so different to change my opinion of these candlestick patterns? I wouldn’t know without actually doing it. However I suspect the change in equity curves would not be enough to alter my opinion. But that is just my opinion. As I’ve said many times it’s important to welcome all ideas, even the above candlestick patterns that look marginal in my Swing Trading strategy. You never know they may look more interesting in a different context that you design. You cannot afford to prejudice any thoughts you hear about the markets, despite how crazy some may sound, or how indifferent they appear to be in studies such as this one I’ve shared with you.
Market Ideas: Fact or Fiction? A
a
Remember to welcome all ideas in trading. AND remember to reserve your opinion until you have independently validated the idea!
Copyright © and all Rights Reserved 2001-2018 Brent Penfold
www.IndexTrader.com.au Helping traders since 2001
8
However, to survive in the markets you need to become a cynic when it comes to trading. Certainly welcome all suggestions however you need to reserve your opinion until you have independently validated the idea. There are no short-cuts to trading success. As Larry Williams has said there are no easy solutions to trading. Do the work. Test all ideas. Use a universal portfolio to eliminate data mining. Embrace simplicity to minimise your curve fitting. Calculate your expectancy and ROR. If your ROR=0% you may just be ready to trade for profits. These are my results with my portfolio, my (daily) timeframe produced by my simple Swing Trading strategy. You may achieve different results with a different portfolio, different timeframe and different strategy. It doesn’t matter. What matters is that you independently validate all ideas to see whether they have value in your hands, across your portfolio, within your timeframe and with your strategy. If they do (with minor curve fitting and no data mining) then you’re moving forward. I hope this Working Paper has been of some assistance as you continue your journey toward long-term and sustainable trading. And remember to be a cynic in this business of trading, particularly when it comes to middle of the road ideas like candlestick reversal patterns. Good validating, good money management and good risk management. Brent Penfold Helping traders since 2001 Sydney, Australia May 2018
Market Ideas: Fact or Fiction? A
a
Remember to welcome all ideas in trading. AND remember to reserve your opinion until you have independently validated the idea!
Copyright © and all Rights Reserved 2001-2018 Brent Penfold
www.IndexTrader.com.au Helping traders since 2001
9
Brent Penfold Trader, Advisor, Author and Educator Brent Penfold is a 30-year veteran trader having begun his career in 1983 as an institutional trader with Bank America. In addition to being a professional trader Brent is an advisor, author and educator. Today Brent trades a diversified global portfolio of markets including indices, currencies, interest rates, energies, metals, grains, softs and meats. He is the author of two books;
Trading the SPI (Wiley 2005) and The Universal Principles of Successful Trading (Wiley 2010).
The Universal Principles of Successful Trading has become an international best seller that has now been translated into Polish, German, Korean, Japanese and simplified and orthodox Chinese. Brent has a third book coming out in 2018;
The Universal Tactics of Successful Trading (Wiley 2018). Brent publishes daily newsletters for active index, currency and commodity traders and is a popular and sought after international speaker who has presented to traders throughout the Asia Pacific region including;
Australia New Zealand Malaysia Singapore Hong Kong Vietnam Thailand India and China.
Brent is an advisor and holds a Master of Commerce (Finance) degree. To learn more about Brent Penfold and his services you can visit his web site: www.IndexTrader.com.au Please read the following Warning on the next page.
Brent Penfold Helping traders since 2001.
Market Ideas: Fact or Fiction? A
a
Remember to welcome all ideas in trading. AND remember to reserve your opinion until you have independently validated the idea!
Copyright © and all Rights Reserved 2001-2018 Brent Penfold
www.IndexTrader.com.au Helping traders since 2001
10
Warning – Please read This Working Paper does not contain any trading advice, personal advice or general advice. This Working Paper is educational only and is designed to encourage traders to independently verify trading ideas before they consider using them in the market. When researching certain trading ideas this Working Paper does not take into account individual trader needs, their individual financial situation or their individual investment objectives. If you wish to further explore the ideas shared in this Working Paper you will need to, with or without the assistance of a licensed financial adviser, determine whether the particular trading idea is appropriate in light of your particular needs, financial situation and investment objectives. You need to understand there is risk of loss in trading and that this Working Paper does not indicate future trading success. By receiving this Working Paper you acknowledge that you understand and accept these warnings.