Candidate: Juan Carlos Bello Muñoz - UAB Barcelona...experimental del algoritmo al compararlo con...
207
Volume Perfussion Index (VPI): Developing a New Tool for Measuring Fetal Blood Flow by using Four Dimensional Ultrasound and Power Doppler Signal Mathematical modelling of Fetal Cardiac Output in an Experimental Animal model. Candidate: Juan Carlos Bello Muñoz DOCTORAL THESIS UNIVERSITAT AUTONOMA DE BARCELONA 2012 THESIS CO-DIRECTORS Professor Dr Lluis Cabero Roura. Professor Dr. Elena Carreras Moratonas
Transcript of Candidate: Juan Carlos Bello Muñoz - UAB Barcelona...experimental del algoritmo al compararlo con...

Volume Perfussion Index (VPI): Developing a New Tool
for Measuring Fetal Blood Flow by using Four
Dimensional Ultrasound and Power Doppler Signal
Mathematical modelling of Fetal Cardiac Output in an Experimental
Animal model.
Candidate: Juan Carlos Bello Muñoz
DOCTORAL THESIS
UNIVERSITAT AUTONOMA DE BARCELONA
2012
THESIS CO-DIRECTORS
Professor Dr Lluis Cabero Roura.
Professor Dr. Elena Carreras Moratonas

ii

iii

iv
A mis padres A Alejandra y Andrea, por el sacrificio mas grande
To my parents To Alejandra and Andrea, for their unsurmontable sacrifice.


vi
Acknoledgements Author wish to acknowledge : Mister Mauricio Ayala Sánchez for his continuous teaching on mathematics and physics of the fluids, and also for developing part of the software for image analysis. Doctor José Luis Peiró for his teaching and help in animal surgery and for generously providing the experimental subjects. Doctors Francesc Soldado and Francisco Garcia-Fontecha for generously providing experimental subjects from their own projects. Doctor Marta Rosales from the Animal Warehouse of the Research Institute in Vall d’Hebron Hospital for her support in accessing the facilities. Doctors Marielle Estevez and Carla Mendes from the Animal Warehouse of the Research Institute in Vall d’Hebron Hospital for her thorough care of the animals involved in the experiment. Doctor Raul Cruz-Hidalgo from the Applied Physics and Mathematics Dept of the University of Navarra for his help in developing the algorithms Mister Mariano Sanchez and Mistress Dolores Cantelli from the technical and scientific department of Philips Medizin System for their initial support and for providing us with a iU22 US machine for this experiment Mister Sun Ho Ko and Miss July Bartholomew from the technical and scientific department of Samsung Medical Co for their irrestrict support and for providing us with a Medison Accuvix V20 Prestige. Mister Juan Carlos Elias and Carme Perramon from the applications development center of Samsung Medical for providing us with unreleased versions of their Sonoview software. Doctors Paula Oliveros, Nazareth Campo , Gabriel Villagómez, Mauricio Orozco, Francisco Villanueva and John Freddy Plata, for their cooperation in collecting the first normal fetuses. Mister George Chilton for his thorough review of the english version of this work.


viii
Abstract Aims Primary aim: To develop a tool for measuring fetal flow and perfussion by Spatio- time correlation (4D) and power Doppler signal. Secondary aim: To test and calibrate the designed tool in a well controled animal (sheep) model Methods: Mathematical modelling of a vectorial velocity color signal displacement algorithm. Experimental measurement of the algorithm by comparing it to known flow profiles in vitro by designing a phantom model of pulsatile flow and in-vivo by comparing obtained values to actual measurements obtained, by invasive methods, from fetal aortic arch in eight term pregnant sheep. Acquisition of 4D volume datasets with offline analysis of color signal by using the already validated Vascularization Flow Index (VFI)® and the newly designed Volume Perfusion Index (VPI). Comparison of both methods in terms of repeatability and accuracy, in-vitro as well as in-vivo. Results: When tested in-vitro, both techniques showed a good repeatability. Intra-Observer Intraclass Correlation Coefficient (ICC; 95% CI) was similar for VPI (0.95; 0.91-0.99) and VFI (0.9; 0.88-0.92). Inter-Observer ICC was also alike for VPI (0.90; 0.87-0.99) and VFI (0.88; 0.84-0.91). When plotting VPI against actual flow calculation the Pearson’s correlation Index (95% CI) was 0.88 (0.58-0.97) for VPI and 0.34 (0.31-0.44) for VFI. When tested in-vivo the VPI exhibited an Intra-Observer ICC(95% CI) of 0.9(0.88-0.99) and the VFI 0.79(0.75-0.92); and an Inter-Observer ICC (955 CI) of 0.88 (0.87-0.99) for VPI and 0.78 (0.74-0.91) for VFI. The flow measurement in the animal model correlated significantly better in VPI than in VFI with a Perason’s Correlation Index (95% CI) of 0.88(0.58-0.97) Vs -0.34 (-0.31-0.44). p< 0.001 Conclusion The Volume Perfusion Index exhibits a more robust correlation with actual flow than the currently used Vazcularization Flow Index and further work and investment in this direction is clearly justified

ix
Resumen Objetivos Objetivo principal: Desarrollar una herramienta para medir el flujo y perfusión fetales, mediante el uso de ecografía tridimensional en tiempo real por correlación espacio-tiempo (4D) y el uso de la señal power-Doppler. Objetivo secundario: evaluar y calibrar la herramienta diseñada en un modelo animal bien controlado (ovino). Métodos: Modelación matemática de un algoritmo de la velocidad de desplazamiento de color vectorial de la señal de color. Medida experimental del algoritmo al compararlo con los perfiles de flujo conocidos in vitro mediante el diseño de un modelo fantasma de flujo pulsátil e in vivo, mediante la comparación de los valores obtenidos con las mediciones reales obtenidas por métodos invasivos, desde el arco aórtico fetal en ocho ovejas gestantes plazo. La adquisición de bases de datos 4D de volumen en línea con el análisis de la señal de color mediante el índice de vascularización de flujo ya validado (VFI), ® y el Índice de Volumen de perfusión, diseñado por nuestro equipo (VPI). La comparación de ambos métodos en términos de replicabilidad y precisión, in vitro, así como in vivo. Resultados: Durante el ensayo in vitro, ambas técnicas mostraron una buena capacidad de repetición. Intra-observador coeficiente de correlación intraclase (ICC, IC 95%) fue similar para VPI (0,95; 0,91 a 0.99) y VFI (0,9; 0,88 a 0.92). Inter-observador CCI también fue igual para VPI (0,90; 0,87 a 0,99) y VFI (0,88; 0,84 a 0,91). Al trazar VPI contra la corriente real de cálculo Índice de correlación de Pearson (95% IC) fue de 0,88 (.58 a .97) para VPI y 0,34 (0,31-0,44) para la VFI. Cuando la prueba in vivo el VPI exhibió una Corte Penal Internacional intra-observador (95% IC) de 0.9 (0.88-0.99) y la VFI 0,79 (0,75 a 0,92), y una Corte Penal Inter-observador (955 CI) de 0,88 (0,87- 0,99) para VPI y 0.78 (0.74 a 0.91) para la VFI. La medición de flujo en el modelo animal se correlacionó significativamente mejor en VPI que en VFI con un índice de correlación de Pearson (95% IC) de 0.88 (0.58-0.97) vs -0,34 (-0,31 hasta 0,44). p <0,001. Conclusión El VPI muestra una correlación más fuerte con el flujo sanguíneo fetal real que el VFI, actualmente en uso, y futuros trabajos e inversión en este sentido están claramente justificados.


xi
Prologue Measuring Fetal Blood flow has been always an elusive matter. Diverse attempts to
represent this physiological phenomenon have been done in the last thirty years without
achieving an acceptable accuracy. The weakest point in the previous assays relies on
the limited clinical utility of the techniques employed. When using pulsed Doppler and
two dimension ultrasound, the repeatability of the measurement was low indeed and the
technical skills required from the expert taking the measurements were extremely high,
Previous reports have pointed to the potential of two dimensional power Doppler signal
and some research teams developed the so-called Fractional Moving Blood Volume
(FMBV) algorithm. Its representation of moving particles and its quite acceptable
repeatability made this tool a promising opportunity for approaching to circulatory
changes in the fetus, at least in the regional vascularity during a given situation.
Nevertheless, the limited information provided by two dimensional still images made
the limitations of the tool prohibitive as for being considered as a clinical application.
Similar limitations were found when using three-dimensional ultrasound and power
Doppler. Several Indexes were designed and validated as true representations of both,
vascularization and flow. However, any attempt to give a clinical meaning to these
measurements has been unsuccessful.
The main limitation to al those previous uses of the power Doppler signal ahs been the
impossibility of a signal normalization process. In the case of FMBV, it has been
described something alike, but the essential limitations under the image caption made
the process inefficient and the individual variability of the registers an insurmountable
boundary for this tool. In the case of 3D indexes, there is simply no way for a signal

xii
normalization. Therefore the individual variability is so wide than even few seconds
between one caption and the next in the same patient can vary dramatically. Also, as we
have tested and mentioned in the present thesis, these indexes vary in a remarkable way,
when using different machines in the same patient and clinical conditions.
This is a new attempt focused mainly in using a frame sequence as the base for a
normalization process, assuring that small variations in the signal process become less
important and true variations in the signal intensity could be reliably registered. In the
next pages, the author pretends to probe how this variation in the register and
interpretation of the signal might be a breakthrough in the non invasive study of
physiological and pathological conditions of the fetal circulation.


xiv
Index
Pàg.
Abstract ..................................................................................................
viii
Resumen……………………………………………………………… ix
Prologue................................................................................................ xi
List of figures....................................................................................... xvi
List of equations..................................................................................... xvii
List of tables…………………………………………………………… xviii
1. Backgrounf of the tool ...................................................................... 2
1.1. Three-dimensional ultrasound and Power Doppler ..................... 2
1.2 Three-dimensional power Doppler and vascular indexes………… 7
1.3 The signal normalization problem and its consequences…………. 15
1.3.1 The biases behind the algorithm........................................ 17
1.4. The regional normalization solution.............................................. 18
1.4.1. the ductus venosus shunting as an example………..…. 19
1.5. Four dimensional power Doppler signal and flow estimation…… 27
1.5.1 The addition of a time sequence...................................... 27
1.5.2 The dynamic tissue perfusion model................................. 36
2. The Fetal Circulation ........................................................................ 47
2.1. Subtle changes with huge consequences….................................... 47
2.1.1. The normal patterns……………………………………. 47
2.1.2. The suspected changes…………………………………. 69
2.2. How we know what we know? ………..….................................... 77
2.1.1. The experimental models………………………………. 77

xv
3. The Experiment
3.1. Materials and Methods….................................... 79
3.1.1. The Cardiac Output Model…………………………… 79
3.1.2. Mathematical approach to phenomenon..…………….. 81
3.1.3. The In-Vitro test ……………………………………… 91
3.1.4. The In-Vivo test ………………………………………. 101
4. Results 106
4.1. flow quantification….................................................................... 106
4.1.1. In –vitro testing…………………………..…………… 106
4.1.2. In-vivo testing..……………………………………….. 118
5. Discussion …………………….…………………………………. 130
5.1 how much of a breakthrough …………………………………… 130
5.2 Potential Future Uses…………………………………………….. 132
5.4 Conclusion ………………………………………………………. 133
5.5 Disclosures ………………………………………………………. 133
References.............................................................................................. 134
Annexes ......................................................................................... 134

xvi
List of figures
Pàg.Fig. 1. 3D PD angio mode of intracraneal blood flow................................. 6Fig. 2. 3D PD angio mode of Willis polygon...................................................... 10Fig 3. 3DPDangio mode of placental vascularisation…………………………. 12 Fig 4 3DPD angio mode of thyroid gland ……………………………………. 14 Fig 5 3DPD images obtained from a single fetus …………………………….. 16 Fig 6 VFI measurement in abdominal umbilical vein ………………………… 23 Fig 7 Lineal regression plot comparing DVS measurement and VFI …………. 25 Fig 8 Box plot od DV/UV VFI ………………………………………………… 26 Fig 9 Reproduction of STIC VOCAL cardiac output calculation ……………... 35 Fig 10 Example of spatially angle corrected flow measurement ……………….. 38 Fig 11 A significant reduction in fetal perfusion in FGR ………………………. 41 Fig 12 Example of DTPM of basal gamglia in a newborn …………………… 42 Fig 13 Schematical depiction of a horizontaly cut vessel ………………………. 46 Fig 14 Pathways of the Fetal circulation ………………………………………… 68 Fig 15 Screen snapshot of descending aorta …………………………………….. 83 Fig 16 Color deconvolution algorithm ………………………………………… . 84 Fig 17 Screen snapshot of the VOI in descending aorta …………………………. 88 Fig 18 Color deconvolution palette as delivered by the software ……………….. 89 Fig 19 Cardiac cycle values as obtained from the sequences …………………… 90 Fig 20 The flow phantom and test device components …………………………. 92 Fig 21 Linear plot form obtained vectorial velocities …………………………... 108 Fig 22 Linear regression plot from VV values and actual velocities ……………. 109 Fig 23 Quadratic regression plot of VFI ………………………………………… 110 Fig 24 Bland Altman plot for intra-Observer variability of VPI ………………... 111 Fig 25 Bland Altman plot for inter-Observer variability of VPI ………………... 112 Fig 26 Bland Altman plot for intra-Observer variability of VFI ………………... 113 Fig 27 Bland Altman plot for inter-Observer variability of VPI ………………... 114 Fig 28 Linear regression plot of VPI compared to actual flow ………………….. 116 Fig 29 Linear regression plot from VV values and actual velocities ……………. 120 Fig 30 Quadratic regression plot of VFI ………………………………………… 121 Fig 31 Bland Altman plot for intra-Observer variability of VPI ………………... 122 Fig 32 Bland Altman plot for inter-Observer variability of VPI ………………... 123 Fig 33 Bland Altman plot for intra-Observer variability of VFI ………………... 124 Fig 34 Bland Altman plot for inter-Observer variability of VPI ………………... 125 Fig 35 Linear regression plot of VPI compared to actual flow ………………….. 126 Fig 36 Linear regression plot of VFI compared to actual flow ………………….. 127

xvii
List of equations
Pag Eq. 1. Vascularization index algorithm 8
Eq 2. Flow Index algortihm 9
Eq 3 Vascularization Flow algorithm 9
Eq 4 Vascularization Flow deconvolution 10
Eq 5 VFI index 19
Eq 6 Flow through umbilical vein 20
Eq 7 Ductus venosus flow estimation 20
Eq 8 Ductus Venosus Shunting 20
Eq 9 ductus venosus 3D PD shunting estimation 24
Eq 10 Flow formula Gaussian formula 28
Eq 11 Flow formula Kripfgans formula 29
Eq 12 Modified SIVV formula 30
Eq 13 Local velocity estimates 31
Eq 14 Random time increments expression 31
Eq 15 Integration surfaces algorithm for SIVV 32
Eq 16 Volume calculation algorithm in VOCAL 33
Eq 17 Cardiac output values 34
Eq 18 Flow estimation over a cut vessel 44
Eq 19 Flow estimation over a cut vessel (2) 45
Eq 20 Flow calculation Pascal formula 81
Eq 21 Profile of the cross sectional area 81
Eq 22 Velocity profile of the signal 82
Eq 23 Matrix of vectorial velocities 82
Eq 24 Flow calculation 85
Eq 25 Fourier sequence 85
Eq 26 Time average sequence of vectorial velocities 86
Eq 27 Vectorial velocity profile 86
Eq 28 Velocity adjusted values 87
Eq 29 Velocity values within the VOI 99

xviii
List of tables Pàg.Table 1. Results from comparing similar ROI in three different machines .. 18
Table 2. Combined cardiac Output and distribution in the Human Fetus 62
Table 3 Summarized results of repeatability of VPI and VFI
Table 4 Summarized correlation indexes for the VPI and VFI
115
117
Table 5 Summarized results of repeatability of VPI and VFI
Table 6 Summarized correlation indexes for the VPI and VFI
126
129


2
Chapter 1. Background of the tool 1.1 Three Dimensional Ultrasound and Power Doppler
Three-dimensional Ultrasound (3DUS) has grown quick and constantly for
the last fifteen years. These notwithstanding, some of their clinical uses
remain, in best of cases, to define. Three-dimensional Power Doppler
(PD) is based in both, its ability for registering the signal amplitude of the
ultrasound wave, which allows depicting most of moving particles in a
given Region of Interest (ROI) and the three-dimensional US principles,
which allow collecting signal from such particles in a given Volume of
Interest (VOI). The addition of a time sequence or a Space-Time Image
correlation (STIC) algorithm developed and made available by some US
machines add the additional possibility of following the signal evolution
during a pre-established lap. At the beginning, this promising tool was
used to evaluate vascularisation and perfusion in a series of foetal organs,
finding neither adequate accuracy nor repeatability. Nowadays, its use is
seriously restricted to certain foetal conditions but new research on this
topic is ongoing and further uses for this technology are being unveiled.
As largely known (Burns 1992), there are compelling scientific and medical
reasons to seek measuring the volumetric flow rate, which means to
estimate the volume of flow delivered per minute to a tissue bed. No

3
doubt, the success in delivering oxygen and nutrients to the tissues
depends, mainly, on the amount of blood delivered to such tissues per unit
of time. At the beginning of the Doppler ultrasound era, a number of
attempts for achieving this calculation were done (Gill 1979; Eik-Nes et al.
1982; Sauders et al. 1980). The standard method for estimating volume
flow using sonography consisted of multiplying the mean spatial velocity
by the luminal cross-sectional area. However, it is well known that this
technique has many problems. These include inherent variability of vessel
geometry, assumptions about flow profile, 1-dimensional sampling, and
other important technical limitations derived from the way pulsed and
spectral Doppler signal are registered, and an unsustainable amount of
human interaction in the final estimation (J M Rubin 1999). All of that made
those efforts to fail and lead this pretension to be forsaken for two
decades.
Then, it was described the experimental analysis of the Doppler Effect
altogether –taking into account the amplitude of the wave- and tracking the
acoustic speckle pattern produced by the echoes from moving blood (J M
Rubin et al. 1994; Forsberg et al. 1995; Harrington et al. 1996; J M Rubin
1999). From those initial approaches, it was developed the concept of
Fractional Moving Blood Volume (FMBV) (J M Rubin et al. 1997) which
was mainly a mathematical normalization process of the colour pattern

4
obtained from the power Doppler signal acquisition (Tomas Jansson et al.
2003; A Welsh 2004). Preliminary publications established a direct
relationship between the data from FMBV acquired by registering the
power Doppler signal in a given Region of Interest (ROI) and actual
perfusion of the tissue as measured by invasive methods in animal models
(E Hernandez-Andrade, T Jansson, et al. 2004; E Hernandez-Andrade,
Thuring-Jönsson, et al. 2004). Recently, it has described how, in certain
pathological fetal conditions such as fetal growth restriction, some
perfusion patterns are objectively altered and significantly differ from
“normal” patterns established by the authors (E Hernandez-Andrade et al.
2008; Rogelio Cruz-Martinez et al. 2009; R Cruz-Martinez, F Figueras, E
Hernandez-Andrade, et al. 2011).
Nonetheless, there are still enormous gaps between the information
obtained by FMBV and real estimations of either flow or perfusion (A
Welsh 2004; Lai et al. 2010). Frontiers that will limit insurmountably the
utility of this technique, such as the low repeatability when comparing one
patient with the same in a better acquisition setting or one patient with
difficulties for exploration like obese or anxious mothers to a normal one.
Additionally, it will be impossible to relate such magnitudes with flow when
there is no time frame considered in the image quantification process (A.
W. Welsh et al. 2005; Aw Welsh et al. 2012).

5
No additional experience in this technique has been published and very
likely it will not in the future. The next logical step would be to evaluate the
possibilities of three dimensional ultrasound and power Doppler as an
alternative approach to this phenomenon(Lai et al. 2010; Heck et al.
2012).

6
Fig. 1. Three dimensional PD angio mode rendering of intracranial blood
vascularisation in a term fetus

7
1.2. Three-dimensional power Doppler signal and the vascular
indexes
Three-dimensional power Doppler (PD) became available for medical
purposes towards the end of the last century (Fenster et al. 1998; Z. Guo
et al. 1998). Its advantages, considering the higher sensitivity of the PD for
detecting, and therefore depicting, moving particles, its first use was to
evaluate vascularisation in compromised regions, trying to elucidate
whether there was an obstruction or not in a given vessel (Z. Guo &
Fenster 1996). Considering its potential for depicting accurately vascular
structure, it was employed as a tool for measuring potentially angiogenic
structures as tumours (Bendick et al. 1998; Kupesic & Kurjak 2000). Also
its potential for depicting vascular architecture and potential anomalies has
been considered as promising (Fig 1) (Heling et al. 2000; Chaoui &
Kalache 2001)
Nevertheless, the information given by this technique was rather limited,
considering there was no quantification of the signal and no objective
measurements would be done. Then, it was developed a mathematical
algorithm, firstly used in gynecology, by the way(J M Rubin 1999;
Pairleitner et al. 1999); based on the possibility of a direct correlation
between PD signal intensity and, somehow, the velocity of the particles

8
and the possible quantification of moving particles in a Volume of Interest
(VOI) over the amount of grayscale, B-mode, particles in the same VOI. It
were developed three indexes which, indirectly, could give a mathematical
expression of vascularisation and flow:
*Vascularization index (VI) = color voxels/(total voxels − background
voxels)
(1)
Where g= gray-scale value in the US image, normalized to 0-100: lowest
intensity= 1; highest = 100
c= color value in the US image from power Doppler signal
representation. Normalized to 0-100: lowest intensity= 1;
highest = 100
hg(x) = frequency of gray-value x in US image
hc(x) = frequency of color value x in US image
*Flow index (FI) = weighted color voxels/color voxels

9
(2)
*Vascularization–flow index 1 (VFI) = weighted color voxels/(total voxels
background voxels)
Based on the above mentioned indexes, a number of research
communications have been produced, evaluating the vascularity of
benign versus malign ovarian (Kurjak et al. 1998; Juan Luis Alcázar &
Jurado 2011) and prostatic (Moskalik et al. 2001) masses. Regarding
the feto-placental unit, several attempts to correlate those indexes with
regional perfusion of brain (Hayashi et al. 1998; Nardozza et al. 2009),
liver (C.-H. Chang et al. 2003), lungs in normal (Dubiel et al. 2005) as
well as pathologic conditions (Ruano et al. 2006). However, the clinical
efficacy of this method remains unsupported by the evidence. No
clinical estimations can be done from those values so far. (Fig 2)
(3)

10
Fig. 2. Three dimensional PD angio mode rendering of intracranial blood
vascularisation in a mid-trimester fetus with suspected brain sparing. In
the right lower corner it is possible to visualize the histogram with the
indexes obtained from the spehere-VOI

11
A promising field, still open to research is the analysis of placental
vasculature and its potential relationship to placental dysfunction (Nia W
Jones et al. 2011). Some authors have found a positive correlation
between low vascularisation indexes in early pregnancy and Fetal Growth
Restriction (FGR) (Bozkurt et al. 2010; Dar et al. 2010; Guimarães Filho
et al. 2011; Morel et al. 2010; Negrini et al. 2011; A. O. Odibo et al. 2011;
Pomorski et al. 2011; Rizzo et al. 2009). It seems that the evaluation of
first trimester placental vascularisation correlates, somehow, with a
compromised placentation and therefore could predict some adverse
perinatal outcomes of placental origin. Besides, the technique exhibits
quite a good repeatability and accuracy (Tuuli et al. 2010; Martins & N J
Raine-Fenning 2010; Yigiter et al. 2011).
The challenges for the future go through overcoming some of the technical
problems three dimensional PD is plagued with and to establish an
adequate normalisation protocol, which is lacking nowadays. (Figure 3)

12
Fig. 3. Three dimensional angio mode rendering of placental
vascularisation in a pre-eclampsia patient. Quantificaction of vascular
branches suggest a lower flow in the corial plate when compared to
volumes taken at the same gestational age from normal gestations.

13
Another promising approach, recently attempted, is to use 3D PD for the
evaluation of progressive fetal conditions such as fetal goitrous
hypothyroidism (Marín et al. 2010): In a given patient, under well controlled
conditions, it should be possible evaluating the progression of ,either, an
inflammatory response or the success of the treatment, which was thyroid
hormone supplementation in this case. (Fig 4).
Despite being rather promising, the 3D PD still has important limitations,
some related to the power Doppler signal itself and some derived by
acoustic impedance and mechanical interference. Some of these aspects
are going to be discussed further in the next section.

14
Fig. 4. Three dimensional PD angio mode rendered image of Thyroid
gland of the same human fetus, before (left side) and after four weeks of
intra-amniotic thyroid hormone supplementation (right side). Actual volume
of the gland changed according to fetal growth, but vascularisation
decreased markedly after treatment.

15
1.3 The signal normalization problem and its consequences
To normalize the 3D PD signal, it is necessary to take into account three
paramount boundaries:
- The signal can be altered by tissue impedance, which means that a low
velocity flow in a deep vessel will produce completely different PD
patterns depending on the mother’s abdominal wall thickness, the
amount of amniotic fluid and the position of the fetus (Schulten-Wijman
et al. 2011).
- The settings of the machine can modify sensibly the amount of signal
registered by the processor, and therefore, the amount of color voxels
inside the VOI: the algorithms for refining the B-mode signal like the
speckle reduction or the cross beam reduction post-process algorithms
mask the signal processed and “erase” a significant amount of moving
particles. (N J Raine-Fenning et al. 2008b)
- The post-processing software provided by the developers of the
Volume Measurement software: 4DView and virtual organ computer-
aided analysis (VOCAL®) by General Electric Medical division. Q-lab®
by Philips Medical Division, as well as Sonoview® and Histogram by
Samsung-Medison Co show no correlation in their measurements.
Therefore, the same structure, under similar circumstances, draw off

16
different results once measurement of the VOI is performed. (J L
Alcázar 2008)
Fig. 5. Images obtained from a single fetus in cephalic presentation, from
three different machines: General Electric Voluson E8 (Upper); Medison
Accivix V20 Prestige (Middle); Philips iU22 (Lower).

17
1.3.1. The biases behind the algorithm
Based on previous observations, we conducted a preliminary study, on
five healthy fetuses on their 20th week of gestation, comparing the values
obtained in the same fetus with different machines and adjusting settings
as main gain in 600 Hz, medium wall filter in 60 Hz, cross beam reduction
off and persistence of color signal in 0. In all of them the structure was the
Willis’ polygon at the cranial base. Figure 5 shows the images obtained
from the machines and the histograms.
The results, summarized in the table 1, show how different the
measurements are, depending on the brand, and also how they differ
among themselves, despite the same gestational age and similar maternal
characteristics.

18
Fetus GE Voluson E8 Philips iU22 Medison Accuvix V20
VI FI VFI VI FI VFI VI FI VFI
1 44.9 46.1 20.7 32.3 25..1 33.5 48.6 16.9 5.5
2 14.1 39.8 5.6 16.6 28.3 9.5 39.4 21.1 8.3
3 23.6 51.1 17.3 36.2 17.3 19.5 42.5 28.1 4.7
4 36.3 38.9 21.3 27.3 32.8 11.1 25.8 40.3 19.2
5 37.3 44.0 9.5 48.1 27.3 13.1 35.8 39.9 6.9
Table 1. Results from comparing similar ROI in three different machines
when using the PD quantification application included in their software.
In conclusion, normalizing the data from 3D PD signal is currently not
possible and reference ranges to discriminate normality from pathologic
conditions are not available. Therefore, no feasibility for these indexes in
obstetric clinical practice could be foreseen at short term. (Aw Welsh et al.
2012)
1.4 The regional normalization solution
Given that, no decisions can be made from direct measurement of the
abovementioned indexes, a possible approach could be to use two

19
Regions of Interest (ROI) inside the same volume. The more reliable
possibility after in-vitro testing was the VFI (N J Raine-Fenning et al.
2008a). And the easier and more repeatable formula was a simple VFI
index
VFI1 /VFI2 (5)
1,4.1 The ductus venosus shunting as an example
In phisiological conditions, few regions of fetal circulation could offer
enough regional differences as fro being considered clinically relevant.
But the most important of them is, no doubt, the physiological shunt in the
ductus venosus which is not only a reliable indicator of preload, but also a
sensitive mechanism of circulatory re-distribution in adverse circulatory
conditions such as placental insufficiency (M Bellotti et al. 2000; T Kiserud
2001) .
The original description of Ductus Venosus Shunting (DVS) measurement
was published by Belloti (Maria Bellotti et al. 2004), and was, simplifying,
an index of estimated flow through Ductus Venosus (DV) over the one
through Umbilical Vein (UV)

20
The classical way for estimating the flow through th UV is
(6)
Also, the calculation of DV flow, made by Belloti et al, is
Therefore, the DVS could be expressed as
QDV/QUV· 100 (8)
Description of the ideal technique for measuring blodd flow in both UV and
DV has been precisely described (M Tchirikov et al. 2006). For UV blood
volume flow measurement, a straight segment of the intra-abdominal part
of the UV upstream of any hepatic branches should be selected, with the
Doppler gate positioned so as to completely cover the vessel’s diameter.
The UV flow volume can also be measured in the umbilical cord. Authors
suggest measuring blood flow volume following the ‘maximum principle’,
(7)

21
which aims to determine the maximum diameter of the vessel, the
maximum intensity weighted mean velocity (or time-averaged mean
velocity, TAV) at the maximum vessel length in a straight longitudinal
section. The inner vessel diameter is determined to the nearest tenth of a
millimeter by placing the calipers at right angles to the vessel axis on a
frozen B-mode image (without color). This is followed by the TAV
measurement at the same vessel portion with a small angle of insonation
(less than 30). The blood volume flow rate is calculated from diameter (D)
and TAV as flow rate = TAV × ð × (D/2)2 mL/min. Regarding the DV, The
inner diameter of the DV should be measured by insonation perpendicular
to the vessel wall at the isthmus. In order to reduce random error, the
procedure must be repeated four or more times and the calculated mean
diameter entered into the statistics (T Kiserud et al. 2006). Doppler
evaluations must be carried out in the absence of fetal breathing and body
movements.
As evident, the skills needed for achieving such measurements are
prohibitively high; the time needed for every exploration is too long for a
usual clinical exploration and the medical scope of this practice is quite
reduced. Our proposal to address this issue is a far simpler, faster and
repeatable approach, by using 3D PD.(BelloMuñoz et al. 2009)

22
By taking a single volume of the fetal abdomen in Angio 3D PD mode, it
was possible to measure the UV VFI by calculating it into a 1 cc sphere.
After navigating through the volume, same measurement (DV VFI) was
done in the DV, employing the same 1 cc sphere (Figure 6 summarizes
both measurements)
Our study compared 162 volumes from normal fetuses and 36 from Fetal
Growth Restriction (FGR) cases. In all of them we measured the DVS as
described classically by Belloti et al (M Bellotti et al. 2007), and collected a
volume of the fetal abdomen with 3D PD angio mode signal, always
adjusting the same settings in the machine (General Electric Voluson E 8
GE Medical Systems Milwaukee USA) with a 3D RNA5-9-D Volume
Convex Array Transducer Probe.

23
Fig. 6. VFI measurement in abdominal umbilical vein (upper) and in ductus
venosus (lower). As the size of the sphere is exactly the same, the VOI
remains unchanged.

24
The calculation of the DV/UV VFI ratio was as simple as:
DV VFI/UV VFI. · 100 (9)
We found a significant positive correlation between DVS measured as
described by Belloti et al and DVS measured as a ratio of DV/UV VFI
(Figure 7)
Also, as previously described, we found a significant difference in DV/UV
VFI ratio between normal and FGR fetuses. Comparing results in growth
restricted fetuses showed difference as plotted by gestational age mean
(SD):39 (11,5) and 53(16,8) (p = 0,03). (Figure 8)

25
Fig. 7 Lineal regression plot comparing the DVS measured as classically
described and the DV/UV VFI ratio r value = 0.81 P<0.001
Reference ranks equation y = 0,6766 + 1,6542 x + -0,007813 x2

26
Fig. 8 Box Whisker plot of DV/UV VFI ratio comparing normal (left) to
IUGR fetuses (right)

27
1.5. Four-dimensional power Doppler signal and the
estimation of flow
1.5.1 The addition of a time sequence
Since the solution provided is already limited and only allows to estimate
some regional changes in vascularity, applicable perhaps to the
abovementioned DVS and to placenta (Odeh et al. 2011), but is still far
away from depicting the flow phenomenon; it is necessary to move
forward, towards two recently opened gates:
First is the integration of power signal derived velocities profile, which
most reliable approach is the Surface Integration of Velocity Vectors ,(Sun
et al. 1995; J M Rubin et al. 2001; S. Berg et al. 2000) a clarifying concept
which was developed for Color Dopler signal analysis, but has the
handicap of the angle effect (Pemberton et al. 2005; X. Li et al. 2005),
reason why it was left aside. Until the algorithms for calculating velocity of
particles from power Doppler signals were developed (M. G. Jones et al.
2003; Kripfgans et al. 2006; Petersch & Hönigmann 2007)

28
Surface integration of velocity vectors is based on Gauss’ theorem, which
relates the divergence of the quantity (v) in an enclosed volume (V) to the
flux through the surface (S) covering (V). In other words, a surface
integral of v over the enclosing boundary S will yield the volume flow Q:
(10)
The easiest way to implement SIVV is to choose a surface that is locally
perpendicular to each Doppler beam. For this case, the right side dot
product in Equation 1 will be replaced by a regular multiplication of the
Doppler velocity and the size of the surface element. In other words, this
surface has a constant depth geometry with respect to the Doppler beams.
(Kripfgans et al. 2006)
The most general scanning geometry is the surface of a torus because the
center of rotation for the axial-lateral and axial-elevational beams can
differ). Volume flow can be computed by integrating all Doppler
acquisitions on the defined surface, as expressed by Kripfgans et al:

29
(11)
Where, Q is the total flux through the surface S, which equals volume flow;
vi is the local Doppler
velocity; ai is the associated cross-sectional area on S for this voxel, and ·
is the dot product between the local velocity vector and the local surface
normal. In this case, the detected velocity is parallel to the surface normal.
In Kripfgans et al experiment, for the depicted type of tube-to-transducer
orientation, the left-/right-most Doppler beam has the smallest/largest
Doppler angle, respectively. This causes the velocity maximum to shift
toward the left. However, warping of velocity values does not affect the
measured SIVV value. Inherent compensation of this warping is due to
nonuniform distribution of surface elements over the tube cross section.
A very important matter, mainly derived from biophysical characteristics of
blood is the Rouleaoux’ effect (J M Rubin et al. 1997; A. W. Welsh et al.
2005; N J Raine-Fenning et al. 2008a). The local Doppler power is largest
inside the vessel and smallest outside because of the effect of partial
volume averaging and the Doppler wall filter effect, which gives the pixels
inside the vessel a higher power. All Doppler data is wall filter processed

30
internally in the scanner by the smallest setting possible on the machine.
Therefore, it is mandatory to minimize filtering for the selected Doppler
frequency range.
Authors define a solution for surface integration of velocity vectors, which
was weighted on the basis of the Doppler power in the respective voxels.
A velocity masking algorithm which was generated, using the Doppler
power value pT to weight the velocity values of the integration surface.
Therefore, the modified SIVV method that was used by the authors was
(12)
Where, pi is a scaling factor based on the local Doppler power. Power
weighting factors pi were set to 1 for all Doppler powers larger then pT.
Values between 0 and pT were scaled between 0 and 1 on the basis of
their Doppler power value. The justification for the selection/scaling
process is that voxels near the wall, which partially contain flow and soft
tissue, will show lower than- maximum Doppler power. Fractional power is
therefore weighted by fractional scaling factors. So far, the threshold
pTwas set empirically by developers. However, it was set constant for all

31
measurements, and it could be shown that the pT contour fills the lumen.
User-selected Doppler gain was adjusted as needed to compensate for
signal reduction due to large angles between flow and Doppler beams.
Next addition to the conceptual framework was the estimation of pulsatile
conditions by Richards and Kripfgans (Richards et al. 2009), by adding to
the model the potential signal fluctuations derived from the wall
movements and the local velocity profile changes derived from particles
acceleration. As a first issue, authors defined the possibility of collecting
not one, but N number of velocity profiles according to the local variations
in time and position. Such local velocities were expressed as:
(13)
Where E(vi(Xi)) is the expected value of the local velocity estimates.
v(Xi,tj) are the local velocity estimates that are measured at randomly
selected time increments defined by tj asfollows:
(14)

32
Authors defined an experiment to obtain the average volume flow in the
presence of pulsatility: 50 random time points distributed across the
equivalent of a cardiac cycle were collected and averaged at each
location. Power Doppler data were then used to correct for partial volume
effects as described in the previous paragraph. Then, using seven
previously defined surfaces for flow estimate, the equation for the
modified SIVV method, became:
(15)
where M is the number of integration surfaces and the surface of
integration (S) has been
modified to include the M surfaces (SM).
In our opinion, Richards & Kripfgans’ works have achieved a breakthrough
in this matter, and the experiment we have developed is nothing but a
logical consequence of their postulates.
Before describing the experiment, next consequent step was to add a
regular time frame to the algorithm. Fortunately, the tool for getting the
initial data was already developed and seated on the machine: The Spatio

33
Temporal Image Correlation ( STIC) is an automated volume acquisition
in which the array inside the transducer housing performs a slow, single
sweep, recording one single 3D data set. This volume consists of a high
number of 2D frames, one behind the other. Due to the small region of
interest required to image the fetal heart, the B-mode frame rate during the
acquisition of the volume scan is very high, in the range of 150 frames/s.
Assuming a volume acquisition time of 10 s and sweeping over an area of
25 (both parameters can be adjusted), there are 1500 B-mode images in
the volume memory. During this acquisition time the fetal heart beats 20–
25 times, which means there are 20–25 images showing a systolic peak
contained within these 1500 B-mode frames (DeVore et al. 2003; Chaoui
& Heling 2005). Concerning this application, further studies have shown
how, the mere analysis of intra-ventricular stroke volume in left and right
heart gave information reliable enough for calculating the cardiac output in
fetuses from 16 to 32 weeks (Molina et al. 2008a).
Basis of volume calculation in VOCAL are performed by integration of
polygon areas marked in parallel planes. The method used for the
integration of the polygon areas is given by the formula
(16)

34
Where N = number of marked polygon areas Ai = polygon area in plane i
di,j = distance between plane i and plane j the sort order of planes 1,..., N
is given by d1,2 £ d1,3 £... £ d1,N. (Sohn 1993; Robb et al. 1997).
And the basis for stroke volume calculation and cardiac output calculation
were (Molina et al. 2008b):
CO= (17)
Where CO = Cardiac Output, VS is Systolic Volume and VD is Diastolic
Volume.
The abovementioned approach provides some additional information on
cardiac output and has proven to be repeatible and more accurate than
previous methods (Messing et al. 2007; Hamill et al. 2011; Simioni,
Nardozza, Araujo Júnior, Líliam Cristine Rolo, et al. 2011).
Notwithstanding, it still has a substantial amount of human interaction, and
is rather time-consuming as for being used in an actual clinical setting.

35
x
Fig. 9. Reproduction of STIC and VOCAL model for left ventricle output
calculation in a term ovine fetus, taken by the authors during their
experiment (BelloMuñoz et al. 2010); as proposed by Molina et al.

36
1.5.2. The Dynamic Tissue Perfussion Model
The foetal perfusion has to meet the needs of the rapidly growing
organism, to deliver oxygen and nutrients in order to permit a normal
intrauterine growth. Among other causes placental insufficiency is an
important reason for disturbed intrauterine growth, resulting in intrauterine
growth retardation (IUGR) and postnatal complications. The evaluation of
foetal perfusion today is based in daily practice on the calculation of RI
and PI in large arteries, mainly the umbilical, the cerebral arteries and the
aorta, sometimes supplemented by flow pattern evaluations in the venous
duct attempts tried to quantify the umbilical venous flow volume with the
aim to evaluate the foetal perfusion in quantitative terms . These studies
were not continued because of limited reproducibility . Nevertheless, these
studies targeted at a parameter – volumen flow –, which has a much better
rationale than the popular and easy to measure RI and PI.
The early studies were flawed mainly by two limitations, which could not
be overcome with two-dimensional sonographic techniques. First the angle
correction of flow velocity in space and second the non-circular shape of
the transection of the umbilical vein (UV).
Spatial angle correction is but pivotal in this setting, because the UV is
continuously winding around the umbilical arteries and the whole cord is

37
irregularly bent within the amniotic cavity. Two-dimensional images thus
may allow an angle correction within the frontal plane but this can be
vastly misleading. Depending on the sagittal angle the true and only
relevant spatial angle can differ substantially thus leading to unpredictable
errors of the volume flow calculation, when unknown. The second source
of error was the universal assumption, that the UV is a round tube. The
investigators tried to depict a straight running venous segment with parallel
borders to apply the formula for circular area calculation in order to
multiply this area with the mean flow velocity which was traced with a
pulsedwave- Doppler instrument in the centre of the vein.
These sources of error combined in an unpredictable manner and caused
the refusal of this approach.
The technique of DTPM combined with the modern three-dimensional
imaging techniques can resolve all of these imponderabilities. We
developed the three-dimensional, spatial angle corrected umbilical vein
flow volume measurement, which is outlined below.
In this plane both velocity as displayed by a certain colour hue and shape
of the vessel’s cross section are distorted by a stretching factor which is
equal to the cosine of the spatial angle between vessel’s course and the
ultrasound waves’ propagation line – the so called Doppler angle α. While
the area is stretched by the reciprocal of cos α the velocity is virtually
reduced by the by multiplication with cos α

38
Fig. 10. Example of a spatially angle corrected fetal volume flow
measurement in the umbilical vein. A 3D-dataset is shown displaying three
perpendicular imaging planes. The horizontal plane is used for DTPM
(right lower quarter): False color map of the venous flow.
Therefore, direct calculation of true flow volumes directly from
measurements within the horizontal plane is possible.. The reproducibility
of these measurements in a clinical situation lies in the range of around 6
% and less, if exclusively data with steep spatial Doppler angles are
allowed

39
A significant correlation of such volume flow measurements with fetal
weight could be demonstrated that was the better the steeper the spatial
angle could be arranged. Moreover, in a preliminary study a significantly
diminished flow volume per gram fetal weight could be shown
DTPM offers a universally applicable approach to tissue perfusion
measurement as far as sonographic depiction of tissues is possible. So
far, inaccessible details of perfusion intensity, perfusion distribution,
perfusion gradients within a certain vasculature open a widow to an
individualized evaluation of the specific pathophysiological situation.
Treatment efforts can be evaluated according to their effect on perfusion.
Besides these intrinsic advantages, the technique requires no additional
hardware, is non-invasive, needs no specific preparation of the patient and
thus can be recommended for a broad array of clinical applications.
True volume flow calculation becomes feasible with three-dimensional
colour Doppler data. True volume flow calculation means the exact
calculation of the blood flow volume running through any vessel which is
cut perpendicularly.
The method of true volume perfusion measurement in vessels cut by the
horizontal plane in any spatial angle is described and proven below. The

40
spatial angle, which is the angle between the vessel and the ultrasound
propagation line, influences simultaneously the stretching of the shape of
the vessels’ cross-sectional area as well as the change of the recorded
flow velocity. towards the ultrasound propagation line (blue line). The
horizontal imaging plane, which is calculated during the three-dimensional
ultrasound imaging, cuts the vessel. Line a′ is the stretched vessel’s
diameter as it can be seen in the horizontal plane. Vector b is the original
flow velocity within the vessel. Due to the Doppler angle á the recorded
velocity is displayed with the value for vector b’. This means, the color hue
of b’ is darker, representing a lower velocity as if vector b would be
displayed in its appropriate color. This is the well known Doppler effect ( fd
=2∗ fo∗vt c ∗cos α) , which reduces the recorded velocity according to
the cosine of á.

41
Fig. 11. A significant reduction of fetal perfusion per gram fetal weight
could be demonstrated by DTPM in fetuses with intrauterine growth
retardation (IUGR) compared to normal children

42
Fig. 12. Example of a DTPM of basal ganglia in a newborn. Upper part:
false color map of the basal ganglia and distribution curve. Lower part:
Perfusion intensity course during one examination. (Image and
measurement courtesy of Dr. Ricardo Faingold, Montreal)

43
The real flow volume per time (V) of a circular vessel is calculated as
calculates the circular area of the perpendicularly cut vessel
V t = ð 4 ∗a∗a∗b
// ð 4∗a∗a
The oblique transsection of a round vessel, a vessel running not
perpendicularly towards the horizontal plane, results in stretching of the
circular vessel’s round cross-sectional area in the direction of the
projection vector of the spatial angle of this vessel with the horizontal
plane. This results in an ellipse which longer axis is represented by a′ , the
stretched projection of a onto the horizontal plane (Fig. 30). The shorter
axis is equal to the original diameter of the vessel. It remains unstretched
since no angulation occurs. It is therefore possible to consider the change
of diameter a towards a′ , the long axis of the ellipse in order to describe
the change of the horizontally projected cross-sectional area of the vessel.
The change of the circular area towards the elliptical area is thus equal to
the stretching factor a′ a.
The other relevant change is the reduction on the displayed flow velocity
compared to the original velocity b, the reduction factor is b′ b .

44
It is now claimed, that the flow volume V’ per time, which is passing
through the horizontal
plane in direction of the vessel, calculated by multiplying the elliptical area
(A=ð 4∗a∗a′) (17)
with the flow velocity b’ of the vessel in the horizontal plane is equal to V
per time, the flow volume passing through the perpendicularly cut vessel in
the same time. (18)
The depiction of the horizontally cut vessel shows the velocity b′
and a stretched Wessel diameter a′ .

45
The triangle ABC is rectangular, since the blood vessel is a rectangle, a
perpendicularly cut circular straight vessel. Doppler angle á is
complemented to 90° by the angles DAB and FAC since the ultrasound
propagation line (blue line running through F) runs perpendicular to
the transducer’s surface and thus the horizontal imaging plane. Both
angles are thus equal and named â. Angles FAC and CAB add to 90°
since again the ultrasound propagation line runs perpendicular to the
horizontal imaging plane. Thus angle CAB is á again, the Doppler angle.
(19)
This means, that it is possible to calculate the true flow volume of all
vessels cut horizontally from the depicted flow velocities1 and the
pixelwise calculated cross-sectional areas2 directly, thus compensating

46
any spatial angle. Both measurements (1 and 2), are carried out
automatically by the PixelFlux-software, which delivers thus true flow
volumes of all vessels in any tissue section cut horizontally in three-
dimensional color Doppler ultrasound data
Fig. 13. Schematical depiction of a horizontally cut vessel in a 3D-color
Doppler sonographic dataset

47
Chapter 2. The Fetal Circulation
2.1 Subtle changes with huge consequences 2.1.1. The normal patterns Many of the mechanisms described in animal experiments also occur in
the human fetus, but with differences. The reasons for variation are many,
e.g. a sheep fetus has a different anatomy compared with a human fetus,
with a longer intrathoracic inferior vena cava (IVC), a smaller brain, the
fetal liver is positioned differently, two umbilical veins, a higher
temperature, a lower Haemoglobin (Hgb), a higher growth rate and a
shorter pregnancy. Ultrasound in obstetrics has been used increasingly to
provide physiological data from human fetuses, and this is reflected in the
present review.(Torvid Kiserud & Ganesh Acharya 2004).
The blood volume in the human fetus is estimated to be 10–12% of the
body weight, compared with 7–8% in adults (G. C. S. Smith & A. D.
Cameron 2003) The main reason for this difference is the large pool of
blood contained within the placenta; a volume that reduces as gestation
progresses. The calculated blood volume of 90–105 ml/kg in fetuses
undergoing blood transfusion during the second half of pregnancy is
probably an underestimate (P. Johnson 2000). Other studies have

48
indicated a volume of 110–115 ml/kg, which is more in line with
experimental sheep studies. (Yamamura et al. 2012). The estimated
volume of 80 ml/kg contained within the fetal body is marginally more than
that in adults. Compared with adults, the fetus is capable of much faster
regulation and restoration of the blood volume due to high diffusion rates
between fetal compartments.
Arterial and venous blood pressure
The mean arterial pressure in human fetuses was measured to be
15 mmHg during cordocentesis at gestational weeks 19–21(T. Kiserud
et al. 1994). Intra-uterine recording of the intraventricular pressure in the
human fetus suggests that the systemic systolic pressure increases from
15–20 mmHg at 16 weeks to 30–40 mmHg at 28 weeks.(P. Johnson
2000). There was no obvious difference between the left and right
ventricles. This increase was also seen for diastolic pressure, which was
≤5 mmHg at 16–18 weeks and 5–15 mmHg at 19–26 weeks.
Umbilical venous pressure, recorded during cordocentesis and corrected
for amniotic pressure, increased from 4.5 mmHg at 18 weeks to 6 mmHg
at term (K Flo, T Wilsgaard & G Acharya 2010).
Cardiac performance
Structural details of the heart are organized during the embryonic period
but are dependent on the physical environment, including blood flow, in

49
order to develop normally. The myocardium grows by cell division until
birth, and growth beyond birth is due to cell enlargement. The density of
myofibrils increases particularly in early pregnancy and the contractility
continues to improve during the second half of pregnancy (H. Li et al.
2006). The two ventricles perform differently in pressure/volume curves
and when tested with intact peripheral vasculature (Reller et al. 1987) .The
fetal heart has limited capacity to increase stroke volume by increasing
diastolic filling pressure, the right ventricle even less than the left, as they
are already operating at the top of their function curves. The Frank–
Starling mechanism does operate in the fetal heart, which is apparent
during arrhythmias(Grosse-Wortmann et al. 2006). Adrenergic drive also
shifts the function curve to increase stroke volume. However, increased
heart rate may be the single most prominent means of increasing cardiac
output in the fetus (Hamill et al. 2011; Simioni, Nardozza, Araujo Júnior,
Líliam Cristine Rolo, et al. 2011).
The two ventricles pump in parallel and the pressure difference between
them is minimal compared with postnatal life(Reller et al. 1987). However,
experimental studies show some variation in pressure and velocity waves
between the two sides, ascribed to the difference in compliance of the
great arteries and downstream impedance (upper body vs lower body and
placenta) (Ganesh Acharya et al. 2004) . Some of the ‘stiffness’ of the fetal
myocardium is attributed to the constraint of the pericardium, lungs and

50
chest wall (Torvid Kiserud & Ganesh Acharya 2004; R Cruz-Martinez, F
Figueras, Benavides-Serralde, et al. 2011) ,all of which have low
compliance before air is introduced. However, with the shunts in operation
and a metabolism capable of extracting oxygen at low saturation levels,
the fetal heart appears to be a very flexible, responsive and adaptive
structure. Figure 14 represents schematically the major features of fetal
circulation
Cardiac output and distribution
The fetal systemic circulation is fed from the left and right ventricles in
parallel. The left ventricle is predominantly dedicated to the coronary
circulation and upper body, while the right ventricle is the main distributor
to the lower part of the body, the placenta and the lungs. When using
outer-inner diameter measurements of the vessels, the combined cardiac
output (CCO) is reported to be 210 ml/min at mid-gestation and
1900 ml/min at 38 weeks (Hamill et al. 2011) . A summary of these
measurements could be seen in table 2 (J.-C. Fouron et al. 2009). When
using inner diameters, these numbers are lower. The right ventricular
output is slightly larger than that of the left ventricle, and pulmonary flow in
the human fetus is larger (mean 13–25%) than in the classical fetal lamb
studies (≤10%). Interestingly, a developmental transition in fetal
haemodynamics seems to occur at 28–32 weeks when the pulmonary
blood flow reaches a maximum with a simultaneous change in oxygen

51
sensitivity in the pulmonary vasculature (Ruano et al. 2006; Dong et al.
2011) . Another study found that less blood was distributed to the fetal
lungs (11%) (Mess & Ferner 2010) ,which is more in line with previous
experimental studies.
The three shunts (ductus venosus, ductus arteriosus and foramen ovale)
are essential distributional arrangements that make the fetal circulation a
flexible and adaptive system for intra-uterine life. A classical concept
describes the pathway of oxygenated blood as the via sinistra, leaving the
umbilical vein through the ductus venosus to reach the foramen ovale, left
ventricle and aorta, thus feeding the coronary and cerebral circuits.
Conversely, a via dextra directs de-oxygenated blood from the caval veins
through the tricuspid valve, pulmonary trunk and ductus arteriosus to
reach the descending aorta, largely bypassing the pulmonary circuit.
Oxygen saturation gives a picture of distribution and blending of flows in
the central fetal circulation. The lowest saturation is found in the abdominal
IVC, and the highest saturation is found in the umbilical vein (Ganesh
Acharya & Sitras 2009) . Interestingly, the difference between the left and
right ventricles is only 10%, and this increases to 12% during hypoxaemia.
The small difference between the left and right ventricles is due to the
abundant volume of oxygenated blood presented to the foramen ovale. In
addition to the ductus venosus blood flow, the umbilical blood passing

52
through the liver has had a modest reduction in saturation and represents
another sizeable volume of oxygenated blood flowing in much the same
direction as the ductus venosus towards the foramen ovale. In addition to
some blending, the abundance of oxygenated blood will cause a spillover
to the right side when reaching the foramen ovale with its crista dividens
(limbus) .
Ductus venosus and liver circulation
In the human fetus, the ductus venosus is a slender trumpet-like shunt
connecting the intra-abdominal umbilical vein to the IVC at its inlet to the
heart. The inlet of the ductus venosus, the isthmus, is the restrictive area
with a mean diameter of 0.5 mm at mid-gestation and hardly exceeds
2 mm for the rest of a normal pregnancy (T. Kiserud et al. 1994;
BelloMuñoz et al. 2009; M Tchirikov et al. 2006) .The umbilical venous
pressure ranges from 2 to 9 mmHg (Maria Bellotti et al. 2004; Kaji et al.
2012) (the portocaval pressure gradient), and causes the blood to
accelerate from a mean of 10–22 cm/s in the umbilical vein to 60–85 cm/s
as it enters the ductus venosus and flows towards the IVC and foramen
ovale (M Bellotti et al. 2000; Torvid Kiserud & Ganesh Acharya 2004; G
Acharya et al. 2005) . The blood flow with the highest oxygenation, coming
from the ductus venosus, also has the highest kinetic energy in the IVC
and predominantly presses open the foramen ovale valve to enter the left

53
atrium, i.e. the ‘preferential streaming’ described in animal studies(M
Tchirikov et al. 2006).
While 30% of the umbilical blood is shunted through the ductus venosus at
mid-gestation, this fraction is reduced to 20% at 30 weeks and remains so
for the rest of the pregnancy, but with wide variations. These results are
similar to those of another study (Kaji et al. 2012) ,but are at variance with
experimental animal studies, admittedly using a different technique, which
showed that approximately 50% was shunted through the ductus
venosus(M Tchirikov et al. 2006; M Bellotti et al. 2007; BelloMuñoz et al.
2009) The redistributional mechanisms of increased shunting during
hypoxaemia described in animal experiments also seem to operate in the
human fetus (Edelstone & Rudolph 1979; Rudolph 1985; van Cappellen
et al. 1999)
The ductus venosus is under tonic adrenergic control, and distends under
the influence of nitroxide and prostaglandins (P. Vallance et al. 1989; D. J.
Williams et al. 1997) .The most extensive dilatation is seen during
hypoxaemia, leading to a 60% increase of the diameter in fetal sheep.
However, the changes in diameter are not restricted to the isthmus but
also include the entire length of the vessel, which has a far greater impact
on resistance (Maria Bellotti et al. 2004). The shunt obliterates within 1–3
weeks of birth in term infants, although this takes longer in premature

54
births and in cases with persistent pulmonary hypertension or cardiac
malformations (Baez et al. 2005; Borrell et al. 2003) . In contrast to the
ductus arteriosus where increased oxygen tension triggers the closure, no
trigger has been found for the ductus venosus (Fugelseth et al. 1998;
Loberant et al. 1999; Ishida et al. 2011)
Equally important to the active regulatory mechanism is the passive
regulation based on fluid dynamics, i.e. viscosity and pressure (C Ebbing
et al. 2011; Erkinaro et al. 2009). Blood velocity in the ductus venosus is
high and has Newtonian properties with low viscosity (similar to water). In
contrast, liver tissue represents a huge capillary cross-section with a low
blood velocity. At low velocities, the blood is non-Newtonian with an
accordingly high viscosity (and resistance) and a closing pressure of 1–
4 mmHg. It follows that an increase in haematocrit leads to increased
viscous resistance in the low-velocity venous liver flow and has little effect
on the high-velocity flow in the ductus venosus. Thus, the change in
haematocrit alone leads to a shift of umbilical venous flow from the liver to
the ductus venosus.
Along the same lines, variation in the umbilical venous pressure affects the
two pathways differently. A reduction in venous pressure reduces liver
perfusion more than ductus venosus flow, as a further reduction in an
already low velocity in the large cross-section of the portal vasculature

55
implies a considerable increase in viscous resistance. The result is a
higher degree of shunting (T Kiserud et al. 2006).
In addition to these fluid dynamic determinants, the neural and endocrine
regulation of the hepatic vascular bed also play a role (T Kiserud 2001;
Jörg Kessler et al. 2009) .The portal vasculature shows a more
pronounced constricting response to adrenergic stimulation compared with
the ductus venosus (Kilavuz et al. 2003; Jörg Kessler et al. 2008) .It all
combines to make a distribution system that is extremely sensitive to both
active and passive regulation, which is in line with the substantial normal
variation of shunting seen in human fetuses (Coceani & Olley 1988; M
Tchirikov et al. 2006; T Kiserud et al. 2006)
The physiological role of the ductus venosus is not well understood. The
shunting seems more prominent in early pregnancy than after 30 weeks of
gestation. The low degree of shunting through the ductus venosus during
the last 8–10 weeks of pregnancy implies that approximately 80% of the
umbilical blood perfuses the liver, signifying a very high developmental
priority of the umbilical liver perfusion compared with the ductus venosus
(Torvid Kiserud & Ganesh Acharya 2004) . However, during hypoxic
challenges, the priority seems to be different. Fetuses maintain a higher
degree of ductus venosus shunting, probably as a redistributional
adaptation to hypoxic pressure, ensuring oxygenation of the heart and
brain (A. A. Baschat et al. 2002; G. Haugen et al. 2005) . It should be

56
borne in mind that oxygen extraction in the liver is rather modest (10–15%
reduction in oxygen saturation) (C.-H. Chang et al. 2003; G. Haugen et al.
2005) ,which means that blood coming from the median and left hepatic
vein are important contributors of oxygenated blood. Actually, the position
and direction of the left hepatic venous blood under the Eustachian valve
(IVC valve) favour this blood to be delivered at the foramen ovale (Mikhail
Tchirikov et al. 2005; Kaji et al. 2012)
Although agenesis of the ductus venosus has been linked to abnormalities
and fetal demise (P. Volpe et al. 2002), agenesis is also found in fetuses
that have exhibited normal growth (Wald et al. 2012; Thomas et al. 2012;
P. Volpe et al. 2002; P. Volpe et al. 2011; Staboulidou et al. 2011).
Experimental obliteration of the vessel seems to have little haemodynamic
effect, but causes an increase in insulin-like growth factor 2 and increases
the growth of fetal organs (Mikhail Tchirikov et al. 2005). Recent studies
have indicated that the fetal umbilical flow to the liver towards the end of
pregnancy is influenced by the maternal nutritional state and diet (Cerf
et al. 2010). Umbilical venous flow constitutes 75% of the venous supply
to the liver, with the remaining 25% coming from the main portal stem
(Kilavuz et al. 2003).In human fetuses, the arterial supply to the liver is not
known but it seems to have a more prominent role during compromise
(Cathrine Ebbing et al. 2009; C Ebbing et al. 2011)

57
Doppler examination of the ductus venosus is increasingly used to identify
hypoxaemia, acidosis, cardiac decompensation and placental
compromise, and is a promising tool for timing the delivery of critically ill
fetuses (S Yagel et al. 2006; Fasouliotis et al. 2002) .Increased pulsatility,
mainly caused by the augmented atrial contraction wave, signifies
increased atrial contraction due to adrenergic drive, or increased venous
filling pressure, or both.
In early pregnancy, the augmented a-wave in the ductus venosus is
associated with an increased risk of chromosomal aberration and has
been suggested as a secondary screening test (Borrell et al. 2003; Wald
et al. 2012)
Foramen ovale
A defect in the atrial septum is commonly associated with left-right or right-
left shunting in postnatal life. It is conceivable that this concept is carried
over to describe the function of the foramen ovale in the fetus (T Kiserud
et al. 1992; R. L. Lewis & Gutmann 2002) ,but this is not a fair
representation of the actual haemodynamics. Rather, the inferior venous
inlet to the heart should be viewed as a column of blood that ascends
between the two atria from below .This column hits the interatrial ridge,
the crista dividens, and is divided into a left and right arm . The left arm fills
the ‘windsock’, formed between the foramen ovale valve and the atrial
septum, to enter the left atrium. The right arm is directed towards the

58
tricuspid valve and joins the flow from the superior vena cava and
coronary sinus to form the via dextra.
This is an equilibrium easily influenced by changes in pressure on the two
sides. Increased resistance and pressure of the left side is instantaneously
reflected in increased diversion of blood to the right side. In contrast to the
hypertrophy of the left ventricle seen in aortic stenosis in adults, fetal
stenosis commonly leads to a shift of blood volume from left to right at the
level of the foramen ovale, with corresponding development of left-sided
hypoplasia and compensatory growth of the right ventricle.
The developing ventricle responds to the demands of the afterload and is
stimulated by the blood volume of the preload. However, for the left side of
the heart, the foramen ovale is an important limiting factor, particularly in
cases of a maldeveloped foramen or a premature closure. Under
physiological conditions, it is not the oval-shaped hole of the septum that
constitutes the restricting area for the flow to the left atrium, but the
horizontal area between the foramen ovale valve and the atrial septum
above the foramen ovale. Interestingly, the growth of this area is somehow
blunted after 28–30 weeks of gestation compared with the cross-section of
the IVC. This effect coincides with changes in fetal lung perfusion and
ductus venosus shunting, and may signify a transition into a more mature
circulatory physiology (Torvid Kiserud & Ganesh Acharya 2004; Bartha
et al. 2009).

59
Ductus arteriosus and pulmonary circulation
The ductus arteriosus constitutes a wide muscular vessel connecting the
pulmonary arterial trunk to the descending aorta (Fig. 14). During the
second trimester, the velocity in the ductus arteriosus increases more than
that in the pulmonary trunk, reflecting the development of the wind-kessel
function of the pulmonary trunk (Dong et al. 2011). During the second half
of pregnancy, 40% or less of the CCO is directed through the ductus
arteriosus (Ishida et al. 2011). The lungs receive 13% of the CCO at mid-
gestation and 20–25% after 30 weeks, which is more than that reported in
fetal sheep experiments and a more recent human study (Mess & Ferner
2010). Normally, the shunt closes 2 days after birth, but a patent duct is a
common clinical problem. An increase in oxygen tension is regarded as
the main trigger for its closure. The vessel is under the general influence of
circulating substances, particularly prostaglandin E2, which is crucial in
maintaining patency (Smolich et al. 2012; Wei et al. 2011). Sensitivity to
prostaglandin antagonists is at its highest in the third trimester and is
enhanced by glucocorticoids and fetal stress. Nitric oxide has a relaxing
effect prior to the third trimester. The increased reactivity of the ductus
arteriosus in the third trimester makes it vulnerable to prostaglandin
synthase inhibitors, such as indomethacin, which may cause severe and
longlasting constriction (Momma & Takao 1989; Smolich et al. 2012;
Weichert et al. 2010)

60
The ductus arteriosus bypasses the pulmonary circuit, but the distribution
between these two pathways depends heavily on the impedance of the
pulmonary vasculature, which is under the control of prostaglandin I2 and
modified by a series of substances. In an elegant study, Rasanen et al.
showed how reactivity in the pulmonary vascular bed increased in the third
trimester (J Rasanen et al. 1996). While fetuses at gestational age 20–26
weeks showed no changes during maternal hyperoxygenation, fetuses at
31–36 weeks had lower impedance in the pulmonary arteries assessed by
the pulsatility index, and increased pulmonary blood flow.
Correspondingly, the blood flow in the ductus arteriosus was reduced (Lim
et al. 2012).
Brain circulation
Differences in circulation physiology between animal experiments and
human fetuses are likely to be greatest when concerning the brain, as the
human brain is relatively larger than in other species. In a study of human
previable fetuses weighing 12–272 g (probably corresponding to 10–20
weeks of gestation), it was found that the brain received approximately
15% of the systemic venous return (equal to the CCO less the pulmonary
circuit). The proportion directed to the brain increased with low arterial pH,
increased pCO2 and reduced placental perfusion. A study of the primate
Macaca mulatta at an advanced stage of gestation found that 16% of the

61
CCO was distributed to the brain, and this fraction increased to 31%
during hypoxic challenge (Edelstone & Rudolph 1979; Bracci et al. 2006;
Limperopoulos 2009) Both of these studies reflect redistributional
preferences to the brain during hypoxaemia and acidosis. Clinical
obstetrics has taken advantage of such ‘brain-sparing’ mechanisms, and
uses the increased diastolic blood velocity recorded in the middle cerebral
artery as a marker of compensatory redistribution of blood to the brain
(Nathanielsz & M. A. Hanson 2003; Kok et al. 2002; Licht et al. 2009)

62
% of combined cardiac output at gestational age
20 weeks 30 weeks 38 weeks
Combined cardiac output
210 (ml/min) 960 (ml/min) 1900 (ml/min)
Left ventricle 47 43 40
Right ventricle 53 57 60
Foramen ovale 34 18 19
Lungs 13 25 21
Ductus arteriosus 40 32 39
Table 2. Combined cardiac output and distribution in human fetuses during
the second half of pregnancy according to Rasanen et al.

63
Fetoplacental circulation
In the fetal sheep, 45% of the CCO is directed to the umbilical arteries and
placenta (T Kiserud 2001; Torvid Kiserud & Ganesh Acharya 2004) .This
percentage is less in exteriorized human fetuses, but it increases from
17% at 10 weeks to 33% at 20 weeks of gestation. These results
overestimate the placental fraction as the CCO calculation was based on
systemic venous return, not including the pulmonary venous return.
Secondly, the measurements were not performed under strict
physiological conditions. Doppler studies of low-risk pregnancies have
found similar results; one-third of the fetal CCO is directed to the placenta
at 20–32 weeks of gestation, (Erkinaro et al. 2009; Yigiter et al. 2011; A.
O. Odibo et al. 2011) but this decreases to approximately one-fifth beyond
32 weeks of gestation (Negrini et al. 2011).
The introduction of Doppler ultrasound made it possible to assess
umbilical venous blood flow (Maria Bellotti et al. 2004; Jörg Kessler et al.
2008), in the human fetus in-utero. Recent longitudinal observations in
low-risk pregnancies have found that the umbilical blood flow increases
from a mean of 36 ml/min at 20 weeks to 265 ml/min at 40 weeks of
gestation (K Flo, T Wilsgaard & G Acharya 2010) Umbilical flow
normalized for fetal weight is at its highest (117 ml/min/kg) at 25 weeks
and at its lowest at 41 weeks (63 ml/min/kg) of gestation. The fact that
human umbilical flow is considerably lower than that in the fetal sheep is

64
not disconcerting as fetal sheep have a higher growth rate, a higher
temperature and a lower Haemoglobin.
Resistance to flow is mainly determined by the peripheral vascular bed of
the placenta. This vasculature has no neural regulation and
catecholamines have little effect on the vasculature. Endothelin and
prostanoid have a constricting effect and nitric oxide has a vasodilatory
effect (P. Vallance et al. 1989), but the exact role of humoral regulation is
not fully understood. Placental blood flow has been found to be fairly
stable and chiefly determined by arterial blood pressure (Odeh et al. 2011)
The substantial increase in the vascular cross-section during late gestation
accounts for a reduction in impedance and the corresponding fall in
umbilical artery pulsatility seen in longitudinal studies. Placental
vasculature is believed to account for 55% of the umbilical resistance. The
waveform recorded by Doppler measurement in the umbilical artery
reflects this downstream impedance and is used extensively to identify
placental compromise.
Watershed areas and the compromised circulation
The watershed area in the brain circulation has long been used to explain
certain lesions of neonates, and a concept of a watershed at the isthmus
of the aorta, the left portal vein and the foramen ovale with its crista
dividens has been proposed recently.

65
It has long been known that fetuses with critical aorta stenosis or
hypoplastic left heart syndrome direct ductus arteriosus blood in a
retrograde direction through the isthmus aortae to feed the aortic arch.
Recent studies have highlighted the isthmus aortae as a watershed
between the aortic arch and the ductus arteriosus in anatomically normal
fetuses. Since this watershed also reflects the difference in impedance
between the cerebral circuit and that of the placenta and lower fetal body,
the blood velocity pattern across the isthmus with various degrees of
reversed flow was suggested to be an indicator of placental compromise.
Similarly, the direction of flow in the left portal vein is suggested to reflect
compromised venous return demanding a compensatory increase of blood
from the main portal stem to maintain portal and umbilical pressure, with
the result being a cessation of umbilical venous flow to the left portal
branch, and, at a more advanced stage of compromise, reversed flow that
permits splanchnic blood to enter the ductus venosus.
A third watershed, the foramen ovale, differs from the two former
watersheds. It distributes blood to the left and right atria by dividing the
ascending venous blood into two arms at the crista dividens. The
horizontal area between the foramen ovale valve and the atrial septum is
thought to be the restricting area for flow to the left atrium. In cases with
increased venous return (e.g. arteriovenous malformation), an increased
volume of blood is diverted to the right side, leading to increased growth of

66
the right ventricle. In cases of abnormally small foramen ovale, the left side
of the heart develops less in size (one of the possible mechanisms leading
to hypoplastic left heart syndrome).
These concepts are in need of detailed studies to make them clinically
relevant.
Circulatory regulation
Circulatory responses to hypoxaemia and hypovolaemia have been
particularly well studied in animals during the last trimester of pregnancy,
but even during mid-gestation and earlier, there seem to be neural and
endocrine responses in addition to the prominent direct effect on cardiac
function caused by hypoxic insults. A hypoxic insult in late pregnancy
activates a chemoreflex mediated by the carotid bodies (and, to a lesser
extent, the aortic bodies), causing an immediate vagal effect with reduced
heart rate and a sympathetic vasoconstriction. This is followed by
endocrine responses (e.g. adrenaline and noradrenaline) maintaining
vasoconstriction (α-adrenergic), increasing heart rate (β-adrenergic) and
reducing blood volume with renin release and increased angiotensin II
concentration. The responses involve angiotensin–vasopressin
mechanisms, and increased concentrations of adrenocorticotrophic
hormone, cortisol, atrial natriuretic peptide, neuropeptide Y and
adrenomedullin orchestrate a circulatory redistributional pattern that

67
maintains placental circulation and gives priority to the adrenal glands,
myocardium and brain. In clinical medicine, this translates into a frequently
visualized coronary circulation, a shift in left–right ventricular distribution, a
cerebral circulation with high diastolic flow, and increased impedance in
the pulmonary circulation during circulatory compromise.
Sustained hypoxia forces an adaptational shift to less oxygen demand,
reduced DNA synthesis and growth, with a gradual return towards normal
concentrations of blood gases and endocrine status, although with a
residual deviation that may have a longlasting effect on fetal and newborn
life. There is an increasing awareness that even subtle differences in the
development of autocrine, paracrine, endocrine and metabolic functions
induced by nutritional or circulatory variations during pregnancy could
have lasting effects with increased risks of cardiovascular and endocrine
diseases in adult life. This concept is currently known as fetal
programming (J. Robinson et al. 1995; Myatt 2006; Murphy et al. 2006;
Thomas Jansson & Powell 2007; K. M. Godfrey 2002; E Angiolini et al.
2006; C. P. Sibley et al. 2010; Ionel Sandovici et al. 2012).

68
Figure 14. Pathways of the fetal heart and representative oxygen saturation values (in brackets). The via sinistra
(red) directs well-oxygenated blood from the umbilical vein (VU) through the ductus venosus (DV) (or left half of the liver) across the inferior vena cava (VCI), through the foramen ovale (FO), left atrium (AI) and ventricle (VI) and up the ascending aorta (AO) to reach the descending AO through the isthmus aortae. De-oxygenated blood from the superior vena cava (VCS) and VCI forms the via dextra (blue) through the right atrium (AD) and ventricle (VD), pulmonary trunk (AP) and ductus arteriosus (DA). CCA, common carotid arteries; FOV, foramen ovale valve; LHV, left hepatic vein; LP, left portal branch; MHV, medial hepatic vein; MP, portal main stem; PV, pulmonary vein, RHV, right hepatic vein; RP, right portal branch. Copied and modified with permission from ref

69
2.1.2. The suspected changes
Redistribution has been defined as a shift in the proportional contribution
of individual ventricles to the total cardiac output (A A Baschat 2006).
When the relative contribution of the left ventricle rises, a higher proportion
of nutrient-rich blood is channeled towards the myocardium and the upper
body and brain through the brachiocephalic circulation. This concept could
be considered as an oversimplification. Firstly, the physiological
distribution of nutrients from the placenta places essential organs in a
serial order (liver, myocardium, brain and placenta). Secondly, partitioning
of nutrients also occurs at successive levels in the circulation (ductus
venosus, foramen ovale, aortic isthmus, umbilical arteries). Finally,
individual essential organs serve different roles in the human fetus and
autoregulatory adjustments of organ perfusion have been reported for the
liver, heart, and brain, and postulated for the placenta (al-Ghazali et al.
1989; Michael Tchirikov et al. 2010). These organ-sparing effects are also
invoked in a sequential manner with advancing fetal compromise. It
therefore appears worth considering the fetal circulation as a serial unit
distinguishing between venous redistribution, arterial redistribution and
individual organ-sparing effects.

70
Venous redistribution
The shunt dynamics in the ductus venosus–left portal vein system are
responsive to umbilical venous nutritional content, decreased umbilical
venous volume flow and marked elevations in placental blood-flow
resistance (M Tchirikov et al. 2006). An unbalanced maternal diet in
women with low body-fat content is associated with a decrease in ductus
venosus diameter and increased umbilical venous diversion to the liver.
On the other hand, a reduction in umbilical venous volume flow results in
ductal dilation and increased umbilical venous diversion, maintaining
overall ductus venosus contribution to the heart. The exact mechanisms
that regulate these adjustments in ductus venosus diameter are under
investigation (Mikhail Tchirikov et al. 2005; BelloMuñoz et al. 2009; A A
Baschat et al. 2012). With increased ductus venosus shunting towards the
heart, marked reversal of flow in the left portal vein towards the ductus
venosus may be observed. This suggests that the ductus venosus may
receive a variable admixture of depleted splanchnic blood due to left portal
shunting.
To summarize, venous redistribution potentially affects the nutritional
supply of all downstream organs. If diversion to the liver is increased,
ductus venosus contribution of nutrient-rich blood to the left ventricle
decreases. If diversion towards the heart increases, volume flow may be

71
maintained, or increased. The proportion of portal shunting towards the
ductus potentially alters the nutritional content of this bloodstream.
Assessment for venous redistribution could therefore prove critical in the
study of fetal programming and to refine our assessment of arterial
redistribution.
Arterial redistribution
Arterial redistribution occurs at the level of the foramen ovale and the
aortic isthmus. An increase in pulmonary vascular resistance, as may be
observed in fetal growth restriction, increases intracardiac right-to-left
shunting through the foramen ovale into the left ventricle. Therefore, there
is a rise in the contribution of blood with higher nutritional content from the
ductus venosus to left ventricular filling. Elevation of blood-flow resistance
in subdiaphragmatic and placental vascular beds or a decline in
brachiocephalic impedance impact at a cardiac level and in the aortic
isthmus (J.-C. Fouron et al. 2009; R Cruz-Martinez, F Figueras,
Benavides-Serralde, et al. 2011). This relative rise in right ventricular
afterload promotes right-to-left shunting through the foramen ovale. At the
aortic isthmus, diastolic reversal of blood flow indicates increased diastolic
diversion of blood originating from the right ventricle towards the
brachiocephalic circulation. The overall effect of these central adjustments
in shunting is additive. The relative increase in left ventricular output

72
enhances myocardial and brachiocephalic perfusion, while aortic isthmus
shunting supplements cephalic diversion of blood as long as the net flow
of systolic and diastolic forward velocities is forward. When the net flow in
the aortic isthmus becomes retrograde, the central shift of cardiac output
towards the left ventricle is no longer observed. It has been suggested that
the nutrient and oxygen content of the left ventricle drops under these
circumstances; this is supported by the increased risk for adverse
childhood neurodevelopment in fetuses that exhibit net reversal of aortic
isthmus blood flow (J. C. Fouron et al. 2001). Distal to the confluence of
the ductus arteriosus and aorta, ongoing perfusion of the placenta is
critical to maintain adequate nutrient exchange. Marked elevation in blood-
flow resistance in the pelvis and lower extremities favors diversion of blood
flow towards the umbilical vessels. This mechanism may play a role in
preserving placental perfusion in severe placental insufficiency (K.
Mäkikallio et al. 2003; Uerpairojkit et al. 2012).
Venous and arterial redistribution can only be effective as long as
adequate forward cardiac function can be maintained. In severe placental
insufficiency with marked elevations of placental afterload and/or
myocardial dysfunction, central venous pressure becomes elevated as
forward cardiac function declines(Michael Tchirikov et al. 2010; Simioni,
Nardozza, Araujo Júnior, Liliam Cristine Rolo, et al. 2011; Uerpairojkit
et al. 2012). Facilitated retrograde transmission of the atrial pressure pulse

73
through a dilated ductus venosus, with a subsequent decline in the a-
wave, is observed under these circumstances. The contribution of the
ductus venosus to left ventricular filling may decrease under these
conditions. On the arterial side of the circulation, forward cardiac function
may become insufficient to maintain net antegrade flow in the aortic
isthmus. Under these circumstances, intracardiac right-to-left shunting
becomes inefficient and arterial redistribution does not occur. Individual
organ-sparing effects may therefore be invoked at any time when local
organ perfusion becomes insufficient.
Organ-sparing effects
Local autoregulatory vascular adjustments that control organ perfusion are
of three principal types. The first type acts synergistically with venous and
arterial redistribution to augment organ blood flow. The second type
counteracts an ‘organ-steal effect’ that may occur as a result of
redistribution. The third type is relatively independent of redistribution,
because the vascular beds supplying the organs arise distal to the ductus
arteriosus and therefore are little affected by redistribution. Of the local
organ-sparing effects, brain sparing is the longest recognized in the
human fetus, while heart, liver and adrenal sparing (A. A. Baschat et al.
2002; G. Haugen et al. 2005) were described more recently.

74
Heart and brain sparing act synergistically with venous and arterial
redistribution
The heart is the driving force of the fetal circulation and also has a unique
metabolic role, since myocardium can metabolize lactate and may remove
up to 80% of circulating lactate under certain conditions(Wolfberg et al.
2007). The brain has similar metabolic capacities, as it can switch its major
fuel source from glucose to ketone bodies, which is advantageous during
fetal starvation (Cerf et al. 2010). Both of these organs derive their blood
supply from the left ventricle. Venous redistribution towards the heart and
arterial redistribution through the foramen ovale and aortic isthmus lead to
increased diversion of blood towards these organs. Vasodilatation at the
organ level acts synergistically to increase organ blood flow.
Heart sparing may be acute, chronic, or acute-on-chronic. Acute coronary
vasodilatation in response to myocardial ischemia may recruit a
myocardial flow reserve of approximately four times the basal flow.
Chronic heart sparing is due primarily to redistribution. Acute-on-chronic
heart sparing occurs with advanced cardiovascular deterioration. As
chronic hypoxia induces coronary angiogenesis, massive augmentation of
the coronary blood flow (up to 12-fold greater than the basal flow rate) can
be triggered if acute myocardial hypoxia supervenes.

75
Brain sparing as a result of cerebral vasodilatation results in a decrease in
the Doppler index. However, similar Doppler changes are observed with
the development of fetal hypertension (Galan et al. 2005). Concurrent
examination of the aortic isthmus may be helpful to refine the assessment
of the cerebral arterial Doppler changes.
Liver sparing is triggered by ‘hepatic steal’ due to excessive venous
redistribution
The liver is unique because it derives its blood supply from venous and
arterial sources. These include the umbilical vein, the splanchnic portal
system and the hepatic artery. In prolonged venous redistribution,
diversion of umbilical venous blood away from the liver sets up a state of
chronic hepatic insufficiency. When placental insufficiency deteriorates
further and baseline arterial supply becomes insufficient, hepatic artery
vasodilatation is invoked to recruit additional hepatic blood-flow reserve
from the arterial circulation. This vascular state is typically associated with
hepatic dysfunction in the fetus and a marked deterioration of the acid–
base balance. Liver sparing is therefore unique, since, unlike brain and
heart sparing, it does not act synergistically with venous and arterial
redistribution (G. Haugen et al. 2005) .

76
Adrenal sparing is less dependent on redistribution
Because the blood supply to the adrenal glands arises after the
confluence of the ductus arteriosus and the aorta, redistribution should
have little impact on overall adrenal perfusion. It is therefore more likely
that the augmentation of blood flow in this organ is due primarily to local
autoregulation. (Fatima Crispi & Gratacós 2012)
Experience from the sheep model
Prior observations made in the animal model are increasingly being
replaced by human data. However, because our ability for simultaneous
assessment of several fetal vascular beds is limited, we still have to rely
on animal experiment data. Experience from the sheep model verifies that
decreased oxygen delivery through the umbilical vein results in increased
diversion of cardiac output to the brain, heart and adrenal glands at the
expense of the carcass, skin and scalp. This is achieved through venous
and arterial redistribution as described above, and most likely auto-
regulatory mechanisms that have not been evaluated concurrently. In this
setting, adrenal artery blood flow increases by almost 300%, while
myocardial and brain blood flow increase by 120% and 80%, respectively
(Michael Tchirikov et al. 2010; Erkinaro et al. 2009; BelloMuñoz et al.
2010; Morel et al. 2010).

77
2.2 How do we know what we know? 2.1.1. The experimental models
The vast majority of the physiological data we have, regarding cardiac
function and circulatory events has been obtained from animal models
(Pemberton et al. 2005; Yamamura et al. 2012). One of the most widely
used methods has been to compare the ultrasound obtained data with
invasive methods such as direct catheterization or radio-isotopes
quantification (E Hernandez-Andrade, T Jansson, et al. 2004; Pardi &
Cetin 2006). The chronic as well as the acute changes in such a function
have been evaluated by invasive methods, and compared to certain US
obtained indexes (Ram et al. 2011; Hashima et al. 2010). The more
suitable models for these purposes are primates (Behrman et al. 1970;
Hashima et al. 2010) and ovine models, such as the one employed by our
group (Ganesh Acharya et al. 2004; Michael Tchirikov et al. 2010; Erkinaro
et al. 2009; BelloMuñoz et al. 2010).
The information obtained from these experimental models is reliable
enough as for establishing certain parallelisms with actual fetal cardiac
function in human subjects. Nonetheless, these data must be taken
carefully as there are substantial differences in the cardiac anatomy of the
two species: first of all, the heart of a sheep is bigger than humans and is
positioned slightly different in the body. Also, instead of having pulmonary

78
arteries and veins they have what's called a pulmonary trunk and the top
middle of the heart. Also there are two independent umbilical veins
draining directly into the inferior vena cava, hence, there is no ductus
venosus or something alike draining into the atrial bloodstream. The aortic
arch is flat when compared with the hook shape it has in the human and,
very likely, some of the shunting functions already described in the human
are not that evident among the fetal sheep adaptive mechanisms. (Fatima
Crispi & Gratacós 2012; Ganesh Acharya et al. 2008; Michael Tchirikov
et al. 2010)
However, the information gathered from invasive tests in these animal
models, renders a body of knowledge far more reliable than the data
obtained from repeated observations in, either, healthy or compromised
human subjects. Its utility remains in the possibility of assuring the
researcher that, the findings in a physiological situation are sustained by
reliable measurements and, hence, the changes witnessed under
artificially generated adverse conditions are true (Staboulidou et al. 2007;
Michael Tchirikov et al. 2010; N W Jones et al. 2009; Uerpairojkit et al.
2012).

79
Chapter 3. The Experiment 3.1 Materials and Methods 3.1.1. The Cardiac Output Model
Based on previous studies and encouraged by the works of Richards &
Kripfgans, we decided to develop an algorithm of flow calculation, based
on surface integration of velocity vectors and time frame sequences from
STIC volumes. Volume datasets as obtained by the ultrasound machine
Medison Accuvix V-20 prestige with a Medison 3D4-8ET 3D volumetric
probe (Samsung Medical Co, Hoofddorp, Nz).
A total of eight fetuses from near term pregnant sheeps (125-140 days)
were exteriorized through a cesarean section and a modified central
catheter inserted via umbilical cord and under direct echographic vision.
An arterial line was also inserted in one of the umbilical arteries. Both
transducers from the catheters were connected to a PICCO monitor for
invasive testing (PULSION Medical Inc. Irving TX, USA). Continuous
measurement of combined cardiac output was the registered as long as
the experiment was carried out, meanwhile one of the authors (JB-M),
recorded several volume datasets synchronizing the register of the data

80
set with data obtained by monitorization. Analysis of all the data was made
offline.
A complete spreadsheet of physiologic registers from the experimental
subject was recorded for comparison and external validation of
calculations. All images were processed by using the Mathematica ®
software (Wolfram Research Europe Ltd., Oxfordshire, UK). All data from
VOI analysis was addded to the calculation spreadsheet and a polinomial
regression fit model was designed for testing the smoothness of the
numeric register.

81
3.1.2. Mathematical Approach to the Phenomena The mathematical background of this study was based on flow calculation:
(20)
And the concept of vector velocity profile described above. But with the
adittion of a time frame provided by the STIC algorithm, which means a
continuous sum of velocity profiles, giving us a new profile of the area,
represented as:
(21)
And to the velocity profile, expressed also as
(22)
Where N is the entire amount of frames included in a cardiac cycle.

82
Once collected the sequences, information of velocity vector profile (VVP)
form the VOI was collected in a series of frames, from the starting of the
cardiac cycle (early start of diastole), denominated as t0 until the end of
same cycle (end of systole) hence called tn. Information of VVP was then
modified according to area variation in every frame. Therefore, the
mathematical expression of this phenomenon could be expressed as a
matrix of data:
Where Ax is an estimated area obtained by adding all the regional areas in
the VOI and vix is the velocity vector profile in each sub-area, according to,
previously described, sectorial variations in velocity. And t is the timeline
described above.
(23)

83
Fig. 15. Screen snapshot of descending aorta plane with selected volume
of evaluation. Right side of the image is the VOI containing the v1…..vn
information. A set of voxels like this one was added to the matrix, since t1
till tn where n=end of the cardiac cycle. (Actual experiment added
measurements from the aortic isthmus, this image is for illustrative
purposes).

84
Fig. 16. Color deconvolution algorithm as delivered by the Mathematica
software ®

85
The mathematical background of this study was based on flow calculation:
(24)
And the concept of vector velocity profile described above. But with the
addition of a time frame provided by the STIC algorithm, which means a
continuous sum of velocity profiles, giving us a new profile of the area,
represented as a Fourier sequence:
(25)
Our aim is to represent the fetal blood flow dynamics by using STIC, which
gives us a sequence of progressive stages during the cardiac cycle. Thus,
every image with a Ω(t) value with a t=1,2,3,….,n carries a set of color
intensity values that correlate somehow with the actual velocity of the fluid
at the exact moment the image is acquired.
As a first step, it was necessary to draw a ROI and to segment the color
voxels by decomposing the RGB signal into binaries and rendering again
the deconvoluted color information. This process delivers two channels of
information:

86
The number of voxels included in the width of the ROI,which
permits to extrapolate the value of the cross sectional area of
the vessel At(t) in every image of the sequence i= 1,2,…,m.
An approach to the time average mean velocity Vt(t) (area
under the curve of the signal), extrapolated from the color signal
scales
These data lead to the next proposition
(26)
Being Ai (t) the total Area for every (t), and vi(t) the velocity profile
information for every (t)
Where C represents a constant derived from the signal insonation angle,
flow density constants (to be experimentally established, but meaningless
for the application).
The equations’ system could be simplified as:

87
(27)
Where is the velocity vector
Is a n*m matrix that contains the area information for the m
streams evaluated in a n number of sequenced volumes
and
Is a composed vector where every component represents the mean
average flow calculated for every sequenced volume.
Thus, for achieving a solution for this matrix it is necessary to fulfil two
conditions:
1. That the A matrix could be reduced to an inverted matrix A’ with
n’*m’ components
(28)
2. That the number of streams (m) and the number of sequenced
volumes (n), fulfil the condition n>m.
So, as a part of the validation experiment, and having as known the actual
value of Q and V in the aortic isthmus, we developed a mathematical
model for simulating the cardiac output by using the values obtained from

88
the matrix of equations previously described. Figure 12 shows the way
we integrate a Medison predefined function in our protocol (to “cut” a 2mm
length cylinder in the ROI). And figure 13 shows the application as we
have developed it in a Mathematica ® platform.
Fig. 17. Screen snapshot of descending aorta plane with selected volume of evaluation. Right side of the image is the VOI containing the v1…..vn information. A set of voxels like this one was added to the matrix, since t1
till tn where n=end of the cardiac cycle. (Actual experiment added measurements from the aortic isthmus, this image is for illustrative purposes).

89
Fig. 18. Colour deconvolution algorithm as delivered by the Mathematica
software ®

90
Fig 19. Cardiac cycle values as obtained from the different sequences,
CCO was traced as an Area Under the Curve

91
The next step, which has become already the body of this thesis, was to
develop a mathematical modelling process, based on simulations for
random processes, to “draw” a pulsatile flow whose values could correlate
with the actual flow in the ROI. This process has been pre-registered as
VOLUME PERFUSION INDEX (VPI) as a potential for a patent by the
Institut de Recerca Vall d’Hebron. (Appendix 2)
3.1.3 The In Vitro Test
The test device consisted of a flow phantom and gear pump, blood-
mimicking fluid (BMF), and one ultrasound test tank system designed
specifically for the experiment. The ultrasound test tank, containing tissue-
mimicking material (TMM), and a variety of vessel orientations and
arrangements, was insonated using power Doppler ultrasound and 3D-
STIC datasets which were acquired over a range of flow rates, erythrocyte
mimic concentrations and different depths in a series of experiments. All
ultrasound settings were kept constant throughout the experiment to
eliminate their effect on the power Doppler signal, and to ensure that any
variation in the vascular indices related to differences between the test
systems and experimental designs.

92
Figure 20. The ‘flow phantom’ and associated test device components: A)
computer-controlled gear pump was used to circulate the blood-mimicking
fluid through a closed circuit, incorporating a Windkessel, and through a
test tank. B) A test tank filled with tissue mimicking material and vessel
mimicking siliconized tubes. C) An ultrasound machine registering the
movement generated information

93
Flow phantom test device components
A computer-controlled gear pump was connected to each ultrasound test
tank via a series of connecting tubes, incorporating a Windkessel, to
create a closed circuit The gear pump was used to circulate a BMF
through this system in a continuous loop.
The motor used was a geared pump with electromagnetic coupling that
produced flow which varied according to the voltage applied (Integra
series micropump (EG130-0036), Micropump Corporation, Vancouver,
WA, USA). Both continuous and pulsatile flow patterns may be achieved,
with the latter varying between relatively simplistic square waves and
waves that mimic flow seen within the carotid artery. For the purpose of
these studies a pulsatile flow rate was used throughout. The true flow rate
of the BMF was calculated by breaking the circuit and collection of the
BMF into a measuring cylinder of known weight over a set amount of time..
The cylinder and collected fluid were then measured and the initial weight
subtracted to calculate the weight of the collected fluid (with a well known
density of 1.037 g/cc). This was repeated five times for each flow rate over
the complete range of rates used in the study and the mean value used.
Reservoir and circulatory system : A 1-L capacity bell jar was filled with
BMF, which was then pumped through the flow phantom to the test tank
before returning to the jar. The system was closed with the BMF being

94
returned into, and beneath the surface of, the BMF within the reservoir to
prevent the formation of air bubbles. Before each experiment the pump
was activated and the BMF allowed to flow through the system for 30
seconds to expel any air bubbles that had formed and allow an even
distribution of the fluid. Silicone rubber tubing was used to connect the
system, which contained two independent limbs in parallel. One limb led to
the test tank to be insonated and the other acted as a bypass limb, which
returned directly to the reservoir. The overall flow rate was controlled in
this limb through the application of a clamp. A Windkessel was included
before the division into the two limbs. This smoothed the action of the
pump and allowed the maintenance of a constant pulsatile flow within the
system.
The tank used for the experiments consisted of a perspex box (25 × 30 ×
12 cm) with a 0.8-mm thick C-flex™ tube of 4 mm in diameter (Cole-
Palmer, Vernon Hills, IL, USA) running horizontally through the center of
the tank and fixed at a constant depth. This test tank was used for
assessment of the effect of velocity, erythrocyte mimic concentration and
change in ultrasound settings. The tank was filled with an agar-based
TMM and were constantly sealed from the atmosphere when not in use.
The composition (% weight) of the TMM was 82.97% water, 11.21%
glycerol, 0.46% benzalkonium chloride, 0.53% 400-grain silicon carbide
(SiC) powder (Logitech Ltd, Glasgow, UK), 0.88% 0.3 µm aluminum oxide

95
(Al2O3) powder (Logitech Ltd), 0.94% 3 µm Al2O3 powder (Logitech Ltd)
and 3.00% Struers agar (Merck Eurolab, Roskildevej, Denmark). These
components were prepared, mixed in a double boiler, heated to 96 °C and
then maintained at 96 °C ( ± 3 °C) for 1 h, mixing continuously with a
stirring rod. The solution was allowed to cool to 42 °C, while being stirred
continuously, and finally poured into the test tank. All the procedures
mentioned in the presente protocol have been previously tested and
successfully tested by professor Raine Fenning in an already published
experiment (N J Raine-Fenning et al. 2008a; N J Raine-Fenning et al.
2008b)
The BMF was based on a suspension of nylon particles (Orgasol™;
2001UDNAT1 Orgasol, ELF Atochem, Paris, France). The standard
solution was made by mixing 1.82% 5-µm Orgasol particles with 83.86%
pure water, 10.06% glycerol, 3.36% Sigma D4876 dextran 185 kDa
(Sigma Ltd, Poole, UK) and 0.9% ICI synperonic N surfactant by weight
(Merck Ltd, Glasgow, UK). This solution was mixed thoroughly for 2 h and
then poured through a 32-µm sieve. The resulting solution has been
shown to be stable, with backscatter properties that approximate real
blood, and to be within International Electrotechnical Commission
requirements.

96
All data were acquired with a Medison Accuvix V-20 prestige with a
Medison 3D4-8ET 3D volumetric probe (Samsung Medical Co, Hoofddorp,
Nz).. The probe was held in position at 90° to the surface of each
ultrasound test tank, and in contact with the TMM, by a clamp attached to
a retort stand to ensure that there were no inappropriate movements of the
probe during data acquisition. The ‘flow phantom’ was commenced and
after a steady flow rate had been achieved, for a minimum of 30 seconds,
a central 2D view of the vessel(s) was obtained by moving the clamp
stand. Power Doppler was then applied and the volume mode activated to
generate a truncated sector defining the area of interest. The angle was
set to 40° to ensure that a complete volume was obtained and a 3D-STIC
dataset was acquired using the medium sweep mode, as is used in the
clinical setting. The acquired volume was stored to a magnetic optical disk
and subsequently sent to a personal computer via a dedicated DICOM
(Digital Imaging and Communications in Medicine) link. Medison-
Sonoview® (Samsung Medical Co, Hoofddorp, Nz) software was used by
the personal computer to receive and store the volume datasets and for
part of the subsequent data analysis.
The power Doppler settings were specifically maintained for all
experiments as follows: medium central frequency, quality 9, density 8,
reject 82, signal rise 0.4, signal persistence 0, frame rate 12.9, wall motion

97
filter 70 Hz, pulse repetition frequency 1.6 kHz, power 4 dB and color gain
36.8. All the image filters provided by the machine were de-activated (MR
image, speckle reduction and cross beam reduction) The STIC setting
were established as sweep angle 25º, acquisition time 7 seconds, frame
rate 35 fps. These settings were chosen as they reflected those used in
the clinical setting and allowed the best possible registration of the signal.
In order to achieve quantification in a repeatable way, we used part of the
tools in the Sonoview® software provided by the machine. Two plug-in
named “Oblique view” ® and “OVIX” ® which allowed us to, in order to
maintain the same degree of consistency, generating a 3D ‘rectangular
sampling box’ that was applied over the midpoint of the vessel. As
indicated by a central point on the screen, and by maintaining a constant
magnification of 1.1; this VOI was found to fit perfectly such that the vessel
and its wall were just enclosed. This allowed the user to define an
orthogonal VOI, with a 2mm length cylinder included whose dimensions
may be modified manually relative to the object of interest but were always
set at 2mm. To ensure that a consistent VOI was selected for each
dataset, predetermined criteria were set according to the experiment under
consideration All datasets were stored, transferred and subsequently
measured in the same manner with no manipulation of the display.
Because the relationship between the transducer and test tank was

98
maintained at 90°, the vessel was always located centrally and horizontally
within the final dataset.
The power Doppler signal within each dataset was evaluated by applying
the histogram facility in a volume defined by Virtual Organ Computer-aided
AnaLysis (VOCAL: Samsung Medical Co, Hoofddorp, Nz). VOCAL allows
the user to automatically define a sphere of variable size that can be
applied within any 3D dataset to sample the Doppler signal within it. For
these experiments a spherical volume of 0.9 cm3, defined by a diameter of
1 cm as estimated from the sphere volume (πD3/6, where D = diameter),
was used to serially sample each dataset from the proximal to the more
distal part. The fixed size of the sphere allowed assessment of the gain
adjustment from the surface, at depths of 0–1 cm, to the more distant
aspect of the dataset Owing to the nature of the experiments and the
different designs employed we decided to report only the VFI, which is
representative of both the VI and FI. The relationship between the VFI and
the different settings within each flow-free phantom and with each
transducer were represented as plot graphs. The results were plotted for:
Bland- Altman intra e interobserver variability, and Intra-Class correlation
coefficient with 95% Confidence Interval was calculated.

99
Offline Analysis of volume datasets: all stored volumes were then
analyzed, as previously described, by using the image analysis software
provided by Mathematica ® and the voxels intensity information was kept
as a matrix of data. The actual velocity profile measurement was stored
independently for a further plotting against the estimated calculations. The
matrix of color deconvolution values was then inserted into a Matlab suite
® algorithm denominated “least-squares curve fitting“, used for adjusting
complex matrix data in linear equations.
The data delivered by the machine was a function whose values were
related to relative vectorial velocity values within the VOI and had the form:
(29)
Where
C Matrix
d Vector
Aineq Matrix for linear inequality constraints
bineq Vector for linear inequality constraints
Aeq Matrix for linear equality constraints
beq Vector for linear equality constraints

100
lb Vector of lower bounds
ub Vector of upper bounds
x0 Initial point for x
And the VPI is
(Xt -Xo/ Xx)
X value as its maximum register
Xo value is the initial (minimum) point for X
Xx value is the mean value for this vector
As dividing by two, for the example purposes, we are cutting in a half a 2cc
cylinder and expressing the VPI value normalized by 1 cc
The results were plotted for: Bland- Altman intra e interobserver variability,
and the Intra-Class correlation coefficient with 95% Confidence Interval
was calculated. A Cochran Q- test was employed for comparing
repeatability between the two techniques
All the measurements were stored in an Excel spreadsheet (Microsoft
Corporation, Silicon Valley, Ca). Transferred into dedicate databases for
statistical analysis by using Medcalc Software (Medcalc Corporation,
Mariakerke, Belgium) and the Statistical Package for Social Sciences
version 19 (SPSS Corp- IBM Company Armonk, New York )

101
3.1.4. The in-vivo test: Designing the animal model
This was an experimental animal model, carried out in eight, accurately
time-dated, pregnant sheep carrying single fetuses. The posterior limbs of
the fetuses were intervened and evaluated throughout this study. The
research protocol was approved by the Committee for Animal Research of
the Universitat Autònoma de Barcelona (UAB). All animals received care
in compliance with the “principles of Laboratory Animal Care” formulated
by the National Society for Medical Research and the “Guide for Care and
Use of Laboratory Animals” prepared by the National Institute of Health
(NIH publication Nr. 6380-2, revised 2004:
http://www3.od.nih.gov/oma/manualchapters/contracts/6380-2/) and the
Spanish law for protection of experimental animals (RD 223-1988).
A total of eight fetuses from near term pregnant sheeps (125-140 days)
were gathered from the animal welfare house of the Vall d’Hebron
Research Institute. Fetal vitality was previously assessed and, then, a
cesarean section under general anesthesia All pregnant sheep were
endotracheally intubated and underwent general anesthesia with
isofluorane (Aerrane, Baxter Co, One Baxter parkway Deerfield, IL). The
uterus was then exteriorized through a lower midline laparotomy, the
fetuses were exposed via hysterotomy and the umbilical cord was
exteriorized through the section. Afterwards, a modified central catheter

102
was inserted via umbilical vein and under direct echographic vision. An
arterial line was also inserted in one of the umbilical arteries. Both
transducers from the catheters were connected to a PICCO monitor for
invasive testing (PULSION Medical Inc. Irving TX, USA). Continuous
measurement of combined cardiac output was then registered as long as
the experiment was carried out, meanwhile one of the authors (JB-M),
recorded several volume datasets synchronizing the register of the data
set with data obtained by monitorization.. Ultrasound and Doppler
assessment was performed using a Samsung Accuvix V-20 Prestige
machine with a 3-6 MHz multi-frequency 3D matrix array probe (Samsung-
Medison Europe B.V. Parellaan 10, 2132WS, Hoofddorp, The
Netherlands). All the scans were performed in synchronization with the
invasive measurements.
The power Doppler settings were specifically maintained for all
experiments as follows: medium central frequency, quality 9, density 8,
reject 82, signal rise 0.4, signal persistence 0, frame rate 12.9, wall motion
filter 70 Hz, pulse repetition frequency 1.6 kHz, power 4 dB and color gain
36.8. All the image filters provided by the machine were de-activated (MR
image, speckle reduction and cross beam reduction) The STIC setting
were established as sweep angle 25º, acquisition time 7 seconds, frame

103
rate 35 fps. These settings were chosen as they reflected those used in
the clinical setting and allowed the best possible registration of the signal.
In order to achieve quantification in a repeatable way, we used part of the
tools in the Sonoview® software provided by the machine. Two plug-in
named “Oblique view” ® and “OVIX” ® which allowed us to, in order to
maintain the same degree of consistency, generating a 3D ‘rectangular
sampling box’ that was applied over the midpoint of the vessel. As
indicated by a central point on the screen, and by maintaining a constant
magnification of 1.1; this VOI was found to fit perfectly such that the vessel
and its wall were just enclosed. This allowed the user to define an
orthogonal VOI, with a 2mm length cylinder included whose dimensions
may be modified manually relative to the object of interest but were always
set at 2mm. To ensure that a consistent VOI was selected for each
dataset, predetermined criteria were set according to the experiment under
consideration All datasets were stored, transferred and subsequently
measured in the same manner with no manipulation of the display.
Because the relationship between the transducer and test tank was
maintained at 90°, the vessel was always located centrally and horizontally
within the final dataset.
The power Doppler signal within each dataset was evaluated by applying
the histogram facility in a volume defined by Virtual Organ Computer-aided

104
AnaLysis (VOCAL: Samsung Medical Co, Hoofddorp, Nz). VOCAL allows
the user to automatically define a sphere of variable size that can be
applied within any 3D dataset to sample the Doppler signal within it. For
these experiments a spherical volume of 0.9 cm3, defined by a diameter of
1 cm as estimated from the sphere volume (πD3/6, where D = diameter),
was used to serially sample each dataset from the proximal to the more
distal part. The fixed size of the sphere allowed assessment of the gain
adjustment from the surface, at depths of 0–1 cm, to the more distant
aspect of the dataset Owing to the nature of the experiments and the
different designs employed we decided to report only the VFI, which is
representative of both the VI and FI. The relationship between the VFI and
the different settings within each flow-free phantom and with the
transducer were represented as plot graphs. The results were plotted
for: Bland- Altman intra e interobserver variability, and Intra-Class
correlation coefficient with 95% Confidence Interval was calculated.
VPI Offline Analysis of volume datasets: all stored volumes were then
analyzed, as previously described, by using the image analysis software
provided by Mathematica ® and the voxels intensity information was kept
as a matrix of data. The actual velocity profile measurement was stored
independently for a further plotting against the estimated calculations. The
matrix of color deconvolution values was then inserted into a Matlab suite

105
® algorithm denominated “least-squares curve fitting“, used for adjusting
complex matrix data in linear equations.
The algorithms employed for the in vivo test were the same used in the in-
vitro one, already described
The results were plotted for: Bland- Altman intra e interobserver variability,
and Intra-Class correlation coefficient with 95% Confidence Interval was
calculated. A Cochran Q- test was employed for comparing repeatability
between the two techniques
All the measurements were stored in an Excel spreadsheet (Microsoft
Corporation, Silicon Valley, Ca). Transferred into dedicate databases for
statistical analysis by using Medcalc Software (Medcalc Corporation,
Mariakerke, Belgium) and the Statistical Package for Social Sciences
version 19 (SPSS Corp- IBM Company Armonk, New York )

106
Chapter 4. Results 4.1 Flow quantification 4.1.1 In vitro testing 4.1.1.1. Internal Validity A total of 136 measurements were achieved during the experiment, always
under similar conditions of pulse, flow, velocity and machine settings. All
the registers were successfully analyzed offline and the VPI was
calculated in all cases. With the same volume dataset an offline analysis of
volumes using the VOCAL® software was attempted, successfully in all
the cases.
While the graphic of estimated velocity depicts a “pulse-like” graphic
(figure 21). The graphic of the VFI showed a stable value throughout the
entire experiment. . When comparing the vectorial velocity values, as
delivered by the Matlab® algorithm, the correlation was very high with a R2
value of 0.67 (p<0.05) and a Pearson’s correlation index (95% CI) of 0.88
(0.58-0.97). When plotting the VFI values and the velocity values no
correlation was found (R2 value 0.034), and the Pearson’s correlation
index (95%CI) was -0.34(-0.31-0.44) . (Figure 22 and 23).
When tested in-vitro, both techniques showed a good repeatability. Intra-
Observer Intraclass Correlation Coefficient (ICC; 95% CI) was similar for

107
VPI (0.95; 0.91-0.99) and VFI (0.9; 0.88-0.92). Inter-Observer ICC was
also alike for VPI (0.90; 0.87-0.99) and VFI (0.88; 0.84-0.91).
The Bland Altamn plot showed also a low disagreement between two
observations by the same observer (Figures 24 and 25) and by two
different observers (Figures 26 and 27)
When plotting VPI against actual flow calculation the Pearson’s correlation
Index (95% CI) was 0.88 (0.58-0.97) for VPI and 0.34 (0.31-0.44) for VFI.
(Fig 28)
Table 3 summarizes the repeatability tests for both tools.

108
Figure 21 Linear plot from obtained vectorial velocity values as rendered
by the matlab ® linear minimum squares algorithm. It can be seen how
likely the graphic depicts a pulsatile fluctuation of the values.

109
Figure 22 Linear regression plot from obtained vectorial velocity values
as rendered by the Matlab ® linear minimum squares algorithm when
compared to actual velocities as registered by the pump

110
Figure 23 Quadratic regression plot of VFI when compared to actual
velocities as registered by the pump

111
0,0 0,1 0,2 0,3 0,4 0,5 0,6 0,7 0,8 0,9 1,0 1,1
AVERAGE of OBS_A and OBSAA
100
85
70
55
40
25
10
-5
-20
-35
-50
-65
-80
-95
(OB
S_A
- O
BS
AA
) /
Ave
rage
%
Mean
-3,2-1.96 SD
-14,9
+1.96 SD
8,5
Figure 24 Bland-Altman plot showing the intra-observer disagreement of
the Volume Perfusion Index as tested in-vitro.
B-A DA [%] (95% CI): 2,6 (-14.9-8.5)

112
0,0 0,1 0,2 0,3 0,4 0,5 0,6 0,7 0,8 0,9 1,0 1,1
AVERAGE of OBS_A and OBS_B
100
85
70
55
40
25
10
-5
-20
-35
-50
-65
-80
-95
(OB
S_A
- O
BS
_B)
/ A
vera
ge %
Mean
-4,1-1.96 SD
-18,2
+1.96 SD
10,1
Figure 25 Bland-Altman plot showing the inter-observer disagreement of
the Volume Perfusion Index as tested in-vitro
B-A DA [%] (95% CI): -1.4 (-18.2-10.0)

113
25 30 35 40 45 50 55 60
AVERAGE of FI_1AA and FI1A
100
80
60
40
20
0
-20
-40
-60
-80
-100
(FI_
1AA
- F
I1A
) /
Ave
rage
%
Mean
1,3-1.96 SD
-12,9
+1.96 SD
15,4
Figure 26 Bland-Altman plot showing the intra-observer disagreement
of the Vascularization Flow Index (VFI) as tested in-vitro.
B-A DA [%] (95% CI): 1.3 (-12.9-15.5)

114
25 30 35 40 45 50 55 60
AVERAGE of FI1A and FI2
100
80
60
40
20
0
-20
-40
-60
-80
-100
(FI1
A -
FI2
) /
Ave
rage
%
Mean
-2,5-1.96 SD
-17,9
+1.96 SD
12,9
Figure 27 Bland-Altman plot showing the inter-observer disagreement
of the Vascularization Flow Index (VFI) as tested in-vitro.
B-A DA [%] (95% CI): -2.5 (-17.9-12.8)

115
Table 3 Summarized results of intra and inter observer variability
between the Volume Perfusion Index (VPI) and the Vascularization Flow
Index (VFI) from in-vitro measurements
(*) p obtained by a Wilcoxon Sum rank test.
T BA D 95% CI P(*) ICC 95% CI p
VPI
INTRA OBSERVER
2.6 -14.9-8.5 0.6 0.95 0.91-0.99 <0.01
INTER OBSERVER
1.4 -18.2-10.0 0.6 0.90 0.87-0.99 <0.01
VFI
INTRA OBSERVER
1.3 -12.9-15.5 * 0.90 0.88-0.92 <0.01
INTER OBSERVER
2.5 -17.9-12.8 * 0.88 0.84-0.91 <0.01

116
4.1.1.2. Standard Validation
Figure 28 Linear regresion plot of Volume Perfusion Index when
compared to actual flow as measured by direct monitorization (see
description).

117
Table 4 Summarized Pearsons’ and Tau Rank correlation coefficient
between the Volume Perfusion Index (VPI) and the Vascularization Flow
Index (VFI) when compared to actual flow measurements as recorded by
the autor throughout the experimet
T R value CC 95% CI P(*) RCC 95% CI p
VPI
0.92 0.88 0.58-0.97 <0.01 0.69 0.68-0.89 <0.01
VFI
0.15 -0.34 -0.31-0.44 0.57 0.18 -0.1-0.35 0.61

118
4.1.2. In vivo testing 4.1.2.1. Internal Validity A total of 128 measurements from eight subjects were achieved during the
experiment (equivalent to 16 cardiac cycles each one), always under
similar conditions of temperature, pulse, clinical status of the mother,
gestational age and machine settings. In all cases, invasive monitorization
was successful through umbilical vein and artery for pulse, flow, output
and pressures. All the data form invasive monitoring were stored. In all
cases the volume datasets were successfully achieved All the registers
were successfully analyzed offline and the VPI was calculated in all
cases. With the same volume dataset an offline analysis of volumes using
the VOCAL® software was attempted, successfully in all the cases.
While the graphic of estimated velocity depicted a “pulse-like” graphic
(figure 29). The graphic of the VFI showed a stable value throughout the
entire experiment. When comparing the vectorial velocity values, as
delivered by the Matlab® algorithm, the correlation was very high with a R2
value of 0.77 (p<0.05) and a Pearson’s correlation index (95% CI) of 0.68
(0.58-0.77). When plotting the VFI values and the velocity values no
correlation was found (R2 value 0.034), and the Pearson’s correlation
index (95%CI) was -0.24(-0.31-0.44) . (Figure 30).

119
When tested in-vivo the VPI exhibited an Intra-Observer ICC(95% CI) of
0.9(0.88-0.99) and the VFI 0.79(0.75-0.92) (Figure 31 and 32); and an
Inter-Observer ICC (955 CI) of 0.88 (0.87-0.99) for VPI and 0.78 (0.74-
0.91) for VFI (Figures 33 and 34).
Table 5 summarizes the repatibility tests for both tools.
The flow measurement in the animal model correlated significantly better
in VPI than in VFI with a Perason’s Correlation Index (95% CI) of
0.88(0.58-0.97) Vs -0.34 (-0.31-0.44). p< 0.001 (Figures 35 and 36).
Table 6 summarizes the correlation measurements for both techniques.

120
Figure 29 Linear plot from obtained vectorial velocity values as rendered
by the matlab ® linear minimum squares algorithm. It can be seen how
likely the graphic depicts a pulsatile register from the PICCO monitor

121
Figure 30 Cuadratic regression plot from obtained Volume Perfusion
Index as rendered by the Matlab ® linear minimum squares algorithm
when compared to a model fitted values of actual flow as obtained by
direct monitorization

122
0,0 0,1 0,2 0,3 0,4 0,5 0,6 0,7 0,8 0,9 1,0 1,1
AVERAGE of OBS_A and OBSAA
100
85
70
55
40
25
10
-5
-20
-35
-50
-65
-80
-95
(OB
S_A
- O
BS
AA
) /
Ave
rage
%
Mean
-2,8-1.96 SD
-16,2
+1.96 SD
10,7
Figure 31 Bland-Altman plot showing the intra-observer disagreement of
the Volume Perfusion Index as tested in a sheep model.
B-A DA [%] (95% CI): -4,6 (-16.2-10.7)

123
0,0 0,2 0,4 0,6 0,8 1,0 1,2
AVERAGE of OBS_B and OBSAA
100
80
60
40
20
0
-20
-40
-60
-80
-100
(OB
S_B
- O
BS
AA
) /
Ave
rage
%
Mean
4,1-1.96 SD
-14,8
+1.96 SD
23,0
Figure 32 Bland-Altman plot showing the inter-observer disagreement of
the Volume Perfusion Index as tested in a sheep model.
B-A DA [%] (95% CI): 4.1 (-14.8-23.0)

124
0 5 10 15 20 25 30
AVERAGE of VFI1 and VFI1A
100
80
60
40
20
0
-20
-40
-60
-80
-100
(VF
I1 -
VF
I1A
) /
Ave
rage
%
Mean
1,8
-1.96 SD
-25,8
+1.96 SD
29,5
Figure 33 Bland-Altman plot showing the intra-observer disagreement
of the Vascularization Flow Index (VFI) as tested in a sheep model.
B-A DA [%] (95% CI): 1.8 (-25.8-29.5)

125
0 5 10 15 20 25 30
AVERAGE of VFI1A and VFIA_A
100
80
60
40
20
0
-20
-40
-60
-80
-100
(VF
I1A
- V
FIA
_A)
/ A
vera
ge %
Mean
-2,8
-1.96 SD
-40,5
+1.96 SD
34,8
Figure 34 Bland-Altman plot showing the inter-observer disagreement of
the Vascularization Flow Index (VFI) as tested in a sheep model.
B-A DA [%] (95% CI): -2.8 (-40.5-34.8)
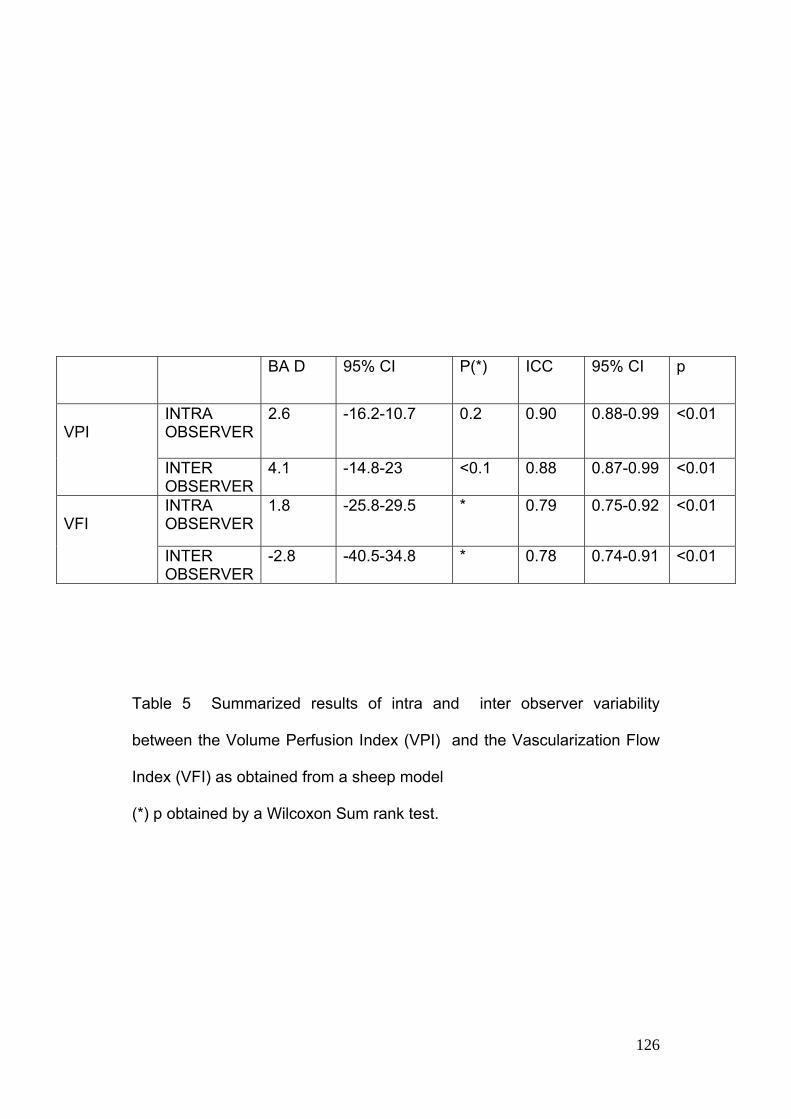
126
Table 5 Summarized results of intra and inter observer variability
between the Volume Perfusion Index (VPI) and the Vascularization Flow
Index (VFI) as obtained from a sheep model
(*) p obtained by a Wilcoxon Sum rank test.
T BA D 95% CI P(*) ICC 95% CI p
VPI
INTRA OBSERVER
2.6 -16.2-10.7 0.2 0.90 0.88-0.99 <0.01
INTER OBSERVER
4.1 -14.8-23 <0.1 0.88 0.87-0.99 <0.01
VFI
INTRA OBSERVER
1.8 -25.8-29.5 * 0.79 0.75-0.92 <0.01
INTER OBSERVER
-2.8 -40.5-34.8 * 0.78 0.74-0.91 <0.01

127
4.1.2.2. Standard Validation
Figure 35 Linear correlation plot of Volume Perfusion Index when
compared to actual flow as measured by invasive monitorization (see
description). R2 value 0.874

128
Figure 36 Linear correlation plot of Vascularization Flow Index when
compared to actual flow as measured by invasive monitorization (see
description). R2 value 0.154

129
Table 6 Summarized Pearsons’ and Tau Rank correlation coefficient
between the Volume Perfusion Index (VPI) and the Vascularization Flow
Index (VFI) when compared to actual flow measurements as recorded by
the autor throughout the experiment.
T CC 95% CI P(*) RCC 95% CI p
VPI
0.68 0.58-0.77 <0.01 0.54 0.38-0.89 <0.01
VFI
-0.24 -0.31-0.44 0.63 0.28 0.08-0.31 0.31

130
Chapter 5. Discussion 5.1 How much of a Breakthrough The possibility of registering , in a reliable manner, the fetal blood flow,
represents a milestone in the evaluation of certain fetal conditons whose
circulatory changes make an essential impact in the prognosis and are
fundamental for clinical decision making (Sifa Turan et al. 2008; A A
Baschat 2006). Particular conditions like monochorionic twin pregnancy
complications (Chmait et al. 2009; Hack et al. 2009; N. A. Smith et al.
2010), fetal growth restriction (R Cruz-Martinez, F Figueras, Benavides-
Serralde, et al. 2011; Apel-Sarid et al. 2009; E Hernandez-Andrade et al.
2008), small for gestational age fetuses without demonstrable signs of
hemodynamic compromise (Rogelio Cruz-Martinez et al. 2009; R Cruz-
Martinez, F Figueras, E Hernandez-Andrade, et al. 2011; R Cruz-Martinez,
F Figueras, E Hernandez-Andrade, et al. 2011), fetuses with cardiac
anomalies and compromise of the upper body circulation (Simioni,
Nardozza, Araujo Júnior, Liliam Cristine Rolo, et al. 2011; Smolich et al.
2012; Wald et al. 2012; K Flo, T Wilsgaard, Vårtun, et al. 2010). Since this
point, several research teams are involved in evaluating in many different
ways this phenomenon. However, the clinical variability of these

131
measurement in any living being makes nearly impossible to get a
replicable measurement without direct evaluation or invasive measures
(unavailable in fetal medicine nowadays).
The promise underneath this technique is the possibility of achieving a
tool, accurate enough as for depicting such changes under any condition
and circulatory territory (A. W. Welsh et al. 2005; Lai et al. 2010; Collins
et al. 2011; Heck et al. 2012). It is quite likely that, this addition to the
technique could be a new surpassed frontier and a step forward in the way
for the actual registering of fetal circulation. (Bello-Munoz JC et al. 2012)
5.1.1. Further Adjustements Despite the promising results described in the present thesis, the author
sincerely thinks that further adjustments should be done to the tool before
considering its clinical applicability. In its actual form it depicts quite
accurately the pulsatile flow but, as far as we have tested, it is not possible
to assume it is going to be able to detect subtle variations on this
magnitude secondary to, either, physiological or pathological conditions.
Further research addressing this particular issue should and will be
attempted in the near future before launching any clinical application of
this algorithm. We assume that five years from this point is a reasonable
and achievable timeline for testing the tool and implementing it in a clinical
setting.

132
5.2 Potential future uses 5.2.1. Prospective for new applications As the tool can register any vascular territory with pulsatile flow the
possibilities for evaluating regional flow are quite a number, In a pre-
clinical way, our group is developing some protocols for registering such a
regional flow in brain, kidneys, hepato-portal circulation, and heart. In
order to withdraw a map of the regional vascularity and circulatory
changes in the physiological condition of fetal growth and in certain
pathological conditions like fetal growth restriction. This research is online
with the state of the art in fetal circulation (Kari Flo, Tom Wilsgaard &
Ganesh Acharya 2010; Cathrine Ebbing et al. 2009; Milani et al. 2011;
Limperopoulos 2009; Clouchoux et al. 2011; Jordan-Young 2011)
A copy of the current protocol for such volume taking (in Spanish) is
attached to the Annex 5.

133
5.4 Conclusion The Volume Perfussion Index may be a significant advance in the way we
observe and measure circulatory changes in the normal and compromised
fetus as well. The VPI shows, under experimental conditions, significantly
better repeatability and accuracy than the currently used tools for power
Doppler quantification.
.
5.5 Disclosures Author acknowledges the cooperation and support provided by
Samsung Medical Co. during the experiment, but declares that
has no commercial relationship whatsoever with that or any
other company producing Ultrasound equipment. The
techniques and results consigned here are subject of a
confidentiality agreement between the author, the Vall d’Hebron
Institute of Research and Samsung Medison Medical Company

134
6. References
3. Acharya, G et al., 2005. Reference ranges for serial measurements of
blood velocity and pulsatility index at the intra-abdominal portion, and
fetal and placental ends of the umbilical artery. Ultrasound in
Obstetrics & Gynecology: The Official Journal of the International
Society of Ultrasound in Obstetrics and Gynecology, 26(2), pp.162–
169.
4. Acharya, Ganesh et al., 2008. Metabolic acidosis decreases fetal
myocardial isovolumic velocities in a chronic sheep model of
increased placental vascular resistance. American journal of
physiology. Heart and circulatory physiology, 294(1), pp.H498–504.
5. Acharya, Ganesh et al., 2004. Relationships among Doppler-derived
umbilical artery absolute velocities, cardiac function, and placental
volume blood flow and resistance in fetal sheep. American Journal of
Physiology. Heart and Circulatory Physiology, 286(4), pp.H1266–
1272.
6. Acharya, Ganesh & Sitras, V., 2009. Oxygen uptake of the human fetus
at term. Acta Obstetricia Et Gynecologica Scandinavica, 88(1),
pp.104–109.
7. Alcázar, J L, 2008. Three-dimensional power Doppler derived
vascular indices: what are we measuring and how are we doing it?
Ultrasound in Obstetrics & Gynecology: The Official Journal of the

135
International Society of Ultrasound in Obstetrics and Gynecology,
32(4), pp.485–487.
8. Alcázar, Juan Luis & Jurado, M., 2011. Three-dimensional ultrasound
for assessing women with gynecological cancer: a systematic review.
Gynecologic Oncology, 120(3), pp.340–346.
9. al-Ghazali, W. et al., 1989. Evidence of redistribution of cardiac
output in asymmetrical growth retardation. British journal of
obstetrics and gynaecology, 96(6), pp.697–704.
10. Angiolini, E et al., 2006. Regulation of placental efficiency for nutrient
transport by imprinted genes. Placenta, 27 Suppl A, pp.S98–102.
11. Apel-Sarid, L. et al., 2009. Placental pathologies associated with intra-
uterine fetal growth restriction complicated with and without
oligohydramnios. Archives of Gynecology and Obstetrics, 280(4),
pp.549–552.
12. Baez, E. et al., 2005. Ductus venosus blood flow velocity waveforms as
a predictor for fetal outcome in isolated congenital heart disease.
Fetal diagnosis and therapy, 20(5), pp.383–389.
13. Bartha, J.L., Moya, E.M. & Hervías-Vivancos, B., 2009. Three-
dimensional power Doppler analysis of cerebral circulation in normal
and growth-restricted fetuses. Journal of Cerebral Blood Flow and
Metabolism: Official Journal of the International Society of Cerebral
Blood Flow and Metabolism, 29(9), pp.1609–1618.

136
14. Baschat, A. A. et al., 2002. Demonstration of fetal coronary blood flow
by Doppler ultrasound in relation to arterial and venous flow velocity
waveforms and perinatal outcome – the ‘heart‐sparing effect’.
Ultrasound in Obstetrics & Gynecology, 9(3), pp.162–172.
15. Baschat, A A, 2006. The fetal circulation and essential organs-a new
twist to an old tale. Ultrasound in Obstetrics & Gynecology: The
Official Journal of the International Society of Ultrasound in
Obstetrics and Gynecology, 27(4), pp.349–354.
16. Baschat, A A, Turan, O.M. & Turan, S, 2012. Ductus venosus blood-
flow patterns: more than meets the eye? Ultrasound in obstetrics &
gynecology: the official journal of the International Society of
Ultrasound in Obstetrics and Gynecology, 39(5), pp.598–599.
17. Behrman, R.E. et al., 1970. Distribution of the circulation in the
normal and asphyxiated fetal primate. American journal of obstetrics
and gynecology, 108(6), pp.956–969.
18. Bello-Munoz JC et al., 2012. Future Uses of Three/Four Dimensional
Power Doppler Signal in Fetal Medicine. En Sonography. InTech web,
pp. 249–272. Available at:
http://www.intechopen.com/source/pdfs/27897/InTech-
Future_uses_of_three_four_dimensional_power_doppler_signal_in_fe
tal_medicine.pdf.

137
19. Bello‐Muñoz, J. et al., 2010. OC26.01: Fetal cardiac output:
measurement by four dimensional power Doppler and artificial neural
networks. Results from a sheep model. Ultrasound in Obstetrics &
Gynecology, 36(S1), pp.46–46.
20. Bello‐Muñoz, J. et al., 2009. OP23.05: A three‐dimensional power
Doppler algorithm for ductus venosus shunting evaluation in normal
and growth restricted fetuses. Ultrasound in Obstetrics & Gynecology,
34(S1), pp.136–137.
21. Bellotti, M, Pennati, G & Ferrazzi, E, 2007. Re: ductus venosus
shunting in growth-restricted fetuses and the effect of umbilical
circulatory compromise. Ultrasound in Obstetrics & Gynecology: The
Official Journal of the International Society of Ultrasound in
Obstetrics and Gynecology, 29(1), pp.100–101; author reply 101–102.
22. Bellotti, M et al., 2000. Role of ductus venosus in distribution of
umbilical blood flow in human fetuses during second half of
pregnancy. American Journal of Physiology. Heart and Circulatory
Physiology, 279(3), pp.H1256–1263.
23. Bellotti, Maria et al., 2004. Simultaneous measurements of umbilical
venous, fetal hepatic, and ductus venosus blood flow in growth-
restricted human fetuses. American Journal of Obstetrics and
Gynecology, 190(5), pp.1347–1358.

138
24. Bendick, P.J. et al., 1998. Three-dimensional vascular imaging using
Doppler ultrasound. American Journal of Surgery, 176(2), pp.183–
187.
25. Berg, S. et al., 2000. Volumetric blood flow measurement with the use
of dynamic 3-dimensional ultrasound color flow imaging. Journal of
the American Society of Echocardiography: Official Publication of the
American Society of Echocardiography, 13(5), pp.393–402.
26. Borrell, A. et al., 2003. Ductus venosus assessment at the time of
nuchal translucency measurement in the detection of fetal aneuploidy.
Prenatal diagnosis, 23(11), pp.921–926.
27. Bozkurt, N. et al., 2010. Correlations of fetal-maternal outcomes and
first trimester 3-D placental volume/3-D power Doppler calculations.
Clinical and Experimental Obstetrics & Gynecology, 37(1), pp.26–28.
28. Bracci, R., Perrone, S. & Buonocore, G., 2006. The timing of neonatal
brain damage. Biology of the Neonate, 90(3), pp.145–155.
29. Burns, P.N., 1992. Measuring volume flow with Doppler ultrasound-an
old nut. Ultrasound in Obstetrics & Gynecology: The Official Journal
of the International Society of Ultrasound in Obstetrics and
Gynecology, 2(4), pp.238–241.
30. van Cappellen, A.M. et al., 1999. Hypoxia, the subsequent systemic
metabolic acidosis, and their relationship with cerebral metabolite
concentrations: An in vivo study in fetal lambs with proton magnetic

139
resonance spectroscopy. American Journal of Obstetrics and
Gynecology, 181(6), pp.1537–1545.
31. Cerf, M.E. et al., 2010. Gestational 30% and 40% fat diets increase
brain GLUT2 and neuropeptide Y immunoreactivity in neonatal Wistar
rats. International Journal of Developmental Neuroscience: The
Official Journal of the International Society for Developmental
Neuroscience, 28(7), pp.625–630.
32. Clouchoux, C. et al., 2011. Normative fetal brain growth by
quantitative in vivo magnetic resonance imaging. American Journal of
Obstetrics and Gynecology. Available at:
http://www.ncbi.nlm.nih.gov/pubmed/22055336 [Accedido noviembre
20, 2011].
33. Coceani, F. & Olley, P.M., 1988. The control of cardiovascular shunts
in the fetal and perinatal period. Canadian journal of physiology and
pharmacology, 66(8), pp.1129–1134.
34. Collins, S. et al., 2011. Influence of power Doppler gain setting on
Virtual Organ Computer AnaLysis (VOCAL) indices in vivo: Can use
of the individual sub-noisegain (SNG) level optimise information?
Ultrasound in Obstetrics & Gynecology: The Official Journal of the
International Society of Ultrasound in Obstetrics and Gynecology.
Available at: http://www.ncbi.nlm.nih.gov/pubmed/22009687
[Accedido mayo 14, 2012].

140
35. Crispi, Fatima & Gratacós, E., 2012. Fetal Cardiac Function:
Technical Considerations and Potential Research and Clinical
Applications. Fetal diagnosis and therapy. Available at:
http://www.ncbi.nlm.nih.gov/pubmed/22614129 [Accedido junio 7,
2012].
36. Cruz-Martinez, R, Figueras, F, Hernandez-Andrade, E, et al., 2011.
Normal reference ranges of fetal regional cerebral blood perfusion as
measured by fractional moving blood volume. Ultrasound in Obstetrics
& Gynecology: The Official Journal of the International Society of
Ultrasound in Obstetrics and Gynecology, 37(2), pp.196–201.
37. Cruz-Martinez, R, Figueras, F, Benavides-Serralde, A., et al., 2011.
Sequence of changes in myocardial performance index in relation to
aortic isthmus and ductus venosus Doppler in fetuses with early-onset
intrauterine growth restriction. Ultrasound in obstetrics &
gynecology: the official journal of the International Society of
Ultrasound in Obstetrics and Gynecology, 38(2), pp.179–184.
38. Cruz-Martinez, Rogelio et al., 2009. Cerebral blood perfusion and
neurobehavioral performance in full-term small-for-gestational-age
fetuses. American Journal of Obstetrics and Gynecology, 201(5),
pp.474.e1–7.

141
39. Chang, C.-H. et al., 2003. Assessment of normal fetal liver blood flow
using quantitative three-dimensional power Doppler ultrasound.
Ultrasound in Medicine & Biology, 29(7), pp.943–949.
40. Chaoui, R. & Heling, K.S., 2005. New developments in fetal heart
scanning: three- and four-dimensional fetal echocardiography.
Seminars in Fetal & Neonatal Medicine, 10(6), pp.567–577.
41. Chaoui, R. & Kalache, K.D., 2001. Three-dimensional power Doppler
ultrasound of the fetal great vessels. Ultrasound in Obstetrics &
Gynecology: The Official Journal of the International Society of
Ultrasound in Obstetrics and Gynecology, 17(5), pp.455–456.
42. Chmait, R., Kontopoulos, E. & Quintero, R., 2009. Fetoscopic
management of complicated monochorionic twins. Clinical Obstetrics
and Gynecology, 52(4), pp.647–653.
43. Dar, P. et al., 2010. First-trimester 3-dimensional power Doppler of
the uteroplacental circulation space: a potential screening method for
preeclampsia. American Journal of Obstetrics and Gynecology,
203(3), pp.238.e1–7.
44. DeVore, G.R. et al., 2003. Spatio-temporal image correlation (STIC):
new technology for evaluation of the fetal heart. Ultrasound in
Obstetrics & Gynecology: The Official Journal of the International
Society of Ultrasound in Obstetrics and Gynecology, 22(4), pp.380–
387.

142
45. Dong, F.Q. et al., 2011. Evaluation of normal fetal pulmonary veins
from the early second trimester by enhanced-flow (e-flow)
echocardiography. Ultrasound in obstetrics & gynecology: the official
journal of the International Society of Ultrasound in Obstetrics and
Gynecology, 38(6), pp.652–657.
46. Dubiel, M. et al., 2005. Computer analysis of three-dimensional power
angiography images of foetal cerebral, lung and placental circulation
in normal and high-risk pregnancy. Ultrasound in Medicine &
Biology, 31(3), pp.321–327.
47. Ebbing, C, Rasmussen, S & Kiserud, T, 2011. Fetal hemodynamic
development in macrosomic growth. Ultrasound in obstetrics &
gynecology: the official journal of the International Society of
Ultrasound in Obstetrics and Gynecology, 38(3), pp.303–308.
48. Ebbing, Cathrine et al., 2009. Redistribution pattern of fetal liver
circulation in intrauterine growth restriction. Acta obstetricia et
gynecologica Scandinavica, 88(10), pp.1118–1123.
49. Edelstone, D.I. & Rudolph, A.M., 1979. Preferential streaming of
ductus venosus blood to the brain and heart in fetal lambs. The
American journal of physiology, 237(6), pp.H724–729.
50. Eik-Nes, S.H. et al., 1982. Ultrasonic measurement of human fetal
blood flow. Journal of Biomedical Engineering, 4(1), pp.28–36.

143
51. Erkinaro, T. et al., 2009. Placental and fetal hemodynamics after
labetalol or pindolol in a sheep model of increased placental vascular
resistance and maternal hypertension. Reproductive Sciences
(Thousand Oaks, Calif.), 16(8), pp.749–757.
52. Fasouliotis, S.J. et al., 2002. The human fetal venous system: normal
embryologic, anatomic, and physiologic characteristics and
developmental abnormalities. Journal of Ultrasound in Medicine:
Official Journal of the American Institute of Ultrasound in Medicine,
21(10), pp.1145–1158.
53. Fenster, A. et al., 1998. Three-dimensional ultrasound imaging of the
vasculature. Ultrasonics, 36(1-5), pp.629–633.
54. Flo, K, Wilsgaard, T, Vårtun, A., et al., 2010. A longitudinal study of
the relationship between maternal cardiac output measured by
impedance cardiography and uterine artery blood flow in the second
half of pregnancy. BJOG: An International Journal of Obstetrics and
Gynaecology, 117(7), pp.837–844.
55. Flo, K, Wilsgaard, T & Acharya, G, 2010. Longitudinal reference
ranges for umbilical vein blood flow at a free loop of the umbilical
cord. Ultrasound in Obstetrics & Gynecology: The Official Journal of
the International Society of Ultrasound in Obstetrics and Gynecology,
36(5), pp.567–572.

144
56. Flo, Kari, Wilsgaard, Tom & Acharya, Ganesh, 2010. Relation
between utero-placental and feto-placental circulations: a longitudinal
study. Acta obstetricia et gynecologica Scandinavica, 89(10), pp.1270–
1275.
57. Forsberg, F. et al., 1995. Volume flow estimation using time domain
correlation and ultrasonic flowmetry. Ultrasound in Medicine &
Biology, 21(8), pp.1037–1045.
58. Fouron, J.C. et al., 2001. Correlation between prenatal velocity
waveforms in the aortic isthmus and neurodevelopmental outcome
between the ages of 2 and 4 years. American journal of obstetrics and
gynecology, 184(4), pp.630–636.
59. Fouron, J.-C. et al., 2009. Feasibility and reliability of Doppler flow
recordings in the fetal aortic isthmus: a multicenter evaluation.
Ultrasound in obstetrics & gynecology: the official journal of the
International Society of Ultrasound in Obstetrics and Gynecology,
33(6), pp.690–693.
60. Fugelseth, D. et al., 1998. Postnatal closure of ductus venosus in
preterm infants < or = 32 weeks. An ultrasonographic study. Early
human development, 53(2), pp.163–169.
61. Galan, H.L. et al., 2005. Fetal hypertension and abnormal Doppler
velocimetry in an ovine model of intrauterine growth restriction.
American journal of obstetrics and gynecology, 192(1), pp.272–279.

145
62. Gill, R.W., 1979. Pulsed Doppler with B-mode imaging for quantitative
blood flow measurement. Ultrasound in Medicine & Biology, 5(3),
pp.223–235.
63. Godfrey, K.M., 2002. The role of the placenta in fetal programming-a
review. Placenta, 23 Suppl A, pp.S20–27.
64. Grosse-Wortmann, L., Bindl, L. & Seghaye, M.-C., 2006. Multiple
types of cardiac arrhythmias in a child with head injury and raised
intracranial pressure. Pediatric Cardiology, 27(2), pp.286–288.
65. Guimarães Filho, H.A. et al., 2011. Reproducibility of three-
dimensional power Doppler placental vascular indices in pregnancies
between 26 and 35 weeks. Archives of Gynecology and Obstetrics,
283(2), pp.213–217.
66. Guo, Z. et al., 1998. In vitro evaluation of multiple arterial stenoses
using three-dimensional power Doppler angiography. Journal of
Vascular Surgery: Official Publication, the Society for Vascular
Surgery [and] International Society for Cardiovascular Surgery, North
American Chapter, 27(4), pp.681–688.
67. Guo, Z. & Fenster, A., 1996. Three-dimensional power Doppler
imaging: a phantom study to quantify vessel stenosis. Ultrasound in
Medicine & Biology, 22(8), pp.1059–1069.

146
68. Hack, K.E.A. et al., 2009. Long-term neurodevelopmental outcome of
monochorionic and matched dichorionic twins. PloS One, 4(8),
p.e6815.
69. Hamill, N. et al., 2011. Fetal cardiac ventricular volume, cardiac
output, and ejection fraction determined with 4-dimensional
ultrasound using spatiotemporal image correlation and virtual organ
computer-aided analysis. American Journal of Obstetrics and
Gynecology. Available at:
http://www.ncbi.nlm.nih.gov/pubmed/21531373 [Accedido julio 17,
2011].
70. Harrington, K., Deane, C. & Campbell, S., 1996. Measurement of
volume flow with time domain and M-mode imaging: in vitro and in
vivo validation studies. Journal of Ultrasound in Medicine: Official
Journal of the American Institute of Ultrasound in Medicine, 15(10),
pp.715–720.
71. Hashima, J.N. et al., 2010. Fetal ventricular diastolic filling
characteristics in a primate model: the role of fetal heart rate and
pulmonary vascular impedance. Reproductive sciences (Thousand
Oaks, Calif.), 17(8), pp.760–766.
72. Haugen, G. et al., 2005. Fetal liver-sparing cardiovascular
adaptations linked to mother’s slimness and diet. Circulation research,
96(1), pp.12–14.

147
73. Hayashi, T. et al., 1998. Three-dimensional reconstruction of the
power flow Doppler imaging of intracranial vascular structures in the
neonate. Journal of Neuroimaging: Official Journal of the American
Society of Neuroimaging, 8(2), pp.94–96.
74. Heck, S. et al., 2012. Evaluation of Neonatal Regional Cerebral
Perfusion Using Power Doppler and the Index Fractional Moving
Blood Volume. Neonatology, 101(4), pp.254–259.
75. Heling, K.S., Chaoui, R. & Bollmann, R., 2000. Prenatal depiction of
the angioarchitecture of an aneurysm of the vein of Galen with three-
dimensional color power angiography. Ultrasound in Obstetrics &
Gynecology: The Official Journal of the International Society of
Ultrasound in Obstetrics and Gynecology, 15(4), p.345.
76. Hernandez-Andrade, E et al., 2008. Changes in regional fetal cerebral
blood flow perfusion in relation to hemodynamic deterioration in
severely growth-restricted fetuses. Ultrasound in Obstetrics &
Gynecology: The Official Journal of the International Society of
Ultrasound in Obstetrics and Gynecology, 32(1), pp.71–76.
77. Hernandez-Andrade, E, Thuring-Jönsson, A., et al., 2004. Fractional
moving blood volume estimation in the fetal lung using power Doppler
ultrasound: a reproducibility study. Ultrasound in Obstetrics &
Gynecology: The Official Journal of the International Society of
Ultrasound in Obstetrics and Gynecology, 23(4), pp.369–373.

148
78. Hernandez-Andrade, E, Jansson, T, et al., 2004. Validation of
fractional moving blood volume measurement with power Doppler
ultrasound in an experimental sheep model. Ultrasound in Obstetrics
& Gynecology: The Official Journal of the International Society of
Ultrasound in Obstetrics and Gynecology, 23(4), pp.363–368.
79. Ishida, H. et al., 2011. Clinical features of the complete closure of the
ductus arteriosus prenatally. Congenital heart disease, 6(1), pp.51–56.
80. Jansson, Thomas & Powell, T.L., 2007. Role of the placenta in fetal
programming: underlying mechanisms and potential interventional
approaches. Clinical science (London, England: 1979), 113(1), pp.1–
13.
81. Jansson, Tomas et al., 2003. Estimation of fractional moving blood
volume in fetal lung using Power Doppler ultrasound, methodological
aspects. Ultrasound in Medicine & Biology, 29(11), pp.1551–1559.
82. Johnson, P., 2000. Intracardiac pressures in the human fetus. Heart,
84(1), pp.59–63.
83. Jones, M.G., Shipley, J.A. & Robinson, T.M., 2003. Visualisation of 4-
D colour and power Doppler data. Ultrasound in Medicine & Biology,
29(12), pp.1735–1747.
84. Jones, N W et al., 2009. In vitro dual perfusion of human placental
lobules as a flow phantom to investigate the relationship between

149
fetoplacental flow and quantitative 3D power doppler angiography.
Placenta, 30(2), pp.130–135.
85. Jones, Nia W et al., 2011. Evaluating the intra- and interobserver
reliability of three-dimensional ultrasound and power Doppler
angiography (3D-PDA) for assessment of placental volume and
vascularity in the second trimester of pregnancy. Ultrasound in
Medicine & Biology, 37(3), pp.376–385.
86. Jordan-Young, R.M., 2011. Hormones, context, and «Brain Gender»:
A review of evidence from congenital adrenal hyperplasia. Social
Science & Medicine (1982). Available at:
http://www.ncbi.nlm.nih.gov/pubmed/21962724 [Accedido octubre 4,
2011].
87. Kaji, T. et al., 2012. Simultaneous recordings of pulsed wave Doppler
signals in hepatic vein and descending aorta using dual Doppler: a
novel method for evaluating fetal arrhythmias. Ultrasound in
obstetrics & gynecology: the official journal of the International
Society of Ultrasound in Obstetrics and Gynecology, 39(3), pp.357–
359.
88. Kessler, Jörg et al., 2009. Fetal growth restriction is associated with
prioritization of umbilical blood flow to the left hepatic lobe at the
expense of the right lobe. Pediatric research, 66(1), pp.113–117.

150
89. Kessler, Jörg et al., 2008. Longitudinal study of umbilical and portal
venous blood flow to the fetal liver: low pregnancy weight gain is
associated with preferential supply to the fetal left liver lobe. Pediatric
research, 63(3), pp.315–320.
90. Kilavuz, O. et al., 2003. The left portal vein is the watershed of the
fetal venous system. Journal of Perinatal Medicine, 31(2), pp.184–187.
91. Kiserud, T et al., 1992. Foramen ovale: an ultrasonographic study of
its relation to the inferior vena cava, ductus venosus and hepatic veins.
Ultrasound in obstetrics & gynecology: the official journal of the
International Society of Ultrasound in Obstetrics and Gynecology,
2(6), pp.389–396.
92. Kiserud, T et al., 2006. Ductus venosus shunting in growth-restricted
fetuses and the effect of umbilical circulatory compromise. Ultrasound
in Obstetrics & Gynecology: The Official Journal of the International
Society of Ultrasound in Obstetrics and Gynecology, 28(2), pp.143–
149.
93. Kiserud, T. et al., 1994. Estimation of the pressure gradient across the
fetal ductus venosus based on doppler velocimetry. Ultrasound in
Medicine & Biology, 20(3), pp.225–232.
94. Kiserud, T, 2001. The ductus venosus. Seminars in Perinatology,
25(1), pp.11–20.

151
95. Kiserud, Torvid & Acharya, Ganesh, 2004. The fetal circulation.
Prenatal Diagnosis, 24(13), pp.1049–1059.
96. Kok, R.D. et al., 2002. Maturation of the human fetal brain as
observed by 1H MR spectroscopy. Magnetic Resonance in Medicine:
Official Journal of the Society of Magnetic Resonance in Medicine /
Society of Magnetic Resonance in Medicine, 48(4), pp.611–616.
97. Kripfgans, O.D. et al., 2006. Measurement of volumetric flow. Journal
of Ultrasound in Medicine: Official Journal of the American Institute
of Ultrasound in Medicine, 25(10), pp.1305–1311.
98. Kupesic, S. & Kurjak, A., 2000. Contrast-enhanced, three-dimensional
power Doppler sonography for differentiation of adnexal masses.
Obstetrics and Gynecology, 96(3), pp.452–458.
99. Kurjak, A. et al., 1998. The assessment of ovarian tumor angiogenesis:
what does three-dimensional power Doppler add? Ultrasound in
Obstetrics & Gynecology: The Official Journal of the International
Society of Ultrasound in Obstetrics and Gynecology, 12(2), pp.136–
146.
100. Lai, P.K., Wang, Y.A. & Welsh, A.W., 2010. Reproducibility of
regional placental vascularity/perfusion measurement using 3D power
Doppler. Ultrasound in Obstetrics & Gynecology: The Official Journal
of the International Society of Ultrasound in Obstetrics and
Gynecology, 36(2), pp.202–209.

152
101. Lewis, R.L. & Gutmann, L., 2002. Post-traumatic paradoxical
embolism in patent foramen ovale. Neurology, 59(10), p.1611.
102. Li, H., Gudmundsson, S. & Olofsson, P., 2006. Acute centralization
of blood flow in compromised human fetuses evoked by uterine
contractions. Early human development, 82(11), pp.747–752.
103. Li, X. et al., 2005. A novel method for the assessment of the
accuracy of computing laminar flow stroke volumes using a real-time
3D ultrasound system: In vitro studies. European Journal of
Echocardiography: The Journal of the Working Group on
Echocardiography of the European Society of Cardiology, 6(6),
pp.396–404.
104. Licht, D.J. et al., 2009. Brain maturation is delayed in infants with
complex congenital heart defects. The Journal of Thoracic and
Cardiovascular Surgery, 137(3), pp.529–536; discussion 536–537.
105. Lim, K. et al., 2012. Third trimester fetal pulmonary artery
Doppler blood flow velocity characteristics following prenatal
selective serotonin reuptake inhibitor (SSRI) exposure. Early human
development. Available at:
http://www.ncbi.nlm.nih.gov/pubmed/22305713 [Accedido mayo 14,
2012].
106. Limperopoulos, C., 2009. Disorders of the fetal circulation and the
fetal brain. Clinics in Perinatology, 36(3), pp.561–577.

153
107. Loberant, N. et al., 1999. Closure of the ductus venosus in
premature infants: findings on real-time gray-scale, color-flow
Doppler, and duplex Doppler sonography. AJR. American journal of
roentgenology, 172(1), pp.227–229.
108. Mäkikallio, K., Jouppila, P. & Räsänen, J., 2003. Retrograde
aortic isthmus net blood flow and human fetal cardiac function in
placental insufficiency. Ultrasound in Obstetrics & Gynecology, 22(4),
pp.351–357.
109. Marín, R.C. et al., 2010. Use of 3-dimensional sonography for
prenatal evaluation and follow-up of fetal goitrous hypothyroidism.
Journal of Ultrasound in Medicine: Official Journal of the American
Institute of Ultrasound in Medicine, 29(9), pp.1339–1343.
110. Martins, W.P. & Raine-Fenning, N J, 2010. Analysis and
acquisition reproducibility of 3D power Doppler. Ultrasound in
Obstetrics & Gynecology: The Official Journal of the International
Society of Ultrasound in Obstetrics and Gynecology, 36(3), pp.392–
393; author reply 393–394.
111. Mess, A.M. & Ferner, K.J., 2010. Evolution and development of
gas exchange structures in Mammalia: the placenta and the lung.
Respiratory physiology & neurobiology, 173 Suppl, pp.S74–82.
112. Messing, B. et al., 2007. Fetal cardiac ventricle volumetry in the
second half of gestation assessed by 4D ultrasound using STIC

154
combined with inversion mode. Ultrasound in Obstetrics &
Gynecology: The Official Journal of the International Society of
Ultrasound in Obstetrics and Gynecology, 30(2), pp.142–151.
113. Milani, H.J.F. et al., 2011. Assessment of cerebral circulation in
normal fetuses by three-dimensional power Doppler ultrasonography.
European Journal of Radiology. Available at:
http://www.ncbi.nlm.nih.gov/pubmed/21300496 [Accedido julio 17,
2011].
114. Molina, F.S. et al., 2008a. Heart stroke volume and cardiac output
by four-dimensional ultrasound in normal fetuses. Ultrasound in
Obstetrics & Gynecology: The Official Journal of the International
Society of Ultrasound in Obstetrics and Gynecology, 32(2), pp.181–
187.
115. Molina, F.S. et al., 2008b. Heart stroke volume and cardiac output
by four-dimensional ultrasound in normal fetuses. Ultrasound in
Obstetrics & Gynecology: The Official Journal of the International
Society of Ultrasound in Obstetrics and Gynecology, 32(2), pp.181–
187.
116. Momma, K. & Takao, A., 1989. Increased constriction of the ductus
arteriosus with combined administration of indomethacin and
betamethasone in fetal rats. Pediatric research, 25(1), pp.69–75.

155
117. Morel, O. et al., 2010. Correlation between uteroplacental three-
dimensional power Doppler indices and true uterine blood flow:
evaluation in a pregnant sheep model. Ultrasound in Obstetrics &
Gynecology: The Official Journal of the International Society of
Ultrasound in Obstetrics and Gynecology, 36(5), pp.635–640.
118. Moskalik, A.P. et al., 2001. Analysis of three-dimensional Doppler
ultrasonographic quantitative measures for the discrimination of
prostate cancer. Journal of Ultrasound in Medicine: Official Journal
of the American Institute of Ultrasound in Medicine, 20(7), pp.713–
722.
119. Murphy, V.E. et al., 2006. Endocrine regulation of human fetal
growth: the role of the mother, placenta, and fetus. Endocrine reviews,
27(2), pp.141–169.
120. Myatt, L., 2006. Placental adaptive responses and fetal
programming. The Journal of physiology, 572(Pt 1), pp.25–30.
121. Nardozza, L.M.M. et al., 2009. Evolution of 3-D power Doppler
indices of fetal brain in normal pregnancy. Ultrasound in Medicine &
Biology, 35(4), pp.545–549.
122. Nathanielsz, P.W. & Hanson, M.A., 2003. The fetal dilemma: spare
the brain and spoil the liver. The Journal of physiology, 548(Pt 2),
p.333.

156
123. Negrini, R. et al., 2011. Assessment of placental blood flow
between 22 and 34 weeks of gestation by 3D-sonography power
Doppler vascular indices. Archives of Gynecology and Obstetrics,
284(1), pp.53–57.
124. Odeh, M. et al., 2011. Placental volume and three-dimensional
power Doppler analysis in prediction of pre-eclampsia and small for
gestational age between Week 11 and 13 weeks and 6 days of
gestation. Prenatal Diagnosis, 31(4), pp.367–371.
125. Odibo, A.O. et al., 2011. Placental volume and vascular flow
assessed by 3D power Doppler and adverse pregnancy outcomes.
Placenta, 32(3), pp.230–234.
126. Pairleitner, H. et al., 1999. Three-dimensional power Doppler
sonography: imaging and quantifying blood flow and vascularization.
Ultrasound in Obstetrics & Gynecology: The Official Journal of the
International Society of Ultrasound in Obstetrics and Gynecology,
14(2), pp.139–143.
127. Pardi, G. & Cetin, I., 2006. Human fetal growth and organ
development: 50 years of discoveries. American journal of obstetrics
and gynecology, 194(4), pp.1088–1099.
128. Pemberton, J. et al., 2005. The use of live three-dimensional
Doppler echocardiography in the measurement of cardiac output: an

157
in vivo animal study. Journal of the American College of Cardiology,
45(3), pp.433–438.
129. Petersch, B. & Hönigmann, D., 2007. Blood flow in its context:
combining 3D B-mode and color Doppler ultrasonic data. IEEE
Transactions on Visualization and Computer Graphics, 13(4), pp.748–
757.
130. Pomorski, M. et al., 2011. Comparative analysis of placental
vasculature and placental volume in normal and IUGR pregnancies
with the use of three-dimensional Power Doppler. Archives of
Gynecology and Obstetrics. Available at:
http://www.ncbi.nlm.nih.gov/pubmed/21744006 [Accedido julio 17,
2011].
131. Raine-Fenning, N J et al., 2008a. Determining the relationship
between three-dimensional power Doppler data and true blood flow
characteristics: an in-vitro flow phantom experiment. Ultrasound in
Obstetrics & Gynecology: The Official Journal of the International
Society of Ultrasound in Obstetrics and Gynecology, 32(4), pp.540–
550.
132. Raine-Fenning, N J et al., 2008b. Evaluation of the effect of
machine settings on quantitative three-dimensional power Doppler
angiography: an in-vitro flow phantom experiment. Ultrasound in
Obstetrics & Gynecology: The Official Journal of the International

158
Society of Ultrasound in Obstetrics and Gynecology, 32(4), pp.551–
559.
133. Ram, R. et al., 2011. New approaches in small animal
echocardiography: imaging the sounds of silence. American journal of
physiology. Heart and circulatory physiology, 301(5), pp.H1765–1780.
134. Rasanen, J et al., 1996. Role of the pulmonary circulation in the
distribution of human fetal cardiac output during the second half of
pregnancy. Circulation, 94(5), pp.1068–1073.
135. Reller, M.D. et al., 1987. Fetal lamb ventricles respond differently
to filling and arterial pressures and to in utero ventilation. Pediatric
research, 22(6), pp.621–626.
136. Richards, M.S. et al., 2009. Mean volume flow estimation in
pulsatile flow conditions. Ultrasound in Medicine & Biology, 35(11),
pp.1880–1891.
137. Rizzo, G. et al., 2009. First-trimester placental volume and
vascularization measured by 3-dimensional power Doppler
sonography in pregnancies with low serum pregnancy-associated
plasma protein a levels. Journal of Ultrasound in Medicine: Official
Journal of the American Institute of Ultrasound in Medicine, 28(12),
pp.1615–1622.
138. Robb, R.A., Aharon, S. & Cameron, B.M., 1997. Patient-specific
anatomic models from three dimensional medical image data for

159
clinical applications in surgery and endoscopy. Journal of Digital
Imaging: The Official Journal of the Society for Computer
Applications in Radiology, 10(3 Suppl 1), pp.31–35.
139. Robinson, J. et al., 1995. Placental control of fetal growth.
Reproduction, fertility, and development, 7(3), pp.333–344.
140. Ruano, R. et al., 2006. Quantitative analysis of fetal pulmonary
vasculature by 3-dimensional power Doppler ultrasonography in
isolated congenital diaphragmatic hernia. American Journal of
Obstetrics and Gynecology, 195(6), pp.1720–1728.
141. Rubin, J M, 1999. Flow quantification. European Radiology, 9
Suppl 3, pp.S368–371.
142. Rubin, J M et al., 1997. Normalizing fractional moving blood
volume estimates with power Doppler US: defining a stable
intravascular point with the cumulative power distribution function.
Radiology, 205(3), pp.757–765.
143. Rubin, J M et al., 1994. Power Doppler US: a potentially useful
alternative to mean frequency-based color Doppler US. Radiology,
190(3), pp.853–856.
144. Rubin, J M, Tuthill, T.A. & Fowlkes, J B, 2001. Volume flow
measurement using Doppler and grey-scale decorrelation. Ultrasound
in Medicine & Biology, 27(1), pp.101–109.

160
145. Rudolph, A.M., 1985. Distribution and regulation of blood flow in
the fetal and neonatal lamb. Circulation research, 57(6), pp.811–821.
146. Sandovici, Ionel et al., 2012. Placental adaptations to the
maternal-fetal environment: implications for fetal growth and
developmental programming. Reproductive biomedicine online.
Available at: http://www.ncbi.nlm.nih.gov/pubmed/22560117
[Accedido mayo 14, 2012].
147. Sauders, J.B., Wright, N. & Lewis, K.O., 1980. Measurement of
human fetal blood flow. British Medical Journal, 280(6210), pp.283–
284.
148. Schulten-Wijman, M.J. et al., 2011. Re: Three-dimensional power
Doppler: validity and reliability. Ultrasound in Obstetrics &
Gynecology: The Official Journal of the International Society of
Ultrasound in Obstetrics and Gynecology, 37(5), pp.620–621.
149. Sibley, C.P. et al., 2010. Review: Adaptation in placental nutrient
supply to meet fetal growth demand: implications for programming.
Placenta, 31 Suppl, pp.S70–74.
150. Simioni, C., Nardozza, L.M.M., Araujo Júnior, E., Rolo, Liliam
Cristine, et al., 2011. Fetal cardiac function assessed by spatio-
temporal image correlation. Archives of Gynecology and Obstetrics,
284(1), pp.253–260.

161
151. Simioni, C., Nardozza, L.M.M., Araujo Júnior, E., Rolo, Líliam
Cristine, et al., 2011. Heart stroke volume, cardiac output, and
ejection fraction in 265 normal fetus in the second half of gestation
assessed by 4D ultrasound using spatio-temporal image correlation.
The Journal of Maternal-Fetal & Neonatal Medicine: The Official
Journal of the European Association of Perinatal Medicine, the
Federation of Asia and Oceania Perinatal Societies, the International
Society of Perinatal Obstetricians. Available at:
http://www.ncbi.nlm.nih.gov/pubmed/21250911 [Accedido julio 17,
2011].
152. Smith, G.C.S. & Cameron, A.D., 2003. Estimating human fetal
blood volume on the basis of gestational age and fetal abdominal
circumference. BJOG: An International Journal of Obstetrics &
Gynaecology, 109(6), pp.721–722.
153. Smith, N.A. et al., 2010. Contemporary management of
monochorionic diamniotic twins: outcomes and delivery
recommendations revisited. American Journal of Obstetrics and
Gynecology, 203(2), pp.133.e1–6.
154. Smolich, J.J., Penny, D.J. & Mynard, J.P., 2012. Enhanced central
and conduit pulmonary arterial reservoir function offsets reduced
ductal systolic outflow during constriction of the fetal ductus

162
arteriosus. American journal of physiology. Regulatory, integrative
and comparative physiology, 302(1), pp.R175–183.
155. Sohn, C., 1993. [Ultrasound--future developments]. Bildgebung =
Imaging, 60(4), pp.301–309.
156. Staboulidou, I. et al., 2011. Prevalence and outcome of absence of
ductus venosus at 11(+0) to 13(+6) weeks. Fetal diagnosis and
therapy, 30(1), pp.35–40.
157. Staboulidou, I. et al., 2007. The significance of intracardiac
Doppler sonography in terms of fetal growth retardation. Archives of
gynecology and obstetrics, 276(1), pp.35–42.
158. Sun, Y. et al., 1995. Estimation of volume flow rate by surface
integration of velocity vectors from color Doppler images. Journal of
the American Society of Echocardiography: Official Publication of the
American Society of Echocardiography, 8(6), pp.904–914.
159. Tchirikov, M, Schröder, H J & Hecher, K, 2006. Ductus venosus
shunting in the fetal venous circulation: regulatory mechanisms,
diagnostic methods and medical importance. Ultrasound in Obstetrics
& Gynecology: The Official Journal of the International Society of
Ultrasound in Obstetrics and Gynecology, 27(4), pp.452–461.
160. Tchirikov, Michael, Strohner, M. & Scholz, A., 2010. Cardiac
output and blood flow volume redistribution during acute maternal

163
hypoxia in fetal sheep. Journal of perinatal medicine, 38(4), pp.387–
392.
161. Tchirikov, Mikhail et al., 2005. Structural evidence for mechanisms
to redistribute hepatic and ductus venosus blood flows in nonhuman
primate fetuses. American journal of obstetrics and gynecology,
192(4), pp.1146–1152.
162. Thomas, J.T. et al., 2012. Absent ductus venosus - outcomes and
implications from a tertiary centre. Prenatal diagnosis. Available at:
http://www.ncbi.nlm.nih.gov/pubmed/22610967 [Accedido junio 4,
2012].
163. Turan, Sifa, Miller, J. & Baschat, Ahmet A, 2008. Integrated
testing and management in fetal growth restriction. Seminars in
Perinatology, 32(3), pp.194–200.
164. Tuuli, M.G. et al., 2010. Validation of placental vascular
sonobiopsy for obtaining representative placental vascular indices by
three-dimensional power Doppler ultrasonography. Placenta, 31(3),
pp.192–196.
165. Uerpairojkit, B. et al., 2012. Are the cardiac dimensions spared in
growth-restricted fetuses resulting from uteroplacental insufficiency?
The journal of obstetrics and gynaecology research, 38(2), pp.390–
395.

164
166. Vallance, P., Collier, J. & Moncada, S., 1989. Effects of
endothelium-derived nitric oxide on peripheral arteriolar tone in man.
Lancet, 2(8670), pp.997–1000.
167. Volpe, P. et al., 2011. Fetal cardiac evaluation at 11-14 weeks by
experienced obstetricians in a low-risk population. Prenatal diagnosis,
31(11), pp.1054–1061.
168. Volpe, P. et al., 2002. Prenatal diagnosis of ductus venosus
agenesis and its association with cytogenetic/congenital anomalies.
Prenatal diagnosis, 22(11), pp.995–1000.
169. Wald, N.J., Bestwick, J.P. & Borrell, A., 2012. Adding ductus
venosus blood flow as a categorical variable to the Combined and
Integrated tests in Down’s syndrome screening. Journal of medical
screening, 19(1), pp.49–50.
170. Wei, S. et al., 2011. Idiopathic occlusion of the fetal ductus
arteriosus without lumen narrowing. Echocardiography (Mount Kisco,
N.Y.), 28(4), pp.E85–88.
171. Weichert, J., Hartge, D.R. & Axt-Fliedner, R., 2010. The fetal
ductus arteriosus and its abnormalities--a review. Congenital heart
disease, 5(5), pp.398–408.
172. Welsh, A, 2004. Quantification of power Doppler and the index
«fractional moving blood volume» (FMBV). Ultrasound in Obstetrics

165
& Gynecology: The Official Journal of the International Society of
Ultrasound in Obstetrics and Gynecology, 23(4), pp.323–326.
173. Welsh, A.W. et al., 2005. Standardization of power Doppler
quantification of blood flow in the human fetus using the aorta and
inferior vena cava. Ultrasound in Obstetrics & Gynecology: The
Official Journal of the International Society of Ultrasound in
Obstetrics and Gynecology, 26(1), pp.33–43.
174. Welsh, Aw et al., 2012. Inapplicability of the Fractional Moving
Blood Volume (FMBV) technique to standardise VOCAL indices for
quantified power Doppler. Ultrasound in Obstetrics & Gynecology:
The Official Journal of the International Society of Ultrasound in
Obstetrics and Gynecology. Available at:
http://www.ncbi.nlm.nih.gov/pubmed/22344971 [Accedido mayo 14,
2012].
175. Williams, D.J. et al., 1997. Nitric oxide-mediated vasodilation in
human pregnancy. The American Journal of Physiology, 272(2 Pt 2),
pp.H748–752.
176. Wolfberg, A.J. et al., 2007. Identification of fetal cerebral lactate
using magnetic resonance spectroscopy. American Journal of
Obstetrics and Gynecology, 196(1), pp.e9–11.
177. Yagel, S et al., 2006. Rendering in fetal cardiac scanning: the
intracardiac septa and the coronal atrioventricular valve planes.

166
Ultrasound in Obstetrics & Gynecology: The Official Journal of the
International Society of Ultrasound in Obstetrics and Gynecology,
28(3), pp.266–274.
178. Yamamura, J. et al., 2012. Cardiac MRI of the fetal heart using a
novel triggering method: Initial results in an animal model. Journal of
magnetic resonance imaging: JMRI, 35(5), pp.1071–1076.
179. Yigiter, A.B. et al., 2011. Placental volume and vascularization
flow indices by 3D power Doppler US using VOCAL technique and
correlation with IGF-1, free beta-hCG, PAPP-A, and uterine artery
Doppler at 11-14 weeks of pregnancy. Journal of Perinatal Medicine,
39(2), pp.137–141.

167
Annex 1 DISCLOSURES
1. Confidentiality agreemetn with Samsung Medison
NON DISCLOSURE AGREEMENT BETWEEN FUNDACIÓ HOSPITAL
UNIVERSITARI VALL DʹHEBRON INSTITUT DE RECERCA AND SAMSUNG
MEDISON EUROPE
This Agreement is made effective as of the date of the last signature hereto
by and between:
FUNDACIÓ HOSPITAL UNIVERSITARI VALL DʹHEBRON INSTITUT DE RECERCA
(hereinafter referred to as “VHIR”), a non‐for‐profit Spanish foundation
with tax identification number G‐60594009, based in Barcelona, Spain,
Passeig Vall d’Hebron, 119‐129, represented by Dr. Joan X. Comella
Carnicé.
and
SA,SING MEDISON EUROPE B.V. (hereinafter “SMNL”), a Dutch company with
tax identification number NL8151.86.368.B01 based in Parellaan 10, 2132WS,
Hoofddorp, The Netherlands represented by Ms/Mr. SH Ko that acts in his/her
capacity as a CEO
VHIR and Recipient are collectively referred to as the “Parties” and individually
as a “Party”.
RECITALS
I. VHIR is the owner of Confidential Information related to
developments and research in the field of Doppler ultrasound blood

168
flow velocity conducted by Dr. Bello and Dr. Carreras as defined
under this document.
II. VHIR considers the disclosure of Confidential Information to
Recipient to be necessary and desirable for the purpose of facilitating
discussion and evaluation of possible collaborative research,
development activities, commercialization of technology and/or other
related activities, etc. (hereinafter, the “Purpose”) and unauthorised
disclosure of such Confidential Information may cause irreparable
damages to VHIR.
III. Such Confidential Information is not public knowledge and is being
disclosed to Recipient only under the terms and conditions of the
present document.
IV. This Agreement is being entered into by and between the Parties in
order to protect the confidentiality and non‐disclosure of
Confidential Information by Recipient.
NOW THEREFORE, the Parties, mutually acknowledging their sufficient
legal capacity to enter into and be bound by this Non‐Disclosure
Agreement (hereinafter, the “Agreement”) agree as follows:
1. CONFIDENTIAL INFORMATION
1.1. For the purposes of this Agreement, ”Confidential Information“
means any business, commercial scientific or technical information
that VHIR discloses to Recipient, including but not limited to,
technical data, know‐how, ideas, inventions, concepts, business
plans, new products, agreements, projects, documents, mechanical or

169
electronic designs, logos, new technologies, planes, drawings,
designs, instructions, recommendations and any other information of
any nature regarding VHIR and its activity or which, under the
circumstances surrounding disclosure ought to be treated as
confidential by Recipient, that has been transferred by the VHIR to
Recipient prior to the execution of this Agreement or that is
transferred in the future, whether orally or in writing, or which is
made available to the Recipient.
1.2. Recipient acknowledges and agrees that Confidential Information in
his possession, whether currently or in the future, shall be deemed
valuable information or information owned by VHIR.
2. USE OF CONFIDENTIAL INFORMATION
2.1. Recipient shall use Confidential Information only for the Purpose.
2.2. Recipient agrees to hold in confidence any and all Confidential
Information disclosed, and further agrees not to disclose Confidential
Information to third parties or to use Confidential Information,
except for the Purpose or with the written permission from an
authorized officer of IR‐HUVH. For Clarification, Samsung
Medison, as a head office of Samsung Medison Europe B.V.,
located in Seoul , Korea, is not a third party.
2.3. Recipient undertakes to use its best efforts to limit access to
Confidential Information under its control solely to Recipientʹs
employees whose access to Confidential Information is essential,
provided that such employees have been specifically informed of the
confidentiality of Confidential Information and have agreed to be
bound by the terms of this Agreement or have entered into an
agreement of similar scope and obligations with Recipient to protect
the proprietary/confidential information of Recipient or the

170
proprietary/confidential information of third parties in Recipient’s
possession. Notwithstanding the above, Recipient shall remain liable
for the compliance of the terms and conditions of the present
Agreement by its employees.
2.4. Recipient shall use the same degree of care as Recipient uses to
protect its own confidential information of a similar nature, but no
less than reasonable care, to prevent the unauthorized use, disclosure
or publication of Confidential Information.
2.5. In the event that VHIR provides any computer software and/or
hardware to Recipient as Confidential Information, Recipient may
not directly or indirectly, disassemble, decrypt, electronically scan,
decompile or derive source code from Confidential Information, or
otherwise attempt to reverse engineer the design and function of
Confidential Information.
2.6. Recipient shall notify VHIR immediately upon discovery of any
unauthorized use or disclosure of Confidential Information or any
other breach of this Agreement by Recipient and its employees and
consultants, and cooperate with VHIR in order to help VHIR regain
possession of Confidential Information and prevent its further
unauthorized use or disclosure.
2.7. Recipient shall, at VHIR’s request, return all originals, copies,
reproductions and summaries of Confidential Information and all
other tangible materials and devices provided to the Recipient as
Confidential Information, or at VHIRʹs option, certify destruction of
the same.
2.8. Recipient shall fully comply with Spain’s imperative Organic Law
15/1999 of Personal Data Protection, when Confidential Information
includes personal data identifiable with any individual.

171
2.9. Should any of the Parties be interested in using any information
regarding this Agreement, whether in total or in part, to any other
third party, both Parties shall have to reach an agreement prior to
any disclosure of such information establishing the terms and
conditions of the disclosure of any such information.
3. OWNERSHIP OF CONFIDENTIAL INFORMATION
3.1. All Confidential Information is and shall remain the property of
VHIR, and VHIR may use such Confidential Information for any
purpose without obligation to Recipient. Neither the execution of this
Agreement nor the furnishing of any Confidential Information
hereunder shall be construed as an assignment or transmission,
neither expressly nor by implication, of any intellectual and/or
industrial property right now or hereinafter owned by or controlled
by IR‐HUVH.
3.2. Recipient covenants and undertakes not to use under its name (or
register), nor shall it collaborate with any third party for said
purpose, all or part of intellectual and/or industrial property rights,
patents or trademarks owned by VHIR.
4. PERSONAL DATA PROTECTION
4.1. Recipient agrees to abide by applicable personal data protection laws.
As a result, Recipient agrees to:
a) Use the data following the instructions of the owner of such
data.
b) Only use the data for the purposes of this Agreement.

172
c) Not disclose to third parties nor copy any personal data, even
for conservation purposes.
d) Apply all the reasonable security measures, and in any case
those required by the Law, in order to preserve the integrity,
confidentiality and the disposure/traffic of the data.
e) Destroy the personal data, including any documentation or
format containing such information, or return it to the other
party, upon termination of this Agreement.
5. LIMITATIONS ON CONFIDENTIALITY
Nothing in this Agreement shall be interpreted as placing any
obligation of confidentiality and non‐use by Recipient with respect to
any information that:
(a) can be demonstrated to have been in the public domain as of the
effective date of this Agreement, or legitimately comes into the
public domain through no fault of the Recipient; or
(b) can be demonstrated to have been known by the Recipient prior
to execution of this Agreement and that it has not been
acquired, directly or indirectly, from VHIR or from a third party
under a continuing obligation of confidentiality; or
(c) can be demonstrated to have been independently developed by
personnel of the Recipient who had no substantive knowledge
of any information provided by VHIR; or
(d) is required to be disclosed pursuant to law or court order,
provided that Recipient provides prior notice to VHIR and

173
provides sufficient time to VHIR to assert any exclusions or
privileges that may be available by law.
6. LIMITED WARRANTY AND LIABILITY
VHIR makes no warranties in respect of Confidential Information
and provides all information “as is”, without any express or implied
warranty of any kind, including any warranty as to merchantability,
fitness for a particular purpose, accuracy, completeness or violation
of third party intellectual and/or property rights. In no event shall
VHIR be liable for any special, incidental or consequential damages
of any kind whatsoever resulting from the disclosure, use or receipt
of Confidential Information.
7. REMEDIES
The Parties acknowledge that monetary damages may not be a
sufficient remedy for unauthorized disclosure of Confidential
Information and that VHIR shall be entitled, without waiving any
other rights or remedies, to such injunctive or equitable relief as may
be deemed proper by a court of competent jurisdiction.
8. TERM
8.1. The term of this Agreement is of [five] (5) years. Notwithstanding the
referred term, this Agreement shall remain in full force and effect
indefinitely for as long as Confidential Information is secret and
confidential. In the event any Confidential Information should be
under physical control of the Recipient before this Agreement is
signed, the terms and provisions shall apply for such Confidential
Information retroactively.

174
8.2. Upon expiration or termination of this Agreement, Recipient will
immediately cease any and all disclosures or uses of Confidential
Information and, upon request by VHIR, all such information
obtained from VHIR and all copies thereof made by Recipient will be
destroyed or returned to VHIR within fifteen (15) days.
9. MISCELLANEOUS
9.1. Any formal notice required or permitted by this Agreement must be
delivered in writing and sent by certified mail, return receipt
requested, addressed to the other Party at the address shown at the
beginning of this Agreement or at such other address for which such
Party gives notice hereunder.
9.2. Should any part, article, paragraph, sentence or clause of this
Agreement be deemed vague, valid or inapplicable, such part shall
be eliminated and the rest of the Agreement shall remain valid and in
force.
9.3. The Agreement may not be changed, modified, or discharged, in
whole or in part, except by a subsequent agreement in writing signed
by authorized representatives of VHIR and Recipient.
9.4. This Agreement shall be construed according to the laws of Spain,
except its provision on conflicts of law. Any dispute arising from the
interpretation and/or implementation of this Agreement, which
cannot be settled amicably, shall be brought before a competent court
of the city of Barcelona.
IN WITNESS WHEREOF, the Parties have caused this Agreement to be executed by
their duly authorized representatives.

175
SIGNATURES:
For and on behalf of FUNDACIÓʹHOSPITAL UNIVERSITARI VALL
DʹHEBRON INSTITUT DE RECERCA
NAME: DR. JOAN X. COMELLA CARNICÉ
TITLE: DIRECTOR
DATE: 28 JUNE 2011
SIGNATURE:
For and on behalf of Samsung Medison Europe B.V.
NAME: SUNGHO KO
TITLE: CEO
DATE: 28 JUNE 2011
SIGNATURE:

176
Annex II Patent application [Spanish] FORMULARI DE SOL·LICITUD DE NOVA INVENCIÓ Nom JUAN CARLOS BELLO MUÑOZ Correu electrònic [email protected] Telèfon 646488475 Dades de la tecnologia 1. Títol Volume Perfusion Index (VPI) 2. Inventors Qui s’ha de considerar inventor: La qüestió a respondre és qui ha concebut la invenció. Si una persona no contribueix a la concepció de la invenció, no es inventor. Respecte a definir la inventoria, la reducció a la practica per se es irrellevant, així como la mera suggestió de la idea a aconseguir (la persona que suggereix una idea d’un resultat a aconseguir, en lloc dels medis per a aconseguir-lo, tampoc és inventor). S’ha de tenir en compte que no és essencial per a un inventor haver estat implicat personalment en les etapes del procés d’obtenció de la invenció, sempre que la implementació d’aquestes etapes no requereixi una activitat inventiva. Sota el mateix principi, no es pot considerar inventor la persona implicada en les etapes d’obtenció de la invenció on aquestes etapes no requereixin activitat inventiva per part d’aquesta persona. Cal indicar a continuació el nom complert i el percentatge de participació de la invenció.
Nom i cognoms Relació laboral Entitat Percentatge JUAN CARLOS BELLO MUÑOZ
Contracte mercantil
HOSPITAL VALL D'HEBRON
50%
MAURICIO AYALA SANCHEZ
Estudiante de doctorado
Universitat de Barcelona
50%
3. Descripció Desarrollo de un modelo matemático para evaluar la perfusión tisular fetal (Cerebral, Renal y Hepática).
4. Aplicacions de la invenció En Medicina Fetal podría emplearse para mejorar la calidad de la evaluación hemodinámica en fetos con sospecha de insuficiencia placentaria

177
5. Model assistencial en el que incideix la invenció Incide en el cuidado prenatal de alto riesgo
6. Millores i avantatges de la tecnologia sobre el model assistencial actual 1. El modelo asistencial actual se basa en el uso de Doppler pulsado para calcular indices que INDIRECTAMENTE miden la resistencia periférica al flujo (Anexo 1) 2. Las limitaciones del modelo actual consisten en su baja sensibilidad para detectar alteraciones en la perfusión de órganos. (Por ejemplo la oliguria fetal se instaura sin que se alteren estos índices en la circulación renal) (Anexo 2) 3. Se ha intentado medir flujo y perfusión con power Doppler 3D sin exito (Anexo 3) 4 Se han planteado modelos teóricos previos sin comprobación experimental hasta el momento (Anexo 4). El modelo propuesto permitirá aumentar la precisión de las determinaciones hemodinámicas fetales y potencialmente podría aumentar la calidad del seguimiento 7. Productes/processos competidors o alternatius El Doppler color y Doppler pulsado y Los índices de power Doppler tridimensional: cuyas limitaciones ya hemos discutido
8. Tipus d'usuaris de la tecnologia Los usuarios potenciales serían los especialistas en Medicina Materno Fetal del mundo. También serían la población diana de cara a la difusión de resultados. 9. Tipus empreses potencials de la tecnologia (empreses diana, tipus de possibles llicenciataris) Se han adelantado conversaciones preliminares con Samsung Corporation, propietarios de la marca de ecógrafos Medison 10. S'ha fet divulgació? Mitjà de divulgació Data divulgació Se ha hecho divulgación de los procesos previos a esta solución (algunos también desarrollados por nosotros) en un capítulo del libro Ultrasonography (Anexo 5) Se ha hecho divulgación de las etapas previas hasta el primer modelo animal (gasto cardiaco) en el Congreso Mundial de Ultrasonido en Obstetricia y Ginecología. (Anexo6)

178
11. Està prevista una pròxima divulgació? Mitjà de divulgació Data divulgació No está prevista SIN EMBARGO la tesis doctoral de JCBM menciona los procesos previos para llegar a esta solución (mencionados superficialmente en el capítulo del libro) Finançament / Acords 1. Fons de finançament Esta investigación se ha financiado con fondos propios de la unidad de Medicina Fetal, provenientes de cursos y demás actividades educativas. 2. Material adquirit? Ampliar No, los equipos empleados para la investigación se adquirieron para uso clínico Estat 1. Estat de la invenció La fórmula se ha ensayado en un modelo animal preliminar que permitía calcular el gasto cardiaco combinado (que es la medición de flujo mas gruesa que se puede intentar en el feto ) y que demostró que el cálculo del flujo se puede inferir con certeza razonable. El paso siguiente se resume en el anexo preparado por MAS (Anexo 7) 2. Hi ha plans de millora? Ampliar Se están iniciando estudios de validación clínica con fetos sanos de cara a establecer valores de normalidad, rangos de referencia y estadísticos necesarios para desarrollar su empleo en la práctica clínica. Se inciará este año un estudio de evaluación de la perfusión cerebral en fetos con anomalías cardiacas congénitas. 3. Hi ha hagut mostres d’interès? Ampliar La mencionada empresa SAMSUNG –Medison ha suscrito un acuerdo de confidencialidad con el IR Vall d’Hebron de cara a compartir información para el desarrollo de la herramienta a nivel de la industría electromédica.

179
Annex 3 Matlab ® Code Line for generating the fitted value and the
function for calculating the VPI
function [X,resnorm,residual,exitflag,output,lambda] = lsqlin(C,d,A,b,Aeq,beq,lb,ub,X0,options,varargin) %LSQLIN Constrained linear least squares. % X = LSQLIN(C,d,A,b) attempts to solve the least-squares problem % % min 0.5*(NORM(C*x-d)).^2 subject to A*x <= b % x % % where C is m-by-n. % % X = LSQLIN(C,d,A,b,Aeq,beq) solves the least-squares % (with equality constraints) problem: % % min 0.5*(NORM(C*x-d)).^2 subject to % x A*x <= b and Aeq*x = beq % % X = LSQLIN(C,d,A,b,Aeq,beq,LB,UB) defines a set of lower and upper % bounds on the design variables, X, so that the solution % is in the range LB <= X <= UB. Use empty matrices for % LB and UB if no bounds exist. Set LB(i) = -Inf if X(i) is unbounded % below; set UB(i) = Inf if X(i) is unbounded above. % % X = LSQLIN(C,d,A,b,Aeq,beq,LB,UB,X0) sets the starting point to X0. % % X = LSQLIN(C,d,A,b,Aeq,beq,LB,UB,X0,OPTIONS) minimizes with the default % optimization parameters replaced by values in the structure OPTIONS, an % argument created with the OPTIMSET function. See OPTIMSET for details. % Used options are Display, Diagnostics, TolFun, LargeScale, MaxIter, % JacobMult, PrecondBandWidth, TypicalX, TolPCG, and MaxPCGIter. % Currently, only 'final' and 'off' are valid values for the parameter % Display ('iter' is not available). %

180
% X = LSQLIN(PROBLEM) solves the least squares problem defined in % PROBLEM. PROBLEM is a structure with the matrix 'C' in PROBLEM.C, the % vector 'd' in PROBLEM.d, the linear inequality constraints in % PROBLEM.Aineq and PROBLEM.bineq, the linear equality constraints in % PROBLEM.Aeq and PROBLEM.beq, the lower bounds in PROBLEM.lb, the upper % bounds in PROBLEM.ub, the start point in PROBLEM.x0, the options % structure in PROBLEM.options, and solver name 'lsqlin' in % PROBLEM.solver. Use this syntax to solve at the command line a problem % exported from OPTIMTOOL. The structure PROBLEM must have all the % fields. % % [X,RESNORM] = LSQLIN(C,d,A,b) returns the value of the squared 2-norm % of the residual: norm(C*X-d)^2. % % [X,RESNORM,RESIDUAL] = LSQLIN(C,d,A,b) returns the residual: C*X-d. % % [X,RESNORM,RESIDUAL,EXITFLAG] = LSQLIN(C,d,A,b) returns an EXITFLAG % that describes the exit condition of LSQLIN. Possible values of % EXITFLAG and the corresponding exit conditions are % % 1 LSQLIN converged to a solution X. % 3 Change in the residual smaller that the specified tolerance. % 0 Maximum number of iterations exceeded. % -2 Problem is infeasible. % -4 Ill-conditioning prevents further optimization. % -7 Magnitude of search direction became too small; no further % progress can be made. The problem is ill-posed or badly % conditioned. % % [X,RESNORM,RESIDUAL,EXITFLAG,OUTPUT] = LSQLIN(C,d,A,b) returns a % structure OUTPUT with the number of iterations taken in % OUTPUT.iterations, the type of algorithm used in OUTPUT.algorithm, the % number of conjugate gradient iterations (if used) in OUTPUT.cgiterations, % a measure of first order optimality (large-scale algorithm only) in % OUTPUT.firstorderopt, and the exit message in OUTPUT.message. %

181
% [X,RESNORM,RESIDUAL,EXITFLAG,OUTPUT,LAMBDA] = LSQLIN(C,d,A,b) returns % the set of Lagrangian multipliers LAMBDA, at the solution: % LAMBDA.ineqlin for the linear inequalities C, LAMBDA.eqlin for the % linear equalities Ceq, LAMBDA.lower for LB, and LAMBDA.upper for UB. % % See also QUADPROG. % Copyright 1990-2011 The MathWorks, Inc. % $Revision: 1.1.6.3 $ $Date: 2011/05/09 01:16:16 $ defaultopt = struct( ... 'Diagnostics','off', ... 'Display','final', ... 'JacobMult',[], ... 'LargeScale','on', ... 'MaxIter',200, ... 'MaxPCGIter','max(1,floor(numberOfVariables/2))', ... 'PrecondBandWidth',0, ... 'TolFun',100*eps, ... 'TolPCG',0.1, ... 'TypicalX','ones(numberOfVariables,1)' ... ); % If just 'defaults' passed in, return the default options in X if nargin==1 && nargout <= 1 && isequal(C,'defaults') X = defaultopt; return end % Handle missing arguments if nargin < 10 options = []; if nargin < 9 X0 = []; if nargin < 8 ub = []; if nargin < 7 lb = []; if nargin < 6 beq = []; if nargin < 5 Aeq = []; if nargin < 4 b = []; if nargin < 3 A = []; end end end

182
end end end end end % Detect problem structure input if nargin == 1 if isa(C,'struct') [C,d,A,b,Aeq,beq,lb,ub,X0,options] = separateOptimStruct(C); else % Single input and non-structure. error(message('optimlib:lsqlin:InputArg')); end end if nargin == 0 error(message('optimlib:lsqlin:NotEnoughInputs')) end % Check for non-double inputs % SUPERIORFLOAT errors when superior input is neither single nor double; % We use try-catch to override SUPERIORFLOAT's error message when input % data type is integer. try dataType = superiorfloat(C,d,A,b,Aeq,beq,lb,ub,X0); catch ME if strcmp(ME.identifier,'MATLAB:datatypes:superiorfloat') dataType = 'notDouble'; end end if ~strcmp(dataType,'double') error(message('optimlib:lsqlin:NonDoubleInput')) end % Set up constant strings medium = 'medium-scale: active-set'; large = 'large-scale: trust-region reflective Newton'; unconstrained = 'slash'; output.iterations = []; % initialize so that it will be the first field % Options setup largescale = strcmpi(optimget(options,'LargeScale',defaultopt,'fast'),'on'); diagnostics = strcmpi(optimget(options,'Diagnostics',defaultopt,'fast'),'on'); mtxmpy = optimget(options,'JacobMult',defaultopt,'fast'); % Check if name clash

183
functionNameClashCheck('JacobMult',mtxmpy,'atamult','optimlib:lsqlin:JacobMultNameClash'); % Use internal Jacobian-multiply function if user does not provide JacobMult function if isempty(mtxmpy) mtxmpy = @atamult; end switch optimget(options,'Display',defaultopt,'fast') case 'off','none' verbosity = 0; case 'iter','iter-detailed' verbosity = 2; case 'final','final-detailed' verbosity = 1; otherwise verbosity = 1; end % Set the constraints up: defaults and check size [nineqcstr,numberOfVariables]=size(A); neqcstr = size(Aeq,1); ncstr = nineqcstr + neqcstr; if isempty(C) || isempty(d) error(message('optimlib:lsqlin:FirstTwoArgsEmpty')) else numberOfVariables = max([size(C,2),numberOfVariables]); % In case C is empty end [rows,cols]=size(C); if length(d) ~= rows error(message('optimlib:lsqlin:InvalidCAndD')) end if length(b) ~= size(A,1) error(message('optimlib:lsqlin:InvalidAAndB')) end if length(beq) ~= size(Aeq,1) error(message('optimlib:lsqlin:InvalidAeqAndBeq')) end if ( ~isempty(A)) && (size(A,2) ~= cols) error(message('optimlib:lsqlin:CAndA')) end if ( ~isempty(Aeq)) && (size(Aeq,2) ~= cols) error(message('optimlib:lsqlin:CAndAeq')) end

184
if isempty(X0) % This zero-valued X0 will potentially be changed in sllsbox or qpsub. % (This potentially temporary zero-valued x0 needed here for backwards % compatibility because it's returned in output x if early termination % occurs when bounds are inconsistent.) X0 = zeros(numberOfVariables,1); params.emptyInitialPoint = true; % parameter passed to sllsbox else params.emptyInitialPoint = false; % parameter passed to sllsbox end if isempty(A) A = zeros(0,numberOfVariables); end if isempty(b) b = zeros(0,1); end if isempty(Aeq) Aeq = zeros(0,numberOfVariables); end if isempty(beq) beq = zeros(0,1); end % Set d, b and X to be column vectors d = d(:); b = b(:); beq = beq(:); X0 = X0(:); [X0,lb,ub,msg] = checkbounds(X0,lb,ub,numberOfVariables); if ~isempty(msg) exitflag = -2; [resnorm,residual,lambda]=deal([]); output.iterations = 0; output.algorithm = ''; % not known at this stage output.firstorderopt=[]; output.cgiterations =[]; output.message = msg; X=X0; if verbosity > 0 disp(msg) end return end % Test if C is all zeros or empty if norm(C,'inf')==0 || isempty(C)

185
C=0; end caller = 'lsqlin'; % Test for constraints if isempty([Aeq;A]) && isempty([beq;b]) && all(isinf([lb;ub])) output.algorithm = unconstrained; % If interior-point chosen and no A,Aeq and C isn't short and fat, then call sllsbox elseif largescale && (isempty([A;Aeq])) && (rows >= cols) output.algorithm = large; else if largescale if (rows < cols) warning(message('optimlib:lsqlin:MoreColsThanRows')) else % ~isempty([A;Aeq])) warning(message('optimlib:lsqlin:LinConstraints')) end end output.algorithm = medium; end if diagnostics % Do diagnostics on information so far gradflag = []; hessflag = []; constflag = false; gradconstflag = false; non_eq=0;non_ineq=0; lin_eq=size(Aeq,1); lin_ineq=size(A,1); XOUT=ones(numberOfVariables,1); funfcn1 = []; confcn1=[]; msg = diagnose('lsqlin',output,gradflag,hessflag,constflag,gradconstflag,... XOUT,non_eq,non_ineq,lin_eq,lin_ineq,lb,ub,funfcn,confcn); end switch output.algorithm; case 'slash' % Disable the warnings about conditioning for singular and % nearly singular matrices warningstate1 = warning('off', 'MATLAB:nearlySingularMatrix'); warningstate2 = warning('off', 'MATLAB:singularMatrix'); X = C\d; % Restore the warning states to their original settings warning(warningstate1) warning(warningstate2) residual = C*X-d; resnorm = sum(residual.*residual); exitflag = 1; lambda.lower = []; lambda.upper = []; lambda.ineqlin = [];

186
lambda.eqlin = []; output.iterations = 0; output.algorithm = unconstrained; output.firstorderopt=[]; output.cgiterations =[]; output.message = ''; case 'large-scale: trust-region reflective Newton'; params.verb = verbosity; % pack parameters together into struct [X,resnorm,residual,firstorderopt,iterations,cgiterations,exitflag,lambda,msg]=... sllsbox(C,d,lb,ub,X0,params,options,defaultopt,mtxmpy,varargin:); output.iterations = iterations; output.algorithm = large; output.firstorderopt = firstorderopt; output.cgiterations = cgiterations; output.message = msg; case 'medium-scale: active-set' if largescale && ( issparse(A) || issparse(C) || issparse(Aeq) )% asked for sparse warning(message('optimlib:lsqlin:ConvertToFull')) end % Create options structure for qpsub lsqlinoptions.MaxIter = optimget(options,'MaxIter',defaultopt,'fast'); % A fixed constraint tolerance (eps) is used for constraint % satisfaction; no need to specify any value lsqlinoptions.TolCon = []; [X,lambdaqp,exitflag,output,dum1,dum2,msg]= ... qpsub(full(C),d,[full(Aeq);full(A)],[beq;b],lb,ub,X0,neqcstr,verbosity,caller,ncstr,numberOfVariables,lsqlinoptions); output.algorithm = medium; % qpsub overwrites output with output.iterations residual = C*X-d; resnorm = sum(residual.*residual); end if isequal(output.algorithm , medium) llb = length(lb); lub = length(ub); lambda.lower = zeros(llb,1); lambda.upper = zeros(lub,1); arglb = ~isinf(lb); lenarglb = nnz(arglb); argub = ~isinf(ub); lenargub = nnz(argub); lambda.eqlin = lambdaqp(1:neqcstr,1); lambda.ineqlin = lambdaqp(neqcstr+1:neqcstr+nineqcstr,1); lambda.lower(arglb) = lambdaqp(neqcstr+nineqcstr+1:neqcstr+nineqcstr+lenarglb);

187
lambda.upper(argub) = lambdaqp(neqcstr+nineqcstr+lenarglb+1:neqcstr+nineqcstr+lenarglb+lenargub); output.firstorderopt=[]; output.cgiterations =[]; output.message = msg; if exitflag == 1 % qpsub terminated successfully normalTerminationMsg = sprintf('Optimization terminated.'); if verbosity > 0 disp(normalTerminationMsg) end if isempty(msg) output.message = normalTerminationMsg; else % append normal termination msg to current output msg output.message = sprintf('%s\n%s',msg,normalTerminationMsg); end else output.message = msg; end end

188
Annex 4 Abstract of a preliminary report on the current work as accepted to the XX World Congress of the International Society of Ultrasound In Obstetrics and Gynecology (and nominee for the Alfred Kratochwil medal) Volume 36, Issue S1, October 2010, Page: 46

189
Annex 5 Protocol for volume taking as it is already implemented in our Fetal
Medicine Unit
Corazón STIC Color
Ajustes del 2D Ajustes de imagen: Ángulo 30º-FPR 30 Ganancia muy baja (-6).• Contraste (rango dinámico) 5.• NO SRI 5/ CRI 2
• Ajustes del 3D• Calidad Máxima Volumen (ángulo): 20-24 sem : 40º 24-28 sem : 50º 28-32 sem : 60º
Dorso posterior o lateral derecho (feto cefálico) o izquierdo (podálico)
Ajustes del 4D Tiempo de toma 20-24 sem : 7,5” 24-28 sem : 10” 28-32 sem : 12” No sirven volúmenes parciales No sirven otros planos de toma No sirven volúmenes con
movimiento