
Career development in the canadian workplace location breakdown
Upload
trankhuongCategory
view
216download
0
Discussion Paper/Document d’analyse 2012-7
Canadian Bank Balance-Sheet Management: Breakdown by Types of Canadian Financial Institutions
by David Xiao Chen, H. Evren Damar, Hani Soubra and Yaz Terajima

2
Bank of Canada Discussion Paper 2012-7
September 2012
Canadian Bank Balance-Sheet Management: Breakdown by Types of
Canadian Financial Institutions
by
David Xiao Chen,1 H. Evren Damar,2 Hani Soubra2 and Yaz Terajima3
1Data and Statistics Office 2Financial Stability Department
3Canadian Economic Analysis Department Bank of Canada
Ottawa, Ontario, Canada K1A 0G9 [email protected]
[email protected] [email protected] [email protected]
Bank of Canada discussion papers are completed research studies on a wide variety of technical subjects relevant to central bank policy. The views expressed in this paper are those of the authors.
No responsibility for them should be attributed to the Bank of Canada.
ISSN 1914-0568 © 2012 Bank of Canada

ii
Acknowledgements
The authors would like to thank Ian Christensen, Sami Alpanda and Virginie Traclet at the Bank
of Canada, and a number of our colleagues in other Ottawa agencies for their comments,
suggestions and inputs.
iii
Abstract
The authors document leverage, capital and liquidity ratios of banks in Canada. These ratios are
important indicators of different types of risk with respect to a bank’s balance‐sheet
management. Particular attention is given to the observations by different types of banks,
including small banks that historically received less attention. In addition, the authors compare
leverage and capital ratios for banks in Canada and the United States in the period leading up to
the recent crisis. They find that in Canada, most of the risks indicated by these balance‐sheet
ratios are concentrated among large banks that are more likely able to withstand shocks due to
their diversified portfolios. Some smaller banks, however, reveal vulnerability against liquidity
risks. Regarding a Canada–U.S. comparison, small U.S. banks show more vulnerability than their
larger counterparts, as well as an increasing trend in vulnerability prior to the crisis. In contrast,
the ratios for small Canadian banks show increasing resilience.
JEL classification: G21, G28 Bank classification: Financial institutions; Financial stability; Financial system regulation and policies
Résumé
Les auteurs étudient les ratios de levier, de fonds propres et de liquidité des banques au Canada.
Ces ratios sont d’importants indicateurs des différents types de risques du point de vue de la
gestion des bilans bancaires. Les auteurs prêtent une attention particulière aux observations
concernant différents types d’établissements, notamment les banques de petite taille
auxquelles on est historiquement moins attentif. Par ailleurs, ils comparent les ratios de levier et
de fonds propres des banques au Canada et aux États‐Unis au cours de la période qui a précédé
la crise récente. Ils constatent qu’au Canada, la plupart des risques signalés par ces ratios de
bilan se concentrent dans les grandes banques, qui, du fait de leurs portefeuilles diversifiés, sont
plus susceptibles de résister aux chocs. Certaines institutions de plus petite taille se révèlent par
contre vulnérables face aux risques de liquidité. Pour ce qui est de la comparaison entre le
Canada et les États‐Unis, les auteurs notent que les petites banques américaines affichent plus
de vulnérabilité que leurs homologues de grande taille et que cette fragilité tendait à augmenter
avant la crise. Dans le cas des petites banques au Canada, les ratios examinés dénotent au
contraire une résilience croissante.
Classification JEL : G21, G28 Classification de la Banque : Institutions financières; Stabilité financière; Réglementation et politiques relatives au système financier

1
1. Introduction
A safe and efficient financial system contributes to efficient allocations of resources in an economy, given that financial services are an essential input in all sectors.1 A bank failure not only can potentially disrupt financial services to economic agents, but also can potentially lead to other bank failures through contagion. Arguably, the larger the bank, the greater its systemic implications. This is mainly why policy‐makers have long been concerned with, and focused on, the financial stability and soundness of the large, internationally active banks. However, smaller banks tend to have less‐diversified portfolios and more‐concentrated operations geographically.2 Thus, they may be more vulnerable to sector‐specific or region‐specific shocks than larger banks with well‐diversified portfolios located within a broader geographic area. Concurrent small bank failures could also be a source of instability to the financial system.3,4
In order to assess risks arising from different types of financial institutions, it is important to first understand the similarities and differences among them. This paper examines data on different financial institutions to document and analyze indicators of balance‐sheet risks, such as leverage, capital and liquidity ratios. We take two separate approaches in achieving this goal. First, using Canadian data, we explore the similarities and differences in risks to the balance sheets of various financial institutions, grouped by their balance‐sheet size, charter type and reliance on market‐based funding. Second, we compare balance‐sheet risk indicators of Canadian and U.S. financial institutions, paying particular attention to the period leading up to the recent financial crisis.
Our main findings regarding the first objective are summarized as follows. First, risk indicators have decreased during the past three decades for most non‐Big Six financial institutions, and have remained relatively unchanged for the Big Six banks.5 As a result, a divergence between non‐Big Six and the Big Six banks is observed, especially in leverage and capital ratios. Second, heterogeneity among non‐Big Six financial institutions has increased, especially in capital and funding ratios. The observed overall decline and increased heterogeneity in the risk indicators follow certain regulatory changes, such as the introduction of liquidity guidelines on funding in 1995 and the implementation of bank‐specific leverage requirements in 2000. This suggests that regulatory changes have had significant and heterogeneous effects on the management of balance sheets by financial institutions
1 For more details on the relationship between the banking sector and economic growth, see King and Levine (1993); Levine (1997); Northcott (2004). 2 Berger et al. (2005), for example, argue that small banks tend to follow a model that involves “relationship lending,” which requires more information than simply what credit scores and financial records reveal. This model makes it easier for small banks to lend to certain types of borrowers that may otherwise find it difficult to obtain credit. 3 “Despite their small size, the Canadian Commercial Bank (CCB) and Northland Bank failures in 1985 were seen to have had the potential to adversely affect the broader Canadian banking system” (Illing and Liu 2003, 9). 4 See Allen and Gale (2000); Chan‐Lau (2010). Also, Gauthier et al. (2011) argue that a small bank can potentially be systemically important due to its centrality in the interbank network of counterparties. 5 The Canadian banking sector is dominated by the largest six banks, sometimes referred to as the Big Six banks. See Appendix D for a list of their names.

2
and, given that these regulations required more balance‐sheet risk management, they contributed to the increased resilience of the banking sector.
Third, some noteworthy observations are made among non‐Big Six financial institutions. In the size category, large non‐Big Six financial institutions are found to be similar in balance‐sheet ratios to those of the Big Six, due to their similarities in asset and liability portfolios. Regarding the charter‐type category, non‐Big Six domestic banks persistently exhibit low asset‐liquidity ratios relative to other charter types and relative to the Big Six banks. When we look at the funding category, high wholesale funding financial institutions have a historically very high average funding ratio, at 70 per cent. Although this number is by default higher than that of all other non‐Big Six financial institutions, it is interesting to note that the average funding ratio of the Big Six, which house investment banking businesses, is only about 46 per cent. However, this difference has shrunk over time, such that in the 2000s, non‐Big Six high wholesale financial institutions funded 52 per cent of assets by wholesale funding, compared to 46 per cent for the Big Six banks.
Regarding our second objective – comparing Canada and the United States – we find that the leverage ratios of small banks had been increasingly lower than those of their larger peers in Canada leading up to the crisis, while small banks in the United States had higher ratios than their larger peers. Thus, in the United States, the risk associated with high leverage was more concentrated among smaller banks that are typically more vulnerable to a wider range of adverse shocks than the larger banks.
Our paper is relevant to others studying the specifics of the Canadian banking sector, as well as those analyzing dynamics of bank heterogeneity. Recent literature discusses differences that potentially contributed to less‐severe stress among banks and in the banking system in Canada during the crisis. Brean, Kryzanowski and Roberts (2011) argue that the regulatory and structural differences between the Canadian and American banking systems can help explain the different outcomes in bank performance during the crisis. Most notably, they argue that the greater stability of the Canadian system stems from the stringent and prudent banking regulations over the years. Also, Ratnovski and Huang (2009) assess key sources of large Canadian banks’ resilience during the financial crisis. Their paper analyzes whether pre‐crisis conditions at global banks in terms of three structural balance‐sheet ratios (capital, liquidity and funding ratios) were a significant determinant of bank performance during the crisis, and whether they required government assistance. They argue that the funding structure of Canadian banks, combined with stringent and prudent regulatory oversight, was the key source of their resilience during the crisis. Wagster (2012) argues that the Canadian banks fared well during the Great Depression due to close supervision by regulators that required the banks to raise and maintain high capital ratios during good times. Also, he argues that there are similarities between the banks’ capital structure in the 1930s and the Basel III requirements. In addition to a double‐liability feature (similar to contingent capital), the banks’ capital in the 1930s comprised mainly common equity, similar to the Basel III common equity Tier 1 ratio. Moreover, bank note issuance regulations, which are directly linked to the level of capital that banks hold and to credit growth, mirrored features that the countercyclical buffer of Basel III is trying to achieve.

3
Regarding the heterogeneity of banks, Ennis (2001) argues that bank‐size heterogeneity is a result of an explicit equilibrium choice rather than a transitory phenomenon, as the life‐cycle theories of firms prescribe. But regulations concerning branching restrictions also played a role in the large numbers of small banks in the United States, in contrast to the Canadian financial system, where no such regulations were in place.
The rest of this paper is organized as follows: section 2 describes the data and the methodology used in this study. Section 3 discusses the heterogeneity in balance‐sheet ratios among the Canadian banks and section 4 compares Canadian and U.S. banks. Section 5 offers some conclusions.
2. Data and Methodology This section discusses the data source, the definition of the banking variables and the methodology for grouping the banks. 2.1. Data source
Our database for the Canadian financial institutions is based on financial regulatory reports, jointly owned by the Bank of Canada, the Office of the Superintendent of Financial Institutions (OSFI) and the Canadian Deposit Insurance Corporation (CDIC).6
The database is organized by “returns,” which represent regulatory reporting forms for all federally regulated deposit‐taking institutions (DTIs).7,8 Those returns have evolved over the years to reflect the changes to the Bank Act, accounting rules and regulations. The first returns date back to 1976, but were replaced by new returns packages in 19819 as a result of the Bank Act revision. Again, in 1991, the Bank Act was revisited but it was not until 199410 that major reforms were made to the returns packages (see Appendix A for more details on regulatory changes). Since the number of reporting institutions stabilized after mid‐1982, we limit our analysis to the period starting in 1983.
As of 2010, the database comprises 25 different regulatory returns (see Appendix C for the complete list of returns).11 There are four “core” returns: the Basel Capital Adequacy Return (BCAR), the Quarterly Supplementary Return for Foreign Bank Branches (K3), the Income Statement (P3) and the Balance Sheet (M4/L4). The other returns correspond to additional information on selected balance‐sheet items (e.g., non‐mortgage loan breakdowns by industry (A2), and loans in arrears (N3)). The reported frequency is not identical across all returns. They are reported monthly, quarterly (fiscal or
6 Data since 1996 are available from OSFI at <http://www.osfi‐bsif.gc.ca/osfi/index_e.aspx?ArticleID=554>. 7 In this paper, we use “bank,” “deposit‐taking institution” and “financial institution” interchangeably unless otherwise specified. 8 The reporting forms are available from OSFI at <http://www.osfi‐bsif.gc.ca/osfi/index_e.aspx?DetailID=520>. 9 For more detail on the changes, see Bank of Canada Review December 1982 and earlier issues. 10 For more detail on the changes, see Bank of Canada Review 1993‐1994 winter issue and OSFI reporting instructions. 11 These returns are available at <http://www.osfi‐bsif.gc.ca/osfi/index_e.aspx?DetailID=520>.

4
calendar) or annually. Moreover, the reporting requirement for each return depends on the DTI type. For instance, foreign bank branches are not required to report the BCAR.
The database contains 244 active and inactive DTIs that can be categorized as domestic banks (and their subsidiaries), foreign bank subsidiaries, foreign bank branches (lending branch or full‐service branch) and trust and loan companies (subsidiaries and non‐subsidiaries). To avoid double counting, we eliminate banks and trust and loan companies that are consolidated subsidiaries of another DTI in the dataset (since 1980, subsidiaries that are owned with more than a 50 per cent voting share are consolidated with their parent company financial reports using the acquisition method). However, banks and trust and loan companies that existed as an independent entity before being acquired and consolidated with the parent company as a subsidiary were treated as a separate observation during the period in which they were independent.12 Moreover, we exclude foreign bank branches, since they are not required to hold equity – which is a necessary item for calculating the leverage and capital ratios13 – or required to satisfy OSFI’s liquidity requirements. We have monthly balance‐sheet data over the period January 1983 to August 2011. This leaves us with a sample of 156 DTIs, which make a dataset of 22,899 bank‐month combinations. On average, there are 67 active banks at each time period.14
The U.S. banking data are collected from the Federal Reserve Bank of Chicago (FRBC) bank holding company (BHC) database, which contains quarterly financial data on a consolidated basis since 1986. The database has 14,615 active and inactive BHCs. We consider only banks with at least $500 million in total assets; as such, our sample varies between 346 and 937 observations at each time period.15
2.2. Bank groups
First, we divide our sample into two broad categories: the Big Six banks and other financial institutions, non‐Big Six banks. The latter group is further subdivided in three ways: by total asset size (large, medium and small); by charter type (foreign subsidiary, other domestic bank, and trust and loan company);16 and by funding source (high, low and no wholesale funding).17
12 There were 13 such cases. 13 Instead, OSFI requires that the foreign bank branches hold a capital equivalency deposit with an approved financial institution in Canada. The requirements and instructions are available at <http://www.osfi‐bsif.gc.ca/app/DocRepository/1/eng/guidelines/capital/guidelines/a10fbb_e.pdf>. 14 We exclude outliers, including those changing leverage more than 100 per cent in a month, those with negative equity or those with a Tier 1 capital ratio above 500. 15 Between 1986 and 2006, the FRBC database collected data on BHCs with at least $150 million in total assets. As of March 2006, this minimum threshold has been changed to $500 million, mainly due to industry consolidation. 16 Other domestic banks are Canadian banks, while foreign subsidiaries are foreign banks with a Canadian charter. Trust and loan companies have traditionally concentrated on residential mortgages and term deposits, at least until the 1990s (Freedman 1998). See Appendix D for a list of active financial institutions in each category as at August 2011. 17 Categorization by business line (e.g., the riskiness of asset portfolio) correlates with that by funding type, and hence is not included in this paper.

5
For the size category, at each month we sort non‐Big Six banks by size and divide them into three groups of equal numbers: large, medium and small.18
Similarly, for the funding source category, we divide non‐Big Six banks into three groups according to their use of wholesale funding (i.e., the sum of non‐personal deposits and repos divided by total assets): high wholesale funding (high WSF), low wholesale funding (low WSF) and no wholesale funding (no WSF). In each period, the number of banks with a positive amount of wholesale funding is equally divided between the high and the low. As for charter types, we directly apply OSFI’s definitions: foreign subsidiaries, domestic banks (excluding the Big Six banks), and trust and loan companies.
18 In August 2011, the large financial institutions were those valued at more than $2.2 billion; the medium‐sized financial institutions were those valued at between $0.2 billion and $2.2 billion; and the small were those valued at less than $0.2 billion.
6
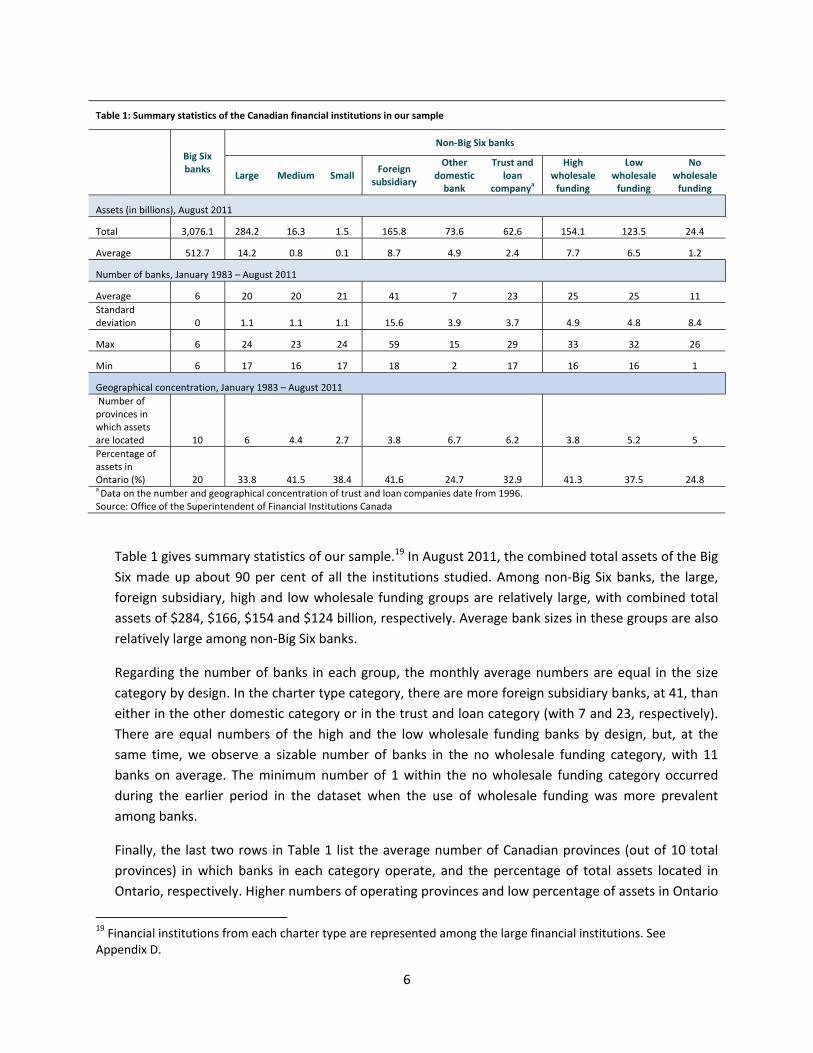
Table 1 gives summary statistics of our sample.19 In August 2011, the combined total assets of the Big Six made up about 90 per cent of all the institutions studied. Among non‐Big Six banks, the large, foreign subsidiary, high and low wholesale funding groups are relatively large, with combined total assets of $284, $166, $154 and $124 billion, respectively. Average bank sizes in these groups are also relatively large among non‐Big Six banks.
Regarding the number of banks in each group, the monthly average numbers are equal in the size category by design. In the charter type category, there are more foreign subsidiary banks, at 41, than either in the other domestic category or in the trust and loan category (with 7 and 23, respectively). There are equal numbers of the high and the low wholesale funding banks by design, but, at the same time, we observe a sizable number of banks in the no wholesale funding category, with 11 banks on average. The minimum number of 1 within the no wholesale funding category occurred during the earlier period in the dataset when the use of wholesale funding was more prevalent among banks.
Finally, the last two rows in Table 1 list the average number of Canadian provinces (out of 10 total provinces) in which banks in each category operate, and the percentage of total assets located in Ontario, respectively. Higher numbers of operating provinces and low percentage of assets in Ontario
19 Financial institutions from each charter type are represented among the large financial institutions. See Appendix D.
Table 1: Summary statistics of the Canadian financial institutions in our sample
Big Six banks
Non‐Big Six banks
Large Medium Small
Foreign subsidiary
Other domestic bank
Trust and loan
companya
High wholesale funding
Low wholesale funding
No wholesale funding
Assets (in billions), August 2011
Total 3,076.1 284.2 16.3 1.5 165.8 73.6 62.6 154.1 123.5 24.4
Average 512.7 14.2 0.8 0.1 8.7 4.9 2.4 7.7 6.5 1.2
Number of banks, January 1983 – August 2011
Average 6 20 20 21 41 7 23 25 25 11 Standard deviation 0 1.1 1.1 1.1 15.6 3.9 3.7 4.9 4.8 8.4
Max 6 24 23 24 59 15 29 33 32 26
Min 6 17 16 17 18 2 17 16 16 1
Geographical concentration, January 1983 – August 2011 Number of provinces in which assets are located 10 6 4.4 2.7 3.8 6.7 6.2 3.8 5.2 5 Percentage of assets in Ontario (%) 20 33.8 41.5 38.4 41.6 24.7 32.9 41.3 37.5 24.8 a Data on the number and geographical concentration of trust and loan companies date from 1996.Source: Office of the Superintendent of Financial Institutions Canada

7
imply higher degrees of geographical diversification. The Big Six banks are more diversified geographically than other institutions, as shown in the last two rows of the table; they are active in all 10 provinces and, as a group, have the lowest percentage of their total assets located in Ontario, the largest province.20 In contrast, the other groups of institutions are active in a smaller number of provinces and hold a higher proportion of their assets in Ontario. These include small, foreign subsidiary and high wholesale funding banks. This is especially true for foreign subsidiaries, which are the least geographically diversified among the three charter types, despite accounting for more than half of the assets in the non‐Big Six category.
For the Canada–U.S. comparison, we define the top 30 banks at each time period as large U.S. banks and compare them to the Big Six banks in Canada. Similarly, the rest of the U.S. banks are defined to be small banks and compared to non‐Big Six banks in Canada.21
2.3. Definitions of four measures of risks to bank balance sheets
Our analysis focuses on four important ratios that capture different balance‐sheet risks.22 Currently, banks are required to comply with several regulatory requirements, including leverage, capital and liquidity ratios. These minimum requirements are set and regularly monitored by OSFI. In this section, we briefly describe these balance‐sheet ratios. A detailed summary of the regulatory changes related to these ratios is provided in Appendix A.
a) Leverage ratio
A leverage ratio measures risk associated with non‐capital funding of overall balance sheets. It is a simple and transparent measure of balance‐sheet risk, not subject to model and measurement errors associated with asset‐risk calculations. All else equal, a higher ratio is associated with greater vulnerability to adverse shocks that reduce the overall value of assets or funding liquidity.23 The regulatory leverage ratio was introduced in Canada in 1982 and it is measured as follows:24
20 The percentage of Big Six assets in Ontario (20 per cent) may appear very low, since their assets are more geographically dispersed in other provinces and in foreign countries than are those of non‐Big Six institutions. In addition, some assets are not associated with a particular location (such as intangible assets), lowering the percentages of location‐specific assets. 21 We tried different ways of categorizing U.S. banks into large and small banks (e.g., top 10 per cent as the threshold); the results are relatively independent of the large bank definition. 22 A complete assessment of bank risk requires a full range of analyses (including, for example, a bank’s provision for loan losses and mismatches of asset‐liability maturity). In this paper, however, we focus only on the four ratios that reflect the risk dimensions considered in the Basel III framework. 23 Excessively high leverage could increase a bank’s reliance on potentially volatile short‐term sources of funding and expose it to higher funding liquidity risk (Bordeleau, Crawford and Graham 2009). 24 Net on‐ and off‐balance‐sheet assets are defined as balance‐sheet assets + direct credit substitutes + transaction‐related contingencies + short‐term self‐liquidating trade‐related contingencies + off‐balance‐sheet exposures to securitizations (at notional principal amounts, excluding liquidity lines); Total regulatory capital is defined as Total adjusted net Tier 1 and Tier 2 capital. Starting in 2013, when Canadian banks begin implementing

8
Regulatory leverage ratio = Net on‐and off‐balance‐sheet assets / Total regulatory capital.
Unfortunately, data on the regulatory definition of leverage did not exist before 1992. In order to have a longer time series, we use the alternative measure of leverage ratio, referred to as the balance‐sheet leverage ratio. This definition is close to the regulatory leverage ratio used by OSFI, which is based on Basel II total regulatory capital, including subordinated debt, and is calculated as follows:25
Balance‐sheet leverage ratio = Total assets / (Total shareholders’ equity + subordinated debt).
This alternative measure of leverage can be obtained for our data period on a monthly basis.
b) Capital ratio
In contrast to leverage ratios, capital ratios capture risks associated with different types of assets. DTIs are required to maintain an adequate level of capital proportionate to their asset exposure to different types of risks. All else equal, a higher capital ratio implies that a bank has relatively high capital holdings or relatively low holdings of risky assets, and is associated with less vulnerability to adverse shocks. Even if their balance sheets are the same size and they have the same amount of capital – i.e., their leverage ratios are equal – two institutions with different asset mixes can have different capital ratios.
In our discussion, we focus on the Tier 1 capital ratio, which reflects higher‐quality capital than that of the total capital ratios and is defined as:
Tier 1 capital ratio (%) = 100 x Adjusted net Tier 1 capital / Total risk‐weighted assets.26
Data for the Tier 1 capital ratio have been available only on a quarterly basis. Since no consistent alternative measure covering a longer time period is available, we will use this regulatory measure.
the Basel III rules, the calculation of total regulatory capital will be slightly altered. For example, it will include deductions of defined‐benefit pension funds, mortgage servicing rights and deferred tax assets. 25This definition is close to the regulatory leverage ratio used by OSFI, which is based on total regulatory capital as defined in Basel II, including subordinated debt (see Bordeleau, Crawford and Graham 2009). Starting in 2013, when Canadian banks begin implementing the Basel III rules, the calculation of total regulatory capital will be slightly altered. For example, it will include deductions of defined pension funds, mortgage servicing rights and deferred tax assets. 26 Adjusted net Tier 1 capital generally includes, but is not limited to, equity and disclosed reserves, including retained earnings. Total risk‐weighted assets are assets that have been adjusted to reflect their risk according to the Basel framework. Data for the Tier 1 capital ratio have been available on a quarterly basis only since 1994, after the implementation of Basel at the end of 1992. With the Basel II framework, calculation of the two components of the Tier 1 capital ratio has been modified to include consideration of market risk since 1997 and an option for financial institutions to use their own risk‐assessment models (with OSFI’s approval) since 2008. Under Basel III, calculation of the two components of the Tier 1 capital ratio will be modified to include a new deduction to capital (refer to footnote 24) and higher weighting for market risk components in the risk‐weighted assets.
9
c) Asset‐liquidity and funding ratios
Both the leverage ratio and the capital ratio focus on whether a bank has sufficient capital to support its assets. The recent financial crisis also highlighted that having sufficient capital alone is not a precondition for stability. Funding liquidity and asset liquidity are also important determinants of the ongoing viability of a bank.27 We therefore constructed ratios that capture the asset liquidity risk and funding liquidity risk of banks. Because of constraints on the data available for a historical analysis, these ratios are different and less complex than those proposed in the Basel III liquidity requirements.28
Unlike the other two regulatory measures, liquidity regulation took the form of guidelines and directives to be applied at the discretion of the banks themselves. Hence, no specific definition for liquidity ratio is available. However, OSFI’s guideline characterizes the stock of liquid assets as “high quality securities for which there is a broad and active secondary market that can be liquidated through their sale to a wide range of counterparties without incurring a substantial discount, thereby securing their status as dependable sources of cash flow.”29 In line with OSFI’s guideline, a broad measure for asset‐liquidity ratio can be defined using monthly balance‐sheet data, as follows:30
Asset‐liquidity ratio (%) = 100 x (cash and equivalent + public securities + secured short‐term loans) / Total assets.
The higher the asset‐liquidity ratio, the more able the institution is to withstand adverse shocks that increase the need to liquidate assets. To better assess a bank’s liquidity profile, one should also analyze their funding structure. A bank with a relatively low asset‐liquidity ratio combined with a high reliance on stable sources of funding may be more resilient to a liquidity shock than a bank with a relatively high asset‐liquidity ratio combined with a high dependency on market‐based funding. High dependency on market‐based funding exposes banks to rollover risk, as seen during the recent crisis. The OSFI liquidity guidelines require banks with more than 10 per cent of market‐based funding to actively manage their short‐
27 During the crisis, liquidity in short‐term funding markets dried up in the United States, the United Kingdom, the euro area and, to a much smaller degree, Canada. Consequently, banks found it difficult to fund their assets. An asset fire sale resulted as banks sold off assets they could no longer fund. With the introduction of the Basel III requirement, banks will have to report and satisfy certain levels of regulatory liquidity and funding ratios, known as the Liquidity Coverage Ratio (LCR) and the Net Stable Funding Ratio (NSFR). The liquidity rules are aimed at measuring banks’ resilience to short‐term liquidity stress, with requirements set to ensure that banks have access to stable funding sources. For more details, see BCBS (2010b); Gomes and Khan (2011). 28 Our asset‐liquidity and funding ratios separately capture liquidity risk on each side of the balance sheet. In comparison, the proposed liquidity standards in Basel III consider both sides of the balance sheet together and incorporate more complex assumptions on funding runoffs (e.g., the sudden withdrawal of bank liabilities) and haircuts (i.e., a percentage difference between the market value of an asset and its value as collateral). 29 See the document B‐6, “Guideline: Liquidity,” OSFI, December 1995, updated in 2012. 30 This ratio reflects a liquidity buffer and does not account for haircuts or interest and principal cash flows, as currently prescribed in the LCR.

10
term funding within internal limits set by the banks’ management.31 We define funding ratio as the proportion of a bank’s total assets that are funded by wholesale funding, a relatively less stable funding source than retail (personal) deposits, as follows:32
Funding ratio (%) = 100 x (Non‐personal deposits + Repos) / Total assets.33
A higher funding ratio indicates that a bank relies on greater market‐based funding and is therefore more exposed to adverse shocks in the market that could disrupt continuous funding of its assets.
Although these indicators are informative regarding bank balance‐sheet risks, caution should be taken when using these ratios to measure relative risks across groups of institutions. High risk, as indicated by a particular ratio, may also reflect regulatory or supervisory latitude granted to an individual institution based on its strong risk‐management practices. In this paper, we use the terms “higher” or “lower” risk, assuming that such supervisory requirements remain constant.
3. Balance‐Sheet Ratios Over Time in Canada In this section, we document evolutions of balance‐sheet ratios over time and across different categories of banks. 3.1. Distributions among all banks, Big Six and non‐Big Six banks
The distributions (median, 25th and 75th percentile) of the four ratios that indicate balance‐sheet risks for the financial institutions in our sample are shown in Figures 1 and 2. Overall median trends in Figure 1 seem to suggest that the Canadian banking industry, as a whole, has become safer over time. Moreover, widening dispersions with respect to these ratios suggest that degrees of heterogeneity among banks have increased over the period. In Figure 2 we document some differences in the evolutions of balance‐sheet ratios between the Big Six and non‐Big Six banks.
3.1.1. Leverage ratio
Changes in the distribution of the leverage ratio for the Big Six and non‐Big Six banks are shown in Figure 2, panel a. The range for the Big Six is over the minimum and the maximum among the six banks, whereas that of non‐Big Six banks is from the 25th to the 75th percentile, excluding the Big Six. Except for the late 1980s and the early 1990s, the Big Six banks have a higher leverage ratio than the majority of non‐Big Six banks.
Furthermore, there is a clear diverging trend between the leverage ratios of these two groups of banks since the mid‐1990s. In fact, leading up to the recent financial crisis, the ratios of the Big Six
31 This 10 per cent threshold was changed to 5 per cent earlier in 2012. 32 Unlike the NSFR, this definition of the funding ratio does not differentiate among the terms of funds or the risks of assets. 33 Non‐personal deposits (i.e., a category in the regulatory report on balance sheets) include market‐based funding, such as commercial paper, bankers’ acceptances and deposit notes.

11
banks had been increasing, while those of non‐Big Six banks had been declining. These observations are consistent with the implementation of a regulatory cap on leverage (i.e., asset‐to‐capital multiple (ACM) limits) by OSFI and their changes over the years, notably a placement of bank‐specific ACM limits since 2000 on non‐Big Six banks.34 OSFI considers a range of factors, such as the strength of the parent bank (in the case of foreign banks), asset diversification and appetite for risk when assigning individual leverage limits on banks.35 For instance, due to their national branch network and wide range of financial products (i.e., geographical and product diversifications), OSFI may have allowed higher leverage limits for larger banks. On the other hand, smaller institutions are typically constrained to have lower limits, which may reflect an underlying risk in these banks’ operations (e.g., less diversification of assets).
The gradual decrease in leverage among non‐Big Six banks during the late 1990s could also be the result of consolidation. After the 1992 amendments to the Bank Act, which allowed cross‐ownership between chartered banks and trust and loan companies, the Big Six acquired several trust and loan companies. If these institutions were highly leveraged, their acquisition and removal from the non‐Big Six sample may have reduced the group’s overall leverage.
3.1.2. Capital ratio
Panel b in Figure 2 displays the movements of the Tier 1 capital ratios between the Big Six and non‐Big Six banks. Most non‐Big Six banks consistently have higher capital ratios than the Big Six, and both have a diverging trend since the late 1990s, although not as strong as that in the leverage ratio. The observations regarding higher and widening ranges in capital ratios over time for non‐Big Six banks are in part due to OSFI’s approach of setting bank‐specific minimum targets. For instance, the assignment of bank‐specific ACM limits since 2000 would indirectly impact a bank’s holding of regulatory capital without changing the weighted risk of its assets.
In addition, the Tier 1 capital ratios for both sets of banks have been increasing since 1994.36,37 This stems from two factors: OSFI’s minimum requirement and a change in banks’ assets mix. On the one
34 ACM is the regulatory definition of leverage in Canada. With the introduction of the regulatory leverage ratio in 1982, OSFI imposed a formal limit on banks. This limit, known as the ACM limit, has since changed over time and, in 2000, became specific to individual institutions. Smaller institutions are typically allowed to have lower limits than their larger counterparts. See Appendix A for more details. 35 See OSFI guidelines on capital‐adequacy requirements at <http://www.osfi‐bsif.gc.ca/osfi/index_e.aspx?DetailID=527>. 36 In 2008, the Basel II framework on capital requirements was implemented, allowing OSFI‐approved institutions to adopt the internal ratings‐based (IRB) approach to determining risk weights. In contrast to the standardized approach, the IRB approach can lead to lower assessed risk weights. Since only the Big Six banks have adopted this approach, the recent divergence in capital ratios may, in part, reflect this difference in risk‐assessment practices. In addition, bank‐specific limits on leverage would have also contributed to increasing heterogeneity in capital ratios. 37 The capital ratios for non‐Big Six banks since 2007 are also higher, despite the different method used to calculate their risk weights compared to the Big Six banks. Except for two mid‐tier banks (ING Bank of Canada and HSBC Bank Canada), the non‐Big Six banks rely on the standardized approach to calculate their capital ratios. This approach prescribes higher risk‐weighting charges in comparison to the internal ratings‐based (IRB) approach used
12
hand, OSFI’s minimum requirements increased in 1999 from 4 per cent, the standard specified in Basel I, to 7 per cent. Also, OSFI requires all financial institutions to establish higher internal capital targets to cushion against unexpected losses and thus avoid breaching the minimum requirements. On the other hand, the banks’ asset mix had pushed down the average risk weight of banks’ assets. For instance, the relative share of corporate and business loans in the banking book has been declining since the mid‐1990s, as these loans are subject to a relatively high risk weight. At the same time, banks have increased their relative exposure to the corporate sector through their trading book (i.e., holding of securities), since the average risk weight on these assets under Basel I and II is lower than the risk weight on corporate loans. This regulatory arbitrage between the banking book and the trading book is one subject that Basel III addresses.
One noticeable difference from the observations of the leverage ratios is that the range of the Tier 1 capital ratios among the Big Six is much narrower than that of non‐Big Six banks, especially since the mid‐2000s. Since leverage ratios, unlike Tier 1 capital ratios, do not take into account the difference in the riskiness of assets, the differences in the risk portfolio between the Big Six and non‐Big Six banks are likely the main cause. That is, the Big Six tend to have similar asset portfolios in terms of risk weights, whereas non‐Big Six banks exhibit more heterogeneity among themselves.
Finally, in contrast to the leverage ratio, the literature on capital requirements and risk behaviour is not conclusive. Capital‐adequacy policies seem to be putting conflicting pressures on risk‐taking incentives.38
3.1.3. Asset‐liquidity and funding ratios
Panels c and d in Figure 2 show the asset‐liquidity and funding ratios, respectively, for the Big Six banks and non‐Big Six banks over time. There is no obvious diverging trend between the two groups of banks in asset‐liquidity ratios, but the median non‐Big Six bank has been holding more liquid assets than the median Big Six bank. As for the range between the 25th and 75th percentiles, the non‐Big Six bank distribution is much wider than that of the Big Six banks, implying more heterogeneity among the smaller banks.
The funding ratio for the Big Six has been stable over time. Moreover, similar to the other ratios, the range between the maximum and minimum has been more stable and narrower over our sample period relative to those of non‐Big Six banks. On the other hand, the funding ratio for non‐Big Six banks has been declining, while the range between the 25th and 75th percentiles has been widening since the early 1990s. The sharp decline in the funding ratio for non‐Big Six banks in the late 1990s can be explained, in part, by the introduction of liquidity guidelines by OSFI in 1995,39 which required
by the Big Six banks. Also note that trading activities at the majority of non‐Big Six banks are either non‐existent or do not meet OSFI’s threshold for the capital‐adequacy requirements for market risk. 38 See, for instance, Northcott (2004); Hellmann, Murdock and Stiglitz (2000); Repullo (2003); Kashyap and Stein (2004). 39 See OSFI B‐6 guidelines on liquidity, available at <http://www.osfi‐bsif.gc.ca/osfi/index_e.aspx?DetailID=527>.

13
institutions with high reliance on market‐based funding to have strict liquidity risk‐management practices. Among other things, the guidelines required banks with more than 10 per cent (changed to 5 per cent in 2012) of market‐based funding to actively manage their short‐term funding within internal limits set by the banks’ management.
Moreover, the decline between 1999 and 2003 coincides with the Canada Mortgage and Housing Corporation’s (CMHC) mortgage insurance rule changes and increased housing affordability. For example, CMHC lowered the minimum down payment eligibility for their mortgage insurance to 5 per cent from the previous level of 25 per cent. These changes may have impacted smaller banks’ business models by increasing the share of mortgage loans for most non‐Big Six bank subgroups between 2000 and 2011, from 14 per cent to 39 per cent for the medium banks and from 11 per cent to 27 per cent for the large banks (see Figure 3). Similarly, the share of wholesale funding for most non‐Big Six bank subgroups has declined, for example, from 55 per cent to 18 per cent for the medium banks and from 55 per cent to 34 per cent for the large banks. Furthermore, the increased popularity of securitization following the introduction of the Canada Mortgage Bond program may have allowed some of the non‐Big Six banks to adopt an “originate to distribute” business model. Since originate‐to‐distribute securitization is another type of market‐based funding, these banks may have shifted out of other types of market‐based funding on balance sheets.
This section compares the leverage, capital, liquidity and funding ratios of non‐Big Six banks to those of the Big Six banks. Heterogeneity of these indicators within the banking system, measured by the differences between the Big Six and other financial institutions, as well as the differences among non‐Big Six institutions, has generally increased since the mid‐1990s. This may be due, in part, to greater discipline imposed by markets or regulations that have become increasingly bank‐specific, implying a more appropriate alignment of these balance‐sheet ratios with the underlying risks.
Overall trends suggest that non‐Big Six institutions have become more resilient over time. Capital has increased, while both leverage and funding risk have decreased. For the Big Six banks, capital ratios increased moderately until 2008, when the trend became more positive. Their leverage ratios declined in the 1980s, followed by an increasing trend until 2008, when the recent financial crisis hit the Canadian economy. Asset‐liquidity and funding ratios for the Big Six banks are either stable or display no long‐term trend. Nevertheless, the Big Six hold more diversified portfolios such that idiosyncratic shocks to a region or a product line are more likely to be evened out.40
We also identify wider dispersions of these ratios for the smaller banks relative to those for the Big Six. In the next section, we explore more of this heterogeneity among non‐Big Six banks by grouping them into subcategories.
40 Regarding the results reported in this section, we discuss various robustness checks in Appendix E.

14
Figure 1: Indicators of balance‐sheet risks at Canadian financial institutions (12‐month moving average)
Note: Panel d includes only institutions with wholesale funding. Source: Office of the Superintendent of Financial Institutions Canada Last observation: August 2011

15
Figure 2: Indicators of balance‐sheet risks at Canadian financial institutions – Big Six vs. non‐Big Six (12‐month moving average)
Note: Panel d includes only institutions with wholesale funding. Source: Office of the Superintendent of Financial Institutions Canada Last observation: August 2011
3.2. Balance‐sheet ratios by various type within non‐Big Six banks
Table 2 shows the four measures of balance‐sheet risks according to bank size, charter type and wholesale funding by decade. The numbers are obtained by averaging the monthly‐median for each group over time.
We observe that leverage ratios tend to be positively correlated with bank size. Overall, non‐Big Six financial institutions have higher capital ratios, among which large institutions, domestic banks and low WSF banks have the highest leverage. Furthermore, all non‐Big Six institutions show declining trends in leverage, which is consistent with the evolution shown in panel a of Figure 2. The decline appears to be the largest for small banks and no wholesale funding banks, moving from 10.3 over the

16
1983–90 period to 1.8 after 2000 for small banks, and from 10.9 to 1.5 for no wholesale funding banks. These declines follow the introduction of bank‐specific regulatory limits on leverage. In contrast, the Big Six banks maintained relatively higher leverage than their smaller peers throughout the sample period.
Observations of capital ratios are consistent with those of leverage ratios. We observe that capital ratios tend to be negatively correlated with size while noting that leverage has an inverse relation with capital. Overall, non‐Big Six financial institutions have higher capital ratios, among which small institutions, trust and loan companies, and no wholesale funding banks have the highest capital ratios and have shown large increases in capital over time, going from 23 per cent in the 1990s to 59 per cent in the 2000s, from 22 per cent to 30 per cent, and from 34 per cent to 57 per cent, respectively. This likely contributed to the observed spikes at the 75th percentile of the distribution of capital during the 2000s, as shown in panel b of Figure 2. These observations point to increasing heterogeneity in capital ratios across institutions in Canada;41 however, this trend is not observed everywhere (see section 4 for a comparison of Canada and the United States).
41 In 2008, the Basel II framework on capital requirements was implemented, allowing OSFI‐approved institutions to adopt the internal ratings‐based (IRB) approach to assessing credit risk. In contrast to the standardized approach, the IRB approach can lead to lower assessed risk. Since only the Big Six banks have adopted this approach, the recent divergence in capital ratios may, in part, reflect this difference in risk‐assessment practices. In addition, bank‐specific limits on leverage would have also contributed to increasing heterogeneity in capital ratios.

17
Table 2: Indicators of balance‐sheet risks at Canadian financial institutions, by bank size and charter type
Big Six banks
Non‐Big Six
Large Medium Small
Foreign subsidiary
Other domestic bank
Trust and loan
companyb
High wholesale funding
Low wholesale funding
No wholesale funding
Leverage ratios
1983‐2011 16.1 14.1 11.1 6.0 10.7 13.5 6.2 10.9 12.0 3.0
1983‐1990 17.3 18.2 15.4 10.3 15.0 16.7 ‐ 15.7 14.6 10.9
1991‐2000 14.7 13.3 10.2 6.9 10.0 14.6 9.8 10.0 11.9 2.6
2001‐2011 16.6 11.7 8.8 1.8 8.0 9.9 4.5 8.3 10.1 1.5
Capital ratiosa (%)
1994‐2011 8.4 10.2 15.6 44.5 13.1 10.9 27.8 13.0 14.0 49.9
1994‐2000 7.1 8.5 13.1 22.9 9.9 9.3 22.2 8.7 12.7 34.0
2001‐2011 9.3 11.3 17.2 58.7 15.2 12.0 30.4 15.7 14.8 57.3
Asset‐liquidity ratios (%)
1983‐2011 15.0 16.5 16.9 31.9 19.8 11.3 22.7 17.9 17.0 42.5
1983‐1990 16.0 16.2 25.4 26.0 23.0 9.7 ‐ 23.3 20.7 34.6
1991‐2000 15.9 18.8 14.8 20.5 18.7 12.6 11.8 15.4 17.2 52.2
2001‐2011 13.4 14.6 12.6 47.0 18.5 11.3 27.8 16.3 14.0 37.6
Funding ratios (%)
1983‐2011 45.8 53.8 47.3 29.1 58.5 18.4 0.2 69.5 31.4 0.0
1983‐1990 46.9 70.6 75.1 66.1 72.5 31.2 ‐ 80.0 61.0 0.0
1991‐2000 44.3 65.5 63.7 30.3 68.9 17.3 0.4 79.5 33.5 0.0
2001‐2011 46.4 30.3 11.1 0.2 38.3 9.7 0.0 52.2 7.4 0.0 a Data on regulatory capital ratio date from 1994. b Data on trust and loan companies date from 1996. Note: Numbers represent an average of monthly medians in each period. Source: Office of the Superintendent of Financial Institutions Canada
Asset‐liquidity ratios in panel c of Figure 2 display high dispersion among non‐Big Six banks. Table 2 shows that during the entire data period of 1983–2011, the small institutions, trust and loan companies, and no wholesale funding banks held high asset‐liquidity ratios, which partly drove the observed heterogeneity in panel c of Figure 2. The observed high ratios during the 1990s in the figure appear to be mostly driven by no wholesale funding banks (52 per cent), whereas those in the 2000s were driven by small institutions (47 per cent), trust and loan companies (28 per cent) and no wholesale funding banks (38 per cent). On the opposite side of the distribution, the domestic banks show the lowest asset‐liquidity ratios at 11.3 per cent over the 1983–2011 period, a lower number even compared to the Big Six (15 per cent).

18
Finally, regarding the funding ratio, small institutions, domestic banks, and trust and loan companies display smaller funding ratios, whereas foreign subsidiaries, large institutions and, by default, high wholesale funding banks display higher funding ratios, the latter of which are even higher than those of the Big Six. The relatively high, continuous use of this funding source by the large institutions and foreign subsidiaries may be influenced by their access to global funding markets. Overall, the ratios of almost all non‐Big Six banks in Table 2 declined significantly in the late 1990s to lower levels than those of the Big Six, as shown in panel d of Figure 2. As noted in section 3.1.3, the sharp decline in the funding ratio for non‐Big Six banks in the late 1990s can be explained, in part, by the introduction of liquidity guidelines by OSFI in 1995.42
3.3. Bank balance sheets
The previous sections highlighted the degree of heterogeneity over important balance‐sheet ratios. These ratios reflect the banks’ balance‐sheet composition in both asset and liability portfolios. Hence, changes in balance‐sheet portfolios can help us understand more about these observed heterogeneities. This section documents trends and stylized facts about banks’ assets and liabilities, first by size and then by other bank groups (i.e., charter type and WSF).
3.3.1. By balance‐sheet size
Figure 3 shows the evolution of the different balance‐sheet components for the four size groups. For each group, the numbers are calculated by taking the weighted portfolio of bank balance sheets in each month and averaging them over time. The Big Six banks and the large institutions appear to have similar trends in overall portfolio changes. Both mortgage and non‐mortgage loans appear to be an important component for these groups since the mid‐2000s. Prior to then, non‐mortgage loans had a larger weight over total loans. Slight differences, if any, appear in mortgage loans and private securities where non‐Big Six large banks tend to hold more of the former and less of the latter relative to the Big Six, especially toward the end of the data period. The medium and the small institutions’ balance‐sheet compositions have significantly changed during the 2001–11 period. There appears to be a decline in the proportion of non‐mortgage loans for the medium banks and both mortgage and non‐mortgage loans for the small banks.
Figure 3 also shows the portfolio on the liability side of these banks. Contrary to assets, the Big Six banks and large institutions did not have a similar composition of liabilities until 2000. Prior to that, the large institutions relied more on wholesale funding than the Big Six banks. Following the year 2000, both had similar funding patterns, with retail and wholesale deposits being equally important.43 Among the medium and small institutions, the use of wholesale deposits has declined since the early 2000s. For medium institutions, some of this decline was replaced by an increase in
42 See OSFI B‐6 guidelines on liquidity at <http://www.osfi‐bsif.gc.ca/osfi/index_e.aspx?DetailID=527>. 43 A few exceptions appear to be the share of private securities on the asset side and the use of repos on the liability side. While the Big Six hold visible more shares of private securities and repos, non‐Big Six large banks do not.

19
retail deposits. For small banks, the amount of retail deposits has also declined since then; however, it has been replaced by a higher share of equity.
The Big Six and the large banks’ asset mix appear to be well‐diversified and stable over time, as with their liability mix. On the other hand, the asset and liability mixes for medium and small banks have changed over time (i.e., a decline in non‐mortgage loans and an increase in mortgage loans), especially since the 1990s, when banking regulation and mortgage insurance rule changes were introduced.44 This coincided with changes in the liability mix for these banks, via a decline in wholesale deposits and an increase in retail deposits. Also, the loss of small banks from the sample, owing to failures in the 1980s and 1990s, may have left only less‐leveraged and better‐capitalized institutions in the sector.45 Overall, it appears that positive correlations exist between asset portfolios and funding portfolios, likely reflecting their business model choices and risk management.
The balance‐sheet portfolio dynamics can shed light on the evolutions in balance‐sheet ratio observations from the previous sections. Table 2 and Figure 3 tell us that non‐Big Six large banks are similar to the Big Six in some balance‐sheet ratios, since both types display similar balance‐sheet portfolios. For example, both types hold a low level of equity relative to their balance‐sheet size, indicating similarly high leverage ratios in Table 2. As the bank size increases, the level of equity relative to total assets decreases, implying that the balance‐sheet size and the leverage ratio are positively correlated, as observed in Table 2. Over time, all bank‐size groups increase their equity shares relative to the balance‐sheet size, leading to a reduction in leverage ratios. Regarding capital ratios, a closer look at Figure 3 tells us that the holding of low risk‐weighted assets, such as cash, mortgage loans and public securities, tends to decrease with balance‐sheet size. In addition, the share of these low‐risk assets appears to have kept increasing since the mid‐1990s for all non‐Big Six size groups. Together with a higher fraction of equity, their capital ratios increased over time, as shown in Table 2.
The positive correlation between bank size and the risks measured by the leverage/capital ratios do not carry over directly to the asset‐liquidity and funding ratios. Panels c and d in Figure 2 already show that there is a sizable number of non‐Big Six banks that hold more liquid assets relative to total assets than the Big Six, as well as those holding less. In addition, as observed in previous sections, the holding patterns of market‐based funding among non‐Big Six banks are quite diverse. This diversity may not be directly reflected in bank size; instead, it may be a result of business model choices. Indeed, several studies have shown that the source of funding is an essential element in banks’ business strategies and balance‐sheet management behaviour.46
44 Changes in economic reality and in legislation have both contributed to the evolution of Canadian banks’ asset and liability mix over the past three decades (see Appendixes A and B for more detail). 45 See the Canada Deposit Insurance Corporation, “History of Member Institution Failures,” available at <http://www.cdic.ca/e/insuredWhere/history_failures.html>. 46 See, for example, Adrian and Shin (2010); Allen and Paligorova (2011); Damar, Meh and Terajima (2010, 2012); Huang and Ratnovski (2011); He, Khang and Krishnamurthy (2010).

20
Figure 3: Balance‐sheet components of various financial institutions, by size, charter type and wholesale funding (as a percentage of total assets)
Note: Data on trust and loan companies date from 1996. Percentages are monthly averages across institutions and then over time. Source: Office of the Superintendent of Financial Institutions Canada Last observation: August 2011
3.3.2. By other bank groups
Figure 3 also shows the balance‐sheet compositions of different types of banks in this study. Among charter types, foreign subsidiaries appear close to the Big Six on the asset side. However, on the liability side, they rely more on wholesale deposits and less on retail deposits than the Big Six. Other domestic banks, as well as trust and loan companies, tend to focus their assets on mortgage loans by relying more on retail deposits than the foreign subsidiary banks. In addition, as wholesale funding use declines, the asset’s focus shifts from non‐mortgage to mortgage loans. Also, less reliance on wholesale funding is made up by retail deposits and equity.
These balance‐sheet composition changes may have been affected by changes in the regulatory environment. For instance, the acquisition of the largest trust and loan companies by the Big Six banks, following the legislative amendment of 1992, may have resulted in the trust and loan company subgroup comprising only small and specialized institutions with riskier assets but more

21
capital. In addition, the growing popularity of mortgage‐loan securitization in the late 1990s following the introduction of the Canada Mortgage Bond program raised the percentage of mortgage loans on bank balance sheets, especially among large and medium‐sized financial institutions.47 Finally, the decline in the proportion of wholesale deposits for non‐Big Six banks is observed around the time of the introduction of the liquidity guidelines.
These observations give further insights into the dynamics of balance‐sheet ratios. First, inverting equity shares can proxy leverage ratios, and thus the higher the equity share, the lower the leverage ratio. Based on this proxy, we observe that foreign subsidiaries, other domestic banks, and high and low wholesale funding banks tend to hold less equity relative to the rest and hence have a higher leverage ratio.
Similarly, since capital ratios reflect the riskiness of asset portfolios, we can elaborate on them by identifying “risky” assets in Figure 3 and comparing their fractions relative to equity. Non‐mortgage loans and private securities contain higher risk than, for example, cash, mortgage loans and public securities. Medium‐sized, foreign subsidiaries and high wholesale funding banks hold these assets for 50 per cent or more of their balance sheets. Combined with low equity, foreign subsidiaries and high wholesale funding banks exhibit low Tier 1 capital ratios. Differences in asset‐liquidity ratios can be observed by adding cash and public securities as a proxy. Except for non‐Big Six domestic banks and the low WSF banks, all other institutions hold more cash than public securities. Also, non‐Big Six domestic banks appear to hold less liquid assets than any other charter type (including the Big Six banks). This may indicate that these domestic banks are vulnerable to liquidity shocks. However, the need to hold less liquid assets by the domestic banks may stem from the fact that they hold higher shares of resilient funding sources (i.e., retail deposit) and less‐risky assets (e.g., mortgage loans) than the other charter types (including the Big Six banks). Finally, funding ratios are directly observable in Figure 3 by the shares of wholesale deposits and repos combined. On average over the data period, medium‐sized, foreign subsidiaries and high wholesale funding banks all have these market‐based funding fractions higher than those of the Big Six. As we saw in Table 2, these ratios go down in the 2000s, which made them less subject to the funding‐market shocks during the crisis. 4. Canada–U.S. Comparison
Canada’s financial system fared well in the recent financial crisis in comparison to the U.S. financial system, whose banking sectors experienced failures, necessitating government funding guarantees and public sector capital injections. The resilience of the Canadian banking sector could potentially be attributed to several structural differences between the Canadian and U.S. financial systems. One
47 See Appendixes A and B for more details on legislation that might have impacted the evolution of bank balance sheets.

22
important factor is the supervisory regulatory approach.48 Federally chartered Canadian banks are regulated by a single entity, whereas in the United States, bank regulation falls under the responsibility of several authorities across both the federal and the state level. Another important difference is that, in Canada, bank regulators apply a principles‐based supervisory approach, in contrast to a rules‐based approach in the United States. A key advantage of a principles‐based approach is thought to be the ability of the supervisor to enact principles to adapt to changes in the bank operating environment.
In this section, we document the trends and stylized facts regarding the leverage and capital ratios for large and small financial institutions in Canada and the United States. For Canada, we define the large institutions to be the Big Six banks and the small institutions to be non‐Big Six banks with at least $500 million in assets, in order to have a consistent comparison between the United States and Canada. For the U.S. banks, we define the large BHCs as the largest 30 BHCs, and the small BHCs as the remaining banks with at least $500 million in assets.49
4.1. Leverage ratios
Figure 4 shows the evolution of the weighted‐average leverage ratios for the Big Six and non‐Big Six, before and after the recent crisis, as indicated by the red vertical line at 2007Q4, and compares those ratios to the large and the small U.S. BHCs. Different patterns emerge between the Canadian banks and the U.S. BHCs.50 First, starting in the mid‐1990s, the leverage ratios for the Big Six have been higher than those for non‐Big Six banks. Second, there has been a diverging trend between these two groups in Canada. Non‐Big Six banks became increasingly less leveraged relative to the Big Six banks, especially leading up to the start of the crisis in 2007Q4. In contrast, during the same period, small U.S. BHCs exhibited consistently higher, although declining, leverage ratios than large U.S. BHCs, with no sign of reversion in this pattern.
Figure 5 shows the estimated probability density (i.e., kernel density estimations) of leverage ratios at financial institutions in Canada and the United States. In 1988, the two countries had similar distributions but the dynamics that followed appear different. In Canada, an increasing mode and fatter right tail (i.e., the number of financial institutions with lower leverage ratios) have been observed over time, while in the United States, the distribution has remained relatively unchanged and is centred around its mode. It is also worth noting that the overall average leverage ratios in both countries declined between 1988 and 2010.
48 See Ratnovski and Huang (2009); Brean, Kryzanowski and Roberts (2011). 49 Refer to footnote 15. 50 Differences in accounting standard can affect the level of the measured leverage ratios. For instance, in the United States, netting of on‐balance‐sheet derivatives is permitted under the U.S. generally accepted accounting principles (GAAP). In contrast, this is not allowed under Canadian GAAP and the international financial reporting standards (IFRS). As such, the level of the measured leverage ratios at U.S. banks is relatively understated compared to the Canadian banks. Furthermore, securitization (i.e., moving on‐balance‐sheet assets to off‐balance‐sheet) in Canada was limited before 2000, whereas in the United States it was more widespread. This may have affected the level of leverage at U.S. banks compared to the Canadian banks.

23
A possible explanation for the different patterns might be the results of regulatory approaches between the two countries (see Brean, Kryzanowski and Roberts 2011). Since 2000, Canadian banks are required to maintain an ACM below an individually authorized amount.51 The diverging patterns of the Canadian leverage ratios are consistent with the timing of the implementation of this regulation and the discussions that took place prior to the implementation in 2000, which would have made some banks pre‐emptively change their leverage ratios. As noted earlier, the increasingly fatter right tails for leverage in Canada have been driven primarily by non‐Big Six Canadian financial institutions.
In contrast, minimum capital requirements in the United States have been uniformly applied across financial institutions since 1985, following the enactment of the International Lending Supervision Act in 1983. Up until 1990, all BHCs had to maintain a primary capital ratio and a total capital ratio of 5.5 per cent and 6 per cent, respectively. These capital ratios are calculated using unweighted assets for risk, and are equivalent to the definition of leverage ratios in this paper when taking their inverse. By 1990, the U.S. regulator sought to supplement the newly adopted Basel I risk‐weighted capital ratios with an unweighted capital ratio of 3 per cent (i.e., a leverage‐ratio limit of 33)52 derived from the capital ratios prescribed above. Furthermore, the Federal Deposit Insurance Corporation Improvement Act (FDICIA), enacted in 1991, required a 2 percentage point buffer, effectively raising the minimum requirement for the unweighted capital ratio to 5 per cent (i.e., a leverage‐ratio limit of 20).53,54 Similar to our findings, Lee and Stebunovs (2011) argue that the sharp decline in BHC leverage ratios during these two periods (1985 and 1990) is primarily due to regulatory changes. The decline in BHC leverage ratios around the 1990s has been uniform across the BHCs, as shown in Figures 4 and 5, mainly due to the uniform minimum requirement (as opposed to the individually authorized limits in Canada).
51 See Appendix A for a discussion of Canadian leverage regulations. Also, the implementation of individual leverage limits based on consistent criteria may be feasible partly because Canadian banks are regulated by a single entity, but also because there are fewer banks in the system compared to the United States. The large number of banks and the different jurisdictional regulatory bodies in the United States would make a “bank‐specific” supervisory approach less feasible. This may be one reason for the narrow range of leverage ratios in the United States. 52 The U.S. regulation on leverage is specified in terms of required capital as a percentage of assets, which is the inverse of the ACM defined in this paper. 53 For more details, see Lee and Stebunovs (2011). 54 The FDICIA defines a “well capitalized BHC” as a bank with at least 5 per cent of unweighted capital ratio, 6 per cent of Tier 1 capital ratio and 10 per cent of total capital ratio. It also defines a BHC with 3 to 4 per cent of leverage, 6 per cent of Tier 1 capital ratio and 10 per cent of total capital ratio as an “adequately capitalized bank.”

24
Figure 4: Leverage ratio by asset size, Canada vs. United States (12‐month moving average)
Last observation: 2010Q1
Source: Office of the Superintendent of Financial Institutions Canada and the Federal Reserve Bank of Chicago
Figure 5: Estimated probability density of leverage ratios, Canada vs. United States
Last observation: 2010Q1
Source: Office of the Superintendent of Financial Institutions Canada and the Federal Reserve Bank of Chicago
4.2. Capital ratios
Figure 6 shows the evolution of Tier 1 capital ratios for the Big Six and non‐Big Six banks, and compares it to the large and small U.S. BHCs. Again, clear differences are observable between the two countries. The capital ratios for non‐Big Six banks in Canada had been trending upward leading up to the crisis, while the Tier 1 ratio for the small BHCs in the United States had been declining. Moreover, as shown in Figure 7, the distribution of capital ratios has been exhibiting increasingly fatter right tails in Canada over time, while the distribution has remained relatively unchanged and centred around its mode in the United States. As with the leverage ratios, this implies a higher

25
degree of heterogeneity in Canada than in the United States, especially in terms of the right tail of the distribution. The increasing amounts of higher capital holdings and hence fatter right tails have been driven primarily by non‐Big Six Canadian financial institutions.
The different pattern and distribution of the capital ratios in the two countries may also be a result of different approaches in bank regulation. In Canada, banks must maintain their capital ratios comfortably above the minimum requirements as per the OSFI directive and without an explicit threshold. In other words, OSFI may require risky banks to set higher capital targets on a discretional basis. For instance, OSFI may require specific banks with geographical and single‐name concentration, which includes the majority of non‐Big Six banks, to set higher internal capital targets.55 In contrast, in the United States, the FDICIA explicitly establishes, for all banks uniformly, a threshold above the minimum requirements for regulatory ratios, and sets out mandatory and optional enforcement actions in case the thresholds are breached.56
Figures 6 and 7 also show that both the Canadian and U.S. banks experienced a sharp increase in their capital ratios following the financial crisis. To assess the drivers behind this upward trend, we analyze the two main components of the capital ratio: Tier 1 capital and risk‐weighted assets. In Figures 8 and 9, we show the year‐over‐year growth of these two components.
Figure 8 compares the Tier 1 capital ratio components of the Big Six Canadian banks and large U.S. BHCs. Note that following the financial crisis, the Big Six banks achieved a higher capital ratio by both reducing their risk‐weighted assets and increasing their Tier 1 capital. The reduction in risk‐weighted assets for the Big Six reflects the increasing share of low‐risk assets, such as secured loans and insured residential mortgages, as well as the transition to Basel II. On the other hand, the increase in Tier 1 capital for the Big Six Canadian banks is attributable to both solid internal capital generation and to OSFI changing the regulatory limit on non‐common Tier 1 capital components (preferred shares, hybrids and innovative instruments) in Tier 1 capital.57 As for the large U.S. BHCs, the capital ratios increased on the back of strong Tier 1 capital growth, mainly due to internal capital retentions and external capital injections by the U.S. public authorities, and the risk‐weighted assets kept growing as well.
Figure 9 compares the Tier 1 capital ratio components of non‐Big Six Canadian banks and small U.S. BHCs, showing a similar trend for the smaller banks. On the one hand, the non‐Big Six bank Tier 1 capital ratio mainly improved on decelerating growth in risk‐weighted assets (e.g., a higher proportion of insured residential mortgages which carry zero risk weights) combined with strong growth in Tier 1 capital due to internal capital generation and the regulatory change in the limit on non‐common Tier 1 capital. On the other hand, the small U.S. BHC capital ratios received a boost
55 See “Internal Capital Adequacy Assessment Process (ICAAP),” OSFI, October 2010. 56 The threshold is set at 2 per cent above the minimum required Tier 1 capital and total ratios of 4 per cent and 8 per cent, respectively. These minimum requirements may change according to the new banking capital guideline proposed by the Board of Governors of the Federal Reserve System on 7 June 2012, available at <http://www.federalreserve.gov/newsevents/press/bcreg/20120607a.htm>. For more details about the FDICIA enacted in 1991, see <http://thomas.loc.gov/cgi‐bin/query/z?c102:S.543.ENR:>. 57 It increased from 25 per cent to 40 per cent of Tier 1.

26
from public sector capital injections. Therefore, for both the large and small banks, the post‐crisis improvement of capital ratios in Canada and the United States depicts a very different picture of balance‐sheet management. Namely, Canadian banks reduced the proportion of risky assets or lowered their growth, while their U.S. counterparts did not or could not.
Figure 6: Capital ratio by asset size, Canada vs. United States (12‐month moving average)
Last observation: 2010Q1
Source: Office of the Superintendent of Financial Institutions Canada and the Federal Reserve Bank of Chicago
Figure 7: Estimated probability density of capital ratios, Canada vs. United States
Last observation: 2010Q1
Source: Office of the Superintendent of Financial Institutions Canada and the Federal Reserve Bank of Chicago

27
Figure 8: Breakdown of capital ratios, large banks (year‐over‐year growth rate)
Last observation: 2010Q1
Source: Office of the Superintendent of Financial Institutions Canada and the Federal Reserve Bank of Chicago
Figure 9: Breakdown of capital ratios, small banks (year‐over‐year growth rate)
Last observation: 2010Q1
Source: Office of the Superintendent of Financial Institutions Canada and the Federal Reserve Bank of Chicago
5. Conclusion/policy implications
This paper documents balance‐sheet ratios of Canadian financial institutions. Overall, various measures of risk have decreased over the past three decades for most non‐Big Six institutions and have remained relatively unchanged for the Big Six banks. We find that smaller institutions, particularly trust and loan companies, generally have lower leverage and higher capital ratios than other types of banks, including the Big Six banks. They also have larger holdings of liquid assets and face lower funding risk compared with other financial institutions. The observed overall decline and increased heterogeneity in risk, measured by divergent trends in the leverage, capital and asset‐

28
liquidity ratios, followed certain regulatory changes: specifically, the introduction of liquidity guidelines on funding in 1995 (which preceded a sharp decline in, and more dispersion of funding ratios among, non‐Big Six institutions) and the implementation of bank‐specific leverage requirements in 2000 (which preceded a divergence in leverage ratios between the Big Six and non‐Big Six institutions). This suggests that regulatory changes had significant and heterogeneous impacts on the management of balance sheets by financial institutions, resulting in the increased resilience of the banking system. While market discipline may have also played a role, more research is needed to identify changes in the degree of market discipline in the Canadian banking sector.
The Canada–U.S. comparison shows that small U.S. banks were more vulnerable than their larger banks in terms of leverage ratios, and also shows increasing vulnerability leading up to the crisis in risk‐weighted capital. Observations of Canadian banks do not show similar vulnerabilities among small banks prior to the crisis period.
The resilience of the Canadian financial system could be attributed to the conservatism and prudent approach of its regulatory bodies. Over the past couple of decades, Canadian banks were resilient to several financial stresses that, for the most part, originated outside Canada’s borders.58 More recently, at the onset of the 2007 financial crisis, while many international foreign banks faced difficulties and required public capital injections and debt guarantees, the Canadian financial system did not require any public assistance or experience any bank failures. It has been argued that this was due in large part to the tighter regulatory ratios set by the Office of the Superintendent of Financial Institutions (OSFI), which exceeded international minimums. Potentially more important is OSFI’s regulatory approach based on individual financial institutions. A part of the observed heterogeneity in balance‐sheet ratios among Canadian banks is likely attributable to this.
However, in this paper, we focus only on the risk side of financial regulations. There is likely a trade‐off between the benefits of regulations for financial stability and productivity losses in banking sector activities. These potential productivity losses could accumulate over a long horizon, since these regulations are effective even during normal times when the financial sector would not pose a systemic risk. As important future research topics, these trade‐offs need to be properly assessed to strike the right balance between the benefits and the costs of regulations.
58 For instance: the Mexican crisis in 1994, the Asian crisis in 1997–98, and the Long‐Term Capital Management crisis in 1998.

29
References
Adrian, T. and H. Shin. 2010. “Liquidity and Leverage." Journal of Financial Intermediation 19 (3): 418–37. Allen, F. and D. Gale. 2000. “Financial Contagion.” Journal of Political Economy 108 (1): 1–33. Allen, J., A. Hortaçsu and J. Kastl. 2011. “Analyzing Default Risk and Liquidity Demand during a Financial Crisis: The Case of Canada.” Bank of Canada Working Paper No. 2011‐17. Allen, J. and T. Paligorova. 2011. “Bank Loans for Private and Public Firms in a Credit Crunch.” Bank of Canada Working Paper No. 2011‐13. Armstrong, J. 1997. “The Changing Business Activities of Banks in Canada.” Bank of Canada Review (Spring): 11–38. Basel Committee on Banking Supervision (BCBS). 2010a. “Basel III: A Global Regulatory Framework for More Resilient Banks and Banking Systems.” Available at <http://www.bis.org/publ/bcbs189.pdf>. ———. 2010b. “Basel III: International Framework for Liquidity Risk Measurement, Standards and Monitoring.” Available at <http://www.bis.org/publ/bcbs188.pdf>. Berger, A. N., N. H. Miller, M. A. Petersen, R. G. Rajan and J. C. Stein. 2005. “Does Function Follow Organizational Form? Evidence from the Lending Practices of Large and Small Banks.” Journal of Financial Economics 76 (2): 237–69. Bordeleau, E., A. Crawford and C. Graham. 2009. “Regulatory Constraints on Bank Leverage: Issues and Lessons from the Canadian Experience.” Bank of Canada Discussion Paper No. 2009‐15. Brean, D. J. S., L. Kryzanowski and G. S. Roberts. 2011. “Canada and the United States: Different Roots, Different Routes to Financial Sector Regulation.” Business History 53 (2): 249–69. Chan‐Lau, J. A. 2010. “Balance Sheet Network Analysis of Too‐Connected‐to‐Fail Risk in Global and Domestic Banking Systems.” IMF Working Paper No. WP/10/107. Damar, E., C. Meh and Y. Terajima. 2010. “Leverage, Balance Sheet Size and Wholesale Funding.” Bank of Canada Working Paper No. 2010‐39. ———. 2012. “Effects of Funding Portfolios on the Credit Supply of Canadian Banks.” Bank of Canada. Photocopy. Daniel, F., C. Freedman and C. Goodlet. 1992‐93. “Restructuring the Canadian Financial Industry.” Bank of Canada Review (Winter): 21–45. Ennis, H. 2001. “On the Size Distribution of Banks.” Federal Reserve Bank of Richmond Economic Quartely, 87/4 Fall. Freedman, C. 1998. “The Canadian Banking System.” Bank of Canada Technical Report No. 81. Freedman, C. and W. Engert. 2003. “Financial Developments in Canada: Past Trends and Future Challenges.” Bank of Canada Review (Summer): 3–16. Freedman, C. and C. Goodlet. 1998. “The Financial Services Sector: Past Changes and Future Prospects.” Bank of Canada Technical Report No. 82.

30
Gauthier, C., T. Gravelle, X. Liu and M. Souissi. 2011. “What Matters in Determining Capital Surcharges for Systemically Important Financial Institutions?” Bank of Canada Discussion Paper No. 2011‐9. Gomes, T. and N. Khan. 2011. “Strengthening Bank Management of Liquidity Risk: The Basel III Liquidity Standards.” Bank of Canada Financial System Review (December): 35–42. He, Z., I. Khang, and A. Krishnamurthy. 2010. “Balance Sheet Adjustments during the 2008 Crisis." IMF Economic Review 58 (1): 118–56. Hellmann, T. F., K. Murdock and J. Stiglitz. 2000. “Liberalization, Moral Hazard in Banking, and Prudential Regulation: Are Capital Requirements Enough?” American Economic Review 90 (1): 147–65. Huang, R. and L. Ratnovski. 2011. “The Dark Side of Bank Wholesale Funding.” Journal of Financial Intermediation 20 (2): 248–63. Illing, M. and Y. Liu. 2003. “An Index of Financial Stress for Canada.” Bank of Canada Working Paper No. 2003‐14. Kashyap, A. K. and J. C. Stein. 2004. “Cyclical Implications of the Basel II Capital Standards.” Federal Reserve Bank of Chicago Economic Perspectives 28 (1Q): 18–31. King, R. and R. Levine. 1993. “Finance and Growth: Schumpeter Might Be Right.” Quarterly Journal of Economics 108 (3): 717–37. Lee, S. J. and V. Stebunovs. 2011. “Bank Capital Ratios and the Structure of Nonfinancial Industries.” Board of Governors of the Federal Reserve System. Photocopy. Levine, R. 1997. “Financial Development and Economic Growth: Views and Agenda.” Journal of Economic Literature 35 (2): 688–726. Morrow, R. 1994‐1995. “Repo, Reverse Repo and Securities Lending Markets in Canada.” Bank of Canada Review (Winter): 61–70. Northcott, C. A. 2004. “Competition in Banking: A Review of the Literature.” Bank of Canada Working Paper No. 2004‐24. Northcott, C. A., G. Paulin and M. White. 2009. “Lessons for Banking Reform: A Canadian Perspective.” Central Banking 19 (4): 42–53. Ratnovski, L. and R. Huang. 2009. “Why Are Canadian Banks More Resilient?” IMF Working Paper 09/152. Repullo, R. 2003. “Capital Requirements, Market Power and Risk‐Taking in Banking.” Centre for Economic Policy Research Discussion Paper No. 3721. Wagster, J. D. 2012. “Canadian Bank Capital During the Great Depression of the 1930s: A Comparison to the Basel III Requirements.” Journal of Banking Regulation 13 (2): 89–98.
31
Appendixes
A. Evolution of the Canadian Financial System 59
The Canadian financial system has been shaped by several legislative and regulatory changes. Most notably, periodic revision of the Bank Act has led to a number of important legislative amendments that shaped the financial institutions that we know today. We begin first by highlighting some important regulatory changes that affected the financial system as a whole, and follow with important regulatory changes related to our regulatory ratios.
A.1. Legislative amendments
A chronological list of some important legislative amendments is briefly described here. ‐ 1954 amendments: Chartered banks were allowed to make mortgage loans insured by
the National Housing Association and to make personal loans secured by chattel mortgages on personal properties, such as automobiles and appliances.
‐ 1967 amendments: Chartered banks were allowed to make conventional mortgage loans (i.e., uninsured). At the same time, the 6 per cent ceiling on the interest rate on bank loans was eliminated. Also, a 10 per cent ownership limit of Canadian bank shares was introduced.
‐ 1980 amendments: The Bank Act was revised and had significant regulatory changes. When the amendments became effective on 1 November 1981, chartered banks were permitted to broaden their activity by having operations in leasing and factoring, and by providing venture capital and other services. Also, banks were permitted to raise new equity through ways previously restricted. For instance, the amendments removed the restriction of having only one class of shares, and allowed banks to issue equity to others who were not existing shareholders. Furthermore, foreign banks were permitted to enter the Canadian market through subsidiaries only.
‐ 1987 amendments: Chartered banks were further permitted to expand their operations by allowing them to own and invest in securities dealers. As a consequence, by the mid‐1990s, no single large and independent Canadian securities dealers existed.
‐ 1992 amendments: With the revision of the Bank Act, further deregulation of the financial industry was introduced. Barriers between the chartered banks, trust and loan companies, and insurance companies were eliminated. Chartered banks and trust companies were allowed to enter the insurance business; however, restrictions on network insurance products through their branches were imposed. Moreover, chartered banks were now allowed to own trust companies, which led to a wave of acquisitions that reduced the number of independent trust and loan companies.
59 This section draws heavily on Freedman (1998). For a more in‐depth discussion, see Daniel, Freedman and Goodlet (1992–93); Freedman and Goodlet (1998); Freedman and Engert (2003); Armstrong (1997).

32
‐ 1995 amendments: Restrictions on the size of all foreign bank subsidiaries were removed. This was a result of two prior amendments, where the size restrictions were removed for the U.S. foreign bank subsidiaries in 1989, and for Mexican foreign bank subsidiaries in 1994.
‐ 1998 amendments: Trust and loan reporting forms were combined with the chartered banks reporting returns. As a consequence, only monthly data on trust and loan companies from 1996 exist.
‐ 1999 amendments: Foreign banks’ branches were allowed in Canada; however, restrictions were imposed on their business models, where they were limited to raising only wholesale deposits, with very few retail deposits permitted. In addition, foreign branches needed to maintain a minimum capital equivalent deposit amount with a domestic financial institution.
‐ 2002 amendments: Chartered banks were allowed to own finance companies. However, investment in non‐financial businesses was still restricted.
A.2. Regulatory requirements
In addition to satisfying legislative requirements, federally regulated deposit‐taking institutions have to satisfy regulatory requirements imposed by OSFI. The following is a list of important changes related to our three ratios.
A.2.1. Leverage requirements
With the introduction of the regulatory leverage ratio, a formal limit was imposed by OSFI. This limit is known as the asset‐to‐capital multiple (ACM) limit. Based on Bordeleau, Crawford and Graham (2009), the ACM limit evolution can be divided into three distinct periods:
‐ 1982: A formal ACM limit of 30 was imposed only on large banks. The actual limit was indeed lower.
‐ 1991: The formal ACM limit of 30 was reduced to 20. This limit was applied uniformly across all DTIs.
‐ 2000: The ACM limit of 20 was maintained; however, banks that satisfied certain sets of criteria were temporarily allowed a limit of 23. Furthermore, supervisors could use their discretionary powers to impose lower actual limits. For instance, small and newly founded financial institutions have ACM limits much lower than 20.
‐ 2010: The Basel Committee on Banking Supervision (BCBS) issued the so‐called Basel III requirements. It introduced a pillar‐II leverage ratio requirement, which should migrate to pillar‐I by 2018. The BCBS is still in the process of calibrating the minimum standards for this ratio.

33
A.2.2. Capital requirements Officially, minimum requirements on capital ratios were first introduced with the adoption of the Basel I accord. The minimum requirement limits and the components of the ratios have evolved over time. Here, we focus only on Tier 1 ratio components which are Tier 1 capital and risk‐weighted capital:
‐ 1988: The Basel I accord was signed and required implementation by all banks, with significant international business in the G‐10 by the end of 1992.
‐ 1994: Canadian banks started reporting the Basel Capital Adequacy Returns to supervisory authorities. The minimum requirements were set by Basel at 4 per cent and 8 per cent for the Tier 1 capital ratio and the total capital ratio, respectively. Tier 1 capital included mainly equity and retained earnings. Risk‐weighted capital focused primarily on credit risk and was calculated using the standardized approach.
‐ 1996: The Basel I framework was amended to account for market risk due to increased bank activities in trading books, using the standardized approach.
‐ 1999: OSFI officially raised the minimum requirement to 7 per cent and 10 per cent for the Tier 1 capital and total capital ratios, respectively.
‐ 2004: The Basel II accord was released, with its framework to be implemented by 2008. The new framework introduced operational risk in addition to market and credit risk. The methodology for calculating market risk remained the same standardized approach. However, the framework allowed banks to use their internal models to calculate the weighting for credit and operational risk exposures. It should be noted that banks must obtain approval from regulatory authorities before using their own methodologies. Also, Tier 1 capital components were adjusted; however, the equity and retained earnings remained its major components, with a minimum of 75 per cent common equity (core capital) requirement in Tier 1 capital.
‐ 2008: The Basel II framework was implemented in Canada. However, only the six top banks have adopted the internal ratings‐based (IRB) approach.
‐ 2010: The Basel Committee on Banking Supervision (BCBS) issued the so‐called Basel III requirements,60 which refined the level and quality of the capital requirements. By the end of the transition period (end‐2019), internationally active financial institutions would have to comply with a 4.5 per cent minimum common equity ratio plus a 2.5 per cent minimum capital conversion buffer; a minimum of 6 per cent and 8 per cent Tier 1 capital and total capital, respectively.
A.2.3. Liquidity requirements Until recently, and unlike the other two regulatory measures, liquidity regulation took the form of guidelines and directives to be applied at the discretion of the banks. The first guideline was introduced by OSFI in December 1995. However, OSFI is in the process of
60 See BCBS (2010a).

34
reviewing this guideline in light of the new BCBS requirements. Indeed, with the introduction of Basel III requirements, banks will have to report two regulatory liquidity ratios, known as the Liquidity Coverage Ratio (LCR) and the Net Stable Funding Ratio (NSFR). However, the BCBS is still in the process of calibrating the minimum standards for this ratio, which are expected to be introduced in 2015 for the LCR, and 2018 of the NSFR.
B. Overview of the Canadian Financial System
B.1. Historical evolution of the banking landscape
In the early and mid‐1900s, the Canadian financial system was characterized by five distinct, yet complementary, financial institutions: chartered banks, credit unions and caisses populaires, trust and loan companies, life insurance companies, and security dealers.61 This was the result of federal and provincial regulatory barriers that prohibited cross‐ownership and, to a certain degree, separated business activities between these institutions.
For instance, chartered banks, which are federally incorporated and supervised, were mainly involved in making commercial loans, whereas trust and loan companies, which operated under federal or provincial charters,62 specialized in residential mortgage lending and fiduciary business.63
Gradually, over the years, periodic changes in legislation have reduced the traditional barriers between these institutions and permitted them to enter each other’s business lines. While the 1967 legislative amendments removed restrictions on chartered banks’ involvement in residential mortgage lending, the legislative amendments of the 1980s allowed the banks to directly compete with trust and loan companies by permitting them to own mortgage companies.64 However, it wasn’t until 1992 that the distinction between the different institutions almost completely disappeared, by eliminating the prohibition on cross‐ownership.65,66 Over the following two decades, banks have emerged as the largest pillar of the Canadian financial system, with the six largest domestic bank conglomerates dominating the banking system.
61 There are, of course, other types of institutions; e.g., co‐operative credit movements, pension funds, venture capital companies, and financial market infrastructures such as clearing and settlement systems. However, this paper focuses on federally incorporated deposit‐taking institutions (banks, bank holding companies and federally regulated trust and loan companies). 62 Trust and loan companies can be incorporated under either federal or provincial legislation; however, all trust and loan institutions are subject to provincial licensing agreements. 63 As for the other two types of institutions, life insurance companies can be incorporated through federal or provincial charters, while securities dealers are incorporated under provincial legislation. 64 Also, during this period, trust and loan companies began to aggressively compete with banks for consumer and commercial lending. 65 Although some restrictions still prevail. For example, chartered banks can market their insurance products only through independent branches (distinct from their retail banking branches). Also, credit unions and caisses populaires are still provincially regulated. 66 For more details on the evolution of the Canadian financial system, see Freedman (1998); Freedman and Goodlet (1998); Freedman and Engert (2003); Armstrong (1997).

35
These Big Six banks,67 which hold roughly 90 per cent of all Canadian bank assets, offer financial services to a wide range of sectors, and operate on a nationwide basis through their branch network. Their activities are organized into three broad business segments: retail banking, which offers loan products to households and small/medium‐sized businesses; capital markets activities, which include security dealers, investment banking and credit products to large corporations; and wealth management activities, which include retail brokerage and mutual fund products. On the other hand, most of the smaller financial institutions have a more traditional model of banking, which mainly consists of raising deposits, providing loans to a few economic agents, and operating in specific regions.
B.2. Historical evolution of the overall balance sheet
Changes in economic reality and in legislation have both contributed to the evolution of Canadian banks’ asset and liability mix over the past three decades. Noticeably, the relative shares of mortgage loans and private securities have trended up, while the relative share of non‐mortgage loans has trended down.
On the asset side, the share of mortgage lending, which includes residential and non‐residential mortgages, but excludes off‐balance‐sheet securitization,68 has been continuously growing since the 1980s (Figure B1).69 This trend has been mainly driven by residential mortgage lending. During the 1980s and early 1990s, residential mortgage growth was in part facilitated by several legislative amendments of the Bank Act, which allowed chartered banks to directly compete with other financial institutions for residential mortgage financing. The trend in the 1990s was also supported by favourable demographics. The “Baby‐Boomer” generation was starting to form families and buying their first homes.70 Modifications to the mortgage insurance rules by the Canada Mortgage and Housing Corporation (CMHC) in the early 2000s also aided the growth trend for residential mortgage lending. For instance, the minimum down payment eligibility criterion was lowered from 25 per cent to 5 per cent in 1999, and price ceiling limits were removed in 2003. The decline in 2009 is attributed to the introduction of the Insured Mortgage Purchase Program, through which CMHC bought roughly $75 billion of the banks’ insured mortgage portfolios on behalf of the government. In 2010, the growth trend picked up again, stemming from robust economic conditions in Canada.
In contrast to mortgage loans, the share of non‐mortgage loans, which includes business loans and personal loans, has been declining since the early 1980s. As shown in Figure B1, the declining share of non‐mortgage loans in the 1980s was in part due to increased competition from different financial
67 These banks are: Bank of Montreal, Bank of Nova Scotia, Canadian Imperial Bank of Commerce, National Bank of Canada, Royal Bank of Canada and Toronto‐Dominion Bank. 68 Securitizations are excluded since they are not included in the leverage ratio calculation prior to implementation of the IFRS in 2011, and since the effect on capital ratios is negligible (immaterial risk weighting). It is worth noting that before 2007, securitization was limited in Canada (around 4 per cent in 1997 to 17 per cent in 2007 of their residential mortgages). For more details, see Armstrong (1997); Allen, Hortaçsu and Kastl (2011). 69 Figures B2 and B3 display balance‐sheet size dynamics for assets and liabilities, respectively, by bank‐size groups. In addition, Table B1 shows average asset and liability portfolios over the entire sample period for all bank groups. 70 See Armstrong (1997) for a more detailed discussion.

36
institutions. For instance, life insurance companies were directly competing for business loans, while credit unions and caisses populaires were competing for personal loans. Additionally, as corporate borrowers increasingly relied on capital markets for their financing needs in the 1990s through bonds and equity issuances, the decline in the share of non‐mortgage loans began to accelerate. At the same time, banks’ relative holdings of private securities had risen, indicating continued exposure to corporate sector risk, albeit through different instruments. On the other hand, holdings of public securities remained stable. The share of public securities remained relatively small, despite the small uptick during the mid‐1990s, in part due to the rapidly growing securities‐lending and repo markets in which banks were increasingly participating through their dealer subsidiaries.71
On the liability side, deposits remain the dominant source of funding. Both retail and wholesale deposits represent more than half of total liabilities. However, their relative shares have been declining since the mid‐1990s, as banks increased their participation in the repo markets. The relative share of other liabilities also increased during this period, mainly due to derivative‐related items held by the banks. This increase is also reflected by the derivates held on the assets side.72
71 See Morrow (1994‐1995). 72 Canadian accounting rules require reporting of derivatives on a gross basis, in contrast to the net basis in the United States, for instance.

37
Figure B1: Balance‐sheet components of Canadian financial institutions (as a percentage of total assets)
Source: Office of the Superintendent of Financial Institutions Canada Last observation: August 2011

38
Figure B2: Asset components of Canadian financial institutions’ balance sheets, by size in billions of dollars (12‐month moving average)
Source: Office of the Superintendent of Financial Institutions Canada Last observation: August 2011

39
Figure B3: Liability components of Canadian financial institutions’ balance sheets, by size in billions of dollars (12‐month moving average)
Source: Office of the Superintendent of Financial Institutions Canada Last observation: August 2011

40
Table B1: Average balance‐sheet composition of Canadian banks by type in per cent, (1983–2011)
Big Six banks
Non‐Big Six
Large Medium Small
Foreign subsidiary
Other domestic bank
Trust and loan
companya
High wholesale funding
Low wholesale funding
No wholesale funding
Assets
Cash 7.9 9.6 16.5 21.5 11.4 4.9 17.8 14.7 7.3 15.9
Mortgage loans 18.7 19.8 18.2 20.3 12.8 42.0 56.9 8.3 29.6 33.0
Public securities 6.8 9.0 4.2 5.3 9.0 8.4 4.2 7.0 10.2 10.6
Non‐mortgage loans
43.0 44.8 47.1 37.7 47.5 37.1 12.4 52.4 38.3 31.2
Private securities 11.9 5.0 5.7 5.2 5.5 3.9 4.3 5.3 5.3 4.1
Other assets 11.7 11.9 8.3 10.0 13.7 3.7 4.4 12.2 9.3 5.1
Liabilities
Retail deposits 32.6 27.6 28.2 30.6 19.1 57.4 64.0 10.2 43.9 42.7
Wholesale deposits
40.8 46.1 48.5 38.6 52.9 23.7 17.9 65.5 30.9 0.0
Repos 4.3 2.0 0.2 0.0 2.2 1.0 0.0 2.5 1.4 0.0
Bankers’ acceptances
3.9 6.0 4.2 1.8 7.0 0.5 0.4 6.0 5.0 0.1
Other liabilities 13.7 12.5 8.0 7.1 12.2 12.2 7.2 9.1 12.9 25.9
Equity 4.7 5.8 10.9 21.8 6.6 5.2 10.5 6.8 6.0 31.2 a Trust and loan data start from 1996. Source: Office of the Superintendent of Financial Institutions Note: Numbers are calculated by first aggregating each balance‐sheet item by groups for each month and taking the simple average over time.

41
C. Reporting Requirements and Returns for DTIs

42
D. Active Financial Institutions, By Bank Size and Charter Type, in August 2011
Non‐Big Six banks
Foreign subsidiary Other domestic bank Trust and loan company
Large
[L] AMEX Bank of Canada [H] Bank of Tokyo‐Mitsubishi UJF (Canada) [H] BNP Paribas (Canada) [L] Citibank Canada [H] HSBC Bank Canada [L] ICICI Bank Canada [L] ING Bank of Canada [H] MBNA Canada Bank
[N] Bridgewater Bank[N] Canadian Tire Bank [H] Canadian Western Bank [L] Laurentian Bank of Canada [H] Manulife Bank of Canada
[N] AGF Trust Company[L] Equitable Trust Company (The) [L] Home Trust Company [N] MCAN Mortgage Corporation [N] Peoples Trust Company [H] RBC Dexia Investor Services Trust [L] ResMor Trust Company
Medium
[H] Bank of China [H] Industrial and Commercial Bank of China (Canada) [H] Korea Exchange Bank of Canada [L] Mega International Commercial Bank (Canada) [H] Shinhan Bank Canada [H] Société Générale (Canada) [L] State Bank of India (Canada) [H] Sumitomo Mitsui Banking Corporation of Canada [H] UBS Bank (Canada)
[L] Bank West[H] First Nations Bank of Canada [L] General Bank of Canada [N] HomEquity Bank [L] Pacific & Western Bank of Canada [N] President's Choice Financial Services
[L] Community Trust Company[H] Effort Trust Company (The) [H] League Savings and Mortgage Company [L] M.R.S. Trust Company [N] Peace Hills Trust Company
Small
[L] CTC Bank of Canada [H] Habib Canadian Bank
[N] Citizens Bank of Canada[H] Alterna Bank [N] DirectCash Bank [H] Jameson Bank
[N] BNY Trust Company of Canada[N] Caledon Trust Company [N] Computershare Trust Company of Canada [N] Concentra Trust [L] Equity Financial Trust Company [N] Fiduciary Trust Canada [L] First Data Loan Company, Canada [N] Industrial Alliance Trust Inc. [N] Investors Group Trust Co. Ltd. [N] Legacy Private Trust [N] Oak Trust [N] Standard Life Trust Company [N] State Street Trust Company Canada [L] Valiant Trust Company
Big Six banks
Bank of Montreal Bank of Nova Scotia (The) Canadian Imperial Bank of Commerce National Bank of Canada Royal Bank of Canada Toronto‐Dominion Bank (The)
Note: High wholesale funding financial institutions are indicated with [H], low wholesale funding with [L] and no wholesale funding with [N].

43
E. Robustness Checks
This appendix investigates whether the main findings in the paper are robust to changes in the calculation methods and sample selections. The first check that we conduct is an analysis of the averages of the ratios instead of the medians of the ratios used in this paper. The results of this test show similar trends as the medians of the ratios despite slight differences in levels. We prefer to use the median, since it provides a better measure for the central tendency by eliminating the bias from outliers.
The second check that we conduct relates to the disaggregation of the Big Six banks, instead of grouping them together. The results reveal that the Big Six banks have fairly similar balance‐sheet compositions, implying similarity in their resilience to different types of shocks. Therefore, analyses in this paper have only focused on the Big Six as a group.
The next two checks that we conduct pertain to the entry, exit and acquisition dynamics and their potential impact on the regulatory ratios, specifically the ones that exhibited significant changes (i.e., leverage and funding ratios). The third check analyzes the measured leverage ratios calculated by only including the active financial institutions throughout the data period. The results still reveal a divergent trend for the leverage ratios between the Big Six and the other institutions, albeit to a lesser degree. This result suggests that the acquisitions of non‐Big Six institutions by the Big Six banks partly contributed to the observed divergence. The trust and loan companies, together with several Canadian investment dealers (not included in the dataset) that were acquired by the Big Six banks in the late 1980s (e.g., Dominion Securities by the Royal Bank of Canada and Nesbitt Thomson by the Bank of Montreal), did not seem to have significantly increased the leverage of their parent institutions.
The fourth check compares the funding ratios with and without including certain acquisitions, entries and exits. The results reveal that the decline in the funding ratio (Figure 2, panel d) is reinforced by the inclusion of trust and loan company data in 1996, which, on average, exhibit low funding ratios. In addition, dynamics regarding mergers, exits and charter changes of foreign subsidiaries (e.g., from a foreign subsidiary to a foreign branch)73 appear to have played some role in the decline of funding ratios around the year 2000. Regardless of these factors, a decline in funding ratios is observed around the time of the introduction of the liquidity guidelines, as shown in Figure E. Potential effects of the liquidity guidelines are seen especially for the low funding ratios (25th percentile), which had declined prior to 1995 and stabilized since that time.
The final check relates to the repurchase agreements securities (i.e., repos) in the funding ratio. Some contend that the repos should not have been included in the calculation of the wholesale funding ratio, since the Canadian repo market structure is different, and is perceived as more stable and resilient than in the United States. For instance, the repo transactions in Canada are largely bilateral and are mostly secured by securities backed by the Government of Canada. However,
73 There were 38 such foreign subsidiaries, of which 11 changed their charter to a foreign bank, 11 merged or were acquired by another financial institution and 16 ceased operation.

44
despite being perceived as resilient, the repo market in Canada was not entirely shielded from market turbulence. At the onset of the recent financial crisis, spreads in Canada increased in line with the spreads in other major economies, although not as much as in some advanced economies that have been hard hit by the crisis.74 Finally, by excluding the repo securities from the wholesale funding ratio, we obtain similar results with only slight differences in levels.
Overall, these checks have confirmed the robustness of, and have increased our confidence in, our results.
Figure E: Funding ratio for the Big Six and non‐Big Six banks (monthly data)
a Exclude trust and loan companies and foreign subsidiaries that merged, exited or changed their charter type. Source: Office of the Superintendent of Financial Institutions Canada Last observation: August 2011
74 For instance, the spreads between the interbank offered rates and overnight indexed swaps moved from 8 basis points in 2007 to more than 100 basis points at the height of the recent financial crisis in 2009.


![World Journal of · enhancing muscle adaptations. RESISTANCE TRAINING Skeletal muscle hypertrophy depends on positive muscle protein balance (protein synthesis exceeds breakdown)[34].](https://static.fdocuments.in/doc/165x107/5fea8961ddc382342d4e386d/world-journal-of-enhancing-muscle-adaptations-resistance-training-skeletal-muscle.jpg)
