Can Weather Radars Help Monitoring and - Pierre Pinson
4
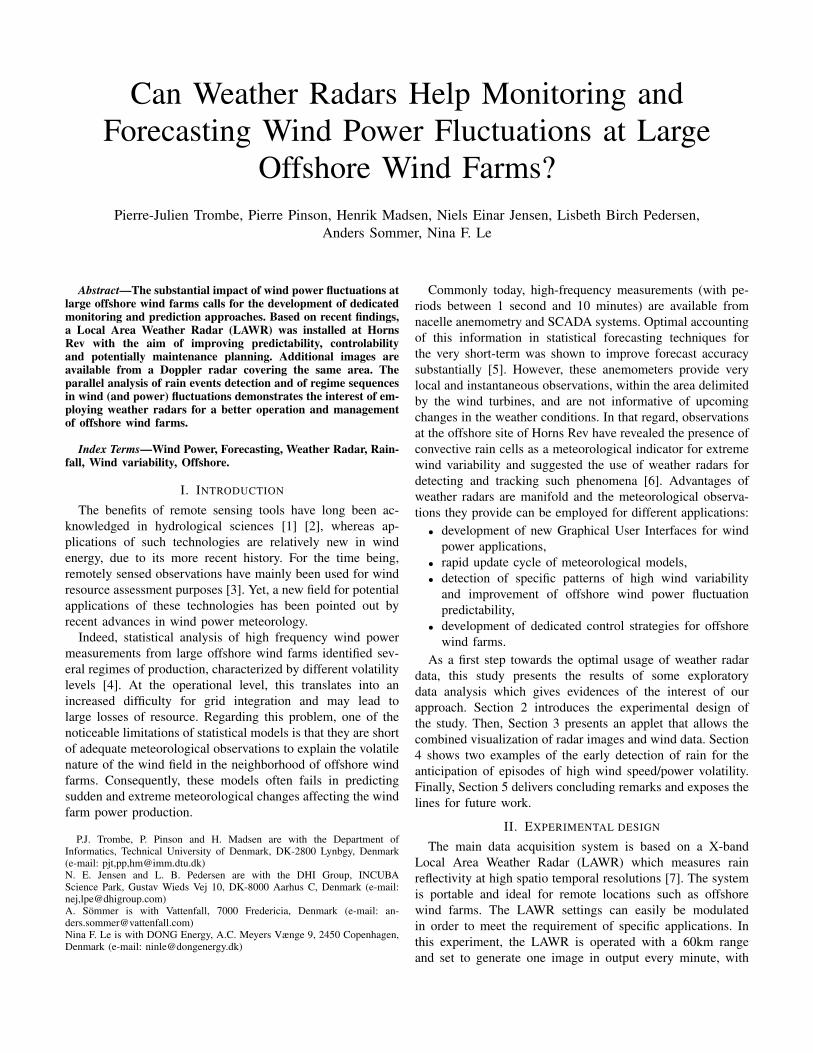
Can Weather Radars Help Monitoring and Forecasting Wind Power Fluctuations at Large Offshore Wind Farms? Pierre-Julien Trombe, Pierre Pinson, Henrik Madsen, Niels Einar Jensen, Lisbeth Birch Pedersen, Anders Sommer, Nina F. Le Abstract—The substantial impact of wind power fluctuations at large offshore wind farms calls for the development of dedicated monitoring and prediction approaches. Based on recent findings, a Local Area Weather Radar (LAWR) was installed at Horns Rev with the aim of improving predictability, controlability and potentially maintenance planning. Additional images are available from a Doppler radar covering the same area. The parallel analysis of rain events detection and of regime sequences in wind (and power) fluctuations demonstrates the interest of em- ploying weather radars for a better operation and management of offshore wind farms. Index Terms—Wind Power, Forecasting, Weather Radar, Rain- fall, Wind variability, Offshore. I. I NTRODUCTION The benefits of remote sensing tools have long been ac- knowledged in hydrological sciences [1] [2], whereas ap- plications of such technologies are relatively new in wind energy, due to its more recent history. For the time being, remotely sensed observations have mainly been used for wind resource assessment purposes [3]. Yet, a new field for potential applications of these technologies has been pointed out by recent advances in wind power meteorology. Indeed, statistical analysis of high frequency wind power measurements from large offshore wind farms identified sev- eral regimes of production, characterized by different volatility levels [4]. At the operational level, this translates into an increased difficulty for grid integration and may lead to large losses of resource. Regarding this problem, one of the noticeable limitations of statistical models is that they are short of adequate meteorological observations to explain the volatile nature of the wind field in the neighborhood of offshore wind farms. Consequently, these models often fails in predicting sudden and extreme meteorological changes affecting the wind farm power production. P.J. Trombe, P. Pinson and H. Madsen are with the Department of Informatics, Technical University of Denmark, DK-2800 Lynbgy, Denmark (e-mail: pjt,pp,[email protected]) N. E. Jensen and L. B. Pedersen are with the DHI Group, INCUBA Science Park, Gustav Wieds Vej 10, DK-8000 Aarhus C, Denmark (e-mail: nej,[email protected]) A. S¨ ommer is with Vattenfall, 7000 Fredericia, Denmark (e-mail: an- [email protected]) Nina F. Le is with DONG Energy, A.C. Meyers Vænge 9, 2450 Copenhagen, Denmark (e-mail: [email protected]) Commonly today, high-frequency measurements (with pe- riods between 1 second and 10 minutes) are available from nacelle anemometry and SCADA systems. Optimal accounting of this information in statistical forecasting techniques for the very short-term was shown to improve forecast accuracy substantially [5]. However, these anemometers provide very local and instantaneous observations, within the area delimited by the wind turbines, and are not informative of upcoming changes in the weather conditions. In that regard, observations at the offshore site of Horns Rev have revealed the presence of convective rain cells as a meteorological indicator for extreme wind variability and suggested the use of weather radars for detecting and tracking such phenomena [6]. Advantages of weather radars are manifold and the meteorological observa- tions they provide can be employed for different applications: • development of new Graphical User Interfaces for wind power applications, • rapid update cycle of meteorological models, • detection of specific patterns of high wind variability and improvement of offshore wind power fluctuation predictability, • development of dedicated control strategies for offshore wind farms. As a first step towards the optimal usage of weather radar data, this study presents the results of some exploratory data analysis which gives evidences of the interest of our approach. Section 2 introduces the experimental design of the study. Then, Section 3 presents an applet that allows the combined visualization of radar images and wind data. Section 4 shows two examples of the early detection of rain for the anticipation of episodes of high wind speed/power volatility. Finally, Section 5 delivers concluding remarks and exposes the lines for future work. II. EXPERIMENTAL DESIGN The main data acquisition system is based on a X-band Local Area Weather Radar (LAWR) which measures rain reflectivity at high spatio temporal resolutions [7]. The system is portable and ideal for remote locations such as offshore wind farms. The LAWR settings can easily be modulated in order to meet the requirement of specific applications. In this experiment, the LAWR is operated with a 60km range and set to generate one image in output every minute, with
Transcript of Can Weather Radars Help Monitoring and - Pierre Pinson
Can Weather Radars Help Monitoring andForecasting Wind Power Fluctuations at Large
Offshore Wind Farms?Pierre-Julien Trombe, Pierre Pinson, Henrik Madsen, Niels Einar Jensen, Lisbeth Birch Pedersen,
Anders Sommer, Nina F. Le
Abstract—The substantial impact of wind power fluctuations atlarge offshore wind farms calls for the development of dedicatedmonitoring and prediction approaches. Based on recent findings,a Local Area Weather Radar (LAWR) was installed at HornsRev with the aim of improving predictability, controlabilityand potentially maintenance planning. Additional images areavailable from a Doppler radar covering the same area. Theparallel analysis of rain events detection and of regime sequencesin wind (and power) fluctuations demonstrates the interest of em-ploying weather radars for a better operation and managementof offshore wind farms.
Index Terms—Wind Power, Forecasting, Weather Radar, Rain-fall, Wind variability, Offshore.
I. INTRODUCTION
The benefits of remote sensing tools have long been ac-knowledged in hydrological sciences [1] [2], whereas ap-plications of such technologies are relatively new in windenergy, due to its more recent history. For the time being,remotely sensed observations have mainly been used for windresource assessment purposes [3]. Yet, a new field for potentialapplications of these technologies has been pointed out byrecent advances in wind power meteorology.
Indeed, statistical analysis of high frequency wind powermeasurements from large offshore wind farms identified sev-eral regimes of production, characterized by different volatilitylevels [4]. At the operational level, this translates into anincreased difficulty for grid integration and may lead tolarge losses of resource. Regarding this problem, one of thenoticeable limitations of statistical models is that they are shortof adequate meteorological observations to explain the volatilenature of the wind field in the neighborhood of offshore windfarms. Consequently, these models often fails in predictingsudden and extreme meteorological changes affecting the windfarm power production.
P.J. Trombe, P. Pinson and H. Madsen are with the Department ofInformatics, Technical University of Denmark, DK-2800 Lynbgy, Denmark(e-mail: pjt,pp,[email protected])N. E. Jensen and L. B. Pedersen are with the DHI Group, INCUBAScience Park, Gustav Wieds Vej 10, DK-8000 Aarhus C, Denmark (e-mail:nej,[email protected])A. Sommer is with Vattenfall, 7000 Fredericia, Denmark (e-mail: [email protected])Nina F. Le is with DONG Energy, A.C. Meyers Vænge 9, 2450 Copenhagen,Denmark (e-mail: [email protected])
Commonly today, high-frequency measurements (with pe-riods between 1 second and 10 minutes) are available fromnacelle anemometry and SCADA systems. Optimal accountingof this information in statistical forecasting techniques forthe very short-term was shown to improve forecast accuracysubstantially [5]. However, these anemometers provide verylocal and instantaneous observations, within the area delimitedby the wind turbines, and are not informative of upcomingchanges in the weather conditions. In that regard, observationsat the offshore site of Horns Rev have revealed the presence ofconvective rain cells as a meteorological indicator for extremewind variability and suggested the use of weather radars fordetecting and tracking such phenomena [6]. Advantages ofweather radars are manifold and the meteorological observa-tions they provide can be employed for different applications:
• development of new Graphical User Interfaces for windpower applications,
• rapid update cycle of meteorological models,• detection of specific patterns of high wind variability
and improvement of offshore wind power fluctuationpredictability,
• development of dedicated control strategies for offshorewind farms.
As a first step towards the optimal usage of weather radardata, this study presents the results of some exploratorydata analysis which gives evidences of the interest of ourapproach. Section 2 introduces the experimental design ofthe study. Then, Section 3 presents an applet that allows thecombined visualization of radar images and wind data. Section4 shows two examples of the early detection of rain for theanticipation of episodes of high wind speed/power volatility.Finally, Section 5 delivers concluding remarks and exposes thelines for future work.
II. EXPERIMENTAL DESIGN
The main data acquisition system is based on a X-bandLocal Area Weather Radar (LAWR) which measures rainreflectivity at high spatio temporal resolutions [7]. The systemis portable and ideal for remote locations such as offshorewind farms. The LAWR settings can easily be modulatedin order to meet the requirement of specific applications. Inthis experiment, the LAWR is operated with a 60km rangeand set to generate one image in output every minute, with
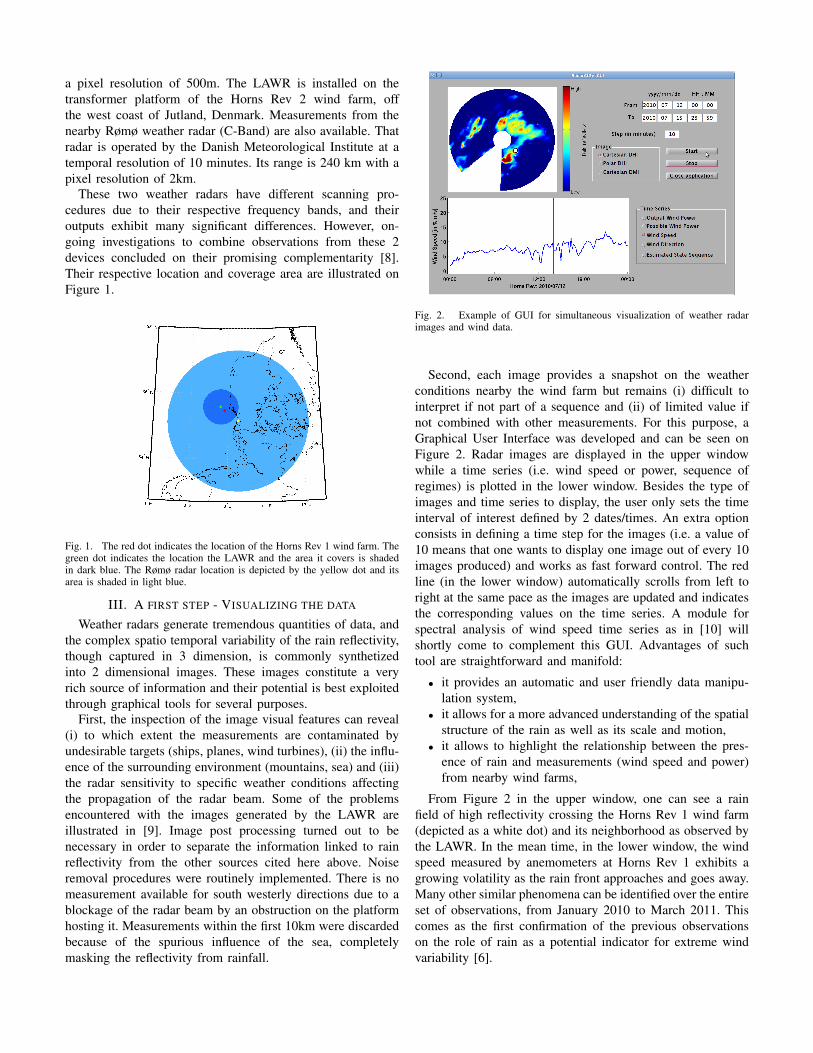
a pixel resolution of 500m. The LAWR is installed on thetransformer platform of the Horns Rev 2 wind farm, offthe west coast of Jutland, Denmark. Measurements from thenearby Rømø weather radar (C-Band) are also available. Thatradar is operated by the Danish Meteorological Institute at atemporal resolution of 10 minutes. Its range is 240 km with apixel resolution of 2km.
These two weather radars have different scanning pro-cedures due to their respective frequency bands, and theiroutputs exhibit many significant differences. However, on-going investigations to combine observations from these 2devices concluded on their promising complementarity [8].Their respective location and coverage area are illustrated onFigure 1.
Fig. 1. The red dot indicates the location of the Horns Rev 1 wind farm. Thegreen dot indicates the location the LAWR and the area it covers is shadedin dark blue. The Rømø radar location is depicted by the yellow dot and itsarea is shaded in light blue.
III. A FIRST STEP - VISUALIZING THE DATA
Weather radars generate tremendous quantities of data, andthe complex spatio temporal variability of the rain reflectivity,though captured in 3 dimension, is commonly synthetizedinto 2 dimensional images. These images constitute a veryrich source of information and their potential is best exploitedthrough graphical tools for several purposes.
First, the inspection of the image visual features can reveal(i) to which extent the measurements are contaminated byundesirable targets (ships, planes, wind turbines), (ii) the influ-ence of the surrounding environment (mountains, sea) and (iii)the radar sensitivity to specific weather conditions affectingthe propagation of the radar beam. Some of the problemsencountered with the images generated by the LAWR areillustrated in [9]. Image post processing turned out to benecessary in order to separate the information linked to rainreflectivity from the other sources cited here above. Noiseremoval procedures were routinely implemented. There is nomeasurement available for south westerly directions due to ablockage of the radar beam by an obstruction on the platformhosting it. Measurements within the first 10km were discardedbecause of the spurious influence of the sea, completelymasking the reflectivity from rainfall.
Fig. 2. Example of GUI for simultaneous visualization of weather radarimages and wind data.
Second, each image provides a snapshot on the weatherconditions nearby the wind farm but remains (i) difficult tointerpret if not part of a sequence and (ii) of limited value ifnot combined with other measurements. For this purpose, aGraphical User Interface was developed and can be seen onFigure 2. Radar images are displayed in the upper windowwhile a time series (i.e. wind speed or power, sequence ofregimes) is plotted in the lower window. Besides the type ofimages and time series to display, the user only sets the timeinterval of interest defined by 2 dates/times. An extra optionconsists in defining a time step for the images (i.e. a value of10 means that one wants to display one image out of every 10images produced) and works as fast forward control. The redline (in the lower window) automatically scrolls from left toright at the same pace as the images are updated and indicatesthe corresponding values on the time series. A module forspectral analysis of wind speed time series as in [10] willshortly come to complement this GUI. Advantages of suchtool are straightforward and manifold:
• it provides an automatic and user friendly data manipu-lation system,
• it allows for a more advanced understanding of the spatialstructure of the rain as well as its scale and motion,
• it allows to highlight the relationship between the pres-ence of rain and measurements (wind speed and power)from nearby wind farms,
From Figure 2 in the upper window, one can see a rainfield of high reflectivity crossing the Horns Rev 1 wind farm(depicted as a white dot) and its neighborhood as observed bythe LAWR. In the mean time, in the lower window, the windspeed measured by anemometers at Horns Rev 1 exhibits agrowing volatility as the rain front approaches and goes away.Many other similar phenomena can be identified over the entireset of observations, from January 2010 to March 2011. Thiscomes as the first confirmation of the previous observationson the role of rain as a potential indicator for extreme windvariability [6].
IV. RAIN: AN INDICATOR OF HIGH WIND SPEED/POWERVARIABILITY?
Moving on from visual observations in the previous section,we propose a simple statistical approach to link the detectionof rain and episodes of high volatility of wind speed and windpower. For a more detailed description of the models used inthis section, we refer to [11].
First of all, it is worth mentioning that we did not attemptto convert rain reflectivity observations into rain intensityvalues since this conversion is based on an approximation,the so called Z-R relationship, which requires the raindropsize distribution to be known or assumed [12]. Instead, weprefer working on the original reflectivity values. Based on thecommon segmentation used in Hydrology and Meteorology,rain reflectivity values are grouped into 5 different classes withrespect to their dBZ values (decibel of reflectivity):
• class 1 - no rain (<8 dBZ)• class 2 - light rain (8-24 dBZ)• class 3 - moderate rain (25-45 dBZ)• class 4 - heavy rain to thunderstorms (46-65 dBZ)• class 5 - extreme thunderstorms (>65 dBZ)
Few events depicting dBZ values of class 5 were observed andafter verification, these values were most of the time linked tocontaminated pixels. We used images from the Rømø radar forthis analysis. A circular area of 60km radius and centered onthe Horns Rev 1 wind farm is defined and only pixels withinthat area are considered. For each image, the rate of pixelsfalling into one of the 5 classes is computed. That way, wecan detect the presence of rain if the cumulated sum of pixelsin class 2-4 exceeds a given threshold.
A. Wind speed variability
As for modeling the wind speed variability, time seriesbased methodologies in the frequency domain provide a widerange of methods of which some are presented in [13]. Inparticular, it is shown in [10] that a method based on theHilbert-Huang transform is able to highlight specific seasonalcycles as key features of wind variability. However, this isbeyond the scope of this study and will be investigated atlater times. Instead, we use a general approach based on Au-toregressive (AR) - Generalized AutoRegressive ConditionalHeteroscedastic (GARCH) models. The AR part of the modelwill capture the mean behavior of the wind speed time series(i.e. the low frequency fluctuations) while the GARCH partwill model the dynamics of the squared errors (i.e. the highfrequency fluctuations). GARCH models are often applied fortime series featuring time-varying variance. For a given timeseries of wind speed {yt}, the model is formulated as follows:
yt = θ0 +
r∑i=1
θiyt−i +√htεt (1)
ht = α0 +
q∑i=1
αiε2t−i +
p∑j=1
βjht−j (2)
with {ht} the estimated conditional variance at time t and{εt} a sequence of independently distributed random variablesfollowing a Normal distribution N (0, 1).
The time series of wind speed was sampled over 10minute intervals and all observations for the year 2010 wereused to fit the model using Maximum Likelihood Estimation.Figure 3 depicts a 17 day episode of wind speed observedat Horns Rev 1 in July 2010 (top window) along with theestimated conditional variance series {ht} (second windowfrom the top). The observed peaks correspond to periods ofhigh wind speed volatility. The corresponding time series ofcumulated coverage rate for classes 3 to 4 (rate of pixelshaving dBZ values larger than 25) is also plotted and illustratesthe sequence of rains fronts detected nearby Horns Rev 1.Interestingly, the 3 periods of highest wind speed volatilitycorrespond to periods where rain fronts with high reflectivityare detected nearby Horns Rev 1. On July 3, the peak ofcoverage is lagged of a couple of hours when compared tothe peak in the conditional variance potentially indicatingthat strong turbulences in the wind field were experiencedas the rain front was approaching. Similar phenomena werealso spotted in several other occasions and make us think thatthe change in the wind speed dynamics may not be perfectlysynchronized with the instantaneous detection of rain nearby.Wind turbulences are experienced a few hours before and afterthe rain front hits the wind farm.
B. Wind power variability
The nonlinear conversion from wind to power makes thatperiods of high wind speed variability do not necessarilytranslate into periods with high wind power variability. It istherefore important to assess whether the detection of raincan lead to identify episodes of large wind power fluctuations,independently of the wind speed variability.
For this purpose, we want to show whether the detectionor rain can be related to different regimes of power produc-tion following the definition proposed in [4]. That definitionassumes that a wind farm can be modeled as a single systemwhich switches between different states or regimes, given thedynamics of its power fluctuations. For the specific case ofHorns Rev 1, it was shown that the mean dynamics wererelatively similar across regimes but that the standard deviationlevels were significantly different.
We extracted a 3 regime sequence based on a time series ofwind power sampled over 10 minute intervals, for the wholeyear 2010. Given σ(i) is the estimated standard deviationsin regime i, regimes were ranked with respect to increasingvolatility levels so that σ(1) < σ(2) < σ(3) and σ(1) = 3.10−4,σ(2) = 0.014, σ(3) = 0.068. Then, we computed the condi-tional probabilities of the wind farm being in each of the 3regimes, given high reflectivity rain (i.e. rain reflectivity ofclass 3 or 4) was detected the hour before, and given no rain.These results are reported in Table I.
Rain (classes 3 and 4) was detected in 17% of the obser-vations. In both cases, rain and no rain, regime 2 is dominantwith the largest conditional probability. As for regime 1, its

Jun 30 Jul 05 Jul 10 Jul 15
05
1015
Win
d S
peed
[m.s
−1]
Jun 30 Jul 05 Jul 10 Jul 15
02
46
8
Est
imat
ed c
ondi
tiona
l Var
ianc
e
Jun 30 Jul 05 Jul 10 Jul 15
0.0
0.2
0.4
0.6
0.8
Cov
erag
e ra
te o
f Cla
ss 3
:4
Fig. 3. From top to bottom: (i) Original wind speed time series, (ii) Estimatedconditional variance, (iii) Coverage rate of pixels in classes 3 and 4.
TABLE ICONDITIONAL PROBABILITIES OF WIND POWER PRODUCTION REGIME
GIVEN RAIN OR NO RAIN WAS DETECTED. REGIME ARE RANKED BYINCREASING VOLATILITY.
Reg. 1 Reg. 2 Reg. 3rain 0.18 0.43 0.39no rain 0.08 0.64 0.28
conditional probability is higher when rain is detected. Atferverification this is due to a higher rate of wind speeds above15m.s−1 for which the wind power dynamics is smoothed.However, the most noticeable feature revealed by these resultsis that the conditional probability of the wind farm being inregime 3 (i.e. the regime for which the wind power fluctuationsare the most volatile) is 11% larger when rain is detectedcompared to the no rain case. Interestingly, it is this type ofwind power fluctuations that statistical models cannot predictaccurately for the moment. It is shown here that the earlydetection of rain fronts can improve the anticipation of thesevolatile wind power fluctuations and hence that weather radarsare very useful.
V. CONCLUSION
In this study, we demonstrated that weather radars could bevaluable assets for offshore wind power applications. Througha binary approach (rain / no rain), we managed to clearly
identify episods of high wind speed variability. In addition,it was shown that it could also improve the anticipationof highly volatile wind power fluctuations for which state-of-the-art forecasts are characterized by large uncertainties.However, it is clear that a more advanced approach is neededfor an optimal use of the information contained within theradar images. Improved image segmentation as well as theextraction of dynamic features such as motion speed anddirection are expected to give more insights on rain events. Another line of work is to merge the expertise of meteorologistsand statisticians to perform a classification of rain events withrespect their impact on wind speed/power variability.
VI. ACKNOWLEDGMENTS
This work was supported by the Danish Public ServiceObligation (PSO) fund under the project “Radar@Sea” (undercontract PSO 2009-1-0226). DONG Energy and Vattenfall areacknowledged for sharing the images generated by the LAWRand the wind data for the Horns Rev 1 wind farm, respectively.DHI is thanked for providing assistance with the images.Finally, the authors express their gratitude to Thomas Bøvithand his colleagues at the Danish Meteorological Institute(DMI) for kindly providing data from the Rømø radar andsharing their expertise.
REFERENCES
[1] A. Pietroniro and T. D. Prowse. “Applications of remote sensing inHydrology”, Hydrological processes, vol. 16, no. 8, pp. 1537-1541, 2002.
[2] G. Delrieu, I. Braud, A. Berne, M. Borga, B. Boudevillain, F. Fabry,J. Freer, E. Gaume, E. Nakakita, A. Seed, P. Tabary and R. Uijlenhoet.“Weather Radar and Hydrology”, Advances in Water Resources, vol. 32,no. 7, pp. 969-974, 2009.
[3] C. B. Hasager, A. Pena, M. Bruun Christiansen, P. Astrup, M. Nielsen,F. Monaldo, D. Thompson and P. Nielsen. “Remote sensing observationsused in Offshore Wind Energy”, IEEE Journal of Selected Topics inApplied Earth Observations and Remote Sensing, vol. 1, no. 1, pp. 67-79,2008.
[4] P. Pinson and H. Madsen. “Adaptive modeling and forecasting of windpower fluctuations with Markov-switching autoregressive models”, Jour-nal of Forecasting, Available online, 2011.
[5] C. Gallego, P. Pinson, H. Madsen, A. Costa and A. Cuerva. “Influenceof local wind speed and direction on wind power dynamics - Applicationto offshore very short-term forecasting”, Applied Energy, vol. 88, no. 11,pp. 4087-4096, 2011.
[6] C. Vincent. “Mesoscale wind fluctuations over Danish waters”, PhDdissertation, Risø - Technical University of Denmark, 2010 (ISBN 978-87-550-3864-6).
[7] L. Pedersen, N. E. Jensen and H. Madsen. “Calibration of Local AreaWeather Radar - Identifying significant factors affecting the calibration”,Atmospheric Research, vol. 97, no. 1-2, pp. 129-143, 2010.
[8] J. E. Nielsen, J.B. Larsen, S. Thorndahl and M. R. Rasmussen. “Quan-titative precipitation estimates measured by C- and X-band radars - thepotential for integration”, Proceedings of the Sixth European Conferenceon Radar in Meteorology and Hydrology, Sibiu, Romania, 2010.
[9] P. J. Trombe, P. Pinson, S. C. Thomsen and H. Madsen. “Radar@Sea -Towards improving short term wind power forecasts”, Proceedings of theEuropean Geosciences Union General Assembly, Vienna, Austria, 2011.
[10] C. Vincent, G. Giebel, P. Pinson and H. Madsen. “Resolving Nonstation-ary Spectral Information in Wind Speed Time Series Using the Hilbert-Huang Transform”, Journal of Applied Meteorology and Climatology,vol. 49, no. 2, pp. 253-267, 2010.
[11] P. J. Trombe, P. Pinson and H. Madsen. “Markov-switching AR-GARCHmodels for the characterization and forecasting of short-term offshorewind power fluctuations”, Working Paper, 2011.
[12] J. S. Marshall and W. McK. Palmer. “The distribution of raindrops withsize”, Journal of Meteorology, vol. 5, pp. 165-166, 1948.
[13] H. Madsen. “Time Series Analysis”, Chapman & Hall, 2008.


![UWB Radars [EDocFind.com]](https://static.fdocuments.in/doc/165x107/577d2b9c1a28ab4e1eaae39f/uwb-radars-edocfindcom.jpg)