Can we use camera traps to estimate population size or ...
36
1 Can we use camera traps to estimate population size or density of the quenda (Isoodon obesulus fusciventer)? This thesis is submitted in partial fulfillment of the requirements for a Master of Biological Science, Zoology SCIE 5511 – 13 Research Dissertation Faculty of Science The University of Western Australia (May 2017) Word count: 8037 Formatted in accordance with the journal Australian Mammalogy Georgia Ford Supervised by Roberta Bencini – School of Agriculture and Environment Dr Michael Bamford – Bamford Consulting Ecologists
Transcript of Can we use camera traps to estimate population size or ...

1
Can we use camera traps to estimate population size or density of
the quenda (Isoodon obesulus fusciventer)?
This thesis is submitted in partial fulfillment of the requirements for a Master of Biological
Science, Zoology
SCIE 5511 – 13 Research Dissertation
Faculty of Science
The University of Western Australia
(May 2017)
Word count: 8037
Formatted in accordance with the journal Australian Mammalogy
Georgia Ford
Supervised by
Roberta Bencini – School of Agriculture and Environment
Dr Michael Bamford – Bamford Consulting Ecologists

2
Faculty of Science Assignment Cover Sheet
UNIT CODE: SCIE5513
UNIT NAME: SCIENCE RESEARCH PROJECT PART 3
UNIT COORDINATOR/LECTURER: JAN HEMMI, LEIGH SIMMONS, AMANDA RIDLEY
DAY/TIME DUE: 29 MAY 2017 17:00
TITLE/TOPIC OF ASSIGNMENT: RESEARCH THESIS
WORD COUNT: 8037
OFFICE USE ONLY:
The Faculty of Science adheres to the University Policy on Academic Dishonesty which constitutes misconduct and is dealt with under the University's Statute 17 (http://calendar.publishing.uwa.edu.au/latest/partc/stat17). These guidelines make reference to the following: • Cheating in tests or examinations, e.g., copying from another student, or taking unauthorized materials into the test or examination room. • Plagiarism, i.e., presenting another's work as though it were one's own, for instance quoting or paraphrasing someone else's opinions,
arguments or research findings, whether published or unpublished (e.g., from a book or article, an internet site, or another student's assignment), without clear acknowledgement of the source. You may quote material from another source, but if you do so, the quotation must be word perfect and, in addition to citing the source reference in the usual manner, the beginning and end of the quotation must be clearly indicated by quotation marks. E.g. “quotation”
• Falsifying results of experiments or research studies. • Collusion, e.g., writing an assignment jointly and submitting it as the work of one individual. Although discussion and co-operation are
valuable in the pursuit of knowledge and understanding, any work submitted for assessment must be the individual's own work unless it is clearly designated a group project.
• Helping someone else to commit any dishonest act such as those listed above.
The consequences for misconduct can be severe, including exclusion from the university. All students are expected to make themselves aware of the definitions and policies relating to academic misconduct, (http://www.teachingandlearning.uwa.edu.au/staff/policies/conduct), and with any additional requirements or stipulations that may be provided by individual unit co-ordinators. Late Assignments There are penalties for late assignments. Refer to the unit outline for more information.
NO ASSIGNMENT WILL BE ACCEPTED UNLESS THE FOLLOWING DECLARATION IS SIGNED AND DATED
DECLARATION I/We certify that I have read the University guidelines on Academic Misconduct. I/We certify that the assignment submitted online is my own work and that all material drawn from other sources has been fully acknowledged. I/We certify that I am aware that the work submitted under this declaration is submitted to an online plagiarism detection service for analysis and that the work may be stored in a database either internal or external to the University. I/We have a photocopy or electronic copy of this assignment in my possession.
Sign: Georgia Ford Date: 29/5/2017 Sign: Date:
Submission date:
Name/s and Student Number/s Individual Group
1. Georgia Ford 21301895
4.
2.
5.
3.
6.
It will be assumed that all group members have equally participated in group assignments, unless other arrangements have been made to notify lecturer of participation levels.

3
Abstract
Obtaining measurements of abundance is a key component of wildlife conservation yet this
information is lacking for numerous species. Australian mammal populations, in particular,
are not well understood because they are generally rare or exhibit cryptic behaviour, making
them difficult to survey. There is consequently an increasingly urgent need for cost-efficient
and accurate monitoring for these species. Recently, camera traps have received considerable
attention as a survey tool with camera trapping research often focused on attempting to
estimate population density, which is critical for wildlife conservation. Capture-mark-
recapture methods, conventionally used to determine population size, typically require
individual identification. However, using camera traps to estimate the population size of
nondescript species would greatly increase their use. Few researchers have attempted to use
camera traps as surrogates for traditional fauna surveys. Therefore, the extent to which we can
rely on camera traps and on the resulting indices of abundance to monitor populations of
nondescript species is still largely unknown. The majority of small to medium-sized mammals
in Australia, such as the quenda (Isoodon obesulus fusciventer), do not have unique markings
yet camera traps are often used to provide population information for these species. The aim
of this study was to determine if camera trap hit rates of quenda could be calibrated with live
trapping population and density estimates obtained through spatially explicit capture-
recapture, to determine if camera traps can be used to estimate population size or density for
this species. Quenda were trapped at seven sites with differing densities using both live and
camera traps, and the relationship between the hit rates derived from camera trapping and
robust population and density estimates derived from live trapping were investigated for this
unrecognisable marsupial. Densities ranged from zero to 1.81 animals/ha, population
estimates ranged from zero to 71 and hit rates ranged from zero to 3842 hits/1000 days. The
relationship between population estimates and hit rates was significant with a Spearman rank
correlation coefficient R of 0.89. The relationship between density and hit rate was also
significant with an R of 0.77. The results indicate that camera trap surveys can provide valid
abundance or density measures that would be sufficient to monitor quenda populations and
that camera traps may be a viable alternative to live trapping for this species.
4
Contents Abstract ...................................................................................................................................... 3Introduction ................................................................................................................................ 6Materials and methods .............................................................................................................. 11Results ...................................................................................................................................... 18Discussion ................................................................................................................................ 23References ................................................................................................................................ 29

5
Acknowledgements
Firstly, I would like to gratefully acknowledge Main Roads WA for the financial support for
this project and I would also like to thank my supervisors, in particular Roberta Bencini, for
their support and for generously sharing their knowledge and expertise. Thank you to Mike
and also Mandy for providing the camera equipment.
Thank you to Dr Charles Krebs who provided valuable guidance and assistance, as did Alice
Kenney, who also let me use her camera trap program “Wild Photo Trap” to calculate the hit
rates.
I would also like to thank Dr Leonie Valentine and Rebecca Campbell, who generously
shared their study site and knowledge with me and taught me how to handle bandicoots.
Also, thank you to the staff at Whiteman Park, in particular Dr Chris Rafferty, for allowing
me to store the traps within the park and thank you to Daisy Pearse, for contacting us and
allowing the bandicoot populations to be measured at Fiona Stanley Hospital.
Finally, many thanks to my family, friends and volunteers who assisted me in the field, I hope
you enjoyed it.

6
Introduction
Knowledge and an understanding of animal populations and how they change are essential for
species conservation (Engeman 2005; Bengsen et al. 2011). Reliable and accurate information
regarding population size or abundance, density, distribution and stability, and the factors
influencing these, is critical for ecological research and conservation, and this is often
obtained through monitoring (Stanley and Royle 2005; Wiewel et al. 2007; Bengsen et al.
2011; Paull et al. 2011; Sollmann et al. 2012; Jareño et al. 2014; Taylor et al. 2014). Without
this information, the most effective conservation and recovery actions for a species cannot be
identified (Paull et al. 2011; Bain et al. 2014). Monitoring is of utmost importance, so it is
disturbing that 50.8% of Australian recovery plans lack any monitoring and evaluation
schemes (Ortega-Argueta et al. 2011). When monitoring does occur, there are often unclear
objectives, inadequate sampling or inappropriate time scales (Dajun et al. 2006). It is
unknown, therefore, whether targets have been met and if the management actions have been
appropriate for the species (Ortega-Argueta et al. 2011). Consequently, there is an
increasingly urgent need for effective and extensive monitoring, particularly for Australian
mammals (King et al. 2007; Paull et al. 2012; Swan et al. 2014; Woinarski et al. 2014; Diete
et al. 2015).
Ecological studies on animal populations require high quality data that can be collected
efficiently (Barros et al. 2015). The methods selected to survey populations must produce the
greatest detection success while minimising costs (Garden et al. 2007; Bain et al. 2014;
Jareño et al. 2014). This is often challenging, particularly for cryptic Australian mammals as
they are often secretive, occur at low densities and may occupy inaccessible habitat (Claridge
et al. 2004; Bain et al. 2014). A wide variety of direct and indirect techniques are available to
survey animal populations, with direct sampling often relying on the physical capture of
animals (De Bondi et al. 2010). This is usually achieved using pitfall, Elliott or wire cage
traps, depending on the target species (De Bondi et al. 2010). Direct sampling is ideal for
research into individual characteristics and is a common sampling method used in Australia
for small and medium sized mammals (Paull et al. 2012). Indirect methods present a practical
alternative to capture-mark-recapture and can sample fauna using tracks, scats, diggings or
hair. These methods are generally cheaper, faster, and easier to use but they can be subject to
bias and inaccuracy (Lyra-Jorge et al. 2008; Bain et al. 2014; Jareño et al. 2014).
The choice of survey method is, therefore, a critical component that influences the accuracy
of data collected and the subsequent interpretation of results (Garden et al. 2007; Lyra-Jorge

7
et al. 2008; De Bondi et al. 2010). Determining the most appropriate method depends on the
goals of the study, the target species, the survey sites and the budget and timeframe (Garden
et al. 2007; Lyra-Jorge et al. 2008; Manzo et al. 2012; Barros et al. 2015).
Capture-mark-recapture based on live trapping is the traditional method used to understand
population dynamics and can be used to accurately estimate density, population size, species
richness and composition, conservation status and responses to recovery actions (Mills et al.
2002; Lemckert et al. 2006; De Bondi et al. 2010; Jareño et al. 2014). This method has been
used extensively in recent years as detailed information can be obtained from individual
animals, such as age, sex, condition and reproductive status (Wiewel et al. 2007; De Bondi et
al. 2010; Jareño et al. 2014). The density estimates obtained via capture-mark-recapture are
considered to be the most robust and accurate for small mammal species (Wiewel et al. 2007;
De Bondi et al. 2010; Jareño et al. 2014), however, trap success depends on the species and
individuals, and their morphological, ecological and behavioural characteristics, as well as
weather conditions and trap mechanisms (Barros et al. 2015).
Live trapping, while effective, has drawbacks. Of particular concern are the welfare
implications for trapped animals. Some adult female marsupials, for example, tend to eject
pouch young when trapped, and may inadvertently crush them while in the trap (Paull et al.
2011). There is also a risk of accidental death from stress or predation, and trapped animals
can be exposed to adverse environmental conditions that they could otherwise avoid
(Lemckert et al. 2006; De Bondi et al. 2010; Paull et al. 2012). Trapping may also interfere
with their normal activities and behaviour, and restrains their movement in time and space
(Claridge et al. 2004; De Bondi et al. 2010). In addition, animals may learn to either avoid or
seek out traps, which may affect monitoring efficiency (King et al. 2007). Common non-
target species may also saturate traps, resulting in fewer captures of the target species (King et
al. 2007). Capture-mark-recapture provides little data for species that are difficult to trap and
rare, cryptic or elusive species so it is, therefore, impractical for such species (Stanley and
Royle 2005; De Bondi et al. 2010; Paull et al. 2012). It is also a time-consuming method as
researchers need to be in the field for long periods and it is labour intensive, often resulting in
poor return for effort (Mills et al. 2002; Claridge et al. 2004; De Bondi et al. 2010; Paull et al.
2012). Capture-mark-recapture is a difficult and expensive method to employ that can be
impractical over the large temporal and spatial scales usually required to make informed
management decisions (Villette et al. 2016). Finally, the assumptions of capture-mark-
recapture can be restrictive and, if they are violated, the population estimates produced may

8
be of questionable quality (Engeman 2005; Krebs 2014). It is for these reasons that indirect
sampling methods are becoming more common for surveying wildlife species.
Camera traps have rapidly become essential tools for wildlife research and monitoring in
Australia and overseas (Manzo et al. 2012; Meek and Pittet 2012; Güthlin et al. 2014; Taylor
et al. 2014; Diete et al. 2015; Meek et al. 2015a, 2015b). They are a promising indirect
sampling method and are preferred over hair tubes, for example, as hair tubes are often
grossly inefficient at detecting target mammals, they are prone to error and the high costs
associated with genetic analysis often preclude their use (Catling et al. 1997; Lobert et al.
2001; Mills et al. 2002; Garden et al. 2007; Claridge et al. 2010a, 2015). Camera traps are
remotely deployed fixed cameras that are triggered to capture images or video of passing
animals at a given location and time, without the need for humans to be present (Rowcliffe et
al. 2008; De Bondi et al. 2010; McCallum 2013; Meek et al. 2015a, 2015b). They may be
passive infrared or time-lapse cameras and they allow the capture and storage of thousands of
images over long periods (Smith and Coulson 2012; McCallum 2013; Meek et al. 2015a).
They have traditionally been used to confirm the presence or absence of species; however,
they are now often used to investigate population dynamics, habitat use and behaviour, to
survey wildlife distributions, and are even used to produce population or density estimates
(Rowcliffe et al. 2008; Manzo et al. 2012; Burton et al. 2015; Diete et al. 2015; Meek et al.
2015a, 2015b). Most camera trap research overseas has concentrated on large and medium
sized mammals such as big cats. However, in Australia, small mammals have largely been the
focus of camera trap research (De Bondi et al. 2010; Meek and Vernes 2016).
Camera traps are less time consuming and laborious than most direct methods and are more
practical and cost effective (Wiewel et al. 2007; Rowcliffe et al. 2008; De Bondi et al. 2010;
Smith and Coulson 2012; McCallum 2013; Dundas et al. 2014; Taylor et al. 2014; Welbourne
et al. 2015; Meek and Vernes 2016; Villette et al. 2016). They operate in most habitats and
are able to withstand extreme weather conditions (Vine et al. 2009; De Bondi et al. 2010;
Manzo et al. 2012; Paull et al. 2012; McCallum 2013; Villette et al. 2017). These versatile
tools can be left in the field for relatively long periods without checking and have greater
detection efficiency relative to other methods. Therefore, they are particularly useful for
cryptic or rare species and habitat specialists (Cutler and Swann 1999; Rowcliffe et al. 2008;
Borchard and Wright 2010; Claridge et al. 2010a; Paull et al. 2012; Smith and Coulson 2012;
McCallum 2013; Dundas et al. 2014; Taylor et al. 2014). Cameras can be deployed over
greater spatial and temporal scales and are able to record multiple species, resulting in large

9
data sets (De Bondi et al. 2010; Foster and Harmsen 2012; Paull et al. 2012; McCallum
2013). The major advantage of camera traps is that they remove the need to handle animals,
providing ethical benefits as there is no direct contact between humans and animals (Claridge
et al. 2004; Wiewel et al. 2007; Rowcliffe et al. 2008; Claridge et al. 2010a; Paull et al. 2012;
McCallum 2013; Dundas et al. 2014; Meek and Vernes 2016).
Abundance or density estimates for mammalian species can be achieved using camera traps
(Bengsen et al. 2011; Güthlin et al. 2014) but traditionally these methods require individual
identification, which is often accomplished using unique coat patterns or other natural
markings or features (Bengsen et al. 2011; Dundas et al. 2014; Güthlin et al. 2014;
Weerakoon et al. 2014; Diete et al. 2015; Villette et al. 2016). Population estimates for
individually recognisable species are achieved using capture-mark-recapture techniques in the
same way as traditional capture-mark-recapture approaches, as they are based on the re-
capture of individuals by cameras (Rowcliffe et al. 2008; Manzo et al. 2012; McCallum 2013;
Sollmann et al. 2013; Güthlin et al. 2014; Weerakoon et al. 2014; Diete et al. 2015; Villette et
al. 2016). This method is problematic for species that have a uniform morphology and lack
unique markings because individuals are indistinguishable in photographs (Weerakoon et al.
2014; Meek et al. 2015a; Villette et al. 2016). This is typical of the majority of species,
including most Australian mammals, making these capture-mark-recapture methods limited in
their use (Carbone et al. 2001; Rowcliffe et al. 2008; Burton et al. 2015; Diete et al. 2015;
Villette et al. 2016). Consequently, there is great interest in alternative methods for
nondescript species, as techniques that could estimate abundance using photographic rates of
these species would significantly increase the value of camera traps (Carbone et al. 2001;
Rowcliffe et al. 2008; Burton et al. 2015). One such method is the use of photographic hit
rates to calculate indices of abundance for species with uniform morphology (Rowcliffe et al.
2008; Rovero and Marshall 2009; Bengsen et al. 2011; Foster and Harmsen 2012; Manzo et
al. 2012; Güthlin et al. 2014; Weerakoon et al. 2014; Villette et al. 2016). In theory, the
number of images taken per unit time contains information about a species population size
(Rowcliffe et al. 2008, 2014). If the population increases or decreases the index should reflect
that and where a species is in greater abundance, its photographic hit rate should be higher
(Engeman 2005; Rovero and Marshall 2009; Rowcliffe et al. 2014). An index is expected to
vary directly with population size and is proportional to and reflects abundance, but is not an
estimate of the actual population size (Engeman 2005; Stanley and Royle 2005; O’Connell et
al. 2011). Though controversial, indices of abundance are used as surrogate measures of

10
population size as they allow rapid assessments of abundance where other methods are not
feasible, and they can be used to make relative comparisons between populations (McKelvey
and Pearson 2001; Engeman 2005; Kelly and Holub 2008; Rovero and Marshall 2009;
Sollmann et al. 2013; Weerakoon et al. 2014). Consequently, they have become integral to
resource-constrained wildlife managers. They have become so prominent that computer
programs that exist purely to calculate hit rates have also been developed, such as Wild Photo
Trap created by Kenney. For nondescript animals, calibrating the relationship between hit rate
and density is critical if photographic hit rates are to be used as an index of abundance,
however, this rarely occurs (Kelly 2008; Rovero and Marshall 2009; Foster and Harmsen
2012; Sollmann et al. 2013; Villette et al. 2016).
A group of Australian marsupials that would greatly benefit from monitoring via the use of
camera traps are the bandicoots (Marsupialia: Peramelidae) because they have experienced
substantial declines in abundance and distribution with the extinction of two species, the pig-
footed bandicoot (Chaeropus ecaudatus) and desert bandicoot (Perameles eremiana). An
additional eight species are listed as vulnerable or endangered under the Environment
Protection and Biodiversity Conservation Act 1999 (Claridge and Barry 2000; Bilney et al.
2010; Diete et al. 2015; Valentine et al. 2017). Their conservation is hampered by lack of data
and this can be partly attributed to the difficulty in surveying these species. Therefore, camera
traps could potentially represent an ideal alternative to traditional survey methods for
monitoring bandicoots (Claridge and Barry 2000; Mills et al. 2002; Paull et al. 2012).
Effective and cost-efficient survey techniques have yet to be developed and refined for the
majority of wildlife populations, and there has been comparatively little research into the
effectiveness of camera traps for measuring Australian mammal populations (De Bondi et al.
2010; Welbourne et al. 2015). Therefore, it is unknown the extent to which we can rely on
photo-indices to monitor our native species (O’Connell et al. 2011; Weerakoon et al. 2014).
Comparing the efficacy and accuracy of camera trapping relative to live trapping would
determine the suitability of this method for unrecognisable mammal populations, which are
under-represented in camera trap research (Rowcliffe et al. 2008; Meek et al. 2015a).
I sought, for the first time, to investigate the relationship between indices of abundance
derived from camera traps and robust population and density estimates derived from live traps
for the quenda (Isoodon obesulus fusciventer), a nondescript marsupial. The objective of this
study was to determine if camera trap hit rates of quenda could be calibrated with live

11
trapping population and density estimates obtained through spatially explicit capture-
recapture, such that camera traps can be used to estimate population size and density for this
species. It was expected that the hit rates and live trapping population and density estimates
would be strongly correlated for the quenda. The findings of this study will help inform future
researchers in their choice of sampling methods for the quenda, as it will determine if camera
traps can be used as substitutes for traditional fauna surveys for this nondescript species.
Materials and methods
To test this hypothesis, capture-mark-recapture methods using conventional trapping were
compared with camera trapping methods developed by Alice Kenney at the University of
Canberra’s Institute of Applied ecology (pers. comm) at seven sites with different quenda
densities.
Study species
The southern brown bandicoot or quenda is a medium-sized omnivorous marsupial, ranging
in size from 400 to 2000g (Braithwaite 1995; Valentine et al. 2013). Quenda occur across
south-west Western Australia, preferring scrubby dense vegetation around swamps and
watercourses or open jarrah forest (Braithwaite 1995; Cooper 1998; Valentine et al. 2013;
Chambers and Bencini 2015). Quenda are ecosystem engineers, as they are capable of turning
over approximately 4 tonnes of soil per individual per year (Valentine et al. 2013). They are
nocturnal, solitary and territorial animals with home range estimates varying from 0.5 to 7ha
(Lobert 1990; Braithwaite 1995). Males generally have larger home ranges than females,
~2.3ha and ~1.8ha respectively, and they may overlap in areas of high density (Broughton and
Dickman 1991; Braithwaite 1995; Valentine et al. 2013). Densities range from 1 to 5 per ha
(Lobert and Lee 1990). Unlike the endangered eastern subspecies (I. obesulus obesulus), the
quenda is persisting in bush fragments and reserves in the peri-urban fringe surrounding Perth
(Valentine et al. 2013; Howard et al. 2014). However, they are classified as Priority 4 under
the Western Australian Wildlife Conservation Act 1950. Quenda were once common across
the south-west but they are now absent from many areas or are persisting in low numbers, due
to a combination of fragmentation, loss of habitat, and predation by the introduced red fox
(Vulpes vulpes) and feral cat (Felis catus) (Braithwaite 1995; Driessen and Rose 2015;
Valentine et al. 2017). The quenda is ideal for this study as they do not typically have
distinguishing markings (e.g. stripes or spots) that would allow for individual identification,
and there are no similar species that they could be mistaken for in photographs. They have a
12
short conical muzzle, small rounded ears and they have coarse grey/brown fur above and
white below with a short, lightly furred tail that may by shortened or lost completely due to
fighting (Braithwaite 1995; Driessen and Rose 2015).
Study sites
Live and camera trapping were conducted in the Perth region of south-west Western Australia
from May 2016 to March 2017. Quenda populations were surveyed with both camera traps
and conventional cage traps at seven sites across Perth: Whiteman Park, Blue Poles Road,
Maralla Road Nature Reserve, Aileen Plant Park, Moitch Park, Craigie Bushland and
Thomsons Lake Nature Reserve (Figure 1). This region experiences a Mediterranean type
climate with hot, dry summers and mild, wet winters with an average annual rainfall of
868mm (Bureau of Meteorology, station #009034). Multiple sites were chosen to maximise
the range of quenda densities.

13
Figure 1. Map of the seven study sites across Perth, Western Australia: Craigie Bushland, Maralla Road Nature Reserve, Whiteman Park, Blue Poles Road, Aileen Plant Park, Moitch Park and Thomsons Lake Nature Reserve. The site names are located adjacent to the marker.
Whiteman Park is located ~19km northeast of Perth (31°49´34.32"S; 115°55´14.88"E) and is
a ~4000ha park managed by the Department of Planning. The study was conducted along a
4km stretch on the western edge of the park (~14ha) where the dominant vegetation is a mix
of Corymbia calophylla, Eucalyptus marginata and Melaleuca damplands. Introduced
predators are controlled at these sites via 1080 bait and shooting (C. Rafferty, pers. comm).
Blue Poles Road (~4ha) is located within Whiteman Park, approximately 1.4km east of the
Whiteman Park site (31°49´30.72"S; 115°56´0.96"E). These sites were considered different

14
sites because they were too far apart for quenda to be moving between them. They share the
same dominant vegetation and predator control measures.
Maralla Road Nature Reserve is located ~35km northeast of Perth (31°44´38.04"S
115°58´51.6"E) and is ~145ha. This site is dominated by Banksia spp. woodland including B.
attenuata and B. menziesii, over sparse shrubland including Calytrix fraseri, Verticordia
nitens and Hibbertia hypericoides. Open paddock with remnant Banksia species is also
present and introduced predators are not controlled (B. Inglis, pers. comm).
Craigie Bushland is located ~21km north of Perth (31°47´39.48"S; 115°46´46.56"E) and is
~41ha. The open woodland vegetation consists of a mosaic of E. gomphocephala, C.
calophylla, E. marginata with B. attenuata and Allocasuarina fraseriana. In 2013, quenda
were translocated from Ellenbrook and Twin Swamps Nature Reserves into Craigie Bushland
to protect the Western Swamp Tortoise (Pseudemydura umbrina) (Valentine et al. 2016). At
this site, quenda are protected from introduced predators by a predator-proof fence.
Aileen Plant Park is located within the Fiona Stanley Hospital grounds, approximately 18km
south of Perth. Aileen Plant Park (32°4´5.16"S; 115°50´54.96"E) is ~1ha and the vegetation is
a mixture of E. marginata and Banksia spp. It is remnant bushland and predators are not
controlled.
Moitch Park (32°4´19.92"S; 115°50´47.04"E) is ~2.5ha and is dominated by Banksia spp.
woodland. It is located ~440m from Aileen Plant Park, also within the grounds of Fiona
Stanley Hospital. Quenda could easily cover this distance, however, these sites are separated
by the hospital’s infrastructure (internal roads and buildings) so movement between these
locations is unlikely, especially within the short timeframe of the survey. Moitch Park is also
a remnant bushland site in which predators are not controlled.
Thomsons Lake Nature Reserve is located ~28km south of Perth (32°9´2.4"S; 115°49´42.3"E)
and is ~538ha. The vegetation around the lake is dominated by rushes and sedges including
Typha spp., Bauma spp., Viminaria juncea and Acacia saligna shrubs. This gives way to a
belt of trees including Eucalyptus spp. and Melaleuca spp., and the shrub Jacksonia
furcellata. This is then replaced by open woodland dominated by Eucalyptus spp. and
Banksia spp. Fauna within the reserve is protected from introduced predators by a predator-

15
proof fence and regular baiting with 1080 (CALM 2005).
Camera trapping
There was one camera trapping session for each site allocated randomly to either before or
after the live trapping session. Twenty motion-activated camera traps divided among the
following models were used in this study: Reconyx HC550 (n=11) and HC600 (n=9)
HyperFire (ReconyxTM, Reconyx Inc., Wisconsin USA) as these models are designed for
small mammals (Meek and Pittet 2012). Each camera was equipped with an 8GB memory
card and set to high sensitivity. The cameras were set to take three photographs over a 3
second period each time the motion sensor was triggered, with no delay between trigger
events, 24 hours a day as recommended by Meek et al. (2012). These models use LED white
flash or infrared illumination. Camera traps were left in the field for ten days, because studies
targeting small mammals generally employ longer sampling periods than those used for live
trapping (De Bondi et al. 2010; Meek et al. 2012). Each camera was attached to a steel pole
and positioned ~1.3m above a scent lure which was a PVC pipe (200 x 40mm) filled with
universal bait (a mixture of rolled oats, sardines and peanut butter) wired to the base of the
steel pole. Small 2 mm holes drilled into the pipe prevented animals from consuming the bait
while attracting them with the strong scent of the peanut butter and sardines. The bait was not
refreshed while cameras were deployed. The cameras were positioned so that the sensor and
camera lens were facing the ground as in Smith and Coulson (2012) as this orientation results
in greater detection of bandicoots and potoroos, increases the ease of species identification
and also reduces the amount of vegetation that needs to be cleared (Smith and Coulson 2012;
Diete et al. 2015). In most cases, the cameras were placed in naturally clear areas; however, if
understorey and/or ground-layer vegetation was present beneath a camera, it was removed to
reduce false triggers.
Footage from all of the cameras operating during each session at each site was pooled
together for the analyses. Data from the camera traps were managed and analysed using Wild
Photo Trap 2.0 (A. Kenney, pers. comm). This program requires each animal (or lack thereof)
in every image to be classified and a hit window, which is the length of time used to group
consecutive photographs together as single detections or hits (Villette et al. 2016), must be
selected. Hit rates were calculated as the number of hits per 1000 camera days, both for the
full length of camera deployment (ten days) and also for the first four days, in line with the
live trapping time frame, using a hit window of five minutes. Hit windows have ranged from
two minutes to one hour in studies of Australian mammal species and five minutes has been
16
shown suitable for species such as the northern hopping-mouse (Notomys aquilo) (Diete et al.
2015).
Live trapping
Live trapping was conducted at all sites, either before or after camera trapping, to ensure that
the activities associated with live trapping did not impact the effectiveness of the camera traps
and vice-versa (Swan et al. 2014). Live trapping was conducted over four consecutive nights
as recommended by the Department of Parks and Wildlife (SOP #9.2,
https://www.dpaw.wa.gov.au/images/documents/plants-animals/monitoring/sop/sop09.2
_cagetraps_v1.1.pdf). Medium sized wire cage traps were used (220 x 220 x 450mm,
Sheffield Wire Works, Welshpool, Western Australia) and were baited with universal bait.
Each trap was placed under vegetation and covered with a hessian bag to protect the animals
from the elements. The traps were checked and cleared each morning at first light, before
being reset. In hot weather, traps were checked both in the morning and afternoon. Trapped
quenda were transferred to a dark cloth handling bag where they were implanted with a
passive integrated transponder or PIT tag (Trovan ID100 (1.4), Trovan, Ltd., North
Humberside, UK) between the shoulder blades. Standard measurements of pes length, head
length, reproductive status and body weight were also recorded. Quenda were released at the
point of capture and captured animals other than quenda were released immediately. All
aspects of this study were approved by The University of Western Australia’s Animal Ethics
Committee (approval number RA/3/100/121) and were consistent with the guidelines in the
‘Australian code of practice for the care and use of animals for scientific purposes’ (NHMRC
2013).
Quenda population and density estimates were calculated from live trapping data using
Efford’s maximum-likelihood spatially explicit capture-recapture model in the program
DENSITY 5.0 (Efford 2012). The default parameters for DENSITY 5.0 were used for all
estimates and the buffer width was set to 100m.
Layout
All sites had a camera trap within 20m of a cage trap location in order to sample the same
individuals. Both camera and live traps were placed randomly with respect to quenda
distribution. Whiteman Park had 16 camera traps and 32 cage traps deployed along a 2.89km
transect. The spacing between camera traps varied between 80m and 740m (average 261m).
Two cage traps were deployed at each camera trap location, resulting in 160 camera nights
and 128 trap nights. Blue Poles Road had five camera traps spaced 200m apart along an 800m

17
transect and two cage traps were deployed at each camera trap location, resulting in 50
camera nights and 40 trap nights, respectively.
Maralla Road Nature Reserve had eight camera traps that were positioned in pairs. Each pair
was ~200m apart from the next pair and ~100m apart from each other. Three cage traps were
placed within 20m of each camera trap location, resulting in a total of 96 trap nights and 80
camera nights.
Aileen Plant Park had 26 cage traps placed on seven parallel transects, with four traps on six
transects and two on one transect, resulting in 104 trap nights. Traps were spaced ~15m apart
along each transect and transects were 15m apart. Thirteen camera traps were randomly
placed at a cage trap location, however, two malfunctioned, resulting in 110 camera nights.
Moitch Park had five camera traps positioned along three transects of ~100m, resulting in 150
camera nights. Camera traps were spaced 20m apart along each transect and transects were
30m apart. At each camera trap location, two cage traps were deployed, resulting in 144 trap
nights.
At Craigie Bushland, 30 cage traps were deployed between 10 and 20m from vehicle tracks
for ease of access. The traps were set to circumnavigate the fenced area and were along
internal pathways. Cage traps were between 40m to 170m apart (average 100m) and 15
camera traps were placed on every second cage trap location. This resulted in 120 trap nights
and 150 camera nights.
Thomsons Lake Nature Reserve had 15 camera traps placed around the lake such that they
were accessible from vehicle tracks, resulting in 150 camera nights. The cameras were spaced
between 70 and 750m apart (average 420m) around the lake and two traps were deployed at
each camera trap location, resulting in 120 trap nights.
Statistical analyses
All analyses were conducted at the site level, so the data were pooled for traps and cameras at
each site. As stated above, population and density estimates were calculated for each site
using DENSITY 5.0 (Efford 2012) and hit rates (the number of hits per 1000 camera days for
each species) were calculated using Wild Photo Trap 2.0 (A. Kenney, pers. comm). Spearman
rank correlations were used to determine if live trapping population and density estimates
could be predicted by hit rates for the quenda. Hit rates were correlated against the density
estimates and also population estimates to test for a relationship and alpha of 0.05 was used
for significance.
18
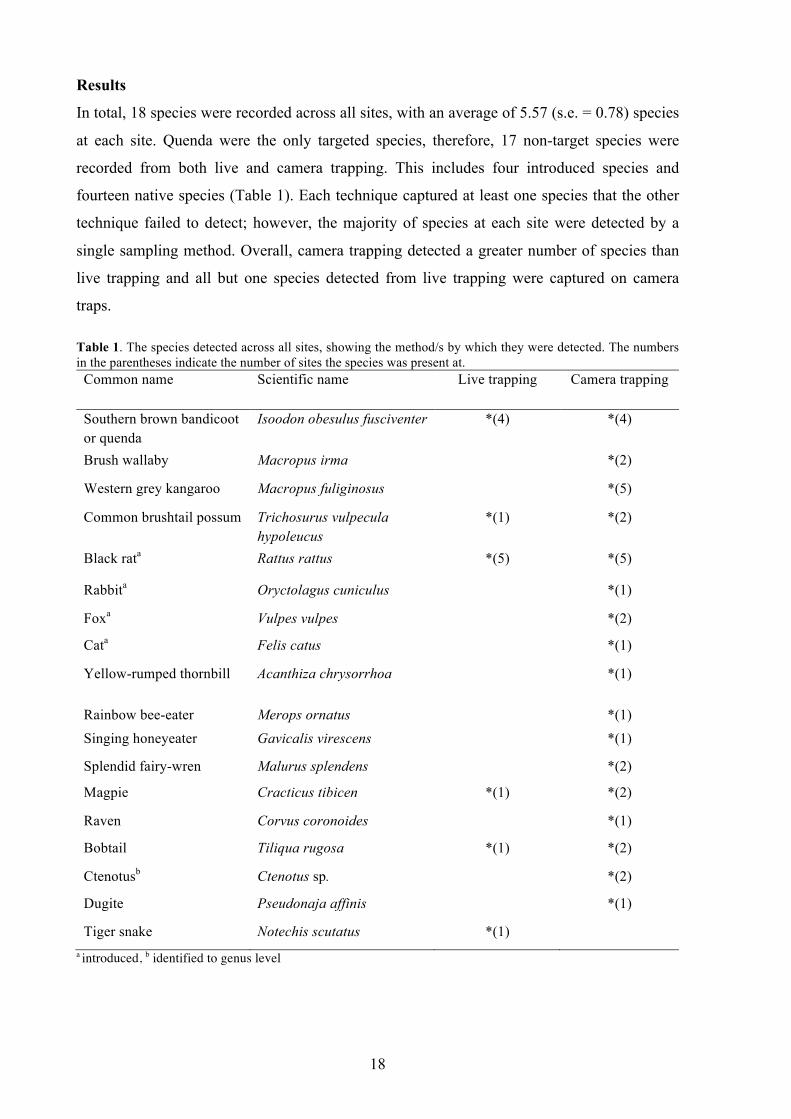
Results
In total, 18 species were recorded across all sites, with an average of 5.57 (s.e. = 0.78) species
at each site. Quenda were the only targeted species, therefore, 17 non-target species were
recorded from both live and camera trapping. This includes four introduced species and
fourteen native species (Table 1). Each technique captured at least one species that the other
technique failed to detect; however, the majority of species at each site were detected by a
single sampling method. Overall, camera trapping detected a greater number of species than
live trapping and all but one species detected from live trapping were captured on camera
traps.
Table 1. The species detected across all sites, showing the method/s by which they were detected. The numbers in the parentheses indicate the number of sites the species was present at.
Common name Scientific name Live trapping
Camera trapping
Southern brown bandicoot or quenda
Isoodon obesulus fusciventer *(4) *(4)
Brush wallaby Macropus irma *(2)
Western grey kangaroo Macropus fuliginosus *(5)
Common brushtail possum Trichosurus vulpecula hypoleucus
*(1) *(2)
Black rata Rattus rattus *(5) *(5)
Rabbita Oryctolagus cuniculus *(1)
Foxa Vulpes vulpes *(2)
Cata Felis catus *(1)
Yellow-rumped thornbill Acanthiza chrysorrhoa *(1)
Rainbow bee-eater Merops ornatus *(1)
Singing honeyeater Gavicalis virescens *(1)
Splendid fairy-wren Malurus splendens *(2)
Magpie Cracticus tibicen *(1) *(2)
Raven Corvus coronoides *(1)
Bobtail Tiliqua rugosa *(1) *(2)
Ctenotusb Ctenotus sp. *(2)
Dugite Pseudonaja affinis *(1)
Tiger snake Notechis scutatus *(1) a introduced, b identified to genus level

19
Quenda
Quenda were captured at four of the seven sites and both live and camera trapping detected
quenda when they were present at a site. The total number of quenda trapped across all sites
was 89 (50 males, 38 females and one unknown because it escaped before being sexed) and
the number of quenda caught varied among sites from zero to 56 (average 12.7 quenda per
site, s.e. = 7.96, Table 2). Males were generally heavier and larger with a mean body mass of
1195g ± 32.0 (SE) (Table 3) and most individuals were in visibly good condition. Density
estimates ranged from zero to 1.81 animals/ha and population estimates ranged from zero to
71 (Table 2). Over the full deployment, the camera traps recorded a maximum of 514 quenda
hits at a single site, with a minimum of zero (Tables 2 and 4) and the hit rates varied from
zero to 3842.11 hits/1000 days (Tables 2 and 4). When using the data from the first four days
of camera deployment, a maximum of 343 quenda hits occurred at a single site, with a
minimum of zero and the hit rates varied from zero to 6125 hits/1000 days (Table 2). Quenda
were always alone when captured by the camera traps and they were active between the hours
of 1700 and 0800, with the majority of captures occurring between the hours of 2100 and
0500.
Table 2. Number of quenda (Isoodon obesulus fusciventer) trapped, estimated population size, estimated density (indivisuals/ha), number of camera hits and the hit rates (hits/1000 days) for each site and the site size (ha).
Table 3. Mean body weight, head length and pes length for the male and female quenda (Isoodon obesulus fusciventer) caught across all seven sites (±SE).
Site size (ha)
Number of live trapped
quenda
Estimated population
size
Estimated density
Number of camera hits
Hit rates (10 days)
Hit rates (4 days)
Whiteman Park 14 0 0 0 0 0.00 0.00 Blue Poles Road 4 0 0 0 0 0.00 0.00 Maralla Rd 145 0 0 0 0 0.00 0.00 Moitch Park 2.5 3 4.0 0.41 38 236.02 347.22 Aileen Plant Park 1 5 5.0 1.35 85 772.73 1340.91 Thomsons Lake 538 25 60.0 1.81 24 195.12 220.34 Craigie Bushland 41 56 71.0 1.53 514 3842.11 6125.00 Average (SE) 106.5
(74.5) 12.71 (7.96)
20 (11.83)
0.73 (0.30)
94.43 (70.88)
720.85 (530.39)
1147.64 (848.85)
Males Females
Weight (g) 1195±32.0 906±22.0
Head length (mm) 88.7±0.82 82.9±1.06
Pes length (mm) 63.0±0.52 57.7±0.50

20
Statistical analyses
Quenda were the only target species, so they were the only species included in the statistical
analyses. Eight mystery hits where animals could not be classified to species were excluded
from the analyses, as were ‘useless’ images that lacked any animals. The camera trap hit rates
and live trapping population and density estimates were positively associated. The
relationship between the population estimates and hit rates was significant (R(5) = 0.89,
0.025>P>0.01) and is shown in Figure 2. The relationship between quenda density and hit
rates was also significant but less so than population estimates (R(5) = 0.77, 0.05>P>0.025)
and is shown in Figure 3. The correlations were identical for hit rates calculated from both
four and ten days.
Live trapping
A total of 752 trap nights across all sites produced 162 captures of six species, resulting in a
success rate of 21.5%. Trap effort varied from 40 trap nights to 144 trap nights with a mean
effort of 107.4 (s.e. = 12.7) trap nights. Overall, five native and one introduced species were
captured (Table 1) and the most commonly detected species was the quenda followed by
black rats (Rattus rattus). Live trapping detected between one and four species at each site
with an average of 1.86 (s.e. = 0.51). This method was the only sampling method that
detected the tiger snake (Notechis scutatus) (Table 1).
Figure 2. Population estimates obtained from live trapping versus camera trap hit rates calculated from ten days (R=0.89) for seven quenda (Isoodon obesulus fusciventer) populations in Perth, Western Australia. Site names are adjacent to the marker. TL denotes Thomsons Lake Nature Reserve, CB denotes Craigie Bushland, AP denotes Aileen Plant Park, and MP denotes Moitch Park. Error bars are ±1 S.E. for population estimates.

21
Camera trapping Total camera trapping effort was 850 camera nights and mean effort for a single camera
trapping session was 121.4 (s.e. = 16.1) but ranged from 50 to 160 camera nights. The camera
traps recorded a total of 1973 hits across all sites sampled, with Craigie Bushland having the
greatest number of hits (557) and Maralla Road Nature Reserve having the fewest number of
hits (13, Table 4). Of the 1973 hits, eight (0.40%) captured animals that due to poor
photographic quality were unable to be identified and 907 (46.0%) were triggered by
vegetation, light or shadows. A total of 1058 (53.6%) hits contained animals that could be
identified to species, including four introduced and thirteen native species (Table 1 and 4).
Therefore, the cameras detected 16 non-target species with the most commonly detected
species being the quenda, followed by black rats and the western grey kangaroo (Macropus
fuliginosus). Camera trapping detected between two and eight species at each site (mean =
5.0, s.e. = 0.87) and was the only method that detected twelve of the eighteen species (Table
1). At the site level, camera trapping detected a greater number of species than live trapping,
for the majority of sites. Animals recorded on camera traps were typically alone; however, in
some cases, kangaroos were in groups of up to three individuals.
Figure 3. Density estimates obtained from live trapping versus camera trap hit rates calculated from ten days (R=0.77) for seven quenda (Isoodon obesulus fusciventer) populations in Perth, Western Australia. Site names are adjacent to the marker. TL denotes Thomsons Lake Nature Reserve, CB denotes Craigie Bushland, AP denotes Aileen Plant Park, and MP denotes Moitch Park. Error bars are ±1 S.E. for density estimates.

22
Table 4. Number of camera nights, species recorded, number of hits in parentheses and the hit rate calculated from ten days (number of hits/1000 days) for each species at each site. Site Number of
camera nights Fauna species recorded Hit rate
Whiteman Park 160 Black rat a (32) 246.27 Western grey kangaroo (25) 186.57 Bobtail (5) 37.31 Western brush wallaby (4) 29.85 Fox a (3) 22.39 Magpie (3) 22.39 Yellow-rumped thornbill (2) 14.92 Cat a (1) 7.46
Thomsons Lake Nature Reserve
150 Western grey kangaroo (62) 504.07 Quenda (24) 195.12 Rabbit a (12) 97.56 Splendid fairy-wren (3) 24.39 Black rat a (2) 16.26 Common brushtail possum (1) 8.13 Raven (1) 8.13
Moitch Park 150 Quenda (38) 236.02 Ctenotus sp. b (9) 55.90 Black rat a (3) 18.63 Singing honeyeater (2) 12.42 Rainbow bee-eater (2) 12.42 Dugite (1) 6.21
Craigie Bushland 150 Quenda (514) 3842.11 Black rat a (32) 240.60 Bobtail (4) 30.08 Common brushtail possum (3) 22.56 Ctenotus sp.b (3) 22.56 Western grey kangaroo (1) 7.52
Maralla Road Nature Reserve
80 Kangaroo (8) 109.59 Splendid fairy-wren (4) 54.79 Fox a (1) 13.70
Blue Poles Road 50 Western grey kangaroo (11) 175.00 Magpie (2) 50.00 Western brush wallaby (1) 25.00
Aileen Plant Park 110 Black rat a (154) 1400.00 Quenda (85) 772.73
a introduced, b identified to genus level
23
Discussion
This study is the first to attempt to use camera traps to estimate the density and population
size of quenda or any bandicoot or peramelid and the results have demonstrated that it may be
possible to use camera traps alone to survey this individually unrecognisable species. Strong
correlations between hit rates and live trapping population and density estimates obtained
through live trapping were expected, and the results support this hypothesis. The results
suggest that hit rates may not only be used to estimate the abundance of quenda, but also the
density of quenda populations. The calibration and comparison of these standard operating
procedures ensures that the results are realistic and practical. The ability to use cameras traps
to measure aspects of quenda populations offers a rapid and more practical sampling method
for resource-constrained researchers, wildlife managers or even community groups with little
training.
The results suggest that population size and density can be calibrated to camera trap hit rates,
but the significance of these relationships may be influenced by the decision to include the
three sites where quenda were absent. Therefore, these relationships could be stronger,
particularly the relationship between hit rate and density. Unfortunately quenda were present
at only four of the seven study sites and it would have been preferable to have a greater
number of sites with quenda, as this would ensure a more robust calibration of methods.
While a range of densities was required, three sites without quenda was unexpected. They
were supposedly present at Whiteman Park, Blue Poles Road and Maralla Road Nature
Reserve, but they were not captured either by live trapping or camera trapping at any of these
sites. It is possible that the combination of open habitat and the presence of introduced
predators (foxes and feral cats) has resulted in local extinctions of the species at these sites
(Claridge et al. 2010b; Smith and Coulson 2012) or they occur at such low densities that they
were not captured by either method. Also, sampling effort was not equal among sites as three
sites had fewer cameras, and this may have influenced the hit rates and subsequent statistical
analyses. If sampling effort had been equal among the sites, there is a possibility that the
correlation would have been stronger because, with increased sampling effort, it is possible
that additional quenda would have been detected, resulting in a greater hit rate and thus a
stronger correlation. Additionally, as Thomsons Lake Nature Reserve had a greater number of
quenda than Moitch Park and Aileen Plant Park, there should have been a greater number of
hits and therefore, a higher hit rate at this site. The lower hit rate can possibly be explained by

24
the heavy rain and storms during the Thomsons Lake camera deployment, which would have
influenced the behaviour of the quenda as their activity is suppressed during heavy or
continuous rain (Read 1988). If their activity was suppressed, then they would not have been
foraging and would not have come into contact with the camera traps as often, therefore,
resulting in a lower hit rate and a weaker correlation. Unfortunately, the storms could not be
avoided, as due to time constraints, the camera traps could not be deployed at any other time.
The camera traps themselves are unlikely to be the reason why the hit rates were lower at
Thomsons Lake Nature Reserve, as both models were able to detect quenda and were still
functioning by the end of the camera trapping session.
Camera trapping is considered underutilised for several taxa, including individually
unrecognisable mammals, despite its rapid adoption into wildlife research (Cutler and Swan
1999; De Bondi et al. 2010). Camera traps are able to provide non-invasive rapid and efficient
surveys, as I have shown in this study and as also shown in Claridge et al. (2010a) and Bain et
al. (2014). They are also cheaper and less labour intensive, however, no attempt was made to
calculate the cost-effectiveness of camera traps relative to live traps in this study, because
costs are typically project specific and depend on study requirements and context (Paull et al.
2012; Swan et al. 2014; Welbourne et al. 2015). Previous studies (e.g. Garden et al. 2007; De
Bondi et al. 2010; Welbourne et al. 2015; Villette et al. 2017) have shown that camera traps
are cheaper and less time consuming to deploy.
Relative abundance indices produced from camera traps, such as hit rates, have been criticised
because they are rarely calibrated to independent estimates of abundance or density (Kelly
and Holub 2008; Rovero and Marshall 2009; O’Connell et al. 2011; Weerakoon et al. 2014;
Hofmeester et al. 2016). It is intuitive that hit rates obtained from camera traps are related to
abundance, as encounters between animals and cameras are expected to increase with
increasing density or population size (Rovero and Marshall 2009; Watkins et al. 2010;
Hofmeester et al. 2016). Using non-calibrated abundance indices, particularly for threatened
species, bears a strong risk of making incorrect decisions and inferences about a population
(Sollman et al. 2013). Therefore, calibrating the relationship between hit rates and density or
abundance, as done here, allows informed decisions regarding a population to be made. For
example, abundance or density can firstly be estimated and then population trends can be
monitored using this information. Many management and research problems are well served
by abundance indices and the use of camera trapping hit rates as an index of abundance is

25
promising for the rapid assessment of rare or elusive species, or in areas where other methods
are unfeasible (Rovero and Marshall 2009). It is important to note that camera traps cannot
replace studies that require data that can only be obtained from handling animals, such as
reproductive status, body weight or tissue samples for genetic analysis. However, the
calibration between hit rates and abundance in this study indicates that camera traps could be
used to make informed management decisions for this species. This is especially true if
additional sites can be included in future surveys to strengthen the relationship between live
trapping and camera captures. Initially, I attempted to fit a regression line to the data but it
was not significant unless it was forced through the origin, in line with the assumption that if
bandicoots were present they would be photographed. I resorted to using the Spearman rank
correlation because of the limited number of sites and the uncertainty about this assumption.
If additional sites can be added to this study, I may be able to use a regression, that would
produce a predictive equation that would allow population estimates or densities to be
calculated from camera trap hit rates. Additionally, an important assumption regarding indices
of abundance obtained from camera traps, and one assumed here, is that of equal detectability
of a species across sites. It is reasonable to assume this for comparisons of the same species
across different sites as they are roughly the same size and have the same habitat requirements
(Harmsen et al. 2010).
While this study is the first to calibrate the relationship between hit rates, density and
abundance for quenda, similar studies have been conducted on other nondescript mammals
with mixed results. Bengsen et al. (2011) found that camera trap abundance indices could
monitor changes in a feral pig population and Diete et al. (2015) found that camera trapping
can be used as a sampling method for the northern hopping-mouse (Notomys aquilo). Also,
Villette et al. (2016, 2017) found that camera trapping can be used as a robust means to
estimate density of red squirrels (Tamiasciurus hudsonicus), red-backed voles (Myodes
rutilus) and deer mice (Peromyscus maniculatus). Other researchers have also found that
camera traps can be used to estimate the density or abundance of the Irish and European hare
(Lepus timidus hibernicus and L. europaeus), European pine marten (Martes martes), red-
necked wallaby (Macropus rufogriseus), quokka (Setonix brachyurus) and ungulates
(Rowcliffe et al. 2008; Rovero and Marshall 2009; Manzo et al. 2012; Dundas et al. 2014;
Caravaggi et al. 2016). By contrast, Weerakoon et al. (2014) found that camera traps were
ineffective at detecting changes in black rat population size and Villette et al. (2017) were
unable to assess camera traps as a means of estimating density for snowshoe hares (Lepus

26
americanus). This study adds to this growing body of knowledge as it demonstrates that it is
possible to survey and monitor a medium sized marsupial with camera traps.
Conservation and management implications
This research has important implications for the conservation and management of quenda in
Western Australia and endangered bandicoots elsewhere. In order to detect population
changes, monitoring must be effective and accurate, and precise measures of population size
can impact on the efficacy of management or conservation strategies (Wayne et al. 2013).
This study has shown that camera traps can be used to sample quenda populations, allowing a
choice of sampling methods for future studies. They have proven useful tools as they can
assess quenda abundance and produce rapid and quantifiable results in a non-invasive
manner. As there was no difference in the statistical results when hit rates calculated from
four camera nights were used, camera trap surveys used to measure quenda populations could
be limited to just four days instead of ten, producing even faster results. They are inexpensive
tools that can detect changes in quenda population size; however, their success is dependent
on weather conditions, as there will be few hits during periods of heavy and continuous rain,
as observed in this study at Thomsons Lake Nature Reserve. In this study, camera traps
detected a greater number of species than live traps and were able to detect small, medium
and large mammals as well as birds and reptiles. This ability to monitor multiple species at
once further highlights the cost-effectiveness and efficiency of camera traps. Finally, camera
traps may facilitate regular monitoring and consequently improve wildlife management by
enabling informed decisions regarding populations of the quenda to be made. Camera
trapping hit rates as an index of abundance may also allow us to standardise and reduce the
costs of monitoring programs (Rovero and Marshall 2009) ensuring effective conservation of
this species.
Limitations
This study has several limitations that should be considered. Firstly, the low number of sites
and low sample size make it difficult to make overarching conclusions about the utility of
camera traps for measuring quenda population size or density. A stronger conclusion could be
made if this study had been conducted over a larger number of sites where quenda were
present, which due to time constraints, could not be achieved in this study. Secondly,
sampling effort was inconsistent between sites, with the number of camera nights varying
between 50 and 160. To ensure an accurate comparison between methods and strong

27
conclusions, it is ideal to have equal sampling effort across sites. Finally, the hit window
length may have influenced the results. As hit windows are species specific, a five minute hit
window may not be the most appropriate to maximise the correlation between hit rate and
population size or density for this species.
Future research
While the results presented here are promising, further research is required. Firstly, it would
be beneficial to conduct this study over a greater number of sites and over a wider range of
quenda densities to strengthen and confirm the correlation between hit rates and population
size and density. Secondly, repeating this survey with equal sampling effort at each site would
be ideal to ensure accurate comparisons between methods. Thirdly, it would be desirable to
determine if hit window length affects the correlation between hit rates and population size or
density, and if five minutes is the most appropriate hit window for this species, as this was
beyond the scope of this project. Five minutes was chosen based on previous research,
however, optimal event definitions are dependent on a study’s target species, site, design and
intent, and there are currently no standard lengths of time a researcher could use to define an
event or hit window (Meek et al. 2014; Diete et al. 2015). In addition, determining if hit rates
obtained from unbaited camera traps are correlated to density or abundance would be prudent,
as the use of baited cameras has been criticised as animals are attracted into the survey area,
which may result in increased population estimates (Dundas et al. 2014). Finally, determining
if the relationships found here can be applied to populations in other regions, particularly in
areas where this and other species of bandicoots are rare or endangered, would be extremely
useful.
Using camera traps to estimate the population size of species with uniform morphology is one
of the most difficult challenges faced by wildlife researchers, and estimating abundance and
density for nondescript species is an ongoing focus of wildlife research (Chandler and Royle
2013; Sollmann et al. 2013; Dundas et al. 2014). This study has shown that camera trap
surveys can potentially provide valid measures of abundance that would enable researchers
and practitioners to monitor quenda populations. The relationship between hit rates and
population and density estimates suggests that camera traps are a potential alternative to live
trapping for the quenda, however, further research is required over a greater number of sites
to strengthen these relationships. Despite the need for further research, the results of this study
are promising because they indicate that it may be possible to survey and monitor nondescript

28
medium-sized marsupials with camera traps without the necessity of live trapping, which is
costly, time-consuming and has welfare implications. Therefore, camera traps may provide a
useful, practical and cheap alternative to traditional methods, which may lead to an
improvement in the conservation and management of our native marsupials.

29
References Bain, K., Wayne, A., and Bencini, R. (2014). Overcoming the challenges of measuring the
abundance of a cryptic macropod: is a qualitative approach good enough? Wildlife
Research 41, 84-93.
Barros, C. S., Püttker, T., Pinotti, B. T., and Pardini, R. (2015). Determinants of capture-
recapture success: an evaluation of trapping methods to estimate population and
community parameters for Atlantic forest small mammals. Zoologia 32, 334-344.
Bengsen, A. J., Leung, L. K.-P., Lapidge, S. J., and Gordan, I. J. (2011). Using a general
index approach to analyze camera-trap abundance indices. The Journal of Wildlife
Management 75, 1222-1227.
Bilney, R. J., Cooke, R., and White, J. G. (2010). Underestimated and severe: small mammal
decline from the forests of south-eastern Australia since European settlement, as
revealed by a top-order predator. Biological Conservation 143, 52-59.
Borchard, P., and Wright, I. A. (2010). Using camera-trap data to model habitat use by bare-
nosed wombats (Vombatus ursinus) and cattle (Bos taurus) in a south-eastern
Australian agricultural riparian ecosystem. Australian Mammalogy 32, 16-22.
Braithwaite, R. W. (1995). Southern Brown Bandicoot Isoodon obesulus (Shaw, 1797). In
‘The Mammals of Australia’. (Ed R. Strahan.) Pp. 176-177. (Reed Books: Sydney).
Broughton, S. K., and Dickman, C. R. (1991). The effect of supplementary food on home
range of the southern brown bandicoot, Isoodon obesulus (Marsupialia: Peramelidae).
Australian Journal of Ecology 16, 71-78.
Burton, A. C., Neilson, E., Moreira, D., Ladle, A., Steenweg, R., Fisher, J. T., Bayne, E., and
Boutin, S. (2015). Wildlife camera trapping: a review and recommendations for
linking surveys to ecological processes. Journal of Applied Ecology 52, 675-685.
CALM. (2005). Thomsons Lake Nature Reserve management plan. Department of Parks and
Wildlife, Management Plan No. 54, Perth, Australia.
Caravaggi, A., Zaccaroni, M., Riga, F., Schai-Braun, S. C., Dick, J. T. A., Montgomery, W.
I., and Reid, N. (2016). An invasive-native mammalian species replacement process
captured by camera trap survey random encounter models. Remote Sensing in Ecology
and Conservation 2, 45-58.
Carbone, C., Christie, S., Conforti, K., Coulson, T., Franklin, N., Ginsberg, J. R., Griffiths,
M., Holden, J., Kawanishi, K., Kinnaird, M., Laidlaw, R., Lynam, A., MacDonald, D.
W., Martyr, D., McDougal, C., Nath, L., O’Brien, T., Seidensticker, J., Smith, D. J. L.,
30
Sunquist, M., Tilson, R., and Shahruddin, W. N. W. (2001). The use of photographic
rates to estimate densities of tigers and other cryptic mammals. Animal Conservation
4, 75-79.
Catling, P. C., Burt, R. J., and Kooyman, R. (1997). A comparison of techniques used in a
survey of the ground-dwelling and arboreal mammals in forests in north-eastern New
South Wales. Wildlife Research 24, 417-432.
Chambers, B., and Bencini, R. (2015). Factors affecting the use of fauna underpasses by
bandicoots and bobtail lizards. Animal Conservation 18, 424-432.
Chandler, R. B., and Royle, J. A. (2013). Spatially explicit models for inference about density
in unmarked or partially marked populations. The Annals of Applied Statistics 7, 936-
954.
Claridge, A. W., and Barry, S. C. (2000). Factors influencing the distribution of medium sized
ground-dwelling mammals in southeastern mainland Australia. Austral Ecology 25,
676-688.
Claridge, A. W., Mifsud, G., Dawson, J., and Saxon, M. J. (2004). Use of infrared digital
cameras to investigate the behaviour of cryptic species. Wildlife Research 31, 645-
650.
Claridge, A. W., Paull, D. J., and Barry, S. C. (2010a). Detection of medium-sized ground-
dwelling mammals using infrared digital cameras: an alternative way forward?
Australian Mammalogy 32, 165-171.
Claridge, A. W., Cunningham, R. B., Catling, P. C., and Reid, A. M. (2010b). Trends in the
activity levels of forest-dwelling vertebrate fauna against a background of intensive
baiting for foxes. Forest Ecology and Management 260, 822-832.
Claridge, A. W., Paull, D. J., and Cunningham, R. B. (2015). Oils ain’t oils: can truffle-
infused food additives improve detection of rare and cryptic mycophagous mammals?
Australian Mammalogy 38, 12-20.
Cooper, M. L. (1998). Geographic variation in size and shape in the southern brown
bandicoot, Isoodon obesulus (Peramelidae: Marsupialia), in Western Australia.
Australian Journal of Zoology 46, 145-152.
Cutler, T. L., and Swann, D. E. (1999). Using remote photography in wildlife ecology: a
review. Wildlife Society Bulletin 27, 571-581.
Dajun, W., Sheng, L., McShea, W. J., and Fu, L. M. (2006). Use of remote-trip cameras for
wildlife surveys and evaluating the effectiveness of conservation activities at a nature
reserve in Sichuan Province, China. Environmental Management 38, 942-951.

31
De Bondi, N., White, J. G., Stevens, M., and Cooke, R. (2010). A comparison of the
effectiveness of camera trapping and live trapping for sampling terrestrial small-
mammal communities. Wildlife Research 37, 456-465.
Diete, R. L., Meek, P. D., Dixon, K. M., Dickman, C. R., and Leung, L. K.-P. (2015). Best
bait for your buck: bait preference for camera trapping north Australian mammals.
Australian Journal of Zoology 63, 376-382.
Driessen, M. M., and Rose, R. K. (2015). Isoodon obesulus (Peramelemorphia: Peramelidae).
Mammalian Species 47, 112-123.
Dundas, S. J., Adams, P. J., and Fleming, P. A. (2014). Can camera trap surveys provide
reliable population estimates for nondescript species? In ‘Camera Trapping: Wildlife
Management and Research’. (Eds P. D. Meek, P. J. S. Fleming, G. Ballard, P. Banks,
A. W. Claridge, J. Sanderson, D. Swann.) Pp. 219-226. (CSIRO Publishing:
Melbourne.)
Efford, M. G. (2012). ‘Density 5.0: software for spatially explicit capture-recapture.’
Department of Mathematics and Statistics, University of Otago, Dunedin, New
Zealand. Available at http://www.otago.ac.nz/density [accessed 5 May 2017].
Engeman, R. M. (2005). Indexing principles and a widely applicable paradigm for indexing
animal populations. Wildlife Research 32, 203-210.
Foster, R. J., and Harmsen, B. J. (2012). Critique of density estimation from camera-trap data.
The Journal of Wildlife Management 76, 224-236.
Garden, J. G., McAlpine, C. A., Possingham, H. P., and Jones, D. N. (2007). Using multiple
survey methods to detect terrestrial reptiles and mammals: what are the most
successful and cost-efficient combinations? Wildlife Research 34, 218-227.
Güthlin, D., Storch, I., and Küchenhoff, H. (2014). Toward reliable estimates of abundance:
comparing index methods to assess the abundance of a mammalian predator. PLoS
ONE 9, e94537.
Harmsen, B. J., Foster, R. J., Silver, S., Ostro, L., and Doncaster, C. P. (2010). Differential
use of trails by forest mammals and the implications for camera-trap studies: a case
study from Belize. Biotropica 42, 126-133.
Hofmeester, T. R., Rowcliffe, M., and Jansen, P. A. (2016). A simple method for estimating
the effective detection distance of camera traps. Remote Sensing in Ecology and
Conservation, in press.

32
Howard, K. H., Barrett, G., Ramalho, C. E., Friend, J. A., Boyland, R. J. I., Hudson, J., and
Wilson, B. (2014). Community Quenda Survey 2012. WWF-Australia and the
Department of Parks and Wildlife, Perth, Australia.
Jareño, D., Viñuela, J., Luque-Larena, J. J., Arroyo, L., Arroyo, B., and Mougeot, F. (2014).
A comparison of methods for estimating common vole (Microtus arvalis) abundance
in agricultural habitats. Ecological Indicators 36, 111-119.
Kelly, M. J. (2008). Design, evaluate, refine: camera trap studies for elusive species. Animal
Conservation 11, 182-184.
Kelly, M. J., and Holub, E. L. (2008). Camera trapping of carnivores: trap success among
camera types and across species, and habitat selection by species, on Salt Pond
Mountain, Giles County, Virginia. Northeastern Naturalist 15, 249-262.
Kenney, A. (2017). Wild Photo Trap: a Microsoft Access database developed to manage and
analyse camera trap data.
King, C. M., McDonald, R. M., Martin, R. D., MacKenzie, D. I., Tempero, G. W., and
Holmes, S. J. (2007). Continuous monitoring of predator control operations at
landscape scale. Ecological Management and Restoration 8, 133-139.
Krebs, C. J. (2014). Estimating abundance and density: mark-recapture techniques. In
‘Ecological Methodology’. (Ed C. Krebs.) Pp. 20-82. (Harper and Row: New York.)
Lemckert, F., Brassil, T., Kavanagh, R., and Law, B. (2006). Trapping small mammals for
research and management: how many die and why? Australian Mammalogy 28, 201-
207.
Lobert. B., and Lee A. K. (1990). Reproduction and life history of Isoodon obesulus in
Victorian heathland. In ‘Bandicoots and Bilbies’. (Eds J. H. Seebeck, P. R. Brown, R.
L. Wallis and C. M. Kemper.) Pp. 311–18. (Surrey Beatty and Sons: Sydney.)
Lobert, B. (1990). Home range and activity period of the southern brown bandicoot (Isoodon
obesulus) in a Victorian heathland. In ‘Bandicoots and Bilbies’. (Eds J. H. Seebeck, P.
R. Brown, R. L. Wallis and C. M. Kemper.) Pp. 319–25. (Surrey Beatty and Sons:
Sydney.)
Lobert, B., Lumsden, L., Brunner, H., and Triggs, B. (2001). An assessment of the accuracy
and reliability of hair identification of south-east Australian mammals. Wildlife
Research 28, 637-641.
Lyra-Jorge, M. C., Ciocheti, G., Pivello, V. R., and Meirelles, S. T. (2008). Comparing
methods for sampling large- and medium-sized mammals: camera traps and track
plots. European Journal of Wildlife Research 54, 739-744.

33
McCallum, J. (2013). Changing use of camera traps in mammalian field research: habitats,
taxa and study types. Mammal Review 43, 196-206.
McKelvey, K. S., and Pearson, D. E. (2001). Population estimation with sparse data: the role
of estimators versus indices revisited. Canadian Journal of Zoology 79, 1754-1765.
Manzo, E., Bartolommei, P., Rowcliffe, J. M., and Cozzolino, R. (2012). Estimation of
population density of European pine marten in central Italy using camera trapping.
Acta Theriologica 57,165-172.
Meek, P. D., and Pittet, A. (2012). User-based design specifications for the ultimate camera
trap for wildlife research. Wildlife Research 39, 649-660.
Meek, P. D., Ballard, G., and Fleming, P. (2012). An introduction to camera trapping for
wildlife surveys in Australia. PestSmart Toolkit Publication, Invasive Animals
Cooperative Research Centre, Canberra, Australia.
Meek, P. D., Ballard, G., Claridge, A., Kays, R., Moseby, K., O’Brien, T., O’Connell, A.,
Sanderson, J., Swann, D. E., Tobler, M., and Townsend, S. (2014). Recommended
guiding principles for reporting on camera trapping research. Biodiversity and
Conservation 23, 2321-2343.
Meek, P. D., Ballard, G-A., and Fleming, P. J. S. (2015a). The pitfalls of wildlife camera
trapping as a survey tool in Australia. Australian Mammalogy 37, 13-22.
Meek, P. D., Ballard, G-A., Vernes, K., and Fleming, P. J. S. (2015b). The history of wildlife
camera trapping as a survey tool in Australia. Australian Mammalogy 37, 1-12.
Meek, P. D., and Vernes, K. (2016). Can camera trapping be used to accurately survey and
monitor the Hastings River mouse (Pseudomys oralis)? Australian Mammalogy 38,
44-51.
Mills, D. J., Harris, B., Claridge, A. W., and Barry, S. C. (2002). Efficacy of hair-sampling
techniques for the detection of medium-sized terrestrial mammals. I. A comparison
between hair-funnels, hair-tubes and indirect signs. Wildlife Research 29, 379-387.
NHMRC. (2013). Australian code for the care and use of animals for scientific purposes, 8th
edition. National Health and Medical Research Council, Canberra, Australia.
O’Connell, A. F., Nichols, J. D., and Karanth, K. U. (2011). ‘Camera Traps in Animal
Ecology.’ (Springer: Japan.)
Ortega-Argueta, A., Baxter, G., and Hockings, M. (2011). Compliance of Australian
threatened species recovery plans with legislative requirements. Journal of
Environmental Management 92, 2054-2060.
34
Paull, D. J., Claridge, A. W., and Barry, S. C. (2011). There’s no accounting for taste: bait
attractants and infrared digital cameras for detecting small to medium ground-dwelling
mammals. Wildlife Research 38, 188-195.
Paull, D. J., Claridge, A. W., and Cunningham, R. B. (2012). Effective detection methods for
medium-sized ground-dwelling mammals: a comparison between infrared digital
cameras and hair tunnels. Wildlife Research 39, 546-553.
Read, D. G. (1988). Weather and trap response of the dasyurid marsupials Sminthopsis
crassicaudata, Planigale gilesi and P. tenuirostris. Australian Wildlife Research 15,
139-148.
Rovero, F., and Marshall, A. R. (2009). Camera trapping photographic rate as an index of
density in forest ungulates. Journal of Applied Ecology 46, 1011-1017.
Rowcliffe, J. M., Field, J., Turvey, S. T., and Carbone, C. (2008). Estimating animal density
using camera traps without the need for individual recognition. Journal of Applied
Ecology 45, 1228-1236.
Rowcliffe, J. M., Carbone, C., Kays, R., Kranstauber, B., Jansen, P. A. (2014). Density
estimation using camera trap surveys: the random encounter model. In ‘Camera
Trapping: Wildlife Management and Research’. (Eds P. D. Meek, P. J. S. Fleming, G.
Ballard, P. Banks, A. W. Claridge, J. Sanderson, D. Swann.) Pp. 391-399. (CSIRO
Publishing: Melbourne.)
Smith, J. K., and Coulson, G. (2012). A comparison of vertical and horizontal camera trap
orientations for detection of potoroos and bandicoots. Australian Mammalogy 34, 196-
201.
Sollmann, R., Gardner, B., and Belant, J. L. (2012). How does spatial study design influence
density estimates from spatial capture-recapture models? PLoS ONE 7, e34575.
Sollmann, R., Mohamed, A., Samejima, H., and Wilting, A. (2013). Risky business or simple
solution – relative abundance indices from camera-trapping. Biological Conservation,
159, 405-412.
Stanley, T. R., and Royle, J. A. (2005). Estimating site occupancy and abundance using
indirect detection indices. Journal of Wildlife Management 69, 874-883.
Swan, M., Di Stefano, J., Christie, F., Steel, E., and York, A. (2014). Detecting mammals in
heterogeneous landscapes: implications for biodiversity monitoring and management.
Biodiversity and Conservation 23, 343-355.

35
Taylor, B. D., Goldingay, R. L., Lindsay, J. M. (2014). Horizontal or vertical? Camera trap
orientations and recording modes for detecting potoroos, bandicoots and pademelons.
Australian Mammalogy 36, 60-66.
Valentine, L. E., Anderson, H., Hardy, G. E. StJ., Fleming, P. A. (2013). Foraging activity by
the southern brown bandicoot (Isoodon obesulus) as a mechanism for soil turnover.
Australian Journal of Zoology 60, 419-423.
Valentine, L. E., Reaveley, A., Campbell, R., Hobbs, R., and Bowler, H. (2016). Bandicoots
in urban bushland. The University of Western Australia, Working Document, Perth,
Australia.
Valentine, L. E., Bretz, M., Ruthrof, K. X., Fisher, R., Hardy, G. E. StJ., and Fleming, P. A.
(2017). Scratching beneath the surface: bandicoot bioturbation contributes to
ecosystem processes. Austral Ecology 42, 265-276.
Villette, P., Krebs, C. J., Jung, T. S., and Boonstra, R. (2016). Can camera trapping provide
accurate estimates of small mammal (Myodes rutilus and Peromyscus maniculatus)
density in the boreal forest? Journal of Mammalogy 97, 32-40.
Villette, P., Krebs, C. J., and Jung, T. S. (2017). Evaluating camera traps as an alternative to
live trapping for estimating the density of snowshoe hares (Lepus americanus) and red
squirrels (Tamiasciurus hudsonicus). European Journal of Wildlife Research 63, 1-9.
Vine, S. J., Crowther, M. S., Lapidge, S. J., Dickman, C. R., Mooney, N., Piggott, M. P., and
English, A. W. (2009). Comparison of methods to detect rare and cryptic species: a
case study using the red fox (Vulpes vulpes). Wildlife Research 36, 436-446.
Watkins, A. F., McWhirter, J. L., and King, C. M. (2010). Variable detectability in long-term
population surveys of small mammals. European Journal of Wildlife Research 56,
261-274.
Wayne, A. F., Maxwell, M. A., Ward, C. G., Vellios C. V., Ward, B. G., Liddelow, G. L.,
Wilson, I., Wayne, J. C., and Williams, M. R. (2013). Importance of getting the
numbers right: quantifying the rapid and substantial decline of an abundant marsupial,
Bettongia penicillata. Wildlife Research 40, 169-183.
Weerakoon, M. K., Ruffino, L., Cleary, G. P., Heavener, S., Bytheway, J. P., Smith, H. M.,
and Banks, P. B. (2014). Can camera traps be used to estimate small mammal
population size? In ‘Camera Trapping: Wildlife Management and Research’. (Eds P.
D. Meek, P. J. S. Fleming, G. Ballard, P. Banks, A. W. Claridge, J. Sanderson, D.
Swann.) Pp. 379-390. (CSIRO Publishing: Melbourne.)

36
Welbourne, D. J., MacGregor, C., Paull, D., and Lindenmayer, D. B. (2015). The
effectiveness and cost of camera traps for surveying small reptiles and critical weight
range mammals: a comparison with labour-intensive complementary methods.
Wildlife Research 42, 414-425.
Wiewel, A. S., Clark, W. R., and Sovada, M. A. (2007). Assessing small mammal abundance
with track-tube indices and mark-recapture population estimates. Journal of
Mammalogy 88, 250-260.
Woinarski, J. C. Z., Burbidge, A. A., and Harrison, P. L. (2014). ‘The Action Plan for
Australian Mammals 2012.’ (CSIRO Publishing: Melbourne.)