CAN STATES TAKE OVER AND TURN AROUND...
43
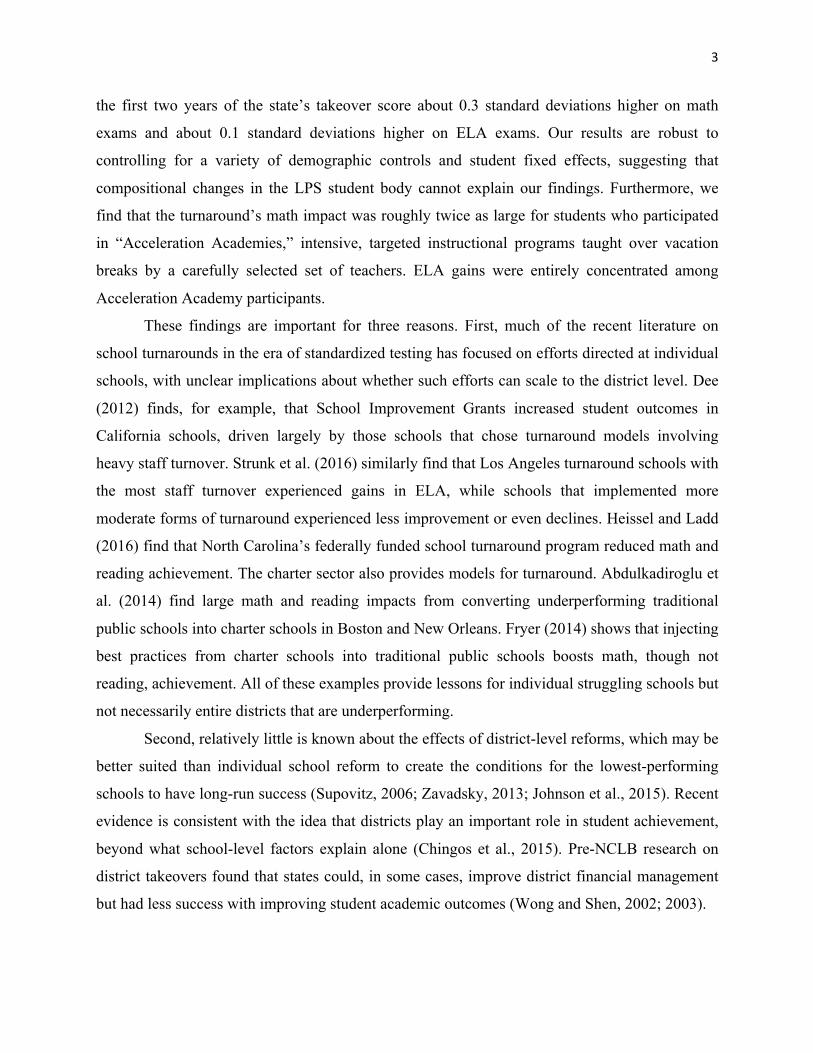
1 CAN STATES TAKE OVER AND TURN AROUND SCHOOL DISTRICTS? EVIDENCE FROM LAWRENCE, MASSACHUSETTS Beth E. Schueler,* Joshua S. Goodman* and David J. Deming** *Harvard Kennedy School of Government **Harvard Graduate School of Education Abstract The Every Student Succeeds Act (ESSA) requires states to identify and turn around struggling schools, with federal school improvement money required to fund evidence-based policies. Most research on turnarounds has focused on individual schools, while studies of district-wide turnarounds have come from relatively exceptional settings and interventions. We study a district-wide turnaround of a type that may become more common under ESSA, an accountability-driven state takeover of Massachusetts’ Lawrence Public Schools (LPS). A differences-in-differences framework comparing LPS to demographically similar districts not subject to state takeover shows that the turnaround’s first two years produced sizeable achievement gains in math and modest gains in reading. Intensive small-group instruction over vacation breaks may have led to particularly large gains for participating students. We also find no evidence that the turnaround resulted in slippage on non-test score outcomes and suggestive evidence of positive effects on grade progression among high school students. Keywords: district turnaround, school improvement, state takeover, school accountability, portfolio management Author Note We owe thanks to Carrie Conaway at the Massachusetts Department of Elementary and Secondary Education, Julie Albino, Mary Lou Bergeron, David Clement, Sara D’Allesandro, Michael Kennealy, Seth Racine, Kristyn Rice, Jeffrey Riley, and Mary Toomey at the Lawrence Public Schools, Steven Poftak at the Rappaport Institute of Greater Boston, and Martin West at the Harvard Graduate School of Education. Beth Schueler’s work on this paper has been supported by funding from the Rappaport Institute for Greater Boston and the Harvard Graduate School of Education Dean’s Summer Fellowship. Address correspondence to Beth E. Schueler, [email protected], Joshua S. Goodman, [email protected], or David J. Deming, [email protected].
Transcript of CAN STATES TAKE OVER AND TURN AROUND...
1"
CAN STATES TAKE OVER AND TURN AROUND SCHOOL DISTRICTS?
EVIDENCE FROM LAWRENCE, MASSACHUSETTS
Beth E. Schueler,* Joshua S. Goodman* and David J. Deming**
*Harvard Kennedy School of Government
**Harvard Graduate School of Education
Abstract
The Every Student Succeeds Act (ESSA) requires states to identify and turn around struggling schools, with federal school improvement money required to fund evidence-based policies. Most research on turnarounds has focused on individual schools, while studies of district-wide turnarounds have come from relatively exceptional settings and interventions. We study a district-wide turnaround of a type that may become more common under ESSA, an accountability-driven state takeover of Massachusetts’ Lawrence Public Schools (LPS). A differences-in-differences framework comparing LPS to demographically similar districts not subject to state takeover shows that the turnaround’s first two years produced sizeable achievement gains in math and modest gains in reading. Intensive small-group instruction over vacation breaks may have led to particularly large gains for participating students. We also find no evidence that the turnaround resulted in slippage on non-test score outcomes and suggestive evidence of positive effects on grade progression among high school students. Keywords: district turnaround, school improvement, state takeover, school accountability, portfolio management Author Note
We owe thanks to Carrie Conaway at the Massachusetts Department of Elementary and Secondary Education, Julie Albino, Mary Lou Bergeron, David Clement, Sara D’Allesandro, Michael Kennealy, Seth Racine, Kristyn Rice, Jeffrey Riley, and Mary Toomey at the Lawrence Public Schools, Steven Poftak at the Rappaport Institute of Greater Boston, and Martin West at the Harvard Graduate School of Education. Beth Schueler’s work on this paper has been supported by funding from the Rappaport Institute for Greater Boston and the Harvard Graduate School of Education Dean’s Summer Fellowship. Address correspondence to Beth E. Schueler, [email protected], Joshua S. Goodman, [email protected], or David J. Deming, [email protected].

2"
1. SCHOOL AND DISTRICT TURNAROUND
Turning around chronically under-performing schools and districts has been an elusive
goal, despite prioritization at the highest levels of government (Gewertz, 2009). In recent years,
considerable federal resources have been devoted toward this end. The Obama administration’s
signature education initiative, Race to the Top, awarded over $4 billion in competitive grant
funding to states in part based on states’ plans for turning around their lowest achieving schools
(Smarick, 2010). The 2009 American Recovery and Reinvestment Act also funded an additional
$3 billion in School Improvement Grants (SIG) aimed at improving the lowest-performing five
percent of public K-12 schools (Dee, 2012).
At the state level, there is considerable variation across accountability models in the
policy response to chronic underperformance. Through its Elementary and Secondary Education
Act Flexibility Program, the U.S. Department of Education (U.S. DOE) has recently encouraged
states to adopt tiered accountability systems targeting the lowest performers for intensive
interventions. The U.S. DOE has highlighted as an exemplar Massachusetts’ accountability
system, which is defined by the state’s 2010 Achievement Gap Act (U.S. DOE, 2012). That
system has three important features. First, the state classifies schools and districts into distinct
performance levels. Second, the state requires low-performing schools and districts to implement
rapid improvement plans. Third, the State Board and Commissioner of Education have the
authority to take control of schools and districts that fall into the lowest performance level.
In fall 2011, the state Department of Elementary and Secondary Education (DESE)
exercised this authority and took over the Lawrence Public School district (LPS). The state
appointed a Receiver who was granted extensive legal powers, including those previously
assigned to the Superintendent and School Committee. The takeover was specified as the final
step in a policy process that began with chronic underperformance and ended with the
classification of LPS as a Level 5 district, the lowest rating in the state’s accountability system.
The turnaround reforms, which we describe in more detail below, involved efforts designed to
increase expectations, increase school-level autonomy and accountability, extend learning time,
improve human capital, and improve data use.
To estimate the impact of the turnaround, we use a differences-in-differences approach
comparing changes over time in the outcomes of LPS students to those of students in
demographically similar Massachusetts school districts. We find that LPS students exposed to
3"
the first two years of the state’s takeover score about 0.3 standard deviations higher on math
exams and about 0.1 standard deviations higher on ELA exams. Our results are robust to
controlling for a variety of demographic controls and student fixed effects, suggesting that
compositional changes in the LPS student body cannot explain our findings. Furthermore, we
find that the turnaround’s math impact was roughly twice as large for students who participated
in “Acceleration Academies,” intensive, targeted instructional programs taught over vacation
breaks by a carefully selected set of teachers. ELA gains were entirely concentrated among
Acceleration Academy participants.
These findings are important for three reasons. First, much of the recent literature on
school turnarounds in the era of standardized testing has focused on efforts directed at individual
schools, with unclear implications about whether such efforts can scale to the district level. Dee
(2012) finds, for example, that School Improvement Grants increased student outcomes in
California schools, driven largely by those schools that chose turnaround models involving
heavy staff turnover. Strunk et al. (2016) similarly find that Los Angeles turnaround schools with
the most staff turnover experienced gains in ELA, while schools that implemented more
moderate forms of turnaround experienced less improvement or even declines. Heissel and Ladd
(2016) find that North Carolina’s federally funded school turnaround program reduced math and
reading achievement. The charter sector also provides models for turnaround. Abdulkadiroglu et
al. (2014) find large math and reading impacts from converting underperforming traditional
public schools into charter schools in Boston and New Orleans. Fryer (2014) shows that injecting
best practices from charter schools into traditional public schools boosts math, though not
reading, achievement. All of these examples provide lessons for individual struggling schools but
not necessarily entire districts that are underperforming.
Second, relatively little is known about the effects of district-level reforms, which may be
better suited than individual school reform to create the conditions for the lowest-performing
schools to have long-run success (Supovitz, 2006; Zavadsky, 2013; Johnson et al., 2015). Recent
evidence is consistent with the idea that districts play an important role in student achievement,
beyond what school-level factors explain alone (Chingos et al., 2015). Pre-NCLB research on
district takeovers found that states could, in some cases, improve district financial management
but had less success with improving student academic outcomes (Wong and Shen, 2002; 2003).

4"
More recent research into district-level turnarounds has focused on three relatively
exceptional cases. Gill et al. (2007) show that the state’s takeover of the Philadelphia schools in
2002, which turned over control of many schools to private operators, had little impact on
student achievement. Conversely, Harris and Larsen (2016) document substantial achievement
gains across the New Orleans school district following wide-ranging reforms that transformed
virtually all of the district’s schools into charter schools. Finally, Zimmer et al. (2015) find
mixed results for turnaround schools in Tennessee’s unusual state-managed Achievement School
District (ASD) model under which district governance is divorced from geography through the
placement of low-performing schools from across the state into a single district.
In contrast, the Lawrence Public Schools (LPS) provide a valuable case of accountability-
driven state takeover and district-wide turnaround of a chronically low-performing school system
that, unlike Philadelphia and New Orleans, was not driven by a large shift to outside school
operators. In the turnaround’s first year, fewer than five percent of LPS students attended school
grades run by outside operators. By the second year, that number was still below 20 percent. The
Lawrence turnaround effort did not depend heavily on outside operators, as did Philadelphia, did
not require an unusual triggering event like Hurricane Katrina, as did New Orleans, and did not
abandon the traditional geographically-based district structure, as did Tennessee’s ASD.
Thus the third contribution of this research is to study a district turnaround case that
represents a policy response stemming directly from state accountability law and is likely more
typical of reforms to be repeated in other contexts. Since taking over LPS, for example, the
Massachusetts Board of Elementary and Secondary Education has voted to take over two
additional districts, Holyoke and Southbridge. Massachusetts is not alone in using or considering
state intervention into underperforming districts. Since 2015, eleven states have passed or
debated legislation to create state-run districts (Education Commission of the States, 2016).
Furthermore, the recently passed Federal Every Student Succeeds Act (ESSA) requires
states to develop policies that identify and turn around low-performing schools as part of a larger
state accountability system. States therefore have substantial need for evidence about takeover
and turnaround policy, and this paper addresses that need.
5"
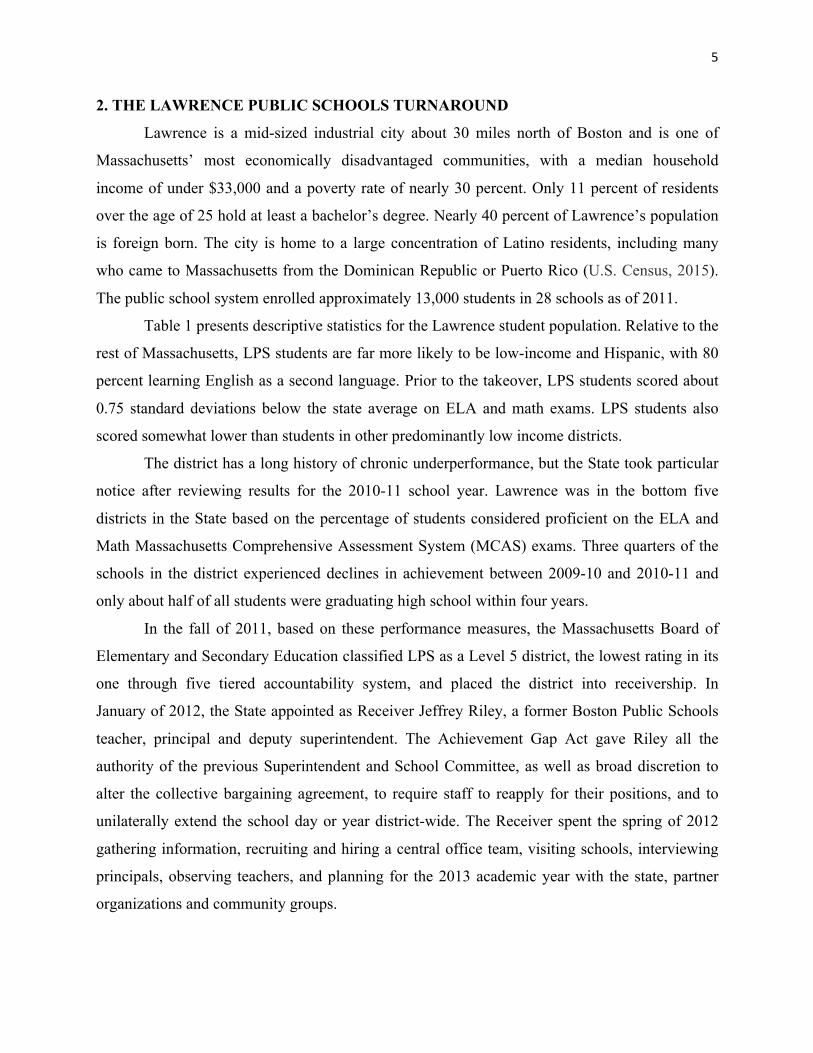
2. THE LAWRENCE PUBLIC SCHOOLS TURNAROUND
Lawrence is a mid-sized industrial city about 30 miles north of Boston and is one of
Massachusetts’ most economically disadvantaged communities, with a median household
income of under $33,000 and a poverty rate of nearly 30 percent. Only 11 percent of residents
over the age of 25 hold at least a bachelor’s degree. Nearly 40 percent of Lawrence’s population
is foreign born. The city is home to a large concentration of Latino residents, including many
who came to Massachusetts from the Dominican Republic or Puerto Rico (U.S. Census, 2015).
The public school system enrolled approximately 13,000 students in 28 schools as of 2011.
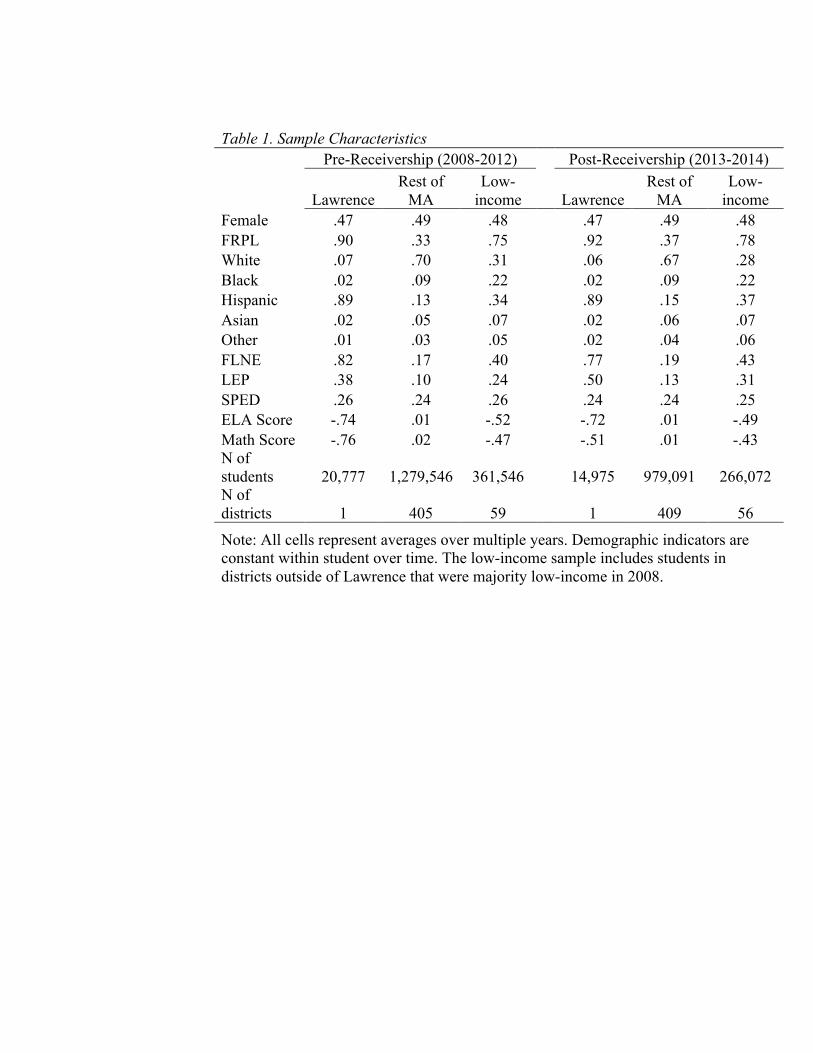
Table 1 presents descriptive statistics for the Lawrence student population. Relative to the
rest of Massachusetts, LPS students are far more likely to be low-income and Hispanic, with 80
percent learning English as a second language. Prior to the takeover, LPS students scored about
0.75 standard deviations below the state average on ELA and math exams. LPS students also
scored somewhat lower than students in other predominantly low income districts.
The district has a long history of chronic underperformance, but the State took particular
notice after reviewing results for the 2010-11 school year. Lawrence was in the bottom five
districts in the State based on the percentage of students considered proficient on the ELA and
Math Massachusetts Comprehensive Assessment System (MCAS) exams. Three quarters of the
schools in the district experienced declines in achievement between 2009-10 and 2010-11 and
only about half of all students were graduating high school within four years.
In the fall of 2011, based on these performance measures, the Massachusetts Board of
Elementary and Secondary Education classified LPS as a Level 5 district, the lowest rating in its
one through five tiered accountability system, and placed the district into receivership. In
January of 2012, the State appointed as Receiver Jeffrey Riley, a former Boston Public Schools
teacher, principal and deputy superintendent. The Achievement Gap Act gave Riley all the
authority of the previous Superintendent and School Committee, as well as broad discretion to
alter the collective bargaining agreement, to require staff to reapply for their positions, and to
unilaterally extend the school day or year district-wide. The Receiver spent the spring of 2012
gathering information, recruiting and hiring a central office team, visiting schools, interviewing
principals, observing teachers, and planning for the 2013 academic year with the state, partner
organizations and community groups.

6"
Receivership did not come with large amounts of additional funding. Per pupil spending
increased slightly over the first two years of the turnaround, from $13,272 in 2012 to $14,027 in
2014. The state average similarly increased from $13,637 in 2012 to $14,518 in 2014 (MA
DESE, 2015). In the second year of the turnaround, LPS did receive more than $2 million in
Race to the Top funding and more than $3 million in School Redesign Grants through the federal
School Improvement Grant program (Education Research Services, 2015). In addition, LPS
received some private funding from individual donors and foundations to support special
programs such as the Acceleration Academies. LPS’s overall state-reported per pupil spending
increases did not, however, outpace statewide increases.
The Receiver began implementing turnaround efforts in the 2012-13 school year and the
turnaround intensified over time. In this paper, we present results from the first two years of the
turnaround implementation, 2013 and 2014. In the follow section, we outline the five primary
components of the turnaround strategy, specifying the changes that occurred by year. This
description is also summarized in Figure 1.
Expectations. First, the district attempted to raise expectations for students and staff. In
Spring 2012, the state and the Receiver jointly released a turnaround plan that laid out ambitious
performance targets, including 1) doubling the number of schools with Student Growth
Percentiles greater than 50 in year one, 2) moving from 22nd to one of the top five ranked
Massachusetts Gateway districts (midsized urban centers with economic challenges) in ELA and
math proficiency and graduation by year three, and 3) closing the gap with the rest of the state in
ELA and math proficiency and graduation in five to seven years (MA DESE, 2012).
Autonomy and Accountability. Second, to increase school autonomy and
accountability, the district reduced spending on the central office by $6.6 million over the first
two years, in an effort to push funds to the school level and shift to a more service-oriented
approach to district-school relations (Education Research Services, 2015). This is consistent with
other improved districts that have moved from a compliance to a school-support focus (Supovitz,
2006) and provide a differentiated menu of services based on individual schools’ needs (Honig,
2013). The district then provided differentiated levels of autonomy and support based on each
school’s prior performance and perceived capacity. High-performing schools received the
highest level of autonomy to continue operating as they saw fit, while management of the lowest
performing five schools was given to independent operators that operated with substantial
7"
autonomy. Schools in the middle of the performance distribution were provided with the least
autonomy and the most intensive central office supports. The ultimate result was a portfolio
management model of district organization, with the central office overseeing a diverse set of
school operators ranging from charter management organizations to the Lawrence Teachers
Union (Hill, Campbell & Gross, 2012).1
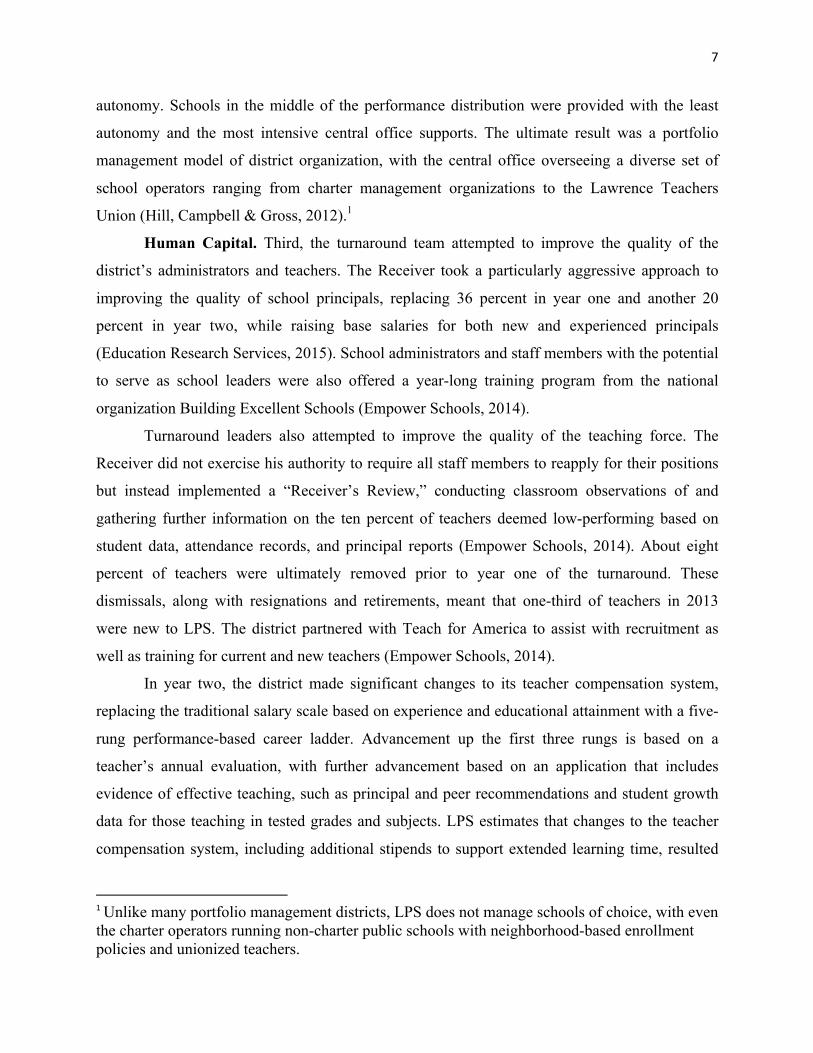
Human Capital. Third, the turnaround team attempted to improve the quality of the
district’s administrators and teachers. The Receiver took a particularly aggressive approach to
improving the quality of school principals, replacing 36 percent in year one and another 20
percent in year two, while raising base salaries for both new and experienced principals
(Education Research Services, 2015). School administrators and staff members with the potential
to serve as school leaders were also offered a year-long training program from the national
organization Building Excellent Schools (Empower Schools, 2014).
Turnaround leaders also attempted to improve the quality of the teaching force. The
Receiver did not exercise his authority to require all staff members to reapply for their positions
but instead implemented a “Receiver’s Review,” conducting classroom observations of and
gathering further information on the ten percent of teachers deemed low-performing based on
student data, attendance records, and principal reports (Empower Schools, 2014). About eight
percent of teachers were ultimately removed prior to year one of the turnaround. These
dismissals, along with resignations and retirements, meant that one-third of teachers in 2013
were new to LPS. The district partnered with Teach for America to assist with recruitment as
well as training for current and new teachers (Empower Schools, 2014).
In year two, the district made significant changes to its teacher compensation system,
replacing the traditional salary scale based on experience and educational attainment with a five-
rung performance-based career ladder. Advancement up the first three rungs is based on a
teacher’s annual evaluation, with further advancement based on an application that includes
evidence of effective teaching, such as principal and peer recommendations and student growth
data for those teaching in tested grades and subjects. LPS estimates that changes to the teacher
compensation system, including additional stipends to support extended learning time, resulted
"""""""""""""""""""""""""""""""""""""""""""""""""""""""""""""1"Unlike many portfolio management districts, LPS does not manage schools of choice, with even the charter operators running non-charter public schools with neighborhood-based enrollment policies and unionized teachers."

8"
in 92 percent of teachers receiving a pay increase beyond the increase they would have received
under the old system (LPS, 2013). The average LPS teacher received a $3,000 raise for the 2014
school year (ERS, 2015).2
Learning Time. The fourth major turnaround component was increased learning time,
including expanded school day, enrichment activities, tutoring, and special programs. A non-
profit organization, the National Center on Time and Learning, worked with several schools to
craft school-level implementation plans for adding hours to the school day. In year one, schools
led by outside operators added about 90 minutes to the school day. By year two, the school year
was expanded by at least 200 hours for all first through eighth grade students (Empower Schools,
2013). The district also worked to build out after-school enrichment offerings such as theater,
dance, arts, music and sports. At the high school level, LPS partnered with Match Education, a
non-profit charter school operator and educational program provider, to offer intensive
mathematics tutoring to a subset of the 9th and 10th grade students attending two of the district’s
lowest performing high schools (ERS, 2015).
One particularly notable component of the Receiver’s expanded learning time efforts
were “Acceleration Academies” that provided struggling students with targeted, small group
instruction in a single subject, delivered by select teachers over week-long vacation breaks.
Teachers were recruited from both within and outside of Lawrence, with the majority coming
from the district. Teachers applied through a competitive process for the Sontag Prize in Urban
Education, with selection based on evaluation ratings and principal recommendations. Those
chosen to teach in the acceleration academies received a $3,000 honorarium and attended a
weekend event at Harvard University that included an awards dinner, networking opportunities,
planning time, team building activities, and professional development delivered by experienced
education professionals.
Students were chosen to participate in acceleration academies by their principals. The
central office recommended but did not mandate that principals select students who had
particularly low prior MCAS scores, who appeared to be struggling based on interim assessment
data, and whose attendance records and behavioral histories suggested they would attend the
acceleration academies and not disrupt their peers. When pitching the program to parents and
"""""""""""""""""""""""""""""""""""""""""""""""""""""""""""""2"The"district"also"created"new"leadership"opportunities"for"teachers,"establishing"a"Teacher"Leader"Cabinet"that"provided"100"teachers"with"a"stipend"of"$5,000"to"provide"the"Receiver"with"guidance"on"districtDwide"policy.""
9"
students, educators emphasized that the Receiver selected them for a special opportunity to get
extra academic help. The program was not described as punishment or remediation.
Principals typically used homogenous ability groupings to create classes of ten to twelve
students, with teachers assigned to a single group for the week. Teachers were given substantial
flexibility to create their own lesson plans. Academies held over the February vacation focused
on ELA. The April Academies focused primarily on math, but also included some classes
dedicated to science. The district asked Academy teachers to focus on frequently assessed
MCAS standards and provided a list of these standards, sample objectives, and interim
assessment data for all of the students in the teacher’s class to identify the standards their
students had and had not yet mastered. The daily schedule varied by school, but administrators
were told to aim for a total of 25 hours of instruction over the week. Instruction in the core
subject was broken up by two “specials” per day, which included theater, visual art, music,
sports, technology and cooking. Students received incentives for perfect attendance, such as $40
gift cards.
Data Use. The fifth and final priority for the turnaround effort was a greater emphasis on
the effective use of data. In the first year, The Achievement Network (ANet), a national partner
organization, began working with nine LPS schools to provide training on how to use of data to
drive instructional improvement. ANet helped administer formative assessments and supported
schools in using data to target specialized programming for struggling students. In 2014, ANet
expanded to work with a majority of Lawrence schools (Empower Schools, 2014).
3. EMPIRICAL METHODS
We make use of student-level administrative data provided by the Massachusetts
Department of Elementary and Secondary Education (MA DESE). The data include students in
the state from the 2006 to the 2015 school year, recording information on each student’s grade,
school, district, demographic characteristics, standardized test scores, attendance and high school
graduation status. We supplement the state data with records from LPS on participation in the
Acceleration Academies in 2013 and 2014.
Our full sample includes over 500,000 unique students in each year. Our preferred
analytic sample includes the roughly one-fourth of students attending the 50 or so school districts
in the state in which at least half of the students qualified for free or reduced price lunch as of

10"
2008. We refer to this as the majority low-income sample. Such districts provide a more relevant
comparison to LPS given the well-known relationship between socioeconomic status and
academic achievement. However, below we show that our findings are generally robust to a
number of different sample restrictions, including those based on districts’ concentration of First
Language Not English students, district size, and districts’ baseline accountability status.
Our primary measures of academic achievement are students’ scores on the statewide
mathematics and English Language Arts (ELA) MCAS exams, given in 3rd-8th and 10th grades.
We standardize these scores within year, subject and grade using the full sample of
Massachusetts students. We also examine additional outcomes including students’ school
attendance, grade progression, probability of remaining in the same district, probability of
remaining enrolled in school, and probability of taking the MCAS in any given year.
LPS’ data allows us to identify the students who participated in Acceleration Academies
in 2013 and 2014. In 2013, 505 LPS students participated only in a math Acceleration Academy,
570 participated only in an ELA Acceleration Academy, and 495 participated in both types. In
total, 1,570 students, or 21 percent of LPS students in tested grades, participated in at least one
Acceleration Academy. In 2014, these numbers roughly doubled in each category, so that 42
percent of LPS students participated in at least one Acceleration Academy.
To study the overall effect of the turnaround, we conduct differences-in-differences
analyses that compare achievement trends of Lawrence students to achievement trends of
students in comparable districts that did not experience the turnaround. In all models, we treat
the school years 2008-12 as the pre-turnaround control period. We then use two primary
regression specifications. Model 1, a school-by-grade fixed effects model, is:
!!"#$ = !! + !!!!"#!"#$×2013! + !!" + !!" + !!!!"#$ + !!"#$"""""""""""""""(1)
"
Here, Y is an outcome for student i in school s and grade g in year y. !"#!"#$×2013! is the
interaction between a binary indicator for being enrolled in the Lawrence Public Schools and an
indicator for 2013, the first post-turnaround year. This interaction provides an estimate of the
extent to which changes in LPS’ outcomes in the first year of the turnaround relative to prior
years differ from such changes in other comparison districts. We exclude 2014 data in order to
focus on first year impacts.

11"
Inclusion of school-by-grade fixed effects δ implies that estimates are generated by
comparing the same school-grade combination to itself over time. Grade-by-year fixed effects !
control for any statewide shocks common to a given grade in a given year, such as changes in
exam difficulty. Student-level demographic controls X account for any compositional changes
within LPS or other districts over time. These controls include measures of gender, race, free or
reduced price lunch status, first language not English status, Limited English Proficiency status
and special education status. Standard errors are clustered at the school level to account for serial
correlation in unobserved components of the error term within schools.
To estimate the cumulative effects of the turnaround in 2014, its second year, we estimate
versions of Model 1 in which we include 2014 data but omit 2013 data and replace 2013 with a
2014 indicator. This allows us to compare the second year of the turnaround to the pre-
turnaround period. Including both periods simultaneously would result in estimates of the impact
of one year’s turnaround conditional on the other year’s, causal interpretation of which would be
unclear. As a result, the 2013 estimates cannot simply be added to the 2014 estimates to calculate
a cumulative effect. Instead, the 2014 estimates themselves provide the cumulative effects of the
first two years of turnaround reform.
Although we control for a rich set of covariates in Model 1, it is possible that there are
other pre-existing differences across schools and districts that could bias our estimates of the
turnaround effect. Furthermore, controlling for demographic characteristics may not sufficiently
account for differential changes over time in the composition of the LPS student population
relative to the population in other districts, particularly if such changes occur along unobservable
dimensions. To account for both observed and unobserved differences in non-time varying
characteristics between our treatment and comparison groups and for compositional changes to
these groups over time we run Model 2, a student fixed effects model, of the form:
!!"#$ = !! + !!!!"#!"#$×2013! + !!" + !!" + !! + !!"#$!!!!!!!!!!!!!!!(2)
"
There are two differences between this model and Model 1. The main difference is that we add
student fixed effects (!!), ensuring that identification of turnaround impacts comes from within-
student changes over time. Second, student fixed effects obviate the need for demographic
controls, which are constant over time, and which the model implicitly employs for

12"
identification. Again, we cluster standard errors at the school level. This is our preferred model
because, by comparing students to themselves over time, Model 2 allows us to eliminate two
potential sources of omitted variable bias: compositional changes to LPS or comparison districts
over time and all observed and unobserved non-time-varying student characteristics.
4. FINDINGS
Turnaround Impacts on Math and ELA Achievement.
We begin by using the raw data to explore achievement trends in Lawrence and other
districts and to establish the existence of parallel pre-turnaround achievement trends for
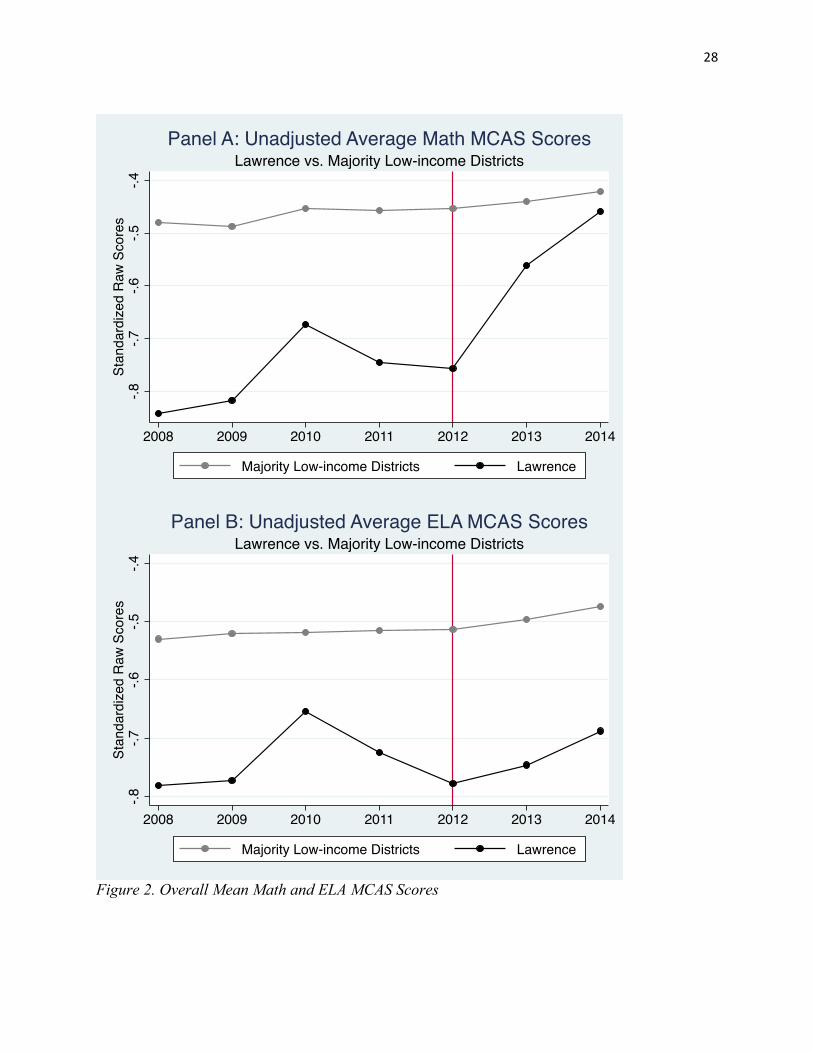
Lawrence and our comparison districts. Figure 2 illustrates Lawrence’s chronic
underperformance prior to receivership. Panel A presents math MCAS scores for all tested
students in LPS and other majority low-income districts. For the five years leading up to the
turnaround, LPS students underperformed Massachusetts as a whole by roughly 0.7 standard
deviations and underperformed other majority low-income districts by about 0.3 standard
deviations. Math achievement remained relatively flat in both Lawrence and other majority low-
income districts prior to the turnaround except for a bump in math achievement in 2010. This
increase occurs both in LPS and comparison districts, but is somewhat larger in LPS than the rest
of the state. In 2013, the first full year of the turnaround, math scores in LPS rose by roughly 0.2
standard deviations relative to the rest of the state, and then rose again by about 0.1 standard
deviations in 2014. Math scores in other low-income districts remained relatively flat during this
time. This clear break from trend, which is the largest change over this period, already suggests
that the turnaround may have had large impacts on math achievement in Lawrence.
Panel B suggests that in ELA, prior to the turnaround, Lawrence substantially
underperformed the rest of the state, by 0.7 standard deviations, and other low-income districts,
by 0.2 standard deviations. ELA achievement is relatively flat in comparison districts prior to
receivership. In contrast, LPS students saw an increase in ELA achievement in 2010. ELA scores
do rise slightly in 2013 and again in 2014 but the pattern of those scores in Lawrence’s pre-
turnaround period and post-turnaround trends in low-income districts make it less clear whether
such increases were due to the turnaround itself.
Table 2 contains estimates generated by our two regression models corresponding to
Figure 2. We focus first on comparisons of LPS to students across the entire state. Estimates
13"
from the school-grade fixed effects model suggest that math scores rose by 0.20 standard
deviations in year one of the turnaround and by 0.31 standard deviations by its second year. Our
preferred student fixed effects model decreases the estimates only slightly, implying that the
turnaround increased test scores by 0.18 standard deviations in year one and 0.30 standard
deviations by year two. The last two columns of the table show that limiting the sample to other
low-income districts has virtually no effect on these estimates. In Appendix Table A1, we
provide further evidence that these results are generally robust to the selection of comparison
districts. We estimate both models after limiting our sample to majority First Language Not
English districts, districts within 5,000 of the size of the LPS student population, and districts
with the same 2010 Level 4 accountability rating as LPS. We also confirm these results are not
driven by changes in the proportion of students taking these exams.
Importantly, our identification strategy relies on the assumption that students did not
respond to the takeover by differentially leaving or entering the district. By making within
student comparisons, our student fixed effects models address this threat. We further rule out
differential migration as a source of omitted variable bias by running versions of all models in
which we fix students’ districts as of 2012, regardless of where they subsequently moved. This
has no impact on the estimates presented here.
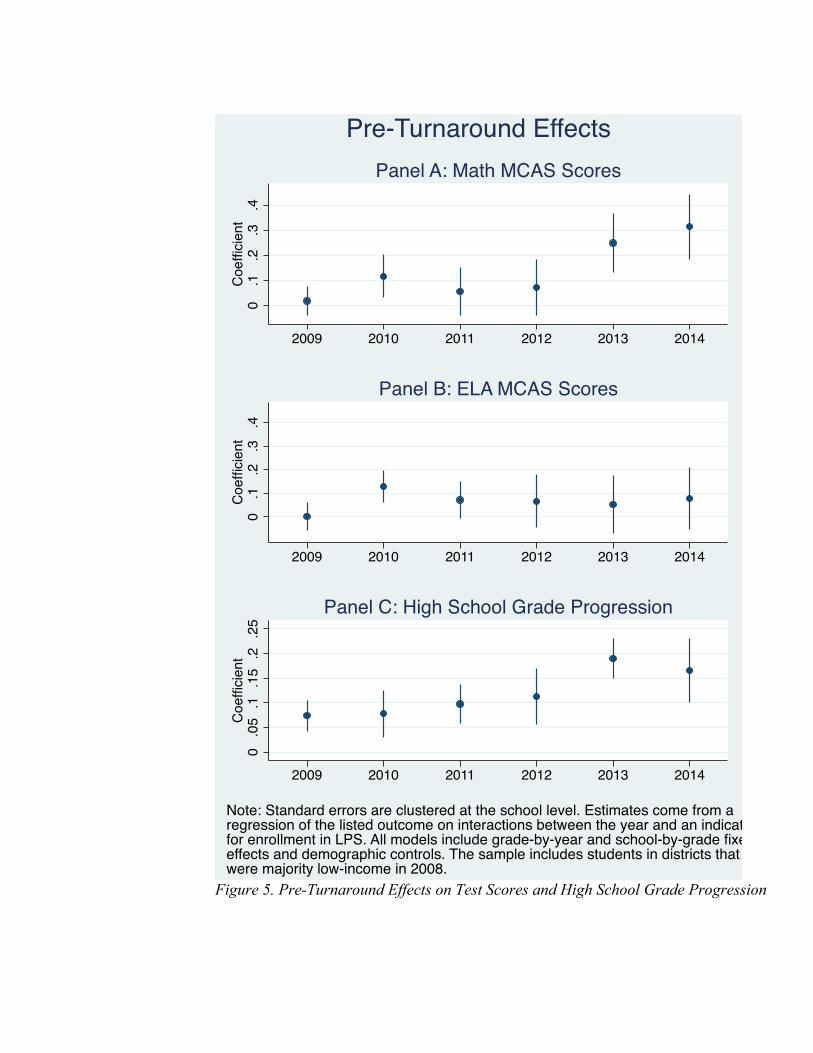
To further examine our parallel trends identifying assumption, we run our school-by-
grade model including interactions between the LPS dummy and each of the years in our time
series, using 2008 as the omitted year, with the low-income sample. In Figure 5, we plot the
resulting coefficients for each year, showing in Panel A that our estimates of the turnaround math
effects persist when utilizing this specification. There is only one pre-turnaround year—2010—
in which LPS students consistently appeared to grow relative to students outside of LPS.
However, the estimates for 2010 math are smaller than the 2013 and 2014 estimates, consistent
with the idea that post-turnaround gains break from the pre-turnaround trend.
None of our central results are sensitive to the choice of model we use to identify likely
counterfactuals for our treated students. Appendix Table A2 shows additional specifications,
using lagged test scores and attendance instead of student fixed effects, matching students to
others based on demographics and pre-turnaround test scores, and a re-estimation of Model 2 in
which we cluster standard errors at the district-by-year level given that the turnaround was a
district-wide intervention Regardless of the model and sample used, all of our estimates suggest
14"
that the turnaround had sizeable positive impacts on math achievement. Our preferred and
conservative student fixed effects model suggests that, by its second year, the turnaround had
improved LPS students’ math scores by a sizeable and statistically significant 0.29 standard
deviations when compared to other majority low-income districts. In ELA, there is no consistent
evidence of progress in year one. By the second year, the two primary models suggest modest
gains of 0.06-0.10 standard deviations. Limiting the sample to low-income districts makes the
estimates smaller across specifications, ranging from 0.02 to 0.07 standard deviations. The main
takeaway is that the turnaround had no apparent impact on ELA scores in its first year and at best
small positive impacts in its second year, on the order of 0.07 standard deviations based on our
preferred student fixed effects model and low-income sample.
Turnaround Impacts by Subgroup.
Because Lawrence has a high proportion of students learning English as a second
language and because such students traditionally underperform their peers who learned English
as a first language, we explore differences in the effect of the turnaround by first language status.
Figure 3 graphs math test scores over time by language status. We follow the Massachusetts
DESE convention and identify students whose first language was anything but English as “First
Language Not English” (FLNE) regardless of the ESL services students received. Panel A shows
a massive rise in the math scores of Lawrence’s FLNE students, so much so that they appear to
have closed the gap with FLNE students in other low-income districts. Panel B shows large math
gains for non-FLNE students as well, although breaks from prior trends are somewhat less clear.
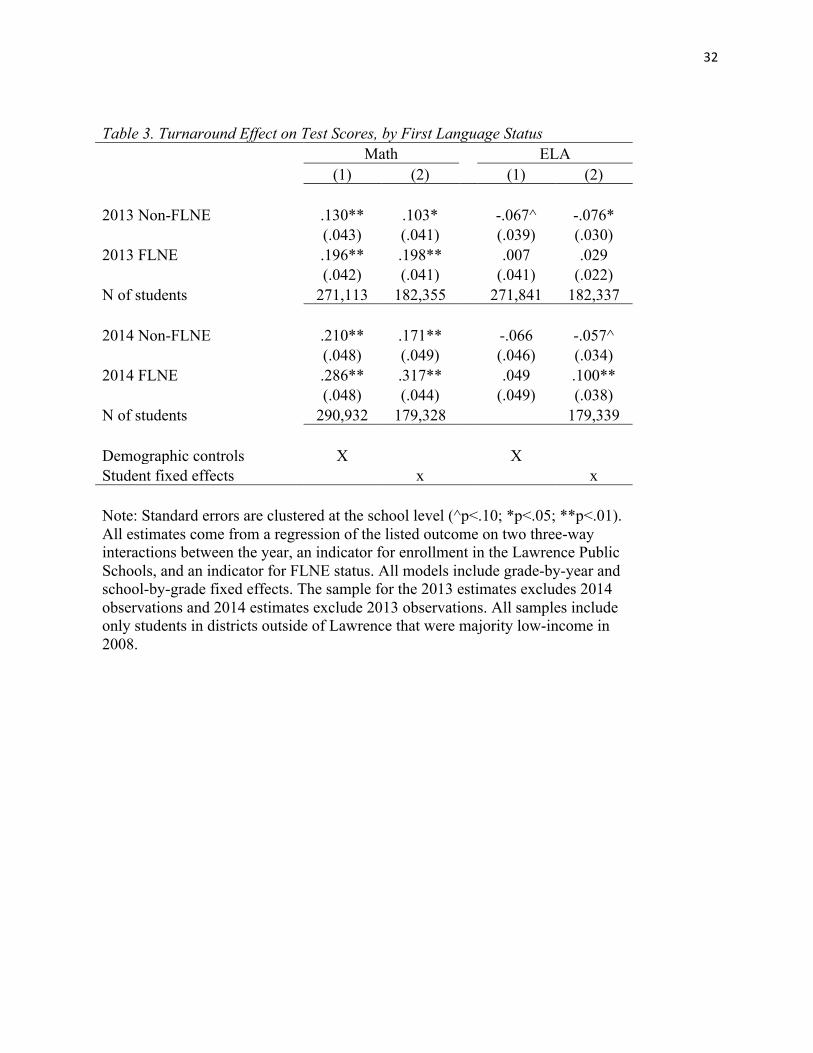
We formalize these estimates in Table 3 by interacting the differences-in-differences
specifications in models 1 and 2 with indicators for whether a student’s first language was
English. Though the subgroup estimates here differ somewhat by the model used, both models
confirm that FLNE students saw large gains in math in both years of the turnaround. The
estimates, as well as Panel A of Appendix Figure A, also suggest that FLNE students made
moderate ELA gains as a result of the turnaround. As Panel B of Appendix Figure A shows, non-
FLNE students appear to have made little progress in ELA. The turnaround is clearly benefitting
Lawrence’s FLNE students, a population of particular concern to the district and to the wider
education policy community.
15"
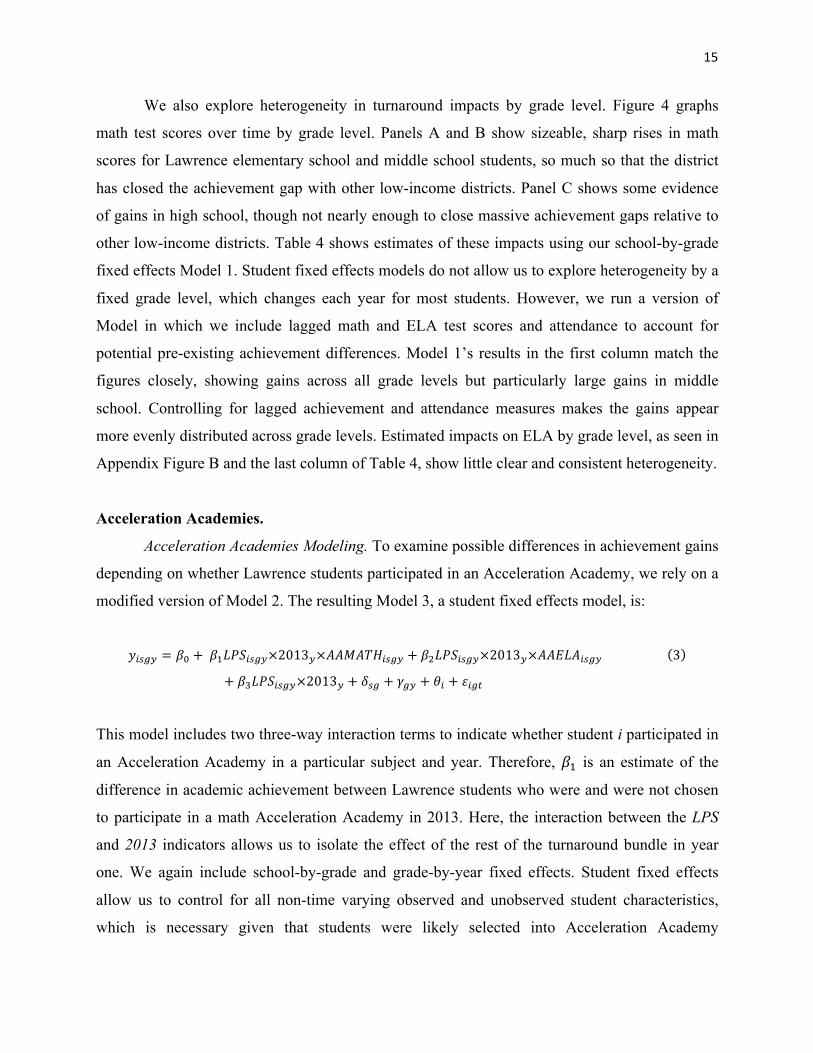
We also explore heterogeneity in turnaround impacts by grade level. Figure 4 graphs
math test scores over time by grade level. Panels A and B show sizeable, sharp rises in math
scores for Lawrence elementary school and middle school students, so much so that the district
has closed the achievement gap with other low-income districts. Panel C shows some evidence
of gains in high school, though not nearly enough to close massive achievement gaps relative to
other low-income districts. Table 4 shows estimates of these impacts using our school-by-grade
fixed effects Model 1. Student fixed effects models do not allow us to explore heterogeneity by a
fixed grade level, which changes each year for most students. However, we run a version of
Model in which we include lagged math and ELA test scores and attendance to account for
potential pre-existing achievement differences. Model 1’s results in the first column match the
figures closely, showing gains across all grade levels but particularly large gains in middle
school. Controlling for lagged achievement and attendance measures makes the gains appear
more evenly distributed across grade levels. Estimated impacts on ELA by grade level, as seen in
Appendix Figure B and the last column of Table 4, show little clear and consistent heterogeneity.
Acceleration Academies.
Acceleration Academies Modeling. To examine possible differences in achievement gains
depending on whether Lawrence students participated in an Acceleration Academy, we rely on a
modified version of Model 2. The resulting Model 3, a student fixed effects model, is:
!!"#$ = !! + !!!!"#!"#$×2013!×!!"!#$!"#$ + !!!"#!"#$×2013!×!!"#!!"#$!!!!!!!!!!!!!!!!!!!!! 3
+ !!!"#!"#$×2013! + !!" + !!" + !! + !!"#""
This model includes two three-way interaction terms to indicate whether student i participated in
an Acceleration Academy in a particular subject and year. Therefore, !! is an estimate of the
difference in academic achievement between Lawrence students who were and were not chosen
to participate in a math Acceleration Academy in 2013. Here, the interaction between the LPS
and 2013 indicators allows us to isolate the effect of the rest of the turnaround bundle in year
one. We again include school-by-grade and grade-by-year fixed effects. Student fixed effects
allow us to control for all non-time varying observed and unobserved student characteristics,
which is necessary given that students were likely selected into Acceleration Academy

16"
participation based on unobserved criteria. Again, we exclude 2014 data when estimating the
first year effects. We run a separate version of Model 3 in which we include 2014 data but omit
2013 data to compare the second year of Acceleration Academies to the pre-turnaround period.
Finally, we modify Model 3 to explore the extent to which the achievement differences
between Acceleration Academy participants and non-participants persisted beyond the year of
the intervention. We refer to this model as Model 4, which takes the following form:
!!"#$ = !! + !!!!"#!"#$×2013!×!!"!#$!"#$ + !!!"#!"#$×2013!×!!"#!!"#$!!!!!!!!!!!!!!!!!!!!! 4
+ !!!"#!"#$×2014! + !!" + !!" + !! + !!"#
There are two differences between Model 3 and 4. First, we run Model 4 excluding 2013 data in
order to estimate the relationship between 2013 Acceleration Academy participation and 2014
achievement. Second, we replace the interaction between the LPS and 2013 indicators with an
interaction between an LPS and 2014 indicator to isolate the 2013 Acceleration Academy effects
from the effects of the non-Acceleration Academy components of the turnaround in year two.
Acceleration Academy Findings. We first explore the unadjusted achievement trends for
Lawrence Acceleration Academy participants compared to non-participants within and outside of
Lawrence. Figure 6 displays MCAS scores for 2013 Academy participants and non-participants,
with the LPS sample limited to those in LPS at some point in the post-turnaround period. Panel
A illustrates that prior to the Acceleration Academies, participants outperformed non-participants
in Lawrence by roughly 0.1 standard deviations. However, participants were still behind other
Massachusetts students by about 0.2 standard deviations and their achievement trend leading up
to the Academy seems to roughly track that of Lawrence non-participants. Although participants
appear to underperform non-participants in 2008, this is due partly to the fact that relatively few
students observed in Academies were present in LPS that far back in time. In 2013, the first year
of the Acceleration Academies, participants appear to have caught up to, if not surpassed,
students in other majority low-income districts in Massachusetts. Specifically, their math scores
rose by about 0.3 standard deviations relative to the rest of the state while non-participants’ math
scores rose by a smaller, but still substantial 0.2 standard deviations. In 2014, gains appear to
continue for both groups, with gains for participants somewhat larger than for non-participants.
17"
Table 5 displays estimates generated by our student fixed effects models. Estimates in the
first column, generated using Model (3), suggest that non-participants’ 2013 math scores rose by
0.15 standard deviations, whereas Acceleration Academy participants’ scores rose by an
additional 0.16 standard deviations, for a total first-year improvement of 0.31 standard
deviations. In the second column, we present estimates based on Model (4) in which we predict
2014 outcomes based on 2013 Academy participation and include an indicator for 2014
turnaround implementation. These estimates suggest that roughly a quarter of the 2013
Acceleration Academy effect faded out by 2014, although overall turnaround effects continued
to increase. LPS students who did not participate in the 2013 math Acceleration Academy thus
showed substantial gains over the first two years of the turnaround but those who did participate
showed even larger gains.
The story is somewhat different for reading achievement. As Panel B of Figure 6 shows,
participants in 2013 ELA Acceleration Academies look generally similar in achievement to non-
participants prior to the turnaround. In the first two years of the turnaround, non-participants
show little or no gains in ELA achievement, where participants show clear gains that are even
larger in 2014. Regression estimates in the third column of Table 5 suggest that non-participants
slightly lost ground but this effect is small, non-significant and somewhat sensitive to the choice
of pre-period. Academy participants gained about 0.11 standard deviations relative to those non-
participants, for an overall first-year gain of 0.09 standard deviations. The fourth column, based
on Model (4), suggests that about half of these gains for participants persisted into 2014. Our
estimates of the persistence of 2013 Academy effects are similar when controlling for 2014
Academy participation and after excluding all 2014 Academy participants from our sample,
suggesting that the relationship between 2013 Academy participation and 2014 outcomes is not
driven by 2014 Academy participation.
We note here that our estimates of the effects of the 2013 Acceleration Academies could
in theory be biased by differential selection into participation, hence our inclusion of student
fixed effects. One indication that such controls are sufficient to largely eliminate bias in our
estimates is the fact that we observe clear positive impacts of each Acceleration Academy on its
own subject and only very small effects of each Academy on the other subject. If differential
selection were an issue here, we would expect to see similar impacts of a given Academy across
both subjects. However, we recognize that students could have been nominated based on their

18"
propensity for growth in a single subject and therefore are not able to rule out differential
selection entirely.
There are two central takeaways from these figures and tables. First, Acceleration
Academies appear to have had large positive impacts on achievement in the subjects they
focused on. Second, the other components of the LPS turnaround had large positive impacts in
math but no impact in ELA. As a result, any positive impacts in ELA appear to be driven largely
by Acceleration Academies, whereas improvements in math are generated both by the
Academies and by other district initiatives.
We repeat this analysis for the 2014 Acceleration Academies in the bottom Panel of
Table 5, with corresponding figures in Appendix Figure A. We estimate the 2014 effects using a
version of Model (3) in which we omit 2013 observations. Estimating these impacts is
complicated by the fact that 2014 participation status may be correlated with 2013 participation
status and other unobservable shocks to students in 2013. We therefore present these estimates
but are somewhat less confident in their causal interpretation. We present them in part because
LPS doubled the number of students participating, so that these estimates provide suggestive
evidence about the potential scalability of this intervention.
Participation in the 2014 math Acceleration Academy appears to boost 2014 math scores
by 0.17 standard deviations relative to the 0.20 standard deviation gain of non-participants, for
an overall gain of 0.36 standard deviations. Participation in the 2014 ELA Acceleration
Academy also appears to boost math achievement by an additional 0.12 standard deviations, a
moderate effect that could be spuriously driven by selection bias or could represent true
spillovers from the ELA preparation that precedes the math test in time. As such, we find the
estimated impacts of the 2014 math Acceleration Academy on math scores to be plausible.
Oddly, both math and ELA Acceleration academies appear to boost ELA scores in 2014 by 0.11
and .17 standard deviations, respectively. Given that ELA testing preceded math Acceleration
Academies in time, this suggests that at least some fraction of these estimated effects is driven by
selection bias. As such, we put less stock in these ELA achievement gain estimates.
The bulk of the evidence thus suggests that Acceleration Academies were an important
component of LPS’ turnaround success. Though selection issues likely create some bias in our
estimates, results from 2014 are suggestive that the positive Acceleration Academy impacts may
be scalable to a wider range of students than LPS selected in its first year of the turnaround.

19"
Impacts on Other Academic Outcomes.
We also look for possible turnaround effects on additional outcomes of interest, but find
little evidence of impact. Figure 7 shows the unadjusted days of school attendance by year for
Lawrence students compared to students in other majority low-income districts. Interestingly,
student attendance shows a large jump in the year prior to the turnaround. However, there is no
visual evidence of major differences between Lawrence and comparison districts in the post-
turnaround period. Nevertheless, we utilize Model 2, our student fixed effects model, to estimate
the turnaround effect on attendance. In Table 6 we report that Lawrence students under the
turnaround appeared to gain between three and four days in school compared to comparison
students. However, the Lawrence break from trend in 2012, prior to the turnaround, complicates
our ability to interpret this coefficient.
Similarly, in Panel A of Figure 8, we show that overall grade progression in Lawrence
does not appear to break from the upward trend in other low-income districts after turnaround
implementation. We also examine student mobility. Figure 9 shows that the probability of
remaining in the same district was already growing in Lawrence relative to other districts prior to
the turnaround, and the magnitude of change in any given year was relatively small (never larger
than 0.02 percentage points). This provides further evidence in support of our identifying
assumption that students did not respond to the takeover announcement by transferring districts.
We also test for whether the turnaround had an effect on whether a student enrolled in school
would remain in school. Figure 10 shows that the probability of remaining enrolled seemed to
have increased slightly in the year leading up to the turnaround, both overall and for the high
school subsample shown in Panel B. In Figure 11 we display the percent of 12th grade students
who graduate, conditional on having progressed to 12th grade. There does not appear to be visual
evidence of a shift in 12th grade graduation in Lawrence over the first two years of the
turnaround relative to comparison districts. In sum, we do not find convincing evidence that the
turnaround appeared to have a positive or negative effect on any of the alternative academic
outcomes we explored.
The one possible exception is grade progression among high school students. Panel B of
Figure 9 shows that prior to the turnaround, Lawrence high school students were less likely to
progress to the next grade than students in comparison districts, by a magnitude of between ten
20"
to 20 percentage points depending on the time point. In the four years leading up to the
turnaround, the trend for Lawrence students appears to track the trend for non-Lawrence
students. In 2013, the probability that Lawrence high school students progressed to the next
grade increased by about eight percentage points while the same figure increased by about two
percentage points for comparison students. This probability dipped by about two percentage
points for Lawrence students in year two of the turnaround, but they remained about five
percentage points more likely to progress than they did in 2012. We report our estimate of the
turnaround effect on grade progression with the high school sample in Table 6. These estimates
are based on Model 1, our school-by-grade model, given we are unable to utilize student fixed
effects with the high school sample alone. The first year of the turnaround appears to have made
Lawrence students about twelve percentage points more likely to progress to the next grade. By
year two, this effect was reduced slightly to ten percentage points. We further test our parallel
trends assumption by estimating turnaround effects in pre-receivership years and display the
results in Panel C of Figure 5. We do find evidence that the likelihood of progressing from one
grade to the next was already improving for Lawrence students relative to students in other
majority low-income districts in the years leading up to the turnaround. However, the magnitude
of the effects is larger in both of the post-turnaround years than in any of the years prior to
receivership. Therefore, we find suggestive evidence that the turnaround had a positive effect on
Lawrence high school students’ grade progression.
5. DISCUSSION AND CONCLUSION
Our findings illustrate that the state takeover and turnaround of the Lawrence Public
Schools has demonstrated promising early results, particularly in terms of students’ math
achievement and among the district’s large population of students with a first language other
than English. Students exposed to the first two years of the turnaround appear to have made
substantially larger math achievement gains than demographically similar students in other
majority low-income school districts across Massachusetts. In ELA, we find some evidence of
small positive effects by year two. We find suggestive evidence that the turnaround may have
increased the probability that Lawrence high school students progress from one grade to the next
and no evidence of slippage on any of the other outcomes we explored, including school
21"
attendance, overall grade progression, the likelihood of remaining enrolled in school, the
likelihood of remaining in the same district, and graduation among 12th grade students.
In both the first and second year of the turnaround, students who participated in
Acceleration Academy programs over vacation breaks made larger gains in both ELA and math
than did non-participants within and outside of Lawrence. In both years, math gains are larger
among Academy participants, but the overall math effects cannot be fully explained by Academy
participation. Gains in ELA are more fully concentrated among ELA Academy participants.
In year one, the combined average effect of Acceleration Academy participation plus the
remaining bundle of turnaround reforms was 0.31 standard deviations in math and 0.09 standard
deviations in reading. Table 7 puts the magnitude of these effects into context by comparing
them to the size of the effects found in two other studies of related interventions. The combined
effects of Acceleration Academy participation plus the rest of the Lawrence turnaround are
larger than the effects of injecting high-performing charter school practices including high
expectations, improved human capital, increased instructional time, high-dosage tutoring, and
data-driven instruction, into low-performing, traditional public schools in Houston, Texas (Fryer,
2014). Lawrence effects are somewhat smaller in ELA than, but still comparable in both subjects
to the effects of grandfathering traditional public school students into charter schools in New
Orleans and Boston (Abdulkadiroglu et al., 2014). It is also worth noting that, in contrast to New
Orleans, only three percent of Lawrence’s 2013 test-takers were in schools and grades taken over
by outside operators. Therefore, only a small fraction of the widespread achievement gains we
observe in year one are attributable to such outside operators.
Based on our year one results alone, the Acceleration Academies seem especially
effective, particularly given that they involve only one week of instruction. The district argues
that participating students receive at least 25 hours of additional instruction in a given subject
over a week, which adds up to more hours of instruction in a core subject than a student gets in a
typical month of school. Our results are therefore consistent with findings from Cook et al.
(2014), Fryer (2016) and Kraft (2015) that high-dosage tutoring appears to be a particularly
effective form of intervention with struggling students. However, Acceleration Academies may
provide a more scalable option given they involve a higher student-teacher ratio than typical
high-dosage tutoring. LPS estimates that this program costs approximately $800 per student per
week. The bulk of these funds go to teacher stipends, and the remainder pays for teacher
22"
professional development, student incentives, and student transportation. These Acceleration
Academy programs might be a useful strategy for schools looking to improve the performance of
struggling students in core content areas, regardless of whether or not their districts are pursuing
an aggressive district-wide turnaround effort.
The large body of research showing that teacher quality accounts for a larger portion of
the variation in student achievement than any other school-based factor, as well as Dee’s (2012)
and Strunk et al.’s (forthcoming) findings that turnaround schools that adopted reform models
compelling the most dramatic staff turnover produced the largest gains, may make it initially
surprising that Lawrence achieved sizeable gains while actively replacing no more than ten
percent of teachers in year one. However, Acceleration Academies could be thought of, in part,
as a human capital intervention since teachers were selected based on merit.
At the same time, it is possible that Acceleration Academy participants differed on
important unobserved dimensions that could explain, at least in part, their larger response to the
turnaround reforms. For example, we cannot rule out the possibility that these students could
have been targeted for other interventions in addition to Acceleration Academies throughout the
turnaround period. If so, our estimates would overstate the Acceleration Academy effect and our
estimate of the rest of the turnaround bundle would represent a lower bound on the impact of the
other turnaround reforms. Given the potential utility and scalability of the Acceleration
Academies, the field could benefit from new research that is able to more definitively estimate
the program’s causal effect.
It is also important to keep in mind that our results focus solely on the first two years of
the turnaround. The Receiver made additional changes in the 2015 school year including piloting
full-day Kindergarten for four-year-olds, implementing a new teacher contract that mandates
school-based teacher leadership teams (ERS, 2015), attempting to equalize funding between
schools (ERS, 2015), and creating a district-wide family engagement office (LPS, 2013). Our
focus on the early stages of the turnaround may also help to explain why we find larger effects
on some outcomes than others. For instance, it may be easier to improve math scores in one to
two years, but take longer to substantially move the needle on graduation rates.
We also find much larger effects in math than in reading, consistent with earlier research
on the impact of implementing high-performing charter school practices in low-performing
traditional public schools (Fryer, 2016) and of attending an oversubscribed charter school

23"
(Abdulkadirogˇlu et al., 2011; Angrist et al., 2010; Dobie & Fryer, 2011; Hoxby & Murarka,
2009; Gleason et al., 2010). A number of factors could explain this pattern. First, it may be that
relative to math, reading outcomes are influenced more by the home environment than school-
based interventions. Second, reading skills may take longer to develop than math skills,
consistent with our finding of no overall ELA effects until after the turnaround’s second year.
Third, improved literacy might have spillover effects on a student’s ability to effectively
complete math assessments, whereas the reverse is unlikely. Fourth, some observers have
suggested that it is uniquely difficult to make short-term progress on reading achievement with a
large population of English language learners. However, this theory is inconsistent with our
finding that Lawrence’s gains in reading were entirely concentrated among the district’s FLNE
students. Finally, it is possible that state math exams better capture growth than state reading
assessments.
Finally, we see three major questions prompted by these results. First, can subsequent
research further clarify which aspects of the turnaround efforts are responsible for the observed
positive impacts? Second, will the short-term gains we observe be sustained over time and
translate to longer-term outcomes such as college enrollment and persistence, particularly as the
receivership is phased out and local control is reinstated? Third, to what extent can the successes
in Lawrence be replicated in other districts, both in Massachusetts and the wider set of states
developing tiered accountability systems? This last question is of particular importance given
that the capacity of individual state departments of education and the characteristics of other
districts’ student populations may play a role in determining the generalizability of our findings.
Despite these open questions, this study provides an encouraging proof point that accountability-
driven improvement of chronically underperforming districts is indeed possible.
24"
REFERENCES Abdulkadiroglu, A., Angrist, J., Hull, P. & Pathak, P. (2014). Charters without lotteries: Testing
takeovers in New Orleans and Boston. NBER Working Paper 20792. Abdulkadiroglu, A., Angrist, J., Dynarski, S., Kane, T., & Pathak, P. (2011). Accountability in
public schools: Evidence from Boston’s charters and pilots. Quarterly Journal of Economics, 126, 699–748.
Angrist, J., Dynarski, S., Kane, T., Pathak, P. & Walters, C. (2010). Inputs and impacts in
charter schools: KIPP Lynn? American Economic Review, 100, 1–5. Chingos, M., Whitehurst, G., & Gallaher, M. (2015). School Districts and Student
Achievement. Education Finance and Policy 10(3): 378-398. Cook, P., Dodge, K., Farkas, G., Fryer R., Guryan, J., Ludwig, J., Mayer, S., Pollack, H. &
Steinberg, L. (2014). The (surprising) efficacy of academic and behavioral intervention with disadvantaged youth. NBER Working Paper 19862.
Dee, T. (2012). School Turnarounds: Evidence from the 2009 Stimulus. Program on Education
Policy and Governance Working Papers Series. Dobbie, W. & Fryer, R. (2011). Are high quality schools enough to increase achievement among
the poor? Evidence from the Harlem Children’s Zone,’ American Economic Journal: Applied Economics, 3, 158–187.
Education Research Services (2015). Back from the brink: Lawrence, Massachusetts. School
System 20/20 Case Study. Empower Schools (2014). Urban school reform in Lawrence Massachusetts: Pioneering the
“open architecture” model. (http://empowerschools.org/lawrence-case-study/). Fryer, R. (2014). Injecting charter school best practices into traditional public schools: Evidence
from field experiments. Quarterly Journal of Economics. doi: 10.1093/qje/qju011 Fryer, R. (2016). The Production of Human Capital in Developed Countries: Evidence from 196
Randomized Field Experiments. NBER Working Paper #22130. Gewertz, C. (2009). Duncan’s call for school turnarounds sparks debate. Education Week,
28(37). Gill, B., Zimmer, R., Christman, J., & Blanc, S. (2007). State Takeover, School Restructuring,
Private Management, and Student Achievement in Philadelphia. RAND Corporation. Gleason, P., Clark, M., Clark Tuttle, C. & Dwoyer, E. (2010). The evaluation of charter school
impacts: Final report. Washington, DC: National Center for Education and Evaluation and Regional Assistance.

25"
Harris, D. & Larsen, M. (2016). The Effects of the New Orleans Post-Katrina School Reforms on Student Academic Outcomes. Tulane University, Education Research Alliance for New Orleans.
Heissel, J. & Ladd, H. (2016). School Turnaround in North Carolina: A Regression Discontinuity
Analysis. National Center for Analysis of Longitudinal Data Working Paper 156. Honig, M. (2013). From tinkering to transformation: Strengthening school district central office
performance. Education Outlook. American Enterprise Institute. Hoxby, C., & Murarka, S. (2009). Charter schools in New York City: Who enrolls and
how they affect their students’ achievement,’’ NBER Working Paper No. w14852, 2009. Johnson, S.M., Marietta, G., Higgins, M., Mapp, K. & Grossman, A. (2015). Achieving
coherence in district improvement. Cambridge, MA: Harvard Education Press. Kraft, M.A. (2015). How to make additional time matter: Extending the school day for
individualized tutorials. Education Finance and Policy. 10(1), 81-116. LPS (2013). Professional compensation system. (https://vimeo.com/63110985). Massachusetts DESE (2015). Lawrence: Total Expenditure Per Pupil, All Funds, By Function. Smarick, A. (2010). Toothless reform. Education Next, 10(2), pp. 15-22. Strunk, K. O., Marsh, J. A., Hashim, A., Bush, S., & Weinstein, T. (2016). The Impact of
Turnaround Reform on Student Outcomes: Evidence and Insights from the Los Angeles Unified School District. Education Finance and Policy, 11(3), pp. 251-282.
Supovitz, J. (2006). The case for district-based reform: Leading, building and sustaining school
improvement. Cambridge, MA: Harvard Education Press. U.S. Census (2015). State and County Quickfacts: Lawrence, Massachusetts. U.S. Department of Education (2012). Turning around the lowest-performing schools.
(http://www2.ed.gov/policy/elsec/guid/esea-flexibility/resources/turn-around.pdf). Wong, K. & Shen, F. (2002). Politics of state-led reform in education: market competition and
electoral dynamics. Educational Policy, 16: 161. Zavadsky, H. (2013). Scaling turnaround. Washington, D.C.: American Enterprise Institute. Zimmer, R., Kho, A., Henry, G. and Viano, S. (2015). Evaluation of the Effects of Tennessee’s
Achievement School District on Student Test Scores. Tennessee Consortium on Research, Evaluation and Development.

26#
Year 1 (2012-13) Year 2 (2013-14)
Higher Expectations
Announced performance targets: 1) Double the number of schools with Student Growth Percentiles greater than 50 in year 1 2) Move from 22nd to top 5 MA Gateway districts in ELA and math proficiency and graduation by year 3 3) Close gap with the rest of the State in ELA and math proficiency and graduation within 5-7 years
Autonomy & Accountability
Increased school autonomy, but differentiated levels based on prior performance
Gave management of one full grade level at 3 schools to independent operators
Independent operators expanded to serve additional grades and schools
Independent operator opened new alternative high school focused on dropout recovery and prevention
Lawrence Teachers Union took over management of one elementary school
Central office budget reduced by 25%
Learning Time
At "Acceleration Academies," select teachers provided 1,800 struggling students ELA or math instruction in small groups over week-long vacation breaks
Doubled participation in Acceleration Academies
Built out extracurricular offerings Built out extracurricular offerings further School year expanded at least 200 hours for grades 1-8 MATCH Education provided math tutoring to 550 9th-10th graders at two schools
Data Use Achievement Network worked with 9 schools to train educators on using data to improve instruction
Achievement Network expanded to work with 85% of K-8 schools
Human Capital
Replaced 36% of principals, 20% of assistant principals and 10% of teachers
Replaced another 20% of principals
New teacher compensation system with career ladder, performance pay, stipends for ELT and leadership.
Figure 1. Components of the Turnaround Strategy by Year
27#
Table 1. Sample Characteristics
Pre-Receivership (2008-2012) Post-Receivership (2013-2014)
Lawrence
Rest of MA
Low-income Lawrence
Rest of MA
Low-income
Female .47 .49 .48
.47 .49 .48 FRPL .90 .33 .75
.92 .37 .78
White .07 .70 .31
.06 .67 .28 Black .02 .09 .22
.02 .09 .22
Hispanic .89 .13 .34
.89 .15 .37 Asian .02 .05 .07
.02 .06 .07
Other .01 .03 .05
.02 .04 .06 FLNE .82 .17 .40
.77 .19 .43
LEP .38 .10 .24
.50 .13 .31 SPED .26 .24 .26
.24 .24 .25
ELA Score -.74 .01 -.52
-.72 .01 -.49 Math Score -.76 .02 -.47
-.51 .01 -.43
N of students 20,777 1,279,546 361,546
14,975 979,091 266,072
N of districts 1 405 59 1 409 56
Note: All cells represent averages over multiple years. Demographic indicators are constant within student over time. The low-income sample includes students in districts outside of Lawrence that were majority low-income in 2008.
28#
Figure 2. Overall Mean Math and ELA MCAS Scores
-.8-.7
-.6-.5
-.4St
anda
rdiz
ed R
aw S
core
s
2008 2009 2010 2011 2012 2013 2014
Majority Low-income Districts Lawrence
Lawrence vs. Majority Low-income DistrictsPanel A: Unadjusted Average Math MCAS Scores
-.8-.7
-.6-.5
-.4St
anda
rdiz
ed R
aw S
core
s
2008 2009 2010 2011 2012 2013 2014
Majority Low-income Districts Lawrence
Lawrence vs. Majority Low-income DistrictsPanel B: Unadjusted Average ELA MCAS Scores

29#
Table 2. Turnaround Effect on Test Scores
Full Sample
Low-income Sample
(1) (2) (1) (2)
2013 Math .203** .184**
.182** .180**
(.041) (.036)
(.041) (.040)
N of students 981,333 707,196 271,113 182,355
2014 Math .305** .297**
.268** .288**
(.046) (.040)
(.047) (.044)
N of students 1,051,409 702,183 290,932 179,328
2013 ELA .011 .030
-.009 .008
(.038) (.022)
(.039) (.022)
N of students 982,722 707,598 271,841 182,337
2014 ELA .060 .097**
.022 .068^
(.047) (.033)
(.046) (.036)
N of students 1,052,560 702,666 291,604 179,339
Demographic controls X
x Student fixed effects
x
x
Note: Standard errors are clustered at the school level (^p<.10; *p<.05; **p<.01). All estimates come from a regression of the listed outcome on an interaction between the year and an indicator for enrollment in LPS. All models include grade-by-year and school-by-grade fixed effects. For 2014 estimates, we use 2012 values for lagged test scores and attendance. The sample for the 2013 estimates excludes 2014 observations and 2014 estimates exclude 2013 observations. The low-income sample includes students in districts outside of LPS that were majority low-income in 2008.

30#
Figure 3. Mean Math MCAS Scores by First Language Status
Figure 4. Mean Math MCAS Scores by Grade Level
-.5-.6
-.7-.8
-.9St
anda
rdiz
ed M
CAS
Sco
res
2008 2009 2010 2011 2012 2013 2014Spring of School Year
Majority Low-Income Districts LPS
Lawrence vs. Majority Low-Income DistrictsPanel A: Unadjusted Math Scores: FLNE Students
-.2-.3
-.4-.5
-.6St
anda
rdiz
ed M
CAS
Sco
res
2008 2009 2010 2011 2012 2013 2014Spring of School Year
Majority Low-Income Districts LPS
Lawrence vs. Majority Low-Income DistrictsPanel B: Unadjusted Math Scores: Non-FLNE Students
-.3-.4
-.5-.6
-.7St
anda
rdiz
ed M
CAS
Sco
res
2008 2009 2010 2011 2012 2013 2014Spring of School Year
Majority Low-Income Districts LPS
Lawrence vs. Majority Low-Income DistrictsPanel A: Unadjusted Math Scores: Elementary School
-.4-.5
-.6-.7
-.8-.9
Stan
dard
ized
MC
AS S
core
s
2008 2009 2010 2011 2012 2013 2014Spring of School Year
Majority Low-Income Districts LPS
Lawrence vs. Majority Low-Income DistrictsPanel B: Unadjusted Math Scores: Middle School
-.4-.5
-.6-.7
-.8-.9
-1-1
.1-1
.2St
anda
rdiz
ed M
CAS
Sco
res
2008 2009 2010 2011 2012 2013 2014Spring of School Year
Majority Low-Income Districts LPS
Lawrence vs. Majority Low-Income DistrictsPanel C: Unadjusted Math Scores: High School
31#
Figure 5. Pre-Turnaround Effects on Test Scores and High School Grade Progression
0.1
.2.3
.4C
oeffi
cien
t
2009 2010 2011 2012 2013 2014
Panel A: Math MCAS Scores
0.1
.2.3
.4C
oeffi
cien
t
2009 2010 2011 2012 2013 2014
Panel B: ELA MCAS Scores
0.0
5.1
.15
.2.2
5C
oeffi
cien
t
2009 2010 2011 2012 2013 2014
Panel C: High School Grade Progression
Note: Standard errors are clustered at the school level. Estimates come from a regression of the listed outcome on interactions between the year and an indicator for enrollment in LPS. All models include grade-by-year and school-by-grade fixed effects and demographic controls. The sample includes students in districts that were majority low-income in 2008.
Pre-Turnaround Effects
32#
Table 3. Turnaround Effect on Test Scores, by First Language Status
Math
ELA
(1) (2) (1) (2)
2013 Non-FLNE .130** .103*
-.067^ -.076*
(.043) (.041)
(.039) (.030)
2013 FLNE .196** .198**
.007 .029
(.042) (.041)
(.041) (.022)
N of students 271,113 182,355
271,841 182,337
2014 Non-FLNE .210** .171**
-.066 -.057^
(.048) (.049)
(.046) (.034)
2014 FLNE .286** .317**
.049 .100**
(.048) (.044)
(.049) (.038)
N of students 290,932 179,328 179,339
Demographic controls X
X Student fixed effects
x
x
Note: Standard errors are clustered at the school level (^p<.10; *p<.05; **p<.01). All estimates come from a regression of the listed outcome on two three-way interactions between the year, an indicator for enrollment in the Lawrence Public Schools, and an indicator for FLNE status. All models include grade-by-year and school-by-grade fixed effects. The sample for the 2013 estimates excludes 2014 observations and 2014 estimates exclude 2013 observations. All samples include only students in districts outside of Lawrence that were majority low-income in 2008.
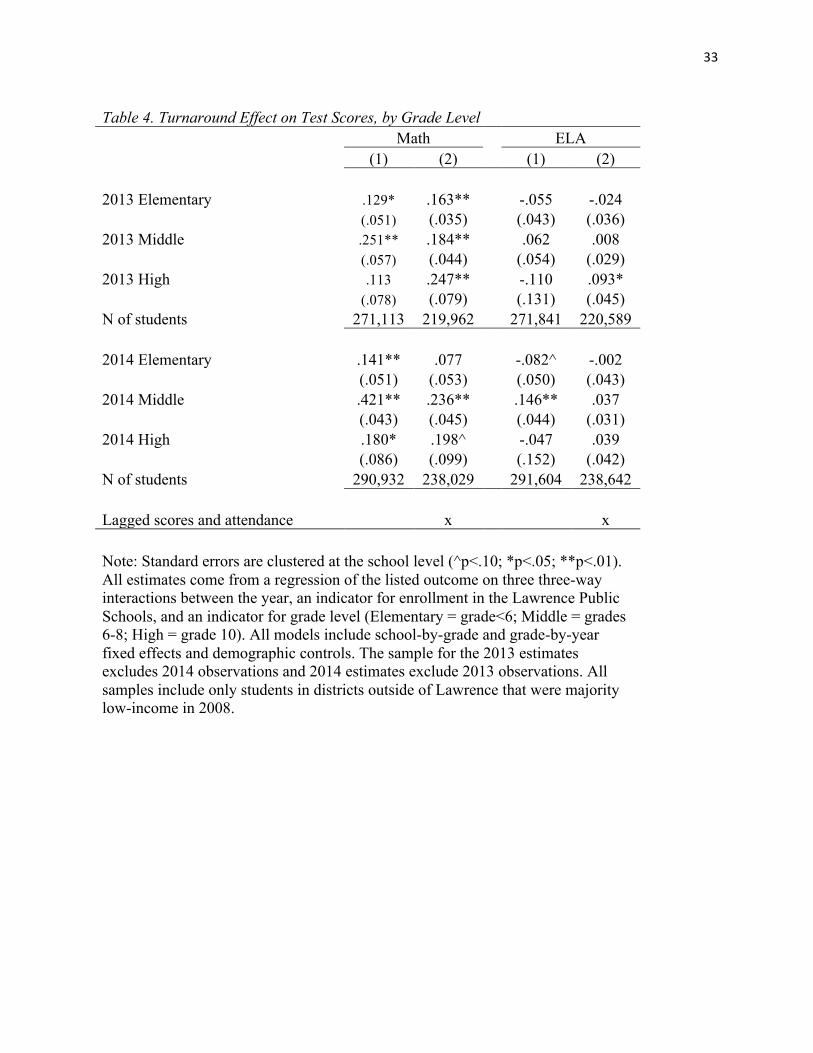
33#
Table 4. Turnaround Effect on Test Scores, by Grade Level
Math ELA
(1) (2) (1) (2)
2013 Elementary .129* .163**
-.055 -.024
(.051) (.035)
(.043) (.036)
2013 Middle .251** .184**
.062 .008
(.057) (.044)
(.054) (.029)
2013 High .113 .247**
-.110 .093*
(.078) (.079)
(.131) (.045)
N of students 271,113 219,962 271,841 220,589
2014 Elementary .141** .077
-.082^ -.002
(.051) (.053)
(.050) (.043)
2014 Middle .421** .236**
.146** .037
(.043) (.045)
(.044) (.031)
2014 High .180* .198^
-.047 .039
(.086) (.099)
(.152) (.042)
N of students 290,932 238,029 291,604 238,642
Lagged scores and attendance x x
Note: Standard errors are clustered at the school level (^p<.10; *p<.05; **p<.01). All estimates come from a regression of the listed outcome on three three-way interactions between the year, an indicator for enrollment in the Lawrence Public Schools, and an indicator for grade level (Elementary = grade<6; Middle = grades 6-8; High = grade 10). All models include school-by-grade and grade-by-year fixed effects and demographic controls. The sample for the 2013 estimates excludes 2014 observations and 2014 estimates exclude 2013 observations. All samples include only students in districts outside of Lawrence that were majority low-income in 2008.
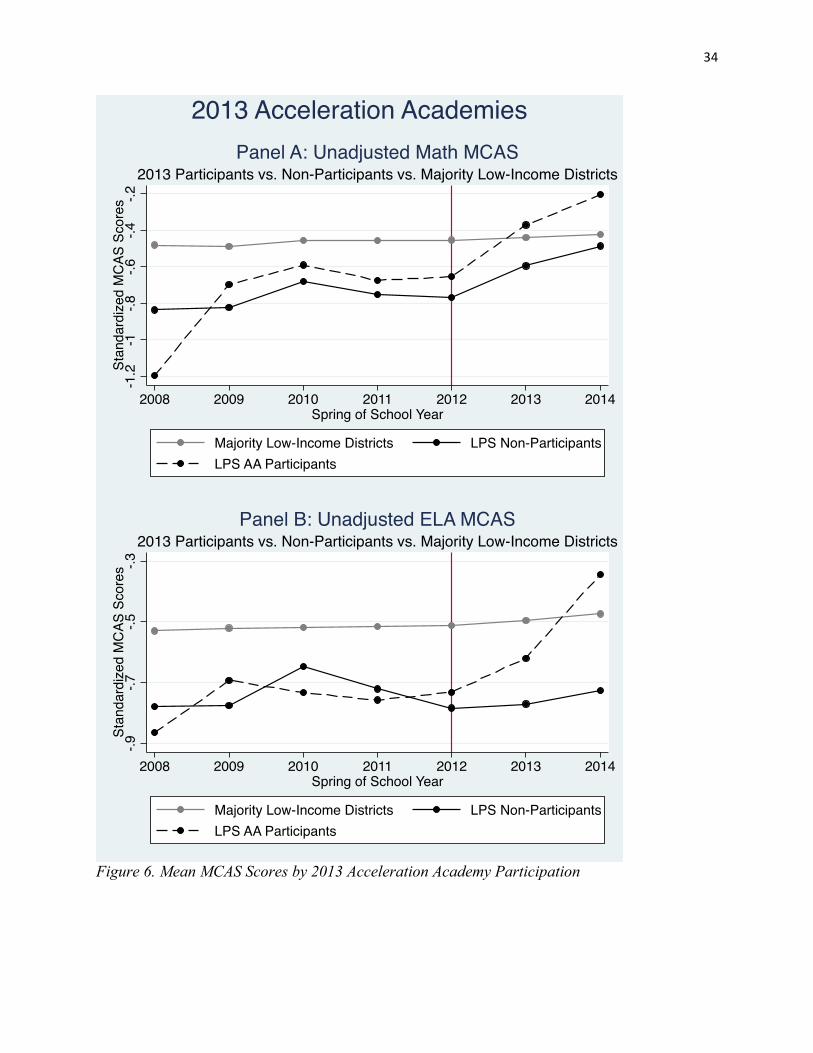
34#
Figure 6. Mean MCAS Scores by 2013 Acceleration Academy Participation
-.2-.4
-.6-.8
-1-1
.2Stan
dard
ized
MC
AS S
core
s
2008 2009 2010 2011 2012 2013 2014Spring of School Year
Majority Low-Income Districts LPS Non-ParticipantsLPS AA Participants
2013 Participants vs. Non-Participants vs. Majority Low-Income DistrictsPanel A: Unadjusted Math MCAS
-.3-.5
-.7-.9
Stan
dard
ized
MC
AS S
core
s
2008 2009 2010 2011 2012 2013 2014Spring of School Year
Majority Low-Income Districts LPS Non-ParticipantsLPS AA Participants
2013 Participants vs. Non-Participants vs. Majority Low-Income DistrictsPanel B: Unadjusted ELA MCAS
2013 Acceleration Academies
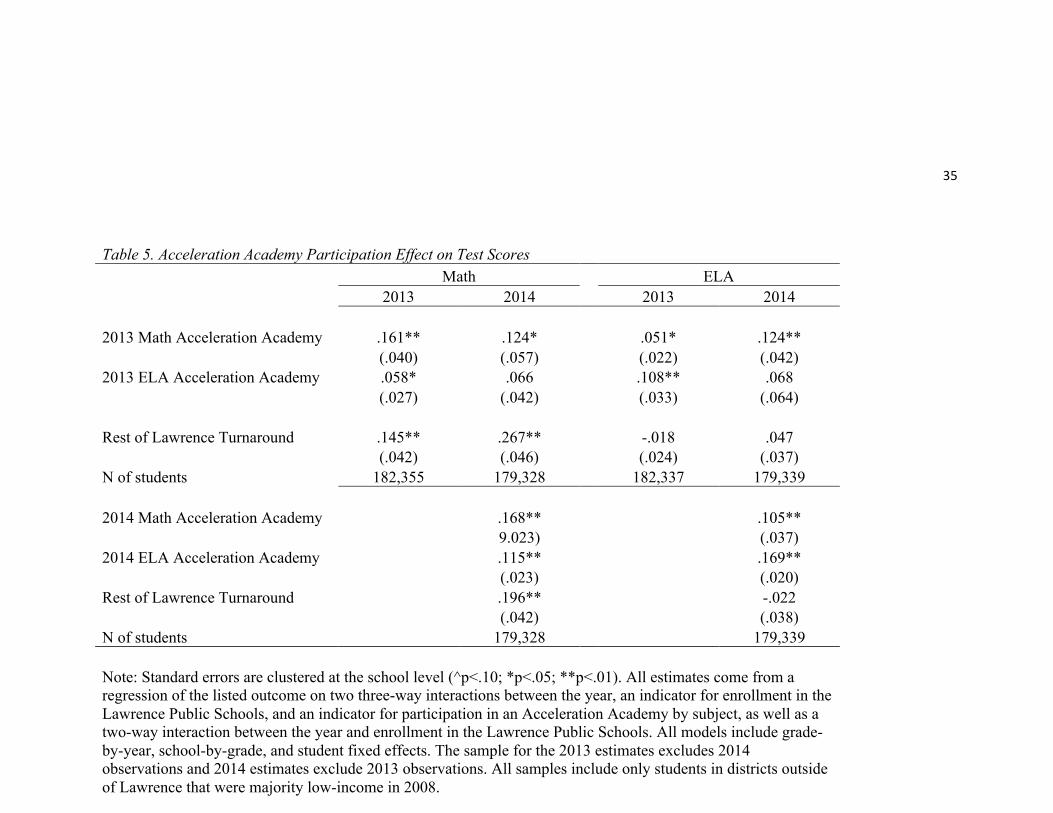
35#
Table 5. Acceleration Academy Participation Effect on Test Scores
Math ELA
2013 2014 2013 2014
2013 Math Acceleration Academy .161** .124*
.051* .124**
(.040) (.057)
(.022) (.042)
2013 ELA Acceleration Academy .058* .066
.108** .068
(.027) (.042)
(.033) (.064)
Rest of Lawrence Turnaround .145** .267**
-.018 .047
(.042) (.046)
(.024) (.037)
N of students 182,355 179,328 182,337 179,339
2014 Math Acceleration Academy
.168**
.105**
9.023)
(.037)
2014 ELA Acceleration Academy
.115**
.169**
(.023)
(.020)
Rest of Lawrence Turnaround
.196**
-.022
(.042)
(.038)
N of students 179,328 179,339
Note: Standard errors are clustered at the school level (^p<.10; *p<.05; **p<.01). All estimates come from a regression of the listed outcome on two three-way interactions between the year, an indicator for enrollment in the Lawrence Public Schools, and an indicator for participation in an Acceleration Academy by subject, as well as a two-way interaction between the year and enrollment in the Lawrence Public Schools. All models include grade-by-year, school-by-grade, and student fixed effects. The sample for the 2013 estimates excludes 2014 observations and 2014 estimates exclude 2013 observations. All samples include only students in districts outside of Lawrence that were majority low-income in 2008.

36#
Figure 7. Overall Mean Days in Attendance
Figure 8. Percent of Students Making Grade Progress, Overall and Among High School Students
165
160
155
Day
s in
Atte
ndan
ce
2008 2009 2010 2011 2012 2013 2014Spring of School Year
Majority Low-Income Districts LPS
Lawrence vs. Majority Low-Income DistrictsUnadjusted Days in Attendance
.9.8
5.8
Perc
ent P
rogr
ess
2008 2009 2010 2011 2012 2013 2014Spring of School Year
Majority Low-Income Districts LPS
Lawrence vs. Majority Low-Income DistrictsPanel A: Unadjusted Grade Progression
.85
.8.7
5.7
.65
.6.5
5Pe
rcen
t Pro
gres
s
2008 2009 2010 2011 2012 2013 2014Spring of School Year
Majority Low-Income Districts LPS
Lawrence vs. Majority Low-Income DistrictsPanel B: Unadjusted Grade Progression: High School

37#
Figure 9. Overall Percent of Students Remaining in the Same District
Figure 11. Overall Graduate Rate among 12th Grade Students
Figure 10. Overall Percent of Students Remaining Enrolled in School
.88
.87
.86
.85
.84
.83
Perc
ent R
emai
ned
in D
istri
ct
2008 2009 2010 2011 2012 2013 2014Spring of School Year
Majority Low-Income Districts LPS
Lawrence vs. Majority Low-Income DistrictsUnadjusted Remained in Same District
.8.7
.6.5
Perc
ent G
radu
ate
2008 2009 2010 2011 2012 2013 2014Spring of School Year
Majority Low-Income Districts LPS
Lawrence vs. Majority Low-Income DistrictsUnadjusted Graduation: 12th Grade
.95
.93
.91
Perc
ent R
emai
ned
Enro
lled
2008 2009 2010 2011 2012 2013 2014Spring of School Year
Majority Low-Income Districts LPS
Lawrence vs. Majority Low-Income DistrictsPanel A: Unadjusted Remained Enrolled in School
.9.8
8.8
6.8
4.8
2.8
Perc
ent R
emai
ned
Enro
lled
2008 2009 2010 2011 2012 2013 2014Spring of School Year
Majority Low-Income Districts LPS
Lawrence vs. Majority Low-Income DistrictsPanel B: Unadjusted Remained Enrolled: High School
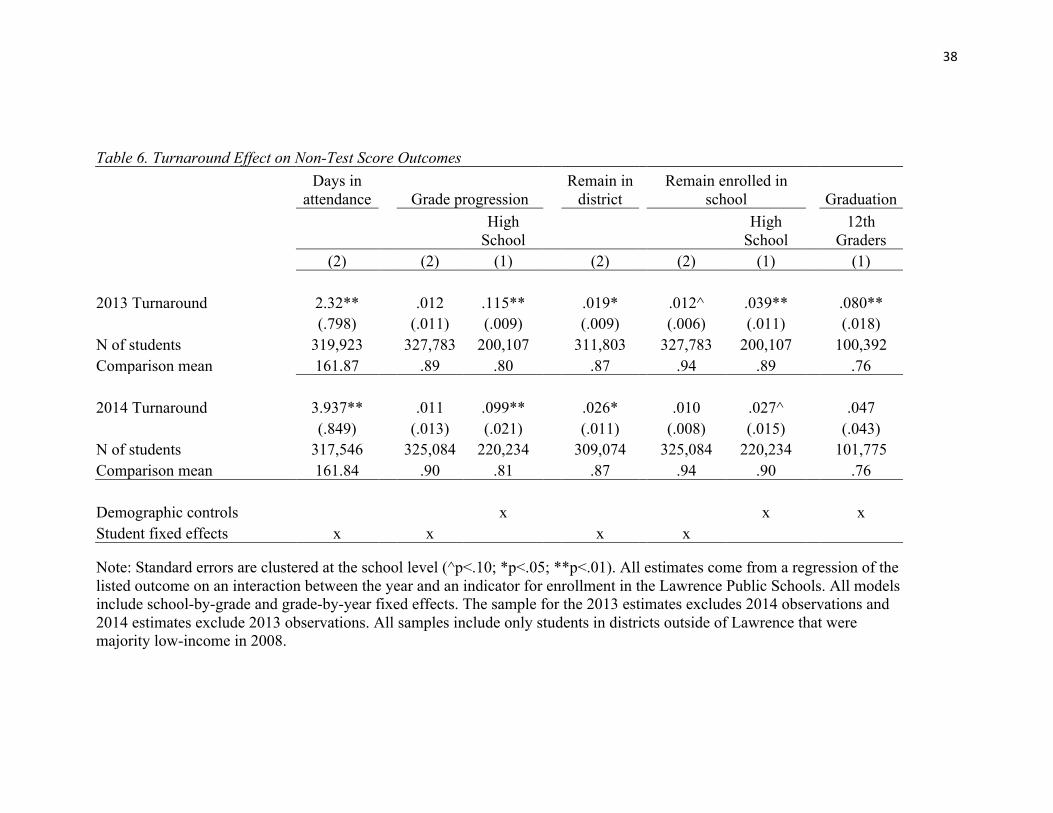
38#
Table 6. Turnaround Effect on Non-Test Score Outcomes
Days in attendance Grade progression
Remain in district
Remain enrolled in school Graduation
High School
High School
12th Graders
(2) (2) (1) (2) (2) (1) (1)
2013 Turnaround 2.32**
.012 .115**
.019*
.012^ .039**
.080**
(.798)
(.011) (.009)
(.009)
(.006) (.011)
(.018)
N of students 319,923
327,783 200,107
311,803
327,783 200,107
100,392 Comparison mean 161.87 .89 .80 .87 .94 .89 .76
2014 Turnaround 3.937**
.011 .099**
.026*
.010 .027^
.047
(.849)
(.013) (.021)
(.011)
(.008) (.015)
(.043)
N of students 317,546
325,084 220,234
309,074
325,084 220,234
101,775 Comparison mean 161.84 .90 .81 .87 .94 .90 .76
Demographic controls
x
x
x Student fixed effects x x x x
Note: Standard errors are clustered at the school level (^p<.10; *p<.05; **p<.01). All estimates come from a regression of the listed outcome on an interaction between the year and an indicator for enrollment in the Lawrence Public Schools. All models include school-by-grade and grade-by-year fixed effects. The sample for the 2013 estimates excludes 2014 observations and 2014 estimates exclude 2013 observations. All samples include only students in districts outside of Lawrence that were majority low-income in 2008.

39#
Table 7. Comparing Lawrence 2013 Turnaround Effect Magnitudes to Other Educational Interventions
Study Authors
Fryer (2014)
Abdulkadiroglu et al. (2014)
Intervention Acceleration Academies
Rest of Turnaround
Total Effect of Acceleration
Academies and Rest of
Turnaround
Injecting Charter
Practices into Traditional
Public Schools
Grandfathering Traditional Public School
Students Into Charter Schools
Location Lawrence
Houston New Orleans Boston
Math Effects .16 sd .15 sd .31 sd
.15 to .18 sd
0.21 0.32 ELA Effects .11 sd -.02 sd .09 sd .02 sd
0.14 0.39
Note: Lawrence effects are based on 2013 estimates provided in Table 5.
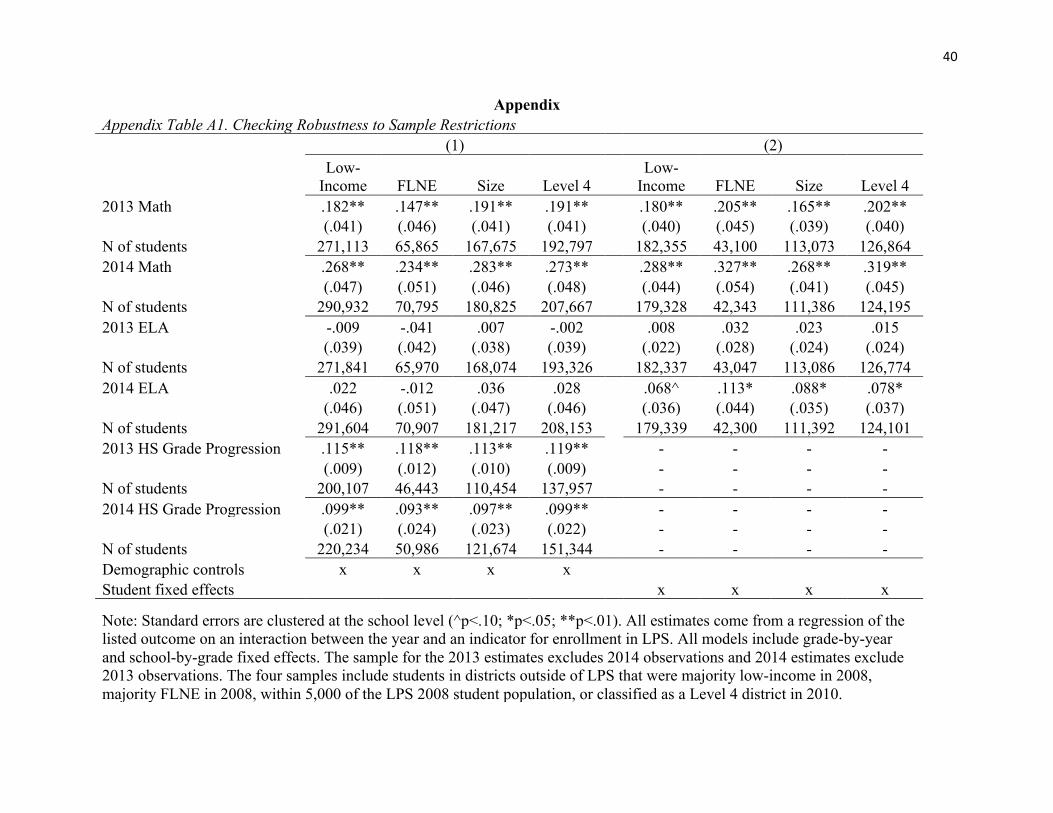
40#
Appendix Appendix Table A1. Checking Robustness to Sample Restrictions
(1) (2)
Low-Income FLNE Size Level 4
Low-Income FLNE Size Level 4
2013 Math .182** .147** .191** .191** .180** .205** .165** .202**
(.041) (.046) (.041) (.041)
(.040) (.045) (.039) (.040)
N of students 271,113 65,865 167,675 192,797 182,355 43,100 113,073 126,864 2014 Math .268** .234** .283** .273**
.288** .327** .268** .319**
(.047) (.051) (.046) (.048)
(.044) (.054) (.041) (.045)
N of students 290,932 70,795 180,825 207,667
179,328 42,343 111,386 124,195 2013 ELA -.009 -.041 .007 -.002 .008 .032 .023 .015
(.039) (.042) (.038) (.039)
(.022) (.028) (.024) (.024)
N of students 271,841 65,970 168,074 193,326 182,337 43,047 113,086 126,774 2014 ELA .022 -.012 .036 .028
.068^ .113* .088* .078*
(.046) (.051) (.047) (.046)
(.036) (.044) (.035) (.037)
N of students 291,604 70,907 181,217 208,153
179,339 42,300 111,392 124,101 2013 HS Grade Progression .115** .118** .113** .119**
- - - -
(.009) (.012) (.010) (.009)
- - - -
N of students 200,107 46,443 110,454 137,957 - - - - 2014 HS Grade Progression .099** .093** .097** .099**
- - - -
(.021) (.024) (.023) (.022)
- - - -
N of students 220,234 50,986 121,674 151,344 - - - - Demographic controls x x x x
Student fixed effects x x x x
Note: Standard errors are clustered at the school level (^p<.10; *p<.05; **p<.01). All estimates come from a regression of the listed outcome on an interaction between the year and an indicator for enrollment in LPS. All models include grade-by-year and school-by-grade fixed effects. The sample for the 2013 estimates excludes 2014 observations and 2014 estimates exclude 2013 observations. The four samples include students in districts outside of LPS that were majority low-income in 2008, majority FLNE in 2008, within 5,000 of the LPS 2008 student population, or classified as a Level 4 district in 2010.
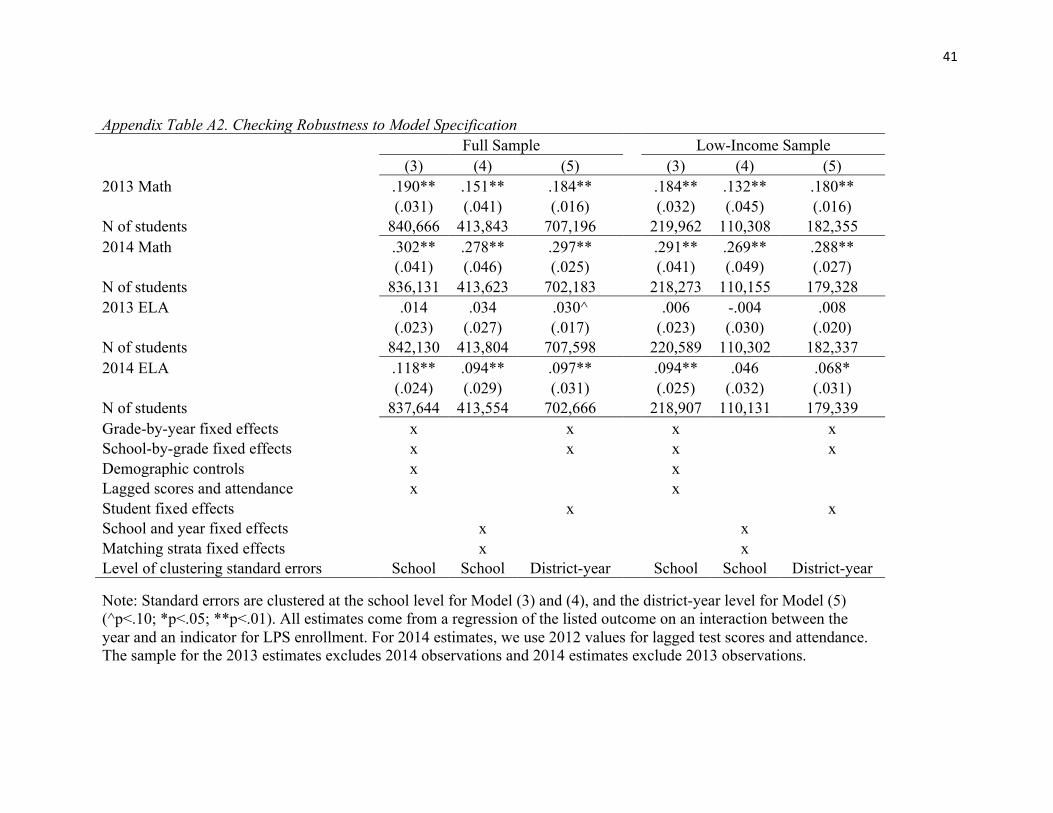
41#
Appendix Table A2. Checking Robustness to Model Specification
Full Sample
Low-Income Sample
(3) (4) (5) (3) (4) (5)
2013 Math .190** .151** .184**
.184** .132** .180**
(.031) (.041) (.016)
(.032) (.045) (.016)
N of students 840,666 413,843 707,196
219,962 110,308 182,355 2014 Math .302** .278** .297** .291** .269** .288**
(.041) (.046) (.025)
(.041) (.049) (.027)
N of students 836,131 413,623 702,183 218,273 110,155 179,328 2013 ELA .014 .034 .030^
.006 -.004 .008
(.023) (.027) (.017)
(.023) (.030) (.020)
N of students 842,130 413,804 707,598
220,589 110,302 182,337 2014 ELA .118** .094** .097** .094** .046 .068*
(.024) (.029) (.031)
(.025) (.032) (.031)
N of students 837,644 413,554 702,666 218,907 110,131 179,339 Grade-by-year fixed effects x
x
x
x
School-by-grade fixed effects x
x
x
x Demographic controls x
x
Lagged scores and attendance x
x Student fixed effects
x
x
School and year fixed effects
x
x Matching strata fixed effects
x
x
Level of clustering standard errors School School District-year School School District-year
Note: Standard errors are clustered at the school level for Model (3) and (4), and the district-year level for Model (5) (^p<.10; *p<.05; **p<.01). All estimates come from a regression of the listed outcome on an interaction between the year and an indicator for LPS enrollment. For 2014 estimates, we use 2012 values for lagged test scores and attendance. The sample for the 2013 estimates excludes 2014 observations and 2014 estimates exclude 2013 observations.

42#
Appendix Figure A. Mean MCAS Scores by 2014 Acceleration Academy Participation
Appendix Figure B. Mean ELA MCAS Scores by First Language Status
-.3-.5
-.7-.9
-1.1St
anda
rdiz
ed M
CAS
Sco
res
2008 2009 2010 2011 2012 2013 2014Spring of School Year
Majority Low-Income Districts LPS Non-ParticipantsLPS AA Participants
2014 Participants vs. Non-Participants vs. Majority Low-Income DistrictsPanel A: Unadjusted Math MCAS
-.4-.6
-.8St
anda
rdiz
ed M
CAS
Sco
res
2008 2009 2010 2011 2012 2013 2014Spring of School Year
Majority Low-Income Districts LPS Non-ParticipantsLPS AA Participants
2014 Participants vs. Non-Participants vs. Majority Low-Income DistrictsPanel B: Unadjusted ELA MCAS
2014 Acceleration Academies
-.5-.6
-.7-.8
-.9St
anda
rdiz
ed M
CAS
Sco
res
2008 2009 2010 2011 2012 2013 2014Spring of School Year
Majority Low-Income Districts LPS
Lawrence vs. Majority Low-Income DistrictsPanel A: Unadjusted ELA Scores: FLNE Students
-.2-.3
-.4-.5
-.6St
anda
rdiz
ed M
CAS
Sco
res
2008 2009 2010 2011 2012 2013 2014Spring of School Year
Majority Low-Income Districts LPS
Lawrence vs. Majority Low-Income DistrictsPanel B: Unadjusted ELA Scores: Non-FLNE Students

43#
Appendix Figure C. Mean ELA MCAS Scores by Grade Level
Appendix Figure D. Overall Percent of Students Taking the MCAS Exam
-.4-.5
-.6-.7
Stan
dard
ized
MC
AS S
core
s
2008 2009 2010 2011 2012 2013 2014Spring of School Year
Majority Low-Income Districts LPS
Lawrence vs. Majority Low-Income DistrictsUnadjusted ELA MCAS Scores: Elementary School
-.5-.6
-.7-.8
Stan
dard
ized
MC
AS S
core
s
2008 2009 2010 2011 2012 2013 2014Spring of School Year
Majority Low-Income Districts LPS
Lawrence vs. Majority Low-Income DistrictsUnadjusted ELA MCAS Scores: Middle School
-.4-.5
-.6-.7
-.8-.9
-1-1
.1-1
.2-1
.3St
anda
rdiz
ed M
CAS
Sco
res
2008 2009 2010 2011 2012 2013 2014Spring of School Year
Majority Low-Income Districts LPS
Lawrence vs. Majority Low-Income DistrictsUnadjusted ELA MCAS Scores: High School
.9.8
5.8
Perc
ent T
ook
MC
AS
2008 2009 2010 2011 2012 2013 2014Spring of School Year
Majority Low-Income Districts LPS
Lawrence vs. Majority Low-Income DistrictsUnadjusted Took Math MCAS
.9.8
5.8
Perc
ent T
ook
MC
AS
2008 2009 2010 2011 2012 2013 2014Spring of School Year
Majority Low-Income Districts LPS
Lawrence vs. Majority Low-Income DistrictsUnadjusted Took ELA MCAS