Cameroon Economic Update No.2, July 2011
23
CAMEROON ECONOMIC UPDATE July 2011 l Issue No.2 TOWARDS BETTER SERVICE DELIVERY AN ECONOMIC UPDATE ON CAMEROON With a Focus on Fiscal Decentralization Poverty Reduction and Economic Management Unit Africa Region
-
Upload
world-bank-cameroon -
Category
Documents
-
view
215 -
download
0
Transcript of Cameroon Economic Update No.2, July 2011

8/22/2019 Cameroon Economic Update No.2, July 2011
http://slidepdf.com/reader/full/cameroon-economic-update-no2-july-2011 1/23
CAMEROON ECONOMIC UPDATE
July 2011 l Issue No.2
TOWARDS BETTER SERVICE DELIVERY
AN ECONOMIC UPDATE ON CAMEROON
With a Focus on Fiscal Decentralization
Poverty Reduction and Economic Management Unit Africa Region

8/22/2019 Cameroon Economic Update No.2, July 2011
http://slidepdf.com/reader/full/cameroon-economic-update-no2-july-2011 2/23
July 2011
Towards Better Service DeliveryAn Economic Update on Cameroon
With a focus on fiscal decentralization
Poverty Reduction and Economic Management Unit Africa Region

8/22/2019 Cameroon Economic Update No.2, July 2011
http://slidepdf.com/reader/full/cameroon-economic-update-no2-july-2011 3/23
Table of Contents
ABBREVIATIONS AND ACRONYMS ....................................................................................I
TOWARDS BETTER SERVICE DELIVERY .............................................................................. 2
Introduction ...................................................................................................................................... 2
Recent Economic Developments ...................................................................................................... 3
Outlook 2011 .................................................................................................................................... 6
Fiscal Decentralization – Opportunities and Challenges .................................................................. 8
Figures
Figure 1 : Sectoral Contributions to GDP Growth, 2005-10 (in percent) ............................................. 3
Figure 2 : Oil Production, 2002-10 (in mn barrels)............................................................................... 4
Figure 3 : Inflation Developments in Major Cities ............................................................................... 5
Figure 4 : Inflation Drivers in Major Cities (in percent) ........................................................................ 5
Figure 5 : Total Public Debt, 2004-10 (in percent of GDP) ................................................................... 6
Figure 6 : Non-Oil Revenue, 2005-11 (in percent of non-oil GDP) ....................................................... 7
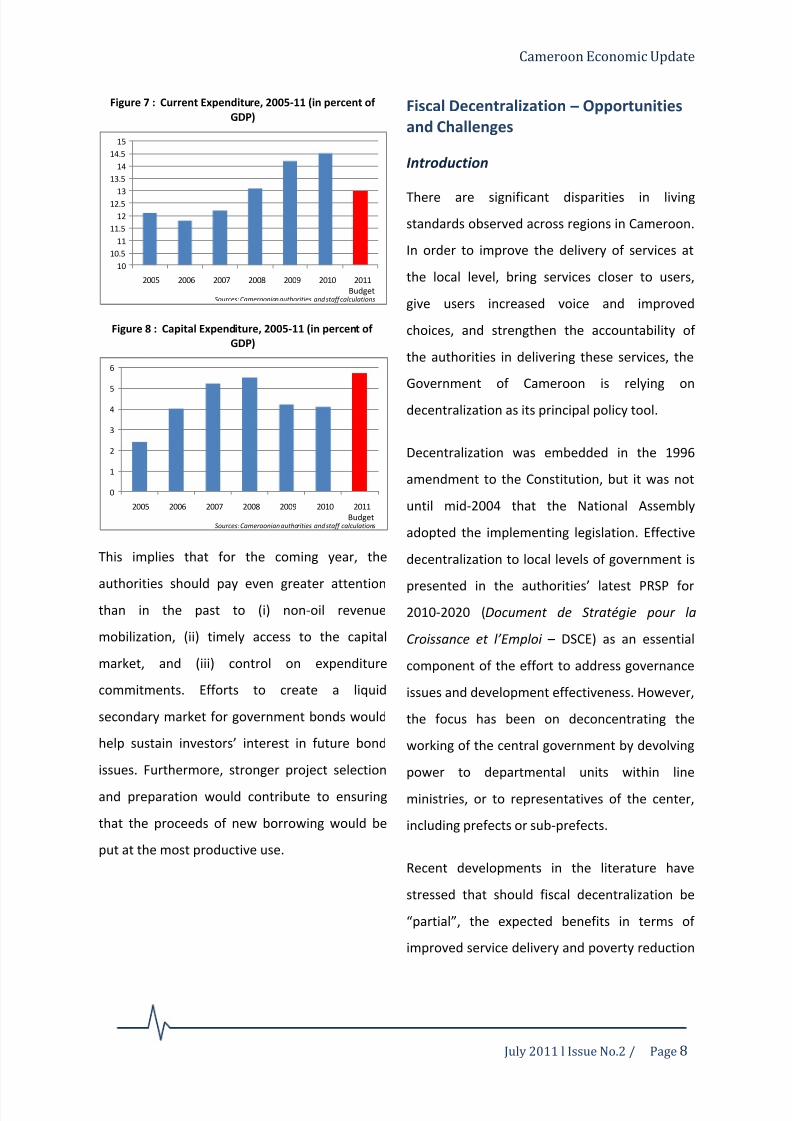
Figure 7 : Current Expenditure, 2005-11 (in percent of GDP) .............................................................. 8
Figure 8 : Capital Expenditure, 2005-11 (in percent of GDP) ............................................................... 8
Figure 9 : Access and Human Development Indicators International Comparisons ......................... 10
Figure 10: Well-Being Indicator, 2007 (average rank) ........................................................................ 11
Figure 11: Changes in Regional Living Standards ................................................................................ 12
Figure 12: CAC and FEICOM Grants, 2010 (CFAF per capita) .............................................................. 16 Figure 13: Local Budget Spending, 2007 (CFAF mn) ........................................................................... 16
Box
Box 1 : Promoting Budget Transparency and Efficiency in Cameroon .............................................. 20

8/22/2019 Cameroon Economic Update No.2, July 2011
http://slidepdf.com/reader/full/cameroon-economic-update-no2-july-2011 4/23
July 2011 l Issue No.2
ABBREVIATIONS AND ACRONYMS
BEAC Banque des Etats d’Afrique Centrale (Central Bank of Central African States)
CAC Centimes Additionnels Communaux (local revenue surcharge)
CEMAC Communauté Economique et Monétaire de l’Afrique Centrale (Economic and
Monetary Community of Central Africa)
CFAF CFA Franc
CIT Corporate Income Tax
COBAC Commission Bancaire de l’Afrique Centrale (Central Africa Banking
Commission)
CPI Consumer Price Index
DSCE Document de Stratégie pour la Croissance et l’Emploi (Growth and
Employment Strategy)FEICOM Fonds Spécial d’Equipement et d’Intervention Intercommunale (Special
Council Support Fund for Mutual Assistance)
GDP Gross Domestic Product
GNI Gross National Income
HIPC Heavily Indebted Poor Countries
ILO International Labor Organization
IMF International Monetary Fund
MDG Millennium Development Goals
MDRI Multilateral Debt Relief Initiative
RFA Redevance Forestière Annuelle (annual forestry fee)
SDR Special Drawing Rights
SNH Société Nationale des Hydrocarbures (national oil company)
SONARA Société Nationale de Raffinage (national refinery)
SSA Sub-Saharan Africa
TSA Treasury Single Account
VAT Value-Added Tax

8/22/2019 Cameroon Economic Update No.2, July 2011
http://slidepdf.com/reader/full/cameroon-economic-update-no2-july-2011 5/23
Cameroon Economic Update
July 2011 l Issue No.2 / Page 2
TOWARDS BETTER SERVICE DELIVERY
Introduction
With this Cameroon Economic Update, the
World Bank is pursuing a program of short, crisp
and more frequent country economic reports.
These Economic Updates analyze the trends and
constraints in Cameroon’s economic
development. Each issue, produced bi-annually,
provides an update of recent economic
developments as well as a special focus on a
selected topical issue.
The Economic Updates aim to share knowledge
and stimulate debate among those interested in
improving the economic management of
Cameroon and unleashing its enormous
potential. The notes thereby offer another voice
on economic issues in Cameroon, and an
additional platform for engagement, learning
and change.
This second issue of the Cameroon Economic
Update is titled “Towards Better Service Delivery
– An Economic Update of Cameroon, with a
special focus on fiscal decentralization”. This
title reflects the opportunities and challenges of
the ongoing fiscal decentralization in Cameroon.
The disparity in living standards observed across
regions calls for better service delivery at the
local level. For some basic services, access is
worse in Cameroon than on average in Sub-
Saharan Africa. In some regions, indicators have
even deteriorated over the past decade.
Bringing services closer to users, giving users
increased voices and improved choices, and
strengthening the accountability of the
authorities could lead to improved service
delivery. At the same time, if fiscal
decentralization is only partial, if not all the
needed building blocks are in place, the
expected benefits in terms of improved service
delivery and poverty reduction may not
materialize. Yet expectations have been raised.
The Cameroon Economic Updates are produced
by the Poverty Reduction and Economic
Management Unit of the World Bank Country
Office in Cameroon by a Team led by Raju Jan
Singh. The Team included James Acworth,
Sanjay Agarwal, Ehtisham Ahmad, Martin Luis
Alton, David Abouem a Tchoyi, Abel Bove, Paolo
Omar Cerutti, Bernard Dafflon, Bjorn Dahlin van
Wees, Simon Davies, Meike van Ginneken,
Faustin Koyassé, Guillaume Lescuyer, Thierry
Madiès, Amadou Nchare, and Peter Taniform.
Greg Binkert (Country Director for Cameroon)
and Jan Walliser (Sector Manager) provided
guidance and advice, and have been an
invaluable source of encouragement.
The Team also benefited greatly from
consultations with Cameroon’s key policy
makers and analysts, who provided important
insights, in particular the following institutions:

8/22/2019 Cameroon Economic Update No.2, July 2011
http://slidepdf.com/reader/full/cameroon-economic-update-no2-july-2011 6/23
Cameroon Economic Update
July 2011 l Issue No.2 / Page 3
the BEAC, the Ministry of Finance, the Ministry
of Economy and Planning, the Ministry of
Territorial Administration and Decentralization,
FEICOM, and the National Institute of Statistics.
The special focus on fiscal decentralization
draws on the preliminary observations of
extensive discussions with officials in Yaoundé
and Douala, representatives of about a hundred
municipalities from the Center, East, Littoral,
and North-West regions, as well as with civil
society and the donor community.
Photo credit: Raju Jan Singh
Recent Economic Developments
Growth
The latest information confirms the expected
recovery in economic activity in Cameroon
(Figure 1). Following the upturn in the global
economy and measures taken by the authorities
to stimulate domestic production, real GDP
growth in 2010 is estimated to have reached 3.2
percent (compared to 2 percent in 2009).
Figure 1 : Sectoral Contributions to GDP Growth, 2005-10
(in percent)
As expected, most of this recovery was driven by
the tertiary sector, which accounted for more
than half of the estimated growth. The sector
benefitted from a pick-up in timber-related
transport and continued strong activities in
mobile telephony stemming from a greater use
of fiber optic, promotional campaigns during the
Soccer World Cup, and the roll-out of new
products.
The recovery in the primary sector, with an
estimated growth rate of about 4 percent in
2010, was led by a strong expansion in the
timber sector, as well as in food crops. The non-
oil secondary sector, meanwhile, is also
estimated to have grown by about 4 percent,
-2
-1
0
1
2
3
4
5
2005 2006 2007 2008 2009 2010
Primary Secondary (excl. oil)
Oil Tertiary
GDP Growth
Sources: Cameroonian authorities
and staff calculations

8/22/2019 Cameroon Economic Update No.2, July 2011
http://slidepdf.com/reader/full/cameroon-economic-update-no2-july-2011 7/23
Cameroon Economic Update
July 2011 l Issue No.2 / Page 4
driven by a continued pick-up in construction
activities and a rebound in food processing.
Cameroon is a relatively small and mature oil
producer, where oil production is declining
(Figure 2). Depleting reserves, aging equipment,
and – more recently – postponements of some
development projects and investments because
of the financial crisis explain this profile. The
contribution of this sector to GDP growth has
been mostly negative in recent years and oil
production is estimated to have contracted by a
further 12 percent in 2010 (to 23.2 million
barrels).
Figure 2 : Oil Production, 2002-10 (in mn barrels)
Inflation
Average annual inflation was contained at 1.3
percent in 2010, compared with 3 percent in
2009. This development is partly attributable to
the policy measures to improve food supply
carried out by the authorities. The stability of
retail prices for petroleum products has also
contributed to the containment of inflation. The
food and transport components of the
Consumer Price Index (CPI) increased on average
only by 1.2 percent and 0.9 percent,
respectively.
Photo credit: Raju Jan Singh
These national averages hide, however,
important differences across regions, partly
reflecting the segmentation of local markets
(Figures 3 and 4). In the North (Garoua),
inflation has been declining most substantially,
driven by a fall in food prices stemming from
good harvests. In the rest of the country, strong
demand from neighboring countries seems to
have kept food prices up. As mentioned in our
January issue, Cameroon – and Central Africa in
general – has the most expensive and slowest
road infrastructure on the continent. It takes, for
instance, four weeks to make a two-way trip
15
20
25
30
35
40
2002 2003 2004 2005 2006 2007 2008 2009 2010Source: SNH

8/22/2019 Cameroon Economic Update No.2, July 2011
http://slidepdf.com/reader/full/cameroon-economic-update-no2-july-2011 8/23
Cameroon Economic Update
July 2011 l Issue No.2 / Page 5
between Douala and N’Djamena (about 1’900
km).
Figure 3 : Inflation Developments in Major Cities
(in percent)
Figure 4 : Inflation Drivers in Major Cities (in percent)
Fiscal performance
The Government successfully issued its first
bond in December 2010, attracting interest from
both national and foreign investors. The issue
was oversubscribed, mobilizing the targeted
CFAF 200 billion (about 1.8 percent of GDP). The
bond carries a 5.6 percent coupon, maturing
from 2012 and 2015.
Its issuance late in the year has, however,
constrained capital spending. The proceeds
from this operation are earmarked to finance
key infrastructure projects. As a result, at 2.3
percent of GDP, the overall fiscal deficit
(including grants, on a cash basis) turned out to
be slightly lower than we had expected and
much lower than envisaged in the September
2010 presidential decree amending the 2010
Budget (3.5 percent of GDP).
Overall, the fiscal performance in 2010 broadly
reflects similar developments observed in the
past: under-performance in the mobilization of
non-oil revenue offset by stronger oil revenue,
while overruns in current spending are
compensated by lower capital expenditure. This
year, however, the pattern is only more strikingwith an estimated outcome for capital spending
only slightly higher than its 2009 level.
The delay in the placement of the first
Government bond has also implied a tight
liquidity situation. The government used some
of its SDR allocation (CFAF 103 billion) to pay off
most of its obligations to the SONARA, the
national oil refinery, to compensate the
company for its losses stemming from the
government’s policy to freeze retail prices of
petroleum products. At the same time, new
payment obligations are reported to have
accumulated. Furthermore, the tight liquidity
0
1
2
3
4
5
6
7
8
Bafoussam Bamenda Douala Garoua Yaounde
Sources: Cameroonian authorities and staff calculations
2009 2010
-2
-1
0
1
2
3
4
Bafoussam Bamenda Douala Garoua Yaounde
Sources: Cameroonian authorities and staff calculations
Ge ne ral In de x Fo od
2009
Est. LFR WB Proj. Est.
Revenue and Grants 1926 1932 1936 1940
Revenue 1839 1842 1845 1869
Oil revenue 507 407 461 497
Non-oil Revenue 1332 1435 1384 1372
Grants 87 90 91 71Total Spending 1937 2151 2044 2067
Current Spending 1496 1552 1545 1611
Capital Spending 441 599 499 456
Overall Balance -11 -219 -108 -127
Arrears -17 -172 -158 -125
Overall Balance on a cash basis -28 -391 -266 -252
Sources: Cameroonian authorities, Staff's calculations
2010
Fiscal Performance, 2009-10
(in CFAF Billions)

8/22/2019 Cameroon Economic Update No.2, July 2011
http://slidepdf.com/reader/full/cameroon-economic-update-no2-july-2011 9/23
Cameroon Economic Update
July 2011 l Issue No.2 / Page 6
position has led to a near depletion of the
Government’s usable deposits at the BEAC, the
regional central bank.
Outlook 2011
It is expected that most of the developments
observed in 2010 will carry over into 2011. The
economic recovery would continue with growth
reaching about 4 percent. The main drivers
would come from the non-oil economy
(expanding by about 4½ percent), while oil
activities would continue to decline (by about 11
percent).
More particularly, growth in the secondary
(excluding oil) and tertiary sectors is expected to
remain strong and contribute for most of the
expected expansion in economic activity in
2011. This positive outlook is mainly driven by
the ongoing recovery of the global economy, the
execution of infrastructure programs, and
projects to boost productivity in agriculture by
strengthening for instance assistance in the
production of key crops (cocoa, coffee, cotton,
and rice), access to finance, training, and
research.
As discussed in our January issue, limited
infrastructure is perceived as a major bottleneck
to achieving the faster economic growth rates
needed to reduce poverty sustainably.
Infrastructure spending, especially in
transportation and power generation, can play a
critical role in stimulating sectors vital to growth
in Cameroon.
In this context, the authorities are actively using
the room provided by the country’s low level of
public debt to finance an expansion of their
public investment program (Figure 5). The most
recent joint IMF-World Bank low-income
country debt sustainability analysis carried out
indicates that Cameroon’s risk of debt distress
remains low, opening the possibility for some
further limited non-concessional borrowing.
Figure 5 : Total Public Debt, 2004-10 (in percent of GDP)
Inflation is expected to pick up on the back of
higher food prices, but remain below the
regional convergence criterion of 3 percent.
Ongoing initiatives to boost agricultural
production and subsidize imports of food are
% contribution towards GDP growth 2011 (proj.)Primary sector 0.9%
Secondary sector (excl. oil) 1.2%
Oil -0.5%
Tertiary sector 2.2%
GDP Growth 3.8%
0
10
20
30
40
50
60
70
2004 2005 2006 2007 2008 2009 2010Sources: Cameroonian authorities and staff calculations

8/22/2019 Cameroon Economic Update No.2, July 2011
http://slidepdf.com/reader/full/cameroon-economic-update-no2-july-2011 10/23
Cameroon Economic Update
July 2011 l Issue No.2 / Page 7
likely to continue to moderate the impact from
rising world food prices.
Concerning the country’s fiscal position, the
2011 Budget aims at containing the
deterioration, targeting an overall fiscal deficit
of 2.6 percent of GDP (including grants). This
would imply an increase in the non-oil revenue
effort and a greater restraint on current
spending to allow higher capital expenditure.
Cameroon’s non-oil revenue effort is relatively
weak, even when compared with other oil-
producing countries. The mobilization of non-oil
revenue in general has been disappointing,
partly because of the narrowness of its taxpayer
base. The budget target would imply reversing
the recent erosion in non-oil revenue
mobilization (Figure 6).
Figure 6 : Non-Oil Revenue, 2005-11 (in percent of non-oilGDP)
The tax rates being already high, the projected
additional non-oil revenue needs to be achieved
through administrative measures. In this regard,
the introduction of a single declaration for
taxpayers paying VAT, income tax, and patents
(above a certain level) is a welcome step. This
reform could considerably simplify existing
procedures, thereby reducing compliance costs.
Since the proceeds will be transferred to the
Treasury Single Account (TSA), this reform could
also provide greater certainty to municipalities
about the amount of revenues they should
receive.
On the expenditure side, current spending
would need to be contained to provide the
needed fiscal room for capital expenditure to
expand. This would also be a departure from
past experience (Figures 7 and 8). With
Presidential elections approaching, pressure for
increased spending may become harder to
resist.
In addition, a continued high stock of unsettled
payment obligations will weigh on the liquidity
position of the Government and on the
execution of the 2011 budget. Issuance of a new
bond and treasury bills is scheduled, but could
face similar delays as the first bond issue. The
reduced level of remaining government deposits
at the regional central bank will, however, only
provide a limited buffer this time. In these
circumstances, it could be tempting for the
central government to “delay” the transfer to
municipalities of local revenue transiting
through the TSA. With cash-strapped local
governments, this would just lead to arrears and
a further weakening of the budget process.
12.8
13
13.2
13.4
13.6
13.8
14
14.2
14.4
2005 2006 2007 2008 2009 2010 2011
BudgetSources: Cameroonian authorities and staff calculations
8/22/2019 Cameroon Economic Update No.2, July 2011
http://slidepdf.com/reader/full/cameroon-economic-update-no2-july-2011 11/23
Cameroon Economic Update
July 2011 l Issue No.2 / Page 8
Figure 7 : Current Expenditure, 2005-11 (in percent of
GDP)
Figure 8 : Capital Expenditure, 2005-11 (in percent of
GDP)
This implies that for the coming year, the
authorities should pay even greater attentionthan in the past to (i) non-oil revenue
mobilization, (ii) timely access to the capital
market, and (iii) control on expenditure
commitments. Efforts to create a liquid
secondary market for government bonds would
help sustain investors’ interest in future bond
issues. Furthermore, stronger project selection
and preparation would contribute to ensuring
that the proceeds of new borrowing would be
put at the most productive use.
Fiscal Decentralization – Opportunities
and Challenges
Introduction
There are significant disparities in living
standards observed across regions in Cameroon.
In order to improve the delivery of services at
the local level, bring services closer to users,
give users increased voice and improved
choices, and strengthen the accountability of
the authorities in delivering these services, the
Government of Cameroon is relying on
decentralization as its principal policy tool.
Decentralization was embedded in the 1996
amendment to the Constitution, but it was not
until mid-2004 that the National Assembly
adopted the implementing legislation. Effective
decentralization to local levels of government is
presented in the authorities’ latest PRSP for
2010-2020 (Document de Stratégie pour la
Croi ssance et l’Emploi – DSCE) as an essential
component of the effort to address governance
issues and development effectiveness. However,
the focus has been on deconcentrating the
working of the central government by devolving
power to departmental units within line
ministries, or to representatives of the center,
including prefects or sub-prefects.
Recent developments in the literature have
stressed that should fiscal decentralization be
“partial”, the expected benefits in terms of
improved service delivery and poverty reduction
10
10.5
11
11.5
12
12.5
13
13.5
14
14.5
15
2005 2006 2007 2008 2009 2010 2011
BudgetSources: Cameroonian authorities and staff calculations
0
1
2
3
4
5
6
2005 2006 2007 2008 2009 2010 2011
BudgetSources: Cameroonian authorities and staff calculations

8/22/2019 Cameroon Economic Update No.2, July 2011
http://slidepdf.com/reader/full/cameroon-economic-update-no2-july-2011 12/23
Cameroon Economic Update
July 2011 l Issue No.2 / Page 9
may not materialize.1
Decentralized units may
lack, for instance, appropriate incentives,
financial resources or requisite skills and
experience to meet their new responsibilities.
With decentralization in Cameroon at an
incipient stage, it is an opportune time to take
stock and ensure the needed building blocks for
a successful transition are in place.
Photo credit: Raju Jan Singh
Preliminary findings of this stocktaking suggest
that the current legal framework in relation to
fiscal decentralization needs to be clarified,
responsibilities are overlapping, cumbersome
and in many respects open to different
1For a review of the recent literature on the case for
and preconditions for effective decentralization, and
whether or not this leads to enhanced local public
service delivery, see Ahmad and Brosio, eds., 2006,
Handbook of Fiscal Federalism, Edward Elgar, and
Ahmad and Brosio, eds., 2009, Does Decentralization
Enhance Service Delivery and Poverty Reduction? Edward Elgar.
interpretations. To date, there is little true
transfer of competences and effective own-
source revenues are lacking: a crucial element in
establishing a hard budget constraint. The
design of the transfer mechanism could be
made more equalizing and the current
budgeting process does not fully reflect local
priorities nor foster fiscal discipline at the local
level. Expectations are high, and could generate
a backlash if not met.
Against this background, the most importantissue for the authorities at this stage would be
to determine how fast to move with the
decentralization process and the sequencing of
measures to ensure that the process is managed
in a manner that enhances service delivery, and
leads to greater accountability. This would help
to establish a road map for effective and
sustainable implementation.
Disparity in living standards – call for better
service delivery
There is a need for better service delivery at the
local level. Indicators for service delivery in
Cameroon tend to trail behind the standards of
countries at similar income levels (Figure 9). For
indicators such as primary school completion or
child mortality, Cameroon does even worse than
the average for sub-Saharan Africa.

8/22/2019 Cameroon Economic Update No.2, July 2011
http://slidepdf.com/reader/full/cameroon-economic-update-no2-july-2011 13/23
Cameroon Economic Update
July 2011 l Issue No.2 / Page 10
Figure 9 : Access and Human Development Indicators International Comparisons

8/22/2019 Cameroon Economic Update No.2, July 2011
http://slidepdf.com/reader/full/cameroon-economic-update-no2-july-2011 14/23
Cameroon Economic Update
July 2011 l Issue No.2 / Page 11
Furthermore, within Cameroon, there is a wide
dispersion in service delivery across regions. A
ranking of relative “well being” in Cameroon
shows wide regional discrepancies.2
As
expected, Douala and Yaoundé score best, and
the Far North is consistently the lowest (Figure
10). While the index does not imply that Douala
and Yaoundé have no needs, in relative terms
the Far North, North and East regions fare the
worst.
Figure 10: Well-Being Indicator, 2007 (average rank)
The situation in some of the less developed
regions worsened in the past decade or so
(Figure 11). Particularly striking is the declining
access to sanitation and drinking water, as well
as the increase in child mortality in some of the
regions. Despite the emphasis on primary
education, there was a decline in attendance in
2To build a composite index, a set of commonly used
needs and criteria has been taken: (1) poverty (less
than 738 CFAF/day; % of population); (2) primary
education attendance (6-14 yrs); (3) access to
drinking water (% of population); (4) access to
electricity (% of population); (5) literacy (15+); (6)
child mortality (per 1000 live births; children under 5
years); (7) under-employment (ILO definition; % of
population); (8) access to clean toilets (% of
population); and (9) births assisted by qualified staff
(% of births). A rank order for each is determined (1=
the best score).
the East. Also, in the richest regions some
indicators have deteriorated—especially in
Yaoundé for access to drinking water; sanitation
and infant mortality; and access to drinking
water in Douala.
Photo credit: Raju Jan Singh
Spending assignments – no effective
transfer of competences
Much of the focus to date has been ondeconcentrated operations. As far as
decentralization is concerned, line ministries
have “decided” to spin off administrative “sub-
areas” to lower levels, often without the
requisite human resources or financial means.
For instance, the typical responsibility
transferred is that of building additional
classrooms in schools—in locations determined
0
2
4
6
8
10
12
Sources: ECAM 3, National MDG Report 2008 and Staff calculations
Note: For de finitions and co mponents of th e wellbeing indicator, see text

8/22/2019 Cameroon Economic Update No.2, July 2011
http://slidepdf.com/reader/full/cameroon-economic-update-no2-july-2011 15/23
Cameroon Economic Update
July 2011 l Issue No.2 / Page 12
Figure 11: Changes in Regional Living Standards
-60
-40
-20
0
20
40
Sources: ECAM 2 & 3, Staff calculations
Poverty, 2001-2007(Change in %)
-80
-60
-40
-20
0
20
Access to Improved Sanitation,
2001-2007
(Change in %)
Sources: National MDG report 2008 and Staff calculations
-60
-40
-20
0
20
40
60
C e n t e r
E a s t
S o u t h
N o r t h W e s t
A d a m a o u a
L i t t o r a l
W e s t
D o u a l a
Y a o u n d e
F a r N o r t h
S o u t h W e s t
N o r t h
Sources: ECAM 2&3 and Staff calculations
Access to Drinking Water, 2001-2007(Change in %)
-50
-40
-30
-20
-10
0
10
20
30
Births Assisted by Qualified Staff,
2004-2006
(Change in %)
Sources: National MDG report 2008 and Staff calculations

8/22/2019 Cameroon Economic Update No.2, July 2011
http://slidepdf.com/reader/full/cameroon-economic-update-no2-july-2011 16/23
Cameroon Economic Update
July 2011 l Issue No.2 / Page 13
-40
-20
0
20
40
60
Child Mortality, 1998-2004(Change in %)
Sources: National MDG report 2008 and Staff calculations
-5
0
5
10
15
20
Sources: ECAM 2&3 and Staff calculations
Primary Education Attendance, 2001-2007(Change in %)
-10
-5
0
5
10
15
20
25
Sources: ECAM 2&3 and Staff calculations
Literacy, 2001-2007
(Change in %)
-40
-20
0
20
40
60
80
100
Sources: ECAM 2&3 and Staff calculations
Access to Electricity, 2001-2007
(Change in %)

8/22/2019 Cameroon Economic Update No.2, July 2011
http://slidepdf.com/reader/full/cameroon-economic-update-no2-july-2011 17/23
Cameroon Economic Update
July 2011 l Issue No.2 / Page 14
by the Ministry. These may, however, not reflect
the priorities of the local populations.
This peeling of administrative arrangements at
the discretion of line ministries will not result in
effective decentralization. It will neither transfer
the competences that are required by local
populations, nor will it facilitate the local
electorates holding mayors or local officials
responsible for the effective implementation.
Yet expectations have been raised, and there is
a danger that these will not be met.
Inadequate local own-source revenues
The main sources of sub-national financing
include shares in the main taxes: the Value-
Added Tax (VAT) and the Corporate Income Tax
(CIT), the grant elements of the loans provided
by FEICOM (Fonds Spécial d’Equipement et
d’Intervention Intercommunale – Special Council
Support Fund for Mutual Assistance) to local
governments, as well as the annual forestry fee
(redevance forestière annuelle – RFA). While the
shared revenues from the VAT and CIT are
transferred through the CAC (centimes
additionnels communaux ) and belong to the
local government by law, these shares are
determined automatically, or by formula, and
are not subject to control by local governments,
which are not able to increase this amount in
case of need.
A major lacuna in the Cameroonian
decentralization story is thus the lack of
effective own-source revenues. By own-source
revenues we refer to the ability of the local
government to influence or set the rate or base
of a significant tax handle. The distinguishing
feature of own-source revenues is that this head
can be increased at will by the local government
should the need arise (e. g., in meeting debt
obligations or arrears). It is a crucial element in
establishing a hard budget constraint and is not
linked to whether or not the government
administers the tax itself or uses the central tax
agency to collect the revenues on its behalf.
Transfers design – need for a more modern
system of equalization
The current transfer mechanism is opaque.
Ostensibly the per capita transfers are to ensure
“equality”, but this is not achieved, given
differences in infrastructure and unequal capital
endowments. Moreover, there are significant
spatial price differences having an impact on the
net access to services that could be purchased
by the transfers.
Current transfers
There is a considerable emphasis on equality in
the design of the transfer of CACs to local
governments. This translates into equality of
transfers on a per capita basis. This is often
justified on the grounds of being easy to
understand and politically attractive as a proxy

8/22/2019 Cameroon Economic Update No.2, July 2011
http://slidepdf.com/reader/full/cameroon-economic-update-no2-july-2011 18/23
Cameroon Economic Update
July 2011 l Issue No.2 / Page 15
for cost of service provision. However, the use
of the population basis for transfers poses a
number of significant difficulties:
Attaching revenues transferred in
relation to the population figure runs
the risk of politicizing the census;
The costs of providing public services in
remote areas, such as in the North and
in the Eastern forest region, are likely to
be higher than the average for all
regions. Costs may also be higher in
densely populated urban regions. Thus,
an equal per capita transfer may not
generate equal access to public services;
The basis for the transfer is likely to
generate expectation of entitlements
rather than a focus on the delivery of
services;
The equal per capita transfer would
seriously bias an effective service
delivery, if there are uneven levels of
basic infrastructure. Without schools in
some regions, spending current dollars
may not be as effective as in other
regions with schools.
Capital transfers
The criteria for the allocation of capital transfers
are not clear. In addition to the CACs, FEICOM
manages a lending window for local
governments. These loans could have grant
elements of up to 90 percent. It is hard to
discern a model underlying the system of capital
grants: it is not based on any “equalization”
framework, nor do the transfers appear to be
linked with a growth and development strategy.
Although there has been considerable work
undertaken to define local preferences, there
does not appear to be an explicit attempt to link
these grants to the local priorities identified in
the local development plans, for example.
Overall effects
As a result, the allocations of CACs and FEICOM’s
capital grants component are heavily tilted
towards Douala and Yaoundé, and appear to be
negatively correlated with need, the full extent
of which is not fully captured in the ordinal
rankings of the well-being index (Figure 12). The
inclusion of the RFA – expected to offset tosome extent the biases in the CAC and in the
FEICOM grants arrangements given that they are
generated largely by the poorer municipalities in
the East – does not change the picture.
Moreover, there is an implicit “asymmetry” in
the spending assignments in that the RFA is
expected to cover some deconcentrated
responsibilities in the forested regions that are
direct central responsibilities in others – adding
to the confusion as to who is responsible for
which function.

8/22/2019 Cameroon Economic Update No.2, July 2011
http://slidepdf.com/reader/full/cameroon-economic-update-no2-july-2011 19/23
Cameroon Economic Update
July 2011 l Issue No.2 / Page 16
Figure 12: CAC and FEICOM Grants, 2010 (CFAF per capita)
Budgeting and macroeconomic
stabilization – need to be more conducive
to fiscal discipline
To the extent that local governments provide
basic functions, and do not have access to
significant own-source revenues or access to
credit, it is appropriate that the stabilization
function should remain with the central
government. A consequence of this is that local
governments should be assigned revenue
sources and transfers that do not fluctuate
significantly over time.
In budgeting terms, the center should provide
reasonable multi-year forecasts of the transfers
that it proposes to allocate, perhaps with a floor
that provides assurance and certainty for the
local governments to carry out their budgets
within a reasonable framework. This is critical to
establishing accountability at the sub-national
level.
The current budgeting process does not,
however, engender discipline at the local level.
Part of the difficulty is that the budget cycles are
not properly synchronized. Central transfers
(budgeted in mid-November) are not known at
the time that the local budgets are put together
(early November). In addition, the actual
allocations are not known until February or
March of the year in which spending is incurred.
This leads to problems in achieving a realistic
local budget. For 2007, for instance, a year for
which full figures are available, the gap between
budgeted figures and actual spending is
substantial (Figure 13).
Figure 13: Local Budget Spending, 2007 (CFAF mn)
A more significant difficulty is that the central
government passes on part of the stabilization
function to local governments. This comes about
partly through the fluctuations in the share of
revenues, as well as the arbitrary recent
downward movement in the RFA: during 2009
and 2010. Given the problems faced by timber
companies, the central government reduced by
half the RFA due, to the benefit of the
companies, without consulting local
governments. The ad hoc reduction in the RFA
was criticized as introducing uncertainties for
local governments that they are ill-equipped to
handle.
0
2000
40006000
8000
10000
12000
14000
0
2
4
6
8
10
12
Sources: ECAM 3, National MDG Report 2008, MINATD, FEICOM and Staff calculations
Wellbeing indicator
CAC and FEICOM grants
0
500
1000
1500
2000
2500
3000
Sources: FEICOM and Staff calculations
Appropriation Execution

8/22/2019 Cameroon Economic Update No.2, July 2011
http://slidepdf.com/reader/full/cameroon-economic-update-no2-july-2011 20/23
Cameroon Economic Update
July 2011 l Issue No.2 / Page 17
With no autonomous sources of revenues (over
which they control rates or base) and little scope
for adjusting spending, the typical local
government response is to run arrears, in
particular where it affects the center—social
insurance contributions as well as utility
payments. On these accounts, the Ministry of
Finance has assumed local governments’
payment obligations, a move authorized by the
bailout clause in favor of local governments
included in the existing legislation.
Photo credit: Raju Jan Singh
Moreover, no single institution is able to
monitor and assess all sub-national liabilities.
The current cash-based system does not track
stocks of debt. Arrears are building up, but are
not being systematically tracked. Even pending
payment obligations are generally not known by
those who should monitor them, including local
treasurers.
Any lending agency should examine the full
extent of local government debt and assess this
in relation to its ability to repay. FEICOM is,
however, not generally aware of total liabilities.
It is assured of CAC resources, and easy
rescheduling, so has little incentive to examine
the full set of liabilities being incurred by local
governments. What information it has largely
relates to its own lending and captive revenue
sources (CAC over which it has control).
Reform issues – some building blocks
Spending assignments
The functions (or sub-function or sub-sub-
functions) over which the local governments
have jurisdiction, and for which they would be
held responsible, could be clarified. Primary
education is a typical sub-function that is often
assigned to lower levels, even if the center
generally continues to set the curricula and
standards. In the Cameroonian case one could
think of beginning the process with full
functional responsibility (covering all aspects of
wages, current and capital spending) for water
sanitation for instance. Such a decentralization
process would become more operational with
better information on the allocation of funds as
well as the results of spending.

8/22/2019 Cameroon Economic Update No.2, July 2011
http://slidepdf.com/reader/full/cameroon-economic-update-no2-july-2011 21/23
Cameroon Economic Update
July 2011 l Issue No.2 / Page 18
In some countries, such as Peru, a gradual
decentralization process has involved a level of
certification of competences and ability of the
local government to carry out the functions. The
argument that local governments lack the
capacity to carry out certain functions cannot be
made too strongly, as the transfer of human
resources and financing can easily address any
shortcomings that might be apparent under the
present circumstances.
Revenue assignments
In order to address the issue of local own-
sources of revenues, the government could
initiate a reassessment of local revenue
assignments with a view to clarify and
determine which heads of own-source revenues
would be most appropriate in the Camerooniancontext. Capacity constraints can be overcome
by using modern methods of self-assessment
and audit. Some of the functions can be
outsourced, including to the Directorate General
of Taxation.
The property tax could be developed as the
basis for local own-revenues. Current amounts
collected are meager, and are shared with
FEICOM. Consideration should be given to
making the property tax entirely “local” with
setting of the relevant rate (e.g. within a band
that could be legislated nationally, if needed, as
is common in several unitary states where the
legislative authority remains with Parliament).
Work also needs to be done on establishing a
cadastre (this could be maintained at the central
or regional level), as well as valuation
mechanisms and a system to track property
transactions. For the more advanced
municipalities, such as Douala and Yaoundé,
consideration could be given to applying the
techniques of modern tax administration—using
self-assessment and applying sanctions for
misdeclaration (i.e., purchasing the property at
above declared values). This could emulate the
success seen in cities such as Bogotá.
In addition, the resulting assignments should: (i)
rebalance own and shared revenues to minimize
local budget fluctuations; (ii) enhance local
accountability by enhancing the local ability to
resort to own-revenues at margin; and (iii) avoid
complex revenues-sharing arrangements (forinstance the CAC could be rolled into an
equalization transfer).
Transfer design
The authorities may wish to examine a more
modern system of “equalization”. As in the
Scandinavian countries and Australia, the
objective could be to “provide resources so that
local governments could provide equal
standards of service at equal levels of tax
effort”. Very simply, the equalization framework
would be based on “standardized” factors. This
ensures that local governments would not be

8/22/2019 Cameroon Economic Update No.2, July 2011
http://slidepdf.com/reader/full/cameroon-economic-update-no2-july-2011 22/23
Cameroon Economic Update
July 2011 l Issue No.2 / Page 19
able to influence the magnitude of the transfer
by their actions or lack of actions.
The standardized transfers thus become more or
less “lump sum” and should not distort
incentives at the local level. The standardized
spending responsibilities would address
differential costs of provision for services
assigned to them, with higher costs in remotely
populated areas, as well as densely populated
urban districts. Similarly, the own-revenue
potential would be based on standardized
revenue (spatial distribution of bases, assuming
average rates), and the fact that a local
government chooses not to exploit a revenue
base would not lead to a higher grant. Thus,
there would be an incentive to better utilize
assigned revenue bases.
Overall, the modern equalization framework
shifts the focus from “entitlements” to a political
focus on service delivery by local governments.
This helps with local oversight and could
generate “yardstick competition”, with
important political economy and accountability
advantages.
Budgeting
It is important to avoid fluctuations in local
government financing. Besides assigning more
stable revenue sources to local governments
and clearly giving the stabilization function to
the central government, efforts should be made
to improve the predictability of central transfers
to permit efficient budgeting.
Part of the difficulty is that the budget cycles are
not properly synchronized. This could be
relatively easy to adjust, e.g., with sharing the
likely central budget envelope in advance,
perhaps along with the budget circular that is
also sent to central spending agencies.
Consideration could also be given to establishing
a minimum level of transfers to ensure financing
of basic spending and facilitate budget
preparation at local level.
Debt management and governance
The legal framework needs to be modified to (i)
remove bail-out provisions; (ii) introduce limits
on debt stocks and flows as percentage of own-revenue, for instance; and (iii) establish
sanctions for exceeding these thresholds. The
Ministry of Finance should monitor all sources of
sub-national liabilities and risks, including the
buildup of arrears (in particular to social
insurance and utilities).
More generally, improved information flows on
all aspects of local operations are needed, not
just for the governments at all levels, but also to
inform the public and recipients of resources, so
that they might exert pressure on their elected
representatives in case of substandard
performance (Box 1).

8/22/2019 Cameroon Economic Update No.2, July 2011
http://slidepdf.com/reader/full/cameroon-economic-update-no2-july-2011 23/23
Cameroon Economic Update
Box 1 : Promoting Budget Transparency and Efficiency in Cameroon
Worldwide, governments, donors and civil society organizations alike have committed to increase
budget resources to improve basic service delivery and accelerate progress towards the Millennium
Development Goals. A more efficient use of resources is critical to achieve these goals. Citizens, who
ultimately are the end beneficiaries, often do not have information on the use of public funds, are
often left out of the allocation decisions, and cannot provide adequate and timely feedback on the
use of these scarce resources. Transparency in budgetary processes reduces opportunities for
wasteful or corrupt spending, consequently increasing the resources available to fight poverty.
In Cameroon, two regions – the North-West and the Adamaoua – are piloting an initiative to
promote greater budget transparency. The initiative supports three objectives, namely: (i)
simplification, analysis, and disclosure of budgets at multiple levels (regional, divisional, municipality,
school and health center); (ii) awareness and capacity building of government officials and
local/regional institutions to promote a public dialogue regarding public expenditures byencouraging demand-side governance; and (iii) documentation and dissemination. Steering
committees in each of the two regions under the chairmanship of their Governors are coordinating
these activities.
In the first phase of the initiative3, a simplification of the budget and its dissemination are being
undertaken in 60 primary and secondary schools, 20 health centers and 12 local councils. Simplified
budget templates for schools, health centers and local councils have been designed and field tested.
Schools and health centers are currently populating these templates with performance and budget
data to create snapshots for wide public dissemination. At the municipal level, the administrative
accounts of selected municipalities are being processed and simplified. Furthermore, a budget
transparency index for municipalities is being developed to assess their budget openness. This willfacilitate exchange of best practices in budget transparency between municipalities. At the regional
and divisional levels, budgetary allocation and expenditure data for FY2010 are being analyzed.
Discussions with stakeholders at all levels - from parents, to health center officials, local mayors and
the governors – revealed that there was a high demand for budget disclosure. They were, for
instance, surprised by the preliminary results for the North-West showing: (i) a high inter-divisional
variation in investment expenditures on basic/secondary education and public health4; and (ii)
higher government spending on secondary education than on primary education in the region.5
These initial results indicate that there is much scope for improving budget transparency in
Cameroon and stakeholders were confident that disclosure of budget information would help
prevent misuse of funds, enhance transparency and increase community participation.
3The first phase of the budget transparency initiative is expected to end in August 2011.
4The share of investment expenditure on basic education to total expenditure in 2010 varies from 10.4
percent to 20.8 percent. Similarly, in health the variation ranges from 6.0 percent to 16.2 percent.5
The share of investment expenditures to total expenditures on basic education, secondary education andpublic health were 13.4 percent, 20.7 percent and 10.8 percent, respectively.