Cambridgeshire County Council - ccc-live.storage ... · This insight pack has been commissioned by...
25
Cambridgeshire County Council Benchmarking report 24/01/2018
Transcript of Cambridgeshire County Council - ccc-live.storage ... · This insight pack has been commissioned by...

Cambridgeshire County Council
Benchmarking report24/01/2018

© 2018 Grant Thornton UK LLP. | Draft
Introduction
This insight pack has been commissioned by Cambridgeshire County Council to support strategic planning discussions.
The report has been prepared by Grant Thornton's Insights and Analytics team using CFO Insights, which is an online analysis tool that gives those aspiring to improve the financial position of their organisation instant access to insight on thefinancial performance, socio-economic context and service outcomes of theirs and every other council in England, Scotland and Wales. Sections 1 and 2 of this report are high level benchmarking exercises comparing the net expenditure and total service line income of Cambridgeshire County Council against all English Counties and a nearest neighbour group. . This has been undertaken using publically available financial data submitted by every council to the Department of Communities and Local Government.
As part of section 3, we have also manually collated data on senior officer salaries from reports published by local authorities in accordance with Section 38 of the Localism Act 2011, which requires that authorities publish their policies for the financial year relating to the remuneration of their chief officers and lowest paid employees, as well as the relationship between the salaries of its chief officers and employees who are not chief officers.

© 2018 Grant Thornton UK LLP. | Draft
Contents
3
Socio economic context 3
Benchmarking expenditure 6
Income generation 13
Senior officer salaries 18
© 2018 Grant Thornton UK LLP. | Draft
Socio economic context
4

© 2018 Grant Thornton UK LLP. | Draft
Socio economic overview
5
Figure 1: Socio economic profile with two nearest neighboursSocio Economic characteristics
In order to appropriately benchmark Cambridgeshire County Council
against similar areas we used a variety of socio-economic measures to profile the council and then find other County Councils with similar
characteristics.
The measures used were specifically selected as they give a holistic picture of the population of Cambridgeshire and take into account
spatial scale. Measures include age brackets, deprivation, earnings, employment rate and area size.
The socioeconomic profile, to the right (figure 1), shows
Cambridgeshire County Council in the context of all English Counties. The 50 line represents the group median, consequently points closer to
the outside of the profile are 'very high' in comparison to the group and those closer to the centre are 'very low'.
The spider chart shows that Cambridgeshire has a very high proportion
of its population aged 18-64 years old in comparison to the group and a relatively low aging population (65+). Cambridgeshire’s population also
has very low levels of deprivation and very high level of skills.
0
25
50
75
100
Population density
Employment rate: 16-64
NVQ 4+: 16-64 %
Deprivation scoreAge: 0-17 (%)
Age: 18-64 (%)
Age: 65+ (%)
Cambridgeshire Council A Council B

© 2018 Grant Thornton UK LLP. | Draft
Nearest neighbours
Using the measures set out in the spider chart in figure 1, we have
identified the ten most statistically similar County Councils to Cambridgeshire, with Council A being most similar overall. These are
shown in the table and map to the right (figure 2).
The nearest neighbour group identified has been used as a more focused benchmark group for this report in order to appropriately
benchmark Cambridgeshire County Council against similar areas.
6
Nearest NeighboursFigure 2: Map of near neighbours
Nearest Neighbours
Council A
Council B
Council C
Council D
Council E
Council F
Council G
Council H
Council I
Council J

© 2018 Grant Thornton UK LLP. | Draft
Benchmarking expenditure
7

© 2018 Grant Thornton UK LLP. | Draft
Total Services
8
Figure 5: Gross Expenditure, Income and Net: Total Service (2009/10 – 2016/17) Figure 4: Net expenditure per head (2016/17)- Nearest neighbour context
Figure 3: Net expenditure per head (2016/17)- County contextNet expenditure in context
The map to the right (figure 3) illustrates that Cambridgeshire’s net expenditure
per head (total population) on total service was £968.85 in 2016/17, which is very low in the context of all County Councils.
Compared to the nearest neighbour group (figure 4), Cambridgeshire has very low net expenditure per head on total services. The two Counties with the most
similar level of spend are Council A and Council B, at £1,021.98 and £800.02 respectively.
Based on revenue outturn returns submitted to the Department of Communities
and Local Government by Cambridgeshire County Council it can be seen that between 2009/10 and 2016/17 there was a decrease in net expenditure for the
total service of 14.3%. In comparison, total English County Council spend has decreased by 10.5% over this time period. Cambridgeshire’s decrease in net
expenditure is as a result of a decrease in gross expenditure of 12.4% (figure 5). But there was also a decrease in income over this time period of 5.1%.
0
200,000
400,000
600,000
800,000
1,000,000
2009-10 2010-11 2011-12 2012-13 2013-14 2014-15 2015-16 2016-17
£0
00
s
Gross Expenditure Net Expenditure Total Income
0
200
400
600
800
1,000
1,200
1,400
£/h
ea
d

© 2018 Grant Thornton UK LLP. | Draft9
Does spend align with socio economic conditions?
Figure 6: Net expenditure per head (2016/17)- County context
The scatter chart (figure 6, right) shows unit cost total service line
expenditure against council area deprivation. From this chart we can see that there is no clear relationship between these two measures. Whereas, if
you were to do a similar chart for single tier authorities a clear relationship would be found with councils with higher levels of deprivation having higher
spend per head. Our analysis has also shown that there is no relationship between unit cost spend and rurality or population density. This means that
other and more complex factors are driving relative spending. Our analysis shows that Cambridgeshire has a relatively young population by comparison
with nearest neighbours, it may be that this is associated with lower unit costs for adult social care as analysed on following pages.
However, from the scatter chart we can see that Cambridgeshire has both
very low unit cost spend and deprivation in this landscape.
Cambridgeshire
Council H
Council I
Council E
Council CCouncil D
Council F
Council G
Council J
Council A
Council B
0
25
50
75
100
0 25 50 75 100D
ep
riva
tio
n (p
erc
entile
)
Unit Costs Total Service Expenditure (percentile)

© 2018 Grant Thornton UK LLP. | Draft10
2016/17 % total spendCounty Council
context
Nearest Neighbour
Context
Education Services 45.86 Very Low Low
Adult social care 24.46 Very Low Low
Children's social care 12.87 Average Average
Housing services (GFRA) 0 Very Low Very Low
Highways and Transport Services
4.56 Very Low Very Low
Environmental and Regulatory Services
5.33 High High
Planning and Development Services
0.32 Very Low Very Low
Cultural and Related Services
1.09 Very Low Very Low
Public Health Services 4.41 Average Low
Central Services 1.12 Average Low
Total Services 100 Very Low Very Low
Service line breakdownService line benchmarking
The table to the right (figure 7) shows how unit cost spend for each council
service line compares to all English county councils and also the nearest neighbour group. Although total service spend overall is very low in both a
county and near neighbour context it is clear that there are variations in the
relative levels of spend across service lines. For example, service lines which are outliers due to higher levels of spend include children’s social
care and environmental and regulatory services. However, there are also outliers due to low levels of spending such as adult social care, highways
and transport, planning and development and cultural and related services, which also warrant further investigation.
Four service lines have been selected for further analysis of financials due to being outliers and will be explored further in the following pages:
• Environmental and Regulatory Services• Children’s Social Care
• Adult Social Care• Planning and Development Services
Figure 7: Net expenditure per head (2016/17)

© 2018 Grant Thornton UK LLP. | Draft11
Figure 10: Gross Expenditure, Income and Net (2009/10 – 2016/17) Figure 9: Net expenditure per head (2016/17)- Nearest neighbour context
Figure 8: Net expenditure per head (2016/17)- County contextNet expenditure in context
The map to the right (figure 8) illustrates that Cambridgeshire’s net
expenditure per head (total population) on environmental and regulatory services was £51.61 in 2016/17, which is high in the context of all County
Councils.
Compared to the nearest neighbour group (figure 9), Cambridgeshire has
high net expenditure per head on environmental and regulatory services. The two Counties with the most similar level of spend are Council G and
Council B, at £52.13 and £45.55 respectively.
Based on revenue outturn returns submitted to the Department of Communities and Local Government by Cambridgeshire County Council it
can be seen that between 2009/10 and 2016/17 there was an increase in net expenditure for environmental and regulatory services of 40.6%,
amounting to approximately £9.7 million. This was as a result of an increase in gross expenditure of 42.8% (figure 10).
Environmental & Regulatory Services
0
10,000
20,000
30,000
40,000
50,000
2009-10 2010-11 2011-12 2012-13 2013-14 2014-15 2015-16 2016-17
£0
00
s
Gross Expenditure Net Expenditure Total Income
0
10
20
30
40
50
60
£/h
ea
d

© 2018 Grant Thornton UK LLP. | Draft12
Figure 13: Gross Expenditure, Income and Net (2009/10 – 2016/17) Figure 12: Net expenditure per head (2016/17)- Nearest neighbour context
Figure 11: Net expenditure per head (2016/17)- County contextNet expenditure in context
The map to the right (figure 11) illustrates that Cambridgeshire’s net
expenditure per head (aged 0-17) on children’s social care services was £604.92 in 2016/17, which is average in the context of all County Councils.
Compared to the nearest neighbour group (figure 12), Cambridgeshire has average net expenditure per head on children’s social care services. The
two Counties with the most similar level of spend are Council F and Council G, at £612.60 and £603.27 respectively.
Based on revenue outturn returns submitted to the Department of
Communities and Local Government by Cambridgeshire County Council it can be seen that between 2011/12 and 2016/17 there was an increase in
net expenditure for children’s social care services of 11.57%. This was as a result of an increase in gross expenditure of 13.63% (figure 13).
Children's social care
0
20,000
40,000
60,000
80,000
100,000
2009-10 2010-11 2011-12 2012-13 2013-14 2014-15 2015-16 2016-17
£0
00
s
Gross Expenditure Net Expenditure Total Income
0
100
200
300
400
500
600
700
800
900
£/h
ea
d
© 2018 Grant Thornton UK LLP. | Draft
Adult Social Care
13
Figure 16: Gross Expenditure, Income and Net (2009/10 – 2016/17) Figure 15: Net expenditure per head (2016/17)- Nearest neighbour context
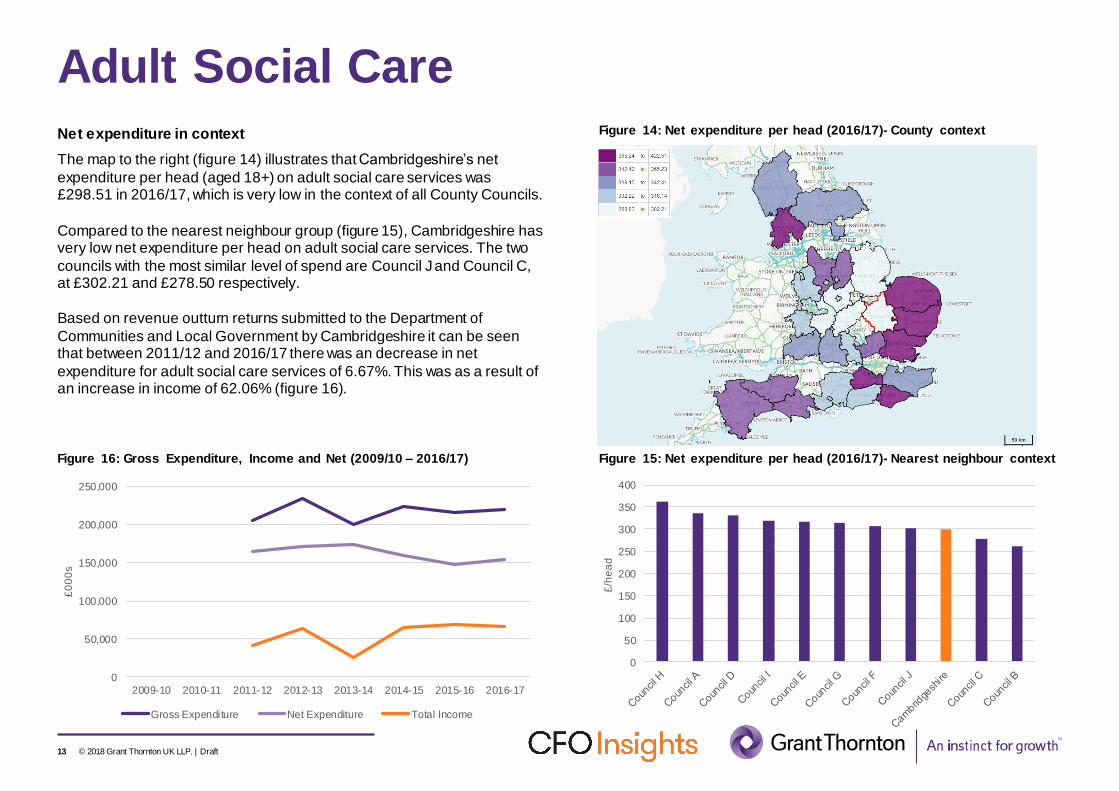
Figure 14: Net expenditure per head (2016/17)- County contextNet expenditure in context
The map to the right (figure 14) illustrates that Cambridgeshire’s net
expenditure per head (aged 18+) on adult social care services was £298.51 in 2016/17, which is very low in the context of all County Councils.
Compared to the nearest neighbour group (figure 15), Cambridgeshire has very low net expenditure per head on adult social care services. The two
councils with the most similar level of spend are Council J and Council C, at £302.21 and £278.50 respectively.
Based on revenue outturn returns submitted to the Department of
Communities and Local Government by Cambridgeshire it can be seen that between 2011/12 and 2016/17 there was an decrease in net
expenditure for adult social care services of 6.67%. This was as a result of an increase in income of 62.06% (figure 16).
0
50,000
100,000
150,000
200,000
250,000
2009-10 2010-11 2011-12 2012-13 2013-14 2014-15 2015-16 2016-17
£0
00
s
Gross Expenditure Net Expenditure Total Income
0
50
100
150
200
250
300
350
400
£/h
ea
d

© 2018 Grant Thornton UK LLP. | Draft14
Figure 19: Gross Expenditure, Income and Net (2009/10 – 2016/17) Figure 18: Net expenditure per head (2016/17)- Nearest neighbour context
Figure 17: Net expenditure per head (2016/17)- County contextNet expenditure in context
The map to the right (figure 17) illustrates that Cambridgeshire’s net
expenditure per head (total population) on planning and development services was £3.06 in 2016/17, which is very low in the context of all
County councils.
Compared to the nearest neighbour group (figure 18), Cambridgeshire has
very low net expenditure per head on planning and development services. The two boroughs with the most similar level of spend are Council I and
Council F, at £3.58 and £2.15 respectively.
Based on revenue outturn returns submitted to the Department of Communities and Local Government by Cambridgeshire County Council it
can be seen that between 2009/10 and 2016/17 there was a decrease in net expenditure for planning and development services of 62.9%,
amounting to £3.4 million. This was as a result of a decrease in gross expenditure of 55.1% (figure 19).
Planning & Development Services
0
1,000
2,000
3,000
4,000
5,000
6,000
7,000
8,000
9,000
10,000
2009-10 2010-11 2011-12 2012-13 2013-14 2014-15 2015-16 2016-17
£0
00
s
Gross Expenditure Net Expenditure Total Income
0
2
4
6
8
10
12
14
16
18
20
£/h
ea
d

© 2018 Grant Thornton UK LLP. | Draft
Income generation
15

© 2018 Grant Thornton UK LLP. | Draft
Income generation: Total Services
16
Figure 21: Income generation per head (2016/17)- Nearest neighbour context
Figure 20: Income generation per head (2016/17)- County contextIncome generation in context
The map to the right (figure 20) illustrates that Cambridgeshire’s total
service line income per head (total population) was £285.03 in 2016/17, which is high in the context of all County Councils.
Compared to the nearest neighbour group (figure 21), Cambridgeshire has average total service line income generation per head. The two Counties
with the most similar level of income generation are Council I and Council F, at £293.51 and £283.77 respectively.
Based on revenue outturn returns submitted to the Department of
Communities and Local Government by Cambridgeshire County Council it can be seen that between 2009/10 and 2016/17 there was a decrease in
total service line income of 5.1%. However, since 2013-14 there has been increase in income generation on 49.42% (figure 22).
Figure 22: Service Line Income: Total Service (2009/10 – 2016/17)
0
50,000
100,000
150,000
200,000
250,000
2009-10 2010-11 2011-12 2012-13 2013-14 2014-15 2015-16 2016-17
£0
00
s
0
50
100
150
200
250
300
350
400
450
£/h
ea
d

© 2018 Grant Thornton UK LLP. | Draft17
Income generationIncome generation in context
The scatter chart (figure 23, right) shows total service line expenditure
against total service line income. From this chart we can see that there is a clear relationship between these two measures. Generally areas with higher
gross expenditure also have high levels of income.
However, authorities that are to the left of the trend line, Cambridgeshire is one such example, have high levels of income for their level of gross
expenditure. Whereas those to the right have high gross expenditure and to their level of income.
Figure 23: Income generation per head (2016/17)
Cambridgeshire
Council E
Council H
Council F
Council J
Council C
Council A
Council D
Council I
Council G
Council B
0
25
50
75
100
0 25 50 75 100
To
tal In
co
me
(p
erc
en
tile
)Gross Expenditure (percentile)
Cambridgeshire Near neighbours Counties

© 2018 Grant Thornton UK LLP. | Draft18
2016/17County Council
context
Nearest
Neighbour
Context
Top 3 income generators from
Nearest neighbour group
Education Services High High1. Council C 2. Council B
3. Council F
Adult social care High High1. Council F 2. Council B
3. Council H
Children's social care Very High Very High1. Council I 2. Cambridgeshire 3.
Council C
Housing services
(GFRA)Low Low
1. Council A 2. Council B
3. Council G
Highw ays and
Transport ServicesAverage High
1. Council C 2. Council B
3. Cambridgeshire
Environmental and
Regulatory ServicesHigh Average
1. Council F 2. Council I
3. Council G
Planning and
Development ServicesAverage Average
1. Council C 2. Council F
3. Council I
Cultural and Related
ServicesLow Very Low
1. Council G 2. Council E
3. Council C
Public Health Services Very Low Very Low1. Council B 2. Council I
3. Council A
Central Services Average Average1. Council H 2. Council E
3. Council C
Total Services High Average1. Council C 2. Council H
3. Council E
Income generationIncome generation benchmarking by service line
The table to the right (figure 24) shows how unit cost income
for each council service line compares to all English county councils and also the nearest neighbour group. Although total
service income overall is high in both a county and near
neighbour context it is clear that there are variations in the relative levels of income generation across service lines.
The table also identifies the three counties, of the nearest
neighbour group, that generate the most income for each service line.
Figure 24: Income generation per head (2016/17)

© 2018 Grant Thornton UK LLP. | Draft19
Income generation: Key case studiesIncome generation benchmarking by service line
Of the near neighbour group only three authorities
have greater income generation per head of population than Cambridgeshire, these councils are:
Council E, Council H and Council I.
The service line income generation profile, to the right
(figure 25), shows Cambridgeshire County Council in the context of all English Counties. The 50 line
represents the group median, consequently points closer to the outside of the profile are 'very high' in
comparison to the group and those closer to the centre are 'very low'. Overlaid onto this is also the three
authorities that have greater income generation than Cambridgeshire.
From the spider chart we can see that in comparison
to these three authorities the areas in which potentially greater levels of income generation could be achieved
include: cultural and related services, environmental and regulatory services and central services.
Figure 25: Income generation per head (2016/17)
0
25
50
75
100
Total education services
Total highways and transportservices
Total housing services (gfra only)
Total cultural and related services
Total environmental and regulatoryservices
Total planning and developmentservices
Total central services
Total service expenditure
Total children social care
Total adult social care
Total public health
Council E Council H Council I Cambridgeshire

© 2018 Grant Thornton UK LLP. | Draft
Senior officer salaries
20

© 2018 Grant Thornton UK LLP. | Draft21
Council top salaries
Rank County Council Highest Salary
1 Council E £ 214,054.00
2 Council I £ 195,000.00
3 Council B £ 190,740.00
4 Council J £ 185,488.00
5 Council A £ 181,037.76
6 Council F £ 180,000.00
7 Council C £ 172,866.00
8 Council G £ 163,729.50
9 Council H £ 150,778.00
10 Council D £ 131,581.00
11 Cambridgeshire £ 123,728.00
Figure 27: Council highest salary against total council spend Council top salaries
Under the Localism Act 2011 all councils must publish the authority’s policies for the financial year relating to the remuneration of their chief officers and lowest paid employees, as well as the relationship between the salaries of its chief officers and employees who are not chief officers. We have captured this data from council websites for the ten authorities in the near neighbour group in order to benchmark Cambridgeshire.
The table below (figure 26) shows a rank of highest council salaries. This shows that of the near neighbour group Cambridgeshire has the lowest top council salary at just less than half that offered at Council E.
The scatter chart to the right (figure 27) seeks to but this salary data in context by correlating top salaries with total net expenditure by the council. There is no clear correlation between these measures, however it does place Cambridgeshire in a landscape. We can see that Cambridgeshire has both low spend and low highest salary in this context.
Figure 26: Rank of highest council salary - Near Neighbour context
Council A
Council B
Council C
Council D
Council E
Council F
Council G
Council H
Council I
Council J
Cambridgeshire
0
25
50
75
100
0 25 50 75 100T
ota
l S
erv
ice S
pe
nd
Highest Salary

© 2018 Grant Thornton UK LLP. | Draft22
Rank Council Pay multiple of median salary
1 Council E 9.97
2 Council H 8.10
3 Council F 8.00
4 Council B 7.93
5 Council G 7.89
6 Council I 7.20
7 Council C 7.00
8 Council J 6.90
9 Council A 6.10
10 Council D 5.80
11 Cambridgeshire 4.50
Salary multiplesPay multiples of near neighbour group
Pay multiples show how many times larger the top salary in the council is in
comparison to the median. The pay multiples of the near neighbour are shown in the rank table below in figure 28.
Of the near neighbour group Cambridgeshire has the lowest pay multiple of median salary at 4.5. In comparison to Council E which has the greatest at
9.97.
Pay multiples correlate weakly with total council spend on employees per head of population as shown in figure 29, where Cambridgeshire has low
spend on employees and also low pay multiples.
Figure 28: Council pay multiple of median salary – near neighbour context
Figure 29: Council pay multiple against total council spend
Council E
Council H
Council F
Council B
Council G
Council I
Council C
Council J
Council A
Council D
Cambridgeshire
0
25
50
75
100
0 25 50 75 100T
ota
l se
rvic
e e
mp
loyee
sp
en
d (p
erc
en
tile
)
Pay multiple of median salary (percentile)

© 2018 Grant Thornton UK LLP. | Draft
Want to see more benchmarks for your authority?
23

© 2018 Grant Thornton UK LLP. | Draft
Free on iOS and android devices, get:
• headline financial data
• comparisons on key service line
outcomes
• insightful commentary on current
events in public sector
• a spotlight on best practice and
innovation in the local government
sector
• a taster of our platform that is used by
over 70 authorities to benchmark their
spend
24
Download the CFO insights app
Benchmarks in your pocket: iPhone: buff.ly/2yL9Sbn Android: bit.ly/2A0lcNQ

© 2018 Grant Thornton UK LLP. | Draft
‘Grant Thornton’ refers to the brand under which the Grant Thornton member firms provide assurance, tax and advisory services to their clients and/or refers to one or more member firms, as the context requires. Grant Thornton UK LLP is a member firm of Grant Thornton International Ltd (GTIL).GTIL and the member firms are not a worldwide partnership. GTIL and each member firm is a separate legal entity. Services are delivered by the member firms. GTIL does not provide services to clients. GTIL and its member firms are not agents of, and do not obligate, one another and are not liable for one another’s acts or omissions.
grantthornton.co.uk