Cambridge Working Papers in Economics CWPE 0460 CMI Working Paper 59
37
Cambridge Working Papers in Economics Not to be quoted without permission M assachusetts Institute of Technology Center for Energy and Environmental Policy Research CMI Working Paper UNIVERSITY OF CAMBRIDGE Department of Applied Economics
Transcript of Cambridge Working Papers in Economics CWPE 0460 CMI Working Paper 59

Cambridge Working Papers in Economics CWPE 0460
Large Scale Deployment of Renewables
for Electricity Generation
Karsten Neuhoff
Massachusetts Institute of Technology
Center for Energy and
Environmental Policy Research
CMI Working Paper 59
UNIVERSITY OFCAMBRIDGEDepartment ofApplied Economics

Cambridge Working Papers in Economics
Not to be quoted without permission
Massachusetts Institute of Technology Center for Energy and
Environmental Policy Research
CMI Working Paper
UNIVERSITY OFCAMBRIDGEDepartment ofApplied Economics

Large Scale Deployment of Renewables for Electricity Generation
Karsten Neuhoff1
Comparisons of resource assessments suggest resource constraints are not an obstacle to the large-scale deployment of renewable energy technologies. Economic analysis identifies barriers to the adoption of renewable energy sources resulting from market structure, competition in an uneven playing field and various non-market place barriers. However, even if these barriers are removed, the problem of ‘technology lock-out’ remains. The key policy response is strategic deployment coupled with increased R&D support to accelerate the pace of improvement through market experience. The paper suggests significant contributions from various technologies, but does not assess their optimal or maximal market share.
1 Introduction Using renewables on a large scale to replace fossil electricity generation offers two principal advantages. Environmentally, renewables offer a means to significantly reduce greenhouse gas emissions. This is a pressing priority given the need to minimise the risks of climate change cause by rapidly rising concentrations of greenhouse gases caused in large part by the burning of fossil fuels. Renewable energy sources can also help to diversify energy supplies in most countries. Reducing dependence on energy imports reduces the exposure of economies to international fuel price fluctuations and potential interruptions caused by political instability. In addition, most renewables are cleaner thereby providing ancillary benefits to the environment and to human health. A variety of studies show that renewables have a large technical potential. Yet, currently they only supply 13.5% of global energy demand, and nearly all of this is from established sources of hydro-power and small-scale wood fuel and other biomass combustion, which are limited in their potential expansion. There are many reasons for this. First, the playing field is far from level: conventional generation sources compete unfettered by their full environmental and social costs. Second, renewable energy technologies are of three distinct generations, each presenting different, complex challenges to expansion of their markets. The mature generation includes hydropower, biomass combustion, solar thermal hot water, and geothermal technologies. These technologies are already cost-competitive with conventional forms, provided the renewables plant is located in a high quality resource area, and where there is low-cost access to the grid. The challenge to expanding these markets relates to high up-front costs and to local site issues. The emerging generation of technologies includes wind, several advanced forms of bioenergy, and solar PV. These technologies are proven technologically, but still need substantial cost reduction through market experience. The third group are the technologies still in the R&D phase, including concentrating solar power,
1 I would like to thank Joanna Ellis (OECD), Tim Foxon (Imperial College), Michael Grubb (University of Cambridge), Robert Gross (Imperial College, London), Daniel Kammen (University of California, Berkeley), David Newbery (University of Cambridge), Nic Rivers (Simon Fraser University), Annette Schou (Danish Energy Authority), Rick Sellers (IEA renewables), Simon Upton (OECD) for extensive discussions and comments on various versions of the paper. I would like to thank Jun Arima (IEA country studies), Thobjon Fangel (Danish Environment Ministry), Anna Marie Fitzpatrick (Imperial College, London), Norbert Gorissen (German Environment Ministry), Jan Losson (ErSol), Joachim Nick-Leptin (BMWU), Chris Mottershead (BP), Stefan Klinski (Legal Advisor, BMWU), Mark Radka (UNEP financing), Maya Papineau (eco-innovate), Till Stenzel, (IEA), Piotr Tulej (IEA renewables), Nicole Wilke (BMWU) for valuable insights and discussions. Most of all I would like to thank Lucy Butler for a lot of help and the survey of renewable resources. Financial support from the OECD round table on sustainable development and UK research councils ESRC/EPSRC under award number RG37889 is gratefully acknowledged. Contact address: Department of Applied Economics, University of Cambridge, CB3 9DE, UK, [email protected].

2
ocean energy, and even more advanced forms of bioenergy, such as lignocelluloses processing. These technologies will require substantial RD&D in order to prove themselves at market scale, and to begin entry into commercial markets. This paper does not address the optima future generation mix. It only asks whether individual renewable technologies are capable of supplying more than a couple of percentage points of our energy demands. After renewable technologies are developed and society is accustomed to their use, then markets can determine what fraction of energy to supply from individual technologies. This paper explains the potential for new renewables and addresses the economic issues associated with their deployment in three main parts.
• First, the paper (section 1) summarises the resource potential for renewables, concluding that fundamental technological and resource constraints are not the major obstacle to large-scale deployment (section 2).
• The core of the paper looks in depth at the economic barriers to renewable energy: the impact of
competition in an uneven playing field (section 3) and the specific obstacles associated with market structure (section 4) and non-market (section 5) barriers. The analysis also considers the nature and causes of ‘technology lock-out’ as a generic barrier (section 6).
• Finally, the paper considers the potential policy responses. It is argued that they key is for
programmes of strategic deployment (section 7) to accelerate the pace of improvement through market experience (learning). The specific instruments available for this are then reviewed (section 8), before also emphasising the continued role of R&D as a supporting, but not unique, element of renewable energy technology policy (section 9). Finally, the paper takes a brief look at the international dimension of renewable technology policy (section 10).
2 Renewable Market Share and Potential
Currently only bioenergy and hydropower make significant contributions to meeting energy demand (IEA, 2003b), followed by geothermal energy and wind power. Africa and Asia are the biggest users of bioenergy, but this will only be sustainable if active replanting complements the collection of firewood. Renewables supply only 19.6% of global electricity and 13.5% of global energy demand (IEA, 2004b). Several studies show that this is only a small part of their technical resource potentia.2 These estimations take account of a range of constraints - for example WBGU assumes that only 4% of the land with significant wind resources or 1% of all land will be used for electricity production.3 Figure 1 shows the estimated electric potential for solar, wind, tidal, wave, geothermal, hydro and biomass as compared to current global electricity demand. Current energy systems require 2.5 units of primary energy to produce 1 unit of electricity - renewable energy would therefore not only replace the electric energy but also eliminate the corresponding transformation losses.
2 Potential is often defined separately for the globally available resource, the technically available part of the resource and the economically accessible resource. To avoid heroic assumptions on future technological costs this paper does not refer to economically constrained potential, but to technically constrained potential. To increase applicability, siting constraints have been included where available. 3 Three quotations from recent papers illustrate the scale of renewable resources. First, according to Hoffert et al. (2002), biomass (energy density ~0.6W m-2) would require >10% of earth surface to satisfy 10TW (315 EJ); PV and wind (~15W m-2 electric) need less land, but other materials can be limiting. Second, Duke (2002) suggests that US electricity consumption in 1999 was 3.700 TWh. Assuming average insulation of 1,850kWh/m2, each m2 of PV capacity yields: 0.75 technical loss factor * 1850kWh/m2 * 0.1 module efficiency = 140kWh/m2. This corresponds to 26000km2 or 0.3% of U.S land mass. Third, Musial and Butterfield (2004) estimate US off-shore wind resources of 900 GW within a 50-nautical mile limit (assuming capacity factor of 0.4, this corresponds to 11.3 EJ). Much of the offshore wind resource lies close to major urban load centres with high-energy costs, and the energy can be brought to market with minimal new transmission construction. 98 GW of this resource is located in waters shallower than 30 m.
3
The figure assumed that all renewable resource potential is allocated to electricity generation. If biomass is used for heating or cooking, then transformation losses (assumed to be 65%) can be reduced. In the mid term, the highest value application of biomass will be through bio-fuels. 4 Storage and safety requirements for fuels in the transport sector can be better and more cheaply addressed by bio-fuel than by hydrogen. Space and water heating can be provided by solar and geothermal. In this case the transformation losses to electricity are avoided and local resources can be used up to five times more efficiently.
0
2
4
6
8
10
Sol
ar
Win
d
Tid
al
Wav
e
Geo
ther
mal
Hyd
ro
Ele
ctric
Dem
and
Bonn TBP (2004) WEA (2000) RIGES (1993)Shell (1996) Greenpeace (1993) WBGU (2004)Fischer & Schrattenholzer (2001) IEA (2002) WEC (1994)IPCC (1996) Hall & Rosillo-Calle (1998)
Bill
ion
Ton
nes
of O
il E
quiv
alen
t
Hoogwijk et al (2004)
Loss
es
Bio
mas
sE
lect
rica l
Out
put
Grubb & Meyer (1993)
Figure 1 Achievable Electric Energy from Renewable sources 5
4 Biomass can be converted into liquid form to produce Biofuels. Pyrolysis technology can be used to produce a combustible liquid that is a potential fuel for a furnace or a gas turbine, but the technology is still in the pilot stage. Alternatively, biomass can be used to produce fuels for transportation, notably ethers from oilseeds and alcohol fuels from the fermentation and hydrolosis of sugar or lingo-cellulose material. Anaerobic digestion or gasification of biomass produces gas that can be used in similar applications to natural gas. Small-scale biogas production is now a well-established technology and large-scale application is in the advanced stages of development. The possibility of using biogas in fuel cells exists, but there are a number of technical difficulties that remain to be overcome in this area. Source: www.britishbiogen.co.uk and WEA (2000). 5 All figures refer to electricity.Where necessary, figures are converted using 20% conversion for solar, 30% for wind, 35% for Biomass and 15% for Geothermal. Where possible, the figure refers to the electricity (or energy) that could realistically be harvested. This does not generally take into account economic considerations, but may include land use restrictions and sustainability considerations. Estimates from WBGU are generally lower than other sources, since this takes into account sustainability considerations. • For geothermal energy, the WEA makes estimates for the accessible resource, useful accessible resource and
accessible resource expected to be economical in 40-50 years and in 10-20 years. The numbers used in the figure refer to the resource expected to be economical in 10-20 years.
• For wind energy, potential varies according to assumptions about land availability, with the most restrictive assumptions represented in the graph to reflect achievable output. Grubb and Meyer (1993): Resource class three

4
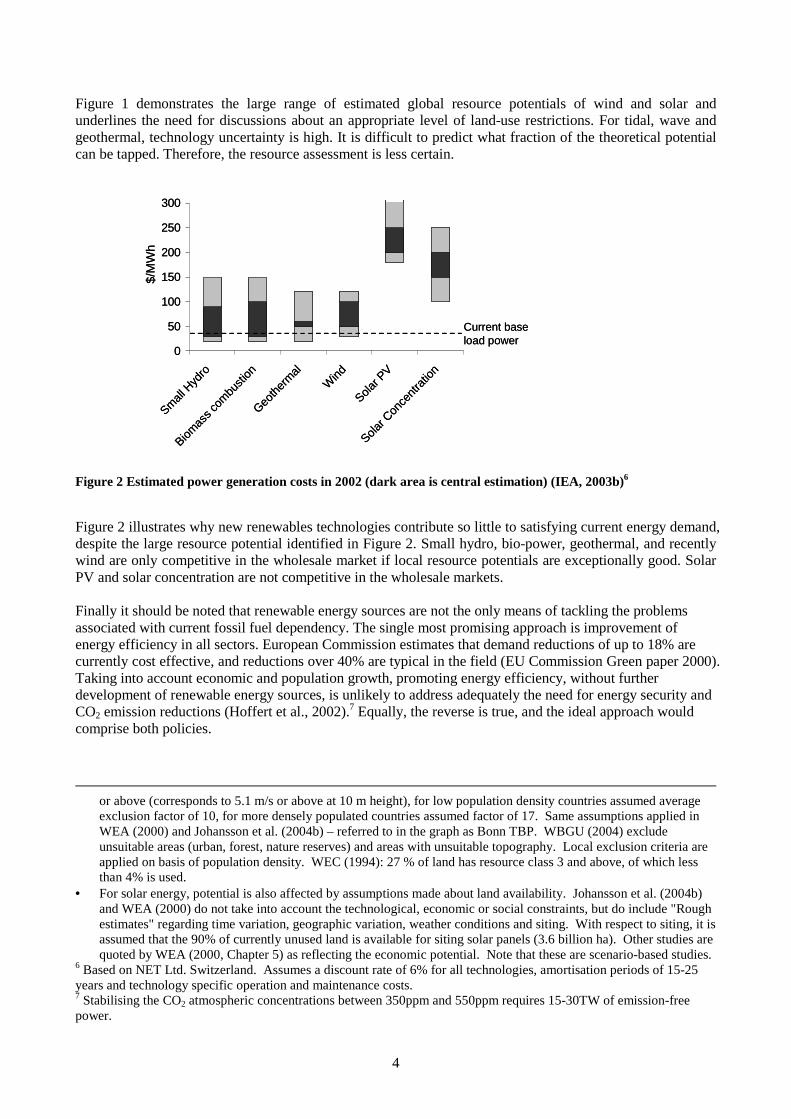
Figure 1 demonstrates the large range of estimated global resource potentials of wind and solar and underlines the need for discussions about an appropriate level of land-use restrictions. For tidal, wave and geothermal, technology uncertainty is high. It is difficult to predict what fraction of the theoretical potential can be tapped. Therefore, the resource assessment is less certain.
0
50
100
150
200
250
300
Small
Hyd
ro
Biomas
s com
busti
on
Geoth
erm
al
Wind
Solar P
V
Solar C
once
ntra
tion
$/M
Wh
Current base load power
0
50
100
150
200
250
300
Small
Hyd
ro
Biomas
s com
busti
on
Geoth
erm
al
Wind
Solar P
V
Solar C
once
ntra
tion
$/M
Wh
Current base load power
Figure 2 Estimated power generation costs in 2002 (dark area is central estimation) (IEA, 2003b)6
Figure 2 illustrates why new renewables technologies contribute so little to satisfying current energy demand, despite the large resource potential identified in Figure 2. Small hydro, bio-power, geothermal, and recently wind are only competitive in the wholesale market if local resource potentials are exceptionally good. Solar PV and solar concentration are not competitive in the wholesale markets. Finally it should be noted that renewable energy sources are not the only means of tackling the problems associated with current fossil fuel dependency. The single most promising approach is improvement of energy efficiency in all sectors. European Commission estimates that demand reductions of up to 18% are currently cost effective, and reductions over 40% are typical in the field (EU Commission Green paper 2000). Taking into account economic and population growth, promoting energy efficiency, without further development of renewable energy sources, is unlikely to address adequately the need for energy security and CO2 emission reductions (Hoffert et al., 2002).7 Equally, the reverse is true, and the ideal approach would comprise both policies.
or above (corresponds to 5.1 m/s or above at 10 m height), for low population density countries assumed average exclusion factor of 10, for more densely populated countries assumed factor of 17. Same assumptions applied in WEA (2000) and Johansson et al. (2004b) – referred to in the graph as Bonn TBP. WBGU (2004) exclude unsuitable areas (urban, forest, nature reserves) and areas with unsuitable topography. Local exclusion criteria are applied on basis of population density. WEC (1994): 27 % of land has resource class 3 and above, of which less than 4% is used.
• For solar energy, potential is also affected by assumptions made about land availability. Johansson et al. (2004b) and WEA (2000) do not take into account the technological, economic or social constraints, but do include "Rough estimates" regarding time variation, geographic variation, weather conditions and siting. With respect to siting, it is assumed that the 90% of currently unused land is available for siting solar panels (3.6 billion ha). Other studies are quoted by WEA (2000, Chapter 5) as reflecting the economic potential. Note that these are scenario-based studies.
6 Based on NET Ltd. Switzerland. Assumes a discount rate of 6% for all technologies, amortisation periods of 15-25 years and technology specific operation and maintenance costs. 7 Stabilising the CO2 atmospheric concentrations between 350ppm and 550ppm requires 15-30TW of emission-free power.

5
Switching fuel sources from coal to gas would reduce CO2 emissions while gas resources remain adequate. Carbon sequestration could capture CO2 from coal and gas power plants. This would require new technologies for sequestrating and storing CO2, storage facilities with low leakage rates, and deployment both of new power plants and of CO2 transport networks.8 Nuclear energy could provide for up to 40% of global electricity demand. However, assuming that proliferation risks continue to necessitate open fuel-cycles, the global uranium resources would only last for 50 years.9
3 Technological Barriers
Research to date does not point to fundamental technological barriers to renewable energy technologies. This assessment is robust for technologies such as on-shore wind, geothermal and solar PV (Alsema, 2000) 10, where deployment experience is significant. The assessment is also valid for technologies that have been applied in demonstration projects, such as offshore wind (European Wind Energy Association, 2004, Musial and Butterfield, 2004, Neumann et al., 2002) and solar concentration. Demonstration projects for wave and tidal energy are needed to assess potential technical barriers, and initial small-scale funding for this work has been announced.11 Typical concerns about renewable energy relate to their intermittency. However, a closer look at the technology mix and time scales go some way to answering these concerns. Availability is different for each technology. Hydro and bioenergy are seasonal, but storage makes their availability 80 – 100%. Solar is seasonal and daily. Wind is the most difficult to predict, but still has capacity factors in the 30 – 40% range. Geothermal is typically available 95% of the time over the productive life of the reservoir, usually 20 – 30 years. Wind, solar and wave intermittency can be assessed on three time frames. First, in the few hours before production, average regional output can be predicted with a high degree of accuracy. Remaining uncertainty is mainly due to sudden wind bursts shutting down turbines or cloud fronts covering solar panels. Transmission networks are already designed to cope with larger output changes caused by sudden shut downs of fossil or nuclear power stations (Grubb and Vigotti, 1997). For distribution networks using a large
8 Carbon sequestration involves the capture of CO2 produced during the use of fossil fuels, and the storage of this CO2. For example CO2 from the oil and gas production process are reinserted into the wells and enhance oil recovery. For large-scale application, new infrastructure must be built to transport and store CO2 underground. Furthermore, power plants must be replaced as effective CO2 capture requires new combustion processes. Although it has shown potential in niche markets, the required technologies are still at the development stage and need to reach demonstration stage. Cost-effectiveness is debated, but main objections are based on leakage of stored CO2 back into the atmosphere and the question of how to evaluate such future impact. Rather than providing a long-term solution, US scientists argue that carbon sequestration could be a bridge until better energy technologies are introduced. Sequestration would decrease peak atmospheric CO2 levels in the next decades (Hoffert et al., 2002). 9 A recent assessment of nuclear energy by an interdisciplinary research group at MIT concluded that “over at least the next 50 years, the best choice to meet [cost, safety, proliferation and waste management] challenges is the open, once-through fuel cycle.” (Ansolabehere et al., 2003). At twice the current uranium price, the known uranium resources suffice to fuel a global fleet of 3,000 reactors of 1GW for 50 years. Apart from nuclear operational and transport risks in this large-scale scenario, nuclear will provide less than 40% of global electricity demand. The MIT study suggested 1,500 reactors would require 15 million tonnes of uranium over 50 years and known resources of 30 million tonnes of uranium at price-levels below $80/kg of uranium. Improvements in mining technology or acceptance of higher uranium prices could allow for longer operation. Whether nuclear operated in an open cycle is sufficiently sustainable is unclear. Extracting 30 million tonnes of Uranium at e.g. $60/kg costs US$1.800 billion. Spending such sums on raw material extraction involves a significant energy and chemical inputs which might reduce the no-emission benefit of nuclear. WEA (2000) gives a far less optimistic picture, estimating global conventional uranium reserves and resources of only about 20 million tonnes (this includes estimated resources at extraction costs up to $260/kg). 10 Initially, the production of solar PV cells was rather energy intensive. However, by 1999, rooftop-installed and grid-connected PV paid back their life-cycle energy in 2-3 years. This performance is likely to improve with technological advances through learning and increase in the scale of production. 11 UK Department for Trade and Industry announced £50million funding for demonstration projects on August 3rd 2004.

6
share of renewables, sudden output changes can result in voltage swings, but power electronics offer solutions.12 Second, during the 24 hours prior to production, the accuracy of output predictions for wind, solar and wave is increasing. With improving predictions, the operation schedule for power plants and the transmission network should be able to be adjusted to make efficient use of all resources. Current electricity market designs do not provide the flexibility and trading liquidity for such readjustments. It is so far unclear whether markets or designated institutions are best suited to predict and schedule renewable output. Third, even intermittent renewables do make a statistical contribution to security of supply. All power systems carry a ‘capacity reserve margin’ of power plants to allow for unexpected plant or transmission line failures, exceptional demand peaks, etc. The probability of most renewables generating something at such times is in fact extremely high; they thus do increase the system reliability or, conversely, allow the reserve margin of other plant to be reduced whilst maintaining reliability. They make an important capacity contribution, as well as saving fuel; and the increasing geographical diversity as the total capacity rises increases both these contributions. Where wind power contributes up to 20% or 30% of electric energy, there are few additional requirements (Smith et al., 2004).13 PV output is, in many regions, correlated with peak demand from air conditioning and can therefore significantly reduce system costs (Herig, 2000).14 Retaining old power plants was historically the cheapest option for provision of back-up capacity for periods of peak demand or power station outages. This could also prove a low-cost way for initial support of larger market shares of intermittent renewables. Only in the long term, if intermittent renewable resources dominate electricity generation, would storage technologies need to play an important part.
4 Uneven Playing-Field
In liberalised energy markets, investors, operators and consumers should, in theory, face the full costs of their decisions. This applies to access to resources and capital, and the social and environmental impacts of energy consumption. However, current practice falls short of this ideal for complex reasons. In the first place, impacts may be hard to quantify. Second, even if potential impacts can be quantified, any decision on the extent to which they should be internalised will be a highly politicised judgement. This can be difficult enough with new technologies (for instance, opposition to the detrimental impact on landscapes of windfarms). But where impacts have previously been tolerated, seeking to change what are perceived to be existing rights is even more difficult. The same holds for those energy producers whose commercial viability has relied on a variety of financial and social subsidies. Not surprisingly, operators want to protect any benefits they have been granted and avoid any new constraints that would limit environmental impacts. Levelling the playing field to enable renewable energy to compete on a more equal footing involves tackling these unpriced 'advantages' for conventional technologies. The most obvious influence on markets are direct and indirect subsidies (see Pershing and Mackenzie 2004 for a recent survey). In 1992 the World Bank estimated that subsidies for energy totalled more than US$230 billion per year (Larsen and Shah, 1992). These have since fallen, but it is estimated that OECD countries alone still spent between US$20-30 billion on energy subsidies in 2002 (OECD/IEA/UNEP, 2002).15 The level of subsidies in developing and transition economies is much higher. These subsidies often include cheap domestic rates, which are intended to benefit people on low incomes, but usually benefit well-off
12 See recent EU research projects: www.sustelnet.net, www.dispower.org, and www.clusterintegration.org and http://www.ecn.nl/docs/library/report/2004/rx04078.pdf. 13 They survey nine US power system studies for varying levels of wind penetration. With penetration below 5%, impacts on system operation costs are small. They remain moderate, detracting approximately 10% of the wholesale value of wind, for penetrations of up to 20%. Strbac (2002) calculates the additional system costs for the UK. 14 He use the US-wide solar input from 1986-1995, and suggests that PV in commercial applications could reach a capacity factor of 66% and 39% in residential environments. 15Moor’s (2001) provided an alternative estimates for OECD countries. In the period 1995-1998 subsidies in billion US$ are: coal 30, oil 19, gas 8, nuclear 16, renewable and end-use technology 9, giving a total of 88. Globally, he estimated US$244 billion, of which $9 billion is attributed to renewable and end-use technologies.

7
households that tend to consume much more energy. The effect of such energy subsidies is increased consumption (IEA 1999)16 and delayed investment in energy-efficiency and renewable energy provision. In many developing countries, traditional energy technologies also benefit from export-credit guarantees extended by OECD government agencies. In the late 1990s export credit guarantees facilitated US$17 billion annual investment in fossil energy and only US$0.8 billion investment in renewables (G8, 2001).17 In 2003, the World Bank allocated only 13% of its loan portfolio to renewable projects .18 The nuclear energy sector illustrates a more subtle type of subsidy rooted in the role governments played in the development of the industry. An implicit government underwriting of accidents has meant that only very limited - and therefore rather cheap - insurance cover is required for nuclear power plants.19 The failure to adequately ‘internalise’ environmental impacts in prices is the other obvious source of 'subsidy' that makes it difficult for clean energy technologies to make headway. Traditional environmental regulation sets emission limits and requires firms to invest in improved combustion or exhaust clearing technology. Emissions below the emission limits also cause environmental damage, but firms are not exposed to these costs and will not include them in the energy price. Estimations for these damages, excluding the costs of global warming, range from additional €8.7 to €25/MWh for modern coal power plants (ExternE).20 Most of this damage relates to human health problems. These unpriced externalities will obviously rise if some account is taken of CO2 emissions and their contribution to climate change. Averaging over a large set of studies for the cost of climate-change suggests that the impact of electricity produced by coal can be conservatively estimated at €10-€23/MWh Tol (2003).21 The true costs are likely to be higher, as current studies compare snap-shots of future outcomes and ignore extreme weather events and the costs of changing infrastructure, agricultural practices and living patterns.22
16 The International Energy Agency estimated that removing consumption subsidies in eight non-OECD countries would reduce energy consumption by 13%. 17 According to the G8, between 1994 and 1998, export credit agencies provided US$44 billion to support energy intensive investments. This leveraged an additional US$60 billion in private investment. Only US$2 billion were provided for renewable energy projects. 18 The total loan portfolio of the World Bank has risen from 4% in 1990 to 13% in 2003. 19 The Price-Anderson Act requires licensees for nuclear power plants to have primary insurance of $300 million per site. Secondary coverage, in the form of retrospective premiums to be contributed by all licensees, is limited to $10 million per year and $95.8 million in total for each of its plants (United States General Accounting Office, 2004). Thus ~ $8 billion is the maximum financial "contribution" that the commercial nuclear industry would make in the event of nuclear catastrophe (http://www.nirs.org). In 2004, contracting parties to the OECD Paris (and Brussels) Conventions signed Amending Protocols, which require operators to insure up to € 700 million (Uranium Information Centre, 2004). 20 "Externalities of Energy, A Project of the European Commission", http://externe.jrc.es. The main driver is the human health impact of SO2, NOx and particles. Roth et al. (2004) estimated externality costs of modern coal plants in $/MWh as CO2 26.38, NOx 12.96, SO2 1.68, PM 0.24, N2O 0.15, upstream 2.57, land use 5.26, water related 1.3 (best estimates quoted) All externalities are based on coal power plants. They have the highest emissions levels (apart from peaking oil plants) and are therefore most likely to set the marginal electricity price if externalities are priced. Given current constraints on gas supply, it is likely that coal will continue to provide electricity in most countries whilst renewable energy technologies undergo strategic deployment. 21 In a survey of the literature, Tol finds that the average marginal damage costs of CO2 (derived from over 88 studies) was$29/tCO2 ($104/tC). He also applied weights to different studies and then calculated an average value of $13/tCO2. In advanced fluidised bed combustion coal plants with the production of 1.25 MWh of electricity, 1 tonne of CO2 is emitted. Therefore the production of one MWh of electricity in a coal plant produces damages between €10-€23/MWh. Roth et al. (2004) estimated global warming externality costs of $26.38/MWh. ExternE (http://externe.jrc.es) calculated a range of €3-€111/MWh. Lower marginal social costs of CO2 are calculated if higher discount rates are assumed. For example, if the utility of people in 100 years is only weighted at 5% of the utility of today’s population rather than 37% (by increasing the implied rate of time preference from 2% to 3%). Equity weighing leads to a higher estimate of the marginal costs and particularly to greater uncertainty (Yohe, 2003). Although equity weighing is theoretically sound, it does impose an idealised worldview on the estimates, since in reality, the rich do not care much for the poor (Tol 2003). 22 The current generation of aggregate estimates may understate the true cost of climate change because these tend to ignore extreme weather events, underestimate the compounding effect of multiple stresses, ignore the costs of transition and learning, and might also have overlooked how development could reduce impacts of climate change. (Tol 2003)

8
Cap and trade programs aim to internalise the costs of SO2, NOx and most prominently CO2 and might in the long-run ensure that electricity prices will reflect the true environmental costs. The experience gained in using emission-trading schemes is less promising. In political negotiations the emission reduction targets and therefore scarcity price of emission certificates are frequently set below the levels suggested by scientific evidence. To ensure the support of the power sector, a large fraction of the allowances are usually handed out for free. As a one-off windfall payment, based on historic output, this would not affect prices and investment decisions. The national allocation plans for CO2 allowances in Europe however show that politicians are reluctant to grant such large one-off payments. They insisted that free allocation is conditioned on future output or availability. This reduces the opportunity costs of allowances and the resulting electricity prices. Some national allocation plans also grant free allowances to new power plants. This distorts the technology choices (Keats and Neuhoff, 2004). 23 As a result of these political processes electricity prices will only gradually reflect environmental externalities. The recent debate on security of supply has highlighted a different way in which traditional energy pricing does not accurately reflect the social and economic risks many societies run. The dependence of many economies on imported fossil fuels means that they are vulnerable to serious disruption if geo-political events disrupt supply. The same risk applies to the disruptions of fossil fuel use in the case of future stringent action to slow global warming. Macroeconomic and technology models show that it is socially rational to diversify technology options when confronted with such supply uncertainties (Gruebler et al., 1999).24 For example, a study of the UK electricity system showed that wind power reduced the risk of power shortages during gas supply interruption, thus increasing the value of wind power by €7.60/MWh (Oxera, 2003). Further studies are required to put a price tag on the value of energy and technology diversity. If the political influence of incumbent energy companies is likely to hold back moves to eliminate subsidies and internalise environmental impacts, then there is a strong case for subsidising renewable energy to prevent an on-going distortion in the choice of technologies that figure in future investment decisions.
5 Marketplace Barriers
The electricity sector has been liberalised gradually to ensure that security of supply will be maintained. As a result, the electricity market has been designed to replicate the historic operation of centralised power plants and favours their operation. For example, solar PV can reduce peak loads on the distribution network in summer peaking systems, and combined heat and power - whether gas or bioenergy - can do likewise in winter peaking systems (Hoff and Cheney, 2000).25 But frequently network tariffs do not reward for this kind of system service (Alderfer et al., 2000).26 An other example for inherited market design are mechanisms that
23 The idea of cap-and-trade programmes is that producers’ political support is bought by an initial hand out of free allowances. Producers can resell their allocated allowances and therefore should still include the full allowance price into the electricity price. This has two drawbacks. First, it leaves fossil fuel generation companies with cash from the free hand-out. Given existing management expertise, these companies are more likely to reinvest in conventional generation capacity. Second, in the implementation process, politicians are usually reluctant to allow entirely free hand-outs, but make future allocation in some form contingent on future output. This restricts generators from reselling their free allowances, and reduces the (opportunity) cost of emissions for the involved generators. 24 They simulate a three-technology energy sector optimising social welfare. Uncertainty about a potential need for new technologies (e.g. uncertainty about demand or carbon prices) results in earlier and larger investment in new technologies. 25 They evaluate rural US electric cooperatives (8% of total electricity sold) and conclude that it is cost efficient to build decentralised power systems rather than replace existing lines. This would involve approximately 700 MW of PV which would provide a value of $3,000/KW and additional 1,8GW with marginal value of $2,000/kw 26 Alderfer et al. report that utilities frequently propose high charges for the interconnection of distributed generation. The charges are subsequently reduced at the intervention of regulatory bodies, but with significant delays. However, the situation might be improving with the higher value of distributed resources reflected in recent legislation. Forty US states have implemented metering legislation allowing PV owners to run their meter backwards if their PV production exceeds their own demand (Duke 2002). Net-metering increases the price received by distributed PV from the wholesale price to the retail tariff.

9
accommodate the inflexible operation of some fossil and nuclear power plants, while few markets provide flexibility for intermittent generation. The main operational concern for renewable energy technologies is that wind, solar and wave output cannot be predicted with sufficient accuracy at the time of the liquid day-ahead market. By the time the prediction accuracy improves (about four hours before final production) most international electricity transmissions have been allocated and liquidity in energy markets is low. This is despite the fact that transmission flows can be adjusted within seconds, most power plants can be started and stopped and all power plants can change their output within this time frame.27 As a result, the electricity system is operated inefficiently and wind, solar and wave selling their output in the general energy market receive lower than justified prices. In most countries electricity generation companies have high market shares in their regional markets and can influence prices in day-ahead and intra-day markets. Currently they sell most output on longer-term contracts and therefore profit little and will typically refrain from influencing short-term prices.28 With higher penetration of renewables, trade in the short-term market will increase. At times of low renewable output, it is profitable for conventional generation to sell additional output in the short-term market above costs. At times of high renewable output, it is profitable for conventional generation to buy back energy sold on longer-term contracts, but below cost. This market power will reduce the revenue of intermittent renewables and is likely to result in production inefficiencies (Neuhoff and Twomey, 2004).29 Vertically integrated companies face additional incentives to obstruct the entry of renewable energies, if this takes market share from their conventional generation assets, or if it results in changes to the transmission system, which reduce the value of some of their existing assets (Alderfer et al., 2000).30 But also inexperienced or inert companies can increase project costs for decentralised generation and cause unnecessary delays, when they have not established procedures for interconnections or ask for technical assessments and insurance cover that is only appropriate for large central power plants. Regulatory intervention can prevent31 or compensate initial investors for these costs (Kammen, 2004).32
A different set of question relates to the regulatory and market risk of investment in electricity generation capacity. It is currently widely debated, whether the risk might prevent timely investment in new generation
27 This effect is enhanced if in systems like the English and Welsh NETA renewables generators balance their output if they want to avoid high imbalance prices. As individual output is relative more volatile than aggregate output this results in higher levels of spinning reserve. 28 Electricity producers sell longer-term contracts to hedge the price risk and to compete for market share, but sometimes regulators also intervene and require the sale of output in a longer-term electricity auction, for example in France. 29 To reduce the incentive to exercise market power in short-term markets, generators with significant market share should sign long-term option contracts. This would increase the incentive to bid at cost-reflective terms in the short-term market. Economic modelling however shows that generators have limited incentives to sign such contracts. Alternatively renewable project developers can sign power-purchasing agreements with large utilities that provide internally for the balancing. As only few utilities will be able to provide the local balancing they can capture most rents and restrict total investment quantity. 30 They observe that utilities are reluctant to connect competing generation (PV) to the network. They induce permitting delays and require exorbitant liability insurance for residential PV systems. Most of the distributed power case studies experienced significant market entry barriers. Of the 65 case studies, only seven cases reported no major utility-related barriers and were completed and interconnected within a satisfactory timescale. 31 Alderfer et al. (2000) suggest a ten point action plan for reducing barriers to distributed generation. This consists of (1) uniform technical standards, (2) certification procedures for interconnection equipment, (3) acceleration of development of distributed power control technology, (4) adoption of standard commercial practice for any required utility review, (5) standard interconnection agreements, (6) development of tools for utilities to assess value and impact of distributed power at any point in the grid, (7) regulatory principles compatible with distributed power choices, (8) regulatory tariffs to fit distributed power model, (9) establishment of expedited dispute resolution processes and (10) definition of conditions necessary for the right to interconnect. 32 If the market share of a technology is at or below 1%, niche applications or specific regulatory provisions dominate its economies even when they are economically competitive on a technology-to-technology comparison.

10
capacity.33 This risk could be eliminated by long-term contracts between final consumers or consumer franchises and electricity generation companies. But current regulators prevent such long-term contracts in an attempt to foster retail competition.34 This exposes investors to electricity price risk and induces them to charge a risk premium on their capital. The risk premium, created by artificial regulatory constraints, affects capital-intensive technologies more than technologies with high fuel costs and therefore biases against nuclear and renewables (Neuhoff and De Vries, 2004).
Regulators are concerned about the implications of investment risk, because it could postpone investment causing unpopular power shortages. But instead of reducing market and regulatory risk, they typically implement financial payments for available capacity. This retains the bias against capital-intensive technologies and some designs even reinforce the bias.35 Furthermore, the short-term contracting in electricity markets can reinforce cyclical investment patterns. This can hinder development of small industries with less scaling opportunity and restrict their opportunities for production improvements.36 Financial markets face difficulties in providing risk management instruments for new renewable technologies (United Nations Environment Programme, 2004). First, historical actuarial data is not available to assess risk (Sonntag-O’Brien and Usher, 2004). Conventional technologies have never faced these difficulties, because they were already deployed before liberalisation. Historic records from these times have allowed risk assessment since liberalisation. A second disadvantage faced by renewable energy projects is their small scale. It results in disproportionately high transaction costs for risk management tools, complex financing arrangements or export credit guarantees.37
6 Non-Marketplace Barriers
The complex interactions between the public, administration, private sector and electricity system operators can create non-marketplace barriers for new energy technologies. Administrative frameworks were developed for existing technologies and are not yet tailored to the needs of renewables. While spatial planning traditionally envisages specific zones for industrial development, local plans frequently have to be revised to allow for the location of wind or bioenergy plants, thus creating
33 It is currently being debated whether revenues from electricity sales alone provide sufficient incentives for sufficient investment in electricity generation capacity. Higher capital costs are one reason for investors to delay any investment until electricity prices rise. Capital costs are higher because future electricity prices are uncertain, increasing the risk investors face. In theory investors could sign long-term contracts with consumers to hedge against this risk and reduce capital costs. In practice few contracts covering more than five years are signed. First, because transaction and information costs are high and second, because retail companies (unless vertically integrated) are not a credible counter-party for long-term contracts with generators. Scandinavian experience shows that final customers are also unlikely to sign long-term contracts, possibly because they anticipate government support if prices of their short-term contracts rise. 34 Retail competition has been introduced in most market designs to balance the market power of large generation companies, particularly where they are vertically integrated. Retail competition requires that customers can freely switch their electricity supplier, and therefore limits the possibility of long-term contracts. 35 Several markets designs have included capacity payments or capacity markets for dispatchable generation capacity. These instruments can discriminate against intermittent generation. Intermittent generation capacity does not qualify for capacity payments and might have difficulty in interacting in insufficiently liquid capacity markets. 36 Markets with capital-intensive production typically exhibit cyclic price and investment patterns (e.g. oil-refining, aluminium and electricity). This could create difficulties for producers of renewable energy technologies. They have less production experience, more problems in scaling up production during boom periods, and will capture less of the increased market size. Finally, focusing on rapid up-scaling of production is likely to divert focus from cost-efficiency, thereby delaying technological learning. Market designs that support long-term contracting might provide for more forward-looking information and could reduce the cyclical nature of the market. 37 Large institutions like the World Bank have little track record with efficient administration of small-scale projects (below $15 million). Beck and Martinot (2004) argue that rural energisation and electrification policies therefore start to use small-scale entrepreneurship.

11
uncertainty and costly delays for project developers (Admire Rebus, 2003).38 The small scale of renewable energy projects multiplies the relative costs incurred through multiple administrative processes. For example, biogas plants in Germany require several parallel permit processes designed to address issues such as EU regulations to prevent the spread of BSE, while large power plants only require a single general permit process (Klinski, 2004).39 Reliable and comprehensive information about the motivation and benefits, as well as the costs and externalities, of renewable technologies must be shared with involved and affected citizens.40 While early investors in renewable energy technologies require technical and economic information on which to base their decisions, subsequent groups of adaptors might have to familiarise themselves with the technology through trial and error and learning through experience (Kaplan, 1999). Citizen support has been seriously affected by myths about wind turbines as bird killers41 or excessive energy-intensity of solar PV production, based on prototype figures (Alsema, 2000). In contrast, German project developers report that if they involve citizens and local councils in the early planning stages, they are more likely to obtain planning consent. In addition, polling in Europe shows that support for wind energy tends to strengthen after plants have been installed and in operation for some time.42 This illustrates that some time is required to allow stakeholders to adjust to and accept new technologies. The successful deployment of wind turbines in Denmark is a result of long-term thinking, local community involvement, benefits to incumbent energy companies, public and private R&D support and government support (Ministry of Economic Affairs, 2004).43 Over time,44 Denmark has developed domestic industries to design, finance, insure, manufacture, install and maintain renewables systems, using local equipment and labour (Sawin, 2004). This shows that countries cannot simply rely on adopting an internationally developed technology, but have to give population, industry and administration a chance to get used to a new technology and learn how to deal with its new characteristics (Duke et al., 2002).45 Because of this
38 They surveyed wind project planning phases in European countries. Average lead times are between 1.5 and 4.5 years. The principal administrative cause of delay is linked to spatial planning. The report lists general principles to allow competent authorities to simplify and clarify procedures. 39 EU decree 1774/2002 is aimed at preventing spread of BSE when dealing with animal by-products. 40 The Nebraska Public Power District asked its customers whether it should go forward with a $200 million wind project in exchange for a 2.5% rate increase. 96% said yes, and 37% voted for a larger wind project. Among Colorado residents, 82% supported “wind and solar” even if rates would increase as a result. (Wind Power Outlook 2004, www.awea.org). 41 For example, the nine harbour-wall turbines at Blyth are in a busy bird area. Of the bird flights through the wind farm, only one in 10,000 have resulted in a collision. This translates to 1-2 collisions per year per turbine. To put the issue into perspective, cars in the UK kill every year more than 10 million birds. (www.yes2wind.com, funded by Friends of the Earth, Greenpeace and WWF) 42 Polling in Europe shows that support for wind energy tends to strengthen after a wind plant has been installed and operating for some time. In Scotland, according to a 2003 survey, people living close to the ten largest wind farms in the region strongly support wind: 82% of the respondents want an increase in electricity generated from wind, and 54% support an increase in the number of turbines at their local wind farm. In Spain, studies surveying the Catalonian province of Tarragona showed that 80% favour wind energy, with the strongest support coming from people residing near a wind farm. (Wind Power Outlook 2004, www.awea.org) 43 To achieve this objective, the Netherlands apply a transmission management in which a vision of the way forward is agreed with all stakeholders, and the government not only brings the parties together, but also supports experiments to facilitate institutional and technological learning (see also Kaplan 1999). IEA (2003) emphasises that stakeholders from all relevant groups need to be actively engaged in the programme, in some cases even in the design phase, and contribute to case studies (Austrian Biomass Heating and Danish Labelling Scheme for Buildings). 44 IEA (2003) points out that new technologies require major changes, “not just in routines and procedures familiar to many actors, but also in the models and concepts that underpin decisions. Basic ideas on ‘How we do business around here’ may have to be re-evaluated, for example in the shift from centralised to decentralised power generation.” 45 They show that wide variety of product quality constrains sales of PV modules for solar home systems in Kenya, as some customers refrain from purchases due to the associated performance uncertainty. Domestic product testing with public disclosure represents an inexpensive, low-risk strategy, but may prove inadequate. International certification with PVGAP (Geneva) or PowerMark (US) exists, but seems to be insufficiently established in developing countries. PVPS (2003) reports all PV models must qualify under IEC 61215.

12
‘institutional learning’ process (Espejo et al., 1996),46 countries benefit, if they support the deployment of renewables before they are fully cost-competitive. This will remove non-market place barriers for subsequent use in competitive markets and accelerates their future growth.47
7 Technology Lock-out
Technology ‘lock-in’ and ‘lock-out’ refer to various processes, which favour conventional, established technologies at the expense of innovative technologies. The classic example of lock-in is the ‘QUERTY’ keyboard layout, reputed to have actually been invented to slow down typing to rates compatible with early typewriters; other, more efficient layouts, have never been able to gain acceptance. The obstacles of uneven playing field, market-place, and non-market barriers identified above can be seen as specific aspects of lock-in to established energy technologies that serve to deter new renewables. Lock-in is exacerbated by several factors that lower production cost (including economies of scale and learning-by-doing) and adoption cost (including increased market confidence and learning-by-using) of incumbent technologies (Sanden and Azar, 2004).48 Figure 3 shows how new renewable technologies have consistently reduced their costs with increasing market experience. The fact that the cost of new technologies falls with increasing deployment49 has been established in a large set of studies on energy technologies50 and in other industry sectors.51 Consequently, without large-scale applications, the cost of new technologies can stay high and investors will continue to use established technologies. For all these reasons, new technologies can be ‘locked out’, and energy systems themselves may be highly path dependent – what seems economic in the future depends on previous patterns of investment. 52
46 Institutional and organisational learning increases the capability of an organisation to act effectively. (Espejo et al., 1996) Users, insurers and the finance sector require data on realised project performances for evaluations. (Sonntag-O’Brien and Usher, 2004) 47 Dekimpe et al. (2000) use the Mobile Telecom industry to illustrate that the marketing paradigm of Rogers (1983) in which customer groups are classified in temporal segments from innovators and early adopters to laggards, also applies to the community of nations. This suggests that global partnerships could provide benefits if they manage to prevent delays in the deployment of profitable renewable technologies. 48 For this reason it does not suffice to only level the playing field – e.g. by Carbon pricing – but additional support is required to allow sufficient improvements through market experience to un-lock renewable energy technologies. For a discussion of the interaction between technology support, e.g. green certificates, and CO2 pricing see Jensen and Skytte (2003). 49 Figure 3 shows for several energy technologies that with each doubling of global production, costs fall by a constant percentage. With PV, manufacturing and installation costs dominate and their reduction is the focus. Therefore subsequent analysis focuses on installed capacity rather than produced output. Estimation of learning curves must typically use price rather than production costs as input, but in competitive industries such as PV, long-term learning rates are either not affected (Duke 2002), or average out over time. 50 Watanabe (1999) shows that 70% of price reductions in the Japanese PV industry can be attributed to learning effects. Isoard and Soria (2001) identify Grainger causality between installed capacity and capital costs both for wind and PV, and confirm that economies of scale apply to PV, but not to wind. The result confirms (Neumann et al., 2002) that increasing turbine size does not reduce cost per MW (but accessible resource base and therefore cost per MWh) due to disproportional increase of mechanical forces in larger turbines. A literature survey across several industries by Isoard and Soria (1997) indicates that learning effects usually dominate scale economies. IEA (2003) concludes that “there is overwhelming empirical evidence that deploying new technologies in competitive markets leads to technology learning, in which the cost of using a new technology falls and its technical performance improves as sales and operational experience accumulate.” 51 McDonald and Schrattenholzer (2001) show that for emerging technology, price typically falls between 5-25% with each doubling of cumulative industry output, with most clustered between 15-20%. 52 See Kline (2001). The effect is also described as path dependency of our economy (Arthur, 1994). Unruh (2002) provides historic examples and explains the institutional reasons.

13
Figure 3 Learning-curve for energy technologies (IEA, 2000).
The strength of technology lock-out varies across industries. In many consumer and information technology markets, the new services offered by new products dominates; consumers buy what is new because it is different and appealing, and this dominates over any tendency to lock-out. However, the energy sector exhibits three basic characteristics that result in a strong technology lock-out. First, new technologies produce the same basic product – electricity, in the case of most renewables. Hence, they have to compete mainly on price, making them immediately more vulnerable to lock-out. This is sharp contrast to the IT, telecoms and other sectors where product differentiation is a prime instrument of marketing and innovation and the innovator can charge more for enhanced functionality or reduced size of a new device. Second, perhaps because they involve transformation and delivery of large quantities of energy, the technologies and systems tend to involve large-scale engineering products that last decades. This greatly increases the scale and timescale of financial investment required, and this multiplies the risks associated with innovation; it also means that new energy technologies compete with incumbents that have gained market experience over several decades and large quantities of global investment, often drawing on prior public R&D. Third, both the above factors make it far harder for individual private firms to appropriate the full benefits of R&D. 53 Technology ‘spill over’ allows other companies to copy the initial learning at a fraction of the costs. 54 As more producers compete, the benefits of the invention are split among several producers that share the
53 Dasgupta and Stiglitz (1988) show that oligopolistic firms might be prepared to incur initial losses by expanding their production if learning effects would reduce their future costs, thereby allowing for larger market shares and profit margins. This effect is unlikely to play a dominant role in renewable energy technologies, with long-time frames and competition from existing generation technologies, and not only competition from the same technology. Duke and Kammen (1999) argue that the resulting market power of firms with cost advantages coupled with the non-internalised social benefits of learning ‘spill over’ induces firms to reduce output below the social optimal level, providing an additional rationale for government intervention. 54 Few studies assess learning-by-doing ‘spill-overs’. Irwin and Klenow (1994) investigate the semiconductor industry, and the results are consistent with the existence of ‘spill overs’ between firms on an international scale. Own learning is more effective per unit of cumulative production, but global cumulative production is larger. See also Watanabe et al. (2001).

14
market and consumers that pay lower prices.55 This problem has been resolved in the pharmaceutical sector by granting patents for inventions – and companies spend 15% of revenue on drug development. However, pharmaceutical patents protect a specific, distinct drug; it is far harder to define engineering patents in ways that cannot be circumvented over time56, and renewable energy technologies consist of a large set of components and require the expertise of several companies to improve the system.57 In addition, the scale and timescale of “learning-investment” tends to exceed the funds of individual companies and the patience of the venture capital markets. 58 The oil sector is relatively innovative because the economic rents on oil are enormous (and even here, government incentives have played an important role). But power companies operate in regulated markets that limit their profits, and, moreover, where governments could change regulations to extract the economic windfall from any major successful innovations. As a net result of these factors, private sector R&D in energy is below 0.5% of sales revenue compared to more than 10% in IT and the pharmaceuticals sector (Margolis and Kammen, 1999).59 Furthermore, innovation is required to address ‘public goods’ needs, like energy security and climate change, in which the economic returns to investors depend upon future government-policy – amplifying further the uncertainties facing potential innovators.
8 The economics of Strategic Deployment
These diverse barriers to deployment and impediments to innovation underpin the case for ‘strategic deployment’ of renewable energy technologies, which means the use of diverse policies to foster large-scale private investment before they are commercially competitive in current energy markets. The experience with on-shore wind power is a good example of the success of strategic deployment. R&D-led attempts in Germany, the US and others to build multi-megawatt wind turbines in the early 1980s failed both on engineering and cost grounds.60 At the same time, private and subsequently public initiatives supported the deployment of small wind turbines in Denmark. Through application experience, the turbine manufacturer learned how to address design challenges and the turbine size gradually increased (Grubb and Vigotti, 1997).61 Today’s commercial turbines have reached the size of the ambitious experimental turbines 55 See Duke and Kammen (1999) for a summary on the impact of partial appropriation of learning benefits by oligopoly firms. For simplicity the calculations in the next section assume full spill over. This seems appropriate, because of the long period until breakeven in the centralized grid market. Therefore even private up-front investment under partial spill-over will be recovered during the period of strategic deployment and therefore ‘refinanced’ through strategic deployment support. 56 First, successful drugs targeting is guided by scientific knowledge but requires a lot of luck. Therefore, it might take time for a competitor to find a substance with similar characteristics. Second, the new substance requires the same extensive clinical trials, which are the most expensive part of drug research and development. The substance will only be accredited if it has better features than the existing drug. Third, the follower must decide whether all these costs will be recovered with lower market share in a lower-margin duopoly market. 57 The monopoly position granted by patent rights in the pharmaceutical industry results in inefficient markets. Profits account for 30% of sales volume, with marketing and administration accounting for a further 30%(Based on SEC filings, annual reports, Hoovers and company presentations for Abbott Laboratories, Johnson&Johnson, Novcartis, SmithKline Beecham, Merck & Co, Bristol-Meyers Squibb, American Home Products, Astra Zeneca, Pfizer, GlaxoWellcome for the year 1999) 58 However, a consortium will face difficulties in sharing the costs of “learning investment”, as it is difficult to negotiate and fix the allocation of future profits. Firms are therefore reluctant to invest for the benefits of consortium members (the hold-up problem). There is even the risk that enhancing intellectual property rights protection impedes innovation and diffusion of new knowledge (Alic et al. 2003). 59 They show that drugs, profession & scientific instrument and communication sectors spending more than 10% of net sales revenue on R&D. Services and Transport spend more than 6% and Industrial chemicals more than 4% on R&D, while energy and primary metals spend less than 0.5%. 60 A WTS-4 4 MW wind turbine was located at Medicine Bow/ US- Wyoming, had its first year of operation in 1981, was damaged in January 1995 but produced on average less than 1100 full hours per year. A 3 MW turbine Growian located at Kaiser-Wilhelms-Koog in Germany, had its first rotation 1984 and was dismantled in 1987. 61 Sanden and Azar (2004) argue that the diversity of firms in Denmark and Germany allowed experiments with various wind turbine designs. Less variety in design approaches resulted in initial failures of wind power development in

15
in the 1980s. A combination of public and private R&D, market feedback, operational experience and incremental improvements achieved cost reductions and allowed an increase of turbine size. At windy locations, wind power is now as cheap as new conventional capacity, and it may approach competitiveness in other locations depending on competing fuel cost and the extent to which policies reflect environmental costs. The wind power market is burgeoning, with growth sustained at 20-30%/yr annually since the early 1990s. Strategic deployment of wind energy cost Denmark an estimated US$1.4bn subsidies over 1993-2001; annual revenues of Danish wind companies by 2001 were $2.7bn, the vast majority from its dominant position in export markets (Carbon Trust, 2003). Strategic deployment programs have to cover the difference between wholesale electricity price and the costs of new technologies. These costs of renewable technologies are initially high, as they have not experienced improvements through market experience. With increasing cumulative installation and market experience costs of the new technology fall. 62 Strategic deployment has to be continued until the cost of a new renewable technology becomes competitive with conventional technology (whose costs may also decline, but more slowly since they are at a much higher level of maturity). The grey area in Figure 4 illustrates this process, including the need for up-front subsidies at declining rates. As indicated, the time to break-even, and the longer term gains, will also depend upon the emergence of policies that reflect environmental costs, and in particular, CO2.
Cos
t to
Pro
duce
E
lect
ricity
Cumulative installationBreak-Even
Point
New Technology Established Technology Established Technology (with CO2 Pricing)Public learning investmentFuture Benefit
Cos
t to
Pro
duce
E
lect
ricity
Cumulative installationBreak-Even
Point
New Technology Established Technology Established Technology (with CO2 Pricing)Public learning investmentFuture Benefit
Figure 4 Learning investment and future benefits of a new technology
After the break-even point is passed, new technologies produce electricity below the costs of established technologies and consumers will benefit from lower costs (striped area in Figure 4). In economic terms, the up-front subsidies seek to internalise the benefits of strategic learning, which to a large degree is an external, public good. For technologies with some market experience, like wind and solar photovoltaics (PV),63 historic data can be used to estimate (IEA, 2000, McDonald and Schrattenholzer, 2001) costs and benefits of such an active technology policy.64 Table 1 shows the public ‘learning investment’ that may be required to create sufficient
Sweden (Bergek and Jacobsson, 2003) and the US (Norberg-Bohm, 2000). Jensen (2004a) provides a detailed case study of the Danish wind turbine industry. 62 Costs also fall for established technologies, but at a slower pace. However, for established technologies, doubling of global installed capacity takes much longer and further cost reductions are therefore slower. 63 Cost predictions for off-shore wind, solar concentration and marine technologies rely on engineering assessments, which are more detailed but also more subjective as a specific technology evolution has to be assumed. 64 An accurate estimation of future costs would require an accurate prediction of the development of technology. With technology evolution such estimates are impossible, but improvements through market experience can be used to estimate technology cost evolution. Such improvements have been observed across various industry sectors and energy

16
market experience for PV to make it cost competitive with existing technologies (See Appendix I for more details). In the base case €20 billion of public subsidies are required spread over the period 2005-2023. The calculations assume that PV is applied both in markets for high value off-grid and distributed PV and in centralised installations to gain sufficient scale.
Future wholesale electricity price level Public Learning investment (billion Euro) €40/MWh €50/MWh €60/MWh
Slow 110 55 29 Historic 38 20 12
Rate at which technology improves with market experience Rapid 17 10 6
Table 1 Public learning investment required to make photovoltaic cost competitive at wholesale level.
Two uncertainties drive the prediction. The first uncertainty is the future costs of conventional generation, including the extent to which environmental and security externalities are internalised; this determines the wholesale price against which PV needs to compete. Second is the rate at which PV costs decline with increasing market experience.
technologies. Evidence from historic data can never provide a guarantee that a technology will continue to follow the established cost path: the technology might never achieve, or could outperform predictions. One fundamental assumption of the improvement through market experience (learning curve) methodology is that the pattern of cost reductions caused by global installed capacity will not undergo fundamental future change. This result requires thorough examination as it has significant implications for government technology policy. I surveyed the literature and conducted a large set of interviews, but have not yet found arguments that contradict the result. Lieberman (1984) shows that in the chemical processing industry time becomes statistically insignificant if log cumulative production is used as explanatory variable and Jensen (2004b) critically discusses different modelling approaches. Papineau (2004) is the only paper I found that identifies time as significant explanatory variable for price reductions in a regression of PV module prices. This could be interpreted as if we merely have to wait for a sufficient length of time, and that technology cost will fall. However, the estimation did not include the log of global cumulative installed capacity as an explanatory variable. In the observation period, global PV penetration increased exponentially (with constant growth rates). Therefore the log of global cumulative capacity is almost perfectly correlated with time. In the sample it is impossible to identify whether time or global cumulative installed capacity drives cost reduction. The analysis, however, shows that regional cumulative capacity explains some regional price evolution. This supports the point that local learning reduces local costs. One disadvantage of the traditional learning curve is that costs approach zero with increasing deployment, which is not realistic. To address this concern, Denis Anderson (Imperial College London) uses a learning curve with a lower floor, but empirical observations are so far insufficient to estimate both parameters. However, bottom-up technology assessment suggests that renewable energy technology costs are sufficiently far from a floor of unavoidable costs. Based on assumptions about the minimum raw material input required, Zweibel (1999) estimated minimum costs of: $0.4/Wp thin film, and EPRI/OUT (1997) estimated $0.67/Wp crystalline and $0.31/Wp thin film (Duke 2002). WEA (2000) estimate long term system costs of $0.5-1/Wp. Therefore, the simplified learning curve used in the cost benefit analysis does not affect the calculation of the break even point, but might bias the calculation of the net present value up-ward if it contains benefits from future cost reductions close to the lower cost bound. Various extensions of the learning curve model are currently being developed to capture the interaction of cumulative production and research and development expenditure. All the models try to explicitly model the impact of research and development expenditure, which are implicit in the traditional learning curve model.The learning rate is estimated on historical data, and historical cost reductions were achieved due to both cumulative production and to research and development expenditure. Gruebler and Gritsevskyi (1997) introduce a model that assesses learning as a function of aggregate expenditure in R&D and market expenditure. Kouvartiakis et al (2000) apply the two-factor learning curve, a Cobb-Douglas type production function, with both factors acting as substitutes according to their so-called learning-by-doing (cumulative installed capacity) and learning-by-searching (R&D) elasticities. Barreto and Kypreos (2003) observe that the two-factor learning curve approach is limited by “unsolved estimation and data issues, but constitutes an important step towards understanding the role of R&D”. Williams and Terzian (1993) use experience curves to show strong positive net present values for technology deployment and R&D policies under a range of parameters.

17
Future wholesale electricity price level Ratio NPV/Learning investment €40/MWh €50/MWh €60/MWh
Slow 0 2 9 Historic 4 15 38
Rate at which technology improves with market experience Rapid 17 44 92
Table 2 Ratio between NPV and learning investment.
These uncertainties influence the benefits that society will obtain from strategic deployment.65 Table 2 shows the global ‘strategic benefit/cost’ ratio for the PV cases indicated in Table 1. In the base case, the benefits (until 2040, at a 5% discount rate) would be 15 times the costs of learning investment.66 However, if both learning rates and the reference electricity price is at the lower end of the assumed distribution, the ‘learning investment’ would not be recovered by 2040. This type of technology risk is unavoidable (Alic et al. 2003).67 It requires continuous evaluation of technology progress in order to stop unsuccessful programs. It also requires support of several technology options to ensure that future energy security is not jeopardised if one technology does not satisfy expectations. Of course, the real picture is complicated by the diversity of resources and potential applications (eg. off-grid or buildings-integrated PV may attract a far higher electricity value, whilst PV-electricity in very sunny regions is obviously cheaper than in others). In addition, there are issues of international competition; learning is likely to be partly domestic and partly generic, and many different actors and countries could contribute to learning, and in turn, recoup benefits of component or machine exports (as in Danish wind energy). But the fundamental point is that there is a clear economic case for government action to build markets for advanced deployment of emerging clean energy technologies. In such strategic deployment, policy determines the subsidy volume and therefore the growth rate. The previous calculations assumed a growth rate of 35%, slightly above recent development (PVPS, 2003)68 and slightly below the growth rates of the semi-conductor industry.69 If the growth rate is reduced, then more learning takes place in high-value off grid and distributed markets. This reduces the cost of strategic deployment, but also postpones the benefits which society will obtain from larger scale application of competitive PV.70
65If models with perfect foresight endogenise technological learning, they suggest early investment in initially expensive technologies, assuming that these technologies exhibit sufficient cost-reduction potential along the time horizon (Barreto and Klaaasen, 2004). Zwaan et al. (2002) model endogenous technological change with learning based on cumulative capacity. The socially optimal investment pattern results in earlier investment in new technologies with earlier emissions reductions and lower carbon tax levels. 66 The estimation of the benefits of an energy technology is easier than in most sectors where the demand or preferences for a new product first have to be created. It is far more risky to determine the value of a new service, like 3G mobile phones. 67 Uncertainty is a part of innovation. Policy-makers must be prepared to tolerate some “failures” (i.e., investments that do not pay off), and learn from them. This is common among private entrepreneurs in other sectors. 68 Averaged installed capacity increased by 32% between 1996 and 2002. 69 D-Ram semiconductor sales show an average annual growth rate of 33%, in units shipped of 43% and in shipped memory density of 98% for the period 1974-1998 (Source: Firsthand, Understanding Semi Conductor Cycles, http://advisors.firsthandfunds.com/documents/investor_ed/semiconductors.pdf). 70 Reducing the growth rate to 25% reduces net present value provided by PV by 60% in the period until 2040. Models with perfect foresight and endogenous learning confirm this result. They behave in an all-or-nothing fashion. If a technology such as PV has the potential to be cost-effective and its future benefits outweigh the learning costs, the model maximises investment up to the maximum growth rate of the technology. However, industry will face difficulties when scaling production up or down excessively. Therefore, Barreto and Kypreos (2003) apply maximum growth and decline rates (15%, 10%) for R&D budgets in their model for endogenous technological change. Rasmussen (2001) includes learning by doing in a macroscopic model, but fixes the rate of subsidy for renewable technologies. This effectively allows the author to set growth rates for renewable technologies.

18
The anticipated cost improvements can only materialise if producers invest and experiment with new production processes and technology options. For this to happen, industry has to be confident that the global market growth will be sustained. Whilst it is not difficult to give guarantees around individual projects, it is far more difficult to guarantee that strategic deployment policies will be maintained – indeed, they are bound to be reviewed periodically. However the more countries that are engaged, the less exposed producers will be to interruptions of policy processes in individual countries (Wilson, 198971, Grubb and Vigotti, 199772).
9 Policy instruments
This paper has surveyed five key features of energy-technology systems: uneven playing field; specific barriers in market, and non-market structures; lock-out phenomena; and the overall economics of strategic deployment for technology learning. Together these form an overwhelming economic case for policies to help build markets in emerging renewable energy technologies as part of any strategy for tackling global energy problems. In the absence of such policies, new renewable technologies will be introduced with large delays, if at all.73 Governments have successfully supported technology improvements through market experience in other sectors (Duke and Kammen, 1999)74, as the example of deep-water oil drilling shows.75 Initially costs were significantly higher than for on-shore or shallow water fields. Oil companies preferred to develop cheaper fields, as they had to sell output on a global oil market at a homogeneous price. Extraction tax reductions were used to compensate for higher field development costs supported private development of deep-water oil
71 A further benefit of deployment at global scale is the transparency created in an international competitive market. First, it should allow a more objective program evaluation, and should make it easier to abolish programmes for technologies that fail to show sufficient progress. Given our limited understanding of technology policy, this flexibility is crucial in order to allow us to include the experience we will gain in the process. Second, it should minimise direct interaction between policy makers and the industry lobby. Programmes that provide concentrated benefits, e.g. to a technology sector, will motivate strong lobbying support from this sector. If the programme is funded by broad taxes, opposition is dispersed potentially resulting in inappropriate extension of funding. 72Section 4.3 describes the history of wind and solar PV funding. International trading partially reduced the negative impact of large changes in national deployment support. 73 With further reductions in CO2 quotas, it is likely that renewable technologies are required to satisfy energy demand. Without strategic deployment the carbon price will rise until it is high enough to finance new renewable technologies. With the application of these technologies, their costs, and therefore also the carbon price will fall again. Such a peak in the carbon price is likely to result in distortions in other economic sectors and to increase the total costs of climate policy to society. 74 They conclude that new strategies that foster market transformation (namely, the accelerated introduction of new technologies) have been found to be effective in promoting both energy efficiency and renewable energy technologies. They identify substantial positive benefit-cost ratios for EPA’s Green Lights programme to support efficient lighting technology and the World Bank’s photovoltaic market transformation program, but approximately zero benefit-cost ratio for the US ethanol programme. 75 The oil industry illustrates how governments can address technology lock-in. The tax-rebate on deep water drilling has the same effect as subsidy schemes for renewable energy technologies: it allows technologies with (temporarily) differing costs to compete in a homogeneous product market. Producers in competitive renewable energy technology markets would face an incentive to reduce their production costs if they profited from the cost-savings in the period until competitors managed to replicate the improvements and the regulator reduces the subsidy level (tax-rebate). The market for renewable energy technologies exhibits one difference to that of regulated oil production. Renewable technologies are sold to investors in energy production (project developers or building owners). These investors will buy the cheapest product of the technology type, and retain the difference to revenues from energy sales. Therefore technology producer will only receive the market-clearing price. If this market is competitive, then the producer will benefit from cost-savings only in the period until the competitors have replicated the cost-savings. If the government wants to increase incentives to reduce costs in deep-water drilling, it can keep the tax rates fixed for a longer period, thereby allowing oil producers to benefit from their cost-savings for a longer period of time (a similar mechanism is used to incentivise utilities to implement cost-savings under RPI-X price regulation). If the market for renewable energy technology production is very competitive this could reduce incentives to innovate. In this case additional R&D support might be required.

19
fields. With improvements through market experience, costs for deep-water drilling fell and governments could reduce the scale of incentives.76 Tax levels in the electricity sector are lower than in oil extraction, and a tax reduction would not suffice to make new renewable technologies cost competitive. A financial premium is needed, either funded from the general budget or through electricity consumers. General taxation to fund the budget creates economic distortions (Duke, 2002), therefore it is economically preferable and also more commonplace to incorporate ‘learning investment’ costs for energy technologies into the price of electricity. As environmental externalities are not fully included in electricity prices, the modest addition to electricity prices makes consumption decisions more efficient (Ismer and Neuhoff, 2004).77 A variety of policy instruments are used to deliver financial support to renewable energy projects. Up-front capital subsidies or investment tax deductions provide public financial support for the initial investment. The Japanese PV program has successfully combined direct investment aid and capital grants with stable energy-prices guaranteed at the level of retail tariffs (net-metering). This is a simple way to support distributed small-scale projects and creates few transaction costs. However, if too much of the project funding is based on up-front payments or tax deductions, then Indian experience shows investors might pay insufficient attention to turbine siting, durability and maintenance (Jagadeesh, 2000).78 As technologies improve and the scale of deployment increases, experience shows that it is increasingly important for incentives to support the value of power produced, rather than just the investment – to reward performance, not merely the fact of installing equipment. Labelling of electricity and relying on consumer choice has been proposed as an alternative to obligatory schemes. While this option might be attractive in certain respects, it seems to have little impact on the deployment of renewable energy technologies (EWEA, 2004).79 Most consumers prefer renewable energy but are happy to free ride, if their neighbours incur the costs (Rader and Norgaard, 1996).80 With few consumers opting to buy renewable energy at higher tariffs, they are supplied by existing rather than new capacity. Two main approaches have emerged to provide effective market-based support. One is to set obligations to provide a certain percentage of power from renewables - ‘renewable portfolio standards’ - generally implemented with some form of tradeable ‘renewable energy credits’ which electricity suppliers have to acquire, either through own generation or purchase of these credits. These systems are perceived to be a market-based instrument that limits government interference.81 One drawback is that no mechanism has been
76 Oil companies face three incentives to invest and innovate. First, governments will only observe cost-reductions achieved by oil companies with some delay, and therefore extraction taxes will also be adjusted with some delay. In the meantime, oil companies can retain savings from cost reductions. Second, in most countries, several big oil companies are active. It is unlikely that governments will discriminate between these companies. Oil companies compete with each other to achieve cost reductions while average costs remain higher. Third, governments require ongoing investment by oil companies to operate existing oil fields and prospect for new oil fields. If a government sets excessive extraction taxes, oil companies will shift their investment to other countries. Repeated interaction serves as a commitment device. 77 Industry competing in international markets can be exempt but, preferably, international coordination implies that all countries should add similar burdens to their customers. Alternatively, border tax adjustment, which could be implemented to support CO2 trading, could be expanded to also compensate for differences in costs for strategic deployment programmes. 78 For some time wind power investment could be depreciated at 100% from Indian corporate taxes. 79 The European Wind Energy Association concludes that, although good in theory, in practice marketing programmes which depend on the willingness of customers to pay extra for “green” electricity have made little impact on uptake. 80 Fewer than 1% of customers choose to pay a premium to support renewables, rather than no renewable energy or a power blend (Swezey and Bird, 2001). 81 Frequently, the main benefit attributed to market trading of renewable energy certificates is price reductions from competition. This argument ignores the multi-layer market structure. Producers, installers and planners compete to supply to project developers or investors irrespective of the funding regime to which project developers are exposed.

20
found to isolate markets for renewable energy certificates from future policy decisions. The setting of the overall quota involves tradeoffs between investment security and inherent uncertainties about rates of installation, and the quota value may be quite unstable according to a range of factors that help determine how close the quotas are to being met at any given point in time.82 As a result, revenue streams of renewable energy projects are exposed to uncertainties from both market uncertainties and future government decisions. With such regulatory risk, investors apply higher discount rates when evaluating future revenues and require higher total payments for projects to break even.83 Regulatory risk can be reduced if policies provide legally enforceable long-term guarantees. The German feed-in tariff and the British auctions for long-term renewable contracts under the Non Fossil Fuel Obligation (NFFO) in the 1990s defined electricity prices for most of the project lifespan.84 While the tariff is fixed for the lifespan of a project, it can be adjusted year-by-year to represent technology advances for new projects coming online. Fixed prices have the additional benefit of insulating investors from the regulatory risk caused by future changes to electricity market design. For renewable energy plants, other than bio energy, fixed off-take prices do not distort the efficient operation of the plant, because the system operator does not require marginal prices to give priority to technologies with zero fuel costs.85 The increased investment security associated with long-term guarantees reduces the cost of financing.86 As an alternative support mechanism in the US, production tax-credits are used to offer investors tax benefits during the project’s life. But tax schemes are frequently modified, investors face risk and discount the benefits and higher payments are needed to ensure projects break even (Crooks, 1997).87 Overall, experience of different policy instruments is mixed. There is some indication that mechanisms that expose investors to regulatory risk or uncertainty about future market designs are either more expensive for the ratepayers, or do not result in significant investment. Mechanisms that do not provide technology specific support premia inevitably focus investment on the most cost effective technology available and do not encourage improvements through market experience of other renewable energy technologies.88 The optimal policy instrument or mix of instruments might depend on the local and technology circumstances. A harmonisation of instruments does not seem to be required, as the mechanisms predominantly affect local project developers and investors. These local actors then contract out technology and construction services and negotiate the best possible price. Therefore a global market for renewable technologies is compatible with a mix of support mechanisms, as we can already observe today.
10 Research, Development and Demonstration
Innovation is frequently pictured as a linear process, taking a new technology from research and development to demonstration and strategic deployment until the technology can finally compete in mass markets (Foxon and Kemp, 2004). Tidal, wave and solar concentration are at an early stage of the innovation process and require extensive demonstration projects to explore options and improve solutions. However 82 In Admire Rebus (2003), it is argued that governments should set targets beyond 2010 to ensure a continued market for renewable electricity and to provide regulatory security to investors. 83 A programme for financial assistance must remain stable for at least ten years (Moore and Ihle, 1999). 84 The regional transmission system operator or the NFFO purchasing agency were the counter-party to the contracts. Even with the introduction of the new bilateral market design (NETA) and funding mechanism for renewables in the UK (ROCs), the NFFO purchasing agency remains the counter party for existing long-term off-take contracts with renewable energy projects. 85 Danish experience shows that it is still possible to find arrangements within the feed-in mechanism to allow the system operator to reduce short-term output from wind turbines if required for system purposes (spill wind). 86 See Butler and Neuhoff (2004). 87 He suggests that one of the reasons for the small market share of ethanol in highway gasoline sales is the reluctance of investors to invest in grain ethanol production facilities, as the federal tax incentive is frequently modified (three times between 1978 and 1997) 88 New investment will predominantly go into the cheapest renewable, not allowing for improvements through market experience in other technologies. Bird and Swezey (2002) report that wind accounts for 98% of new renewables installed under green marketing programmes.

21
more advanced technologies like wind and solar PV also need research and development to improve their performance. Market experience from strategic deployment programs then refines the research results and at the same time helps to identify new research needs. Industry can only appropriate a fraction of the benefits of research and development investment at each of these stages (Margolis and Kammen, 1999b).89 Technology ‘spill over’ in the energy sector is large,90 investors face difficulties in evaluating intangible research and development output,91 and regulatory intervention can cap profits in the case of path-breaking research success.92 Therefore it is generally accepted that public support is required to achieve the optimal investment level.93
89 They survey estimates of returns on R&D across various sectors. Estimates of the social rate of return on R&D investment are around 50% and the private rates are around 20-30%. This shows that only a fraction of social returns are appropriated by private investors. 90 Research results ‘spill over’ to competitors and therefore provide more benefit to society than to the investing company. As the investing company only captures a fraction of the benefit, it tends to invest less than what is socially optimal. According to Azar and Dowlatabadi (1999), overwhelming empirical evidence exists for the consistent (since Mansfield, 1968) under-investment of private firms in R&D. Economists have found private rates of return to R&D consistently above 30%. Improvements in patent laws are frequently proposed to increase incentives for innovation, and there is a high correlation between research and development input and patent output (Jaffe, 2000). Mansfield (1986) surveyed 100 firms in 12 industries. Patenting was considered instrumental to the development of innovations in less than 20% of the innovations, with only the petroleum industry (25%), chemical industry (38%) and pharmaceuticals (60%) showing high impacts of patenting. Rather than incentivising research and development, Cohen et al. (2000) suggest that firms patent in order to prevent competitors from patenting related innovations and to improve their negotiation position in patent infringement lawsuits. According to Jaffe (2000), patenting could be a “zero-or negative-sum game [for society]”. 91 Investors encounter difficulties in verifying the quality of research and development efforts of companies, since results are intangible for several years before the innovation reaches the market. Alic et al. (2003) assess private public research partnership under the Advanced Technology Program in the U.S. “[Time] Lags, along with the difficulty inherent in retrospective evaluation of factors affecting the timing and character of innovations, make it difficult if not impossible to attribute specific commercial advantages to funding awarded much earlier.” As a result, research and development intensive companies are systematically under-priced by the market (Based on a study by Lev (2004) of more than 750 firms in sectors with substantial R&D in the period 1983-2000). This has led to such companies shifting funds away from basic research towards product modifications and extensions. The allocation of R&D funds to directed basic research [of members of the industrial research institute] declined every year from 1993 to 2003 in favour of modifications and extensions of current products (Lev, 2004). 92 Renewable energy technologies compete in electricity wholesale markets that were frequently exposed to regulatory interference (e.g. price caps). Governments or regulators are also expected to intervene if a company with a path-breaking energy innovation extracts monopoly rents. This reduces incentives for private investment in long-term research and development. Government is less likely to expropriate inventors, if this would risk future inventions, as in pharmaceuticals. 93 Macroeconomic analysis attributes about 50% of economic growth to technology change (Jorgenson and Wilcoxen, 1990). It is unlikely that pubic support of R&D has a detrimental effect on our economies. Goulder and Schneider (1999) argue that increasing R&D expenditures in carbon-free technologies could crowd out R&D in the rest of the economy and therefore reduce overall growth rates. However, Azar and Dowlatabadi (1999) refer to Mansfield’s (1968) convincing counter argument: radical technological change will trigger more research overall and therefore increase economy-wide productivity rates.

22
0
2
4
6
8
10
12
14
16
1974
1976
1978
1980
1982
1984
1986
1988
1990
1992
1994
1996
1998
Bill
ion
US
$
Other
Conservation
Nuclear
Fossil
Renewables
Figure 5 IEA country public R&D expenditure on energy technologies (IEA database of R&D)
Industry funded R&D focuses on the domain of existing expertise94 and on improvements that can be leveraged in the short term (Anderson and Bird, 1992).95 This suggests that public funding will be the main driver for longer-term developments in new technology and production processes for existing renewables, exploration of untried renewable technologies,96 energy system integration,97 superconductivity,98 and non-hydro storage technologies. The innovation process is not linear but entails various feedback loops between market experience and research activities. This suggests that cost and efficiency improvements in existing renewable technologies (Luther, 2004)99 require a parallel increase in strategic deployment efforts and public research funding.100 94 Companies tend to focus their R&D expenditure on their existing areas of activity. Jelen and Black observed that companies fund internal research, development and demonstration in rough proportions to sales revenue (1983). The market volume of renewable energy technologies is still small and therefore industry R&D is likely to be small. According to preliminary data provided by the DoE, private sector research and development expenditures on various renewable energy technologies are as much as 10% or more of sales revenue, comparable to other high-technology industries (PCAST 1997). 95 The benefits of R&D may not arrive for two to three decades, which is beyond the planning horizons of even the most forward-looking companies. 96 According to Kammen (2004), organic cells are now being seen as possibility to provide PV at costs below US$0.50 per peak watt. 97 For example, additional research and development efforts are required on storage technologies and superconductivity to facilitate energy backbones. 98 Electric energy demand is likely to grow as an increasing fraction of industry energy demand is satisfied with electricity. Furthermore, renewable energy resources are not always close to final consumers, and it is likely that the most efficient means to transport the energy is grid based. It is therefore likely that existing grids have to be expanded (Hoffert et al. 2002). Superconductivity, improved with additional research, development and deployment, would reduce transport losses and costs. 99 He provides a list of aspects of renewable energy technologies that warrant additional R&D support. 100 Over the period 1973-1995, Japan spent about US$2.5 billion (in 1995 prices and exchange rates) on PVs, of which 22% was spent in R&D (Gruebler et al. 1999). In 2002, the three countries with the largest PV programmes devoted 31% of PV support for RD&D and the remainder to deployment (based on PVPS (2003) and data for Japan, Germany and the US). For example, a change towards a crystalline PV production process that is not derived from the chip production process, but entirely optimised for PV, might reduce costs and energy input but would require the development of new production methods. This would be beyond the scope of mid-sized companies particularly active in the PV production field.

23
Figure 5 shows that in the last decades only a small fraction of public energy R&D funds of IEA countries have been allocated to renewable energy technologies, less than 8% in the period 1987-2002.101Given public expectations and policy commitments it is surprising that renewable energy technologies continue to be funded at a low level relative to nuclear and fossil energy. This picture is even more disturbing, if we consider that private R&D expenditure in the energy sector is extremely low. In the US, as a typical example, 0.5% of sales revenue in the electricity sector is devoted to R&D, compared to 3.3% in the car industry, 8% in electronics and 15% in pharmaceuticals.102 Figure 6 shows the allocation of public R&D funds to different renewable technologies over time. Total funding has dropped after the initial interest created through the oil shock in the 1970s, and has stayed constant since.
0
200
400
600
800
1000
1200
1400
1600
1800
2000
1974
1977
1980
1983
1986
1989
1992
1995
1998
2001
Mill
ion
US
$
Geothermal
Biomass
Ocean
Wind
Solar Thermal-Electric
Solar Photo-Electric
Solar Heating & Cooling0
200
400
600
800
1000
1200
1400
1600
1800
2000
1974
1977
1980
1983
1986
1989
1992
1995
1998
2001
Mill
ion
US
$
Geothermal
Biomass
Ocean
Wind
Solar Thermal-Electric
Solar Photo-Electric
Solar Heating & Cooling0
200
400
600
800
1000
1200
1400
1600
1800
2000
1974
1977
1980
1983
1986
1989
1992
1995
1998
2001
Mill
ion
US
$
Geothermal
Biomass
Ocean
Wind
Solar Thermal-Electric
Solar Photo-Electric
Solar Heating & Cooling
Figure 6 Public R&D expenditure on renewable energy technologies in IEA countries (IEA, USD2000)
However, the aggregate picture hides the large uncertainty to which individual research streams are exposed. Funding levels for individual technologies in individual countries have changed by more than 30% in about half the observation years.103 This ‘roller-coaster’ of research funding limits the ability of laboratories to attract, develop and maintain human capital for successful research and development.
101 The total public funding for energy technologies in IEA countries in the period 1987-2002 was US$ 291 billion, 50% allocated to fission and fusion, 12.3% to fossil fuels and 7.7% to renewable energy technologies (in year-2000 US$ and exchange rates, International Energy Agency, 2004). Margolis and Kammen (1999) show that total investment in R&D in the US increased from US$100 billion in 1976 to US$200 billion in 1996, while US energy R&D decreased from US$7.6 billion to US$4.3 billion. Renewable fuels make up 4% of the United States’ energy supply, yet receive only 1% of federal tax expenditures and direct fiscal spending, excluding revenue outlays for the Alcohol Fuels Excise Tax (Herzog et a., 2001). 102 According to National Science Foundation (2003), total private funding for industry-based R&D in the energy sector in the US in 2000 was $1.151 million. Revenues of electric utilities are about $240 billion (4000 TWh times 60$/MWh assumed average final electricity rate), suggesting a R&D quota of 0.5%. This is an upper estimate, as some energy R&D is devoted to non-electric energy supply. This share of R&D on sales revenue compares to, according to Alice et al. (2003), 3.3% for auto industry and 8% for electronics. See also endnote 57. 103 Based on own analysis of R&D data provided by IEA. Kamman (2004) concludes that national research and development programs have frequently have exhibited “roller-coaster funding cycles.”

24
11 International
Cost reductions in renewable technologies or their production process occur on an international scale.104 Therefore strategic deployment not only reduces technology costs for users in one country, but also has a positive impact in other countries. Global welfare increases with the number and scale of strategic deployment programmes.105 Such joint learning experience can be facilitated if standards are harmonised.106 The objective is therefore to achieve coherence in energy and technology policy. This is not the same as convergence of policy instruments,107 which is perhaps not even desirable.108 Renewable technologies are traded in competitive markets, which already successfully interface with a variety of support mechanisms in different countries.109 Costs of strategic deployment programs can be added to the tariff bills of national consumers without significant distortions.110 How many countries will autonomously develop or expand strategic deployment programs for renewable energy technologies? Results from research and development not only ‘spill over’ between companies but also between countries. This might induce national governments to free-ride on foreign research and development efforts, undermining the objective of large-scale deployment of renewable energy technologies (Barreto and Klaassen, 2004).111 However, the benefits from unlocking renewable technologies are a multiple of the costs of the learning investment. Therefore, it can be advantageous for individual countries to finance learning investment, even if they only capture a fraction of the global benefits. Furthermore, national 104 Models with endogenous technological change typically assume global learning rates. See Barreto and Kypreos (2000), Gritseveskyi and Nakicenovic (2000) and Manne and Richels (2002). Bottazzi and Peri (2004) use a panel data analysis over all industries to show that internationally generated ideas have a very significant impact in helping innovation in a country. As a consequence, a positive shock to innovation in a large country has, both in the short and in the long run, a significant positive effect on the innovation of all other countries. 105 Barreto and Klaasen (2004) use the ERIS model to show that with global learning optimal investment in renewable technologies is increased. 106 The standardisation in the Telecom sector allowed transfer of mobile equipment between most markets. Currently wind turbine producers face difficulties, as their power electronic equipment has to satisfy different requirements in many markets. 107 Proponents of tradable renewable energy certificates argue that international trading of certificates allows developers to access the best wind and solar resources. International trading might reduce short-term costs, which are easily quantifiable and therefore typically emphasised. But international trading ignores the fact that one objective of strategic deployment is to foster local industry and institutional learning. All regions will have to develop capabilities to install, administer and operate renewable energy technologies. This reduces transport and balancing costs and takes account of the fact that excellent resources basis are limited. Developing local capabilities to apply renewable technologies does not preclude the opportunity to complement local energy supply with large-scale international trade of competitive output from renewable energy resources. 108 Policy-makers should channel funds for technology development and diffusion through multiple agencies and programs to promote competition and support a diversity of options rather than particular technological choices (Alic et al. 2003). 109 Rowlands (2004) summarises the EU debate leading to the renewable quotas. In the event, member states retained the autonomy to choose their preferred instruments. 110 These costs are small relative to the electricity price differences already observed between countries. In 2003 the average retail tariff (class Da, Italy Dd) in EU countries (Euro-zone) was 18.12 Euro/MWh with standard deviation of 4.70 Euro/MWh. The average tariff for large industrial customers was 58.8 Euro/MWh with standard deviation of 12.36 Euro/MWh (Eurostat Statistics in focus, Theme 8, 21/2003). This compares to less than 4 Euro/MWh price increase to cover costs of the current deployment program. The 4 Euro/MWh are calculated as follows: 6.1% of electricity in Germany was produced in 2003 from new renewable energy sources with an average remuneration of 91.3 Euro/MWh. The costs above wholesale price level (~30Euro/MWh) are shared among all consumers with exception of exempt industrial customers (6% in 2003). (http://www.vdn-berlin.de/aktuelledaten_eeg.asp) 111 They suggest on page 74 that learning spill-over could result in a lack of incentives for [individual] countries to pay for the ‘learning investments’, because other countries could be free riding. It is not clear to what extent technology ‘spill-over’ prevents public investment into energy technologies. For example, US federal and state governments and some industrial corporations spent US$5.6 billion on research and development in the Clean Coal Technology Demonstration Program. (IEA 2003).

25
industry policy and national institutional learning provide additional arguments to pursue or expand a strategic deployment program. National politicians or administrations will be more successful in pursuing strategic deployment programs, if these programs are coherent with similar initiatives in other countries (Barreto and Klaassen, 2004).112 A joint public declaration or non-committing statement made by the Johannesburg Renewable Energy Coalition, the G-8 (G8, 2001), or similar institutions, could express support for stretching targets for increases in research and development budgets or strategic deployment funding. This could provide a reference point for national policy debate and focus the attention of national administrations on energy technology policy. An international agreement that supports the strategic deployment of several renewable energy technologies would have the advantage that that the nationally championed technology of each country could be included.
This is likely to increase the number of participating countries. However, it would require a lengthy international process to foster such an agreement, as demonstrated by negotiations of the Kyoto Protocol and the difficulties experienced with the EU policy-making process in defining a renewable quota (Rowlands, 2004).113 It might be easier to foster agreements for individual technologies. For example, the Concentrating Solar Power Global Market Initiative (GMI) of several European, North American and North African countries aims at deploying 5GW of solar concentration in the next 10 years. The resulting learning-by-doing is expected to reduce costs and allow competition with mid-range generation capacity.114 Implementing Agreements of the International Energy Agency focused in the past on research and development and particularly on information provision and exchange. They exist in fields such as bio-energy115, climate technology initiative116, photovoltaic power systems117, solar heating and cooling118, wind turbine systems, but also in fossil technologies, energy efficiency, and other topics (41 Agreements in all).119 Total spending under the collaborative programme is only $120-$150million per year, of which renewables get a minor share.120 In principle there are no objections to using the credibility provided by the IEA to support internationally coordinated deployment programs. Partnerships with developing countries could provide mutual benefits. OECD countries would benefit from larger markets and lower production costs, while developing countries would obtain access to new
112 They suggest to forge sound international cooperation on research, development, demonstration and deployment activities for technologies that could contribute to mitigate greenhouse gas emissions. 113 He describes the European debate about the definition of renewables. During the debate, the scope was first broadened, e.g. keeping the option for large-scale hydro plants open, and yielding to pressur from Italy, the Netherlands and the UK to include municipal and industrial waste. Subsequently, the definition of renewables was broadened to allow for directly combusted, and not digested, waste to contribute to the renewable quota. 114 See http://www.solarpaces.org. 115 One of the largest Implementing Agreements since 1974 aims to accelerate the use of environmentally sound and cost-competitive bioenergy on a sustainable basis, http://www.ieabioenergy.com. 116 With focus on technology transfer and capacity building, but in the status also accelerated development and diffusion, www.climatetech.net. 117 With the aim of contributing to the cost reduction of their applications, to increase awareness of their potential and value, to foster their market deployment by removing technical and non-technical barriers and to enhance technology co-operation with non-IEA countries, http://www.iea-PVps.org. 118 (Since 1974) Production of reports on the solar thermal collector market and solar energy activities in IEA countries and starting new work in the areas of storage, industrial process heat, and building energy analysis tools: www.iea-shc.org. 119 To stimulate co-operation on wind energy research and development and to provide high quality information and analysis to member governments and commercial sector leaders: addressing technology development and deployment and their benefits, markets and policy instruments, www.ieawind.org. 120 Antonio Pflüger, Head, Energy Technology Collaboration Division, International Energy Agency, Bonn 3.6.2004
26
technologies, new employment opportunities and reduced fossil fuel costs.121 All participants would benefit from reduced emissions. One step towards facilitating such co-operation would be the expansion of export credit guarantees for renewable energy technologies.122 12 Conclusion Resource assessments suggest that renewables could satisfy a much larger share of global energy demand. This would enhance our security and environment. However, the market share of renewables will not increase unless new energy and technology policies address the following barriers:
1. Traditional energy technologies are not exposed to full security and environmental costs and offer energy below the level of total social costs. Levelling the playing field implies re-allocation of rent between stakeholders and is therefore a slow process. In the meantime, subsidies for renewable technologies might be required to ensure efficient investment decisions, and subsidies for conventional technologies should be reduced.
2. Markets and tariff structures are designed and optimised for fossil generation technologies. They do
not address the specific requirements of renewables: flexible operation, long-term contractual arrangements to reduce financing costs particularly in an environment with high regulatory risk, and simple procedures with low-transaction costs for their small-scale nature.
3. Renewables are at different stages of development, and fit into different markets. Therefore, policy
support needs to address the specific stage and market of each renewable. For emerging and innovative technologies, this means increasing substantially the collective investment in RD&D, and for those entering the market, increasing the level of deployment incentives. Several countries applying strategic deployment in parallel will create industry confidence in continuous market growth.
The discovery of a new energy technology that suddenly resolves all energy challenges would be great, but has not happened in the past and is unlikely to occur in the future. In contrast, we have consistently observed that technologies become more cost effective with improvements through market experience. However, this does not happen autonomously - most renewable energy technologies are locked-out from large-scale market experience because the playing field is uneven and various barriers and technology spill-over prevent industry from financing the learning investment. It is in the power of governments to unlock these technologies.
121 The disincentive for innovation in energy technologies due to international technology spill over could provide an argument to create international partnerships, where one party gains access to a broader market for its products, thus being able to benefit from a larger potential for learning-by-doing effects, while the other party gains access to less polluting and more efficient technologies (PCAP 1999). 122 UNEP suggests an expansion of the repayment period to 15 instead of 12 years corresponding to the longer life time of energy projects. Micro-credit linked to micro-enterprises can have considerable success in both promoting renewable energy use and meeting poverty reduction goals (Johansson et al. 2004). Strategies to include renewables in non-energy sectors, such as water supply, health, education, and communication can significantly enhance energy access (Johansson et al. 2004b).

27
References:
Admire Rebus (2003) Renewable Electricity Market Development in the European Union, Final report, www.admire-rebus.net.
Alderfer R.B., Eldridge M.M., Starrs T.J. (2000) Making Connections, Case Studies of interconnection barriers and their impacts on distributed power projects, NREL/SR-200-28053.
Alic J.A., Mowery D.C., Rubin E.S. (2003) U.S. Technology and Innovation Policies: Lessons for Climate Change, Prepared for the Pew Center on Global Climate Change.
Alsema, E. A. (2000) Energy pay-back time and CO2 emissions of PV systems, Progress in photovoltaics: research and applications 8, p. 17-25.
American Wind Energy Association (2004) Wind Power Outlook, 2004, www.awea.org
Anderson, D., Bird C.D. (2002) Carbon Accumulations and Technical Progress – A simulation study of costs, Oxford Bulletin of Economics and Statistics, 54,1, p. 1-27.
Ansolabehere S., Deutch J., Driscoll M., Gray P.E., Holdren J.P., Joskow P.L., Lester R.K., Moniz E.J., Todreas N.E. (2003) The future of nuclear power, an interdisciplinary MIT study, Boston.
Azar C., Dowlatabadi H. (1999) A review of technical change in assessment of climate policy, Ann. Rev. Energy Economics, 24, p. 513-44.
Barreto L., Kypreos S. (2003) Endogenizing R&D and Market Experience in the “Bottom-Up” Energy-Systems ERIS Model. Technovation. In print.
Barreto L., Klaassen G. (2003) Emission trading and the role of learning-by-doing spillovers in the `bottom-up’ energy-system ERIS model, Int. J. Energy Technology and Policy, Vol. 2 Nr. 1,2 70-95.
Beck F., Martinot E. (2004) Renewable energy policies and barriers, Encyclopedia of Energy, (Academic Press/Elsevier Science, San Diego.
Bergek A., Jacobsson S. ( 2003) The emergence of a growth industry: a comparative analysis of the German, Dutch and Swedish wind turbine industries. In: Metcalfe, S., Cantner, U. (Eds.), Change, Transformation and Development. Physica-Verlag, Heidelberg, pp. 197–228.
Bird, L., Swezey B. (2002) Estimates of renewable energy developed to serve green power markets, National Renewable Energy Laboratory.
Bottazzi L., Peri G. (2004) The Dynamics of R&D and Innovation in the Short-Run and in the Long-Run, Centre for Economic Policy Research, DP4479.
Butler L., Neuhoff K. (2004) Comparison of Feed in Tariff, Quota and Auction mechanisms to support wind power development, Department of Applied Economics mimeo.
Carbon Trust (2003) Building Options for UK Renewable Energy, www.thecarbontrust.co.uk
Cohen W. M., Nelson R.R et al. (2000) Protecting their intellectual assets: appropriability conditions and why U.S. manufacturing firms patent (or not), NBER Working Paper No. 7552
Crooks, A.C. (1997) Cooperatives and New Uses for Agricultural Products: An Assessment of the Fuel Ethanol Industry, USDA Rural Business-Cooperative Service, RBS Research Report 148.
Dasgupta P., Stiglitz J. (1988) Learning-by-doing, market structure and industrial and trade policies, Oxford Economic Papers, 40, 256-268.

28
Dekimpe M.G., Parker P.M., Sarvary M. (2000) “Globalization”: Modeling Technology Adoption Timing Across Countries, Technology Forecasting and Social Change, 63, p. 25-42.
Duke, R. (2002) Clean Energy Technology Buydowns: Economic theory, Analytic tools, and the Photovoltaics case, PhD Dissertation, Princeton University.
Duke, R, Kammen, D.M. (1999) The Economics of Energy Market Transformation Programs, The Energy Journal , 20(4) p. 15-64.
Duke, R.D., Kammen D.M. (2003) Energy for Development: Solar Home Systems in Africa and Global Carbon Emissions, in Climate Change for Africa, Science, Technology, Policy and Capacity Building, Pak Sum, Low, editor, Kluwer Academic Publishers
Duke R.D., Jacobson A., Kammen D.M. (2002) Photovoltaic module quality in the Kenyan solar home systems market, Energy Policy 30, p. 477-499.
EPRI/OUT (1997) Renewable Energy Technology Characterizations. Palo Alto, Electric Power Research Institute and Office of Utility Technologies, Energy Efficiency and Renewable Energy, US Department of Energy.
Espejo, R., Schuhmann,W., Schwaninger, M. and Bilello, U. (1996) Organizational Transformation and Learning – A Cybernetic Approach to Management, John Wiley & Sons, Chichester. EU Commission (2000) Towards a European Strategy for Security of Energy Supply, Green Paper.
European Wind Energy Association (2004) Wind Energy, The Facts, an analysis of wind energy in the EU-25, funded by EU Commission, DG TREN.
Foxon T., Kemp R. (2004) Innovation impacts of environmental policies, in International Handbook on Environment and Technology Management (ETM), forthcoming.
G8 (2001) Renewable Energy: Development that lasts, G8 Renewable Energy Task Force Chairman report.
Goulder L.H., Schneider S.H. (1999) Induced Technological Change and the Attractiveness of CO2 Emissions Abatement Policies, Resource and Energy Economics 21, p. 211-253.
Gubb M., Vigotti R., (1997) Renewable Energy Strategies for Europe – Electricity Systems and Primary Electricity Sources,, Volume II, Earthscan, London
Gritsevskyi A., Nakicenovic N. (2000) Modelling uncertainty of induced technological change, Energy Policy, Vol. 28, pp. 907-921.
Grubb, M., Meyer, N. (1993) Wind Energy Resources, Systems and Regional Strategies, in Johansson, T. Kelly, H. Reddy, A. Williams, R and Burnham, L. (eds.) Renewable Energy: Sources for Fuels and Electricity, Washington D.C., Island Press.
Gruebler A., Nakicenovic, N. (1991) Long Waves, Technology Diffusion, and Substitution, Review, 14, 313-342.
Gruebler, A., Gritsevskyi, A. (1997) A Model of Endogenous Technological Change Through Uncertain Returns on Learning (R&D and Investments). Paper presented at the Internatinal Workshop on induced Technical Change and the Environment, June 26-27, International Institute for Applied Systems Analysis, Laxemburg, Austria.
Gruebler, A., Nakicenovic, N,, Voctor D.G. (1999) Modelling technological change: Implications for the Global Environment, Ann. Rev. Energy Environ. 1999, 24: 545-69
Herig, C. (2000) PV is on when the power is out, National Association of Regulatory Utility Commissioners committee
on Energy Resources and the Environment, 2000 Annual Convention, San Diego.
Herzog A.V., Lipman T.E., Edwards J.L., Kammen D.M. (2001) Renewable Energy: A viable choice, Environment, Vol. 43, No. 10.

29
Hoff, T., Cheney, M. (2000) The Potential for photovoltaics and other distributed resources in rural electric cooperatives, The Energy Journal, Vol. 21, No. 3, p. 113-127.
Hoffert M., Caldeira K. Benford G., Criswell D.R., Green C. Herzog H., Jain A.T., Kheshgi H.S., Lackner K.S., Lewis J.S., Lighfoot H.D., Manheimer W., Mankins J.C., Mauel M.E., Perkins L.J., Schlesinger M.E., Volk T., Wigley T.M.L. (2002) Advanced Technology Paths to Global Climate Stability: Energy for a Greenhouse Planet, Science Vol 298, p. 981-987.
International Energy Agency (1999) World Energy Outlook, Looking at Energy Subsidies: Getting the Price Right, OECD/IEA, Paris.
International Energy Agency (2000) Experience Curves for Technology Policy. Paris.
International Energy Agency (2002) World Energy Outlook, Paris.
International Energy Agency (2003) Creating Markets for Energy Technologies, Paris.
International Energy Agency (2003b) Renewables for Power Generation, Status and Prospects, Paris.
International Energy Agency (2004) Renewable Energy, Market and Policy Trends in IEA countries, Paris.
International Energy Agency (2004b) World Energy Outlook, Paris.
Irwin D., Klenow P. (1994) Learning-by-doing spillovers in the semiconductor industry, Journal of Political Economy, Vol. 102, pp. 1200-1227.
Ismer R., Neuhoff, K. (2004) Border Tax Adjustments: A feasible way to address nonparticipation in Emission Trading, Cambridge MIT Electricity Project Working Paper 36. Isoard, S. Soria, A. (1997) Learning Curves and Returns to Scale Dynamics: Evidence from the Emerging Renewable Energy Technologies, IPTS Working Paper Series WP 97/05
Isoard, S. Soria A. (2001) Technical change dynamics: evidence from the emerging renewable energy technologies, Energy Economics 23, p. 619-636.
Jaffe A.B. (2000) The U.S. patent system in transition: policy innovation and the innovation process, Research Policy, 29: 531-557.
Jagedeesh A. (2000) Wind energy development in Tamil Nadu and Andhra Pradesh, India: Institutional dynamics and barriers - a case study, Energy Policy 28, p. 157-168.
Jelen F.C., Black L (1983) Cost and Optimization Engineering, Mc Graw Hill, New York.
Jensen S.G., Skytte K. (2003) Simultaneous attainment of energy goals by means of green certificates and emission permits, Energy Policy, 31, p. 63–71.
Jensen S.G. (2004a) Reducing costs of emerging renewable energy technologies – an analysis of the dynamic development with wind power as case study, Int. J. Energy Technology and Policy, Vol. 2, Nos. 1/2, p. 179-202.
Jensen S.G. (2004b) Describing Technological Development with Quantitative Models, Energy & Environment, Vol. 15, No. 2, pp. 187-200.
Johansson T.B., Fritsche U. R., Flavin C., Sawin J., Assmann D., Herberg T.C. (2004) Policy Recommendations for Renewable Energies, International Conference for Renewables, Bonn.
Johansson T.B., McCormick K., Neij L.,Turkenburg W. (2004b) The Potentials of Renewable Energy, International Conference for Renewables, Bonn.

30
Jorgenson D.W., Wilcoxen P.K. (1990) Environmental regulation and US economic growth, RAND Journal of Economics, 21(2), p. 314-340.
Kammen, D. M. (2004) Renewable Energy Options for the Emerging Economy: Advances, Opportunities and Obstacles, Background paper for “The 10-50 Solution: Technologies and Policies for a Low-Carbon Future”, Pew Center & NECP Conference, Washington, DC.
Kaplan, A. (1999) Generating interest, generating power: commercializing photovoltaics in the utility sector, Energy Policy, Vol. 27, pp. 317-329.
Keats-Martinez K., Neuhoff K. (2004) Allocation of Carbon Emission Certificates in the Power Sector, How generators profit from grandfathered rights, Cambridge MIT Electricity Project Working paper, forthcoming.
Kline D. (2001) Positive feedback, lock-in, and environmental policy, Policy Science 34, 95-107, 2001, p. 95-107.
Klinski S. (2004) Rechtliche und administrative Hemmnisse des Ausbaus erneuerbare Energien in Deutschland, Ergebnisse des 1. Teilberichts, March.
Kouvaritakis N., Soria A., Isoard S. (2000) Modelling energy technology dynamics: methodology for adaptive expectations model with learning by doing and learning by searching, Int. J. Global Energy Issues, Vol. 14, Nos. 1-4, p. 104-115.
Laitner J.A., Sandtad A.H. (2004) Learning-by-doing on both the demand and the supply sides: implications for electric utility investments in a Heuristic model, International Journal of Energy Technology and Policy, Vol. 2, No.1/2 p. 142-152.
Larsen B., Shah A. (1992) World Energy Subsidies and Global Carbon Emissions, World Bank, World Development Report 1992, Background Paper No. 25, Washington DC.
Lev, B. (2004) Sharpening the Intangibles’ Edge, Harvard Business Review, June 2004, p. 109-116.
Lieberman, M.B. (1984) The learning curve and pricing in the chemical processing industries, RAND Journal of Economics, 15(2), 213-228.
Luther, J. (2004) Research and Development, The Basis for Wide-spread Employment of Renewable Energy, Thematic Background paper, International Conference for Renewable Energies, Bonn.
Mansfield E. (1968) Industrial Research and Technological Innovation, Norton, New York.
Mansfield E. (1986) Patents and innovation: An empirical study, Management Science 32, 173–181.
Manne A., Richels R. (2002) The Impact of Learning-by-doing on the Timing and Cost of CO2 abatement, Working Paper, Stanford University.
Margolis R.M., Kammen D.M. (1999) Underinvestment: The Energy Technology and R&D Policy Challenge, Science, Vol 285, p. 690-692.
Margolis R.M., Kammen D.M. (1999b) Evidence of under-investment in energy R&D in the United States and the impact of Federal policy, Energy Policy, 27, p. 575-584.
McDonald A. and L. Schrattenholzer (2001) Learning rates for energy technologies, Energy Policy 29, 255-261.
Ministry of Economic Affairs, Netherlands (2004) Innovation in Energy Policy, Energy transition: state of affairs and the way ahead.
Moore C., Ihle, J. (1999) Renewable Energy Policy outside the United States, Renewable Energy Policy Project, October 1999, No. 14.
Moor De A. (2001) Towards a Grand Deal on Subsidies and Climate Change, Natural Resource Forum, JNRF, 25.

31
Moskovitz D. (2001) Distributed Resource Distribution Credit Pilot Programs: An idea whose time has come, regulatory assistance program.
Musial W., Butterfield S. (2004) Future for Offshore Wind Energy in the United States, NREL/CP-500-36313.
National Science Foundation, Division of Science Resources Statistics (2000) Research and Development in Industry, NSF 03-318, Project Officer, Raymond M. Wolfe (Arlington, VA 2003).
Neuhoff K., De Vries L. (2004) Insufficient Incentives for Investment in Electricity Generation, Cambridge MIT Electricity Project Working paper 42.
Neuhoff K, Twomey P. (2004) Intermittency and market power in short-term markets, Department of Applied Economics mimeo.
Neumann T., Ender C., Molly J.P., Neddermann B., Winkler W., Strack M (2002) Weiterer Ausbau der Windenergienutzung im Hinblick auf den Klimaschutz – Teil 2, Deutsches Windenergie-Institut.
Norberg-Bohm V. (2000) Creating incentives for environmentally enhancing technological change: lessons from 30 years of us energy technology policy. Technological Forecasting and Social Change 65, p. 125–148.
OECD, IEA, UNEP (2002) Reforming Energy Subsidies.
Oxera (2003) The non-market value of generation technologies, funded by British Nuclear Fuels.
Papineau, M. (2004) An Economic Perspective on Experience Curves in Renewable Energy Technology, Energy Policy, forthcoming.
PCAST, President’s Committee of Advisors on Science and Technology (1999) Powerful Partnerships: The Federal Role in International Co-operation on Energy Innovation.
PCAST, President’s Committee of Advisors on Science and Technology (1997) Report to the president on federal energy research and development for the challenges of the twenty-first century, November.
Pershing J., Mackenzie J.(2004) Removing Subsidies, Leveling the Playing Field for Renewable Energy Technologies, Thematic Background Paper, International Conference for Renewable Energies, Bonn.
PVPS – Photovoltaic Power System Program (2003) Trends in Photovoltaic Applications, Survey report of selected IEA countries between 1992 and 2002, Report IEA-PVPS T1-12.
Rader, N., Norgaard R. (1996) Efficiency and sustainability in restructured electricity markets: The renewables portfolio standard, The Electricity Journal 9, 6, p. 37-49.
Rasmussen, T. (2001) CO2 abatement policy with learning-by-doing in renewable energy, Resource and Energy Economics, 23, p. 297-325.
Rogers E.M. (1983) Diffusion of Innovations, The Free Press, New York, NY.
Reinaud J. (2004) Emission Trading and its possible impacts on investment decisions in the power sector, IEA information paper.
Roth F.I., Ambs L.L. (2004) Incorporating externalities into a full cost approach to electric power generation life-cycle costing, Energy, in print.
Rowlands, I.H. (2004) The European directive on renewable electricity: conflicts and compromises, Energy Policy, in press.
Saghir J. (2003) The Role of the World Bank Group in Renewable Energy and Energy Efficiency, www.Wolrdbank.org/energy/pdfs/mso337.pdf.

32
Sanden B., Azar C., (2004) Near-term technologies for long term climate targets - economy wide versus technology specific approaches, Energy Policy, in press.
Sawin J.L. (2004) Mainstreaming Renewable Energy in the 21st Century, Worldwatch Paper 169.
Smith J.C., DeMeo ET AL., Parson B., Milligan M. (2004) Wind Power Impacts on Electric Power System Operating Costs: Asummary and Perspective on Work to data, National Renewable Energy Laboratory, NREL/CP-500-35946.
Sonntag-O’Brien V., Usher E. (2004) Mobilising Finance For Renewable Energies, International Conference for Renewable Energies, Bonn.
Strbac G. (2002) Quantifying the system costs of additional renewables in 2020, Report to UK Department of Trade and Industry.
Swezey, B. and L. Bird (2001) Utility green pricing programs: what defines success? National Renewable Energy Laboratory, NREL/TP-620-29831.
Tol R. (2003) The marginal cost of carbon dioxide emissions: An assessment of the uncertainties, Working paper FNU 19.
United States General Accounting Office (2004) Nuclear Regulation, NRC’s Liability Insurance Requirements for Nuclear Power Plants Owned by Limited Liability Companies, May, GAO-04-654.
United Nations Environment Program (2004) Financial Risk Management Tools for Renewable Energy Projects, study available at www.uneptie.org/energy/act/fin/index.htm.
Unruh G.C. (2002) Escaping Carbon lock-in, Energy Policy 30, p. 317-325
Watanabe, C. (1999) Industrial dynamism and the creation of a "virtuous cycle" between R&D, market growth and price reduction: The case of PV in Japan, Proceedings of the IEA International Workshop at Stuttgart, Germany, 10-11 May, 1999.
Watanabe C., Zhu B., Griffy-Brown C., Asgari B. (2001) Global technology spillover and its impact on industry’s R&D strategies, Technovation, Vol. 21, pp. 281-291.
WBGU (2004) World in Transition: Towards Sustainable Energy Systems, Earthscan
WEA (2000) World Energy Assessment: Energy and the Challenge of Sustainability, New York: UNDP.
WEC (1994) New Renewable Energy Resources: A New Framework for Decision-Making, London: Earthscan.
Williams, R. and G. Terzian (1993) A benefit/cost analysis of accelerated development of photovoltaic technology, Princeton University Center for Energy and Environmental Studies.
Wilson, J.Q. (1989) Bureaucracy: what government agencies do and why the do it. Library of Congress: Basic Books, Inc.
Ybema, J. R., Cloin J., Nieuwenhout F.D.J., Hunt A.C., Kaufman S.L. (2000) Towards a Streamlined CMD Process for Solar Home Systems: Emission reductions from implemented systems and development of standardised baselines, ECN -C--00-109.
Yohe, G.W. (2003) More Trouble for Cost-Benefit Analysis, Climatic Change, 56 (3), 235-244.
Zwaan van der B.C.C., Gerlagh R., Klaassen G., Schrattenholzer L. (2002) Endogenous technological change in climate change modelling, Energy Economics, 24, p. 1-19.
Zweibel, K. (1999) Issues in thin film PV manufacturing cost reduction, Solar Energy Materials and Solar Cells 59, p. 1-18.

33
Appendix I This appendix first summarises the assumptions made to calculate how much learning experience is required to make PV cost competitive with conventional generation capacity. Then the results are compared with the results of other studies. Assumptions The calculations have been performed for three sets of learning rates. The row labelled ‘Slow’ improvements through market experience correspond to cost reductions of 17% with each doubling of cumulative installed capacity, ‘historic’ to 20% and ‘rapid’ to 23%. IEA (2000) assumes learning rates between 18% and 22%. In a survey of learning rates in energy technologies, McDonald and Schrattenholzer (2000) suggest that the estimated learning rate of 20% for solar PV modules based on global installed capacity in the period 1968-1998. PV is applied both in markets for high value off-grid and distributed PV and in centralised installations to gain sufficient scale. Long-term costs of fossil generation are likely to be above €35/MWh. This is based on Reinaud (2004) who calculates long-term average CCGT production costs of €29.18 /MWh. However, if gas prices stay above the prediction of the 2002 World Energy outlook $2.8/Mbtu, e.g. at $3.6/Mbtu, average production costs increase to €35 /MWh. Adding some environmental externalities (see the section on the uneven playing field) makes it likely that wholesale price of electricity will be at least €50/MWh. An additional uncertainty is caused by the choice of real interest rate. I assume 5%, resulting in an annual capital cost of 8% of investment. Increasing the interest rate to 7% increases costs of learning investment by 29%, whilst reducing the interest rate to 3% reduces costs of learning investment by 27%. The net present value costs of learning investment increase by 3% if we assume a linear increase of wholesale prices from €35 /MWh in 2005 to €50 /MWh in 2015, rather than a constant wholesale price of €50 /MWh. This is because of the initially low energy production from PV modules. The net present value (NPV) is calculated globally for investment until 2040, using 5% real discount rate. The following figure shows the distribution of the required subsidies over time. First, where subsidies are provided as investment subsidy, the difference between the PV system cost and the expected future revenue stream must be covered. After the peak in 2010, PV costs fall more quickly than market growth, but subsequently high value market segments are becoming saturated, and lower market segments must be addressed. This results in a second peak of subsidy requirement.
0
500
1,000
1,500
2,000
2,500
3,000
3,500
2005 2010 2015 2020 2025 2030 2035 2040
Feed in SubsidyInvestment Subsidy
Mio
Eur
o/ye
ar

34
Alternatively feed-in tariffs or renewable portfolio standards provide revenue streams over the life-time of the project and therefore delay the requirement for public financial support. Over the guaranteed period (e.g. 20 years), the difference between market value and guaranteed feed-in price must be covered by subsidies. At this level of abstraction, the present value costs of feed in tariff, renewable portfolio standard and investment subsidy are identical. In reality, investors face higher capital costs due to price and regulatory risk involved in renewable portfolio standards which increases the required public financial support. Comparison According to my calculations, about 200-250 GW of PV will be installed globally at the end of the period and PV can compete in the wholesale market. IEA (2000) predicts a break-even of PV with fossil fuel technologies at cumulative production of 200 GW. In the base, case with €50 /MWh conventional generation costs, I calculate break-even at 115 GW at reduced system prices and 250 GW at full system prices. There might be a typographical error in the IEA (2000) publication, as they suggest that break-even point (200 GW installed capacity) will be reached in 2025 with 15% growth rates. Going back to 1999 data, this requires 30% growth rates in sales (or equally installed capacity). Based on the additional data available after the IEA publication, I assume 35% growth rates and break-even for non-integrated systems funded at the wholesale price will be reached in 2023. In the base case of my calculations €20 billion of public subsidies are required spread over the period 2005-2023. This figure compares to US$4.2 trillion of investment in electricity generation capacity required between now and 2030 (International Energy Agency, 2002). G8 (2001) does not quantify the learning investment costs, but also assumes PV growth rates of 35% and according to Annex 1, Figure 9, global cash flow breaks even relative to business as usual in 2023. Strategic deployment costs in my study are lower than calculated in a previous IEA (2000) study, because it is assumed that high-value market segments are targeted: (1) costs are reduced by €17 billion relative to the IEA study if PV modules are connected to distribution
networks produce higher value electricity. • Assuming that an OECD market of about 50 million correctly-oriented houses allows for 2
million installations per year (given a 25 year life-time), of which 1 million will be new installations. PV modules to produce 3 kW require ~24 m^2 (1000 Watt/m^2, 13% efficiency of cell, 95% efficiency of power electronics). Therefore a very rough approximation suggests a high-value distributed market of 6GW per year, of which 3GW are installed together with new buildings and 3GW are retrofitted. Subject to this maximum market size, 50% of grid-connected global market is allocated to the new buildings and 20% to old buildings. This represents the possibility of designing policy in such a way that high value segments are targeted first, in order to minimise subsidy requirements.
• Doubling the size of the high-value distributed market (and take-up rate to 65% and 30%) reduces net present value costs of investment in strategic deployment to €14 billion in the base case. Reducing the high-value segment by 50% and assuming lower take-up rate increases cost to €27 billion. The value of electricity in this distributed generation market segment is assumed to be twice the wholesale price.
• Duke (2002) showed that correlating PV output with wholesale prices increased the energy value of PV electricity by 2-3 times. Moskovitz (2002, quoted in Duke, 2002) reports average US distribution costs of US$25/MWh with marginal rates from US$0/MWh and reaching US$200/MWh if capacity constraints are reached. See endnote 26.
• The Japanese PV program has the target of reducing PV system costs to US$3.000/kw by 2007 (IEA 2000). Given a 25-year depreciation and low Japanese real interest rates of 2%, this price corresponds to a value of electricity in the distribution network of US$100/MWh (alternatively, the higher Japanese power prices might also justify projects at higher interest rates). My updated calculations (with four years of additional data) would predict the break-even point for the year 2008, at 35% global market growth. However, other countries face higher real interest rates than Japan. Furthermore, I assume a 20-year depreciation to provide a reserve for possible

35
maintenance of costs or efficiency losses towards the end of the PV and system life-time. Break-even at €$100/MWh then requires a reduction of system costs to €2.000/kw.
• If strategic deployment is restricted to high-value distributed resources, which could sell their output at twice the wholesale price (e.g. €100 /MWh), strategic deployment costs can be reduced to €12billion (net present value €10 billion). However, the market size is likely to stay remain limited and therefore learning will be slow. Assuming a global annual market of 6GW plus 0.7GW off-grid applications, the break-even point for other applications would move to the year 2055. The global market would stagnate after the year 2015 at 6.7 GW. This provides for fewer opportunities to invest and experiment in new plants, possibly further delaying the break-even point.
(2) Costs are reduced by €16 billion relative to the IEA study if PV models are installed as part of new buildings.
• I use the average of indicative module prices for 2002 in the three biggest markets €3.400 /kw (Japan €3.900 /kW, USA €3.400/kW and Germany €2.900/kW, covering 92% of installed capacity altogether). The average installed system price is €6.600/kW (Germany €5.600 /kW, Japan €7.200/kW, US €6.900/kW). (Source: PVPS 2003)
• If modules are installed with new buildings, it is assumed that €1.600/kW of the €3.200/kW non-PV-module system costs can be saved. This is the result of optimisation of the building and installation process and exterior functions covered by the modules.
(3) Costs are reduced by €2 billion relative to the IEA study if off-grid applications of PV create additional value.
• The next figure shows that, initially most PV was sold to commercial and domestic off-grid applications. The off-grid market is growing at 16% per year (1992-2002) but is too small to support large PV production increases. By 2002, less than 10% PV capacity was installed off-grid. Significant sales increases require a grid-connected market.1
0
200
400
600
800
1000
1200
1400
1992
1993
1994
1995
1996
1997
1998
1999
2000
2001
2002C
umul
ativ
e in
stal
led
capa
city
(M
W)
Off-grid
Grid connected
Figure: Global cumulative installed PV capacity in different market segments (Source PVPS, 2003). • Kammen and Duke (2003) estimate a total long-term market potential of 20 GWp. (50Wp to 400 million
unelectrified homes). Ybema et al. (2000) estimate 1.3 million solar home systems have been installed by 2000, with a long term potential of 325 million. Assuming some financial constraints, the maximum installation per year is set to 700MWp, starting at 50MW in 2005 with a 35% growth rate. Increases and decreases of the take- up rate and maximum installation by 50% changes total strategic deployment costs by only 4%.
• The little impact which off-grid applications have on the total costs of strategic deployment (€2 billion) confirms Duke (2002): “Solar home systems have assisted in the early commercialisation of PV

36
technology and remain a useful tool for rural development, but they are unlikely to play a major role in future PV module buy-down efforts.”
These three factors explain why the base case results in Table 1 require lower learning investment than the base case of IEA (2000) of US$60 billion or the range from US$50-100 billion suggested by the International Energy Agency (2003). Duke (2002) performed a similar calculation. In his base case, PV module sales grow at 30% until 2014 (based on strategic deployment) when break-even is reached for distributed generation and strategic deployment programmes are stopped. Subsequently, sales increase at 20% per year until they reach an assumed cap for distributed generation of 100GW/year in 2028. In 2030, PV would contribute 11% to electricity demand. Strategic deployment costs US$9.1 billion and produces a net benefit of US$156 billion. (learning rate 20%, discount rate 5%). Duke only requires about half the deployment costs depicted in Table 1 as strategic deployment is only applied to the high-value distributed market. This also results in a delay of larger scale application of PV competitive in the wholesale market – Duke only obtains half the NPV of the project described here. Both approaches achieve the same cost-benefit ratio.