Information Technology Undergraduate Information Technology Degrees.

J u n e 2 0 0 8
Californians & information
technology
in collaboration with
The California Emerging Technology Fund
Mark Baldassare Dean Bonner Jennifer Paluch Sonja Petek

PUBLIC POLICY INSTITUTE OF CALIFORNIA500 Washington Street, Suite 600 San Francisco, California 94111phone: 415.291.4400 fax: 415.291.4401
PPIC SACRAmENTO CENTERSenator Office Building1121 L Street, Suite 801Sacramento, California 95814phone: 916.440.1120fax: 916.440.1121
www.ppic.org [email protected]
The Public Policy Institute of California is dedicated to informing and improving public policy in California through independent, objective, nonpartisan research on major economic, social, and political issues. The institute’s goal is to raise public awareness and to give elected representatives and other decisionmakers a more informed basis for developing policies and programs.
The institute’s research focuses on the underlying forces shaping California’s future, cutting across a wide range of public policy concerns, including economic development, education, environment and resources, governance, population, public finance, and social and health policy. PPIC is a private, nonprofit organization. It does not take or support positions on any ballot measures or on any local, state, or federal legislation, nor does it endorse, support, or oppose any political parties or candidates for public office. PPIC was established in 1994 with an endowment from William R. Hewlett.
Mark Baldassare is President and Chief Executive Officer of PPIC.Thomas C. Sutton is Chair of the Board of Directors.
TABLE OF CONTENTS
About the Survey 1
Press Release 3
Access and Use 7
Perceptions and Attitudes 17
Regional Map 24
Methodology 25
Questionnaire and Results 27

ABOUT THE SURVEY
The PPIC Statewide Survey series provides policymakers, the media, and the general public with objective, advocacy-free information on the perceptions, opinions, and public policy preferences of California residents. Inaugurated in April 1998, this is the 87th PPIC Statewide Survey in a series that has generated a database that includes the responses of more than 185,000 Californians. This survey is the first in a new five-year PPIC Statewide Survey series focusing on information technology issues, funded with grants from the California Emerging Technology Fund and from ZeroDivide. The series’ intent is to inform state policymakers, encourage discussion, and raise public awareness about a variety of information technology issues. For this benchmark survey, we draw upon earlier PPIC Statewide Surveys for California trends over time and recent surveys by the Pew Internet & American Life Project for national comparisons.
Although the use of the Internet and information technology is expanding nationally, with California a global leader in this arena, we know from past studies that a number of large and important subgroups in the California population do not have access to information technology. Given the role of the Internet in modern society, and the reality of the digital divide, this survey seeks to inform and improve public policy choices involving this disjunction between large populations who are and are not “connected.” We examine both access and use of information technology as well as the public’s perceptions and attitudes.
This survey presents the responses of 2,503 adult residents interviewed in multiple languages and reached by landline and cellular telephone throughout the state, on the following topics:
Access and use of information technology, including computer ownership, home Internet and broadband connections, and overall use of computers, the Internet, and email. We also ask about a variety of specific activities that are conducted on the Internet, how often residents access the Internet or email, what kind of Internet connection they have at home, and other issues related to home broadband adoption. We ask about the manner in which the Internet is used outside home and work, the use of mobile devices for the Internet and other purposes, and parents’ use of the Internet to connect to their children’s schools.
Perceptions and attitudes regarding information technology, including the importance of access to the Internet, the importance of the Internet as a source of information in daily life, the role of government in Internet regulation and in improving the access and availability of broadband Internet technology, and residents’ comfort with and confidence in technology. We also ask about whether Californians in lower-income and rural areas are less likely to have access to broadband Internet technology and the level of concern regarding these access issues.
California trends over time and differences between Americans nationally and Californians in access, uses, perceptions, and attitudes about information technology.
Variations in behaviors, perceptions, and attitudes regarding information technology issues across the five major regions of the state (Central Valley, San Francisco Bay Area, Los Angeles County, Inland Empire, and Orange/San Diego Counties), among Asians, blacks, Latinos, and non-Hispanic whites, between urban and rural communities, and among socioeconomic and political groups.
Copies of this report may be ordered online (www.ppic.org) or by phone (415-291-4400). For questions about the survey, please contact [email protected]. View our searchable PPIC Statewide Survey database online at http://www.ppic.org/main/survAdvancedSearch.asp.
1


PRESS RELEASE
Para ver este comunicado de prensa en español, por favor visite nuestra página de internet: http://www.ppic.org/main/pressreleaseindex.asp
PPIC STATEWIDE SURVEY: CALIFORNIANS AND INFORMATION TECHNOLOGY
More Shop, Get News Online ‒ Yet Digital Divide Widens AS CALIFORNIANS BROADEN USE OF WEB, LATINO AND LOW-INCOME RESIDENTS LEFT BEHIND
SAN FRANCISCO, California, June 25, 2008 — At least half of Californians go online to get news, make purchases, look for health information, or visit government websites. But as the state’s residents integrate the Internet into their daily lives, there are signs that the digital divide is widening for some groups, particularly Latino and low-income residents. These are among the key findings in a statewide survey released today by the Public Policy Institute of California (PPIC) in collaboration with the California Emerging Technology Fund.
Californians value access to the web: Nearly all Internet users (92%) say it is at least somewhat important in everyday life, and even 56 percent of those who don’t go online agree. But disparities in Californians’ use of technology reveal a digital divide: Residents who are white, black, or over age 55 have significantly increased their use of computers and the Internet since 2000, while Latinos, Asians, and low-income residents have not.
“Many Californians go online to research the decisions they make as voters, taxpayers, and consumers,” says Mark Baldassare, PPIC president and CEO. “Yet there are tremendous differences in access to critical information that put many at a disadvantage in their everyday lives. At a time when technology’s role is growing and in a state that has led the way, this poses a major policy challenge.”
COMPUTER USE SIMILAR IN CALIFORNIA AND NATION
Three in four Californians (75%) use a computer at home, school, or work, a statistic that has held steady since 2000. A 2008 survey by the Pew Internet & American Life Project found similar results (74%) nationwide. The percentage of Californians who use the Internet has increased since 2000, from 65 percent to 70 percent. Today, Californians and adults across the nation are equally likely to have Internet access at home (63% vs. 62% in the 2008 Pew survey) and a broadband connection (55% each).
WHITE, BLACK, OLDER CALIFORNIANS INCREASE USE
Differences emerge in the way demographic groups use technology.
Race/ethnicity: Since 2000, computer use has grown among whites (79% to 85%) and blacks (76% to 83%), as has Internet use (70% to 81% for whites, 60% to 82% for blacks). Among Latinos, computer use has declined (64% to 58%) and Internet use is unchanged (47% to 48%). Asians have seen declines in both their use of computers (91% to 81%) and the Internet (84% to 80%).
Age and income: Internet use has grown sharply among those age 55 and older (42% to 58%), but not among adults with household incomes less than $40,000 (47% to 49%). Adults under age 35 are more likely to use the Internet (78%) than older adults. Almost all adults with household incomes of $80,000 or more use computers (94%) and the Internet (92%).
3

Californians and Information Technology
FEWER LATINOS HAVE COMPUTERS, WEB ACCESS AT HOME
A digital divide is also apparent among ethnic/racial groups, income levels, and regions when comparing rates of computer ownership, Internet access, and broadband connections at home.
Race/ethnicity: Less than half of Latinos (48%) have home computers compared to about eight in 10 or more for whites (86%), Asians (84%), and blacks (79%). Just four in 10 Latinos (40%) have Internet access and a third (34%) broadband connection at home. In contrast, majorities in other racial or ethnic groups have both Internet access and broadband.
Income: Among households with incomes under $40,000, half have home computers, but only four in 10 (40%) have home Internet access and just a third (33%) have broadband. At higher income levels, overwhelming majorities of Californians have home computers, Internet access, and broadband.
Region: Majorities in each region of the state say they have home computers and Internet access, but Los Angeles residents report lower rates of broadband connection (48%) than residents in the San Francisco Bay Area (65%), Orange County/San Diego (58%), Inland Empire (56%), and Central Valley (53%). Rural residents are somewhat less likely than urban residents to have a computer (65% vs. 73%), Internet connection (58% vs. 63%), or broadband (51% vs. 56%).
WHAT ARE CALIFORNIANS DOING ONLINE?
Californians are far more likely than they were in 1999 (PPIC Statewide Survey: Californians and Their Government, September 1999) to report that they go online to shop (52% vs. 30% in 1999) or get news about current events (55% vs. 43% in 1999), and slightly more likely to seek information about their work or jobs (49% vs. 45% in 1999). Half of Californians (50%) look for health information online or visit government websites. Less than half (47%) bank or manage finances online or look for community events and activities (47%). Fewer go online to use government resources, such as downloading forms (43%); get housing or real estate information (40%); engage in education activities, such as taking a class (27%); or use social networking sites (26%), such as Facebook, MySpace, or LinkedIn.
Stark differences emerge in the way demographic groups use the Internet. Latinos are more likely than they were in 1999 to go online for news (35% vs. 28%), but far less likely to do so than whites (67%), blacks (62%), and Asians (61%). Comparing age groups, most people under age 35 (62%) and between ages 35 and 54 (61%) get news online, compared to 41 percent of residents age 55 and older.
While more Latinos report shopping on the web today (29% vs. 16% in 1999), they are far less likely than whites (67%), blacks (63%), or Asians (58%) to research or make purchases online. Among other differences:
Health information: While half of Californians say they get health information online, lower income adults (30%) and Latinos (31%) are the least likely to do so.
Social networking: Half of residents under age 35 use social networking sites, compared to 20 percent in the 35-54 age group and 8 percent of adults over age 55.
School websites: More than half of parents (56%) visit their children’s school websites. However, only 30 percent of those with household incomes under $40,000 do so, compared to 84 percent of those with incomes of $80,000 or more.
4 PPIC Statewide Survey

Press Release
June 2008 5
WHO’S TEXTING?
Some experts have suggested that mobile devices may be the platform to bridge the digital divide because a phone and service plan costs less than a computer and Internet connection. In California, 75 percent of all adults and solid majorities in all demographic categories have cell phones. Whites (83%) and blacks (78%) are more likely than Asians (72%) and Latinos (63%) to have cell phones.
Nearly six in 10 use their cell phones to send or receive text messages, and younger residents (87%) are the most likely to do so. They are also the most likely to use their cell phones for email or to access the Internet. Overall, one in four Californians uses cell phones for email (26%) or to go online (25%).
MORE KEY FINDINGS:
More have DSL connections – Page 12
To access the Internet, 29 percent have DSL, 19 percent have cable modems, 5 percent have wireless, and 2 percent have fiber optic or T-1 connections. Just 7 percent have dial-up connections.
Most say cities should provide free wireless – Page 19
As local governments consider the benefits and difficulties of providing free wireless Internet access, 67 percent of Californians say it is a good idea and 26 percent say it is a bad one.
Comfort with technology, worries about security – Pages 20, 21
Internet users are comfortable using technology but less confident that they can keep viruses and spyware out of their computers. They’re even less confident about the security and privacy of financial transactions online.
Californians concerned about digital divide – Page 22
Two-thirds (65%) think Californians in lower-income areas are less likely to have broadband Internet access, and nearly as many (62%) are at least somewhat concerned about the disparities.
ABOUT THE SURVEY
This is the first survey in a series on public opinion and information technology conducted with funding from the California Emerging Technology Fund and ZeroDivide. The report is based on a telephone survey of 2,503 California adult residents, including 2,253 interviewed on landline telephones and 250 on cell phones, conducted between June 3 and June 17, 2008. Interviews were conducted in English, Spanish, Chinese (Mandarin or Cantonese), Vietnamese, and Korean. The sampling error for the 2,503 adults is +/- 2%. The sampling error for subgroups is larger. For more information on methodology, see page 25.
Mark Baldassare is president and CEO of PPIC, where he holds the Arjay and Frances Fearing Miller Chair in Public Policy. He is founder of the PPIC Statewide Survey which he has directed since 1998. This is the 87th PPIC Statewide Survey in a series that has generated a database that includes the responses of more than 185,000 Californians.
PPIC is a private, nonprofit organization dedicated to informing and improving public policy in California through independent, objective, nonpartisan research on major economic, social, and political issues. The institute was established in 1994 with an endowment from William R. Hewlett. PPIC does not take or support positions on any ballot measure or on any local, state, or federal legislation, nor does it endorse, support, or oppose any political parties or candidates for public office.
This report and a related Just the Facts: The Digital Divide will appear on PPIC’s website (www.ppic.org) after 10 p.m. on June 25, 2008.

ACCESS AND USE
KEY FINDINGS
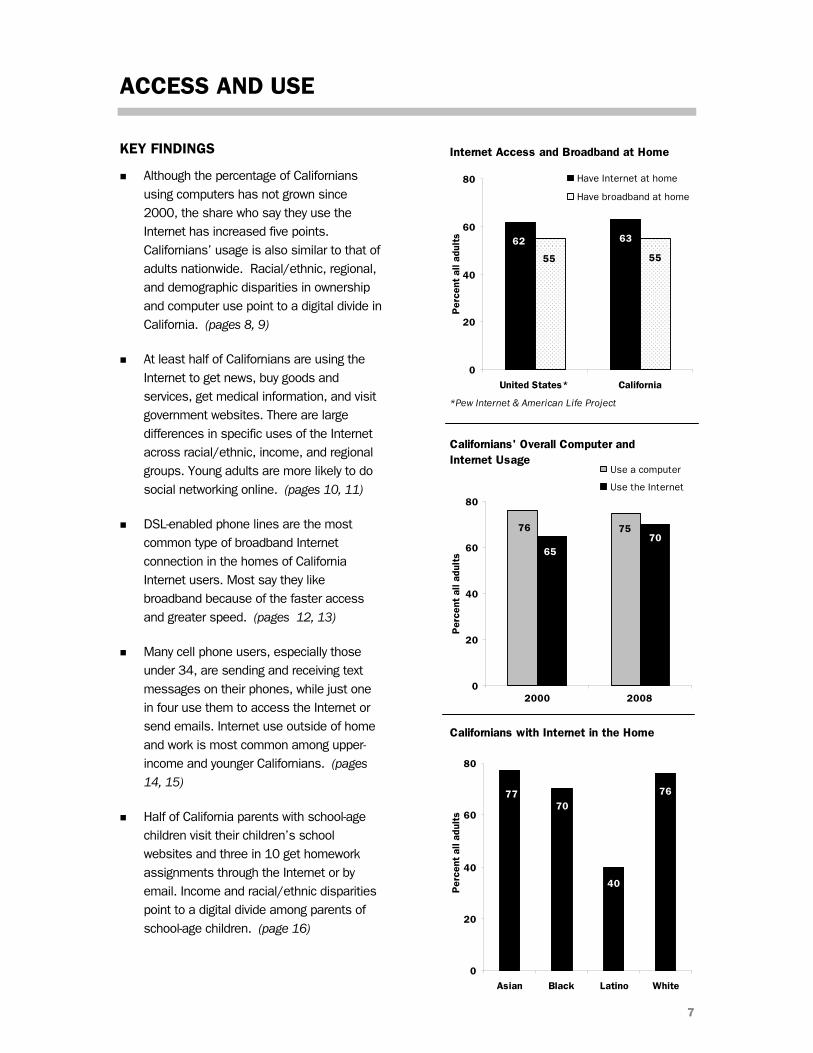
Although the percentage of Californians using computers has not grown since 2000, the share who say they use the Internet has increased five points. Californians’ usage is also similar to that of adults nationwide. Racial/ethnic, regional, and demographic disparities in ownership and computer use point to a digital divide in California. (pages 8, 9)
At least half of Californians are using the Internet to get news, buy goods and services, get medical information, and visit government websites. There are large differences in specific uses of the Internet across racial/ethnic, income, and regional groups. Young adults are more likely to do social networking online. (pages 10, 11)
DSL-enabled phone lines are the most common type of broadband Internet connection in the homes of California Internet users. Most say they like broadband because of the faster access and greater speed. (pages 12, 13)
Many cell phone users, especially those under 34, are sending and receiving text messages on their phones, while just one in four use them to access the Internet or send emails. Internet use outside of home and work is most common among upper-income and younger Californians. (pages 14, 15)
Half of California parents with school-age children visit their children’s school websites and three in 10 get homework assignments through the Internet or by email. Income and racial/ethnic disparities point to a digital divide among parents of school-age children. (page 16)
76 75
6570
0
20
40
60
80
2000 2008
Per
cent
all
adul
tsUse a computer
Use the Internet
Californians' Overall Computer and Internet Usage
7770
40
76
0
20
40
60
80
Asian Black Latino White
Per
cent
all
adul
ts
Californians with Internet in the Home
62 63
5555
0
20
40
60
80
United States* California
Per
cent
all
adul
ts
Have Internet at home
Have broadband at home
Internet Access and Broadband at Home
*Pew Internet & American Life Project
7

Californians and Information Technology
COMPUTER AND INTERNET ACCESS AT HOME
Large majorities of Californians today report that they have a computer (72%) and Internet access at home (63%). Californians are just as likely as residents nationwide to have Internet access at home (63% to 62%), according to a 2008 Pew Internet & American Life Project survey, and are just as likely to have broadband at home (55% each). (Broadband users are defined as having a DSL, cable, wireless, T-1, or fiber-optic Internet connection.) More Californians have computers at home today than in 1999 (63%); a similar comparison for Internet access at home is not available.
A digital divide is apparent today when comparing rates of home computer ownership, Internet connection, and broadband access across demographic groups. Fewer than half of Latinos (48%) report having a computer at home, compared to about eight in 10 or more whites (86%), Asians (84%), and blacks (79%). The same trends hold for having an Internet connection and broadband service. Lower-income respondents are also less likely to have a computer (50%), Internet access (40%), or home broadband service (33%), while almost all adults earning over $80,000 a year have a computer (97%), Internet access at home (90%), and a broadband connection (85%). Adults over 55 are less likely to report having a computer (67%), an Internet connection at home (53%), or home broadband service (44%) than adults under 35 (71%, 68%, and 60%, respectively).
A regional disparity is also apparent: Los Angeles residents (48%) report having a broadband connection at a lower rate than do San Francisco Bay Area residents (65%). Residents in rural areas are also somewhat less likely to have a computer, Internet access, or broadband connection at home.
What is the main reason that adults do not have a computer at home? Thirty-seven percent say the cost of a computer, while fewer say they do not want one (22%) or they do not know how to use one (21%).
“Do you have…”
Percent saying yes
… any type of personal computer, including laptops,
in your home?
…. an Internet connection at
home?
…a broadband connection at
home?
All Adults 72% 63% 55%
18-34 71 68 60
35-54 77 67 61 Age
55 and over 67 53 44
Under $40,000 50 40 33
$40,000 to $79,999 84 76 64 Income
$80,000 or more 97 90 85
Asian 84 77 67
Black 79 70 66
Latino 48 40 34 Race/Ethnicity
White 86 76 68
Central Valley 68 62 53
San Francisco Bay Area 79 71 65
Los Angeles 67 55 48
Orange/San Diego 75 66 58
Region
Inland Empire 73 63 56
Rural 65 58 51 Community
Urban 73 63 56
8 PPIC Statewide Survey

Access and Use
OVERALL COMPUTER AND INTERNET USAGE
Three in four Californians report using a computer at home, school, or work (75%) and seven in 10 access the Internet (70%). Overall computer use today is similar to 2000 (76% 2000, 75% today), but Internet use has increased somewhat (65% to 70%). According to the 2008 Pew Internet & American Life Project survey, Californians and adults nationwide today are similar in computer use (75% to 74%) and Internet use (70% to 73%).
Mirroring the divide in computer ownership and Internet access at home, a gap in overall computer and Internet use is evident across demographic groups. Whites (85%), blacks (83%), and Asians (81%) are again far more likely than Latinos (58%) to use a computer. In addition, about six in 10 Californians (58%) who earn less than $40,000 annually report that they use a computer, while almost all adults who earn more than $80,000 (94%) use a computer. Adults younger than 35 are the age group most likely to report using a computer (83%) or the Internet (78%), while adults 55 and over are the least likely (62%, and 58%, respectively).
Across the state’s regions, Los Angeles residents have the lowest rate of computer and Internet usage (70% and 61%, respectively), while the San Francisco Bay Area has the highest (81% and 77%). The rate of computer use is higher in urban areas (76%) than in rural communities (66%) and the Internet is also used at higher rate within urban communities (70% to 63%)
Computer Use Internet Use
Percent saying yes Do you ever use a computer at home, at work, or at school?
Do you ever go online to access the Internet or worldwide web or send or
receive email? or Do you send or receive email, at least occasionally?
All Adults 75% 70%
18-34 83 78
35-54 78 73 Age
55 and over 62 58
Under $40,000 58 49
$40,000 to $79,999 86 83 Income
$80,000 or more 94 92
Asian 81 80
Black 83 82
Latino 58 48 Race/Ethnicity
White 85 81
Central Valley 74 71
San Francisco Bay Area
81 77
Los Angeles 70 61
Orange/San Diego 77 73
Region
Inland Empire 73 70
Rural 66 63 Community
Urban 76 70
June 2008 9

Californians and Information Technology
SPECIFIC INTERNET ACTIVITIES
At least half of Californians use the Internet for getting news and information on current events (55%), to buy goods and services (52%), to get health and medical information (50%), and to visit a state, local, or federal government website (50%). Just under half use the Internet for information for their work or job (49%), to bank or manage finances online (47%), to get information about activities or events in their community (47%), or to get news and information about politics or the 2008 campaigns (46%). Fewer residents report going online to access government resources such as downloadable forms (43%), to get housing and real estate information (40%), for educational activities such as taking a class (27%), or to use a social networking site (26%).
Compared to 1999, Californians are far more likely now to report going online for shopping (30% 1999, 52% today) and to get news about current events (43% 1999, 55% today); residents are slightly more likely now to go online for information for their work or job (45% 1999, 49% today).
In recent surveys conducted by the Pew Research Center, Internet users nationwide are less likely than California’s Internet users to report going online for certain activities. Seventy-nine percent of California Internet users have gone online to get news and information about current events, compared to 71 percent nationwide. The pattern is similar for going online to get news or information about politics or the 2008 campaigns (65% of California Internet users to 55% U.S. Internet users), online shopping (75% to 66%), visiting government websites (71% to 66%), going online for information about their work or job (70% to 47%), to bank or manage finances (67% to 53%), and for educational purposes such as taking a class (39% to 12%).
“Please tell me if you ever use the Internet to do any of the following things: How about going online …”
Percent saying yes
…to get news on current events?
…to purchase goods and services?
…to get health or medical
information?
…to visit a government
website?
…for information
for your work or job?
…to do any
banking?
All Adults 55% 52% 50% 50% 49% 47%
18-34 62 56 54 54 60 54
35-54 61 57 54 54 55 51 Age
55 and over 41 43 43 41 29 35
Under $40,000 34 27 30 27 30 26
$40,000 to $79,999
68 63 60 65 58 58 Income
$80,000 or more
79 84 74 75 74 74
Asian 61 58 55 56 58 57
Black 62 63 52 60 47 55
Latino 35 29 31 27 34 28 Race/Ethnicity
White 67 67 62 64 58 58
Central Valley 50 50 51 50 49 43
San Francisco Bay Area
66 62 57 60 57 55
Los Angeles 49 44 45 42 43 41
Orange/ San Diego
60 60 51 54 53 55
Region
Inland Empire 50 47 49 46 43 44
Rural 48 47 46 46 45 42 Community
Urban 55 53 51 50 49 47
10 PPIC Statewide Survey

Access and Use
SPECIFIC INTERNET ACTIVITIES (CONTINUED)
Despite California’s overall higher rate of Internet activity, reports of Internet activity are significantly different across racial/ethnic and demographic subgroups, pointing again to a digital divide within the state. Lower-income Californians, Latinos, and older residents are overwhelmingly less likely than others to rely on the Internet for typical uses, with fewer than half reporting that they do so. Lower-income residents (30%) and Latinos (31%) are also far less likely than others to say they use the Internet to get health or medical information. Also, when it comes to online shopping, residents with annual household incomes over $80,000 (84%) and incomes between $40,000 and $80,000 (63%) are significantly more likely than those with incomes under $40,000 (27%) to say they have done this. And while just 29 percent of Latinos report shopping online, solid majorities of Asians (58%), blacks (63%), and whites (67%) say they do As income and education levels rise, residents are much more likely to say they bank online, get news online, and get information for their jobs online.
As for regional differences, San Francisco Bay Area residents are much more likely than Los Angeles residents to have been engaged in a variety of online activities, including getting news on current events, shopping, getting medical information, visiting a government website, and doing banking. Rural residents lag somewhat behind urban residents in most Internet activities.
Half of residents under 35 are using a social networking site while 20 percent of 35–54 year olds and just 8 percent of those 55 and older do so.
“Please tell me if you ever use the Internet to do any of the following things: How about going online …”
Percent saying yes …to get
information about your
community?
…to get news or
information about
politics?
…to access government resources?
…to get housing or real estate
information? …for your education?
…to use a social
networking site?
All Adults 47% 46% 43% 40% 27% 26%
18-34 52 52 45 44 43 52
35-54 52 50 47 47 26 20 Age
55 and over 36 33 35 28 11 8
Under $40,000 30 27 23 24 20 26
$40,000 to $79,999
56 57 54 47 31 27 Income
$80,000 or more 71 65 66 60 37 29
Asian 54 47 52 47 35 37
Black 59 54 49 52 36 37
Latino 29 29 22 22 21 22 Race/Ethnicity
White 57 55 54 50 27 25
Central Valley 43 38 41 38 29 26
San Francisco Bay Area
59 56 52 47 26 30
Los Angeles 40 42 35 34 25 25
Orange/ San Diego
53 50 52 42 28 27
Region
Inland Empire 42 39 39 37 28 29
Rural 41 40 38 39 20 18 Community
Urban 48 46 43 40 27 27
June 2008 11

Californians and Information Technology
FREQUENCY OF INTERNET USAGE
Four in 10 California Internet users go online or check email several times a day when at home; 43 percent go online several times a day from work. Sixty-six percent of California Internet users go online less frequently—once a day or more—from home. Fifty-two percent go online once a day or more from work. Very few Internet users go online or check email frequently outside home or work.
California Internet users today are more likely than those nationally to use the Internet or email from home at least once a day (66% to 58%). They are only slightly more likely than national users to use the Internet or email from work at least once a day (52% to 44%), according to the 2008 Pew survey.
“About how often do you use the Internet or email from…”
Internet users only …home? …work? … some place other than home or work?
Several times a day 41% 43% 8%
About once a day 25 9 6
3-5 days a week 13 5 6
1-2 days a week 9 4 8
Every few weeks 3 1 7
Less often 3 5 24
Never (volunteered) 6 33 41
INTERNET CONNECTION AT HOME
Sixty-three percent of California residents report having some type of Internet connection at home. Fifty-five percent have a broadband connection—including 29 percent with a DSL connection, 19 percent with a cable modem, 5 percent with wireless, and 2 percent with a fiber optic or a T-1 connection. Only 7 percent report having a dial-up connection. Californians are just as likely as Americans nationwide to have broadband at home (55% each), according to the 2008 Pew survey.
The adoption of broadband in the home varies greatly by income and education level, varies slightly by urban and rural location, and is twice as high among whites as Latinos (68% to 34%). Adults 55 years and older (44%) are less likely than others to have broadband. Broadband use is highest in the San Francisco Bay Area (65%) and lowest in the Central Valley (53%) and Los Angeles County (48%).
“What kind of Internet connection do you have at home? Do you use a dial-up telephone line, or do you have some other type of connection, such as a DSL-enabled phone line, a cable TV modem, a wireless
connection, a fiber optic connection such as FiOS or a T-1?”
Household Income Community All Adults
Under $40,000
$40,000 to $79,999
$80,000 or more
Rural Urban
Dial-up telephone line 7% 7% 11% 5% 6% 7%
DSL-enabled phone line 29 18 35 43 27 29
Cable modem 19 11 23 29 15 20
Wireless connection 5 3 4 9 6 5
Fiber optic or T-1 2 - 2 4 3 2
Other (volunteered) 1 1 - 1 1 1
No Internet/computer at home
36 60 23 9 42 35
Don’t know 1 - 2 - - 1
12 PPIC Statewide Survey

Access and Use
BROADBAND ADOPTION
When asked what they like most about having a high-speed Internet connection, seven in 10 broadband users mention faster access or greater speed. Far fewer broadband users cite other reasons. More than six in 10 across racial/ethnic, income, age, and regional groups hold this view.
“What do you like most about having a high-speed Internet connection at home?”
Race/Ethnicity Income Broadband users only
All Broadband
Users Latino White Under $40,000
$40,000 to $79,999
$80,000 and above
Faster access/greater speed 71% 74% 72% 70% 68% 74%
Convenience in general 11 11 11 11 12 11
Easier to check email/ easier to communicate 3 2 2 4 3 2
Doing job-related tasks from home/working from home
2 2 2 1 2 3
Downloading all types of files faster
2 1 2 2 2 1
The 'always on' connection
2 2 2 2 3 3
Other (volunteered) 7 5 7 8 7 4
Don’t know 2 3 2 2 3 2
Of those who have broadband, nearly six in 10 say they subscribe to basic service, while about three in 10 subscribe to a premium service that promises faster speed. Subscribing to premium service increases with income and age. Whites (32%) are somewhat more likely than Latinos (25%) to subscribe to premium service. Fewer than four in 10 broadband users in individual regions subscribe to premium service, with residents in the Inland Empire (37%) the most likely to do so.
“Thinking about your high-speed Internet service at home, do you subscribe to a basic broadband service, or do you pay extra for a premium service that promises faster speed?”
Race/Ethnicity Income Broadband users only
All Broadband
Users Latino White Under $40,000
$40,000 to $79,999
$80,000 and above
Subscribe to basic service 58% 64% 56% 66% 59% 55%
Subscribe to premium service at higher price
31 25 32 24 32 33
Don’t know 11 11 12 10 9 12
Among Internet users who do not have a broadband connection in their home, 74 percent say that high-speed Internet service is available in their neighborhood. Asked if they would like to have a faster broadband connection, seven in 10 dial-up users say they are not interested. When asked what it would take for them to switch to broadband, 35 percent of these dial-up users say that the price of broadband would have to be lower, but one in four say they are simply not interested in switching to broadband.
June 2008 13

Californians and Information Technology
MOBILE DEVICES
Seventy-five percent of California adults say they have a cell phone. While cell phone ownership increases with education and income, about six in 10 or more in all demographic groups have a working cell phone. Across racial/ethnic groups, whites (83%) and blacks (78%) are more likely than Asians (72%) and Latinos (63%) to have a cell phone. A majority of cell phone users (58%) say they use the device to send or receive text messages, while about one in four send or receive email (26%), or access the Internet (25%) with their mobile phone.
Use of a cell phone to send or receive text messages is highest by far among younger cell phone users (87% under 35, 57% 35–54, 23% age 55 and over). Across racial/ethnic groups, Latinos (63%) are more likely than whites (54%) to text-message (sample sizes for black and Asian cell phone users are too small for separate analysis). Majorities of cell phone users across income groups and regions report using their cell phones to send and receive text messages. Residents who have broadband Internet at home are more likely than those without to send or receive text messages on a cell phone.
When it comes to using their cell phones to send and receive email messages, younger cell phone users (39%) are more likely to do this than others. Upper-income cell phone users (30%) are slightly more likely than others (24% under $40,000, 24% $40,000-$80,000), and Latinos slightly more likely than whites (29% to 23%), to use a cell phone for this purpose. Across regions, cell phone users in the San Francisco Bay Area are somewhat less likely to report this activity than those in other regions.
Using cell phones to access the Internet is another activity that has been adopted much more often by younger users (41% under 35, 23% 35–54, 9% 55 and over). Across racial/ethnic groups, Latinos (25%) and whites (22%) are similarly likely to use a cell phone for Internet access. Among cell phone users in California who use them to access the Internet, 15 percent do not have a home Internet connection, while 84 percent do.
“Do you ever use your cell phone to…” Cell phone users only Percent saying yes
…send or receive text messages?
…send or receive email?
…to access the Internet?
All Cell Phone Users 58% 26% 25%
18-34 87 39 41
35-54 57 26 23 Age
55 and over 23 11 9
Under $40,000 60 24 26
$40,000 to $79,999 56 24 20 Income
$80,000 or more 62 30 30
Latino 63 29 25 Race/Ethnicity
White 54 23 22
Central Valley 58 27 26
San Francisco Bay Area 57 23 22
Los Angeles 60 28 30 Region
Orange/San Diego Inland Empire 59 29 26
14 PPIC Statewide Survey

Access and Use
INTERNET USE OUTSIDE OF HOME AND WORK
More than one in three California Internet users (35%) access the Internet from someplace other than work or home at least once every few weeks. Of these, 60 percent use a laptop computer with a wireless connection, 42 percent use a cell phone or handheld device, and 37 percent use a computer at a public library.
More affluent (52%) and younger Californians (62%) are also the most likely use a laptop through a wireless connection when going online outside work or home. Those in the San Francisco Bay Area and Los Angeles (65% each) are more likely to access the Internet using a laptop through a wireless connection. Of those who use a wireless laptop, 72 percent have used public WiFi or other public wireless Internet services. Of those using WiFi, 55 percent have mostly used free services, 9 percent have mostly used pay services, and 34 percent have used a mix of the two.
Using cell phones or handheld devices to access the Internet is most popular among younger (49%) and more affluent Californians (58%). Whites and Latino do so equally (41% each).
Less affluent Californians (51%) are more likely to use a computer at a public library to access the Internet. Latinos (40%) are far more likely than whites (28%) to do so.
Among all adults, accessing the Internet with a wireless laptop, a cell phone, or at the library is rare and infrequent (14%, 10%, and 9% respectively) across all age, income, race/ethnic, and regional groups.
“Now please think about the ways you accessed the Internet from someplace other than from home or from work. Did you access the Internet…”
Those who access the Internet outside of home or work only Percent saying yes
…using a laptop through a wireless
connection?
…using a cell phone or handheld device such as a
Blackberry?
…using a computer at a public library?
Internet Users 60% 42% 37%
18-34 62 49 42
35-54 60 38 30 Age
55 and over 53 30 39
Under $40,000 52 33 51
$40,000 to $79,999 47 34 43 Income
$80,000 or more 73 58 20
Latino 57 41 40 Race/Ethnicity
White 65 41 28
Central Valley 48 44 31
San Francisco Bay Area 65 39 41
Los Angeles 65 44 39 Region
Orange/San Diego Inland Empire
60 48 39
June 2008 15

Californians and Information Technology
16 PPIC Statewide Survey
CHILDREN, SCHOOLS, AND THE INTERNET
Communication with schools is a significant driver of Internet use among parents of school-age children. About half of high school parents (53%), elementary school parents (51%), or middle school parents (49%) visit the website of their child’s school often or sometimes.
“Do you ever visit the website of this child’s school?”
Elementary school parents Middle school parents High school parents
Yes, often 19% 23% 28%
Yes, sometimes 32 26 25
No 49 51 47
Altogether, more than half (56%) of those with children in school report visiting the website of their children’s school. However, there are stark differences by race/ethnicity, with nearly three in four whites (74%) using the Internet for this purpose, compared to four in 10 Latinos (41%). The gap is even wider between income groups—only 30 percent of those with household incomes under $40,000 visit their child’s school website, compared to 84 percent of those with incomes of $80,000 or more.
“Do you ever visit the website of this child’s school?”
Income Race/Ethnicity Parents
Under $40,000
$40,000 to $80,000
$80,000 or more
Latino White
Yes 56% 30% 63% 84% 41% 74%
No 44 70 37 16 59 26
Use of the Internet to get homework assignments increases with the child’s level of schooling. Among elementary school parents, only 18 percent access their child’s homework assignments via email. The rate rises to 28 percent for middle school parents and to 35 percent among high school parents.
“Do you ever receive this child’s homework assignments via the Internet or email?”
Elementary school parents Middle school parents High school parents
Yes, often 8% 13% 15%
Yes, sometimes 10 15 20
No 82 72 65
Altogether, 28 percent of parents with children in school use the Internet to obtain their child’s homework assignments through email. Again, there are divisions apparent among demographic groups. Whites (34%) report receiving their children’s homework electronically much more often than do Latinos (20%). Similarly, parents with annual household incomes of $80,000 or more are nearly three times more likely than parents with household incomes of under $40,000 to use the Internet or email for a child’s homework.
“Do you ever receive this child’s homework assignments via the Internet or email?”
Income Race/Ethnicity Parents
Under $40,000
$40,000 to $80,000
$80,000 or more
Latino White
Yes 28% 15% 30% 41% 20% 34%
No 72 85 70 59 80 66

PERCEPTIONS AND ATTITUDES
KEY FINDINGS
716872
64
0
20
40
60
80
Asian Black Latino White
Per
cent
all
adul
ts
Perceived Importance of Californians Having Access to the Internet
Percent saying very important
14
3242
12
More than enoughJust enoughNot enoughDon't know
Government Regulation of the Internet
All adults
3226
67
58
0
20
40
60
80
2007 2008
Per
cent
all
adul
tsGood Idea
Bad Idea
Free Wireless Broadband InternetProvided by Local Government
Nearly seven in 10 Californians and strong majorities across demographic groups say it is very important for Californians to have Internet access. Most adults say the Internet is an important information source in their own daily lives, with younger, higher- income, and college-educated adults most likely to hold this view. (page 18)
About two in three Californians today think that it would be a good idea for local governments to provide free wireless broadband Internet to all residents at no cost. About half say the government is doing just enough or more than enough to improve Internet access and to regulate the Internet. (page 19)
Large majorities of Internet users say they are very comfortable with using the tools of modern information technology and getting information from the Internet. Most Internet users, however, are not very confident about keeping computer viruses out of their home computers, or that financial transactions on the Internet are secure and private. (pages 20, 21)
Majorities of residents think that Californians in lower-income areas and rural areas have less access to broadband Internet technology than others, and majorities are also at least somewhat concerned about this. Awareness of this digital divide varies by income group, but not by rural status; concern varies by political group. (pages 22, 23)
17

Californians and Information Technology
PERCEPTIONS OF THE INTERNET
Nine in 10 residents say it is very important (69%) or somewhat important (21%) that Californians have Internet access, but what do they think about the role of the Internet in their own daily lives?
Half of Californians (51%) say the Internet is a very important information source, while another 29 percent say is it somewhat important, and fewer than one in five say it is not too (9%) or not at all (9%) important. The level of importance that Californians place on the Internet in their own lives rises with education and income, and decreases with older age. College graduates (61%), those with annual household incomes over $80,000 (64%), and adults under 35 (61%) are the most likely to say the Internet is very important to them as a source of information in their everyday lives. Across racial/ethnic groups, Asians (57%) are somewhat more likely than blacks (53%), whites (51%), or Latinos (50%) to say the Internet is very important as a source of information. A high value placed on the Internet as an information source is similar among urban and rural residents, among U.S.- and foreign-born residents, among those with children 18 years or younger and those without children, and among men and women. Nearly all Californians who use the Internet (92%) say the Internet is at least somewhat important in everyday life, and even 56 percent of those who do not use the Internet agree with this statement.
“How important is the Internet as a source of information in your everyday life?”
Very important
Somewhat important
Not too important
Not at all important Don't know
All Adults 51% 29% 9% 9% 2%
18-34 61 28 7 4 -
35-54 55 29 9 5 2 Age
55 and over 34 31 13 19 3
High school 41 31 12 13 3
Some college 56 29 8 7 - Education
College graduate 61 27 7 5 -
Under $40,000 43 30 14 11 2
$40,000 to $79,999 51 31 9 8 1 Income
$80,000 or more 64 29 4 3 -
Asian 57 27 8 6 2
Black 53 34 5 7 1
Latino 50 29 11 9 1 Race/Ethnicity
White 51 30 9 9 1
Central Valley 48 30 10 10 2
San Francisco Bay Area
52 31 9 7 1
Los Angeles 53 27 9 10 1
Orange/San Diego 48 33 9 9 1
Region
Inland Empire 53 28 10 8 1
Rural 48 29 4 17 2 Community
Urban 51 29 10 8 2
Yes 61 31 6 2 - Use Internet
No 30 26 16 25 3
18 PPIC Statewide Survey

Perceptions and Attitudes
ROLE OF GOVERNMENT
With most residents saying that Internet access is important for Californians today, how do they feel about the government’s role? A majority of Californians (54%) say the government is doing just enough (42%) or more than enough (12%) to regulate the Internet, while 32 percent say it is not doing enough, and 14 percent are undecided. Democrats (37%) are more likely than Republicans (28%) or independents (23%) to say that government is not doing enough to regulate the Internet.
When it comes to improving the access and availability of broadband Internet technology, a majority of Californians (51%) say the government is doing just enough (41%) or more than enough (10%), while 30 percent say it is not doing enough, and 19 percent are undecided. Findings among Internet users are similar to those of all adults.
Across parties, about four in 10 Republicans (43%), independents (40%), and Democrats (40%) say that government is doing just enough to improve broadband access, while Democrats (36%) and independents (33%) are more likely than Republicans (22%) to say government is not doing enough.
“Overall, thinking about the government’s role in improving the access and availability of broadband Internet technology, do you think the government is doing
more than enough, just enough, or not enough?”
Party All Adults
Dem Rep Ind Internet Users Likely
Voters
More than enough 10% 7% 14% 9% 10% 11%
Just enough 41 40 43 40 43 37
Not enough 30 36 22 33 31 31
Don’t know 19 17 21 18 16 21
Some local governments have considered providing free wireless broadband Internet access to all their residents. Among Californians today, 67 percent say this is a good idea and 26 percent say it is a bad idea. Approval for providing free wireless access has increased since we first asked this question in March 2007 (58% good idea, 32% bad idea). Findings among Internet users are similar to all adults. A majority of likely voters say that local government providing wireless access is a good idea.
Democrats (75%) and independents (64%) are far more likely to say local government providing Internet access to residents is a good idea. Republicans are divided (45% good idea, 48% bad idea). Latinos (83%), blacks (81%), and Asians (75%) are more likely than whites (53%) to say it is a good idea. The belief that providing free wireless Internet access is a good idea is strong across most demographic groups, but declines as age, income, and education increase.
“Some local governments have considered providing wireless broadband Internet access to all residents at no cost. Is it a good idea or a bad idea for local governments
to provide Internet access to its residents?”
Party All Adults
Dem Rep Ind. Internet Users Likely
Voters
Good idea 67% 75% 45% 64% 66% 57%
Bad idea 26 19 48 27 28 35
Don’t know 7 6 7 9 6 8
June 2008 19

Californians and Information Technology
COMFORT WITH TECHNOLOGY
With most Californians saying the Internet is an important information source, nearly all (93%) Internet users describe themselves as at least somewhat comfortable. Sixty-two percent of Internet users say they are very comfortable with modern information technology, with even higher levels among college graduates (72%), younger residents (71%), and residents with annual household incomes of $80,000 or more (73%). By contrast, just half of high school graduates (50%) and residents age 55 and older (48%) say they are very comfortable using technology.
Strong majorities of blacks (70%), Asians (62%), whites (62%), and Latinos (58%) all report being very comfortable using modern information technology. San Francisco Bay Area (67%) and Los Angeles (66%) residents are the most likely to say they are very comfortable, followed by residents in Orange/San Diego counties (64%), the Central Valley (59%), and the Inland Empire (53%). Men are somewhat more likely than women to say they are very comfortable (65% to 59%), while Californians with children 18 or younger are similar to residents without children in saying they are very comfortable (64% to 61%). U.S.- and foreign-born residents are also similarly likely to say they are very comfortable (62% to 61%). Broadband users are far more likely than non-broadband users to say they are very comfortable using the tools of modern information technology (66% to 44%).
“Overall, how comfortable are you using the tools of modern information technology?”
Education Age Internet users only
Internet Users High
SchoolSome
CollegeCollege
Graduate18-34 35-54 55 and
above
Very comfortable 62% 50% 59% 72% 71% 63% 48%
Somewhat comfortable 31 40 33 23 26 30 38
Not too comfortable 5 8 6 3 2 6 9
Not at all comfortable 1 1 1 2 - 1 4
Don’t know 1 1 1 - 1 - 1
Ninety-five percent of Internet users say they are very (70%) or somewhat comfortable (25%) using the Internet to get the information they need. Few Internet users say they are not too comfortable (3%) or not at all comfortable (1%). Men and women, and U.S.- and foreign-born residents report similarly high levels of comfort with using the Internet. Californians with children 18 or younger (73%) are somewhat more likely than residents without children under 18 (68%) to report they are very comfortable using the Internet. Comfort increases with higher income and education. Three in four broadband users (75%) say they are very comfortable using the Internet while just half of non-broadband users (50%) say so.
“Overall, how comfortable are you using the Internet to get the information needed in your everyday life?”
Income Gender Internet users only
Internet users Under
$40,000$40,000-$79,999
$80,000 or more
Men Women
Very comfortable 70% 59% 67% 82% 71% 69%
Somewhat comfortable 25 34 26 16 24 25
Not too comfortable 3 3 5 2 3 3
Not at all comfortable 1 2 2 - 1 1
Don’t know 1 2 - - 1 2
20 PPIC Statewide Survey

Perceptions and Attitudes
CONFIDENCE IN TECHNOLOGY
While California Internet users report very high levels of comfort with using technology and the Internet, they are not as confident in their abilities to keep computer viruses, spyware, and adware out of their home computers. About seven in 10 say they are at least somewhat confident that they can do so when they want to, but only 32 percent say they are very confident about doing so.
Residents with at least some college education report higher levels of confidence than high school graduates in keeping things like computer viruses, spyware, and adware out of their home computers, while across age groups, Internet users under age 35 report the greatest levels of confidence. Across racial/ethnic groups, blacks (37%) and whites (35%) are more confident than Asians (29%) and Latinos (24%). Across demographic groups, men (35%) are somewhat more likely than women (29%), Californians without children (34%) are somewhat more likely than residents with children 18 or under (29%), and U.S.-born residents (34%) are somewhat more likely than foreign-born residents (27%) to say they are very confident about keeping things like computer viruses, spyware, and adware off their computers.
“Overall, how confident are you that you can keep things like computer viruses, spyware, and adware off of your home computer when you want to?”
Education Age Internet users only
Internet Users High
schoolSome
collegeCollege
graduate18-34 35-54 55 and
above
Very confident 32% 25% 37% 34% 37% 29% 30%
Somewhat confident 41 38 43 41 38 41 44
Not too confident 17 22 12 17 16 20 15
Not at all confident 8 12 6 7 8 9 8
Don’t know 2 3 2 1 1 1 3
When asked about the security and privacy of financial transactions on the Internet, 69 percent of California Internet users are at least somewhat confident that financial transactions on the Internet are secure and private, but just 26 percent say they are very confident. Confidence in the security and privacy of these transactions is highest among residents with household incomes of $80,000 or more and among college graduates. Lower-income residents are twice as likely as upper-income residents to say they are very confident (40% to 20%). Men (29%) are somewhat more likely than women (23%) to say they are very confident about the security of online financial transactions. Across racial/ethnic groups, whites (29%) are the most likely to say they are very confident, followed by blacks (26%), Asians (22%), and Latinos (21%). Broadband users (30%) are significantly more likely than non-broadband users (11%) to say they are very confident about the security of online financial transactions.
“How confident are you that financial transactions on the Internet are secure and private?”
Income Gender Internet users only
Internet users Under
$40,000$40,000-$79,999
$80,000 or more
Men Women
Very confident 26% 19% 26% 33% 29% 23%
Somewhat confident 43 38 42 46 43 42
Not too confident 16 20 18 13 14 19
Not at all confident 13 20 12 7 12 14
Don’t know 2 3 2 1 2 2
June 2008 21

Californians and Information Technology
ACCESS IN LOWER-INCOME AREAS
Two-thirds of Californians (65%) think that those in lower-income areas of the state are less likely than others to have access to broadband Internet technology, while 27 percent think they are no less likely to have access. The belief that residents in lower-income areas have less access to broadband Internet technology is highest for those with household income of $80,000 or more. Findings are similar in urban and rural communities.
Among racial/ethnic groups, whites (68%), blacks (65%), and Latinos (63%) are similarly likely to say that Californians in lower-income areas are less likely than others to have broadband access, while Asians (57%) are somewhat less likely to agree. Across regions, at least six in 10 in the San Francisco Bay Area (68%), Central Valley (66%), Los Angeles (65%), and Orange/San Diego counties (61%) say there is an inequality in broadband access for lower-income residents, while Inland Empire residents (57%) are least likely to agree. Broadband users (69%) more than non-broadband users (59%) think that Californians in lower-income areas are less likely to have broadband Internet access.
“Do you think that Californians in lower-income areas are less likely than others to have access to broadband Internet technology, or not?”
Household Income Community All Adults
Under $40,000
$40,000 to $79,999
$80,000 or more
Rural Urban
Yes, less likely 65% 64% 62% 71% 63% 65%
No, not less likely 27 29 31 23 26 28
Don’t know 8 7 7 6 11 7
Six in 10 Californians (62%) are at least somewhat concerned that Californians in lower-income areas are less likely than others to have access to broadband Internet technology, and 23 percent say they are very concerned. Across political parties, Democrats (32%) are the most likely to say they are very concerned, followed by independents (22%) and Republicans (13%). Findings are similar across income groups. Levels of concern about unequal broadband access are also similar among rural and urban residents.
Across racial/ethnic groups, blacks (35%) are much more likely than others to say they are very concerned that Californians in lower-income areas are less likely than others to have broadband access. Among the 65 percent of residents who think Californians in lower-income areas have less access, seven in 10 say they are very (30%) or somewhat concerned (42%).
“How concerned are you that Californians in lower-income areas are less likely than others to have access to broadband Internet technology?”
Party Community All Adults
Dem Rep Ind Rural Urban
Very concerned 23% 32% 13% 22% 21% 23%
Somewhat concerned 39 41 34 43 36 39
Not too concerned 19 14 25 20 17 19
Not at all concerned 15 10 24 13 23 15
Don’t know 4 3 4 2 3 4
22 PPIC Statewide Survey

Perceptions and Attitudes
June 2008 23
ACCESS IN RURAL AREAS
A majority of Californians (55%) think that those in rural areas are less likely to have access to broadband Internet technology. Thirty percent think they are no less likely. Across the state, Californians in rural areas and urban residents are similar in their belief that rural residents have less broadband access (58% to 55%). This belief increases with higher education and income and declines with higher age.
Residents of the San Francisco Bay Area (58%) and the Central Valley (57%) are the most likely to think Californians in rural areas have less broadband Internet access, with Inland Empire residents (51%) the least likely. Men are somewhat more likely than women to say rural areas have less broadband access (58% to 53%). Findings among U.S.- and foreign-born residents are similar (56% to 54%).
“Do you think that Californians in rural areas are less likely than others to have access to broadband Internet technology, or not?”
Household Income Community All Adults
Under $40,000
$40,000 to $79,999
$80,000 or more
Rural Urban
Yes, less likely 55% 52% 55% 64% 58% 55%
No, not less likely 30 32 33 24 26 30
Don’t know 15 16 12 12 16 15
Half of Californians (51%) are at least somewhat concerned that rural residents are less likely to have broadband access; 14 percent say they are very concerned. Across parties, Democrats (19%) are the most likely to say they are very concerned, with Republicans the most likely to say they are not at all concerned (24%). Findings are similar across rural and urban communities.
Across racial/ethnic groups, blacks (20%) are the most likely to say they are very concerned, while whites (13%) and Asians (14%) are the least likely. Findings among men and women are similar. Concern decreases with increases in age. Among the 55 percent of residents who think rural Californians are less likely to have broadband access, six in 10 say they are very (20%) or somewhat concerned (43%).
“How concerned are you that Californians in rural areas are less likely than others to have access to broadband Internet technology?”
Party Community All Adults
Dem Rep Ind Rural Urban
Very concerned 14% 19% 9% 12% 12% 15%
Somewhat concerned 37 40 32 36 36 37
Not too concerned 24 23 31 30 24 24
Not at all concerned 19 15 24 18 22 19
Don’t know 6 3 4 4 6 5
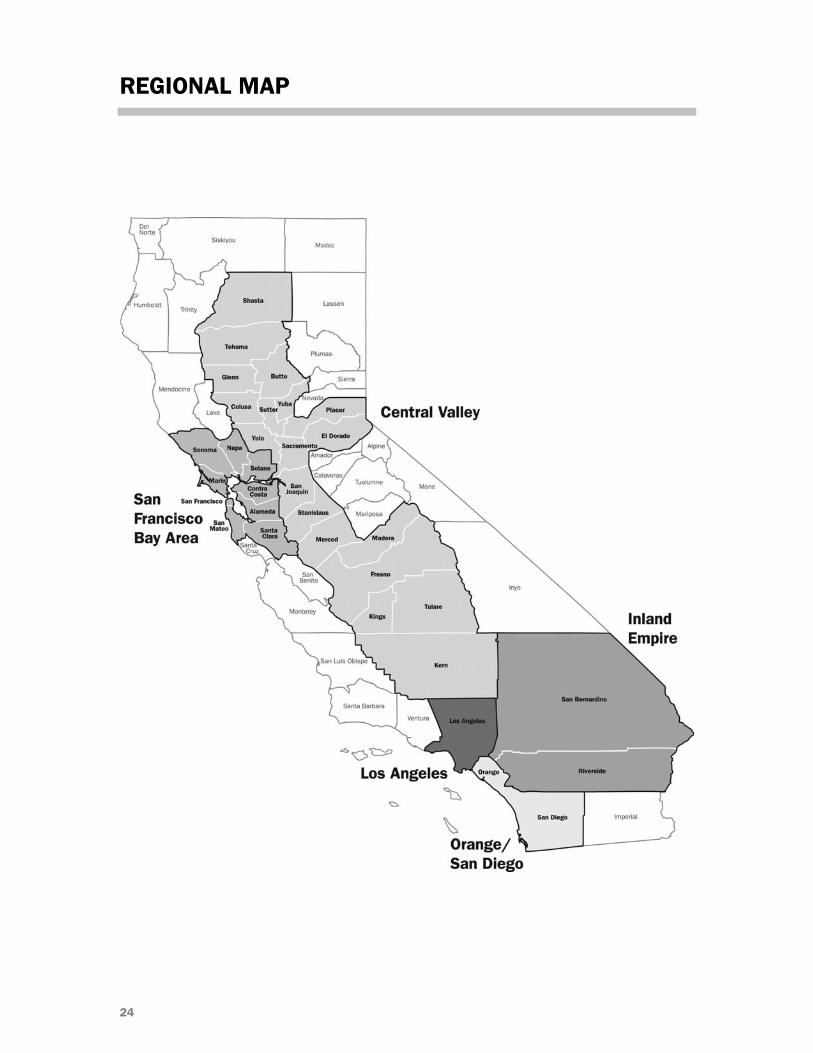
REGIONAL MAP
24

METHODOLOGY
The PPIC Statewide Survey is directed by Mark Baldassare, president and CEO and survey director at the Public Policy Institute of California, with assistance from Dean Bonner, project manager for this survey, survey research associates Jennifer Paluch and Sonja Petek, and survey intern Nicole Fox. This is the first in a series of surveys conducted with funding from the California Emerging Technology Fund (CETF) and ZeroDivide as part of a five-year project on public opinion and information technology issues. We benefited from discussions with the CETF leadership and other experts and consultation with researchers at the Pew Internet & American Life Project and PPIC; however, the survey methods, questions, and content of the report were determined solely by Mark Baldassare and the survey staff.
Findings in this report are based on a telephone survey of 2,503 California adult residents, including 2,253 interviewed on landline telephones and 250 interviewed on cell phones. Interviewing took place on weekday nights and weekend days from June 3 to June 17, 2008. Interviews took an average of 15 minutes to complete. Landline interviews were conducted using a computer-generated random sample of telephone numbers that ensured that both listed and unlisted numbers were called. All landline telephone exchanges in California were eligible for selection and the sample telephone numbers were called as many as six times to increase the likelihood of reaching eligible households. Once a household was reached, an adult respondent (age 18 or older) was randomly chosen for interviewing using the “last birthday method” to avoid biases in age and gender.
Cell phone interviews were included in this survey to account for the growing number of residents who use cell phones. These interviews were conducted using a computer-generated random sample of cell phone numbers. All cell phone numbers with California area codes were eligible for selection and the sample telephone numbers were called as many as eight times to increase the likelihood of reaching an eligible respondent. Once a cell phone user was reached, it was verified that this person was age 18 or older, a resident of California, and in a safe place to continue the survey (i.e., not driving). Cell phone respondents were offered a small reimbursement for their time to help defray the potential cost of the call. Cell phone interviews were conducted both with adults who have only cell phone service and with those who also have a landline telephone in their households.
Landline and cell phone interviewing was conducted in English, Spanish, Chinese (Mandarin or Cantonese), Vietnamese, and Korean, according to respondents’ preferences. We chose these languages because Spanish is the dominant language among non-English speaking adults in California, followed in prevalence by the three Asian languages. Accent on Languages translated the survey into Spanish, with assistance from Renatta DeFever. Abt SRBI Inc. translated the survey into Chinese, Vietnamese, and Korean, and conducted all interviewing.
With assistance from Abt SRBI, we used recent U.S. Census and state figures to compare the demographic characteristics of the survey sample with characteristics of California’s adult population. The survey sample was closely comparable to the census and state figures. Abt SRBI used data from the 2006 National Health Interview Survey (NHIS) for the Pacific Census Division and from the January–July 2007 NHIS to estimate landline and cell phone service in California and compare it against landline and cell phone service reported in the survey. The survey data in this report were statistically weighted to account for any differences in demographics and telephone service.
The sampling error for the total sample of 2,503 adults is +/- 2 percent at the 95 percent confidence level. This means that 95 times out of 100, the results will be within 2 percentage points of what they would be if all adults in California were interviewed. The sampling error for subgroups is larger: For the 1,835 registered voters, it is +/- 2.5 percent; for the 1,295 likely voters, it is +/- 3 percent. Sampling
25

26
error is only one type of error to which surveys are subject. Results may also be affected by factors such as question wording, question order, and survey timing.
Throughout the report, we refer to five geographic regions accounting for approximately 90 percent of the state population. “Central Valley” includes Butte, Colusa, El Dorado, Fresno, Glenn, Kern, Kings, Madera, Merced, Placer, Sacramento, San Joaquin, Shasta, Stanislaus, Sutter, Tehama, Tulare, Yolo, and Yuba counties. “San Francisco Bay Area” includes Alameda, Contra Costa, Marin, Napa, San Francisco, San Mateo, Santa Clara, Solano, and Sonoma counties. “Los Angeles” refers to Los Angeles County, “Inland Empire” includes Riverside and San Bernardino counties, and “Orange/San Diego” refers to Orange and San Diego counties. Residents from other geographic areas are included in the results reported for all adults, registered voters, and likely voters. However, sample sizes for these less populated areas are not large enough to report separately in tables and text. In this survey, we also asked for the zip code of the residence in order to compare the responses of those living in rural areas to those living in urban areas as defined by the U.S. Census. The U.S. Census defines urban areas as generally consisting of a large central place and adjacent densely settled census blocks that together have a total population of at least 2,500 for urban clusters, or at least 50,000 for urbanized areas. Rural areas are defined as any territory not classified as urban.
We present specific results for respondents in four self-identified racial/ethnic groups: Asian, black, Latino, and non-Hispanic white. We also compare the opinions of registered Democrats, Republicans, and independents (i.e., those registered as “decline to state”). We also analyze the responses of likely voters—those who are the most likely to participate in the state’s elections. In addition, we present the responses of Internet users—defined in a manner to be consistent with national surveys for comparison purposes as those who answered yes to either: “Do you ever go online to access the Internet or worldwide web or send or receive email?” or “Do you send or receive email, at least occasionally?”
We compare current PPIC Statewide Survey results to those in our earlier surveys and to those in recent surveys by the Pew Internet & American Life Project.

QUESTIONNAIRE AND RESULTS
CALIFORNIANS AND INFORMATION TECHNOLOGY
June 3–17, 2008 2,503 California Adult Residents: English, Spanish, Chinese, Korean, and Vietnamese
MARGIN OF ERROR +/-2% AT 95% CONFIDENCE LEVEL FOR TOTAL SAMPLE
1. First, do you think things in California are generally going in the right direction or the wrong direction?
22% right direction 69 wrong direction 9 don’t know
2. Turning to economic conditions in California, do you think that during the next 12 months we will have good times financially or bad times?
15% good times 78 bad times 7 don’t know
3a.Changing topics, do you have any type of personal computer, including laptops, in your home?
72% yes [skip to q3e] 28 no [ask q3d]
[q3b and q3c not asked]
3d. And what is the main reason you don’t have a computer at home?
[code, don’t read]
37% cost 22 not interested 21 don’t know how to use it 7 don’t really know about computers 3 sufficient access elsewhere 3 concern about children’s access 6 other 1 don’t know
3e. Do you yourself ever use a computer at home, at work, or at school? (if yes: Do you use a computer often or only sometimes?)
58% yes, often [ask q4] 16 yes, sometimes [ask q4] 25 no [skip to q34] 1 don’t know [skip to q34]
4/4a.Do you ever go online to access the Internet or worldwide web or send or receive email? or Do you send or receive email, at least occasionally?
70% yes 30 no/don’t use a computer
[q5-q9 asked only of Internet users]
5. Did you happen to use the Internet yesterday?
78% yes 22 no
6. About how many years have you been an Internet user?
1% less than 1 year 26 1–5 years 42 6–10 years 21 11–15 years 8 more than 15 years 2 don’t know
27

Californians and Information Technology
7. About how often do you use the Internet or email from home?
41% several times a day 25 about once a day 13 3–5 days a week 9 1–2 days a week 3 every few weeks 3 less often 6 never (volunteered)
8. About how often do you use the Internet or email from work?
43% several times a day 9 about once a day 5 3–5 days a week 4 1–2 days a week 1 every few weeks 5 less often 24 never (volunteered) 9 don’t work/retired (volunteered)
9. About how often do you use the Internet or email from someplace other than home or work?
8% several times a day [ask q10] 6 about once a day [ask q10] 6 3–5 days a week [ask q10] 8 1–2 days a week [ask q10] 7 every few weeks [ask q10] 24 less often [skip to q14] 41 never (volunteered) [skip to q14]
Now please think about the ways you accessed the Internet from someplace other than from home or from work.
[q10-q12 asked only of those who accessed
the Internet from somewhere other than
home or work at least every few weeks]
10. Did you access the Internet using a laptop through a wireless connection?
60% yes 40 no
11. Did you access the Internet using a cell phone or handheld device such as a Blackberry?
42% yes 58 no
12. Did you access the Internet using a computer at a public library?
37% yes 63 no
[If “yes” to q10, ask q13 and q13a]
13. In the past year, have you ever used WiFi or other wireless Internet services in public places, such as airports, coffee shops or restaurants?
72% yes [ask q13a] 28 no [skip to q14]
13a.Do you mostly use free WiFi services in public areas, do you mostly use WiFi you have to pay for, or do you use a mixture of free and paid services?
55% mostly free 9 mostly pay 34 a mix 1 use other services/do not use WiFi
(volunteered) 1 don’t know
Next, please tell me if you ever use the Internet to do any of the following things?
[rotate q14-q23c]
[findings for q14-q24 reported for all adults]
14. How about going online to get news or information about politics or the 2008 campaigns?
46% yes 54 no/don’t use computers or Internet
15. How about going online for information for your work or job?
49% yes 51 no/don’t use computers or Internet
28 PPIC Statewide Survey

Questionnaire and Results
16. How about going online to purchase goods and services?
52% yes 48 no/don’t use computers or Internet
17. How about going online to get news and information on current events, public issues, or politics?
55% yes 45 no/don’t use computers or Internet
18. How about going online to use a social networking site like MySpace, Facebook or LinkedIn.com?
26% yes 74 no/don’t use computers or Internet
19. How about going online to do any banking or manage your finances?
47% yes 53 no/don’t use computers or Internet
20. How about going online to get health or medical information?
50% yes, do this 50 no/don’t use computers or Internet
21. How about going online for your education, such as taking a college course?
27% yes, do this 73 no/don’t use computers or Internet
22. How about going online to visit a state, local, or federal government website?
50% yes, do this 50 no/don’t use computers or Internet
23a.How about going online to access government resources, such as obtaining forms, making payments, or registering to vote?
43% yes, do this 57 no/don’t use computers or Internet
23b.How about going online to get housing or real estate information?
40% yes, do this 60 no/don’t use computers or Internet
23c.How about going online to get information about activities or events in your community?
47% yes, do this 53 no/don’t use computers or Internet
24.What kind of Internet connection do you have at home? Do you use a dial-up telephone line, or do you have some other type of connection, such as a DSL-enabled phone line, a cable TV modem, a wireless connection, a fiber optic connection such as FiOS or a T-1?
29% DSL-enabled phone line [ask q25] 19 cable modem [ask q25] 7 dial-up telephone line [skip to q27] 5 wireless connection (either land-
based or satellite) [ask q25] 2 fiber optic or T-1 [ask q25] 1 other (specify) [skip to q27] 36 do not have Internet
access/computer at home [skip to q27] 1 don’t know [skip to q27]
[q25 and q26 asked only of broadband users]
25. What do you like most about having a high-speed Internet connection at home?
[code, don’t read]
71% faster access/greater speed 11 convenience in general 3 easier to check email/communicate 2 doing job-related tasks from
home/working from home 2 downloading all types of files faster 2 the “always on” connection 7 other 2 don’t know
26. Thinking about your high-speed Internet service at home, do you subscribe to a basic broadband service, or do you pay extra for a premium service that promises faster speed?
58% subscribe to basic service 31 subscribe to premium service at
higher price 11 don’t know
June 2008 29

Californians and Information Technology
[q27 asked only of those who don’t have DSL,
cable, fiber optic, or T1 Internet connection]
27. Do you happen to know whether high-speed Internet service is available in your neighborhood from a telephone company, a cable company or any other company?
74% yes, available 17 no, not available 9 don’t know
[q28 and q29 asked only of dial-up users]
28. Would you like to have a faster broadband connection, or isn't that something you're interested in?
30% yes, interested 69 no, not interested 1 don’t know
29. What would it take to get you to switch to broadband?
[code, don’t read]
35% lower price 6 it would have to become available
where I live 3 having someone else pay for it 2 my cable/telephone company would
have to offer it where I live 24 nothing will convince me to get
broadband/not interested 11 other 19 don’t know
[q30-q33 asked only of Internet users]
30. Overall, how comfortable are you using the tools of modern information technology?
62% very comfortable 31 somewhat comfortable 5 not too comfortable 1 not at all comfortable 1 don’t know
31. Overall, how comfortable are you using the Internet to get the information needed in your everyday life?
70% very comfortable 25 somewhat comfortable 3 not too comfortable 1 not at all comfortable 1 don’t know
[rotate q32 and q33]
32. Overall, how confident are you that you can keep things like computer viruses, spyware and adware off of your home computer when you want to?
32% very confident 41 somewhat confident 17 not too confident 8 not at all confident 2 don’t know
33. How confident are you that financial transactions on the Internet are secure and private?
26% very confident 43 somewhat confident 16 not too confident 13 not at all confident 2 don’t know
[rotate q34 and q35]
[q34-q42 asked of all adults]
34. How important do you think it is for Californians to have access to the Internet?
69% very important 21 somewhat important 4 not too important 3 not at all important 3 don’t know
35. How important is the Internet as a source of information in your every day life?
51% very important 29 somewhat important 9 not too important 9 not at all important 2 don’t know
[rotate q36 and q37]
36. Overall, thinking about the way the Internet is regulated by the government, do you think the government is doing more than enough, just enough, or not enough?
12% more than enough 42 just enough 32 not enough 14 don’t know
30 PPIC Statewide Survey

Questionnaire and Results
37. Overall, thinking about the government’s role in improving the access and availability of broadband Internet technology, do you think the government is doing more than enough, just enough, or not enough?
10% more than enough 41 just enough 30 not enough 19 don’t know
[rotate blocks: q38-q39 and q40-q41]
38. Do you think that Californians in lower-income areas are less likely than others to have access to broadband Internet technology, or not?
65% yes, less likely to have access 27 no, not less likely to have access 8 don’t know
39. How concerned are you that Californians in lower-income areas are less likely than others to have access to broadband Internet technology?
23% very concerned 39 somewhat concerned 19 not too concerned 15 not at all concerned 4 don’t know
40. Do you think that Californians in rural areas are less likely than others to have access to broadband Internet technology, or not?
55% yes, less likely to have access 30 no, not less likely to have access 15 don’t know
41. How concerned are you that Californians in rural areas are less likely than others to have access to broadband Internet technology?
14% very concerned 37 somewhat concerned 24 not too concerned 19 not at all concerned 6 don’t know
42. On another topic, some local governments have considered providing wireless broadband Internet access to all residents at no cost. Is it a good idea or a bad idea for local governments to provide Internet access to its residents?
67% good idea 26 bad idea 7 don’t know
[q43 asked of those who completed survey on
a landline telephone]
43. Now thinking about your telephone use, do you have a working cell phone?
75% yes, have cell phone 25 no, do not
[q44-q45a asked of all respondents who have
a cell phone]
44. Do you ever use your cell phone to send or receive text messages?
58% yes 42 no
45. Do you ever use your cell phone to send or receive email messages?
26% yes 74 no
45a.Do you ever use your cell phone to access the Internet?
25% yes 75 no
46. On another topic, some people are registered to vote and others are not. Are you absolutely certain that you are registered to vote in California?
73% yes [ask q46a] 26 no [skip to q47] 1 don’t know [skip to q47]
46a. Are you registered as a Democrat, a Republican, another party, or as an independent?
43% Democrat [skip to q48] 34 Republican [skip to q48] 3 another party (specify) [skip to q48] 20 independent [ask q47]
June 2008 31

Californians and Information Technology
32 PPIC Statewide Survey
47. Do you think of yourself as closer to the Republican Party or Democratic Party?
21% Republican Party 46 Democratic Party 24 neither (volunteered) 9 don’t know
48. Generally speaking, how much interest would you say you have in politics?
31% great deal 36 fair amount 24 only a little 8 none 1 don’t know
49. Would you consider yourself to be politically:
[read list, rotate order top to bottom]
11% very liberal 19 somewhat liberal 31 middle-of-the-road 24 somewhat conservative 12 very conservative 3 don’t know
[d1-d4: demographic questions]
[d5-d5h asked of parents with children 18 or
under]
d5. Are any of your children in elementary school?
60% yes [ask d5a] 40 no [skip to d5c]
d5a.Do you ever visit the website of this child’s school? (if yes: Do you do this often or only sometimes?)
19% yes, often 32 yes, sometimes 49 no
d5b.Do you ever receive this child’s homework assignments via the Internet or email? (if yes: Do you do receive these often or only sometimes?)
8% yes, often 10 yes, sometimes 82 no
d5c.Are any of your children in middle school?
30% yes [ask d5d] 70 no [skip to d5f]
d5d.Do you ever visit the website of this child’s school? (if yes: Do you do this often or only sometimes?)
23% yes, often 26 yes, sometimes 51 no
d5e.Do you ever receive this child’s homework assignments via the Internet or email? (if yes: Do you do receive these often or only sometimes?)
13% yes, often 15 yes, sometimes 71 no 1 don’t know
d5f.Are any of your children in high school?
37% yes [ask d5g] 63 no [skip to d6]
d5g. Do you ever visit the website of this child’s school? (if yes: Do you do this often or only sometimes?)
28% yes, often 25 yes, sometimes 47 no
d5h.Do you ever receive this child’s homework assignments via the Internet or email? (if yes: Do you do receive these often or only sometimes?)
15% yes, often 20 yes, sometimes 65 no
[d6-d20: demographic questions]

PPIC STATEWIDE SURVEY ADVISORY COMMITTEE
Ruben Barrales President and Chief Executive Officer San Diego Regional Chamber of Commerce
Angela Blackwell Founder and Chief Executive Officer PolicyLink
Paul Brest President The William and Flora Hewlett Foundation
Mollyann Brodie Vice President Kaiser Family Foundation
Bruce E. Cain Executive Director Institute of Governmental Studies University of California, Washington Center
James E. Canales President The James Irvine Foundation
Jon Cohen Director of Polling The Washington Post
Matthew K. Fong Special Counsel Sheppard, Mullin, Richter & Hampton, LLP
Russell Hancock President and Chief Executive Officer Joint Venture Silicon Valley Network
William Hauck President California Business Roundtable
Sherry Bebitch Jeffe Senior Scholar School of Policy, Planning, and Development University of Southern California
Carol S. Larson President and Chief Executive Officer The David and Lucile Packard Foundation
Monica Lozano Publisher and Chief Executive Officer La Opinión
Donna Lucas Chief Executive Officer Lucas Public Affairs
Dan Rosenheim News Director KPIX-TV
Robert K. Ross, M.D. President and Chief Executive Officer The California Endowment
Cathy Taylor Vice President and Editorial Commentary Director Orange County Register
Raymond L. Watson Vice Chairman of the Board Emeritus The Irvine Company
Carol Whiteside President Emeritus Great Valley Center
The PPIC Statewide Survey Advisory Committee is a diverse group of experts who provide advice on survey issues.
However, survey methods, questions, content, and timing are determined solely by PPIC.

PUBLIC POLICY INSTITUTE OF CALIFORNIA
BOARD OF DIRECTORS
Thomas C. Sutton, Chair Retired Chairman and Chief Executive Officer Pacific Life Insurance Company
Mark Baldassare President and Chief Executive Officer Public Policy Institute of California
Ruben Barrales President and Chief Executive Officer San Diego Regional Chamber of Commerce
Edward K. Hamilton Chairman Hamilton, Rabinovitz & Associates, Inc.
Gary K. Hart Former State Senator and Secretary of Education State of California
Walter B. Hewlett Director Center for Computer Assisted Research in the Humanities
Donna Lucas Chief Executive Officer Lucas Public Affairs
Leon E. Panetta Director The Leon & Sylvia Panetta Institute for Public Policy
Ki Suh Park Design and Managing Partner Gruen Associates
Constance L. Rice Co-Director The Advancement Project
Raymond L. Watson Vice Chairman of the Board Emeritus The Irvine Company
Carol Whiteside President Emeritus Great Valley Center

Copyright © 2008 Public Policy Institute of California All rights reservedSan Francisco, CA
Short sections of text, not to exceed three paragraphs, may be quoted without written permission provided thatfull attribution is given to the source and the above copyright notice is included.

PUBLIC POLICY INSTITUTE OF CALIFORNIA500 Washington Street, Suite 600 San Francisco, California 94111phone: 415.291.4400 fax: 415.291.4401
PPIC SACRAmENTO CENTERSenator Office Building1121 L Street, Suite 801Sacramento, California 95814phone: 916.440.1120fax: 916.440.1121
www.ppic.org [email protected]