Living with Chronic Illness: Californians - California HealthCare
35
C ALIFORNIA HEALTHCARE F OUNDATION SNAPSHOT Living with Chronic Illness: Californians’ Perspectives on Cost and Coordination of Care 2008
Transcript of Living with Chronic Illness: Californians - California HealthCare

CAL I FORNIAHEALTHCAREFOUNDATION
s n a p s h o t Living with Chronic Illness: Californians’ Perspectives on Cost and Coordination of Care
2008

©2008 California healthCare foundation 2
Chronic Care Survey
c o n t e n t s
Health Status . . . . . . . . . . . . . . . . . . . . . 3
Provider Care . . . . . . . . . . . . . . . . . . . . . 12
Managing Conditions . . . . . . . . . . . . . . 17
Access . . . . . . . . . . . . . . . . . . . . . . . . . . 22
Insurance and Cost Concerns . . . . . . . . 25
Appendix . . . . . . . . . . . . . . . . . . . . . . . . 35
IntroductionAbout 40 percent of adult Californians live with at least one chronic medical condition. Chronic conditions present
a host of challenges to individuals in their daily lives, such as coping with drug interactions and side effects,
making difficult lifestyle changes, seeing the doctor (usually more than one) more often, and facing frequent
urgent medical care issues. But when coupled with the reality of navigating an increasingly complex and costly
health care system, these challenges become even more daunting.
This snapshot takes a close look at chronic illness through the perspectives and experiences of those living with
one or more chronic conditions. The survey provides data on health status; provider services and ease of access
to health care; satisfaction with services, physician collaboration, and health benefits; types of insurance coverage;
overall out-of-pocket costs; prescription drug use and costs; the relationship between cost and neglect of care;
and additional concerns about the affordability of health care.
Among The findings:
• Respondents who reported having a primary care provider felt more in control of their health, were
happier with their health care benefits, and were less likely to neglect their health.
• in the past year, many respondents failed to get the health care they needed (e.g., medical tests,
prescriptions, or care for a specific problem). And those who neglected care due to cost were more
likely to end up in the emergency room.
• Although over half of all respondents reported that they have not received basic care management
services or preventive care follow-up reminders, respondents with Kaiser as their provider were much
more likely to report receiving care management services and faster access to care.
• nearly 30 percent of all respondents who see multiple doctors reported receiving conflicting advice.
• 46 percent of respondents who rated their doctors’ collaboration as fair or poor ended up in the
emergency room within the past two years.
This survey shows that individuals with chronic conditions who receive care through formal managed care
systems may benefit from better care management services and overall coordination of care. And better care for
these individuals may save precious health care dollars in the long run.
©2008 California healthCare foundation 3
Others
Cancer
Heart Disease
Digestive Disorders
Diabetes
Asthma
Arthritis
Depression
Hypercholesterolemia
Hypertension 39%
35%
22%
20%
19%
15%
11%
7%
7%
5%
PERCENTAGE OF RESPONDENTS WITH…
Chronic Care Survey
Notes: About 55 percent of respondents reported being diagnosed with more than one chronic condition . Conditions included in survey: arthritis, asthma, cancer, COPD (chronic obstructive pulmonary disease), depression, diabetes, digestive or gastrointestinal disorders, heart disease, HIV/AIDS, hypercholesterolemia, hypertension (high blood pressure), kidney disease, and liver disease . “Others” includes kidney and liver disease, COPD, and HIV/AIDS .
Source: Survey of 2,745 adult respondents with chronic conditions, conducted online from November 2 to 19, 2007, using the Harris Interactive public panel, for the California HealthCare Foundation .
high blood pressure and
high cholesterol, two
primary risk factors for
heart disease, topped the
list of chronic conditions
most frequently reported
by respondents.
Has any doctor ever diagnosed you with or treated you for any of the following health conditions?
Diagnosed Chronic Conditions, 2007 Health status

©2008 California healthCare foundation 4
0% 5% 10% 15% 20% 25% 30% 35% 40% 45% 50% 55% 60%
HIV/AIDS
Kidney Disease
COPD
Digestive Disorders
Cancer
Heart Disease
Diabetes
Depression
Asthma
Arthritis
Cholesterol
Hypertension
65+50– 6435 – 4918 – 34
PERCENTAGE OF RESPONDENTS WITH…
Chronic Care Survey
Notes: About 55 percent of respondents reported being diagnosed with more than one chronic condition . “Digestive Disorders” includes liver disease .
Source: Survey of 2,745 adult respondents with chronic conditions, conducted online from November 2 to 19, using the Harris Interactive public panel, for the California HealthCare Foundation .
Rates for arthritis, high
cholesterol, and high
blood pressure increased
with age, starting at
age 35. Conversely,
rates for depression and
asthma were higher in
the youngest age group
and decreased with age.
Health statusDiagnosed Chronic Conditions, by Age Group, 2007

©2008 California healthCare foundation 5
65+50–6435–4918–34
PERCENTAGE OF RESPONDENTS REPLYING “YES”
15%
21%22%
24%
Chronic Care Survey
Source: Survey of 2,745 adult respondents with chronic conditions, conducted online from November 2 to 19, using the Harris Interactive public panel, for the California HealthCare Foundation .
Were you hospitalized in the past 2 years — other than for a normal, uncomplicated delivery of a baby?
Hospitalization, by Age Group, 2007
one in five respondents
between the ages of
35 and 64 reported that
they were hospitalized
within the past two
years. for those aged
aged 65 and older, the
ratio was one in four.
Health status

©2008 California healthCare foundation 6
5+ Conditions
4 Conditions
3 Conditions
2 Conditions
1 Condition 45%
27%
15%
8%
6%
PERCENTAGE OF RESPONDENTS WITH…
Chronic Care Survey
*Conditions included in survey: arthritis, asthma, cancer, COPD (chronic obstructive pulmonary disease), depression, diabetes, digestive or gastrointestinal disorders, heart disease, HIV/AIDS, hypercholesterolemia, hypertension (high blood pressure), kidney disease, and liver disease .
Source: Survey of 2,745 adult respondents with chronic conditions, conducted online from November 2 to 19, 2007, using the Harris Interactive public panel, for the California HealthCare Foundation .
nearly half of all
respondents reported
being diagnosed with
one chronic condition,
over a quarter reported
two, and almost a third
reported being diagnosed
with three or more.
Has any doctor ever diagnosed you with or treated you for any of the following health conditions?*
Multiple Chronic Conditions, by number of conditions, 2007
Health status
©2008 California healthCare foundation 7
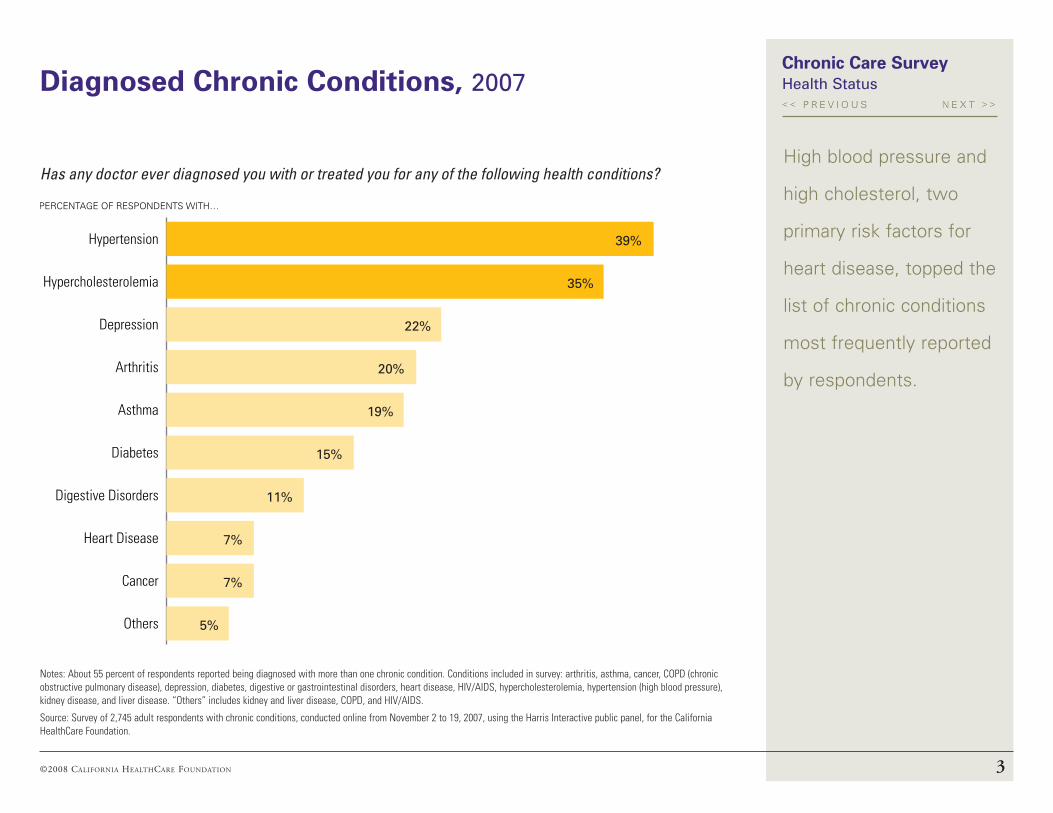
5+
4
3
2
1
0 24%
14%
15%
12%
10%
24%
PERCENTAGE OF RESPONDENTS TAKING…
Chronic Care Survey
Source: Survey of 2,745 adult respondents with chronic conditions, conducted online from November 2 to 19, using the Harris Interactive public panel, for the California HealthCare Foundation .
nearly a quarter of
respondents were not
taking any prescription
drugs. however, an
equal number were
taking 5 or more.
How many separate medicines prescribed by a doctor do you usually take?
Rx Drug Use, by number of Medications, 2007
Health status

©2008 California healthCare foundation 8
65+
50 – 64
35 – 49
18–34 53%
70%
85%
93%
PERCENTAGE OF RESPONDENTS TAKING AT LEAST ONE RX
Chronic Care Survey
Source: Survey of 2,745 adult respondents with chronic conditions, conducted online from November 2 to 19, using the Harris Interactive public panel, for the California HealthCare Foundation .
How many separate medicines prescribed by a doctor do you usually take?slightly over half of
respondents in the
youngest age group use
prescription drugs, while
nearly all respondents
age 65 and older do so.
Rx Drug Use, by Age Group, 2007
Health status
©2008 California healthCare foundation 9
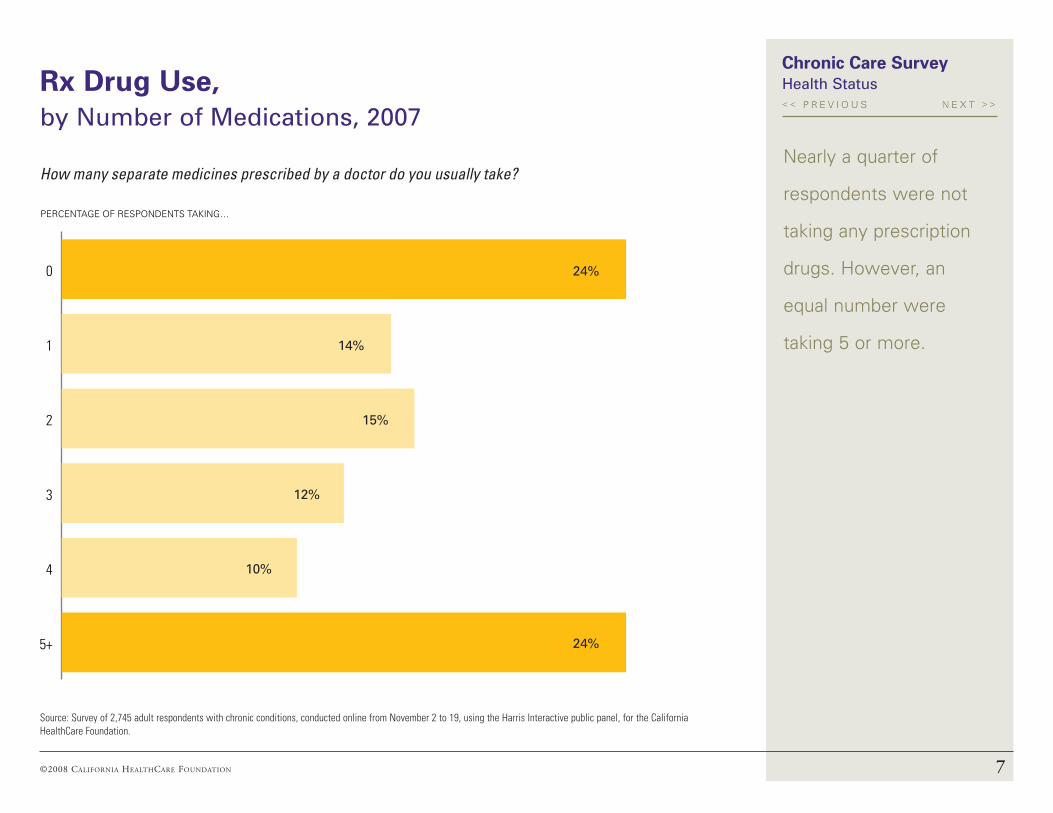
PoorFairGoodVery GoodExcellent
PERCENTAGE OF RESPONDENTS
5%
29%
43%
19%
4%
Chronic Care Survey
Source: Survey of 2,745 adult respondents with chronic conditions, conducted online from November 2 to 19, using the Harris Interactive public panel, for the California HealthCare Foundation .
In general, how would you describe your own health?nearly a quarter of
respondents with chronic
conditions reported being
in fair to poor health.
Health statusPerceived Health Status, by Rating, 2007
©2008 California healthCare foundation 10
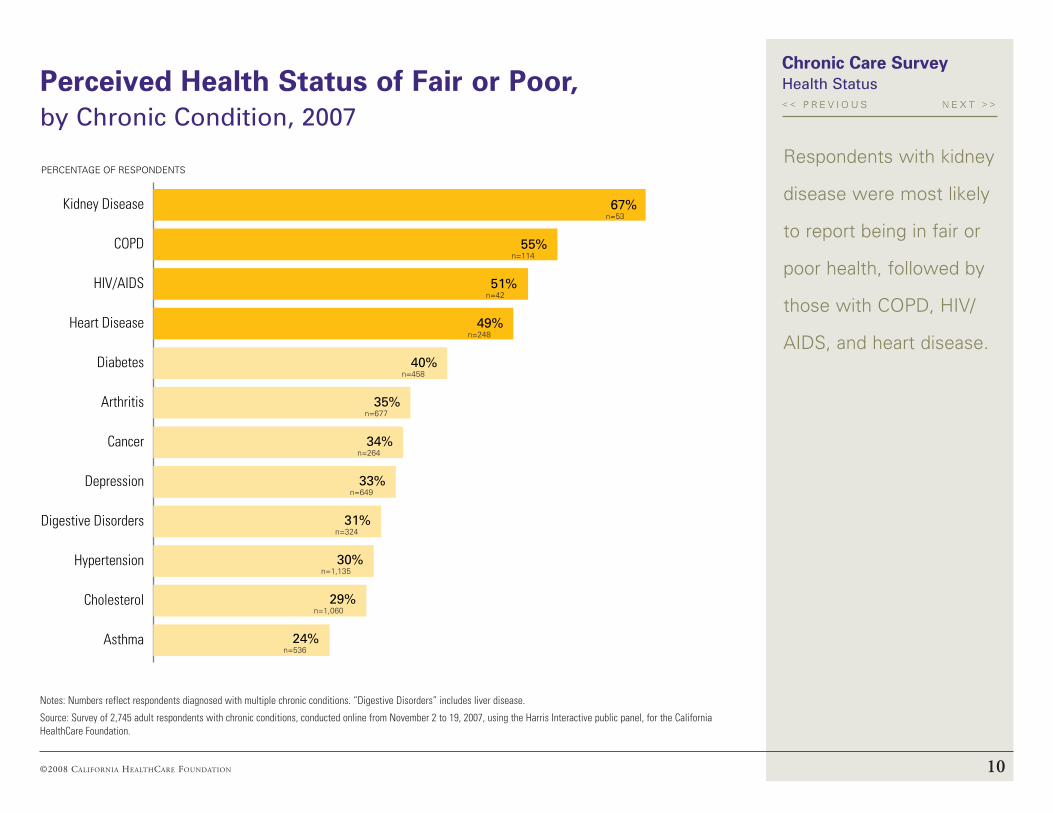
Asthma
Cholesterol
Hypertension
Digestive Disorders
Depression
Cancer
Arthritis
Diabetes
Heart Disease
HIV/AIDS
COPD
Kidney Disease 67%
55%
51%
49%
40%
35%
34%
33%
31%
30%
29%
24%
n=53
n=114
n=42
n=248
n=458
n=677
n=264
n=649
n=324
n=1,135
n=1,060
n=536
PERCENTAGE OF RESPONDENTS
Chronic Care Survey
Notes: Numbers reflect respondents diagnosed with multiple chronic conditions . “Digestive Disorders” includes liver disease .
Source: Survey of 2,745 adult respondents with chronic conditions, conducted online from November 2 to 19, 2007, using the Harris Interactive public panel, for the California HealthCare Foundation .
Respondents with kidney
disease were most likely
to report being in fair or
poor health, followed by
those with CoPd, hiV/
Aids, and heart disease.
Perceived Health Status of Fair or Poor, by chronic condition, 2007
Health status

©2008 California healthCare foundation 11
5+ Conditions
4 Conditions
3 Conditions
2 Conditions
1 Condition 13%
21%
29%
44%
68%
n=1,086
n=695
n=457
n=273
n=234
PERCENTAGE OF RESPONDENTS PERCENTAGE OF TOTALBY NUMBER OF CONDITIONS
145%
227%
315%
48%
5+6%
Chronic Care Survey
Source: Survey of 2,745 adult respondents with chronic conditions, conducted online from November 2 to 19, using the Harris Interactive public panel, for the California HealthCare Foundation .
Respondents were
increasingly more likely
to report their health
as fair or poor with
the addition of each
diagnosis, a significant
finding in light of the
large percentage
reporting multiple
conditions.
Perceived Health Status of Fair or Poor, by number of chronic conditions, 2007
Health status
Note: Answers do not add to 100 percent due to missing responses

©2008 California healthCare foundation 12
No PCP
Clinic/VA/Other
Solo Practice
Kaiser
Group Practice
PERCENTAGE OF RESPONDENTS
31%
24%
18%
12%
13%
Chronic Care Survey
Note: Answers do not add to 100 percent due to missing responses (2 percent)
Source: Survey of 2,745 adult respondents with chronic conditions, conducted online from November 2 to 19, 2007, using the Harris Interactive public panel, for the California HealthCare Foundation .
Thirteen percent of
respondents reported
that they do not have a
usual or regular source
for medical care — a
primary care provider
(PCP).
Do you have a primary doctor — that is, one doctor you always visit or call whenever you don‘t feel well or when you have to go for a regular checkup? Where do you usually go to get medical care? Are you a Kaiser member?
Source of Primary Care, by Practice type, 2007
Provider care
©2008 California healthCare foundation 13
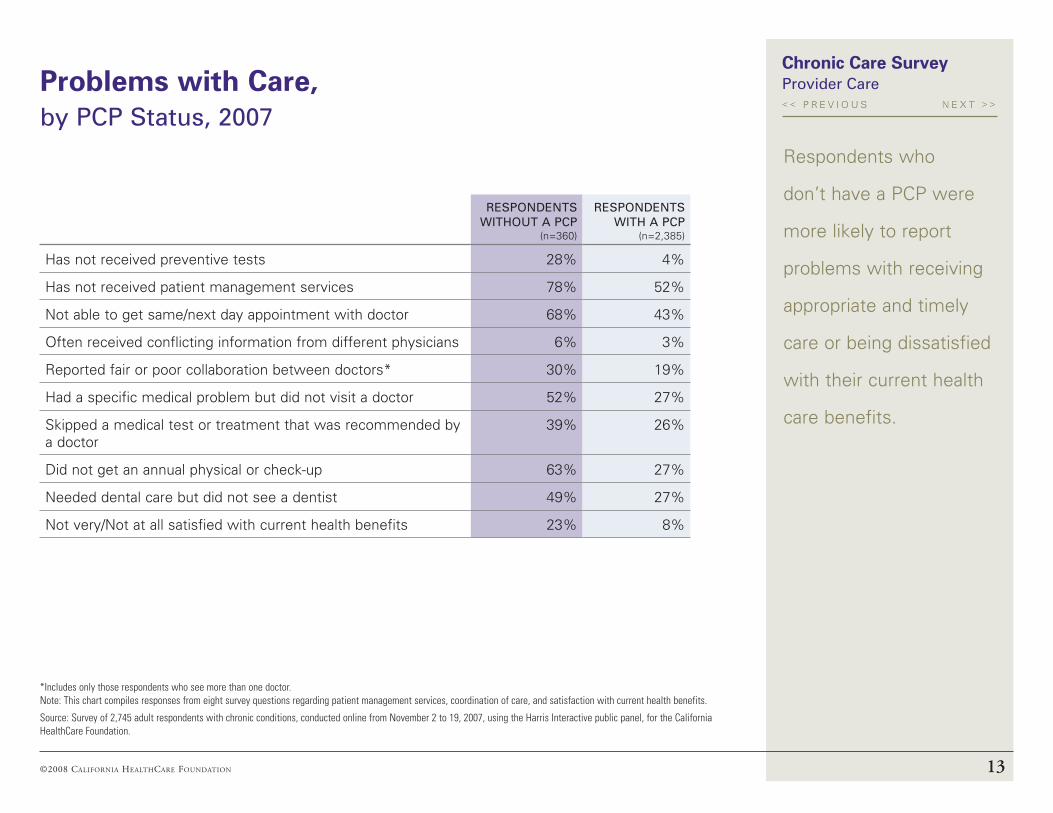
ResPondents witHout A PcP
(n=360)
ResPondents witH A PcP
(n=2,385)
has not received preventive tests 28% 4%
has not received patient management services 78% 52%
not able to get same/next day appointment with doctor 68% 43%
often received conflicting information from different physicians 6% 3%
Reported fair or poor collaboration between doctors* 30% 19%
had a specific medical problem but did not visit a doctor 52% 27%
skipped a medical test or treatment that was recommended by a doctor
39% 26%
did not get an annual physical or check-up 63% 27%
needed dental care but did not see a dentist 49% 27%
not very/not at all satisfied with current health benefits 23% 8%
Chronic Care Survey
Respondents who
don’t have a PCP were
more likely to report
problems with receiving
appropriate and timely
care or being dissatisfied
with their current health
care benefits.
*Includes only those respondents who see more than one doctor . Note: This chart compiles responses from eight survey questions regarding patient management services, coordination of care, and satisfaction with current health benefits .
Source: Survey of 2,745 adult respondents with chronic conditions, conducted online from November 2 to 19, 2007, using the Harris Interactive public panel, for the California HealthCare Foundation .
Problems with Care, by PcP status, 2007
Provider care

©2008 California healthCare foundation 14
5+
4
3
2
1
0 5%
38%
32%
16%
4%
3%
PERCENTAGE OF RESPONDENTS SEEING…
No PCP
Solo Practice
Kaiser
Group Practice
Clinic/VA/Other 33%
26%
24%
21%
18%
n=342
n=847
n=601
n=549
n=360
Note: Total percentages exceed 100 percent because respondents could select more than one response .
Chronic Care Survey
Source: Survey of 2,745 adult respondents with chronic conditions, conducted online from November 2 to 19, using the Harris Interactive public panel, for the California HealthCare Foundation .
Almost a quarter of
respondents reported
seeing three or more
doctors regularly. A third
of this group identified
clinics, the VA, or similar
types of practices as
their primary source of
care, while nearly one
in five reported having
no PCP. Coordination
and continuity of care
is difficult to achieve
without a PCP.
How many different doctors do you see on a regular basis? (at least once a year and excluding dentists)
Number of Doctors Seen Regularly, 2007 Provider care

©2008 California healthCare foundation 15
NeverRarelySometimesOften
PERCENTAGE OF RESPONDENTS…
6% 5%
23%
17%
41%
38%
22%
25%
with 2+ chronic conditions (n=1,659)Seeing 3+ doctors regularly (n=737)
Chronic Care Survey
Notes: These two categories are not mutually exclusive . “Not applicable” and “not sure” values are not shown .
Source: Survey of 2,745 adult respondents with chronic conditions, conducted online from November 2 to 19, 2007, using the Harris Interactive public panel, for the California HealthCare Foundation .
nearly 30 percent of
respondents who see
multiple doctors for
at least one chronic
condition reported
receiving conflicting
advice either often
or sometimes. in
comparison, those with
two or more chronic
conditions, who may or
may not see multiple
doctors, were less
likely to report similar
difficulties.
Thinking about the care you receive, how often, if ever, are you given conflicting information from different doctors, nurses, or other health professionals?
Conflicting Advice, by Respondents seeing Multiple doctors and those Having Multiple conditions, 2007
Provider care

©2008 California healthCare foundation 16
PoorFairGoodVery GoodExcellent
PERCENTAGE OF RESPONDENTS (n=1,591)
20%
33%
27%
13%
6%
VISITED ER IN LAST 2 YEARS
Fair/PoorVery Good/Excellent
46%n=291
34%n=850
Chronic Care Survey
Source: Survey of 2,745 adult respondents with chronic conditions, conducted online from November 2 to 19, using the Harris Interactive public panel, for the California HealthCare Foundation .
one in five respondents
who see multiple doctors
gave their doctors
fair to poor marks
for teamwork. Poor
collaboration can lead to
misunderstandings and
treatment errors. nearly
half of respondents who
reported fair to poor
collaboration between
their doctors visited the
emergency room within
the past two years.
Please rate the doctors that you see regularly on how well they work together to ensure that you get the best possible medical care.
Collaborative Care Rating, by Respondents seeing Multiple doctors, 2007
Provider care
©2008 California healthCare foundation 17
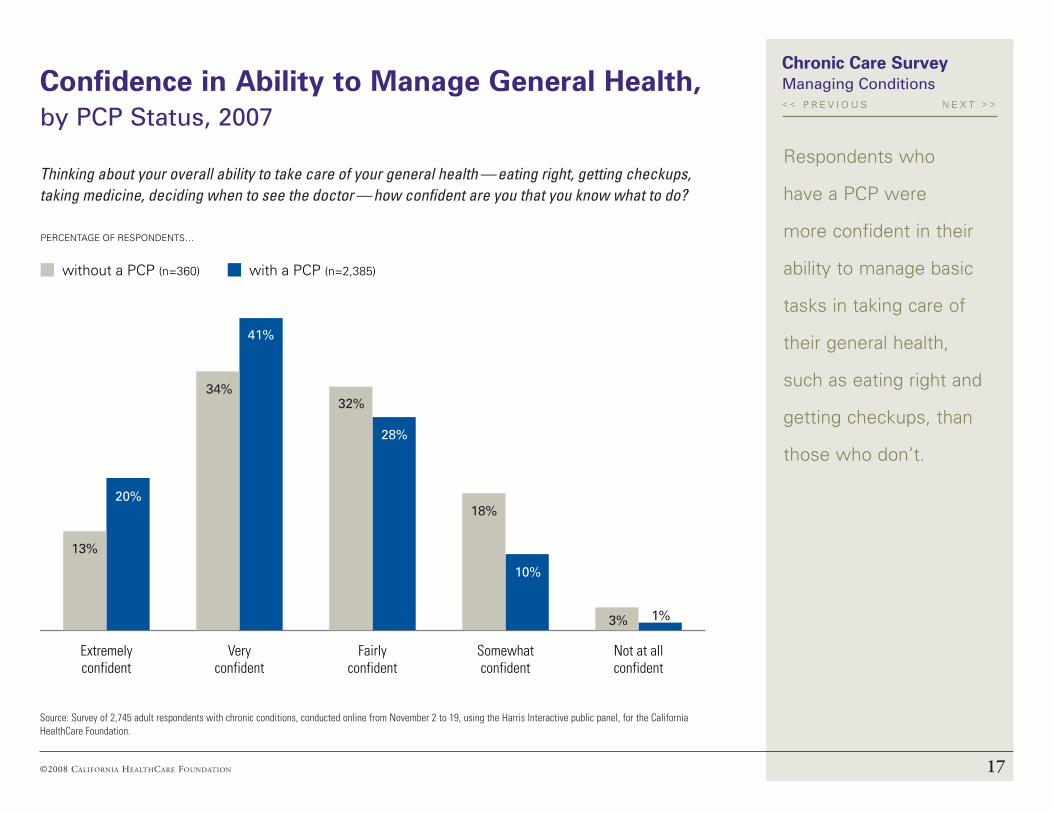
Not at allconfident
Somewhatconfident
Fairlyconfident
Veryconfident
Extremelyconfident
PERCENTAGE OF RESPONDENTS…
20%
34%
41%
13%
41%
28%
22%
10%
1%3%
18%
32%
with a PCP (n=2,385)without a PCP (n=360)
Chronic Care Survey
Source: Survey of 2,745 adult respondents with chronic conditions, conducted online from November 2 to 19, using the Harris Interactive public panel, for the California HealthCare Foundation .
Respondents who
have a PCP were
more confident in their
ability to manage basic
tasks in taking care of
their general health,
such as eating right and
getting checkups, than
those who don’t.
Thinking about your overall ability to take care of your general health — eating right, getting checkups, taking medicine, deciding when to see the doctor — how confident are you that you know what to do?
Confidence in Ability to Manage General Health, by PcP status, 2007
Managing conditions

©2008 California healthCare foundation 18
Definitely noSomewhat noSomewhat yesDefinitely yes
PERCENTAGE OF RESPONDENTS…
36%
49%
53%
29%
9%2%
9%
13%
with a PCP (n=2,385)without a PCP (n=360)
Chronic Care Survey
Source: Survey of 2,745 adult respondents with chronic conditions, conducted online from November 2 to 19, using the Harris Interactive public panel, for the California HealthCare Foundation .
Would you say that you are currently able to keep your health or condition under good control?Although the majority of
respondents from both
groups were at least
somewhat confident in
their ability to manage
their health or chronic
condition, those without
a PCP were less likely to
feel confident overall.
Confidence in Managing Health/Chronic Condition, by PcP status, 2007
Managing conditions
©2008 California healthCare foundation 19
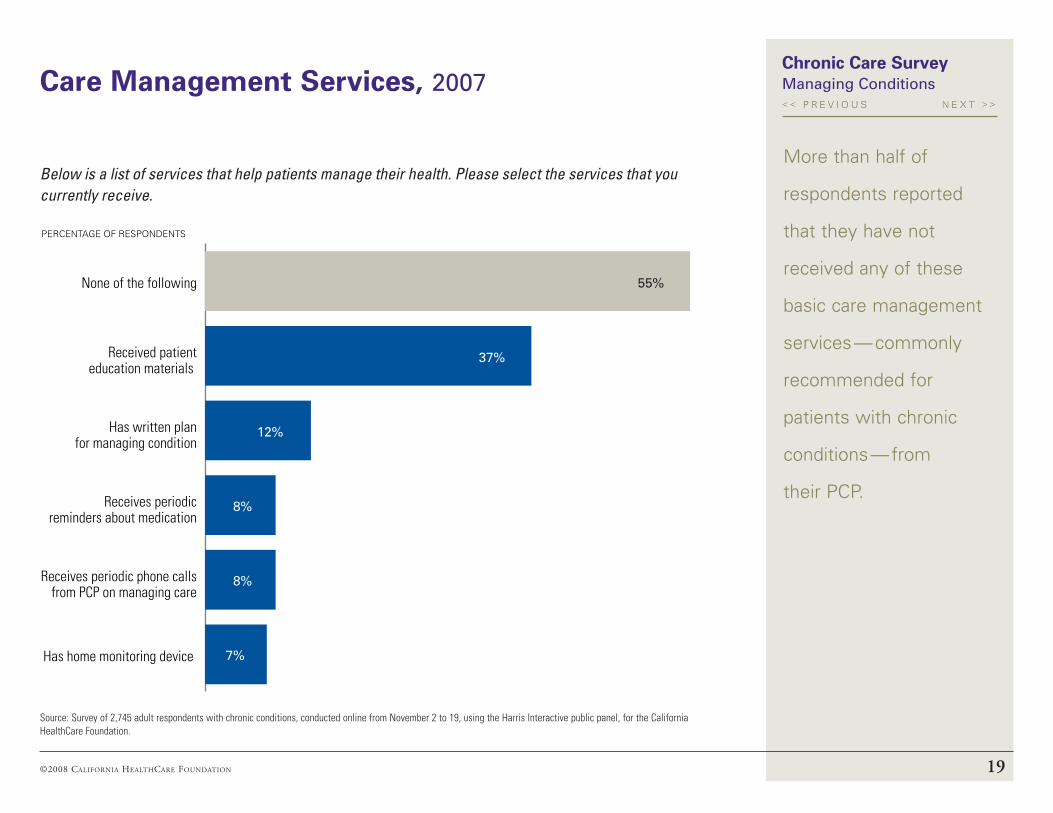
Has home monitoring device
Receives periodic phone calls from PCP on managing care
Receives periodic reminders about medication
Has written plan for managing condition
Received patient education materials
None of the following 55%
37%
12%
8%
8%
7%
PERCENTAGE OF RESPONDENTS
Chronic Care Survey
Source: Survey of 2,745 adult respondents with chronic conditions, conducted online from November 2 to 19, using the Harris Interactive public panel, for the California HealthCare Foundation .
more than half of
respondents reported
that they have not
received any of these
basic care management
services — commonly
recommended for
patients with chronic
conditions — from
their PCP.
Below is a list of services that help patients manage their health. Please select the services that you currently receive.
Care Management Services, 2007 Managing conditions
©2008 California healthCare foundation 20
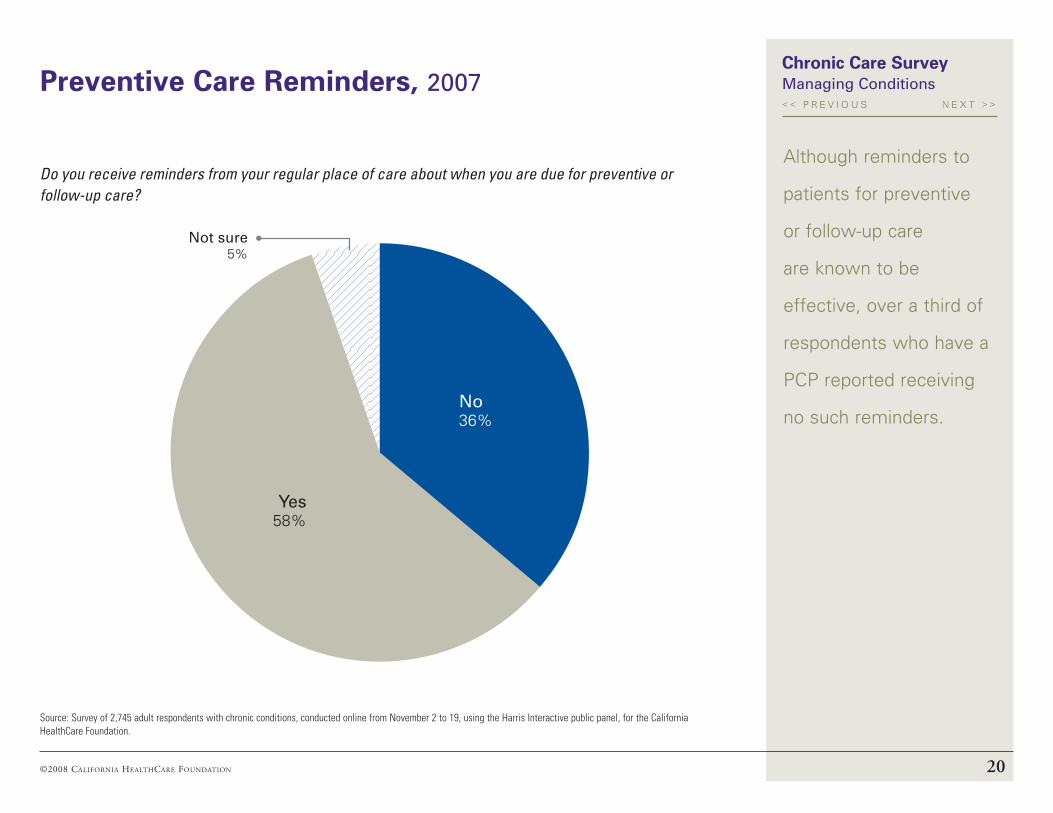
Yes58%
No36%
Not sure5%
Chronic Care Survey
Source: Survey of 2,745 adult respondents with chronic conditions, conducted online from November 2 to 19, using the Harris Interactive public panel, for the California HealthCare Foundation .
Do you receive reminders from your regular place of care about when you are due for preventive or follow-up care?
Although reminders to
patients for preventive
or follow-up care
are known to be
effective, over a third of
respondents who have a
PCP reported receiving
no such reminders.
Preventive Care Reminders, 2007 Managing conditions
©2008 California healthCare foundation 21
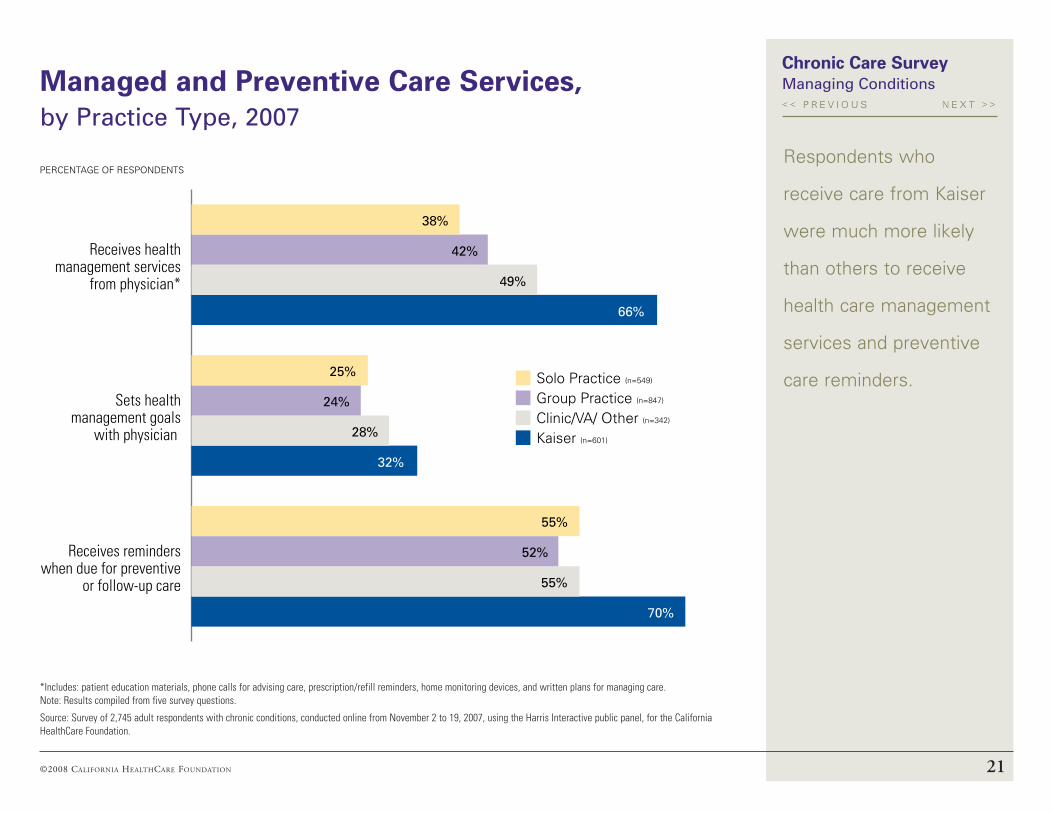
Receives reminders when due for preventive
or follow-up care
Sets health management goals
with physician
Receives health management services
from physician*
PERCENTAGE OF RESPONDENTS
38%
42%
49%
66%
25%
24%
28%
32%
55%
52%
55%
70%
Solo Practice (n=549)
Group Practice (n=847)
Clinic/VA/ Other (n=342)
Kaiser (n=601)
Chronic Care Survey
*Includes: patient education materials, phone calls for advising care, prescription/refill reminders, home monitoring devices, and written plans for managing care . Note: Results compiled from five survey questions .
Source: Survey of 2,745 adult respondents with chronic conditions, conducted online from November 2 to 19, 2007, using the Harris Interactive public panel, for the California HealthCare Foundation .
Respondents who
receive care from Kaiser
were much more likely
than others to receive
health care management
services and preventive
care reminders.
Managed and Preventive Care Services, by Practice type, 2007
Managing conditions

©2008 California healthCare foundation 22
Not sure
Not able to make
appointment
7+ days
4 to 7 days
2 to 3 days
Next day
Same day 30%
20%
19%
11%
10%
1%
9%
PERCENTAGE OF RESPONDENTS
Time Until Seen by the Doctor
Somewhat/Very difficult48%
Somewhat/Very easy
26%
Never needed18%
Ease Getting CareOutside Normal Business Hours
Note sure8%
Chronic Care Survey
Source: Survey of 2,745 adult respondents with chronic conditions, conducted online from November 2 to 19, 2007, using the Harris Interactive public panel, for the California HealthCare Foundation .
nearly half of
respondents reported
difficulty in getting care
after hours or in getting
in to see their doctor
quickly when needed.
some reported waits of
a week or longer.
Access to Appointments, 2007 Access
Thinking of the last time you were sick or needed medical attention, how quickly could you get an appointment to see a doctor? (excluding ER visits)
How easy or difficult is it to get care in the evenings, on weekends, or holidays without going to the hospital emergency department?
©2008 California healthCare foundation 23
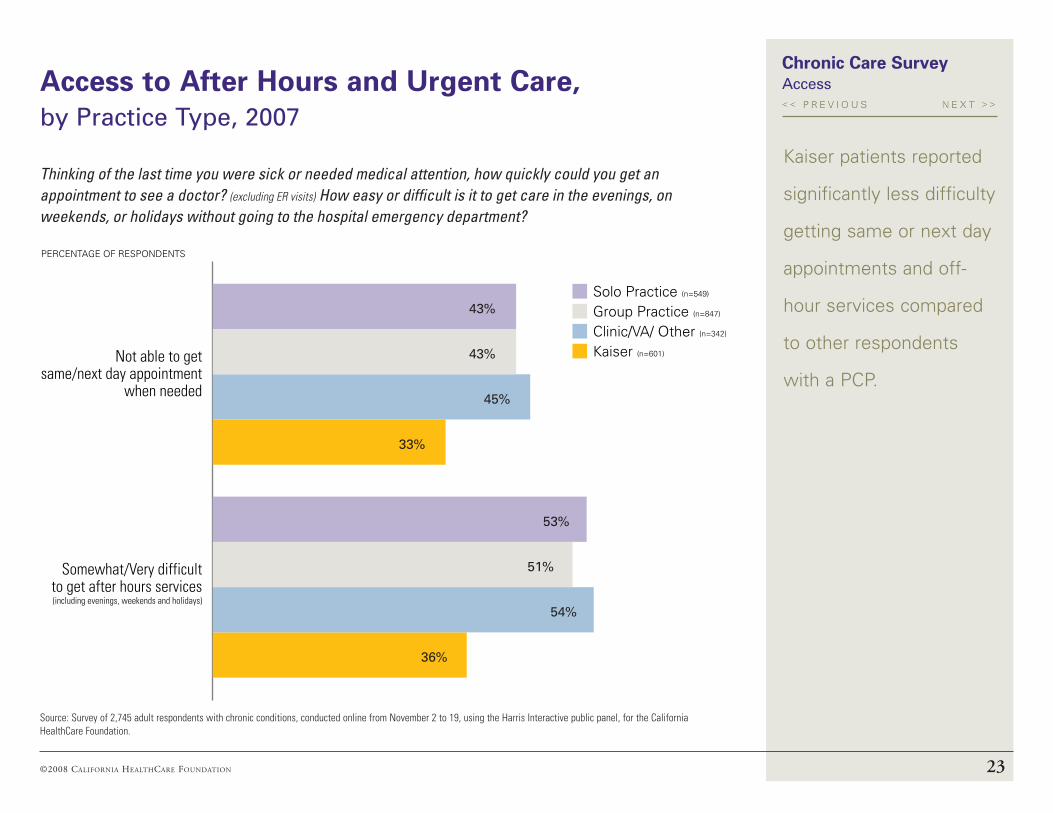
Somewhat/Very difficult to get after hours services (including evenings, weekends and holidays)
Not able to get same/next day appointment
when needed
PERCENTAGE OF RESPONDENTS
43%
43%
45%
33%
53%
51%
54%
36%
Solo Practice (n=549)
Group Practice (n=847)
Clinic/VA/ Other (n=342)
Kaiser (n=601)
Chronic Care Survey
Source: Survey of 2,745 adult respondents with chronic conditions, conducted online from November 2 to 19, using the Harris Interactive public panel, for the California HealthCare Foundation .
Thinking of the last time you were sick or needed medical attention, how quickly could you get an appointment to see a doctor? (excluding ER visits) How easy or difficult is it to get care in the evenings, on weekends, or holidays without going to the hospital emergency department?
Kaiser patients reported
significantly less difficulty
getting same or next day
appointments and off-
hour services compared
to other respondents
with a PCP.
Access to After Hours and Urgent Care, by Practice type, 2007
Access

©2008 California healthCare foundation 24
For care for children
For care PCP usually provides
For care for self
When cannot get appointment to see PCP
For minor health problems
When need care outside of doctor’s normal hours 48%
43%
42%
38%
23%
16%
PERCENTAGE OF RESPONDENTS
What is the likelihood that you would use a retail walk-in health clinic for any of the following?
Note: Examples of retail clinics include Wal-Mart and Rite-Aid store clinics where individuals can seek medical attention on a walk-in basis .
Source: Survey of 2,745 adult respondents with chronic conditions, conducted online from November 2 to 19, 2007, using the Harris Interactive public panel, for the California HealthCare Foundation .
over 40 percent of
respondents reported
that they would be at
least somewhat likely
to use retail clinics for
care during off-hours,
for minor problems, and
when they could not get
in to see their PCP.
Likelihood of Using Retail Clinics for Care, 2007 AccessChronic Care Survey

©2008 California healthCare foundation 25
Uninsured
Medi-Cal
Self-Purchased/Other
Medicare
Employer-Sponsored 50%
24%
11%
5%
10%
PERCENTAGE OF RESPONDENTS
Chronic Care Survey
Source: Survey of 2,745 adult respondents with chronic conditions, conducted online from November 2 to 19, using the Harris Interactive public panel, for the California HealthCare Foundation .
The majority of
respondents were
insured, half through
employer-sponsored
plans. A significant
number bore the majority
of their own medical
costs through self-
purchased insurance
plans or because they
were uninsured.
Are you currently covered by any form of health insurance? Please indicate whether or not you are covered by the following types of health insurance plans.
Insurance Coverage, by insurance status, 2007
insurance and cost concerns

©2008 California healthCare foundation 26
No PCP
Solo Practice
Clinic/VA/Other
Kaiser
Group Practice
PERCENTAGE OF RESPONDENTS
51% 42% 43%
17% 20%
31% 29%
25% 19%
0%
18% 23%
25% 50%
13%
18% 20%
23% 13%
12%
9% 12%
6% 9%
54%
Employer-Sponsored (n=1,216)
Self-Purchased/Other (n=265)
Medicare (n=875)
Medi-Cal (n=99)
Uninsured (n=282)
Chronic Care Survey
Notes: Responses do not add to 100 percent because respondents could select more than one response . Survey question shown on page 12 .
Source: Survey of 2,745 adult respondents with chronic conditions, conducted online from November 2 to 19, 2007, using the Harris Interactive public panel, for the California HealthCare Foundation .
Large percentages of
respondents insured
through employers, self-
purchase, or medicare,
identified group practices
or Kaiser as the source
of their PCP. medi-Cal
recipients were most
likely to frequent clinics,
the VA, or other similar
types of practices. The
uninsured were least
likely to have a PCP.
Source of Primary Care, by insurance status, 2007
insurance and cost concerns
©2008 California healthCare foundation 27
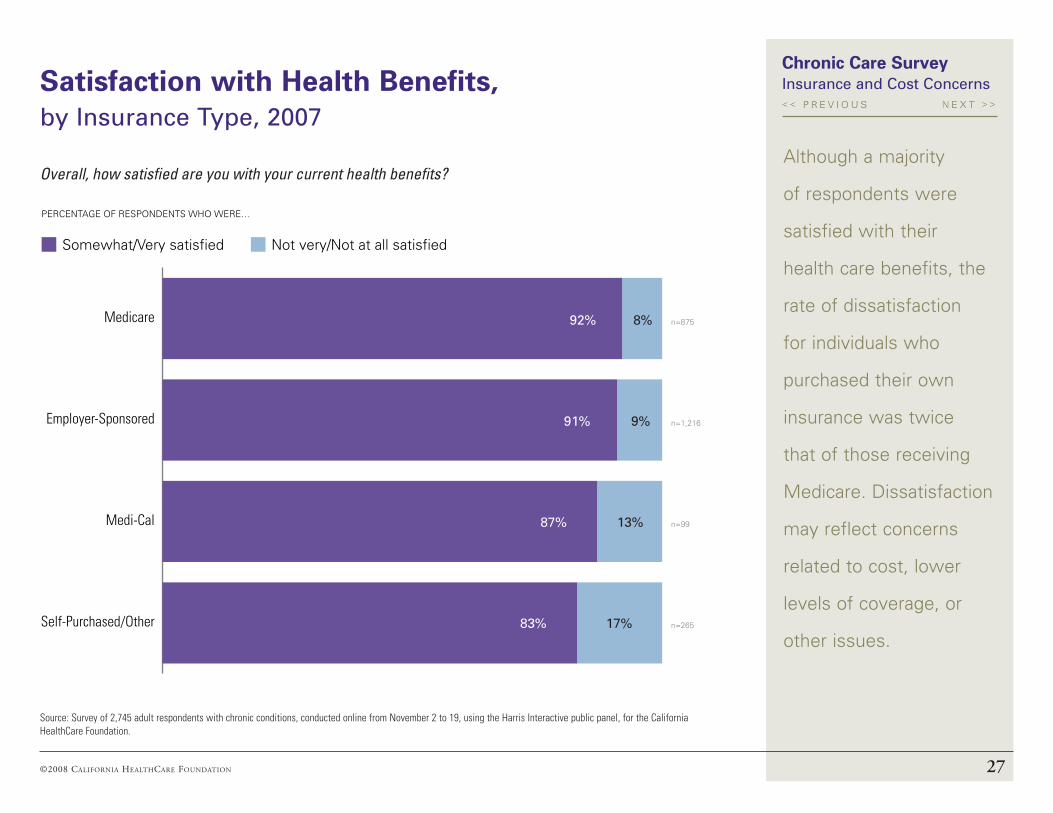
Self-Purchased/Other
Medi-Cal
Employer-Sponsored
Medicare
Somewhat/Very satisfied Not very/Not at all satisfied
PERCENTAGE OF RESPONDENTS WHO WERE…
92% 8%
91% 9%
87% 13%
83% 17%
n=875
n=1,216
n=99
n=265
Chronic Care Survey
Source: Survey of 2,745 adult respondents with chronic conditions, conducted online from November 2 to 19, using the Harris Interactive public panel, for the California HealthCare Foundation .
Overall, how satisfied are you with your current health benefits?Although a majority
of respondents were
satisfied with their
health care benefits, the
rate of dissatisfaction
for individuals who
purchased their own
insurance was twice
that of those receiving
medicare. dissatisfaction
may reflect concerns
related to cost, lower
levels of coverage, or
other issues.
Satisfaction with Health Benefits, by insurance type, 2007
insurance and cost concerns

©2008 California healthCare foundation 28
No PCP
Clinic/VA/Other
Group Practice
Solo Practice
Kaiser
Somewhat/Very satisfied Not very/Not at all satisfied
PERCENTAGE OF RESPONDENTS WHO WERE…
97% 3%
92% 8%
88% 12%
86% 14%
77% 23%
n=601
n=519
n=794
n=300
n=212
Chronic Care Survey
Source: Survey of 2,745 adult respondents with chronic conditions, conducted online from November 2 to 19, using the Harris Interactive public panel, for the California HealthCare Foundation .
Overall, how satisfied are you with your current health benefits?Respondents without a
PCP were less satisfied
with their health benefits
compared to respondents
with a PCP across all
practice types, pointing
out that care providers
are also an important part
of the health benefits
picture.
Satisfaction with Health Benefits, by Practice type, 2007
insurance and cost concerns
©2008 California healthCare foundation 29
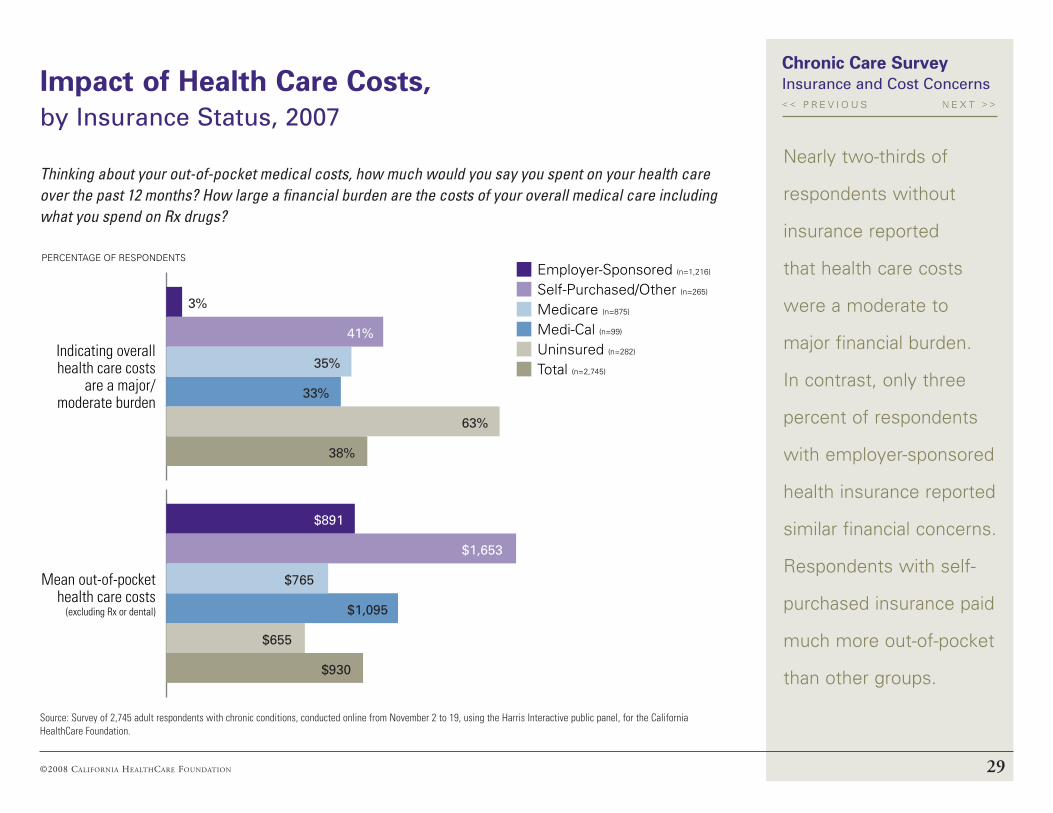
Mean out-of-pocket health care costs
(excluding Rx or dental)
Indicating overall health care costs
are a major/moderate burden
PERCENTAGE OF RESPONDENTS
3%
41%
35%
33%
63%
38%
$891
$1,653
$765
$1,095
$655
$930
Employer-Sponsored (n=1,216)
Self-Purchased/Other (n=265)
Medicare (n=875)
Medi-Cal (n=99)
Uninsured (n=282)
Total (n=2,745)
Chronic Care Survey
Source: Survey of 2,745 adult respondents with chronic conditions, conducted online from November 2 to 19, using the Harris Interactive public panel, for the California HealthCare Foundation .
nearly two-thirds of
respondents without
insurance reported
that health care costs
were a moderate to
major financial burden.
in contrast, only three
percent of respondents
with employer-sponsored
health insurance reported
similar financial concerns.
Respondents with self-
purchased insurance paid
much more out-of-pocket
than other groups.
Thinking about your out-of-pocket medical costs, how much would you say you spent on your health care over the past 12 months? How large a financial burden are the costs of your overall medical care including what you spend on Rx drugs?
Impact of Health Care Costs, by insurance status, 2007
insurance and cost concerns
©2008 California healthCare foundation 30
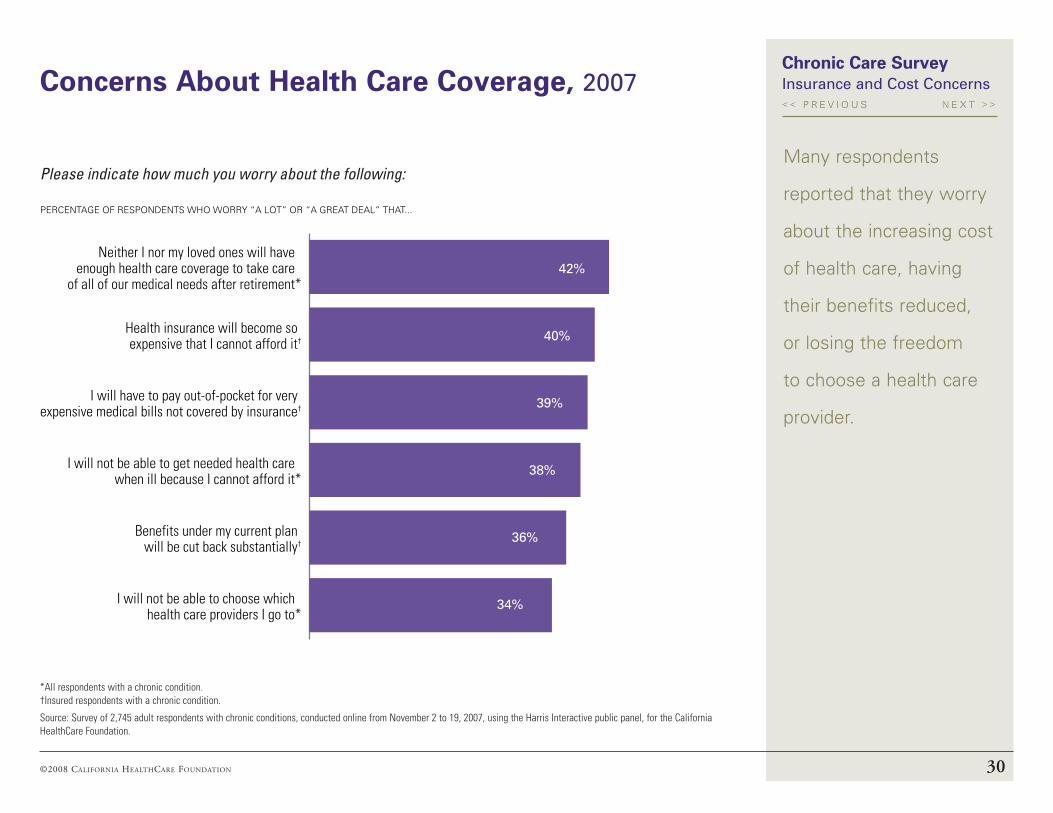
I will not be able to choose which health care providers I go to*
Benefits under my current plan will be cut back substantially†
I will not be able to get needed health care when ill because I cannot afford it*
I will have to pay out-of-pocket for very expensive medical bills not covered by insurance†
Health insurance will become so expensive that I cannot afford it†
Neither I nor my loved ones will have enough health care coverage to take care
of all of our medical needs after retirement*
PERCENTAGE OF RESPONDENTS WHO WORRY “A LOT” OR “A GREAT DEAL” THAT...
42%
40%
39%
38%
36%
34%
Chronic Care Survey
Please indicate how much you worry about the following:
*All respondents with a chronic condition . †Insured respondents with a chronic condition .
Source: Survey of 2,745 adult respondents with chronic conditions, conducted online from November 2 to 19, 2007, using the Harris Interactive public panel, for the California HealthCare Foundation .
many respondents
reported that they worry
about the increasing cost
of health care, having
their benefits reduced,
or losing the freedom
to choose a health care
provider.
Concerns About Health Care Coverage, 2007 insurance and cost concerns
©2008 California HealtHCare foundation 31
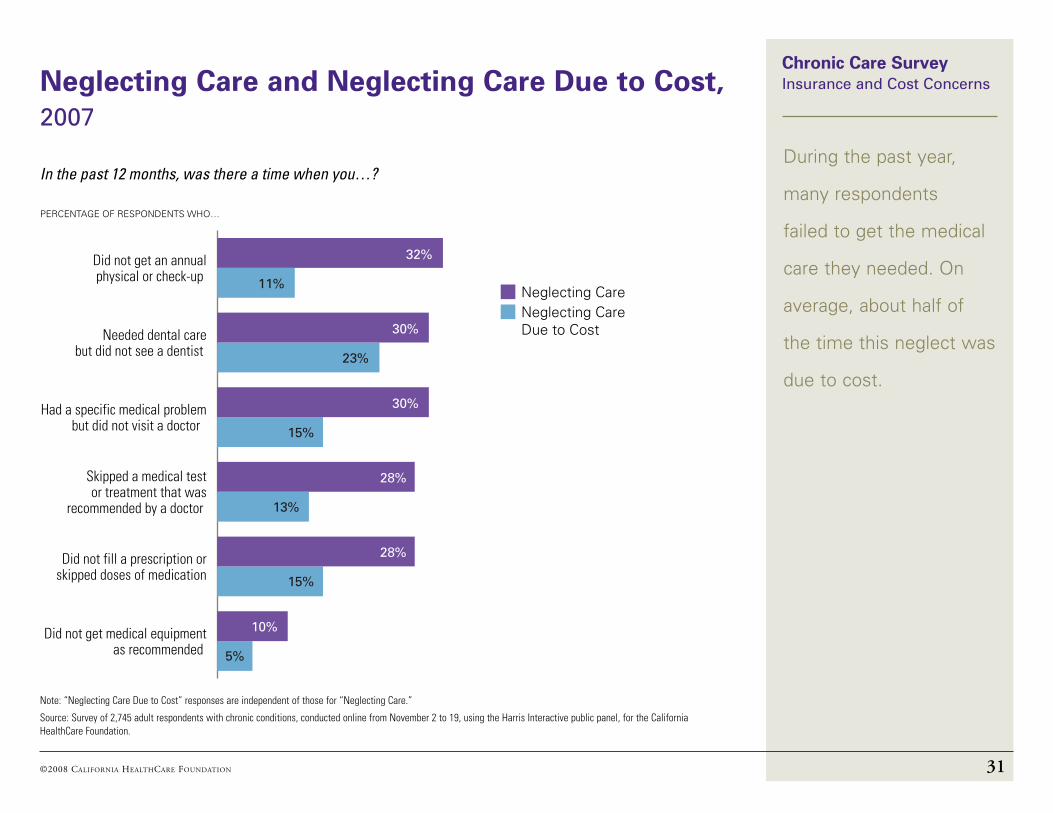
Did not get medical equipment as recommended
Did not fill a prescription or skipped doses of medication
Skipped a medical test or treatment that was
recommended by a doctor
Had a specific medical problem but did not visit a doctor
Needed dental care but did not see a dentist
Did not get an annual physical or check-up
PERCENTAGE OF RESPONDENTS WHO…
32%
11%
30%
23% 30%
30%
15%
28%
13%
28%
15%
10%
5%
Neglecting CareNeglecting Care Due to Cost
Chronic Care Survey
Note: “Neglecting Care Due to Cost” responses are independent of those for “Neglecting Care.”
Source: Survey of 2,745 adult respondents with chronic conditions, conducted online from November 2 to 19, using the Harris Interactive public panel, for the California HealthCare Foundation.
In the past 12 months, was there a time when you…?During the past year,
many respondents
failed to get the medical
care they needed. On
average, about half of
the time this neglect was
due to cost.
Neglecting Care and Neglecting Care Due to Cost, 2007
Insurance and Cost Concerns

©2008 California healthCare foundation 32
Total Respondents with Chronic Illness
Respondents with No PCP
Respondents with PCP
Did Not Neglect Care Due to Cost
Neglected Care Due to Cost 32%
28%
30%
30%
30%
n=1,016
n=1,729
n=2,385
n=360
n=2,745
PERCENTAGE OF RESPONDENTS WHO VISITED THE ER
Chronic Care Survey
Source: Survey of 2,745 adult respondents with chronic conditions, conducted online from November 2 to 19, using the Harris Interactive public panel, for the California HealthCare Foundation .
nearly a third of all
respondents have
visited the emergency
room within the past
two years. Those who
neglected care due to
cost were more likely
to have visited the
emergency room than
those who did not.
In the past 2 years, have you gone to a hospital emergency room for care? In the past 12 months, was there a time when you neglected care due to cost?
Emergency Room Visits, by PcP status and neglect of care due to cost, 2007
insurance and cost concerns

©2008 California healthCare foundation 33
Yes95%
No5%
Rx Coveragen=2,463
AnnuAl Rx out-of-Pocket costs
n=2,745
mean costs $435
median costs $200
Chronic Care Survey
Source: Survey of 2,745 adult respondents with chronic conditions, conducted online from November 2 to 19, using the Harris Interactive public panel, for the California HealthCare Foundation .
The vast majority of
respondents with
insurance have
prescription drug
coverage. Although the
reported average spent
on drugs was $435, the
median ($200) indicates
that a greater number
of respondents pay less
than the average.
Does your health insurance include prescription drug benefits?
About how much have you spent out-of-pocket on prescription drugs over the past 12 months?
Rx Drug Coverage and Out-of-Pocket Costs, 2007 insurance and cost concerns
©2008 California healthCare foundation 34
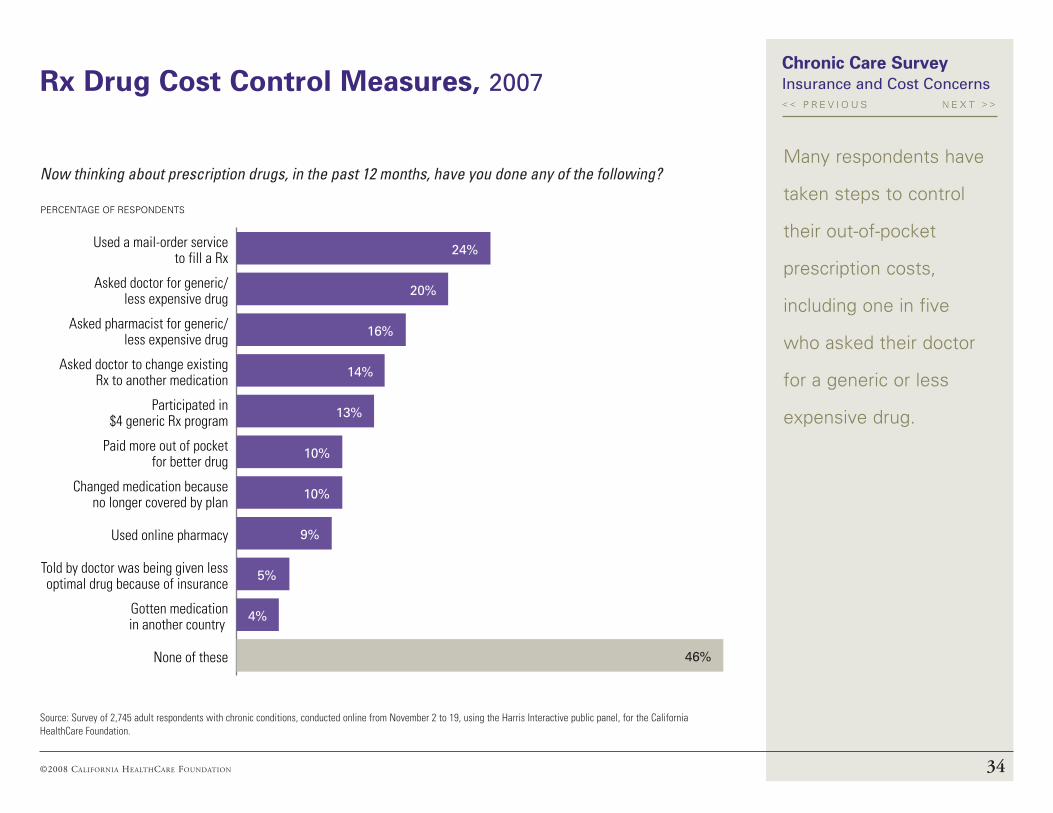
None of these
Gotten medication in another country
Told by doctor was being given less optimal drug because of insurance
Used online pharmacy
Changed medication because no longer covered by plan
Paid more out of pocket for better drug
Participated in $4 generic Rx program
Asked doctor to change existing Rx to another medication
Asked pharmacist for generic/less expensive drug
Asked doctor for generic/less expensive drug
Used a mail-order service to fill a Rx 24%
20%
16%
14%
13%
10%
10%
9%
5%
4%
46%
PERCENTAGE OF RESPONDENTS
Chronic Care Survey
Source: Survey of 2,745 adult respondents with chronic conditions, conducted online from November 2 to 19, using the Harris Interactive public panel, for the California HealthCare Foundation .
many respondents have
taken steps to control
their out-of-pocket
prescription costs,
including one in five
who asked their doctor
for a generic or less
expensive drug.
insurance and cost concerns
Now thinking about prescription drugs, in the past 12 months, have you done any of the following?
Rx Drug Cost Control Measures, 2007
©2008 California healthCare foundation 35
Give us YouR feedbAck
Was the information provided in this report of value? Are there additional kinds of information or data you would like to see included in future reports of this type? Is there other research in this subject area you would like to see? We would like to know .
PLEASE CLICk HERE
to give us your feedback.
thank you.
foR MoRe infoRMAtion
California HealthCare Foundation
1438 Webster Street, Suite 400
Oakland, CA 94612
510 .238 .1040
www .chcf .org
CAL I FORNIAHEALTHCAREFOUNDATION
Chronic Care SurveyAppendix
*Conditions included in survey: arthritis, asthma, cancer, COPD (chronic obstructive pulmonary disease), depression, diabetes, digestive or gastrointestinal disorders, heart disease, HIV/AIDS, hypercholesterolemia, hypertension (high blood pressure), kidney disease, and liver disease .
The Chronic illness survey was conducted online using
the harris interactive public panel (hPoL) between
november 2 and november 19, 2007. The 20-minute
nonrandomized survey was conducted among
2,745 adult respondents with chronic conditions* in
California to examine the group of patients with a
greater need for medical care and/or those who use
the health care system the most. A total of 59 percent
of all California residents who responded to the survey
(n=4,645) reported having at least one of the chronic
conditions listed below. This is significantly higher
than a reported prevalence of 38 percent in California,
which most likely reflects a degree of selection bias.
Respondents were self-selected as well as computer/
internet literate. slightly over half of respondents
with chronic conditions were female. The mean age
was 50.1 years; 27 percent were 18 to 39 years;
51 percent were 40 to 64 years; and 22 percent were
65 years or older. over half (58 percent) were White,
26 percent were Latino, 6 percent were African
American, and 6 percent identified other race/ethnicity.
over a third (36 percent) reported income of $75,000
or more, 16 percent earned $50 to $74.9K, 12 percent
earned $35 to $49.9K, 9 percent earned $25 to
$34.9K, and 14 percent earned less than $25K.
Using the march 2007 Census Bureau Current
Population survey, surveyors adjusted the data for age,
sex, race/ethnicity, education, and household income
to reflect actual population proportions. The weighting
algorithm included a variable called a propensity score.
Propensity score weighting adjusts for attitudinal
and behavioral differences between those who are
online versus offline, those who join online panels
versus those who do not, and those who responded
to this survey versus those who did not. Weights
were applied to the total number of respondents,
including both eligible respondents and those who
were screened out as ineligible. After weights were
applied to all respondents, ineligible respondents were
removed, leaving only eligible respondents for further
analysis.
harris interactive inc. is a Rochester, new York-
based global research company that blends strategic
consulting with efficient methods of investigation,
analysis, and application. Known for The harris Poll
and for internet-based research methods, harris
interactive conducts proprietary and public research
for its clients. for more information, visit
www.harrisinteractive.com.
Methodology, Demographics and Acknowledgments