California Transportation Plan 2050 - Comments · California Transportation Plan Office of State...
83
December 20, 2018 Sent via email and FedEx (if applicable) California Department of Transportation (Caltrans) Division of Transportation Planning California Transportation Plan Office of State Planning 1120 N Street, MS 32 Sacramento, CA 95814 (916) 654-2852 [email protected] Re: California Transportation Plan 2050 - Comments Dear California Transportation Plan 2050 Planners: These comments are submitted on behalf of the Center for Biological Diversity (the “Center”) regarding the California Transportation Plan (CTP) 2050. The Center is encouraged by Caltrans’ commitment to increase safety and security on bridges, highways, and roads and create a low-carbon transportation system that protects human and environmental health. To achieve these goals, it is imperative that Caltrans integrate wildlife connectivity into the design and implementation of California’s transportation infrastructure. The Center urges Caltrans to improve driver safety and minimize the impact of roads and traffic on wildlife movement and habitat connectivity with the following actions: 1. Collect and analyze standardized roadkill and wildlife vehicle collision data. 2. Build climate-wise wildlife crossing infrastructure in high priority areas. 3. Prioritize wildlife movement and habitat connectivity on ALL transportation projects. 4. Designate an expert unit dedicated to address wildlife connectivity issues. This unit should form strategic collaborations and partnerships with other connectivity experts. 5. Evaluate the effectiveness of wildlife crossing infrastructure to inform future mitigation. 6. Upgrade existing culverts to facilitate wildlife connectivity as part of routine maintenance. 7. Provide up-to-date guidance for best practices for climate-wise connectivity. 8. Engage with volunteer and community scientists and platforms. 9. Improve multimodal transportation design. 10. Allocate more funding to prioritize wildlife connectivity.
Transcript of California Transportation Plan 2050 - Comments · California Transportation Plan Office of State...

December 20, 2018
Sent via email and FedEx (if applicable)
California Department of Transportation (Caltrans)
Division of Transportation Planning
California Transportation Plan
Office of State Planning
1120 N Street, MS 32
Sacramento, CA 95814
(916) 654-2852
Re: California Transportation Plan 2050 - Comments
Dear California Transportation Plan 2050 Planners:
These comments are submitted on behalf of the Center for Biological Diversity (the
“Center”) regarding the California Transportation Plan (CTP) 2050. The Center is encouraged by
Caltrans’ commitment to increase safety and security on bridges, highways, and roads and create
a low-carbon transportation system that protects human and environmental health. To achieve
these goals, it is imperative that Caltrans integrate wildlife connectivity into the design and
implementation of California’s transportation infrastructure.
The Center urges Caltrans to improve driver safety and minimize the impact of roads and
traffic on wildlife movement and habitat connectivity with the following actions:
1. Collect and analyze standardized roadkill and wildlife vehicle collision data.
2. Build climate-wise wildlife crossing infrastructure in high priority areas.
3. Prioritize wildlife movement and habitat connectivity on ALL transportation projects.
4. Designate an expert unit dedicated to address wildlife connectivity issues. This unit
should form strategic collaborations and partnerships with other connectivity experts.
5. Evaluate the effectiveness of wildlife crossing infrastructure to inform future mitigation.
6. Upgrade existing culverts to facilitate wildlife connectivity as part of routine
maintenance.
7. Provide up-to-date guidance for best practices for climate-wise connectivity.
8. Engage with volunteer and community scientists and platforms.
9. Improve multimodal transportation design.
10. Allocate more funding to prioritize wildlife connectivity.

December 20, 2018
Page 2
The Center is a non-profit, public interest environmental organization dedicated to the
protection of native species and their habitats through science, policy, and environmental law.
The Center has over 68,000 thousand members and online activists throughout California and the
United States. The Center has worked for many years to protect imperiled plants and wildlife,
open space, air and water quality, and overall quality of life for people in location of Project.
I. ROADS CREATE BARRIERS THAT LEADTO HABITAT LOSS AND
FRAGMENTATION, WHICH HARMS WILDLIFE AND PEOPLE
Desert tortoise crossing the road in Joshua Tree National Park.
Photo Credit: National Park Service.
Roads and traffic are drivers of habitat loss and fragmentation, which have been
identified as major stressors on California’s unique ecosystems and biodiversity (CDFW 2015).
As barriers to wildlife movement and the cause of injuries and mortalities due to wildlife vehicle
collisions, roads and traffic can affect an animal’s behavior, movement patterns, reproductive
success, and physiological state, which can lead to significant impacts on individual wildlife,
populations, communities, and landscapes (Trombulak and Frissell 2000, Haddad et al. 2015,
van der Ree 2015, Ceia-Hasse et al. 2018). For example, habitat fragmentation from roads and
traffic has been shown to cause mortalities and harmful genetic isolation in mountain lions in
southern California (Riley et al. 2006, 2014, Vickers et al. 2015), increase local extinction risk in
amphibians and reptiles (Cushman 2006, Brehme et al. 2018), cause high levels of avoidance
behavior and mortality in birds (Benitez-Lopez et al. 2010, Loss et al. 2014), and alter pollinator
behavior and degrade habitats (Trombulak and Frissell 2000, Goverde et al. 2002, Aguilar et al.
2008). In addition, wildlife vehicle collisions pose a major public safety and economic threat.
Over the last three years (2015-2017) it is estimated that 7,000 to 23,000 wildlife vehicle
collisions have occurred annually on California roads (Shilling et al. 2017, Shilling et al. 2018,
State Farm Insurance Company 2016, 2018). These crashes result in human loss of life, injuries,
emotional trauma, and property damages that can add up to $300-600 million per year.

December 20, 2018
Page 3
Caltrans’ mission statement is to “[p]rovide a safe, sustainable, integrated, and efficient
transportation system to enhance California’s economy and livability” (Caltrans 2018a). Thus,
Caltrans should include an additional goal in the CTP 2050 to maintain and improve
climate-wise connectivity to sustain functional, healthy ecosystems and ensure public
safety. This can be accomplished by avoiding intact wildlife corridors and the implementing
effective wildlife crossing infrastructure. Crossing structures are useful as mitigation for new
projects and as retroactive restoration in areas where existing roads have high incidence of
wildlife vehicle conflict or where species movement has been severely impacted. When
appropriately implemented, wildlife crossing infrastructure has been shown to improve wildlife
permeability and reduce wildlife vehicle collisions (Dodd et al. 2004, 2012, Bissonnette and
Rosa 2012, Sawyer et al. 2012, Sawaya et al. 2014, Kintsch et al. 2018). Thus, by maintaining
and restoring climate-wise habitat connectivity that facilitates movement required for current and
future species ranges and behaviors, Caltrans would improve driver safety while allowing
California’s special biodiversity to thrive.
II. CALTRANS IS NOT ADEQUATELY ADDRESSING WILDLIFE
MOVEMENT OR HABITAT CONNECTIVITY ISSUES
A baby black bear was struck by a car on the road and a red fox feeds on roadkill.
Photo credit: Robert Berdan.
Because Caltrans has authority and jurisdiction over most of California’s roads and
highways, Caltrans is the best suited agency to make roads safe for both motorists and wildlife.
Caltrans should be proactively addressing the environmental and public safety impacts that result
from the maintenance, design, construction, and traffic of California roads. However, Caltrans is
failing to keep people safe and ecosystems healthy by neglecting to acknowledge the need for
appropriate data to determine priority areas for preserving, enhancing, or developing effective
wildlife connectivity on existing or planned roads. Caltrans is falling behind other state
transportation departments that are prioritizing road safety and wildlife connectivity in their
project design and implementation.
A. Caltrans has insufficient data to identify priority areas, determine the
magnitude of the problem, and inform effective mitigation
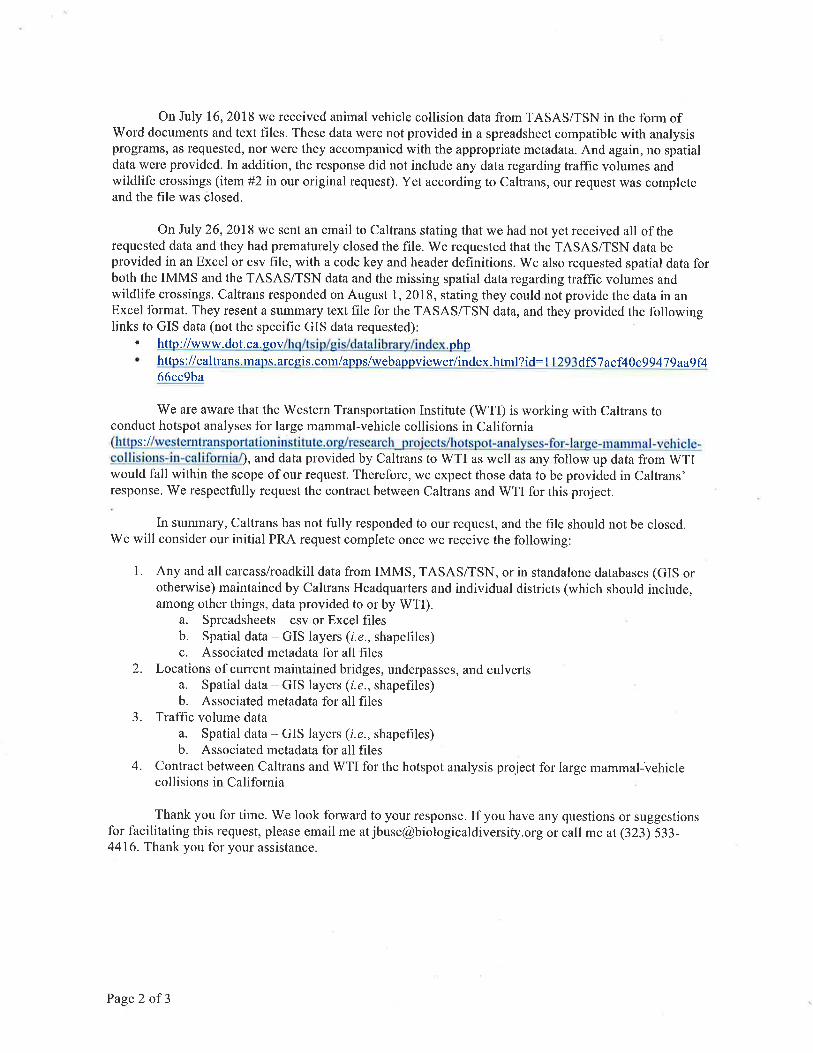
In July and August of 2018 the Center requested roadkill and wildlife vehicle collision
data under the California Public Records Act (PRA), Government Code § 6250 et seq. In

December 20, 2018
Page 4
response to the PRA requests, the Center received various documents, including records and
summary reports of animal hits from 2010 to 2017 from the Transportation Systems Network
(TSN) (these are reported animal vehicle collisions), carcass removal data from 2001 to 2018
from Caltrans Division of Maintenance, and website links to spatial data (i.e., GIS layers) for the
locations of bridges, underpasses, culverts, and traffic volume (Appendix 1). In addition, the
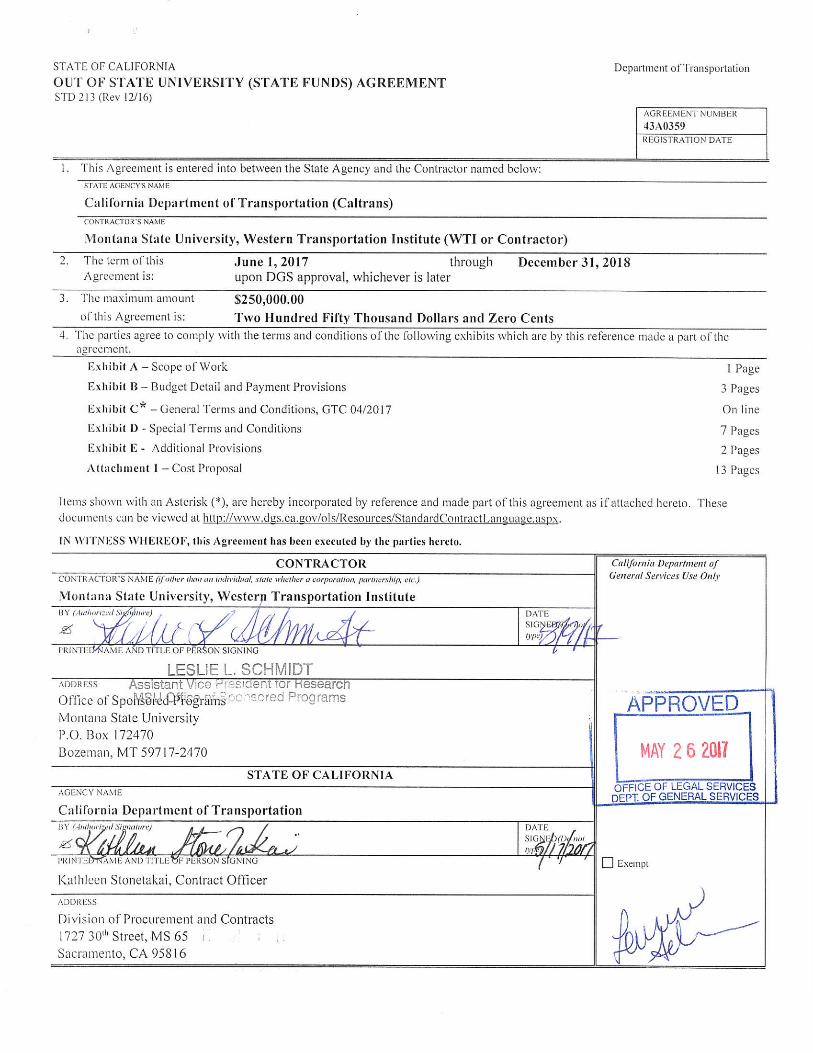
Center received a 2017 contract not to exceed $250,000 between Caltrans and the Western
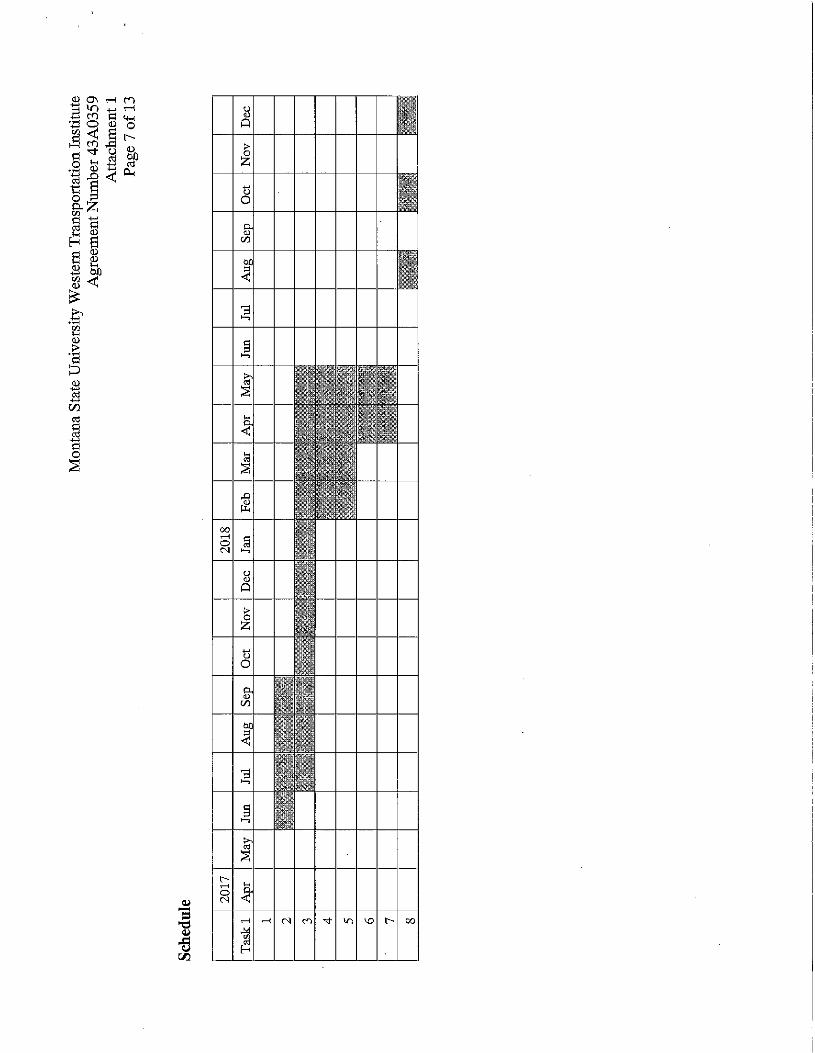
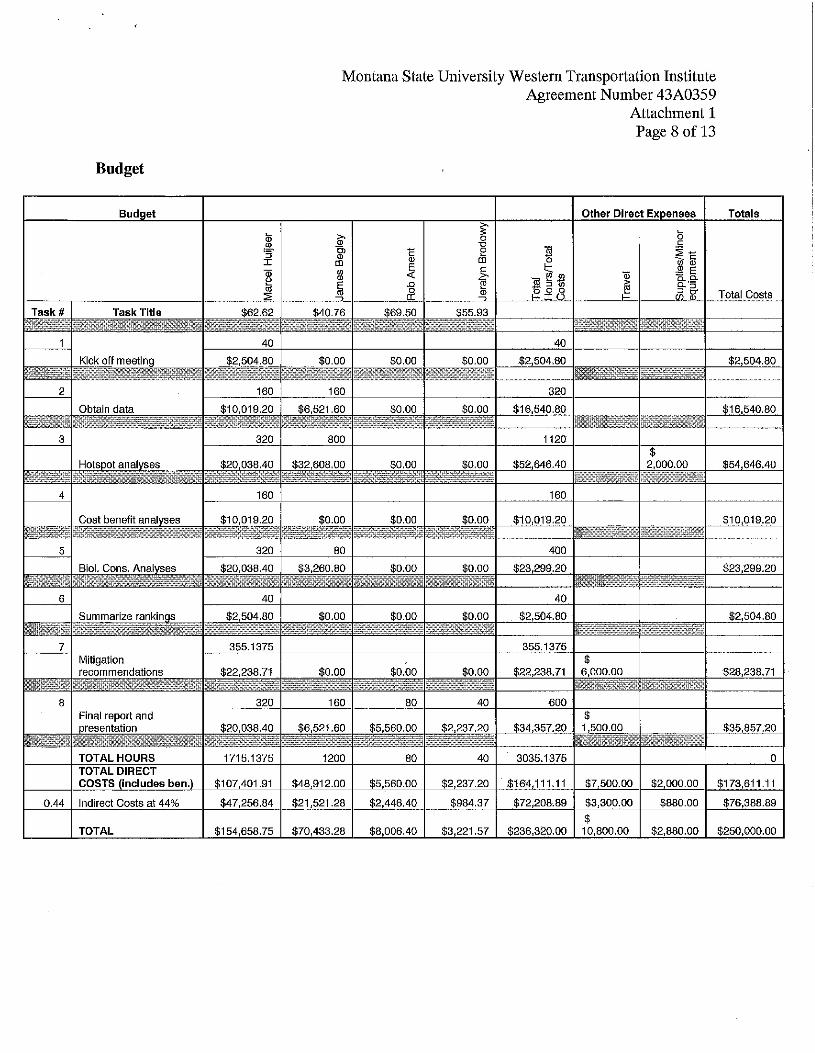
Transportation Institute (WTI) to conduct a hotspot analysis for large mammal-vehicle collisions
in California, the data used by WTI for their analyses, and summaries of WTI’s preliminary
analyses (Appendix 2).
Following a close review of the documents, it became apparent that Caltrans has failed to
systematically collect or record roadkill data. This is concerning because systematic, reliable
roadkill and animal vehicle collision data are needed to accurately identify the existence and
magnitude of road safety and conservation issues (Donaldson 2017, Shilling et al. 2018). Carcass
removal data input varied and often did not include important details like species information,
date and time information, or specific location information. For example, the 52 recorded
roadkill pickups in 2017 in District 7 (Los Angeles and Ventura Counties) included two dogs,
one coyote, one raccoon and 48 unidentified species. These data are insufficient for meaningful
analyses. Alarmingly, four of the 12 Caltrans Districts (9, 10, 11, and 12) had no roadkill data for
the past seven years (2011-2017), even though they cumulatively had an average of ~1200
roadkill pickups annually from 2004 to 2010. In addition, several of the remaining Districts with
data, including Districts 4 (the San Francisco Bay Area) and 7 (Los Angeles and Ventura
Counties), had markedly less records compared to previous years. The lack of data and low
numbers contradict a study conducted by the UC Davis Road Ecology Center, which identified
wildlife vehicle collision hotspots in all of these Districts using independently collected roadkill
data from the California Roadkill Observation System and Caltrans animal crash data (Shilling et
al. 2018). See Figure 1.
Figure 1. Map of Caltrans Districts and identified wildlife vehicle collision hotspots.
Sources: Caltrans, Shilling et al. 2018.

December 20, 2018
Page 5
According to the WTI summary regarding carcass removal (Appendix 2.2), the number
of records in the database for species of concern to human safety (except for mule deer) or
biological conservation were low, and “[l]ooking at the species distribution maps for CA, there
are probably many more hit of these species in locations that did not report these species at all”
(Appendix 2.2). Thus, WTI concludes that the data are insufficient “to conduct meaningful
analyses” on any species other than deer (Appendix 2.2). Search and reporting effort seemed to
vary among the districts over time, and WTI recommended that Caltrans implement the same
level of higher effort across all Caltrans Districts in order to be able to accurately identify
roadkill hotspots and improve safety for both drivers and wildlife.
While animal collision data from reported crashes were somewhat better, there were
significant discrepancies between data summaries from Caltrans and WTI. For example, Caltrans
reported 10,538 total reported crashes with animals from 2005-2014, with 33 human fatalities
and 1,708 human injuries (Appendix 2.4). WTI’s numbers were slightly different, with 10,552
reported animal collisions, 28 human fatalities, and 1,617 human injuries within that same
timeframe (Appendix 2.3). The reasons for the mismatching numbers are unclear, but similar
issues have occurred with other independent analyses of Caltrans data. Shilling et al. (2018)
reported one fatality and 268 injuries from reported animal collisions in 2017 while Caltrans
(2018b) reported 12 fatalities and 383 injuries. More data transparency is needed so these kinds
of issues can be resolved, and accurate information can be provided to decisionmakers.
The large mammal vehicle collision hotspot analysis that Caltrans contracted out is
narrow in focus and does not comprehensively address issues of habitat fragmentation and driver
safety, as other animals on or near roads can be involved in crashes (Shilling et al. 2017, 2018).
Caltrans’ insufficient data further limits WTI’s analysis to only mule deer, even though
numerous other large mammals, such as mountain lions, black bears, and elk, are hit on
California roads every year (Shilling et al. 2017, 2018). In addition, injuries and fatalities
sustained by animals that are hit can impact the resilience and persistence of a species’
population (Trombulak and Frissell 2000, Marsh and Jaeger 2015, van der Ree 2015, Ceia-Hasse
et al. 2018). Thus, this kind of limited analysis does not provide sufficient information regarding
how to effectively minimize the environmental and safety impacts of roads and traffic.
The lack of systematic animal collision and roadkill data undermines Caltrans’ ability to
accurately identify where and how often animal collisions are occurring. According to both
Caltrans’ summary report and WTI’s preliminary analyses using only Caltrans’ reported animal
crash data, there was an average of about 1,000 reported animal collisions per year between 2005
and 2014 (Appendix 2). However, independent analyses of Caltrans’ animal crash data combined
with roadkill data recorded by volunteer scientists in the California Roadkill Observation System
showed that ~7,000 animal collisions per year occurred between 2015 and 2017 (Shilling et al.
2017, 2018). Although these analyses are conducted for different timeframes, the stark difference
in the magnitude of animal collisions occurring on California roads requires more attention. In
addition, these estimates likely underrepresent the actual number of annual animal collisions.
Several studies indicate that these types of collisions are often underreported (Donaldson and
Lafon 2008, Donaldson 2017), which is further supported by car insurance claims; State Farm
Insurance Company estimated that there were >23,000 deer collision claims per fiscal year from

December 20, 2018
Page 6
2015-2018 (State Farm 2016, 2018). This underscores the need for systematic roadkill and crash
data to determine animal crash hotspots so that the issues of wildlife movement and habitat
connectivity on existing roads can be appropriately addressed. The lack of such data makes
Caltrans unable to effectively mitigate these wildlife vehicle collisions, thereby making
them unable to make roads safer for both people and wildlife. Without systematically
collecting and analyzing roadkill and animal crash data, Caltrans will not be able to accomplish
their mission to “[p]rovide a safe, sustainable, integrated, and efficient transportation system to
enhance California’s economy and livability” (Caltrans 2018a).
B. Caltrans is not building enough wildlife crossing infrastructure.
Bobcat at a culvert. Photo credit: National Park Service.
According to Shilling et al. (2018), Caltrans builds only 2-3 wildlife crossings per year
statewide, which is grossly insufficient to address the major threat that roads pose to wildlife
connectivity and driver safety (12 human deaths and 383 human injuries due to ~7,000-23,000
wildlife vehicle collisions in 2017 [Caltrans 2018b, Shilling et al. 2018, State Farm Insurance
Company 2018]). Generally, these crossings are not standalone projects that have the purpose of
addressing wildlife connectivity issues; instead, they are embedded as mitigation in larger
construction/expansion/maintenance projects that have already been approved or funded.
Although embedded mitigation measures are important for minimizing connectivity impacts of
those types of projects, they are limited in addressing wildlife connectivity and driver safety
needs in identified high priority areas. Many identified major wildlife vehicle collision hotspots
are not in areas where Caltrans has planned projects (Shilling et al. 2018). Thus, a more efficient
and effective way to address wildlife connectivity and driver safety issues is to proactively
implement wildlife crossing infrastructure in areas where wildlife vehicle collisions are
most numerous.
December 20, 2018
Page 7
An exception to this pattern is the Highway 17 Connectivity Project, a collaboration
between Caltrans and local/regional stakeholders, including the UC Santa Cruz Puma Project,
Pathways for Wildlife, Midpeninsula Regional Open Space District, Peninsula Open Space
Trust, the Land Trust of Santa Cruz County, Santa Clara Valley Transportation Authority, and
others, in the Santa Cruz Mountains. Based on existing knowledge of local experts, wildlife
movement studies (with GPS telemetry data and camera monitoring data), and roadkill data
analyses, wildlife vehicle collision hotspots were identified at Laurel Curve and Lexington
Reservoir on Highway 17 and have been prioritized for the maintenance of habitat connectivity
and the implementation of wildlife crossing infrastructure (Diamond et al. 2015). Land was
purchased to preserve high quality habitat in the high priority areas on both sides of Highway 17
and the best locations to facilitate wildlife connectivity and reduce wildlife vehicle collisions
were chosen to retrofit, construct, and maintain wildlife crossing structures (underpasses and
culverts) (Diamond et al. 2015). The project is currently in the design phase and construction is
expected to begin in 2020 (Gary 2018). More projects like the Highway 17 Connectivity Project
need to be proactively planned, funded, and implemented.
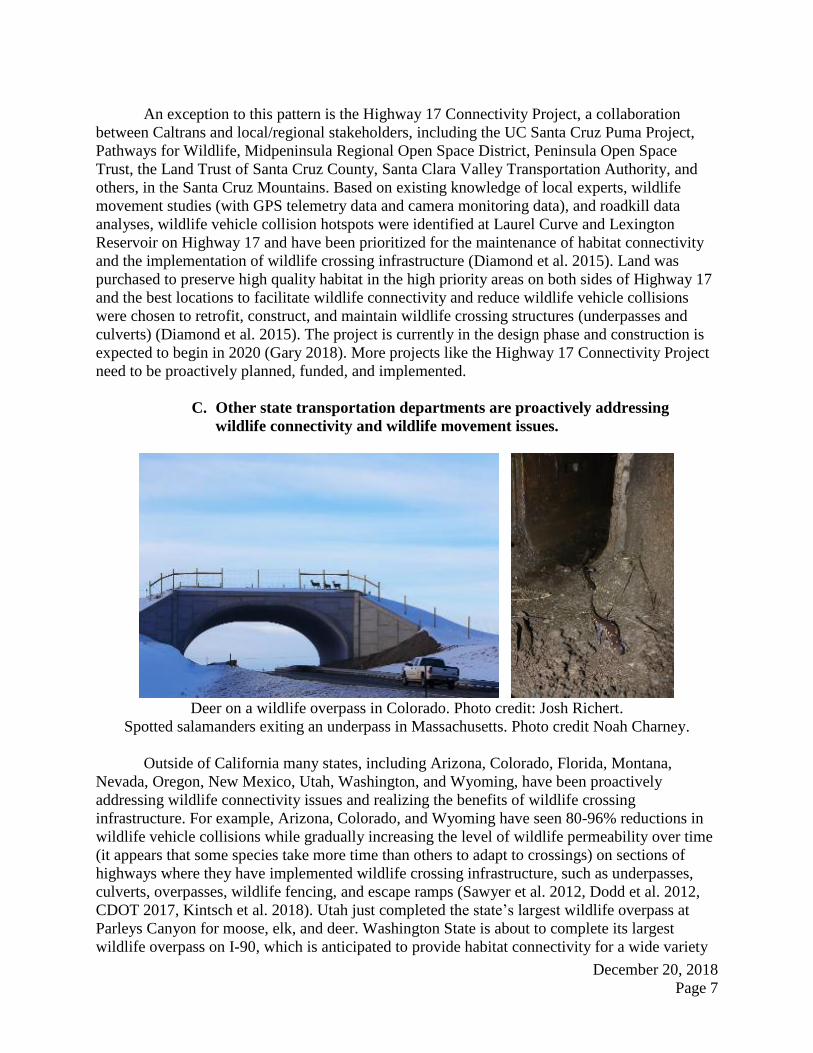
C. Other state transportation departments are proactively addressing
wildlife connectivity and wildlife movement issues.
Deer on a wildlife overpass in Colorado. Photo credit: Josh Richert.
Spotted salamanders exiting an underpass in Massachusetts. Photo credit Noah Charney.
Outside of California many states, including Arizona, Colorado, Florida, Montana,
Nevada, Oregon, New Mexico, Utah, Washington, and Wyoming, have been proactively
addressing wildlife connectivity issues and realizing the benefits of wildlife crossing
infrastructure. For example, Arizona, Colorado, and Wyoming have seen 80-96% reductions in
wildlife vehicle collisions while gradually increasing the level of wildlife permeability over time
(it appears that some species take more time than others to adapt to crossings) on sections of
highways where they have implemented wildlife crossing infrastructure, such as underpasses,
culverts, overpasses, wildlife fencing, and escape ramps (Sawyer et al. 2012, Dodd et al. 2012,
CDOT 2017, Kintsch et al. 2018). Utah just completed the state’s largest wildlife overpass at
Parleys Canyon for moose, elk, and deer. Washington State is about to complete its largest
wildlife overpass on I-90, which is anticipated to provide habitat connectivity for a wide variety
December 20, 2018
Page 8
of species between the North and South Cascade Mountains. The overpass cost $6.2 million as
part of a larger $900 million expansion project that will include multiple wildlife crossings along
a 15-mile stretch of highway. Savings from less hospital bills, damage costs, and road closures
from fewer wildlife vehicle collisions will make up those costs in a few years (Valdes 2018).
State transportation departments are actively pursuing these types of projects because of the
benefits for wildlife connectivity, public safety, and the economy. California needs to follow suit
and more actively invest in preserving habitat connectivity where there are no roads while also
enhancing or restoring connectivity where roads or other transportation infrastructure already
exist.
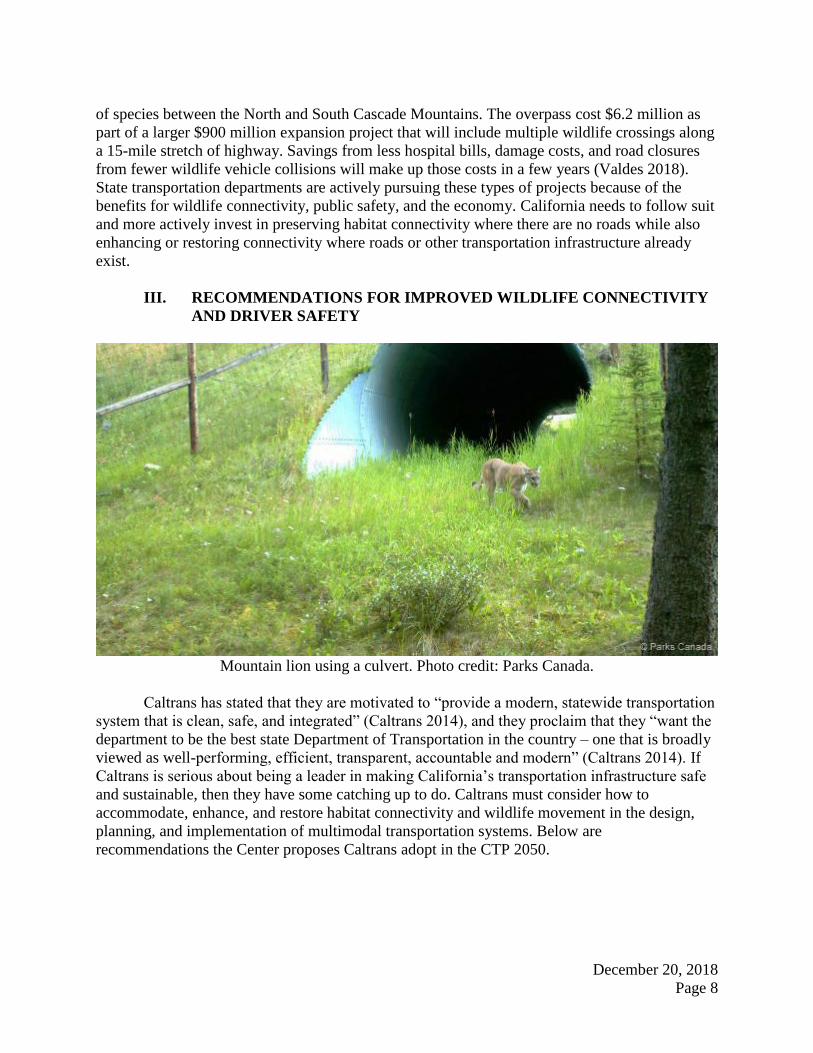
III. RECOMMENDATIONS FOR IMPROVED WILDLIFE CONNECTIVITY
AND DRIVER SAFETY
Mountain lion using a culvert. Photo credit: Parks Canada.
Caltrans has stated that they are motivated to “provide a modern, statewide transportation
system that is clean, safe, and integrated” (Caltrans 2014), and they proclaim that they “want the
department to be the best state Department of Transportation in the country – one that is broadly
viewed as well-performing, efficient, transparent, accountable and modern” (Caltrans 2014). If
Caltrans is serious about being a leader in making California’s transportation infrastructure safe
and sustainable, then they have some catching up to do. Caltrans must consider how to
accommodate, enhance, and restore habitat connectivity and wildlife movement in the design,
planning, and implementation of multimodal transportation systems. Below are
recommendations the Center proposes Caltrans adopt in the CTP 2050.

December 20, 2018
Page 9
Recommendation 1: Collect and analyze standardized roadkill and wildlife vehicle
collision data.
Standardized roadkill and wildlife vehicle collision data should be a priority for
transportation planning and wildlife management (Dodd et al. 2012, Shilling et al. 2017, 2018,
Donaldson 2017). Data from reported collisions alone is insufficient, as collisions are often
vastly underreported (Donaldson and Lafon 2008, Donaldson 2017, Shilling et al. 2017, 2018).
In addition, data transparency is needed for accurate analyses to take place. Olson et al. (2014)
has shown that implementing available technologies, such as GPS, mobile applications, map
viewers, and electronic databases, is a cost-effective way to improve data efficiency, accuracy,
and management. Utah’s state personnel use a wildlife vehicle collision reporter mobile app to
record roadkill data (Ashland 2018). California should do the same. Standardized data and data
transparency will allow for analyses to be conducted at a finer spatial scale so that priority areas
for wildlife road conflict can be accurately identified and appropriate mitigation measures can be
implemented. These data should be made publicly available for other agencies and organizations
to use and analyze.
Recommendation 2: Build climate-wise wildlife crossing infrastructure in high
priority areas.
Caltrans should proactively identify high priority areas for wildlife crossing infrastructure
using the best available scientific information and implement them as standalone retrofit
projects. Although Caltrans does not currently have sufficient roadkill and wildlife collision data,
they can turn to other experts for guidance regarding priority areas to investigate or address now.
The scientific community is a valuable resource that can provide Caltrans with information
regarding connectivity issues. For example, CDFW’s California Essential Habitat Connectivity
Project provides a working foundation to build upon. It can help identify areas that require finer-
scale data collection and analyses to determine where there are intact connectivity areas to
prioritize for preservation or areas that require connectivity enhancement or restoration. Caltrans
should integrate systematic roadkill and wildlife vehicle collision data with existing data and
platforms to improve their understanding of habitat connectivity and wildlife movement issues
on existing and planned transportation infrastructure.
There are other sources of information that can be consulted to proactively address
connectivity issues on California’s roads. The UC Davis Road Ecology Center has published
multiple studies in which they identify wildlife vehicle collision hotspots using Caltrans’ animal
collision data combined with roadkill data collected by volunteer scientists throughout the state
(Shilling et al. 2017, 2018). These studies can be used to inform wildlife connectivity projects to
reduce wildlife vehicle collisions and improve driver safety. Studies and experts can also be
consulted to determine priority areas where species of conservation concern are being impacted
by roads. For example, a 2009 study shows that traffic on Vasco Road in Livermore, CA causes
high levels of mortality in two federally threatened species, California red-legged frogs and
California tiger salamanders (Mendelsohn et al. 2009). Due to the sensitivity of these species and
their need to migrate from terrestrial burrows to temporal pools for breeding, this area should be
prioritized for connectivity infrastructure to facilitate the safe passage of these amphibians along
this road. Caltrans should use the best scientific information available to protect, enhance, or

December 20, 2018
Page 10
restore wildlife connectivity at existing and planned roads or other transportation infrastructure.
These projects should be planned and implemented as standalone retrofit projects.
Recommendation 3: Prioritize wildlife movement and habitat connectivity on ALL
transportation projects.
Caltrans should adequately assess the impacts of all maintenance, expansion, or new
transportation projects on wildlife movement and habitat connectivity and require connectivity
actions through the California Environmental Quality Act (CEQA) process. They should consult
with CDFW as well as local and regional stakeholders to accurately identify connectivity
impacts due to their projects and appropriately mitigate those impacts through avoidance and
minimization measures. Local and regional wildlife movement, habitat connectivity, and wildlife
vehicle collision data should be collected and analyzed in the project area before projects are
approved and budgets are set (Lesbarreres and Fahrig 2012, Shilling et al. 2018). New and
renovated roads should be designed with wildlife connectivity in mind – it is easier to plan a new
road to avoid or minimize impacts to wildlife connectivity than it is to retroactively build
wildlife crossings.
Caltrans recently published climate change vulnerability assessments that bring attention
to current and potential future damage on roads and other transportation infrastructure due to
extreme weather events associated with climate change (Caltrans 2018c). With climate change
predicted to alter the landscape, it is important to consider potential shifts in wildlife movement
patterns due to changes in species distributions and home ranges. To further increase the
resiliency of the state highway system to climate change, Caltrans should integrate climate-wise
wildlife connectivity needs, in consultation with CDFW and other connectivity experts, as they
rebuild damaged roads, retrofit existing roads, and construct new roads. This, in addition to their
proactive approach to other climate change vulnerabilities, will improve California’s
transportation infrastructure and help keep people and wildlife safe.
Recommendation 4: Designate an expert unit dedicated to address wildlife
connectivity issues. This unit should form strategic collaborations and partnerships
with other connectivity experts.
Caltrans should establish a dedicated team of experts to address the complicated and
expansive issues of wildlife movement and habitat connectivity. In addition, Caltrans should
involve wildlife connectivity experts from CDFW and other agencies, organizations, academic
institutions, communities, and local groups at the beginning of transportation projects so that
climate-wise connectivity can be strategically integrated into project design and appropriately
considered in the project budget.
Caltrans should crowdsource for local knowledge by sponsoring, coordinating, and
organizing connectivity working groups with local and regional stakeholders, including agencies,
organizations, academic institutions, and communities, to more easily identify priority
connectivity issues. As part of these working groups Caltrans engineers should be trained and
updated on how high priority areas for wildlife road conflict are identified and best practices to
incorporate climate-wise wildlife connectivity actions.

December 20, 2018
Page 11
Recommendation 5: Evaluate the effectiveness of wildlife crossing infrastructure to
inform future mitigation.
To provide appropriate mitigation for habitat connectivity and wildlife movement, the
effectiveness of wildlife crossing infrastructure planning, design, and strategies should be
thoroughly and systematically evaluated to determine which strategies work better than others
and how they can be improved. This should include the long-term monitoring and maintenance
of crossing infrastructure as well as the use of appropriate metrics that adequately reflect
effectiveness, such as species passage rates and counts of wildlife vehicle collision occurrences.
In addition, Caltrans should archive stamped engineering plans and drawings for crossings for
engineers to reference for future projects. The data and evaluations should inform future
mitigation strategies and be made available to the public.
Recommendation 6: Upgrade existing culverts to facilitate wildlife connectivity as
part of routine maintenance.
A vast system of culverts already exists throughout California’s road systems. Although
some were built for purposes unrelated to habitat connectivity and wildlife movement, many can
function as corridors for multiple species. Upgrading culverts to accommodate wildlife
movement as part of standard routine maintenance could increase connectivity. Arizona does this
on their highways. Caltrans already alters culverts for use by humans and farm animals (e.g.,
horses, cattle). They should extend this practice to include improvements for habitat connectivity
and wildlife movement.
Recommendation 7: Provide up-to-date guidance for best practices to improve
climate-wise connectivity.
Caltrans’ 2009 wildlife crossing guidance manual is outdated. Caltrans should be using
the best available scientific information to preserve or improve habitat connectivity for multiple
species, including small, medium, and large mammals, amphibians, reptiles, birds, fish, and
invertebrates. Guidance should adequately reflect the ecological and behavioral needs of target
species as well as climate change adaptations. As mentioned previously, strategic partnerships
with connectivity experts from various agencies, institutions, and organizations could inform
best practices to preserve, enhance, and restore wildlife connectivity. In addition, information
from previous mitigation strategies, including those conducted within California as well as in
other states (e.g., Dodd et al. 2012, CDOT 2017) should provide insight on how to design the
most effective wildlife crossing infrastructure. Caltrans should facilitate best practices by
updating their wildlife crossing guidance manual to reflect the best available scientific
information regarding wildlife connectivity. Guidance should incorporate lessons learned and
areas in need of improvement based on previous projects and mitigation measures.
Recommendation 8: Engage with volunteer and community scientists and platforms.
Using data collected by community and volunteer scientists can be a cost-effective way
to acquire reliable data needed to identify general patterns and conservation needs across large

December 20, 2018
Page 12
biogeographical spatial scales (Devictor et al. 2010). Thus, using community science can help in
identifying high-risk areas for wildlife connectivity and driver safety (Olson et al. 2014, Waetjen
and Shilling 2017, Periquet et al. 2018), as evidenced by the studies from the Road Ecology
Center (Shilling et al. 2017, 2018). Caltrans should work with community science platforms like
the California Roadkill Observation System, iNaturalist, or other mobile applications to
incorporate additional data into their database that can be included in their analyses.
Recommendation 9: Improve multimodal transportation design.
According to Caltrans, Californians seek more opportunities for walking, biking, or using
public transit (Caltrans 2016). Yet Caltrans continues to focus most of their efforts on building
and expanding more roads to accommodate (and facilitate) more cars. According to a 2017
analysis by INRIX, Los Angeles and San Francisco are two of the three most congested cities in
the US, and at #1, Los Angeles residents spend over 100 hours a year stuck in traffic, which is
estimated to cost the city’s economy over $19 billion (McCarthy 2018). Long commutes cause
increased stress levels and leave little to no time to exercise or spend time with families or
communities, which can lead to mental and physical health impacts, reduced quality of life, and
shorter life spans (Leyden et al. 2003, Frumkin et al. 2004, Ewing et al. 2008). In addition,
emissions from road transportation contribute to poor air quality that can lead to serious health
effects, including respiratory and cardiovascular disease, compromised birth outcomes, and
premature death (Anderson et al. 2011, Lin et al. 2012, Caiazzo et al. 2013, Chen et al. 2017). A
recent study found that emissions from road transportation cause 53,000 premature deaths
annually in the US, and California has about 12,000 early deaths every year due to air pollution
from road transportation and commercial/residential sources (Caiazzo et al. 2013). Thus,
Caltrans has a responsibility to make roads and other transportation infrastructure safer for
drivers and communities where there are roads. Major cities around the world are acknowledging
the detrimental effects of roads and traffic on people, and they are shifting their land use design
focus from cars to human health and well-being (Conniff 2018). By reducing the amount of new
roads and implementing design oriented towards pedestrians, cyclists, and transit instead of cars,
Caltrans can (and should) create transportation infrastructure that improves public health and
safety and preserves wildlife connectivity.
Recommendation 10: Allocate more funding to prioritize wildlife connectivity.
Wildlife connectivity is already severely impaired by over 400,000 road miles in
California (FHWA 2017). Caltrans should prioritize restoring connectivity on existing roads by
funding studies on how to improve connectivity and funding action towards reestablishing
habitat connections. Although Caltrans is the lead agency for the Liberty Canyon Wildlife
Connectivity Project, the first constructed wildlife overpass in California (Caltrans 2018d),
unless funding is secured the project cannot be completed. Caltrans should not rely solely on
outside sources to implement needed connectivity mitigation on roads they are managing. They
should allocate more of their own funding to connectivity projects like Liberty Canyon to
effectively restore wildlife connectivity.

December 20, 2018
Page 13
V. CONCLUSION
California is a biodiversity hotspot with many endemic species and unique habitats. The
health of these ecosystems and human well-being are intertwined, and they intersect on
California’s roads. Thus, to preserve healthy ecosystems and keep people safe as human
populations continue to increase and climate change progresses, Caltrans has a responsibility to
design and implement transportation infrastructure that facilitates climate-wise wildlife
movement and habitat connectivity.
Thank you for the opportunity to submit comments on the California Transportation Plan
2050. Please add the Center to your notice list for all future updates to the California
Transportation Plan 2050. We look forward to working to assure that Caltrans integrates climate-
wise wildlife movement and habitat connectivity into California’s transportation infrastructure
design to safeguard the health and safety of both people and the natural environment. Please do
not hesitate to contact the Center with any questions at the number or email listed below.
Sincerely,
Tiffany Yap, D.Env/PhD
Scientist, Wildlife Corridor Advocate
Center for Biological Diversity
1212 Broadway, Suite 800
Oakland, California 94612
encl:
Appendices
Cited References

References
(provided on CD via FedEx)
Aguilar, R., Quesada, M., Ashworth, L., Herrerias‐Diego, Y. V. O. N. N. E., & Lobo, J. (2008).
Genetic consequences of habitat fragmentation in plant populations: susceptible signals in
plant traits and methodological approaches. Molecular Ecology, 17(24), 5177-5188.
Andersen, Z. J., Hvidberg, M., Jensen, S. S., Ketzel, M., Loft, S., Sørensen, M., ... & Raaschou-
Nielsen, O. (2011). Chronic obstructive pulmonary disease and long-term exposure to traffic-
related air pollution: a cohort study. American Journal of Respiratory and Critical Care
Medicine, 183(4), 455-461.
Ashland, A. (2014 June 6). Roadkill report: App helps Utah officials locate and minimize
wildlife collisions. Utah Public Radio. Available at: https://www.upr.org/post/roadkill-report-
app-helps-utah-officials-locate-and-minimize-wildlife-collisions
Benítez-López, A., Alkemade, R., & Verweij, P. A. (2010). The impacts of roads and other
infrastructure on mammal and bird populations: a meta-analysis. Biological
Conservation, 143(6), 1307-1316.
Bissonette, J. A., & Rosa, S. (2012). An evaluation of a mitigation strategy for deer-vehicle
collisions. Wildlife Biology, 18(4), 414-423.
Brehme, C. S., Hathaway, S. A., & Fisher, R. N. (2018). An objective road risk assessment
method for multiple species: ranking 166 reptiles and amphibians in California. Landscape
Ecology, 33(6), 911-935.
Caiazzo, F., Ashok, A., Waitz, I. A., Yim, S. H., & Barrett, S. R. (2013). Air pollution and early
deaths in the United States. Part I: Quantifying the impact of major sectors in
2005. Atmospheric Environment, 79, 198-208.
California Department of Transportation (Caltrans). (2014 June 13). Caltrans Improvement
Project Implementation Memo.
Caltrans. (2016). California Transportation Plan 2040.
Caltrans. (2018a). Caltrans Mission, Vision, Goals and Values. Available at:
http://www.dot.ca.gov/mission.html
Caltrans. (2018b). Caltrans and the California Department of Fish and Wildlife Urge Drivers to
be Alert during Watch Out for Wildlife Week. Press Release. Available at:
http://www.dot.ca.gov/paffairs/pr/2018/prs/18pr072.html
Caltrans. (2018c). Caltrans Releases First Climate Change Vulnerability Assessment. Press
Release. Available at: http://www.dot.ca.gov/paffairs/pr/2017/prs/17pr132.html

Caltrans. (2018d). Liberty Canyon Wildlife Habitat Connectivity Project. Initial Study with
Mitigated Negative Declaration/Environmental Assessment with Finding of No Significant
Impact.
California Department of Fish and Wildlife (CDFW). (2016). California State Wildlife Action
Plan.
Ceia-Hasse, A., Navarro, L. M., Borda-de-Água, L., & Pereira, H. M. (2018). Population
persistence in landscapes fragmented by roads: Disentangling isolation, mortality, and the
effect of dispersal. Ecological Modelling, 375, 45-53.
Chen, H., Kwong, J. C., Copes, R., Tu, K., Villeneuve, P. J., Van Donkelaar, A., ... & Wilton, A.
S. (2017). Living near major roads and the incidence of dementia, Parkinson's disease, and
multiple sclerosis: a population-based cohort study. The Lancet, 389(10070), 718-726.
Colorado Department of Transportation (CDOT). (2017). CO Highway 9 Wildlife Crossings
Monitoring – Progress Report.
Conniff, R. (2018 Dec 15). The Pedestrian Strikes Back. The New York Times. Available at:
https://www.nytimes.com/2018/12/15/opinion/sunday/cars-pedestrians-
cities.html?action=click&module=Opinion&pgtype=Homepage
Cushman, S. A., McRae, B., Adriaensen, F., Beier, P., Shirley, M., & Zeller, K. (2013).
Biological corridors and connectivity [Chapter 21]. In: Macdonald, DW; Willis, KJ, eds. Key
Topics in Conservation Biology 2. Hoboken, NJ: Wiley-Blackwell. p. 384-404.
Devictor, V., Whittaker, R. J., & Beltrame, C. (2010). Beyond scarcity: citizen science
programmes as useful tools for conservation biogeography. Diversity and
Distributions, 16(3), 354-362.
Diamond, T., Snyder A., Siepel N., & Robertson, M. (2015 September 30). Case Study:
Highway 17 Connectivity Project. Caltrans Road Ecology Meeting.
Dodd Jr, C. K., Barichivich, W. J., & Smith, L. L. (2004). Effectiveness of a barrier wall and
culverts in reducing wildlife mortality on a heavily traveled highway in Florida. Biological
Conservation, 118(5), 619-631.
Dodd, N. L., Gagnon, J. W., Boe, S., Ogren, K., & Schweinsburg, R. E. (2012). Wildlife-vehicle
collision mitigation for safer wildlife movement across highways: State Route 260 (No.
FHWA-AZ-12-603).
Donaldson, B. M., & Lafon, N. W. (2008). Testing an integrated PDA-GPS system to collect
standardized animal carcass removal data (No. FHWA/VTRC 08-CR10).

Donaldson, B. M. (2017). Improving Animal-Vehicle Collision Data for the Strategic
Application of Mitigation (No. FHWA/VTRC 18-R16). Virginia Transportation Research
Council.
Ewing, R., Schmid, T., Killingsworth, R., Zlot, A., & Raudenbush, S. (2008). Relationship
between urban sprawl and physical activity, obesity, and morbidity. In Urban Ecology (pp.
567-582). Springer, Boston, MA
Federal Highway Administration (FHWA). (2015). Highway Statistics Series California 2015.
Frumkin, H., Frank, L., & Jackson, R. J. (2004). Urban sprawl and public health: Designing,
planning, and building for healthy communities. Island Press
Gary, J. (2018 May 14). Caltrans plans to build $12M crossing for wildlife to travel safely under
Hwy 17. Fox KTVU. Available at: http://www.ktvu.com/news/caltrans-plans-to-build-12m-
crossing-for-wildlife-to-travel-safely-under-hwy-17
Goverde, M., Schweizer, K., Baur, B., & Erhardt, A. (2002). Small-scale habitat fragmentation
effects on pollinator behaviour: experimental evidence from the bumblebee Bombus
veteranus on calcareous grasslands. Biological Conservation, 104(3), 293-299.
Haddad, N. M., Brudvig, L. A., Clobert, J., Davies, K. F., Gonzalez, A., Holt, R. D., ... & Cook,
W. M. (2015). Habitat fragmentation and its lasting impact on Earth’s ecosystems. Science
Advances, 1(2), e1500052.
Kintsch, J., Cramer, P., Singer, P., Cowardin, M., & Phelan J. (2018). State Highway 9 Wildlife
Monitoring Year 2 Progress Report. Study Number 115.01
Lesbarreres, D., & Fahrig, L. (2012). Measures to reduce population fragmentation by roads:
what has worked and how do we know? Trends in Ecology & Evolution, 27(7), 374-380.
Leyden, K. M. (2003). Social capital and the built environment: the importance of walkable
neighborhoods. American Journal of Public Health, 93(9), 1546-1551.
Lin, S., Munsie, J. P., Hwang, S. A., Fitzgerald, E., & Cayo, M. R. (2002). Childhood asthma
hospitalization and residential exposure to state route traffic. Environmental research, 88(2),
73-81.
Loss, S. R., Will, T., & Marra, P. P. (2014). Estimation of bird‐vehicle collision mortality on US
roads. The Journal of Wildlife Management, 78(5), 763-771.
Marsh, D. M., & Jaeger, J. A. G. (2015). Direct effects of roads on small animal
populations. Roads and ecological infrastructure. Concepts and applications for small
animals. Johns Hopkins University Press, Baltimore, 42-56.

McCarthy, N. (2018 Feb 8). The cities where US drivers spend the most time stuck in traffic
[infographic]. Forbes. Available at:
https://www.forbes.com/sites/niallmccarthy/2018/02/08/the-cities-where-u-s-drivers-spend-
the-most-time-stuck-in-traffic-infographic/#7832c73616d8
Mendelsohn, M., Dexter, W., Olson, E., Weber, S. (2009). Vasco Road Wildlife Movement
Study Report.
Olson, D. D., Bissonette, J. A., Cramer, P. C., Green, A. D., Davis, S. T., Jackson, P. J., &
Coster, D. C. (2014). Monitoring wildlife-vehicle collisions in the information age: how
smartphones can improve data collection. PloS One, 9(6), e98613.
Périquet, S., Roxburgh, L., le Roux, A., & Collinson, W. J. (2018). Testing the Value of Citizen
Science for Roadkill Studies: A Case Study from South Africa. Frontiers in Ecology and
Evolution, 6, 15.
Riley, S. P., Pollinger, J. P., Sauvajot, R. M., York, E. C., Bromley, C., Fuller, T. K., & Wayne,
R. K. (2006). FAST‐TRACK: A southern California freeway is a physical and social barrier
to gene flow in carnivores. Molecular Ecology, 15(7), 1733-1741.
Ripple, W. J., Estes, J. A., Beschta, R. L., Wilmers, C. C., Ritchie, E. G., Hebblewhite, M., ... &
Schmitz, O. J. (2014). Status and ecological effects of the world’s largest
carnivores. Science, 343(6167), 1241484.
Sawaya, M. A., Kalinowski, S. T., & Clevenger, A. P. (2014). Genetic connectivity for two bear
species at wildlife crossing structures in Banff National Park. Proceedings of the Royal
Society B, 281(1780), 20131705.
Sawyer, H., Lebeau, C., & Hart, T. (2012). Mitigating roadway impacts to migratory mule
deer—a case study with underpasses and continuous fencing. Wildlife Society Bulletin, 36(3),
492-498.
Shilling, F.S., Waetjen, D., Harrold, K. (2017). Impact of wildlife-vehicle conflict on California
drivers and animals.
Shilling, F.S., Denney, C., Waetjen, D., Harrold, K., Farman, P., Perez, P. (2018). Impact of
wildlife-vehicle conflict on California drivers and animals.
State Farm Insurance Company. (2016). Deer Collision 2015-2016.
State Farm Insurance Company. (2018). Deer Collision 2017-2018.
Trombulak, S. C., & Frissell, C. A. (2000). Review of ecological effects of roads on terrestrial
and aquatic communities. Conservation Biology, 14(1), 18-30.
Valdes, M. (2018 December 12). Washington state builds bridge to keep wildlife off highway.
AP News. Available at: https://www.apnews.com/36755628e4c44fdabb01cb9599fa5aef
van der Ree, R., Jaeger, J. A., van der Grift, E. A., & Clevenger, A. P. (2011). Effects of roads
and traffic on wildlife populations and landscape function: road ecology is moving toward
larger scales. Ecology and Society, 16(1).
Vickers, T. W., Sanchez, J. N., Johnson, C. K., Morrison, S. A., Botta, R., Smith, T., ... & Boyce,
W. M. (2015). Survival and mortality of pumas (Puma concolor) in a fragmented, urbanizing
landscape. PloS One, 10(7), e0131490.
Waetjen, D. P., & Shilling, F. M. (2017). Large extent volunteer roadkill and wildlife
observation systems as sources of reliable data. Frontiers in Ecology and Evolution, 5, 89.

APPENDICES
File Description Attached Provided
on CD
APPENDIX 1
A1.1 Center for Biological Diversity PRA dated Aug
9, 2018
x
A1.2 Caltrans PRA Response dated Sept 14, 2018 x
A1.3 Caltrans carcass removal data (excel spreadsheet)
x
A1.4 Caltrans animal crash data 2010-2017 Summary x
A1.5 Caltrans animal crash data 2010-2017 Detail
x
A1.6 zip drive of Caltrans culverts
x
A1.7 zip drive of Caltrans culverts
x
A1.8 Caltrans animal crash data key
x
APPENDIX 2
A2.1 Contract between Caltrans and Western
Transport Institute (WTI) dated May 26, 2017
x
A2.2 WTI summary report on Caltrans carcass data
2001-2009
x
A2.3 WTI summary report on Caltrans animal crash
data 2005-2014
x
A2.4 Caltrans animal crash data 2005-2014 x
A2.5 WTI - Caltrans animal crash data 2005-2014
x
A2.6 WTI - Caltrans animal crash data key
x

APPENDIX A1.1


APPENDIX A1.2

September 14, 2018
CPRA Request Replies To: Center for Biological Diversity
Dear Mr. Buse,
As your request is currently stated, not all records in Caltrans’ possession are maintained or readily available in the
specific format(s) that you have requested. Some divisions do own reporting systems that work with your requested
formats, but not all. For any replies mentioned below that are not addressed in your specified format(s), please know
that Caltrans does not produce those requested records in the requested format(s). Moreover, those requested
electronic format(s) are not such that have been used by Caltrans to create copies of the subject records for its own use
or for provision to other agencies.
We are providing to you, the most current records noted from those Caltrans divisions deemed appropriate to address
this multi-faceted CPRA request. This letter summarizes what docs (or some links are provided below) are included.
Some of the docs attached to the CPRA system are too large to read/open; therefore, we will also copy them onto a
flash drive or disk to mail to you tomorrow. Your questions are below in bold black font; specific Caltrans divisions noted
in blue font; their replies in black font referencing links or documents attached to this response.
1. Any and all carcass/roadkill data from IMMS, TASAS/TSN, or in standalone databases (GIS or otherwise) maintained by Caltrans Headquarters and individual districts (which should include, among other things, data provided to or by WTI):
a. Spreadsheets – csv or Excel files – DRISI: Unfortunately, the TSN TSAR report is available only in pdf, text or doc format. Please see attached docs. It is not available in csv or Excel formats. Division of Maintenance: See attached Doc – 2018 Carcass CPRA; Sheet 1 contains ‘Legend’; Sheet 2 contains ‘Key’.
b. Spatial data – GIS layers (i.e., shapefiles) – DRISI: Currently there are no GIS layers for collision data in TSN.
c. Associated metadata for all files – DRISI: TSN uses collision data from CHP’s SWITRS database; see TSAR reference card.
2. Locations of current maintained bridges, underpasses, and culverts:
a. Spatial data – GIS layers (i.e., shapefiles) – DRISI: See link to the Caltrans GIS Library – regarding bridges:
http://www.dot.ca.gov/hq/tsip/gis/datalibrary/Metadata/Bridges.html
Division of Maintenance:
See attachment(s) - Culverts data to June 2018; Bridges data Excel file - April 1, 2017
Also from Structure, Maintenance & Investigations – Bridges reporting: US.DOT-FHWA – 2017;
See - https://www.fhwa.dot.gov/bridge/nbi/ascii.cfm
b. Associated metadata for all files – captured within; no additional keys. 3. Traffic volume data:
a. Spatial data – GIS layers (i.e., shapefiles) – DRISI: See link to the Caltrans GIS Library – regarding traffic volumes
http://www.dot.ca.gov/hq/tsip/gis/datalibrary/Metadata/AADT.html
Division of Traffic Operations:
See shapefiles Traffic Volumes (Vehicle and Truck) on Caltrans GIS Data Library
b. Associated metadata for all files – captured within; no additional keys.
4. Contract between Caltrans and WTI:
a. For the hotspot analysis project for large mammal-vehicle collisions in California – Division of Environmental Services:
See attachment including seven (7) docs of reporting, and this link is provided for you here:
• GIS – Critical Habitat. See link in Data Basin for CH-Region 8. Select CA records within the downloaded file > https://psw.databasin.org/datasets/0185da5b1b0048cebef752f26c241e99
• Click on "view record" in link above and download the zip file that is lower on the linked page.
Denise Delaney Division of Research, Innovation and System Information (DRISI)

APPENDIX A1.4

file:///M|/...ll%20PRA%20Response%20Sep%202018/A_Q%231%20Reply%20from%20DRISI%20Animal%20Hits2010-2017summary.txt[12/19/2018 4:08:26 PM]
California Department of Transportation
OTM22215
TSAR - ACCIDENT SUMMARY
Policy controlling the use of Traffic Accident Surveillance and Analysis System (TASAS) - Transportation Systems Network (TSN) Reports
1. TASAS - TSN has officially replaced the TASAS - "Legacy" database.
2. Reports from TSN are to be used and interpreted by the California Department of Transportation (Caltrans) officials or authorized representative.
3. Electronic versions of these reports may be emailed between Caltrans' employees only using the State computer system.
4. The contents of these reports shall be considered confidential and may be privileged pursuant to 23 U.S.C. Section 409, and are for the sole use of the intended recipient(s). Any unauthorized review, use, disclosure or distribution is prohibited. If you are not the intended recipient, please contact the sender by reply e-mail and destroy all copies of the original message. Do not print, copy o
California Department of Transportation
OTM22215
TSAR - ACCIDENT SUMMARY

file:///M|/...ll%20PRA%20Response%20Sep%202018/A_Q%231%20Reply%20from%20DRISI%20Animal%20Hits2010-2017summary.txt[12/19/2018 4:08:26 PM]
REPORT PARAMETERS:
REPORT DATE : 07/16/2018 REFERENCE DATE : 07/16/2018
SUBMITTOR : TRBDOMSI
REPORT TITLE : ' Animal hits ' EVENT ID : 4026444
LOCATION CRITERIA: Statewide Report
SELECTION CRITERIA:
1 1 AND 600 - PARTY TYPE IN W,X,Z
Accidents Date Range:
From -- 01/01/2010 To -- 12/31/2017OTM22215 Page#107/16/2018 TASAS SELECTIVE RECORD RETRIEVAL Event 402644408:14 AM TSAR - ACCIDENT SUMMARY ID ' Animal hits '
TOTAL PERSONS MOTOR VEHICLES INVOLVED <---LINES CODED---> ACCIDENTS FATAL INJURY PDO KILLED INJURED NUMBER PCT CODE NUMBER PCT CODE 9087 25 1097 7965 30 1322 8871 97.6 1 3 0.0 1 181 2.0 2 8851 97.4 2 22 0.2 3 189 2.1 3 7 0.1 >3 36 0.4 4 4 0.0 5 1 0.0 6 3 0.0 7 0 0.0 8 0 0.0 9
<---- HOUR OF DAY ----> <--- ACCESS CONTROL ---> <--- SIDE OF HIGHWAY ---> NUMBER PCT CODE NUMBER PCT CODE NUMBER PCT CODE
306 3.4 00- 12 MID. 4220 46.4 C-CONVENTIONAL 2855 31.4 N-NORTHBOUND

file:///M|/...ll%20PRA%20Response%20Sep%202018/A_Q%231%20Reply%20from%20DRISI%20Animal%20Hits2010-2017summary.txt[12/19/2018 4:08:26 PM]
269 3.0 01- 1 A.M. 1766 19.4 E-EXPRESSWAY 2803 30.8 S-SOUTHBOUND 265 2.9 02- 2 A.M. 3100 34.1 F-FREEWAY 1720 18.9 E-EASTBOUND 252 2.8 03- 3 A.M. 1 0.0 S-1-WAY CITY ST 1709 18.8 W-WESTBOUND 283 3.1 04- 4 A.M. 0 0.0 --INVALID DATA 454 5.0 05- 5 A.M. 0 0.0 +-NO DATA 513 5.6 06- 6 A.M. 375 4.1 07- 7 A.M. 355 3.9 08- 8 A.M. 302 3.3 09- 9 A.M. 287 3.2 10- 10 A.M. <----- YEAR -----> <----- MONTH -----> <---- DAY OF WEEK ----> 234 2.6 11- 11 A.M. NUMBER PCT CODE NUMBER PCT CODE NUMBER PCT CODE 175 1.9 12- 12 NOON 162 1.8 13- 1 P.M. 0 0.0 2006 510 5.6 01-JANUARY 1415 15.6 1-SUNDAY 140 1.5 14- 2 P.M. 0 0.0 2007 416 4.6 02-FEBRUARY 1275 14.0 2-MONDAY 173 1.9 15- 3 P.M. 0 0.0 2008 420 4.6 03-MARCH 1265 13.9 3-TUESDAY 219 2.4 16- 4 P.M. 0 0.0 2009 604 6.6 04-APRIL 1222 13.4 4-WEDNESDAY 456 5.0 17- 5 P.M. 972 10.7 2010 829 9.1 05-MAY 1243 13.7 5-THURSDAY 565 6.2 18- 6 P.M. 1056 11.6 2011 814 9.0 06-JUNE 1296 14.3 6-FRIDAY 617 6.8 19- 7 P.M. 1108 12.2 2012 828 9.1 07-JULY 1371 15.1 7-SATURDAY 909 10.0 20- 8 P.M. 1182 13.0 2013 772 8.5 08-AUGUST 842 9.3 21- 9 P.M. 1102 12.1 2014 950 10.5 09-SEPTEMBER 522 5.7 22- 10 P.M. 1172 12.9 2015 1152 12.7 10-OCTOBER 402 4.4 23- 11 P.M. 1229 13.5 2016 1119 12.3 11-NOVEMBER 10 0.1 25- UNKNOWN 1266 13.9 2017 673 7.4 12-DECEMBEROTM22215 Page#207/16/2018 TASAS SELECTIVE RECORD RETRIEVAL Event 402644408:14 AM TSAR - ACCIDENT SUMMARY ID ' Animal hits '
<-- PRIMARY COLLISION FACTOR --> <--- TYPE OF COLLISION ---> <--- ROADWAY CONDITION ---> NUMBER PCT CODE NUMBER PCT CODE NUMBER PCT CODE 18 0.2 1-INFLUENCE ALCOHOL 5 0.1 2-FOLLOW TOO CLOSE 101 1.1 A-HEAD-ON 8 0.1 A-HOLES, RUTS 4 0.0 3-FAILURE TO YIELD 31 0.3 B-SIDESWIPE 1 0.0 B-LOOSE MATERIAL 110 1.2 4-IMPROPER TURN 20 0.2 C-REAR END 87 1.0 C-OBSTRUCTION ON ROA 333 3.7 5-SPEEDING 109 1.2 D-BROADSIDE 49 0.5 D-CONSTRUCT-REPAIR-ZONE 39 0.4 6-OTHER VIOLATIONS 2984 32.8 E-HIT OBJECT 0 0.0 E-REDUCED ROAD WIDTH 2 0.0 B-IMPROPER DRIVING 40 0.4 F-OVERTURN 0 0.0 F-FLOODED 8469 93.2 C-OTHER THAN DRIVER 13 0.1 G-AUTO-PEDESTRIAN 24 0.3 G-OTHER 34 0.4 D-UNKNOWN 5750 63.3 H-OTHER 8882 97.7 H-NO UNUSUAL CONDITION 0 0.0 E-FELL SLEEP 39 0.4 <-NOT STATED 36 0.4 <-NOT STATED 73 0.8 <-NOT STATED 0 0.0 -INVALID CODES 0 0.0 -INVALID CODES 0 0.0 -INVALID CODES

file:///M|/...ll%20PRA%20Response%20Sep%202018/A_Q%231%20Reply%20from%20DRISI%20Animal%20Hits2010-2017summary.txt[12/19/2018 4:08:26 PM]
<--------- WEATHER ---------> <------------ LIGHTING ------------> <----- ROAD SURFACE -----> NUMBER PCT CODE NUMBER PCT CODE NUMBER PCT CODE
7243 79.7 A-CLEAR 2964 32.6 A-DAY LIGHT 8469 93.2 A-DRY 1469 16.2 B-CLOUDY 564 6.2 B-DUSK/DAWN 576 6.3 B-WET 218 2.4 C-RAINING 670 7.4 C-DARK-STREET LIGHT 9 0.1 C-SNOWY, ICY 10 0.1 D-SNOWING 4820 53.0 D-DARK-NO STREET LIGHT 0 0.0 D-SLIPPERY 101 1.1 E-FOG 38 0.4 E-DARK-INOPR STREET LIGHT 33 0.4 <-NOT STATED 6 0.1 F-OTHER 0 0.0 F-DARK-NOT STATED 0 0.0 -INVALID CODE 1 0.0 G-WIND 31 0.3 <-NOT STATED 39 0.4 <-NOT STATED 0 0.0 -INVALID CODES 0 0.0 -INVALID CODES
<------ RIGHT OF WAY CONTROL ------> <-------- HIGHWAY GROUP --------> <- INTERSECTION/RAMP ACCIDENT LOCATION -> NUMBER PCT CODE NUMBER PCT CODE NUMBER PCT CODE
326 3.6 A-CONTROL FUNCTIONING 119 1.3 R-IND. ALIGN RIGHT 5 0.1 1-RAMP INTERSECTION (EXIT) 2 0.0 B-CONTROL NOT FUNCTIONING 122 1.3 L-IND. ALIGN LEFT 129 1.4 2-RAMP 2 0.0 C-CONTROLS OBSCURED 4397 48.4 D-DIVIDED 7 0.1 3-RAMP ENTRY 8735 96.1 D-NO CONTROLS PRESENT 4449 49.0 U-UNDIVIDED 11 0.1 4-RAMP AREA, INTERSECTION 22 0.2 <-NOT STATED 66 0.7 5-IN INTERSECTION 0 0.0 -INVALID CODES 9 0.1 6-OUTSIDE INTRSCT-NONSTATE 8860 97.5 --DOES NOT APPLYOTM22215 Page#307/16/2018 TASAS SELECTIVE RECORD RETRIEVAL Event 402644408:14 AM TSAR - PARTY SUMMARY ID ' Animal hits '
<------------ PARTY TYPE ------------> <- MOVEMENT PRECEDING COLLISION -> <---- OTHER ASSOCIATED FACTORS ----> #1 #2
NUMBER PCT CODE NUMBER PCT CODE NUMBER PCT NUMBER PCT CODE 6999 77.0 A-PASNGR CAR/STA WAGON 31 0.3 A-STOPPED 3 0.0 0 0.0 1-INFLUENCE ALCOHOL 11 0.1 B-PASNGR CAR W/TRAILER 8773 96.5 B-PROCEDED STRAIGHT 6 0.1 0 0.0 2-FOLLOW TOO CLOSE 398 4.4 C-MOTORCYCLE 46 0.5 C-RAN OFF ROAD 0 0.0 0 0.0 3-FAILURE TO YIELD

file:///M|/...ll%20PRA%20Response%20Sep%202018/A_Q%231%20Reply%20from%20DRISI%20Animal%20Hits2010-2017summary.txt[12/19/2018 4:08:26 PM]
1000 11.0 D-PICKUP/PANEL TRUCK 4 0.0 D-MAKING RIGHT TURN 20 0.2 0 0.0 4-IMPROPER TURN 52 0.6 E-PICKUP/PANEL W/TRAILER 3 0.0 E-MAKING LEFT TURN 28 0.3 0 0.0 5-SPEEDING 40 0.4 F-TRUCK/TRUCK TRACTOR 0 0.0 F-MAKING U TURN 14 0.2 0 0.0 6-OTHER VIOLATIONS 185 2.0 G-TRUCK/TRACTOR & 1 TRAILER 0 0.0 G-BACKING 28 0.3 0 0.0 A-CELL PHONE* (INATTN) 21 0.2 2-TRUCK/TRACTOR & 2 TRAILER 149 1.6 H-SLOWING, STOPPING 0 0.0 0 0.0 B-ELECTRC EQUIP*(INATTN) 0 0.0 3-TRUCK/TRACTOR & 3 TRAILER 13 0.1 I-PASS OTHER VEHICLE 0 0.0 0 0.0 C-RADIO/CD/HDPHN*(INATTN) 0 0.0 4-SINGLE UNIT TANKER 39 0.4 J-CHANGING LANES 0 0.0 0 0.0 D-SMOKING* (INATTN) 2 0.0 5-TRUCK/TRA & 1 TANK TRALR 0 0.0 K-PARKING 10 0.1 0 0.0 E-VISION OBSCUREMENT 2 0.0 6-TRUCK/TRA & 2 TANK TRALR 1 0.0 L-ENTER FROM SHLDR 15 0.2 0 0.0 F-INATTENTION - OTHER 12 0.1 H-SCHOOL BUS 34 0.4 M-OTHER UNSAFE TURN 2 0.0 0 0.0 G-STOP & GO TRAFFIC 22 0.2 I-OTHER BUS 13 0.1 N-CROSS INTO OPP LN 26 0.3 3 0.0 H-ENTER/LEAVE RAMP 377 4.1 J-EMERGENCY VEHICLE 4 0.0 O-PARKED 45 0.5 1 0.0 I-PREVIOUS COLLISION 0 0.0 K-HIGHWAY CONST EQUP.** 2 0.0 P-MERGING 3 0.0 0 0.0 J-UNFAMILIAR WITH ROAD 3 0.0 L-BICYCLE 0 0.0 Q-TRAVEL WRONG WAY 0 0.0 0 0.0 K-DEFECT VEHICLE EQUIP 44 0.5 M-OTHER-MOTOR VEH 40 0.4 R-OTHER 11 0.1 0 0.0 L-UNINVOLVED VEHICLE 11 0.1 N-OTHER-NON-MOTOR VEH 31 0.3 <-NOT STATED 38 0.4 2 0.0 M-OTHER 1 0.0 O-SPILLED LOADS 8864 97.5 15 0.2 N-NONE APPARENT 2 0.0 P-DISENGAGED TOW 1 0.0 0 0.0 P-WIND 0 0.0 Q-UNINVOLVED VEHICLE PEDESTRIAN 0 0.0 0 0.0 R-RAMP ACCIDENT 0 0.0 R-MOPED 14 0.2 0 0.0 S-RUNAWAY VEHICLE 0 0.0 T-TRAIN 1 0.0 2- XING XWALK - INTRST 0 0.0 0 0.0 T-EATING* (INATTN) 17 0.2 U-PEDESTRIAN 0 0.0 3- XING XWALK - NOT INTR 0 0.0 0 0.0 U-CHILDREN* (INATTN) 1 0.0 V-DISMOUNT PEDESTRIAN 3 0.0 4- XING NOT XWALK 0 0.0 0 0.0 V-ANIMALS* (INATTN) 826 9.1 W-ANIMAL - LIVESTOCK 9 0.1 5- ROADWAY - INCL SHLDR 0 0.0 0 0.0 W-PERSNL HYGIENE*(INATTN) 6096 67.1 X-ANIMAL - DEER 0 0.0 6- NOT IN ROADWAY 0 0.0 0 0.0 X-READING* (INATTN) 2165 23.8 Z-ANIMAL - OTHER 0 0.0 7- APRH-LEAVE SCHL BUS 9069 99.8 9087 100.0 <-NOT STATED 1244 13.7 - INVALID CODES 1 0.0 1 0.0 --DOES NOT APPLY
<---- DIRECTION OF TRAVEL ----> <---- SPECIAL INFORMATION ----> * INATTENTION CODES EFF. 01-01-01
NUMBER PCT CODE NUMBER PCT CODE

file:///M|/...ll%20PRA%20Response%20Sep%202018/A_Q%231%20Reply%20from%20DRISI%20Animal%20Hits2010-2017summary.txt[12/19/2018 4:08:26 PM]
2873 31.6 N-N, NE, NW BOUND 2 0.0 A-HAZARDOUS MATERIALS 2847 31.3 S-S, SE, SW BOUND 81 0.9 B-CELL PHONE IN USE* 1722 19.0 E-EASTBOUND 8921 98.2 C-CELL PHONE NOT IN USE* 1717 18.9 W-WESTBOUND 2 0.0 D-CELL PHONE NONE/UNKNOWN* 9076 99.9 <-NOT STATED 9064 99.7 <-NOT STATED 0 0.0 --DOES NOT APPLY 10 0.1 --DOES NOT APPLY 0 0.0 -INVALID CODES 0 0.0 -INVALID CODES
* SPECIAL INFORMATION CODES EFF. 04-01-01 ** INCLUDES EQUIPMENT ENGAGED IN CONST/MAINT ACTIVITIES AS OF 00-02-22OTM22215 Page#407/16/2018 TASAS SELECTIVE RECORD RETRIEVAL Event 402644408:14 AM TSAR - PARTY SUMMARY ID ' Animal hits '
<------------------- OBJECT STRUCK -------------------> PRIMARY OTHERS <------ LOCATION OF COLLISION ------> NUMBER PCT NUMBER PCT CODE PRIMARY OTHERS NUMBER PCT NUMBER PCT CODE 1 0.0 7 0.1 01-SIDE OF BRIDGE RAILING 0 0.0 0 0.0 02-END OF BRIDGE RAILING 5 0.1 10 0.1 A-BEYOND MEDIAN OR STRIPE-LEFT 0 0.0 0 0.0 03-PIER, COLUMN, ABUTMENT 38 0.4 135 1.5 B-BEYOND SHLDER DRIVERS LEFT 0 0.0 0 0.0 04-BOTTOM OF STRUCTURE 5 0.1 3 0.0 C-LEFT SHOULDER AREA 0 0.0 0 0.0 05-BRIDGE END POST IN GORE 1972 21.7 109 1.2 D-LEFT LANE 2 0.0 5 0.1 06-END OF GUARD RAIL 569 6.3 38 0.4 E-INTERIOR LANES 0 0.0 0 0.0 07-BRIDGE APPROACH GUARD RAIL 6392 70.3 399 4.4 F-RIGHT LANE 0 0.0 2 0.0 10-LIGHT OR SIGNAL POLE 15 0.2 25 0.3 G-RIGHT SHOULDER AREA 1 0.0 5 0.1 11-UTILITY POLE 58 0.6 259 2.9 H-BEYOND SHLDER DRIVERS RIGHT 1 0.0 3 0.0 12-POLE (TYPE NOT STATED) 1 0.0 0 0.0 I-GORE AREA 6 0.1 24 0.3 13-TRAFFIC SIGN/SIGN POST 9 0.1 0 0.0 J-OTHER 0 0.0 0 0.0 14-OTHER SIGNS NOT TRAFFIC 25 0.3 6 0.1 V-HOV LANE(S) 4 0.0 29 0.3 15-GUARDRAIL 1 0.0 0 0.0 W-HOV LANE BUFFER AREA 9 0.1 43 0.5 16-MEDIAN BARRIER 1182 13.0 18 0.2 <-NOT STATED 0 0.0 3 0.0 17-WALL (EXCEPT SOUND WALL) 7793 85.8 9087 100.0 --DOES NOT APPLY 3 0.0 14 0.2 18-DIKE OR CURB 0 0.0 0 0.0 -INVALID CODES 0 0.0 0 0.2 19-TRAFFIC ISLAND 0 0.0 0 0.0 20-RAISED BARS 0 0.0 2 0.0 21-CONCRETE OBJ (HDWL, D.I.) 1 0.0 19 0.2 22-GUIDEPOST, CULVERT, PM 9 0.1 50 0.6 23-CUT SLOPE OR EMBANKMENT 12 0.1 62 0.7 24-OVER EMBANKMENT 0 0.0 3 0.0 25-IN WATER <------ DRUG/PHYSICAL ------> 5 0.1 20 0.2 26-DRAINAGE DITCH PRIMARY OTHERS 6 0.1 52 0.6 27-FENCE NUMBER PCT NUMBER PCT CODE 3 0.0 50 0.6 28-TREES 2 0.0 11 0.1 29-PLANTS 8897 97.9 0 0.0 A-HAD NOT BEEN DRINKING 0 0.0 0 0.0 30-SOUND WALL 32 0.4 0 0.0 B-HBD - UNDER INFLUENCE

file:///M|/...ll%20PRA%20Response%20Sep%202018/A_Q%231%20Reply%20from%20DRISI%20Animal%20Hits2010-2017summary.txt[12/19/2018 4:08:26 PM]
1 0.0 0 0.0 40-NATURAL MATRL ON ROAD 33 0.4 0 0.0 C-HBD - NOT UNDER INFLUENCE 1 0.0 1 0.0 41-TEMP BARRICADES, CONES 11 0.1 0 0.0 D-HBD - IMPAIRMENT UNKNOWN 2 0.0 3 0.0 42-OTHER OBJECT ON ROAD 0 0.0 6 0.1 E-UNDER DRUG INFLUENCE 6 0.1 17 0.2 43-OTHER OBJECT OFF ROAD 0 0.0 1 0.0 F-OTHER PHYSICAL IMPAIRMENT 22 0.2 461 5.1 44-OVERTURNED 106 1.2 0 0.0 G-IMPAIRMENT NOT KNOWN 0 0.0 0 0.0 45-CRASH CUSHION (SAND) 23 0.3 0 0.0 H-NOT APPLICABLE 0 0.0 1 0.0 46-CRASH CUSHION (OTHER) 0 0.0 3 0.0 I-FATIGUE 1 0.0 1 0.0 51-CALL BOX 9068 99.8 9086 100.0 < NOT STATED 0 0.0 1 0.0 98-UNKNOWN OBJECT STRUCK 0 0.0 0 0.0 --DOES NOT APPLY 4 0.0 3 0.0 99- NO OBJECT INVOLVED 0 0.0 0 0.0 -INVALID CODES 8986 98.9 218 2.4 V1 THRU V9 VEHICLE 1 TO 9 2 0.0 1 0.0 << NOT STATED 2243 24.7 9087 100.0 -- DOES NOT APPLY 0 0.0 0 0.0 - INVALID CODES

APPENDIX A2.1


APPENDIX A2.2
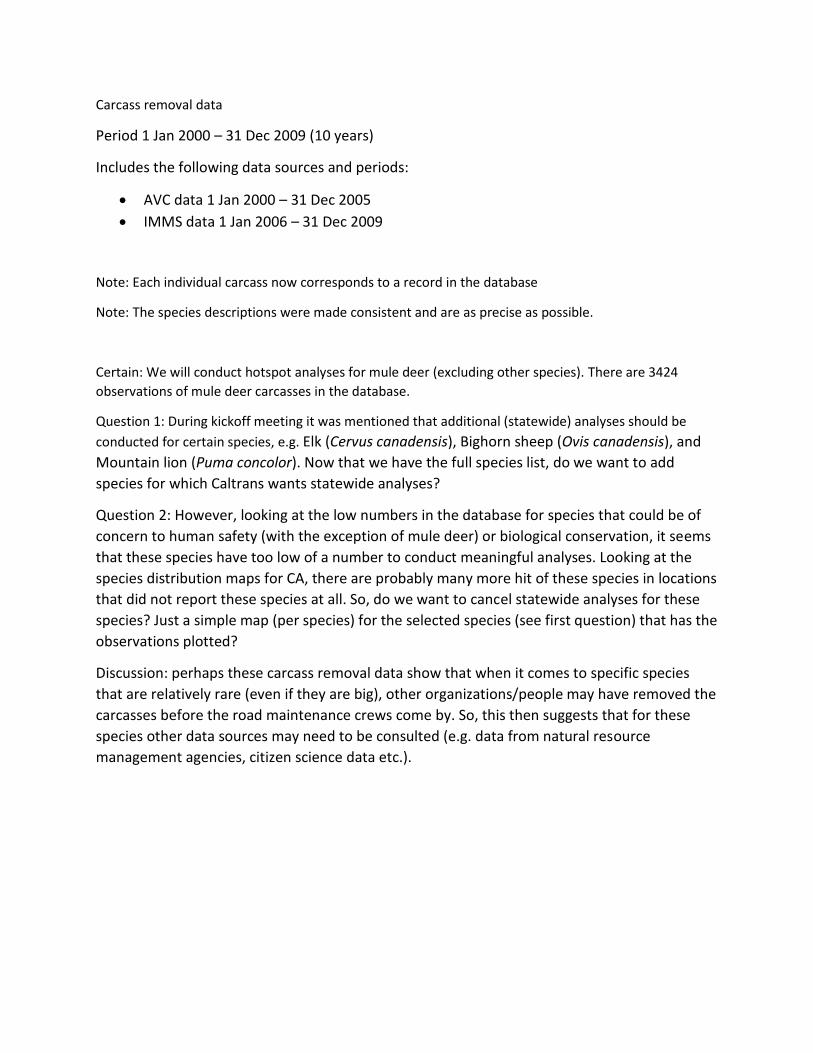
Carcass removal data
Period 1 Jan 2000 – 31 Dec 2009 (10 years)
Includes the following data sources and periods:
• AVC data 1 Jan 2000 – 31 Dec 2005
• IMMS data 1 Jan 2006 – 31 Dec 2009
Note: Each individual carcass now corresponds to a record in the database
Note: The species descriptions were made consistent and are as precise as possible.
Certain: We will conduct hotspot analyses for mule deer (excluding other species). There are 3424
observations of mule deer carcasses in the database.
Question 1: During kickoff meeting it was mentioned that additional (statewide) analyses should be
conducted for certain species, e.g. Elk (Cervus canadensis), Bighorn sheep (Ovis canadensis), and
Mountain lion (Puma concolor). Now that we have the full species list, do we want to add
species for which Caltrans wants statewide analyses?
Question 2: However, looking at the low numbers in the database for species that could be of
concern to human safety (with the exception of mule deer) or biological conservation, it seems
that these species have too low of a number to conduct meaningful analyses. Looking at the
species distribution maps for CA, there are probably many more hit of these species in locations
that did not report these species at all. So, do we want to cancel statewide analyses for these
species? Just a simple map (per species) for the selected species (see first question) that has the
observations plotted?
Discussion: perhaps these carcass removal data show that when it comes to specific species
that are relatively rare (even if they are big), other organizations/people may have removed the
carcasses before the road maintenance crews come by. So, this then suggests that for these
species other data sources may need to be consulted (e.g. data from natural resource
management agencies, citizen science data etc.).

Table A. Species reported in carcass removal database 2000-2009.
Species ID by Marcel Total 2000 2001 2002 2003 2004 2005 2006 2007 2008 2009
Mule deer (Odocoileus hemionus) 3424 357 123 833 487 462 142 155 287 321 257 Unknown 743
7
201 207 176 152
Raccoon (Procyon lotor) 315 24 5 13 17 18 9 14 37 104 74 Coyote (Canis latrans) 211 28 2 25 29 29 12 6 11 18 51 Virginia opossum (Didelphis
virginiana)
99 14 2 17 16 8 14 3 6 13 6 Skunk sp. 88 10
4 5 3 8 6 16 21 15
Bird 65 8 1 7 3 8 34
3 1
Black bear (Ursus americanus) 50
20
7
2 13 5 3 Fox sp. 22 6
2 1
1 6 4 2
Rabbit sp. 21
2 9 8 2 Bobcat (Lynx rufus) 20 5
2 5 2 1
1 1 3
Rabbit or hare sp. 18 6
3 2 2 5
Elk (Cervus canadensis) 17
2 1 5
3 4 2 Squirrel sp. 5 1
1
2
1
Gray fox (Urocyon cinereoargenteus) 4 2 1
1
Mammal sp. 4
1 2 1
Mountain lion (Puma concolor) 4
1 2
1
American badger (Taxidea taxus) 3
3 Red fox (Vulpes vulpes) 3
2 1
Wild boar (Sus scrofa) 3
3 Jack rabbit (Lepus sp.) 2
1 1
Bighorn sheep (Ovis canadensis) 1
1
Kit fox (Vulpes macrotis) 1 1
River otter (Lontra canadensis) 1
1
Pronghorn (Antilocapra americana) 1
1
5125 462 135 937 568 547 228 390 602 682 574
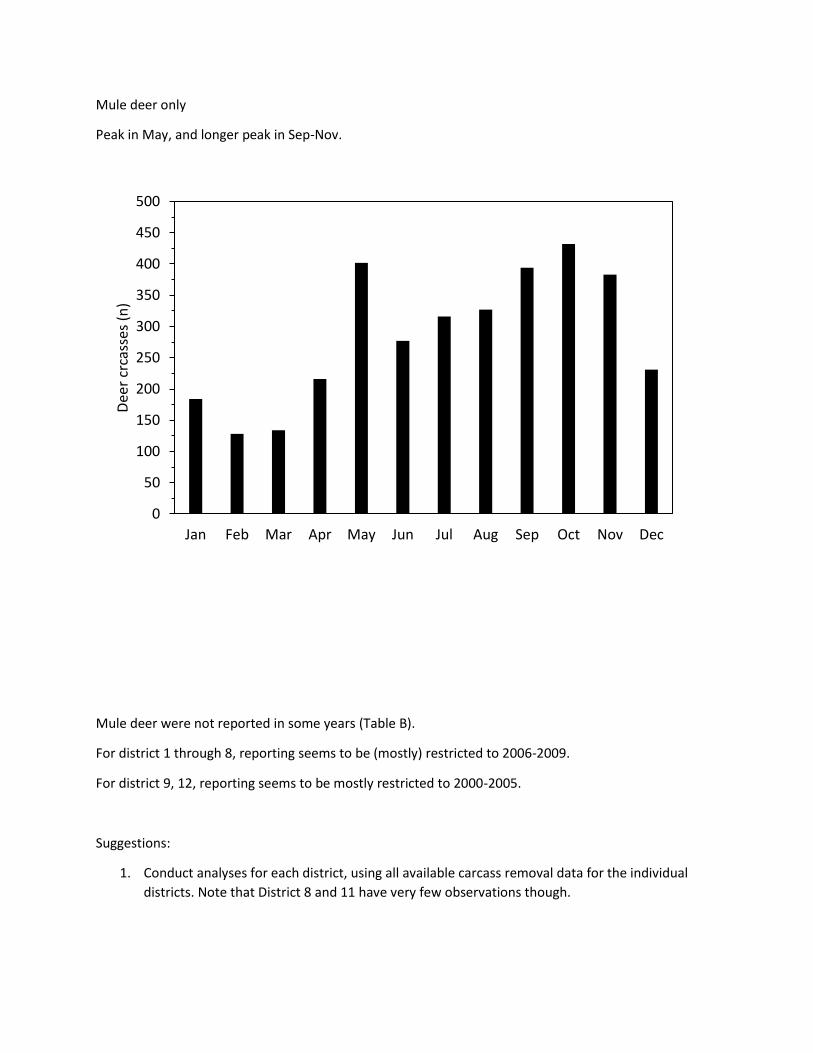
Mule deer only
Peak in May, and longer peak in Sep-Nov.
Mule deer were not reported in some years (Table B).
For district 1 through 8, reporting seems to be (mostly) restricted to 2006-2009.
For district 9, 12, reporting seems to be mostly restricted to 2000-2005.
Suggestions:
1. Conduct analyses for each district, using all available carcass removal data for the individual
districts. Note that District 8 and 11 have very few observations though.
0
50
100
150
200
250
300
350
400
450
500
Jan Feb Mar Apr May Jun Jul Aug Sep Oct Nov Dec
Dee
r cr
cass
es (
n)

2. Do not conduct state-wide analyses… If you do, you would need huge correction factors that are
questionable to begin with. It is better to conduct state-wide analyses only with the deer crash
data (and forego the state-wide analyses with deer carcass removal data).
Discussion: Not all districts seem to report deer carcasses, at least not with the same level of effort. In
addition, within each district, the search and reporting level seems to vary substantially. If the purpose
of collecting the carcass data is to be able to identify carcass hotspots, then this suggests that more
attention needs to be given to report carcasses with similar search and reporting effort between years
as well as between districts.
Table B. Deer carcasses reported per district per year.
District Total Of Count <> 2000 2001 2002 2003 2004 2005 2006 2007 2008 2009
1 230 15 10 18 41 71 37 38
2 202 175 3 14 10
3 9 1 3 1 4
4 367 40 83 135 109
5 32 11 12 6 3
6 58 2 1 4 14 22 15
7 14 6 1 3 4
8 5 2 2 1
9 670 95 35 140 127 157 115 1
10 1746 222 73 487 347 290 13 48 95 99 72
11 3 1 1 1
12 88 24 5 11 12 15 14 2 1 3 1
3424 357 123 833 487 462 142 155 287 321 257

APPENDIX A2.3
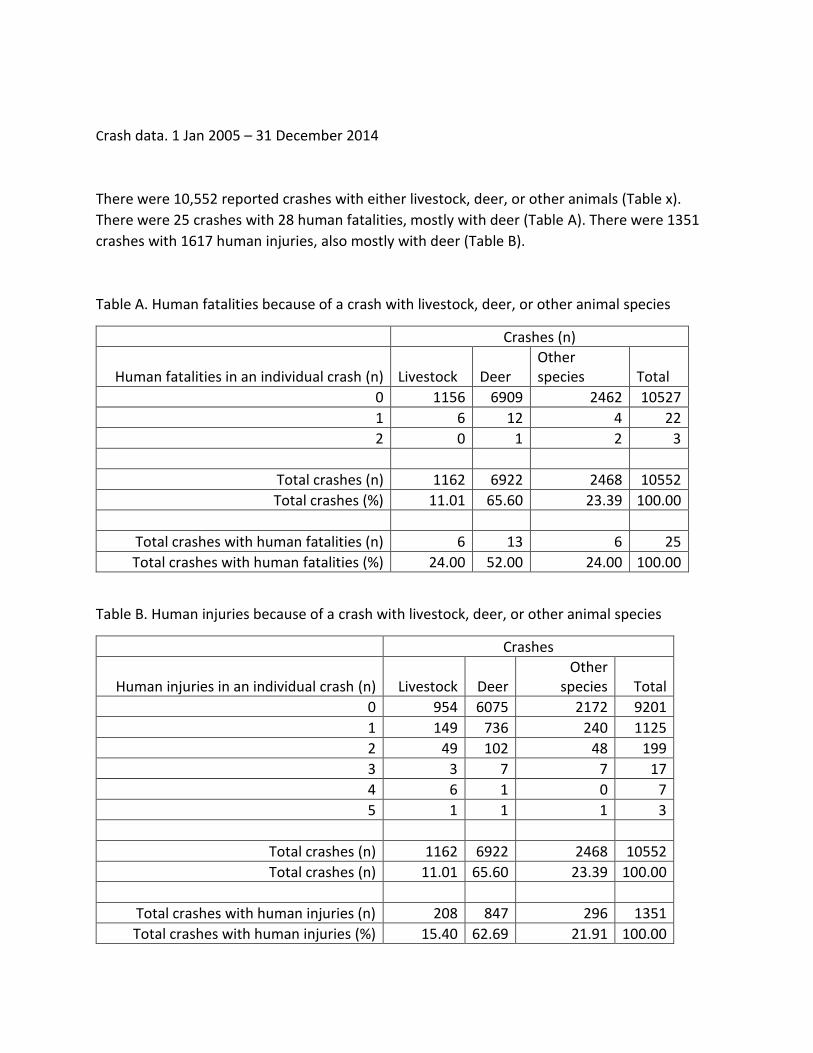
Crash data. 1 Jan 2005 – 31 December 2014
There were 10,552 reported crashes with either livestock, deer, or other animals (Table x).
There were 25 crashes with 28 human fatalities, mostly with deer (Table A). There were 1351
crashes with 1617 human injuries, also mostly with deer (Table B).
Table A. Human fatalities because of a crash with livestock, deer, or other animal species
Crashes (n)
Human fatalities in an individual crash (n) Livestock Deer Other species Total
0 1156 6909 2462 10527
1 6 12 4 22
2 0 1 2 3
Total crashes (n) 1162 6922 2468 10552
Total crashes (%) 11.01 65.60 23.39 100.00
Total crashes with human fatalities (n) 6 13 6 25
Total crashes with human fatalities (%) 24.00 52.00 24.00 100.00
Table B. Human injuries because of a crash with livestock, deer, or other animal species
Crashes
Human injuries in an individual crash (n) Livestock Deer Other
species Total
0 954 6075 2172 9201
1 149 736 240 1125
2 49 102 48 199
3 3 7 7 17
4 6 1 0 7
5 1 1 1 3
Total crashes (n) 1162 6922 2468 10552
Total crashes (n) 11.01 65.60 23.39 100.00
Total crashes with human injuries (n) 208 847 296 1351
Total crashes with human injuries (%) 15.40 62.69 21.91 100.00
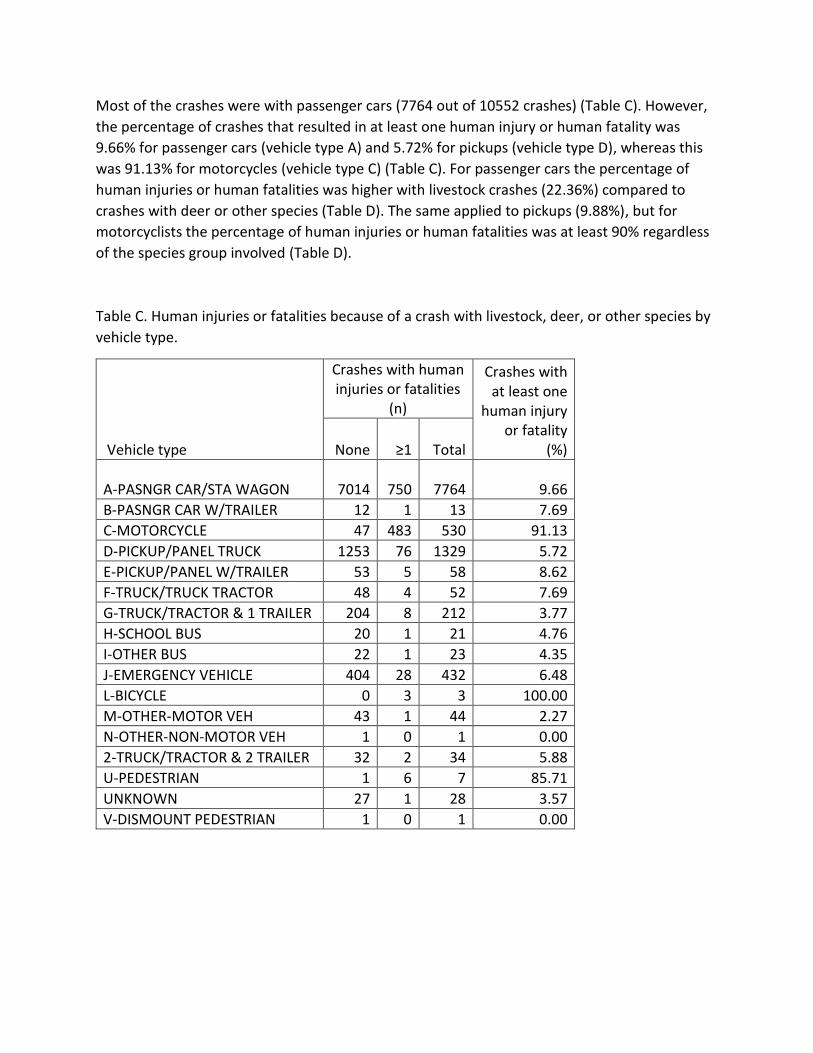
Most of the crashes were with passenger cars (7764 out of 10552 crashes) (Table C). However,
the percentage of crashes that resulted in at least one human injury or human fatality was
9.66% for passenger cars (vehicle type A) and 5.72% for pickups (vehicle type D), whereas this
was 91.13% for motorcycles (vehicle type C) (Table C). For passenger cars the percentage of
human injuries or human fatalities was higher with livestock crashes (22.36%) compared to
crashes with deer or other species (Table D). The same applied to pickups (9.88%), but for
motorcyclists the percentage of human injuries or human fatalities was at least 90% regardless
of the species group involved (Table D).
Table C. Human injuries or fatalities because of a crash with livestock, deer, or other species by
vehicle type.
Vehicle type
Crashes with human injuries or fatalities
(n)
Crashes with at least one
human injury or fatality
(%) None ≥1 Total
A-PASNGR CAR/STA WAGON 7014 750 7764 9.66
B-PASNGR CAR W/TRAILER 12 1 13 7.69
C-MOTORCYCLE 47 483 530 91.13
D-PICKUP/PANEL TRUCK 1253 76 1329 5.72
E-PICKUP/PANEL W/TRAILER 53 5 58 8.62
F-TRUCK/TRUCK TRACTOR 48 4 52 7.69
G-TRUCK/TRACTOR & 1 TRAILER 204 8 212 3.77
H-SCHOOL BUS 20 1 21 4.76
I-OTHER BUS 22 1 23 4.35
J-EMERGENCY VEHICLE 404 28 432 6.48
L-BICYCLE 0 3 3 100.00
M-OTHER-MOTOR VEH 43 1 44 2.27
N-OTHER-NON-MOTOR VEH 1 0 1 0.00
2-TRUCK/TRACTOR & 2 TRAILER 32 2 34 5.88
U-PEDESTRIAN 1 6 7 85.71
UNKNOWN 27 1 28 3.57
V-DISMOUNT PEDESTRIAN 1 0 1 0.00

Table D. Human injuries or fatalities because of a crash with livestock, deer, or other species by
vehicle type.
Species group Human injuries or fatalities (n)
A-PASNGR CAR/STA WAGON C-MOTORCYCLE
D-PICKUP/PANEL TRUCK
Livestock None 552 0 228
≥1 159 14 25
≥1 (%) 22.36 100.00 9.88
Deer None 4703 37 820
≥1 410 378 38
≥1 (%) 8.02 91.08 4.43
Other species None 1759 10 205
≥1 181 91 13
≥1 (%) 9.33 90.10 5.96

Deer only analyses
Distribution of deer crashes per month (n=6922 in total)
0
200
400
600
800
1000
1200
Jan Feb Mar Apr May Jun Jul Aug Sep Oct Nov Dec
Dee
r cr
ash
es (
n)
Month

Deer crashes by the hour of the day
Per month and for all months combined
0
100
200
300
400
500
600
700
0
20
40
60
80
100
120
140
160
0 2 4 6 8 10 12 14 16 18 20 22
Dee
r cr
ash
es f
or
all m
on
ths
com
bin
ed (
n)
Dee
r cr
ash
es in
eac
h m
on
th (
n)
Hour of Day
Jan
Feb
Mar
Apr
May
Jun
Jul
Aug
Sep
Oct
Nov
Dec
All months

The number of deer crashes per district per year.
This appears relatively consistent, allowing for statewide analyses
District Total 2005 2006 2007 2008 2009 2010 2011 2012 2013 2014
1 790 77 64 70 78 75 66 72 94 103 91
2 1366 110 115 155 140 139 121 150 141 146 149
3 913 74 69 74 93 100 92 94 90 114 113
4 789 93 82 91 92 80 75 75 63 75 63
5 1104 90 70 105 108 108 114 139 128 148 94
6 272 38 33 35 28 25 22 23 24 27 17
7 205 18 18 10 21 13 12 25 33 31 24
8 129 4 10 9 19 7 13 10 21 15 21
9 540 35 32 33 38 38 54 74 70 83 83
10 568 60 66 59 76 65 44 42 59 60 37
11 143 7 8 10 14 16 11 16 25 14 22
12 103 9 17 10 12 6 12 7 12 14 4
Total 6922 615 584 661 719 672 636 727 760 830 718

APPENDIX A2.4

OTM22215
TSAR - ACCIDENT SUMMARY
California Department of Transportation
Policy controlling the use of Traffic Accident Surveillance and Analysis System (TASAS) - Transportation Systems Network (TSN) Reports
1. TASAS - TSN has officially replaced the TASAS - "Legacy" database.
2. Reports from TSN are to be used and interpreted by the California Department of Transportation (Caltrans) officials or authorized representative.
3. Electronic versions of these reports may be emailed between Caltrans' employees only using the State computer system.
4. The contents of these reports shall be considered confidential and may be privileged pursuant to 23 U.S.C. Section 409, and are for the sole use of the intended recipient(s). Any unauthorized review, use, disclosure or distribution is prohibited. If you are not the intended recipient, please contact the sender by reply e-mail and destroy all copies of the original message. Do not print, copy or forward.

REPORT PARAMETERS:
REFERENCE DATE
LOCATION CRITERIA:
SELECTION CRITERIA:
' Animal Crashes 'REPORT TITLE
REPORT DATE 07/07/2017
Statewide Report
Accidents Date Range:
From -- 01/01/2005 To -- 12/31/2014
1 1 AND 600 - PARTY TYPE IN W,X,Z
SUBMITTOR TRRKIM
07/07/2017
EVENT ID 3926696
:
:
:
:
:
OTM22215
TSAR - ACCIDENT SUMMARY
California Department of Transportation

1Page#OTM22215
07/07/2017
07:15 AM
TASAS SELECTIVE RECORD RETRIEVALTSAR - ACCIDENT SUMMARY
' Animal Crashes '
Event ID 3926696
INJURYFATAL29 1391
PDOTOTAL
911810538
PERSONS
10241
MOTOR VEHICLES INVOLVED
170833
255309
0 110223 2
255 350 48 50 62 70 80 9
CODE NUMBER <---LINES CODED--->
PCT
351
30232235353056743139535131925318817717320423353968676597498761448110
609
0
493619723628
2
0
980103910561038971
1055110811791101
00
483542659922936944900
109013661324763
3326316520332014
15671508147614471443
15211576
123>3
00- 12 MID.01- 1 A.M.02- 2 A.M.03- 3 A.M.04- 4 A.M.05- 5 A.M.06- 6 A.M.07- 7 A.M.08- 8 A.M.09- 9 A.M.10- 10 A.M.11- 11 A.M.12- 12 NOON13- 1 P.M.14- 2 P.M.15- 3 P.M.16- 4 P.M.17- 5 P.M.18- 6 P.M.19- 7 P.M.20- 8 P.M.21- 9 P.M.22- 10 P.M.23- 11 P.M.25- UNKNOWN
C-CONVENTIONALE-EXPRESSWAYF-FREEWAYS-1-WAY CITY ST--INVALID DATA+-NO DATA
N-NORTHBOUNDS-SOUTHBOUNDE-EASTBOUNDW-WESTBOUND
01-JANUARY02-FEBRUARY03-MARCH04-APRIL05-MAY06-JUNE07-JULY08-AUGUST09-SEPTEMBER10-OCTOBER11-NOVEMBER12-DECEMBER
1-SUNDAY2-MONDAY3-TUESDAY4-WEDNESDAY5-THURSDAY6-FRIDAY7-SATURDAY
<---- HOUR OF DAY ----> <--- ACCESS CONTROL ---> <--- SIDE OF HIGHWAY --->
<----- MONTH -----><----- YEAR -----> <---- DAY OF WEEK ---->
97.22.40.30.1
0.0
3.33.22.93.13.35.05.44.13.73.33.02.41.81.71.61.92.25.16.57.39.2
9.45.84.60.1
46.818.734.40.00.00.0
9.39.9
10.09.99.2
10.010.511.210.40.00.0
5.84.65.16.38.78.99.08.5
10.313.012.67.2
14.914.314.013.713.714.415.0
31.630.019.319.1
97.02.40.50.10.00.00.00.0
333
200520062007200820092010201120122013201420152016
NUMBER PCT CODE
CODENUMBER PCT
CODE NUMBER PCT
ACCIDENTS KILLED INJURED
NUMBER PCT CODENUMBER PCT CODE
NUMBER PCT CODENUMBER PCT CODE
1011 9.6

2Page#OTM22215
07/07/2017
07:15 AM
TASAS SELECTIVE RECORD RETRIEVALTSAR - ACCIDENT SUMMARY
' Animal Crashes '
Event ID 3926696
116 144440138
38156816
6208
31547010
5310170
73
9785681153
54
42932
1007331
118126
49675327
10136
813769
10286
3374
142485593
9630410
134
3363661777
5660320
45
1-INFLUENCE ALCOHOL2-FOLLOW TOO CLOSE3-FAILURE TO YIELD4-IMPROPER TURN5-SPEEDING6-OTHER VIOLATIONSB-IMPROPER DRIVINGC-OTHER THAN DRIVERD-UNKNOWNE-FELL SLEEP<-NOT STATED
93
A-HEAD-ONB-SIDESWIPEC-REAR ENDD-BROADSIDEE-HIT OBJECTF-OVERTURNG-AUTO-PEDESTRIANH-OTHER<-NOT STATED
A-HOLES, RUTSB-LOOSE MATERIALC-OBSTRUCTION ON ROADD-CONSTRUCT-REPAIR-ZONEE-REDUCED ROAD WIDTHF-FLOODEDG-OTHERH-NO UNUSUAL CONDITION<-NOT STATED
A-CLEARB-CLOUDYC-RAININGD-SNOWINGE-FOGF-OTHERG-WIND<-NOT STATED
A-DAY LIGHTB-DUSK/DAWNC-DARK-STREET LIGHTD-DARK-NO STREET LIGHTE-DARK-INOPR STREET LIGHTF-DARK-NOT STATED<-NOT STATED
A-DRYB-WETC-SNOWY, ICYD-SLIPPERY<-NOT STATED
A-CONTROL FUNCTIONINGB-CONTROL NOT FUNCTIONINGC-CONTROLS OBSCUREDD-NO CONTROLS PRESENT<-NOT STATED
R-IND. ALIGN RIGHTL-IND. ALIGN LEFTD-DIVIDEDU-UNDIVIDED
1-RAMP INTERSECTION (EXIT)2-RAMP3-RAMP ENTRY4-RAMP AREA, INTERSECTION STREET5-IN INTERSECTION6-OUTSIDE INTRSCT-NONSTATE RTE--DOES NOT APPLY
<-- PRIMARY COLLISION FACTOR --> <--- TYPE OF COLLISION ---> <--- ROADWAY CONDITION --->
<--------- WEATHER ---------> <------------ LIGHTING ------------> <----- ROAD SURFACE ----->
<------ RIGHT OF WAY CONTROL ------> <-------- HIGHWAY GROUP --------> <- INTERSECTION/RAMP ACCIDENT LOCATION ->
8353171424814140123
54
0.30.10.01.34.60.60.0
91.40.40.01.3
1.1
0.41.3
36.20.60.2
58.90.9
0.10.01.50.70.00.00.5
96.50.7
16.32.40.11.30.10.00.5
31.96.37.4
53.70.30.00.4
6.50.10.00.5
4.10.00.0
95.60.3
1.11.2
47.150.6
1.30.10.10.70.1
97.6
0.4
79.3 92.9
0.1
NUMBER PCT CODE NUMBER PCT CODE
NUMBER PCT CODE NUMBER PCT CODENUMBER PCT CODE
NUMBER PCT CODE
NUMBER PCT CODE NUMBER PCT CODE NUMBER PCT CODE
0 -INVALID CODES0.00 -INVALID CODES0.0
0 -INVALID CODES0.0
0 -INVALID CODES0.0
0 0.0 -INVALID CODES
0 0.0 -INVALID CODES
-INVALID CODES0 0.0

3Page#OTM22215
07/07/2017
07:15 AM
TASAS SELECTIVE RECORD RETRIEVALTSAR - PARTY SUMMARY
' Animal Crashes '
Event ID 3926696
782513539
13836353222340000
2125437
0
4511933000
141
116169132464
3358
20273196
2030
N-N, NE, NW BOUND
S-S, SE, SW BOUNDE-EASTBOUNDW-WESTBOUND<-NOT STATED10532--DOES NOT APPLY0
04
0
180
4010140
666300
5301
3815
7
12810187
33
5130
447425
10193
325683
1058
1021490
17
105230
000000
210250005
30000
105380
1-INFLUENCE ALCOHOL2-FOLLOW TOO CLOSE3-FAILURE TO YIELD4-IMPROPER TURN5-SPEEDING6-OTHER VIOLATIONS
E-VISION OBSCUREMENTF-INATTENTION - OTHERG-STOP & GO TRAFFICH-ENTER/LEAVE RAMPI-PREVIOUS COLLISIONJ-UNFAMILIAR WITH ROADK-DEFECT VEHICLE EQUIPL-UNINVOLVED VEHICLEM-OTHERN-NONE APPARENTP-WINDR-RAMP ACCIDENTS-RUNAWAY VEHICLE
<-NOT STATED--DOES NOT APPLY
PEDESTRIAN
2- XING XWALK - INTRST3- XING XWALK - NOT INTR4- XING NOT XWALK5- ROADWAY - INCL SHLDR6- NOT IN ROADWAY7- APRH-LEAVE SCHL BUS
710
58
A-PASNGR CAR/STA WAGONB-PASNGR CAR W/TRAILERC-MOTORCYCLED-PICKUP/PANEL TRUCKE-PICKUP/PANEL W/TRAILERF-TRUCK/TRUCK TRACTORG-TRUCK/TRACTOR & 1 TRAILER2-TRUCK/TRACTOR & 2 TRAILER3-TRUCK/TRACTOR & 3 TRAILER4-SINGLE UNIT TANKER5-TRUCK/TRA & 1 TANK TRALR6-TRUCK/TRA & 2 TANK TRALRH-SCHOOL BUSI-OTHER BUSJ-EMERGENCY VEHICLEK-HIGHWAY CONST EQUP.**L-BICYCLEM-OTHER-MOTOR VEHN-OTHER-NON-MOTOR VEHO-SPILLED LOADSP-DISENGAGED TOWQ-UNINVOLVED VEHICLER-MOPEDT-TRAINU-PEDESTRIANV-DISMOUNT PEDESTRIANW-ANIMAL - LIVESTOCKX-ANIMAL - DEERZ-ANIMAL - OTHER
A-STOPPEDB-PROCEDED STRAIGHTC-RAN OFF ROADD-MAKING RIGHT TURNE-MAKING LEFT TURNF-MAKING U TURNG-BACKINGH-SLOWING, STOPPINGI-PASS OTHER VEHICLEJ-CHANGING LANESK-PARKINGL-ENTER FROM SHLDRM-OTHER UNSAFE TURNN-CROSS INTO OPP LNO-PARKEDP-MERGINGQ-TRAVEL WRONG WAYR-OTHER<-NOT STATED
A-HAZARDOUS MATERIALS
B-CELL PHONE IN USE*C-CELL PHONE NOT IN USE*D-CELL PHONE NONE/UNKNOWN*
<------------ PARTY TYPE ------------> <- MOVEMENT PRECEDING COLLISION ->
<---- SPECIAL INFORMATION ---->
<---- OTHER ASSOCIATED FACTORS ---->
<---- DIRECTION OF TRAVEL ---->
74.30.15.1
13.10.60.52.10.30.00.00.00.00.20.24.10.00.00.50.20.00.00.00.00.00.10.0
11.065.623.4
31.9
30.319.219.399.90.0
0.00.00.10.00.0
0.0
29.5
0.496.20.60.10.00.00.0
0.00.00.40.10.10.00.00.6
0.1
1.296.70.3
0.00.10.00.40.70.2
0.10.20.00.30.50.10.00.10.6
96.90.10.00.2
99.90.0
0.00.00.00.00.00.0
0.00.00.00.00.00.00.00.00.00.30.00.00.0
100.00.0
1.819314
3110
0.10.5
NUMBER PCT CODE
NUMBER
NUMBER PCT CODE
NUMBER PCT CODEPCT CODE
#1 #2
NUMBER NUMBERPCT PCT CODE
0 0 A-CELL PHONE* (INATTN)0.00 0 B-ELECTRC EQUIP*(INATTN)0.0 0.02 0 C-RADIO/CD/HDPHN*(INATTN)0.0 0.00 0 D-SMOKING* (INATTN)0.0 0.0
00
00
W-PERSNL HYGIENE*(INATTN)X-READING* (INATTN)
0.00.0
0.00.0
00
00
T-EATING* (INATTN)U-CHILDREN* (INATTN)
0.00.0
0.00.0
0 0 V-ANIMALS* (INATTN)0.0 0.0
0.0
1 --DOES NOT APPLY0.010528 <-NOT STATED99.9
* SPECIAL INFORMATION CODES EFF. 04-01-01
* INATTENTION CODES EFF. 01-01-01
0 - INVALID CODES0.0
0 -INVALID CODES0.00 0.0 -INVALID CODES
** INCLUDES EQUIPMENT ENGAGED IN CONST/MAINT
ACTIVITIES AS OF 00-02-22

4Page#OTM22215
07/07/2017
07:15 AM
TASAS SELECTIVE RECORD RETRIEVALTSAR - PARTY SUMMARY
' Animal Crashes '
Event ID 3926696
2
V1 THRU V9 VEHICLE 1 TO 9<< NOT STATED-- DOES NOT APPLY
46-CRASH CUSHION (OTHER)51-CALL BOX98-UNKNOWN OBJECT STRUCK99- NO OBJECT INVOLVED
42-OTHER OBJECT ON ROAD43-OTHER OBJECT OFF ROAD44-OVERTURNED45-CRASH CUSHION (SAND)
28-TREES29-PLANTS
40-NATURAL MATRL ON ROAD41-TEMP BARRICADES, CONES
24-OVER EMBANKMENT25-IN WATER26-DRAINAGE DITCH27-FENCE
20-RAISED BARS21-CONCRETE OBJ (HDWL, D.I.)22-GUIDEPOST, CULVERT, PM23-CUT SLOPE OR EMBANKMENT
16-MEDIAN BARRIER17-WALL (EXCEPT SOUND WALL)18-DIKE OR CURB19-TRAFFIC ISLAND
12-POLE (TYPE NOT STATED)13-TRAFFIC SIGN/SIGN POST14-OTHER SIGNS NOT TRAFFIC15-GUARDRAIL
10-LIGHT OR SIGNAL POLE11-UTILITY POLE
04-BOTTOM OF STRUCTURE05-BRIDGE END POST IN GORE06-END OF GUARD RAIL07-BRIDGE APPROACH GUARD RAIL
01-SIDE OF BRIDGE RAILING02-END OF BRIDGE RAILING03-PIER, COLUMN, ABUTMENT
30-SOUND WALL
J-OTHERV-HOV LANE(S)W-HOV LANE BUFFER AREA
H-BEYOND SHLDER DRIVERS RIGHTI-GORE AREA
D-LEFT LANEE-INTERIOR LANESF-RIGHT LANEG-RIGHT SHOULDER AREA
A-BEYOND MEDIAN OR STRIPE-LEFTB-BEYOND SHLDER DRIVERS LEFTC-LEFT SHOULDER AREA
<-NOT STATED--DOES NOT APPLY
< NOT STATED--DOES NOT APPLY
H-NOT APPLICABLEI-FATIGUE
D-HBD - IMPAIRMENT UNKNOWNE-UNDER DRUG INFLUENCEF-OTHER PHYSICAL IMPAIRMENTG-IMPAIRMENT NOT KNOWN
A-HAD NOT BEEN DRINKINGB-HBD - UNDER INFLUENCEC-HBD - NOT UNDER INFLUENCE
0002011206
161
110003
14190967301127
2800006
103921
1177
000751
134
240
37902
29002
1479843
3576
190013
28682
00018
274
0
2206
742422
704
92
932
1
0
10494
15
4
2429
145
52838
64
338
211
0
0
10300
2
503810
00
132
027
10521
0
0
000
28
1
60
10538
<------------------- OBJECT STRUCK -------------------><------ LOCATION OF COLLISION ------>
<------ DRUG/PHYSICAL ------>
0.0
0.00.00.00.00.00.00.00.00.00.00.10.20.00.10.00.00.00.00.10.20.00.10.10.10.00.00.00.00.00.10.30.00.00.00.00.1
0.011.2
0.10.00.00.00.00.10.00.00.10.00.20.00.40.90.00.30.30.00.00.10.70.80.00.30.70.50.20.00.00.00.00.36.5
0.00.00.00.12.6
20.96.7
70.40.20.90.00.10.30.00.0
99.6
0.12.30.11.4
5.00.43.20.00.00.10.00.0
97.70.5
0.01.3
0.099.8
0.00.00.00.10.00.00.00.1
100.00.0
0 0.09
98.6
0
210538
0.0100.0
6
0.0
54
470.1
0.00.4
0.6
0
0.40.1
0.0
0.0
4
10538 100.0
0.0
0.3
PRIMARY OTHERSNUMBER PCT NUMBER PCT CODE
PRIMARY OTHERSNUMBER NUMBERPCT PCT CODE PRIMARY OTHERS
NUMBER NUMBERPCT PCT CODE
- INVALID CODES0 0.0 0 0.0
-INVALID CODES0 0.0 0 0.0
-INVALID CODES1 0.010.0


![LRFD - dot.ca.gov fileLRFD MTD 1-29 • DECEMBER 2014 Attachment 3 [Sample Structure Type Selection Memo and Report] STATE OF CALIFORNIA DEPARTMENT OF TRANSPORTATION](https://static.fdocuments.in/doc/165x107/5cb15edb88c99342708b493c/lrfd-dotca-mtd-1-29-december-2014-attachment-3-sample-structure-type-selection.jpg)