State of California California State Transportation...
130
State of California California State Transportation Agency DEPARTMENT OF TRANSPORTATION “Provide a safe, sustainable, integrated and efficient transportation system to enhance California’s economy and livability” M e m o r a n d u m To: CHAIR AND COMMISSIONERS CALIFORNIA TRANSPORTATION COMMISSION CTC Meeting: June 27-28, 2018 Reference No.: 3.9 Information Item From: STEVEN KECK Chief Financial Officer Subject: PROPOSITION 1B FISCAL YEAR 2017-18 THIRD QUARTER REPORTS SUMMARY: The attached package includes the California Department of Transportation’s quarterly reports for the Proposition 1B Bond Program. These reports have been discussed with the California Transportation Commission’s (Commission) staff, and will be presented as an informational item at the June 27-28, 2018 Commission meeting. The Proposition 1B Fiscal Year 2017-18 Third Quarter Reports are in the following order: Corridor Mobility Improvement Account State Route 99 Corridor Program Local Bridge Seismic Retrofit Program State-Local Partnership Program Traffic Light Synchronization Program Highway Railroad Crossing Safety Account Intercity Rail Improvement Program Trade Corridors Improvement Fund BACKGROUND: As approved by the voters in the November 2006 general election, Proposition 1B enacts the Highway Safety, Traffic Reduction, Air Quality, and Port Security Bond Act of 2006 to authorize $19.925 billion of state general obligation bonds for specified purposes, including: high-priority transportation corridor improvements, State Route 99 corridor enhancements, trade infrastructure and port security projects, school bus retrofit and replacement purposes, State Transportation Improvement Program augmentation, transit and passenger rail improvements, state-local partnership transportation projects, transit security projects, local bridge seismic retrofit projects, highway-railroad grade separation and crossing improvement projects, state highway safety and rehabilitation projects, local street and road improvement projects, congestion relief, and traffic safety. The attached reports are submitted in compliance of the Bond Accountability Plan as outlined by the California Transportation Commission in the Program Guidelines. Attachments Tab 33
Transcript of State of California California State Transportation...

State of California California State Transportation Agency DEPARTMENT OF TRANSPORTATION
“Provide a safe, sustainable, integrated and efficient transportation system to enhance California’s economy and livability”
M e m o r a n d u mTo: CHAIR AND COMMISSIONERS
CALIFORNIA TRANSPORTATION COMMISSION CTC Meeting: June 27-28, 2018
Reference No.: 3.9 Information Item
From: STEVEN KECK Chief Financial Officer
Subject: PROPOSITION 1B FISCAL YEAR 2017-18 THIRD QUARTER REPORTS
SUMMARY:
The attached package includes the California Department of Transportation’s quarterly reports for the Proposition 1B Bond Program. These reports have been discussed with the California Transportation Commission’s (Commission) staff, and will be presented as an informational item at the June 27-28, 2018 Commission meeting.
The Proposition 1B Fiscal Year 2017-18 Third Quarter Reports are in the following order:
Corridor Mobility Improvement Account State Route 99 Corridor Program Local Bridge Seismic Retrofit Program State-Local Partnership Program Traffic Light Synchronization Program Highway Railroad Crossing Safety Account Intercity Rail Improvement Program Trade Corridors Improvement Fund
BACKGROUND:
As approved by the voters in the November 2006 general election, Proposition 1B enacts the Highway Safety, Traffic Reduction, Air Quality, and Port Security Bond Act of 2006 to authorize $19.925 billion of state general obligation bonds for specified purposes, including: high-priority transportation corridor improvements, State Route 99 corridor enhancements, trade infrastructure and port security projects, school bus retrofit and replacement purposes, State Transportation Improvement Program augmentation, transit and passenger rail improvements, state-local partnership transportation projects, transit security projects, local bridge seismic retrofit projects, highway-railroad grade separation and crossing improvement projects, state highway safety and rehabilitation projects, local street and road improvement projects, congestion relief, and traffic safety. The attached reports are submitted in compliance of the Bond Accountability Plan as outlined by the California Transportation Commission in the Program Guidelines.
Attachments
Tab 33

FY 2017-18 Third Quarter Report
Corridor Mobility Improvement Account
Quarterly Report to the California Transportation
Commission

(1) CMIA Bond Program Summary Third Quarter FY 2017-18
(1a) CMIA Bond Program Funding
#Contracts Project Allocated Funds % Allocated
CMIA bond funds initially allocated to projects: 11291 1$4,410 million1 1100%1 CMIA bond funds revised allocation due to administration savings: 11291 1$4,477 million1 1100%1
In the CMIA bond program, $4,410 million was allocated for projects that commenced construction prior to December 31, 2012, and $90 million was set aside for program administration costs. Subsequently, administration costs have been reduced. Administration savings totaling $67 million were allocated to ongoing projects. A revised total of $4,477 million of CMIA program funds have been allocated to projects, and $23 million is set aside for program administration costs.
(1b) CMIA Bond Program Funding and Contributor Funds Program Expenditures Percent Expended
CMIA bond program funds expended to date: $4,314 million 96%r CMIA bond program funds expended reported last quarter: $4,301 million 96%r In the CMIA bond program's $4,500 million dollar budget, $4,477 million has been allocated to projects from the CMIA bond program funds. In addition, $7,888 million has been committed from other contributor funds to increase the total value of projects in the CMIA bond program to $12,365 million. The table below shows how CMIA bond program funds and contributor funds were distributed by project components as well as expenditures to date for CMIA bond program funds.
CMIA Bond Program Funding and Contributor Funds by Component (millions)Total Funds Other Funds
Allocated Expended Percent Construction Support 1,140.9$ 699.0$ 442.0$ 418.6$ 95% Capital 7,920.5$ 3,892.0$ 4,028.5$ 3,873.6$ 96% Right of Way Support 142.4$ 142.4$ Capital 1,912.7$ 1,912.6$ 0.2$ -$ 0% Preliminary Engineering Support 1,249.2$ 1,242.8$ 6.4$ 6.3$ 98% Committed Subtotal 12,365.8$ 7,888.8$ 4,477.0$ 4,298.4$ 96% Uncommitted -$ Percent Uncommitted 0% Administration 23.0$ 16.3$ 71% Program Total 4,500.0$ 4,314.7$ 96%
CMIA Bond Program Funds
$0.0
$400.0
$800.0
$1,200.0
$1,600.0
$2,000.0
07‐08 08‐09 09‐10 10‐11 11‐12 12‐13 14‐15
$451.4 $1,169.9 $438.0 $297.8 $1,845.6 $207.3 $67.0
CMIA Bond Program Allocations by FY (millions)
California Department of Transportation FY 2017-18 Third Quarter Report
Corridor Mobility Improvement Program Page 1 of 14

(1c) CMIA Bond Program Project Completions # Contracts Completed Percent Completed
CMIA bond program construction contracts completed to date: 117 91%r CMIA bond program construction contracts completed reported last quarter: 117 91%r A total of 90 corridor projects received CMIA bond program funds. Some corridor projects were constructed in stages, resulting in a total of 129 construction contracts being administered.
CMIA Bond Program Completions - Projects and Dollars (millions)
# Total Funds CMIA Funds #
FDR's # Total Funds CMIA Funds # Total Funds CMIA Funds
FY 09-10 4 206$ 60$ 4 4 206$ 60$ FY 10-11 8 374$ 183$ 8 8 374$ 183$ FY 11-12 8 437$ 274$ 8 8 437$ 274$ FY 12-13 19 917$ 403$ 18 19 917$ 403$ FY 13-14 19 969$ 395$ 18 19 969$ 395$ FY 14-15 19 1,576$ 581$ 15 19 1,576$ 581$ FY 15-16 27 1,717$ 702$ 8 27 1,717$ 702$ FY 16-17 12 1,248$ 534$ 1 12 1,248$ 534$ FY 17-18 1 136$ 54$ 0 2 198$ 41$ 3 334$ 94$ FY 18-19 6 3,020$ 1,027$ 6 3,020$ 1,027$ FY 19-20 3 1,166$ 158$ 3 1,166$ 158$ FY 22-23 1 402$ 65$ 1 402$ 65$
Total Value 117 7,579$ 3,186$ 80 12 4,787$ 1,291$ 129 12,366$ 4,477$
Contracts Accepted Contracts Under Construction All CMIA Bond Program Contracts
The status of Final Delivery Reports (FDR), to be completed within six months after construction contracts are accepted, is outlined in the table above.
$0
$400
$800
$1,200
$1,600
$2,000
$2,400
$2,800
$3,200
$3,600
09‐10 Actual
10‐11 Actual
11‐12 Actual
12‐13 Actual
13‐14 Actual
14‐15 Actual
15‐16 Actual
16‐17 Actual
17‐18 Actual
17‐18 Plan
18‐19 Plan
19‐20 Plan
20‐21 Plan
21‐22 Plan
22‐23 Plan
CMIA Bond Program Construction Expenditures by Fiscal Year of Completion (millions)
Total Dollars CMIA Dollars
California Department of Transportation FY 2017-18 Third Quarter Report
Corridor Mobility Improvement Program Page 2 of 14

LEGEND
(2) CMIA Bond Program Project Delivery and Expenditure ReportThird Quarter FY 2017-18
Estimated cost within budgetBaseline budget exceeded, non-bond funds added. No CTC action required.All bond funds expended. Project teams are making expenditure adjustments (adding non-bond funds if necessary) and reviewing project charges. CCA 100% Complete - Complete - Past Due
CONSTRUCTION SUPPORT CONSTRUCTION CAPITAL
PRO
JEC
T N
UM
BER
DIS
TRIC
TC
OU
NTY
RO
UTE
TO
TAL
PRO
JEC
T C
OST
($1,
000'
s)
CM
IA P
RO
JEC
T C
OST
($1,
000'
s)
PRO
JEC
T D
ESC
RIP
TIO
N
ALL
OC
ATI
ON
AW
AR
D
AW
AR
D %
Com
plet
e
APP
RO
VED
CC
AC
UR
REN
T C
CA
CC
A %
CO
MPL
ETE
FIN
AL
DEL
IVER
Y R
EPO
RT
APP
RO
VED
CLO
SEO
UT
CU
RR
ENT
CLO
SEO
UT
CLO
SEO
UT
% C
OM
PLET
E
SUPP
LEM
ENTA
L FD
R
IMPLEMENTINGAGENCY (QUARTER
BOND FUNDS FULLY EXPENDED)
APPROVED BUDGET ($1,000's)
EXPENDED ($1,000's)
APPROVED BUDGET ($1,000's)
EXPENDED ($1,000's)
I-580 Eastbound HOV Lane - Greenville to Hacienda - Corridor Project
59,280$ 29,037$ Corridor Project #1 (EA 29084) 3/13/08 07/28/08 100 12/01/11 02/04/10 100 Caltrans 5,700$ 5,555$ 47,410$ 42,413$
45,630$ 4,904$ Corridor Project #2 (EA 29083) 10/30/08 07/22/09 100 12/01/11 09/30/11 100 Caltrans 4,458$ 4,928$ 34,342$ 43,242$
43,145$ 20,400$ Corridor Project #3 (EA 2908V) 5/23/12 08/23/12 100 11/01/14 05/20/16 100 4,132$ 4,889$ 35,468$ 35,132$
148,055$ 54,341$ Corridor Summary 11/01/14 05/20/16 11/01/15 08/01/19 14,290$ 15,371$ 117,220$ 120,787$
I-580 Westbound HOV Lane - Greenville to Foothill - Corridor Project
91,677$ 41,860$ Corridor Project #1 (EA 2908C) 5/23/12 11/20/12 100 11/01/14 06/30/16 100 Caltrans 9,795$ 10,200$ 73,769$ 73,471$
68,700$ 40,481$ Corridor Project #2 (EA 2908E) 4/26/12 10/29/12 100 11/01/14 04/18/16 100 Caltrans 7,820$ 10,423$ 53,010$ 50,761$
160,377$ 82,341$ Corridor Summary 11/01/14 06/30/16 11/01/15 08/01/19 17,615$ 20,622$ 126,779$ 124,232$
I-580 / Isabel Interchange - Corridor Project
43,495$ 18,375$ Corridor Project #1 (EA 17131) 12/11/08 06/22/09 100 03/01/12 04/09/12 100 Livermore -$ 535$ 26,495$ 17,666$
6,810$ 1,770$ Corridor Project #2 (EA 17132) 12/11/08 06/22/09 100 01/01/12 10/31/11 100 Livermore -$ -$ 3,210$ 1,770$
73,181$ 24,982$ Corridor Project #3 (EA 17133) 10/30/08 07/23/09 100 01/01/12 11/23/11 100 Caltrans 8,000$ 7,006$ 37,682$ 28,032$
123,486$ 45,127$ Corridor Summary 03/01/12 04/09/12 03/01/13 12/01/18 8,000$ 7,541$ 67,387$ 47,468$
I-880 SB HOV Ln Extension - Hegenberger to Marina Blvd - Corridor Project
67,934$ 52,846$ Corridor Project #1 (EA 3A921) 4/26/12 09/14/12 100 01/01/16 04/04/16 100 Caltrans 7,415$ 8,079$ 50,607$ 49,812$
35,052$ 29,765$ Corridor Project #2 (EA 3A922) 5/23/12 11/08/12 100 02/01/16 11/19/15 100 Caltrans 4,000$ 4,000$ 25,765$ 24,609$
102,986$ 82,611$ Corridor Summary 02/01/16 04/04/16 02/01/17 06/05/18 11,415$ 12,079$ 76,372$ 74,422$
State Route 24 Caldecott Tunnel - Fourth Bore - Corridor Project
399,211$ 84,482$ Corridor Project #1 (EA 29491) 5/14/09 11/10/09 100 05/01/14 03/12/15 100 Caltrans 51,218$ 55,998$ 293,775$ 286,737$
4,730$ -$ Corridor Project #2 (EA 29492) Local 12/22/09 100 03/01/11 04/20/11 100 Caltrans 400$ 492$ 4,300$ 2,809$
642$ -$ Corridor Project #3 (EA 29493) Local 12/23/09 100 07/01/10 07/19/10 100 Caltrans 100$ 130$ 500$ 408$
404,583$ 84,482$ Corridor Summary 05/01/14 03/12/15 03/01/15 04/30/18 51,718$ 56,620$ 298,575$ 289,954$
6 10 Cal 4 60,688$ 3,574$ Angels Camp Bypass (EA 36250) 9/20/07 08/11/07 100 09/01/10 09/24/09 100 03/01/12 03/16/20 Caltrans 3,600$ 4,350$ 31,101$ 25,939$
State Route 4 East Widening from Somersville to Route 160
78,472$ 12,428$ Corridor Project #1 (EA 2285C) 5/20/10 01/05/11 100 02/01/13 12/16/13 100 Caltrans 10,608$ 9,891$ 45,183$ 45,155$
83,967$ 16,671$ Corridor Project #2 (EA 2285E) 8/10/11 10/20/11 100 02/01/15 02/02/16 100 Caltrans 14,395$ 14,275$ 48,717$ 47,665$
1 04 Ala 580
3 04 Ala 580
2 04 Ala 580
5 04AlaCC
24
4 04 Ala 880
California Department of Transportation FY 2017-18 Third Quarter Report
Corridor Mobility Improvement Program Page 3 of 14

CONSTRUCTION SUPPORT CONSTRUCTION CAPITALPR
OJE
CT
NU
MB
ER
DIS
TRIC
TC
OU
NTY
RO
UTE
TO
TAL
PRO
JEC
T C
OST
($1,
000'
s)
CM
IA P
RO
JEC
T C
OST
($1,
000'
s)
PRO
JEC
T D
ESC
RIP
TIO
N
ALL
OC
ATI
ON
AW
AR
D
AW
AR
D %
Com
plet
e
APP
RO
VED
CC
AC
UR
REN
T C
CA
CC
A %
CO
MPL
ETE
FIN
AL
DEL
IVER
Y R
EPO
RT
APP
RO
VED
CLO
SEO
UT
CU
RR
ENT
CLO
SEO
UT
CLO
SEO
UT
% C
OM
PLET
E
SUPP
LEM
ENTA
L FD
R
IMPLEMENTINGAGENCY (QUARTER
BOND FUNDS FULLY EXPENDED)
APPROVED BUDGET ($1,000's)
EXPENDED ($1,000's)
APPROVED BUDGET ($1,000's)
EXPENDED ($1,000's)
92,407$ 39,200$ Corridor Project #3 (EA 1G940) 1/25/12 05/25/12 100 12/01/14 06/29/17 100 Caltrans 13,389$ 11,067$ 59,775$ 56,880$
79,307$ -$ Corridor Project #4 (EA 1G941) 8/22/12 11/14/12 100 08/01/15 06/29/18 99 L CCTA -$ 7$ 67,886$ 63,844$
44,949$ 31,787$ Corridor Project #5 (EA 24657) 1/25/12 04/19/12 100 09/30/13 10/30/15 100 CCTA -$ -$ 36,787$ 36,536$
379,102$ 100,086$ Corridor Summary 08/01/15 06/29/18 12/01/18 06/01/19 38,392$ 35,240$ 258,348$ 250,080$
I-80 Integrated Corridor Mobility Project
8,384$ 7,584$ Corridor Project #1 (EA 3A774) 10/27/11 03/15/12 100 04/01/15 05/22/17 100 ACCMA -$ 115$ 7,584$ 5,629$
6,163$ 5,363$ Corridor Project #2 (EA 3A775) 3/29/12 07/26/12 100 04/01/14 08/31/16 100 ACCMA -$ 48$ 5,363$ 5,023$
1,857$ 1,457$ Corridor Project #3 (EA 3A771) 1/20/11 04/28/11 100 04/01/12 12/01/12 100 ACCMA -$ -$ 1,457$ 1,457$
11,259$ 9,379$ Corridor Project #4 (EA 3A776) 5/23/12 09/30/12 100 01/01/14 12/26/14 100 Caltrans 1,492$ 1,331$ 7,887$ 7,070$
28,136$ 22,256$ Corridor Project #5 (EA 3A777) 5/23/12 10/01/12 100 06/01/14 05/04/16 100 Caltrans 3,675$ 3,497$ 18,581$ 17,365$
55,799$ 46,039$ Corridor Summary 04/01/15 05/22/17 10/01/15 05/25/18 5,167$ 4,991$ 40,872$ 36,543$
US 50 HOV Lanes - Corridor Project
44,434$ 19,866$ Corridor Project #1 ( EA 3A711 ) 9/25/08 11/18/08 100 06/01/10 11/07/12 100 ED Co DOT 3,560$ 7,039$ 37,674$ 33,381$
10,454$ 6,294$ Corridor Project #2 ( EA 3A712 ) 12/15/11 04/01/12 100 10/01/13 06/17/13 100 ED Co DOT -$ 1,407$ 8,794$ 10,195$
54,888$ 26,160$ Corridor Summary 10/01/13 06/17/13 10/01/14 07/01/19 3,560$ 8,446$ 46,468$ 43,576$
10 06 Ker 46 73,024$ 30,375$ Route 46 Expressway - Segment 3 (EA 44252)
5/20/10 01/26/11 100 07/01/14 01/16/13 100 01/01/16 10/30/14 100 Caltrans 9,900$ 4,178$ 47,449$ 45,510$
11 06KinTul
198 94,274$ 44,272$ Route 198 Expressway (EA 3568U) 5/14/09 09/01/09 100 02/01/12 03/11/13 100 08/01/13 03/17/16 100 Caltrans 9,514$ 8,579$ 51,516$ 52,213$
12 07 LA 405 1,137,700$ 730,000$ I-405 Carpool Lane I-10 To US 101 (NB) (Design Build) (EA 12030)
9/25/08 04/23/09 100 12/31/13 08/17/18 98 L 12/01/15 06/10/21 Metro -$ -$ 979,700$ 903,391$
Interstate 5 Carpool Lane from Route 134 to Route 170 - Corridor Project
137,366$ -$ Corridor Project #1 (EA 12184) Local 12/06/10 100 12/31/13 10/29/19 84 Caltrans 30,110$ 30,911$ 76,646$ 59,496$
110,516$ -$ Corridor Project #2 (EA 1218V) Local 10/14/10 100 12/31/12 12/15/15 100 Caltrans 19,593$ 19,335$ 71,000$ 62,748$
402,385$ 64,713$ Corridor Project #3 (EA 1218W) 5/23/12 11/29/12 100 05/30/16 07/14/22 65 Caltrans 43,211$ 25,715$ 232,506$ 137,574$
650,267$ 64,713$ Corridor Summary 05/30/16 07/14/22 05/30/17 02/28/22 92,914$ 75,962$ 380,152$ 259,818$
I-5 Carpool Lane from Orange County Line to I-605 - Corridor Project
114,072$ 51,983$ Corridor Project #1 (EA 21591) 8/10/11 11/28/11 100 04/29/15 05/27/16 100 Caltrans 17,110$ 16,458$ 45,247$ 44,110$
631,125$ -$ Corridor Project #2 (EA 21592)(U) 6/23/15 03/14/16 03/31/17 02/07/20 26 Caltrans 34,534$ 7,768$ 170,000$ 43,607$
188,216$ 104,708$ Corridor Project #3 (EA 21593) 4/26/12 08/14/12 100 04/22/16 12/07/18 97 Caltrans 28,481$ 28,291$ 96,447$ 84,684$
323,285$ 158,320$ Corridor Project #4 (EA 21594) 4/26/12 08/23/12 100 04/01/16 08/20/19 79 Caltrans 33,777$ 29,765$ 144,627$ 106,466$
211,747$ -$ Corridor Project #5 (EA 21595) 8/6/13 04/24/14 100 12/01/16 03/13/20 64 Caltrans 25,768$ 18,532$ 116,632$ 58,241$
1,468,445$ 315,011$ Corridor Summary 03/31/17 02/07/20 05/31/20 10/30/23 139,670$ 100,815$ 572,953$ 337,109$
8 04Ala
CC80
7 04 CC 4
13 07 LA 5
9 03 ED 50
14 07 LA 5
California Department of Transportation FY 2017-18 Third Quarter Report
Corridor Mobility Improvement Program Page 4 of 14

CONSTRUCTION SUPPORT CONSTRUCTION CAPITALPR
OJE
CT
NU
MB
ER
DIS
TRIC
TC
OU
NTY
RO
UTE
TO
TAL
PRO
JEC
T C
OST
($1,
000'
s)
CM
IA P
RO
JEC
T C
OST
($1,
000'
s)
PRO
JEC
T D
ESC
RIP
TIO
N
ALL
OC
ATI
ON
AW
AR
D
AW
AR
D %
Com
plet
e
APP
RO
VED
CC
AC
UR
REN
T C
CA
CC
A %
CO
MPL
ETE
FIN
AL
DEL
IVER
Y R
EPO
RT
APP
RO
VED
CLO
SEO
UT
CU
RR
ENT
CLO
SEO
UT
CLO
SEO
UT
% C
OM
PLET
E
SUPP
LEM
ENTA
L FD
R
IMPLEMENTINGAGENCY (QUARTER
BOND FUNDS FULLY EXPENDED)
APPROVED BUDGET ($1,000's)
EXPENDED ($1,000's)
APPROVED BUDGET ($1,000's)
EXPENDED ($1,000's)
Highway 101 Marin-Sonoma Narrows - Corridor Project
85,029$ 26,523$ Corridor Project #1 (EA 26407) 5/23/12 09/14/12 100 06/01/15 05/24/16 100 Caltrans 4,873$ 6,349$ 26,950$ 25,237$
136,148$ 72,717$ Corridor Project #2 (EA 2640U) 5/23/12 11/01/12 100 06/01/15 06/30/17 100 Caltrans 17,716$ 16,247$ 79,500$ 78,935$
48,672$ 28,603$ Corridor Project #3 (EA 26406) 1/20/11 06/02/11 100 12/02/13 12/17/12 100 Caltrans 7,000$ 6,733$ 27,303$ 26,608$
3,904$ 3,530$ Corridor Project #4 (EA 2640G) 6/27/12 11/08/12 100 12/01/13 12/24/13 100 Caltrans (FY 14-15 Q1) 700$ 742$ 2,830$ 2,829$
18,202$ 17,244$ Corridor Project #5 (EA 2640L) 6/27/12 11/01/12 100 06/30/14 12/23/14 100 Caltrans 2,500$ 2,458$ 14,744$ 14,512$
31,679$ 30,729$ Corridor Project #6 (EA 2640K) 6/27/12 11/02/12 100 10/01/14 12/20/16 100 Caltrans 4,800$ 4,757$ 25,929$ 25,589$
323,634$ 179,346$ Corridor Summary 06/01/15 05/30/17 12/30/16 03/15/19 37,589$ 37,285$ 177,256$ 173,709$
16 04 Mrn 580 16,985$ 16,985$ Westbound I-580 to Northbound US 101 Connector Improvements (EA 4A140)
5/14/09 11/04/09 100 03/01/11 01/27/11 100 03/01/12 12/01/12 100 Caltrans 2,100$ 1,858$ 10,534$ 10,763$
17 05 Mon 1 31,691$ 18,568$ Salinas Road Interchange (EA 31592) 5/14/09 10/07/09 100 07/01/11 03/20/14 100 12/01/12 06/30/21 Caltrans 4,598$ 4,867$ 15,638$ 15,418$
SR 12 Jameson Canyon Widening - Phase 1 - Corridor Project
2,190$ -$ PAED Costs Phase 2 ( EA 26412 ) -$ -$ -$ -$
45,886$ 18,518$ Corridor Project #1 ( EA 26413 ) 8/10/11 01/26/12 100 08/01/12 05/05/15 100 Caltrans 4,850$ 8,644$ 30,528$ 30,472$
72,004$ 36,349$ Corridor Project #2 ( EA 26414 ) 8/10/11 01/11/12 100 08/01/13 05/10/16 100 Caltrans 9,250$ 11,355$ 43,293$ 42,134$
120,080$ 54,867$ Corridor Summary 08/01/13 05/10/16 12/29/17 07/31/19 14,100$ 19,999$ 73,821$ 72,605$
19 03 Nev 49 30,019$ 8,225$ Route 49 La Barr Meadows Widening (EA 2A690)
1/13/10 05/28/10 100 12/01/14 04/08/14 100 12/01/16 12/01/18 Caltrans 3,500$ 3,410$ 10,447$ 10,029$
20 12 Ora 91 60,759$ -$ Add one lane on EB SR-91 from SR-241/SR-91 to SR-71/SR-91 (EA 0G040)
Local 08/29/09 100 09/01/11 05/13/11 100 09/01/15 03/28/12 100 Caltrans 7,801$ 5,900$ 40,086$ 39,044$
SR-22 / I-405 / I-605 HOV Connector with ITS Elements - Corridor Project
169,446$ 135,430$ Corridor Project #1 ( EA 07163 ) 4/8/10 10/12/10 100 05/01/14 03/23/15 100 Caltrans 25,475$ 25,469$ 128,871$ 158,897$
119,657$ -$ Corridor Project #2 ( EA 07162 ) Local 06/11/10 100 02/01/14 03/18/15 100 Caltrans 18,374$ 19,199$ 78,637$ 78,803$
289,103$ 135,430$ Corridor Summary 05/01/14 03/23/15 05/01/15 07/07/17 100 43,849$ 44,668$ 207,508$ 237,700$
22 12 Ora 91 77,302$ 54,045$ Widen EB&WB SR-91 fr E of SR-55 Conn to E of Weir Canyon Road (EA 0G330)
1/20/11 05/03/11 100 12/01/14 11/01/13 100 12/01/15 07/01/14 100 Caltrans 8,633$ 9,921$ 54,045$ 54,045$
23 12 Ora 57 34,428$ 24,127$ Widen NB fr 0.3M S of Katella Ave to 0.3M N of Lincoln Ave (EA 0F040)
8/10/11 10/26/11 100 03/01/15 04/21/15 100 03/01/16 06/29/16 100 Caltrans 6,256$ 5,285$ 21,621$ 21,501$
Widen NB from 0.4 m N of SR-91 to 0.1 m N of Lambert Road - Corridor Project
50,397$ 39,513$ Corridor Project #1 ( EA 0F031 ) 4/8/10 10/12/10 100 07/01/14 11/06/14 100 Caltrans 9,180$ 9,142$ 30,333$ 30,648$
51,609$ 41,250$ Corridor Project #2 ( EA 0F032 ) 4/8/10 10/13/10 100 07/01/14 05/02/14 100 Caltrans 9,180$ 9,114$ 32,670$ 32,473$
102,006$ 80,763$ Corridor Summary 07/01/14 11/06/14 07/01/15 12/31/15 100 18,360$ 18,256$ 63,003$ 63,122$
Lincoln Bypass - Corridor Project
292,203$ 48,934$ Corridor Project #1 ( EA 3338U ) 2/14/08 06/09/08 100 06/15/13 07/09/13 100 Caltrans 22,000$ 24,484$ 164,453$ 161,281$
23,099$ 20,000$ Corridor Project #2 ( EA 33382 ) 10/26/11 05/21/12 100 12/15/14 10/01/14 100 Caltrans 2,751$ 2,639$ 19,499$ 18,121$
315,302$ 68,934$ Corridor Summary 12/15/14 10/01/14 12/15/16 04/09/19 24,751$ 27,123$ 183,952$ 179,401$
26 03 Pla 80 47,286$ 8,193$ Pla-80 HOV Phase 2 (EA 36782) 1/10/08 05/01/08 100 10/01/10 10/18/12 100 10/01/12 11/03/16 100 Caltrans 7,143$ 6,240$ 30,909$ 29,327$
27 03 Pla 80 48,993$ 22,604$ Pla-80 HOV Phase 3 (EA 36783) 12/11/08 08/10/09 100 01/01/11 06/17/13 100 01/01/13 10/12/16 100 Caltrans 5,300$ 5,255$ 39,593$ 25,377$
15 04Mrn Son
101
21 12 Ora 22
18 04Nap Sol
12
25 03 Pla 65
24 12 Ora 57
California Department of Transportation FY 2017-18 Third Quarter Report
Corridor Mobility Improvement Program Page 5 of 14

CONSTRUCTION SUPPORT CONSTRUCTION CAPITALPR
OJE
CT
NU
MB
ER
DIS
TRIC
TC
OU
NTY
RO
UTE
TO
TAL
PRO
JEC
T C
OST
($1,
000'
s)
CM
IA P
RO
JEC
T C
OST
($1,
000'
s)
PRO
JEC
T D
ESC
RIP
TIO
N
ALL
OC
ATI
ON
AW
AR
D
AW
AR
D %
Com
plet
e
APP
RO
VED
CC
AC
UR
REN
T C
CA
CC
A %
CO
MPL
ETE
FIN
AL
DEL
IVER
Y R
EPO
RT
APP
RO
VED
CLO
SEO
UT
CU
RR
ENT
CLO
SEO
UT
CLO
SEO
UT
% C
OM
PLET
E
SUPP
LEM
ENTA
L FD
R
IMPLEMENTINGAGENCY (QUARTER
BOND FUNDS FULLY EXPENDED)
APPROVED BUDGET ($1,000's)
EXPENDED ($1,000's)
APPROVED BUDGET ($1,000's)
EXPENDED ($1,000's)
28 08 Riv 215 29,228$ 25,605$ Widening, Add One Mixed Flow Lane in Each Direction (EA 0F161)
1/20/11 09/28/10 100 12/01/13 11/21/13 100 12/01/14 02/29/16 100 RCTC -$ -$ 22,057$ 15,951$
29 08 Riv 91 253,625$ 120,191$ HOV Lane Gap Closure (EA 44840) 8/10/11 02/10/12 100 08/01/15 12/19/16 100 08/01/17 08/01/19 Caltrans 30,728$ 30,702$ 129,924$ 157,151$
30 03 Sac 50 96,581$ 47,611$ Hwy 50 Bus/Carpool & Aux Lns & Community Enhancements (EA 44161)
7/9/09 10/26/09 100 01/01/13 05/10/13 100 01/01/15 08/15/16 100 Caltrans (FY 16-17 Q1) 11,500$ 12,226$ 70,698$ 71,886$
31 03 Sac Loc 16,322$ 12,822$ White Rock Road from Grant Line to Prairie City (EA 92880)
2/23/12 04/30/12 100 12/31/13 12/01/13 100 06/01/14 06/01/14 100 Sac Co -$ -$ 10,622$ 10,423$
32 08 SBd 10 30,760$ 14,074$ Westbound Mixed Flow Lane Addition (EA 0F150)
1/13/10 12/10/10 100 05/01/12 08/10/15 100 06/01/13 07/01/15 100 SANBAG -$ -$ 25,449$ 19,752$
33 08 SBd 215 347,777$ 49,120$ I-215 North Segments 1 & 2 - HOV & Mixed Flow Ln Addition (EA 0071V)
4/16/09 08/27/09 100 09/05/13 09/17/14 100 09/15/15 12/31/18 SANBAG -$ -$ 213,174$ 208,387$
Interstate 215 HOV Lanes and Connectors - Corridor Project
34 77,658$ 29,000$ SR - 210/215 Connectors (EA 44407) combined to 4440U
4/16/09 09/17/09 100 02/01/13 03/01/13 100 Caltrans 12,883$ see 47,672$ see
35 40,614$ 32,414$ I-215 North Segment 5 (EA 00719) combined to 4440U
4/16/09 09/17/09 100 02/01/13 03/01/13 100 Caltrans 7,333$ below 25,081$ below
118,272$ 61,414$ Corridor Summary 02/01/13 03/01/13 03/01/15 10/30/15 100 20,216$ 12,942$ 72,753$ 71,430$
36 08 SBd 10 19,409$ 10,910$ Widen Exit Ramps&Add Aux Ln @Cherry, Citrus&Cedar Ave IC's (EA 49750)
1/13/10 10/12/10 100 12/01/10 12/20/12 100 06/01/11 06/03/14 100 Caltrans 3,280$ 3,422$ 13,239$ 9,337$
I-15 Managed Lanes - Corridor Project
110,103$ 93,765$ Corridor Project #1 (EA 2T093) 9/20/07 02/08/08 100 01/17/11 12/28/11 100 Caltrans 14,739$ 14,603$ 79,026$ 77,319$
87,365$ 71,236$ Corridor Project #2 (EA 2T091) 2/14/08 05/12/08 100 02/21/12 05/31/11 100 Caltrans 14,025$ 11,162$ 57,211$ 57,438$
133,613$ 110,595$ Corridor Project #3 (EA 2T092) 4/10/08 07/25/08 100 04/15/12 06/14/12 100 Caltrans 21,236$ 15,020$ 94,432$ 91,853$
331,081$ 275,596$ Corridor Summary 04/15/12 06/14/12 10/03/13 01/28/15 100 50,000$ 40,785$ 230,669$ 226,609$
I-5 North Coast Corridor - Stage 1A - Corridor Project
52,664$ 24,500$ Corridor Project #1 (EA 2358U) 9/20/07 08/15/07 100 10/30/09 07/14/10 100 Caltrans 6,000$ 7,743$ 43,038$ 37,046$
80,446$ -$ Corridor Project #2 (EA 2T040) Local 01/28/11 100 06/30/12 02/13/15 100 Caltrans 11,183$ 15,357$ 54,610$ 57,724$
133,110$ 24,500$ Corridor Summary 06/30/12 02/13/15 06/30/17 03/31/19 17,183$ 23,100$ 97,648$ 94,770$
39 10 SJ 205 22,009$ 9,070$ I-205 Auxiliary Lanes (EA 0Q270) 4/8/10 10/12/10 100 04/01/13 03/04/13 100 11/01/14 02/13/15 100 Caltrans 2,900$ 2,302$ 11,860$ 11,480$
Route 46 Corridor Improvements (Whitley 1) - Corridor Project
77,214$ 49,778$ Corridor Project #1 (EA 33072) 4/8/10 10/25/10 100 08/01/13 10/13/14 100 Caltrans 7,000$ 7,872$ 54,054$ 52,312$
1,840$ -$ STIP TEA Enhancements (EA 33072)
79,054$ 49,778$ Corridor Summary 08/01/13 10/13/14 10/01/14 06/08/18
Widen US 101 & add Aux Lns fr Marsh Rd to Embarcadero Rd. - Corridor Project
39,493$ 22,300$ Corridor Project #1 (EA 23563) 1/20/11 06/01/11 100 03/01/12 06/25/13 100 Caltrans 8,259$ 3,020$ 21,159$ 16,123$
22,514$ 3,802$ Corridor Project #2 (EA 23564) 10/26/11 05/24/12 100 11/01/13 11/15/13 100 Caltrans 3,802$ 1,256$ 12,648$ 6,514$
62,007$ 26,102$ Corridor Summary 11/01/13 11/15/13 11/01/14 08/25/16 100 12,061$ 4,276$ 33,807$ 22,638$
42 04 SCl 880 61,802$ 39,842$ I-880 Widening (SR 237 to US 101) (EA29830)
8/10/11 12/14/11 100 07/01/13 04/04/14 100 08/01/14 06/20/17 100 Caltrans 9,810$ 6,709$ 32,192$ 31,783$
43 04 SCl 101 73,199$ 55,871$ US 101 Aux Lanes - State Route 85 to Embarcadero Rd (EA 4A330)
8/10/11 11/17/11 100 08/01/13 11/16/15 100 09/01/14 04/11/18 100 Caltrans 11,080$ 10,837$ 44,791$ 42,431$
44 04 SCl 101 49,611$ 16,636$ US 101 Improvements (I-280 to Yerba Buena Rd) (EA 1A980)
1/13/10 10/01/10 100 06/01/13 10/31/12 100 06/01/14 10/03/14 100 Caltrans 6,690$ 6,619$ 31,201$ 26,047$
37 11 SD 15
08 SBd 215
40 05 SLO 46
38 11 SD 5
41 04 SM 101
California Department of Transportation FY 2017-18 Third Quarter Report
Corridor Mobility Improvement Program Page 6 of 14

CONSTRUCTION SUPPORT CONSTRUCTION CAPITALPR
OJE
CT
NU
MB
ER
DIS
TRIC
TC
OU
NTY
RO
UTE
TO
TAL
PRO
JEC
T C
OST
($1,
000'
s)
CM
IA P
RO
JEC
T C
OST
($1,
000'
s)
PRO
JEC
T D
ESC
RIP
TIO
N
ALL
OC
ATI
ON
AW
AR
D
AW
AR
D %
Com
plet
e
APP
RO
VED
CC
AC
UR
REN
T C
CA
CC
A %
CO
MPL
ETE
FIN
AL
DEL
IVER
Y R
EPO
RT
APP
RO
VED
CLO
SEO
UT
CU
RR
ENT
CLO
SEO
UT
CLO
SEO
UT
% C
OM
PLET
E
SUPP
LEM
ENTA
L FD
R
IMPLEMENTINGAGENCY (QUARTER
BOND FUNDS FULLY EXPENDED)
APPROVED BUDGET ($1,000's)
EXPENDED ($1,000's)
APPROVED BUDGET ($1,000's)
EXPENDED ($1,000's)
45 05 SCr 1 21,085$ 13,783$ Highway 1 Soquel to Morrissey Auxiliary Lanes (EA 0F650)
8/10/11 01/05/12 100 11/01/13 02/11/15 100 12/01/14 06/30/18 SCCRTC -$ -$ 16,933$ 16,889$
46 02 Sha 5 16,315$ 13,496$ Cottonwood Hills Truck Climbing Lane (EA 37100)
1/13/10 04/21/10 100 12/01/11 11/17/11 100 12/01/12 10/23/14 100 Caltrans 2,100$ 1,247$ 11,396$ 11,396$
I-80 HOV Lanes, Fairfield (Rt 80/680/12 to Putah Creek) - Corridor Project
41,457$ 18,880$ Corridor Project #1 (EA 0A531) 2/14/08 06/04/08 100 12/01/09 12/01/09 100 Caltrans 6,351$ 4,284$ 27,906$ 28,260$
7,884$ 6,085$ Corridor Project #2 (EA 0A532) 4/8/10 10/12/10 100 09/01/11 02/29/12 100 Caltrans 1,319$ -$ 4,766$ 4,765$
30,296$ -$ Corridor Project #3 (EA 4C15U) 3/12/09 04/21/09 100 11/01/10 11/01/10 100 3,900$ 1,597$ 22,200$ 15,837$
79,637$ 24,965$ Corridor Summary 09/01/11 02/29/12 10/01/12 03/01/14 100 11,570$ 5,881$ 54,872$ 48,862$
48 04 Son 101 92,761$ 17,359$ Central Phase A - US 101 HOV Lns from Railroad Ave to Rohnert Park Expressway (EA 0A18U)
5/14/09 10/12/09 100 12/01/11 12/26/12 100 02/01/13 12/31/19 Caltrans 10,500$ 10,752$ 58,311$ 55,195$
49 04 Son 101 120,260$ 69,860$ US 101 HOV lanes - North Phase A (from Steele Lane to Windsor River Road) (EA 0A10U)
5/29/08 10/29/08 100 01/01/11 12/30/10 100 02/01/12 12/31/18 Caltrans 12,000$ 9,931$ 91,200$ 88,015$
50 04 Son 101 79,367$ 29,280$ US 101 HOV Lanes - Wilfred Ave to Santa Rosa Ave (EA 12965)
9/25/08 03/03/09 100 12/01/13 06/28/13 100 01/01/15 12/31/15 100 Caltrans 6,600$ 2,623$ 51,065$ 45,273$
51 10 Sta 219 44,353$ 8,617$ SR-219 Expressway, Phase 1 (SR-99 to Morrow Road) (EA 0A870)
1/10/08 06/19/08 100 08/01/09 06/30/10 100 11/01/09 07/28/16 100 Caltrans 2,000$ 1,947$ 6,617$ 6,617$
52 10 Sta 219 42,662$ 13,241$ SR-219 Expressway, Phase 2 (Morrow Road to Route 108) (EA 0A872)
12/15/11 08/30/12 100 05/30/14 10/30/15 100 01/13/18 09/30/18 Caltrans 4,300$ 4,172$ 17,612$ 16,442$
53 10 Tuo 108 53,392$ 25,577$ E. Sonora Bypass Stage II (EA 34042) 1/20/11 12/16/11 100 03/01/14 01/10/14 100 05/03/21 12/31/19 Caltrans 5,500$ 6,543$ 26,974$ 28,742$
54 07VenSB
101 101,163$ 81,293$ HOV Lanes, Mussel Shoals to Casitas Pass Road (EA 26070)
8/10/11 01/04/12 100 08/01/16 06/27/17 100 07/31/19 04/25/19 Caltrans 15,300$ 13,824$ 65,993$ 60,339$
CMIA projects amended into program using project cost/award savings
55 04 Son 101 17,321$ 15,000$ Central Project - Phase B (EA 0A184) 1/20/11 05/19/11 100 12/31/12 07/17/13 100 01/01/14 12/30/16 100 Caltrans 3,000$ 2,844$ 12,000$ 12,000$
56 03 Sac 80 136,035$ 53,537$ I-80 HOV Ln Across the Top (EA 3797U)
1/20/11 07/29/11 100 11/01/14 07/13/17 100 11/01/16 11/01/18 Caltrans 19,000$ 19,446$ 104,588$ 105,036$
57 10 SJ 5 124,978$ 42,470$ I-5 HOV Ln and CRCP (EA 0G470) 1/20/11 06/02/11 100 12/30/14 01/26/17 100 01/30/16 01/18/19 11,990$ 17,493$ 97,708$ 95,956$
58 05 SLO 101 47,857$ 31,174$ Santa Maria Bridge (EA 44590) 1/20/11 06/21/11 100 04/01/14 03/12/15 100 07/15/15 04/18/17 100 Caltrans 6,600$ 5,537$ 34,832$ 34,810$
59 11 SD 15 68,159$ 25,802$ Mira Mesa Direct Access Ramp (EA 2T095)
12/15/11 04/04/12 100 01/14/15 01/04/16 100 07/11/17 06/29/18 Caltrans (FY 15-16 Q3) 8,500$ 8,058$ 36,102$ 27,059$
60 02 Sha 5 22,658$ 20,903$ South Redding 6;Lane (EA 4C401) 1/20/11 05/09/11 100 11/15/12 02/01/13 100 11/15/13 09/12/18 Caltrans 2,250$ 1,950$ 18,653$ 18,643$
61 03 But 32 9,925$ 3,425$ But 32 Highway Widening (EA 1E490) 8/10/11 06/30/12 100 11/30/13 12/11/15 100 07/01/18 07/01/18 Chico -$ -$ 6,425$ 6,713$
Widen Ala 84 Expressway - Corridor Project
41,065$ 16,057$ Corridor Project #1 (EA 29761) 8/10/11 03/21/12 100 07/31/13 09/24/15 100 Caltrans 3,780$ 3,812$ 25,085$ 24,304$
97,402$ -$ Corridor Project #2 (EA 29762) 3/26/15 09/30/15 100 10/01/15 08/24/18 67 Caltrans 8,005$ 6,314$ 48,000$ 28,028$
138,467$ 16,057$ Corridor Summary 10/01/15 08/24/18 07/01/18 09/30/20 11,785$ 10,126$ 73,085$ 52,332$
63 06 Tul 198 27,266$ 21,187$ Plaza Drive IC / Aux Lns (EA 42370) 8/10/11 11/30/11 100 06/30/13 08/19/14 100 12/31/13 12/30/18 Visalia 3,617$ 3,785$ 17,570$ 18,952$
64 04 Var Var 74,984$ 36,057$ Freeway Performance Initiative (EA 0G890, 15113, 15300, 15320, 15350, 15420)
4/26/12 08/28/12 100 10/01/14 10/13/15 100 04/01/16 06/30/18 Caltrans 8,271$ 8,737$ 51,346$ 47,681$
47 04 Sol 80
62 04 Ala 84
California Department of Transportation FY 2017-18 Third Quarter Report
Corridor Mobility Improvement Program Page 7 of 14

CONSTRUCTION SUPPORT CONSTRUCTION CAPITALPR
OJE
CT
NU
MB
ER
DIS
TRIC
TC
OU
NTY
RO
UTE
TO
TAL
PRO
JEC
T C
OST
($1,
000'
s)
CM
IA P
RO
JEC
T C
OST
($1,
000'
s)
PRO
JEC
T D
ESC
RIP
TIO
N
ALL
OC
ATI
ON
AW
AR
D
AW
AR
D %
Com
plet
e
APP
RO
VED
CC
AC
UR
REN
T C
CA
CC
A %
CO
MPL
ETE
FIN
AL
DEL
IVER
Y R
EPO
RT
APP
RO
VED
CLO
SEO
UT
CU
RR
ENT
CLO
SEO
UT
CLO
SEO
UT
% C
OM
PLET
E
SUPP
LEM
ENTA
L FD
R
IMPLEMENTINGAGENCY (QUARTER
BOND FUNDS FULLY EXPENDED)
APPROVED BUDGET ($1,000's)
EXPENDED ($1,000's)
APPROVED BUDGET ($1,000's)
EXPENDED ($1,000's)
Bi-County I-215 Gap Closure - Corridor Project
65 182,802$ 15,350$ I-215 Gap Closure (EA 0M940) combined to 0M94U
6/27/12 12/03/12 100 05/01/16 08/25/15 100 Caltrans 16,270$ see 137,171$ see
17,066$ -$ SHOPP contribution to #1 800$ 15,392$
66 5,193$ 3,007$ Newport Ave OC(EA 0M94U) 6/27/12 12/03/12 100 05/01/16 08/25/15 100 Caltrans 361$ below 3,007$ below
205,061$ 18,357$ Corridor Summary 05/01/16 08/25/15 04/20/18 08/02/18 17,431$ 16,318$ 155,570$ 144,150$
67 04 Son 101 52,360$ 22,242$ North Project Phase B Airport IC (EA 3A23U)
4/26/12 12/03/12 100 12/31/13 08/03/15 100 11/01/15 12/31/19 Caltrans 4,500$ 4,461$ 33,813$ 31,620$
68 04 SCl 880 62,097$ 39,231$ I-880/I-280 Stevens Creek IC Impvmts (EA 44560)
5/23/12 09/06/12 100 12/01/14 12/30/15 100 12/01/15 06/30/18 SCVTA -$ -$ 47,197$ 44,472$
69 04 SCl 101 33,812$ 22,217$ Capitol Exp Yerba Buena IC (EA 1G360)
5/23/12 08/02/12 100 06/30/14 04/14/15 100 02/28/17 07/28/17 100 SCVTA -$ -$ 26,286$ 25,319$
70 08 SBd 15 82,912$ 16,206$ La Mesa Nisqualli Rd IC (EA 0A450) 8/10/11 12/08/11 100 12/01/13 03/05/14 100 12/01/15 05/06/16 100 SANBAG -$ 0 53,082$ 40,680$
71 11 SD 805 36,501$ 18,785$ HOV Lns - SR54 to SR94 (EA 2T180) 1/25/12 06/22/12 100 12/31/13 12/20/13 100 07/11/13 05/31/18 Caltrans 5,392$ 5,324$ 19,355$ 18,443$
72 11 SD 805 55,432$ 37,978$ HOV Lns - Palomar to SR54 (EA 2T181)
1/25/12 09/09/12 100 07/30/14 04/03/14 100 11/05/13 05/31/18 Caltrans 7,400$ 7,734$ 34,278$ 35,898$
73 05 SLO 46 55,559$ 45,088$ Whitley 2A (EA 33077) 2/23/12 05/18/12 100 09/08/15 08/15/16 100 10/01/16 07/01/20 Caltrans 7,400$ 7,126$ 37,688$ 35,415$
74 12 Ora 74 77,211$ 24,109$ SR74 / I-5 IC (EA 0E310) 4/25/12 10/19/12 100 02/02/15 11/22/16 100 12/31/18 12/31/18 Caltrans 6,364$ 8,308$ 30,231$ 25,949$
75 11 SD 805 119,000$ 40,638$ 805 Managed Lns North(Design Build) (EA 2T200)
10/26/117/30/122/26/13*
100 03/15/15 04/02/18 99 06/30/17 06/04/20 Caltrans 26,428$ 18,223$ 86,419$ 81,689$
76 02 Sha 5 7,275$ 6,000$ I5/Deschutes Rd IC (EA 34760) 5/3/12 7/26/12 100 12/15/12 01/24/14 100 05/01/13 02/26/16 100 Anderson -$ -$ 6,000$ 5,979$
77 03 Sac 50 37,151$ 12,109$ SR50 - Watt IC (EA 37120) 4/26/12 9/15/12 100 11/30/14 01/16/16 100 11/01/18 02/01/19 Sac Co -$ -$ 30,449$ 35,221$
78 05 Mon 101 91,150$ 30,825$ San Juan IC (EA 31580) 4/26/12 09/27/12 100 03/18/15 04/28/16 100 07/02/18 07/09/19 Caltrans 8,000$ 8,294$ 48,700$ 42,680$
79 05 SB 101 17,618$ 4,442$ Union Valley Pkwy IC (EA 46380) 4/26/12 07/26/12 100 12/31/13 12/27/13 100 02/03/15 02/24/15 100 Caltrans 1,900$ 1,688$ 9,234$ 8,883$
80 08 SBd 10 18,620$ 10,000$ I-10 Tippecanoe Ave IC (EA 44811) 4/26/12 07/11/12 100 07/11/13 06/24/15 100 08/01/15 06/16/16 100 SANBAG 2,000$ 2,821$ 13,787$ 13,872$
81 11 SD 76 36,889$ 29,387$ I-5 / SR 76 IC (EA 25714) 4/26/12 08/01/12 100 01/01/15 10/20/14 100 07/25/16 100 Caltrans 5,056$ 4,977$ 24,561$ 23,739$
82 03 ED 50 19,200$ 15,500$ US Route 50 HOV Ln (EA 2E510) 5/23/12 07/17/12 100 12/31/13 03/31/16 100 10/31/14 07/01/18 ED Co DOT -$ -$ 17,240$ 14,719$
83 03 ED 50 9,145$ 6,000$ Western Placerville IC Ph 1A (EA 37280)
5/23/12 11/05/12 100 06/01/15 11/30/14 100 01/15/14 11/30/20 Caltrans -$ -$ 6,000$ 7,683$
84 08 Riv 215 123,502$ 38,779$ 215 Widening Scortt to Nuevo (EA 0F162)
5/23/12 11/14/12 100 12/31/15 11/15/18 99 L 07/01/19 11/19/20 RCTC -$ -$ 98,500$ 90,649$
85 08 SBd 15 63,923$ 28,264$ I15 Ranchero Rd IC (EA 34160) 5/23/12 08/01/12 100 08/01/14 12/18/15 100 09/01/16 01/30/19 SANBAG 3,650$ 6,187$ 40,148$ 35,433$
86 04 Ala 680 7,860$ 5,740$ FPI (EA 4G100) 6/27/12 09/29/12 100 11/01/14 06/27/13 100 12/01/15 04/21/14 100 Caltrans 1,000$ 998$ 4,740$ 4,740$
87 08 SBd 15 35,274$ 12,000$ Duncan Canyon Rd IC (EA 0H130) 6/27/12 08/14/12 100 06/01/14 03/03/17 100 11/30/18 02/28/19 Fontana 2,900$ 4,550$ 26,054$ 24,315$
88 12 Ora 405 3,058$ 2,238$ Widen Ramp for Deceleration Lane (EA 0M130)
6/27/12 10/11/12 100 07/01/14 05/30/14 100 12/01/14 12/01/14 100 Caltrans 500$ 498$ 1,738$ 1,738$
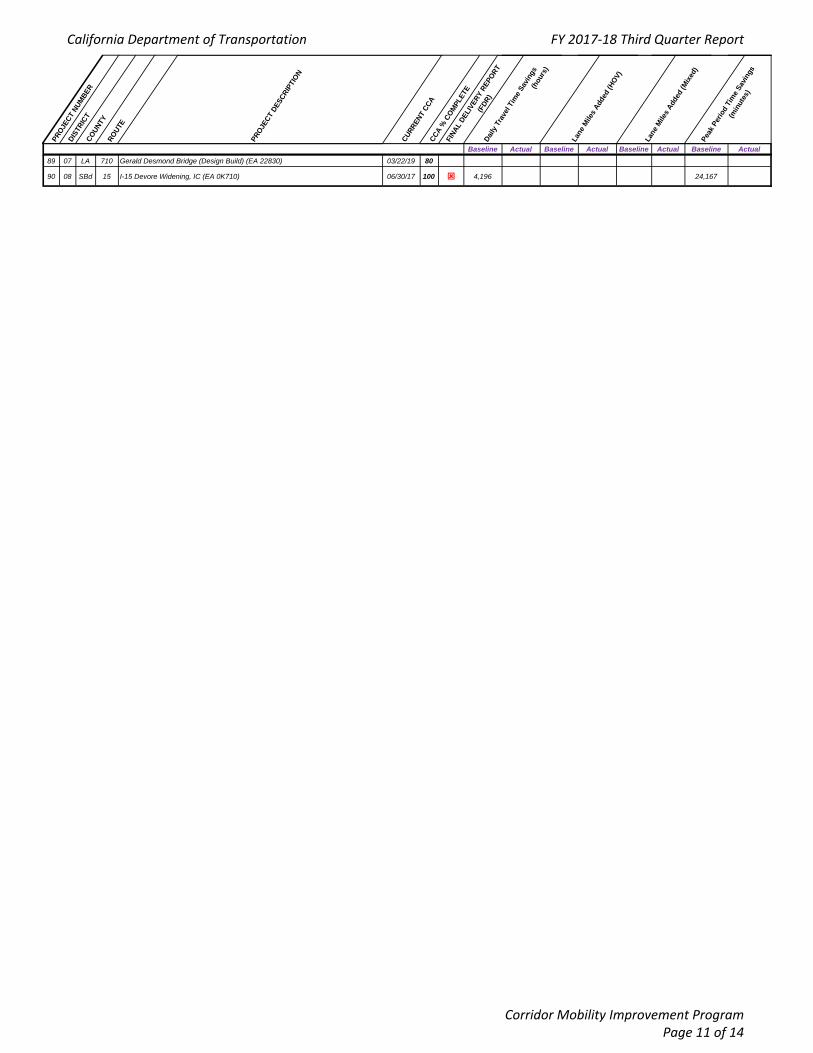
89 07 LA 710 1,336,061$ 153,657$ Gerald Desmond Bridge(Design Build) (EA 22830)
10/24/1210/1/126/11/13*
100 03/22/19 03/22/19 83 L 05/21/21 05/21/21 Port of Long Beach 97,000$ 90,773$ 864,260$ 505,712$
90 08 SBd 15 325,365$ 53,743$ I-15 Devore Widening, IC (EA 0K710) 12/6/12 11/13/12 100 03/25/16 06/30/17 100 10/25/19 06/11/19 SANBAG 26,951$ 24,938$ 239,662$ 232,818$
Totals 12,365,790$ 4,476,979$
* Design Build contract: two award dates. 1st, notice to proceed for design, 2nd, construction start
** Section 4a of CMIA report details CMIA Bond Program funding loans.
08SBd Riv
215
California Department of Transportation FY 2017-18 Third Quarter Report
Corridor Mobility Improvement Program Page 8 of 14

LEGEND - Complete - Past Due
- CCA 100% Complete N/A - Not Available
(3) CMIA Bond Program Performance Outcome - Benefits ReportThird Quarter FY 2017-18
PRO
JEC
T N
UM
BER
DIS
TRIC
TC
OU
NTY
RO
UTE
PRO
JEC
T D
ESC
RIP
TIO
N
CU
RR
ENT
CC
AC
CA
% C
OM
PLET
E
FIN
AL
DEL
IVER
Y R
EPO
RT
(FD
R)
Dai
ly T
rave
l Tim
e Sa
ving
s (h
ours
)
Lane
Mile
s A
dded
(HO
V)
Lane
Mile
s A
dded
(Mix
ed)
Peak
Per
iod
Tim
e Sa
ving
s
(min
utes
)
Baseline Actual Baseline Actual Baseline Actual Baseline Actual1 04 Ala 580 I-580 Eastbound HOV Lane - Greenville to Hacienda 05/20/16 100 3,522 257,080
2 04 Ala 580 I-580 Westbound HOV Lane - Greenville to Foothill 06/30/16 100 3,341 243,880
3 04 Ala 580 I-580 / Isabel Interchange 04/09/12 100 814 814 194,000 194,000
4 04 Ala 880 I-880 SB HOV Ln Extension - Hegenberger to Marina Blvd 04/04/16 100 3,161 230,780
5 04AlaCC
24 State Route 24 Caldecott Tunnel - Fourth Bore 03/12/15 100 10,368 10,368 825,665 825,665
6 10 Cal 4 Angels Camp Bypass (EA 36250) 09/24/09 100 184 184 4.6 4.6 7,320 7,320
7 04 CC 4 State Route 4 East Widening from Somersville to Route 160 12/29/17 99 8,561 5.9 10.2 624,920
8 04AlaCC
80 I-80 Integrated Corridor Mobility Project 05/22/17 100 5,821 463,571
9 03 ED 50 US 50 HOV Lanes 06/17/13 100 2,295 691 167,560 41,460
10 06 Ker 46 Route 46 Expressway - Segment 3 (EA 44252) 01/16/13 100 475 436 26.0 26.0 5,678 5,204
11 06KinTul
198 Route 198 Expressway (EA 3568U) 03/11/13 100 875 1,233 20.6 20.6 10,453 12,607
12 07 LA 405 I-405 Carpool Lane I-10 To US 101 (NB) (Design Build) (EA 12030) 08/17/18 97 L 22,929 1,673,840
13 07 LA 5 Interstate 5 Carpool Lane from Route 134 to Route 170 12/31/19 64 16,407 1,223,200
14 07 LA 5 I-5 Carpool Lane from Orange County Line to I-605 02/07/20 18 32,705 2,387,480
15 04Mrn Son
101 Highway 101 Marin-Sonoma Narrows 06/30/17 100 2,023 7.3 166,207
16 04 Mrn 580 Westbound I-580 to Northbound US 101 Connector Improvements (EA 4A140) 01/27/11 100 158 158 12,545 12,545
17 05 Mon 1 Salinas Road Interchange (EA 31592) 03/20/14 100 673 729 45,561 49,354
18 04Nap Sol
12 SR 12 Jameson Canyon Widening - Phase 1 05/10/16 100 3,898 3,109 6.0 6.0 310,407 175,822
19 03 Nev 49 Route 49 La Barr Meadows Widening (EA 2A690) 04/08/14 100 38 N/A 2.8 2.8 2,559 2,760
20 12 Ora 91 Add one lane on EB SR-91 from SR-241/SR-91 to SR-71/SR-91 (EA 0G040) 05/13/11 100 6,216 6,216 495,033 495,033
21 12 Ora 22 SR-22 / I-405 / I-605 HOV Connector with ITS Elements 03/23/15 100 32,099 34,805 15.5 8.8 2,343,200 2,088,300
22 12 Ora 91 Widen EB&WB SR-91 fr E of SR-55 Conn to E of Weir Canyon Road (EA 0G330) 11/01/13 100 31,946 55,166 2,544,065 4,393,265
23 12 Ora 57 Widen NB fr 0.3M S of Katella Ave to 0.3M N of Lincoln Ave (EA 0F040) 04/21/15 100 2,311 753 184,036 15,744
24 12 Ora 57 Widen NB from 0.4 m N of SR-91 to 0.1 m N of Lambert Road 11/06/14 100 16,718 22,195 1,331,385 1,767,564
25 03 Pla 65 Lincoln Bypass 10/01/14 100 3,961 3,961 268,103 268,103
26 03 Pla 80 Pla-80 HOV Phase 2 (EA 36782) 10/18/12 100 2,243 2,243 151,850 151,850
27 03 Pla 80 Pla-80 HOV Phase 3 (EA 36783) 06/17/13 100 156 672 10,571 45,600
28 08 Riv 215 Widening, Add One Mixed Flow Lane in Each Direction (EA 0F161) 11/21/13 100 2,424 2,451 193,025 195,185
29 08 Riv 91 HOV Lane Gap Closure (EA 44840) 12/19/16 100 6,771 494,280
30 03 Sac 50 Hwy 50 Bus/Carpool & Aux Lns & Community Enhancements (EA 44161) 05/10/13 100 10,888 1,953 15.0 15.0 794,860 450,818
31 03 Sac Loc White Rock Road from Grant Line to Prairie City (EA 92880) 12/01/13 100 2,679 2,679 181,319 181,319
32 08 SBd 10 Westbound Mixed Flow Lane Addition (EA 0F150) 08/10/15 100 868 79,744 3.6 3.6 69,194 1,134,588
33 08 SBd 215 I-215 North Segments 1 & 2 - HOV & Mixed Flow Ln Addition (EA 0071V) 09/17/14 100 15,636 6,624 1,141,440 162,947
Interstate 215 HOV Lanes and Connectors - Corridor Project
34 SR - 210/215 Connectors (EA 44407) combined to 4440U 03/01/13 100 2,886 2,363 3.5 2.0 343,200 172,480
35 I-215 North Segment 5 (EA 00719) combined to 4440U 03/01/13 100 2,886 2,363 3.5 2.0 343,200 172,480
Corridor Summary 03/01/13 2,886 2,363 315,720 172,480
36 08 SBd 10 Widen Exit Ramps&Add Aux Ln @Cherry, Citrus&Cedar Ave IC's (EA 49750) 12/20/12 100 3,577 3,577 284,880 284,880
37 11 SD 15 I-15 Managed Lanes 06/14/12 100 29,386 35,989 2,145,180 2,195,131
38 11 SD 5 I-5 North Coast Corridor - Stage 1A 02/13/15 100 2,605 1,916 5.6 4.0 25,574 18,774
39 10 SJ 205 I-205 Auxiliary Lanes (EA 0Q270) 03/04/13 100 3,150 2,144 125,440 85,353
40 05 SLO 46 Route 46 Corridor Improvements (Whitley 1) 10/13/14 100 2,425 2,329 164,164 157,673
41 04 SM 101 Widen US 101 & add Aux Lns fr Marsh Rd to Embarcadero Rd. 11/15/13 100 13,752 13,752 1,095,164 1,095,164
08 SBd 215
California Department of Transportation FY 2017-18 Third Quarter Report
Corridor Mobility Improvement Program Page 9 of 14

PRO
JEC
T N
UM
BER
DIS
TRIC
TC
OU
NTY
RO
UTE
PRO
JEC
T D
ESC
RIP
TIO
N
CU
RR
ENT
CC
AC
CA
% C
OM
PLET
E
FIN
AL
DEL
IVER
Y R
EPO
RT
(FD
R)
Dai
ly T
rave
l Tim
e Sa
ving
s (h
ours
)
Lane
Mile
s A
dded
(HO
V)
Lane
Mile
s A
dded
(Mix
ed)
Peak
Per
iod
Tim
e Sa
ving
s
(min
utes
)
Baseline Actual Baseline Actual Baseline Actual Baseline Actual
42 04 SCl 880I-880 Widening (SR 237 to US 101) (EA29830)
04/04/14 100 16,297 16,297 8.4 8.4 1,189,660 1,189,660
43 04 SCl 101 US 101 Aux Lanes - State Route 85 to Embarcadero Rd (EA 4A330) 11/16/15 100 2,949 2,949 6.4 6.4 234,829 234,829
44 04 SCl 101 US 101 Improvements (I-280 to Yerba Buena Rd) (EA 1A980) 10/31/12 100 3,530 3,530 281,078 281,078
45 05 SCr 1 Highway 1 Soquel to Morrissey Auxiliary Lanes (EA 0F650) 02/11/15 100 796 880 2.0 2.0 53,893 88,300
46 02 Sha 5 Cottonwood Hills Truck Climbing Lane (EA 37100) 11/17/11 100 802 293 4,788 6,240
47 04 Sol 80 I-80 HOV Lanes, Fairfield (Rt 80/680/12 to Putah Creek) 02/29/12 100 10,004 N/A 17.4 N/A 730,280 N/A
48 04 Son 101Central Phase A - US 101 HOV Lns from Railroad Ave to Rohnert Park Expressway (EA 0A18U)
12/26/12 100 3,090 2,367 225,600 172,769
49 04 Son 101US 101 HOV lanes - North Phase A (from Steele Lane to Windsor River Road) (EA 0A10U)
12/30/10 100 3,146 6,062 229,640 442,524
50 04 Son 101 US 101 HOV Lanes - Wilfred Ave to Santa Rosa Ave (EA 12965) 06/28/13 100 2,841 3,216 207,420 234,800
51 10 Sta 219 SR-219 Expressway, Phase 1 (SR-99 to Morrow Road) (EA 0A870) 06/30/10 100 940 N/A 6.7 N/A 37,418 N/A
52 10 Sta 219 SR-219 Expressway, Phase 2 (Morrow Road to Route 108) (EA 0A872) 10/30/15 100 1,302 1,221 51,851 48,611
53 10 Tuo 108 E. Sonora Bypass Stage II (EA 34042) 01/10/14 100 656 583 2.0 2.0 25,850 23,100
54 07VenSB
101 HOV Lanes, Mussel Shoals to Casitas Pass Road (EA 26070) 06/27/17 100 1,603 108,528
CMIA projects amended into program using project cost/award savings
55 04 Son 101 Central Project - Phase B (EA 0A184) 07/17/13 100 965 965 70,432 70,432
56 03 Sac 80 I-80 HOV Ln Across the Top (EA 3797U) 07/30/17 100 8,425 734,982
57 10 SJ 5 I-5 HOV Ln and CRCP (EA 0G470) 01/26/17 100 30,302 559,080
58 05 SLO 101 Santa Maria Bridge (EA 44590) 03/12/15 100 220 203 21,300 20,000
59 11 SD 15 Mira Mesa Direct Access Ramp (EA 2T095) 01/04/16 100 29,386 2,145,180
60 02 Sha 5 South Redding 6;Lane (EA 4C401) 02/01/13 100 727 727 3,600 3,600
61 03 But 32 But 32 Highway Widening (EA 1E490) 12/11/15 100 1.6
62 04 Ala 84 Widen Ala 84 Expressway 12/01/17 62 5,682 3.2 452,465
63 06 Tul 198 Plaza Drive IC / Aux Lns (EA 42370) 08/19/14 100 608 710 7,259 8,476
64 04 Var VarFreeway Performance Initiative (EA 0G890, 15113, 15300, 15320, 15350, 15420)
10/13/15 100 4,000 4,000 59,000 59,000
Bi-County I-215 Gap Closure - Corridor Project
65 I-215 Gap Closure (EA 0M940) combined to 0M94U 08/25/15 100 8.0
66 Newport Ave OC(EA 0M94U) 08/25/15 100 8.0
Corridor Summary 08/25/15 14,571 268,060
67 04 Son 101 North Project Phase B, Airport IC (EA 3A23U) 08/03/15 100 1,711 1,711 102,654 102,654
68 04 SCl 880 I-880/I-280 Stevens Creek IC Impvmts (EA 44560) 12/30/15 100 9,992 885,686
69 04 SCl 101 Capitol Exp Yerba Buena IC (EA 1G360) 04/14/15 100 3,630 281,078
70 08 SBd 15 La Mesa Nisqualli Rd IC (EA 0A450) 03/05/14 100 4,447 2,226 333,525 54,748
71 11 SD 805 HOV Lns - SR54 to SR94 (EA 2T180) 12/20/13 100 4.5 4.4
72 11 SD 805 HOV Lns - Palomar to SR54 (EA 2T181) 04/03/14 100 3.9 3.9
73 05 SLO 46 Whitley 2A (EA 33077) 08/15/16 100 2,425 2,812 11.2 11.2 164,164 205,297
74 12 Ora 74 SR74 / I-5 IC (EA 0E310) 11/22/16 100 N/A
75 11 SD 805 805 Managed Lns North (Design Build) (EA 2T200) 04/01/18 99 7.6
76 02 Sha 5 I5/Deschutes Rd IC (EA 34760) 01/24/14 100 630 630
77 03 Sac 50 SR50 - Watt IC (EA 37120) 01/16/16 100 N/A
78 05 Mon 101 San Juan IC (EA 31580) 04/28/16 100 884 662 6,424 5,479
79 05 SB 101 Union Valley Pkwy IC (EA 46380) 12/27/13 100 935 781 5,610 4,518
80 08 SBd 10 I-10 Tippecanoe Ave IC (EA 44811) 06/24/15 100 14,571 40 268,060 600
81 11 SD 76 I-5 / SR 76 IC (EA 25714) 10/20/14 100 1,132 1,132 5,773 5,773
82 03 ED 50 US Route 50 HOV Ln (EA 2E510) 03/31/16 100 947 22,728
83 03 ED 50 Western Placerville IC Ph 1A (EA 37280) 11/30/14 100 115 2,650
84 08 Riv 215 215 Widening Scortt to Nuevo (EA 0F162) 11/15/18 98 L 10,232 675,330
85 08 SBd 15 I15 Ranchero Rd IC (EA 34160) 12/18/15 100 1,400 21,191
86 04 Ala 680 FPI (EA 4G100) 06/27/13 100 1,112 1,112 0.4 0.4 0.4 0.4 11,481 11,481
87 08 SBd 15 Duncan Canyon Rd IC (EA 0H130) 03/03/17 100 1,322 24,610
88 12 Ora 405 Widen Ramp for Deceleration Lane (EA 0M130) 05/30/14 100 1,036 980
08SBd Riv
215
California Department of Transportation FY 2017-18 Third Quarter Report
Corridor Mobility Improvement Program Page 10 of 14
PRO
JEC
T N
UM
BER
DIS
TRIC
TC
OU
NTY
RO
UTE
PRO
JEC
T D
ESC
RIP
TIO
N
CU
RR
ENT
CC
AC
CA
% C
OM
PLET
E
FIN
AL
DEL
IVER
Y R
EPO
RT
(FD
R)
Dai
ly T
rave
l Tim
e Sa
ving
s (h
ours
)
Lane
Mile
s A
dded
(HO
V)
Lane
Mile
s A
dded
(Mix
ed)
Peak
Per
iod
Tim
e Sa
ving
s
(min
utes
)
Baseline Actual Baseline Actual Baseline Actual Baseline Actual89 07 LA 710 Gerald Desmond Bridge (Design Build) (EA 22830) 03/22/19 80 L90 08 SBd 15 I-15 Devore Widening, IC (EA 0K710) 06/30/17 100 4,196 24,167
California Department of Transportation FY 2017-18 Third Quarter Report
Corridor Mobility Improvement Program Page 11 of 14

(4) CMIA Bond Program Action Plans Third Quarter FY 2017-18
(4a) Major Project Issues
No project has major issues that may impact the project schedule or budget.
(4b) Project Budgets Supplemented with Local Funds No project budgets were supplemented with Local funds since the last quarterly report.
(4c) Project Action Plans (Projects with gray shading are completed and will be removed in the next quarterly report)
Project #1 – Eastbound I-580 HOV- Hacienda to Greenville #3 – Project overrun (Con Support $227) will be addressed with non-bond funds. Expenditure adjustment will be completed by March 30, 2018.
Project #2.2 – Westbound I-580 Westbound HOV Ln (Seg 2) – Project overrun (Con Cap $2,924 and Con Sup $2,927) will be addressed with non-bond funds. Expenditure adjustments underway and will be completed by March 30, 2018.
Project #4 – I-880 Southbound HOV Ln Extension- Hegenberger to Marina Blvd – Project overrun (Con Sup $100) will be addressed with non-bond funds. District will do timesheets corrections to correct overrun in CMIA. Target completion date will be March 30, 2018.
Project #15.2 – Highway 101 Marin-Sonoma Narrows, Contract A – Project overrun (Con Cap $30,684 $8,506) will be addressed with non-bond funds. The MSN B2 construction capital has multiple funding sources and % split by funding source was an issue to over-spent for CMIA funding source. The project expenditure is still under the project budget. Expenditure adjustments will be completed by June 30, 2018. Project #15.4 – Highway 101 Marin-Sonoma Narrows, Contract A2 – Project overrun (Con Sup $42,006) will be addressed with non-bond funds. The COOP with TAM has been executed. Once funding line is established, by budgets, overrun will be covered. Target completion date is May 2018. Project #59 – I-15 Mira Mesa / Scripps Ranch Direct Access Ramp – The Con Cap $32,519 shown as over expended is an accrual issue. These are not true expenditures, hence there is no expenditure adjustment to be made until final voucher. The Final Vouchering Unit has until Final Project Closeout which is expected 7/5/2019 to make the expenditure adjustment. Expenditure adjustment is now completed.
Project #62 – SR-84 Expressway Widening – Seg. 1 – Timesheet corrections underway to address the (Con Sup $680) overrun and will be completed by March 30, 2018. Project #73 – SR-46 Corridor Improvements (Whitley 2A) – Project overrun (Con Sup $120,645) will be addressed with corridor options. Construction claims process continues. District is preparing a PCR to move ITIP funds within the project to cover the over-expenditure of construction
California Department of Transportation FY 2017-18 Third Quarter Report
Corridor Mobility Improvement Program Page 12 of 14

support. Target completion for claims process is Dec 2019. Fund adjustment is expected to be completed by May 1, 2018. A corrective action plan was submitted and recommended for approval and implementation. Program guidelines allows for savings from one component to be moved to another, if the project CCA is completed. Funds will be moved from construction capital to construction support to support additional claims efforts. This recommendation was presented to CTC staff and they concur.
California Department of Transportation FY 2017-18 Third Quarter Report
Corridor Mobility Improvement Program Page 13 of 14

(5) CMIA Bond Program Funding Adjustments Third Quarter FY 2017-18
(5a) CMIA Bond Program Funding Loans
American Recovery and Reinvestment Act (ARRA) of 2009 funding loans were made in 2009 to replace CMIA funding on CMIA program projects. The CMIA program project budgets, as reported in this report include $214,459,000 of ARRA funding in accordance with Government Code, Section 8879.77. In 2009, limitations on bond sales and the enactment of the ARRA program led to legislation allowing loans in order to allocate projects ready for construction. The table below outlines the loans made and repayment of loans for the CMIA program.
Project ARRA Funding (Loan) ($1,000;s)
Repayment (CMIA Funding) ($1,000;s)
Caldecott Tunnel Fourth Bore (segment 1) $ 73,439 I-215 North Segments 1 & 2 HOV Lanes $ 49,120 La Barr Meadows $ 2,000 Route 405 Northbound HOV Lanes $ 89,900 State Highway Account Reimbursement $ 214,459 Totals $ 214,459 $ 214,459
(5b) CMIA Bond Program Funding Transfers In January 2014, the Commission established a Proposition 1B savings policy with the intention that savings accrued in the CMIA program will be used for CMIA-eligible STIP projects that commenced construction prior to December 31, 2012. To date, Caltrans has identified a total of $86.4 million in savings ($19.4 in project closeouts and $67 in projected administration savings) in the CMIA program.
Funding Transfers Project Allocated CMIA Funds
Administration Budget
Program Budget, Allocations through Dec. 31, 2012 $ 4,410.0 million $ 90 million Project Closeout Savings – de-allocated -$ 19.4 million Project Closeout Savings – re-allocated to projects $ 19.4 million Administration Savings – re-allocated to projects $ 67.0 million -$ 67 million Revised Allocated Budget Totals $ 4,477 million $ 23 million
California Department of Transportation FY 2017-18 Third Quarter Report
Corridor Mobility Improvement Program Page 14 of 14

FY 2017-18 Third Quarter Report
State Route 99 Program
Quarterly Report to the California Transportation
Commission

‐$200.0$0.0
$200.0$400.0$600.0$800.0
08‐09 09‐10 10‐11 11‐12 12‐13 13‐14 14‐15 15‐16 17‐18 Total
Actual $12.3 $185. $56.6 $601. $62.8 $48.6 ‐$10. $5.3 $961.
In the SR99 Bond Program budget, $766 million was allocated for construction. In addition, $196 million has been allocated for right of way and engineering support costs. $6 million is set aside for bond administrative costs, leaving $32.1 million uncommitted. Additional projects will be programmed using program guidelines. SR99 Program Allocations by FY (millions)
(1) SR99 Bond Program Summary Third Quarter FY 2017-18
(1a) SR99 Bond Program Funding
#Contracts Project Allocated Funds % Allocated
SR99 Bond Program funds allocated to projects: 1281 1$962 million1 196%1
One additional project, District 3 EA 1H380 - SR 99 Auxiliary Lanes Project, from I-5 Connector to W Elkhorn Blvd Overcrossing, received allocations in RW Support, PAED, PSE, Con Support and Con Capital Totaling $5,295,000 in March 2018, reducing the uncommitted balance from $37.4 million during this quarter to $32.1 million.
(1b) SR99 Bond Program Funding Loans
American Recovery and Reinvestment Act (ARRA) of 2009 funding loans were made in 2009 to replace SR99 funding on a SR99 program project. The SR99 program project budget, as reported in this report includes $19,061,000 of ARRA funding in accordance with Government Code, Section 8879.77. In 2009, limitations on bond sales and the enactment of the ARRA program led to legislation to allow for loans in order to allocate projects ready for construction.
California Department of Transportation FY 2017-18 Third Quarter Report
State Route 99 Corridor ProgramPage 1 of 8

(1c) SR99 Bond Program Funding and Contributor Funds
Project Expenditures Percent Expended
88%1 SR99 Bond Program project funds expended to date: 1$878 million1 SR99 Bond Program project funds expended reported last quarter: 1$876 million1 88%1
In the SR99 Bond Program's $1 billion dollar budget, $962 million has been allocated to projects from SR99 Bond Program funds. In addition, $390 million has been committed from other contributor funds to increase the total value of projects in the SR99 Bond Program to $1,352 million. The table below shows how SR99 Bond Program funds and contributor funds were distributed, as well as expenditures to date for SR99 Bond Program funds.
SR99 Bond Program Funding and Contributor Funds by Component (millions)
Total Funds Other Funds SR99 Bond Program Funds Allocated Expended Percent
Construction $ 128.3 $ 12.2 $ 116.1 $ 113.7 98 % Support
Capital $ 881.5 $ 115.4 $ 766.4 $ 699.4 91 % Right of Way
$ 19.2 $ 8.2 $ 11.0 $ 9.0 82 % Support Capital $ 187.1 $ 133.2 $ 53.9 $ 37.4 69 %
Preliminary Engineering $ 135.5 $ 121.0 $ 14.5 $ 13.7 94% Support
Committed Subtotal $ 1,351.9 $ 390.0 $ 961.9 $ 873.2 91% Uncommitted $ 32.1Percent uncommitted 3.7%Bond Administration $ 6.0 $ 5.1 85 % Program Total $ 1,000.0 $ 878.3 88 %
California Department of Transportation FY 2017-18 Third Quarter Report
State Route 99 Corridor ProgramPage 2 of 8

have received SR99 Bond Program funds. Some projects $400.0 were constructed in stages,resulting in a total of 28 $200.0 construction contracts being administered. $0.0
$600.0
11‐12
Actual
12‐13
Actual
13‐14
Actual
14‐15
Actual
15‐16
Actual
16‐17
Actual
17‐18
Plan
18‐19
Plan
Total
SR99 Bond Program Construction Contracts by Fiscal Year of Completion (millions)
SR99 Dollars Total Dollars
(1d) SR99 Bond Program Project Completions
# Contract Completed
Percent Contracts Completed
27 96 SR99 Bond Program construction contracts completed to date:
SR99 Bond Program construction contracts completed reported last
quarter:
27 100
To date, a total of 24 projects
A new project, 3 EA 1H380 - SR 99 Auxiliary Lanes Project, from I-5 Connector to W Elkhorn Blvd Overcrossing, received SR99 allocations on March 21, 2018 per resolution R99-A-1718-03 in the amount of $ 5,295,000, no expenditures were noted in this third quarter.
SR99 Bond Program Completions – Projects and Dollars (millions)
Contracts Accepted In Plant Establishment
Contracts Under Construction
All SR99 Bond Program Contracts
# Total Funds
SR99 Funds
# FDR's
# Total Funds
SR99 Funds
# Total Funds
SR99 Funds
# Total Funds
SR99 Funds
FY 11-12 1 $ 22 $ 22 1 1 $ 22 $ 22FY 12-13 2 $ 15 $ 11 2 2 $ 15 $ 11FY 13-14 1 $ 32 $ 19 1 1 $ 32 $ 19FY 14-15 8 $340 $259 6 8 $ 340 $ 259FY 15-16 10 $547 $388 3 10 $ 547 $ 388FY 16-17 3 $130 $ 93 5 3 $ 130 $ 93FY 17-18 2 $257 $166 1 2 $ 257 $ 166FY 18-19 0 $ 0 $ 0Total Value 27 $1,343 $957 19 0 $ 0 $ 0 27 $1,343 $ 957
28 $1,352 $ 962
The status of final delivery reports (FDR) to be completed within six months after construction contracts are accepted, is outlined in the table above. Some rounding may occur.
California Department of Transportation FY 2017-18 Third Quarter Report
State Route 99 Corridor ProgramPage 3 of 8

LEGENDEstimated cost within budgetBaseline budget exceeded, non-bond funds added. No CTC action required.All bond funds exceeded. Project teams are making expenditure adjustments (adding non-bond funds if necessary) and reviewing project charges. The quarter in which the bond funds were fully expended has been added to the table below so that the timeliness of corrective actions can be monitored.CCA 100% CompleteMilestone Behind Schedule - Complete - Past Due PE - Plant Establishment
.(2) State Route 99 Bond Program Current Status and Project Expenditure Report
Support CapitalCONSTRUCTION
PR
OJE
CT
NU
MB
ER
DIS
TRIC
TC
OU
NTY
RO
UTE
TOTA
L P
RO
JEC
T C
OS
T
($1,
000'
s)
SR
99 P
RO
JEC
T C
OS
T
($1,
000'
s) L
ST
QTR
PR
OJE
CT
DE
SC
RIP
TIO
N
ALL
OC
ATI
ON
AW
AR
D
AW
AR
D %
CO
MPL
ETE
AP
PR
OV
ED
CC
AC
UR
RE
NT
CC
AC
CA
% C
OM
PLE
TE
FIN
AL
DE
LIV
ERY
RE
PO
RT
AP
PR
OV
ED
CLO
SE
OU
TC
UR
RE
NT
CLO
SEO
UT
CLO
SE
OU
T C
OM
PLE
TE
SU
PP
LEM
EN
TAL
FDR
IMPLEMENTINGAGENCY (QUARTER
BOND FUNDS EXPENDED) A
pp
rove
d
Ap
pro
ved
Exp
end
ed
Exp
end
ed
1 03 But 99 38,349$ 20,969$ Butte SR 99 Chico AuxilliaryLanes - Phase II
1/20/11 7/8/11 100 2/18/15 2/18/15 100 10/15/15 4/30/21 Caltrans 4,394$ 5,506$ 27,290$ 23,302$
Island Park 6-Lane - Corridor Project
22,313$ 22,313$ Corridor Project #1 (EA 44261) 1/13/10 8/10/10 100 9/1/12 2/3/12 100 Caltrans 3,313$ 3,313$ 16,915$ 16,914$
65,481$ 65,481$ Corridor Project #2(EA 44262) 4/26/12 10/10/12 100 7/1/16 5/20/16 100 Caltrans (FY 16-17 Q1) 8,500$ 8,602$ 44,000$ 43,622$
87,794$ 87,794$ Corridor Summary 7/1/16 5/20/16 100 7/1/18 7/1/19 11,813$ 11,915$ 60,915$ 60,536$
3 06 Mad 99 93,802$ 59,402$ Reconstruct Interchange at Avenue 12 6/27/12 12/7/12 100 6/13/16 6/13/16 100 7/1/18 7/1/18 Caltrans 8,000$ 7,956$ 48,802$ 43,746$
4 10 Mer 99 115,758$ 79,425$ Arboleda Road Freeway
12/15/11 5/14/12 100 5/1/15 5/18/15 100 5/1/16 3/1/22 Caltrans 9,906$ 9,136$ 68,560$ 68,000$
5 10 Mer 99 76,611$ 65,869$ Freeway Upgrade & Plainsburg Road I/C 2/23/12 7/12/12 100 5/10/16 5/10/16 100 7/10/18 7/10/18 Caltrans 10,000$ 9,128$ 51,398$ 44,869$
6 03 Sac 99 7,446$ 5,806$ Add Aux Lane Calvine to North of Mack Rd on 99
2/25/10 6/23/10 100 2/1/13 2/1/13 100 2/1/17 9/29/16 Caltrans 750$ 747$ 5,506$ 5,299$
7 03 Sac 99 32,470$ 18,529$ SR 99/Elverta Rd. Interchange
2/23/12 5/28/12 100 4/1/14 3/7/14 100 7/1/14 10/1/18 Sac Co -$ -$ 25,270$ 24,757$
8 10 SJ 99 214,458$ 132,256$ SR 99 (South Stockton)Widening
6/27/12 12/3/12 100 12/30/16 9/20/17 100 12/5/18 7/1/20 Caltrans (FY 16-17 Q3) 20,000$ 20,630$ 113,958$ 101,797$
SR 99 Widening in Manteca and San Joaquin - Corridor Project
-$ Corridor PAED (EA 0E610)
42,178$ 35,894$ Corridor Project #1 (EA 0E611) 12/15/11 3/27/12 100 1/7/15 1/7/15 100 Caltrans 5,250$ 5,127$ 30,644$ 29,416$
44,996$ 38,183$ Corridor Project #2 (EA 0E612) 1/25/12 6/27/12 100 10/12/15 10/12/15 100 Caltrans 6,750$ 6,589$ 29,543$ 27,348$
65,350$ 12,143$ Corridor Project #3 (EA 0E613) 6/27/12 10/11/12 100 12/15/15 12/15/15 100 Caltrans 7,500$ 6,923$ 29,481$ 27,176$
152,524$ 86,220$ Corridor Summary 10/1/15 12/15/15 100 12/4/17 6/29/18 19,500$ 18,639$ 89,668$ 83,940$
10 03 Sut 99 31,082$ 19,264$ SR 99 / Riego Road Interchange
3/29/12 10/1/12 100 1/1/15 6/30/15 100 1/1/17 7/1/18 Caltrans 3,500$ 3,500$ 20,062$ 19,772$
2 06 99Fre Mad
9 10 SJ 99
California Department of Transportation FY 2017-18 Third Quarter Report
State Route 99 Corridor ProgramPage 4 of 8

Support CapitalCONSTRUCTION
PR
OJE
CT
NU
MB
ER
DIS
TRIC
TC
OU
NTY
RO
UTE
TOTA
L P
RO
JEC
T C
OS
T
($1,
000'
s)
SR
99 P
RO
JEC
T C
OS
T
($1,
000'
s) L
ST
QTR
PR
OJE
CT
DE
SC
RIP
TIO
N
ALL
OC
ATI
ON
AW
AR
D
AW
AR
D %
CO
MPL
ETE
AP
PR
OV
ED
CC
AC
UR
RE
NT
CC
AC
CA
% C
OM
PLE
TE
FIN
AL
DE
LIV
ERY
RE
PO
RT
AP
PR
OV
ED
CLO
SE
OU
TC
UR
RE
NT
CLO
SEO
UT
CLO
SE
OU
T C
OM
PLE
TE
SU
PP
LEM
EN
TAL
FDR
IMPLEMENTINGAGENCY (QUARTER
BOND FUNDS EXPENDED) A
pp
rove
d
Ap
pro
ved
Exp
end
ed
Exp
end
ed
11 03 Sut 99 56,725$ 53,211$ Sutter 99 Segment 2
1/13/10 7/14/10 100 12/1/15 5/15/15 100 12/1/17 7/31/18 Caltrans 8,500$ 8,493$ 43,731$ 41,284$
Los Molinos - Staged Construction Project
Stage #1 1/13/10 5/5/10 100 12/31/12 4/20/11 100
Stage #2 1/25/12 5/31/12 100 5/15/13 5/15/13 100 Caltrans 838$ 811$ 4,723$ 4,577$
588$ -$ Enhancements
7,574$ 4,705$ Corridor Summary 12/31/12 5/15/13 100 1/25/16 1/25/16
Goshen to Kingsburg 6-Lane - Corridor Project
101,445$ 86,675$ Goshen to Kingsburg 6-Lane 5/20/10 1/4/11 100 11/2/15 11/2/15 100 Caltrans 13,450$ 14,775$ 75,863$ 74,067$
4,944$ 4,944$ Landscape Mitigation 6/27/12 10/1/12 100 8/1/18 2/24/17 PE Caltrans (FY16-17 Q1 ) 700$ 813$ 3,752$ 3,088$
106,389$ 91,619$ Corridor Summary 8/1/18 8/1/18 100 10/1/20 10/1/20 14,150$ 15,588$ 79,615$ 77,155$
SR 99 projects amended into program using project cost/award savings
14 03 Sut 99 18,233$ 16,333$ SR 99/113 Interchange
6/27/12 10/16/12 100 12/1/14 8/13/14 100 12/1/16 2/1/16 Caltrans 2,500$ 2,453$ 13,833$ 12,844$
15 06 Tul 99 52,707$ 46,927$ Tulare to Goshen 6 Ln
6/27/12 12/7/12 100 6/24/16 6/24/16 100 10/6/18 10/6/18 Caltrans (FY 16-17 Q1) 8,200$ 8,437$ 38,727$ 37,540$
16 06 Ker 99 27,350$ 24,600$ South Bakersfield Widening
6/27/12 10/24/12 100 11/15/14 9/18/14 100 11/15/16 3/1/17 Caltrans 3,600$ 3,557$ 21,000$ 20,823$
17 10 Sta 99 42,849$ 33,401$ Kiernan IC
6/27/12 12/11/12 100 7/22/16 10/17/17 100 L 1/22/18 12/15/19 Sta Cty -$ -$ 33,401$ 33,072$
18 06 Ker 99 10,203$ 9,003$ North Bakersfield Widening
10/24/12 2/21/12 100 12/1/13 7/10/14 100 12/1/15 7/1/17 Caltrans 1,500$ 1,498$ 7,500$ 7,356$
19 10 Mer 99 65,880$ 46,521$ Merced Atwater Expwy Ph 1A
3/5/13 6/19/13 100 12/30/16 10/12/16 100 2/28/19 5/28/19 MCAG -$ -$ 46,521$ 40,594$
20 03 Sac 99 8,981$ 5,000$ Elk Grove Blvd SR99 IC
3/5/13 8/1/13 100 8/1/14 10/16/15 100 12/1/14 10/30/17 Elk Grove -$ 850$ 6,896$ 6,307$
21 03 Sac 99 1,930$ 1,108$ Elkhorn Blvd IC
5/7/13 7/1/13 100 7/30/15 7/30/15 100 5/1/17 10/20/17 Sacramento -$ 360$ 1,330$ 1,298$
22 10 Sta 99 59,551$ 41,630$ Pelandale Ave IC
10/8/13 3/12/14 100 12/15/16 6/30/17 100 12/1/18 8/1/19 Modesto 50$ -$ 42,130$ 39,284$
23 06 Tul 99 36,050$ 7,000$ Cartmill Interchange
1/29/14 6/3/14 100 6/7/16 6/7/16 100 7/1/18 7/30/21 Tulare Cty -$ 3,781$ 28,181$ 24,709$
24 03 Sac 99 7,095$ 5,295$ West Elkhorn Auxiliary Lanes
3/29/18 1,200$ -$ 5,100$ -$
1,351,811$ 961,887$
4,705$ 6,986$
99
12 02 Teh 99
13 06 Tul
*Section 1B of SR99 report details SR99 Bond Program funding loansTotal Cost
California Department of Transportation FY 2017-18 Third Quarter Report
State Route 99 Corridor ProgramPage 5 of 8

LEGEND - Complete - Past Due PE - Plant Establishment
State Route 99 Bond Program Benefits Report
*Reported Actual Benefits are being verified for accuracyP
RO
JEC
T N
UM
BE
R
DIS
TRIC
TC
OU
NTY
RO
UTE
PR
OJE
CT
DE
SC
RIP
TIO
N
CU
RR
EN
T C
CA
CC
A %
CO
MP
LETE
FIN
AL
DE
LIV
ER
Y
RE
PO
RT
Dai
ly T
rave
l Tim
e Sa
ving
s (h
ours
)
Lane
Mile
s A
dded
Peak
Per
iod
Tim
e S
avin
gs
(min
utes
)
Baseline Actual * Baseline Actual * Baseline Actual *
1 03 But 99Butte SR 99 Chico AuxilliaryLanes - Phase II
2/18/15 100 87.7 1.8 20,684 2,600
2 6Fre Mad 99 Island Park 6-Lane 5/20/16 100 1,795 1,795 42,881 42,881
3 06 Mad 99Reconstruct Interchange at Avenue 12
6/13/16 100 32 2,533
4 10 Mer 99Arboleda Road Freeway
5/18/15 100 87 85 16.2 6,951 6,752
5 10 Mer 99Freeway Upgrade & Plainsburg Road I/C 5/10/16 100 66 5,285
6 03 Sac 99Add Aux Lane Calvine to Northof Mack Rd on 99
2/1/13 100 2,914 2,914
7 03 Sac 99SR 99/Elverta Rd. Interchange
3/7/14 100 6,420 6,420
8 10 SJ 99SR 99 (South Stockton)Widening
9/20/17 100 4,722 7.2 376,053
SR 99 Widening in Manteca and San Joaquin
12/15/15 100 12,592 11,321 16.8
10 03 Sut 99SR 99 / Riego Road Interchange
6/30/15 100 65 1,082
11 03 Sut 99Sutter 99 Segment 2
5/15/15 100 6.6 1,010
Los Molinos 5/15/13 100
Goshen to Kingsburg 6-Lane 8/1/18 100 20.3
14 03 Sut 99SR 99/113 Interchange
8/13/14 100 277 110
15 06 Tul 99Tulare to Goshen 6 Ln
6/24/16 100
9 10 SJ 99
12 02 Teh 99 Not Applicable-Pedestrian/Bicycle facilities
13 06 Tul 99
California Department of Transportation FY 2017-18 Third Quarter Report
State Route 99 Corridor ProgramPage 6 of 8

*Reported Actual Benefits are being verified for accuracy
PR
OJE
CT
NU
MB
ER
DIS
TRIC
TC
OU
NTY
RO
UTE
PR
OJE
CT
DE
SC
RIP
TIO
N
CU
RR
EN
T C
CA
CC
A %
CO
MP
LETE
FIN
AL
DE
LIV
ER
Y
RE
PO
RT
Dai
ly T
rave
l Tim
e Sa
ving
s (h
ours
)
Lane
Mile
s A
dded
Peak
Per
iod
Tim
e S
avin
gs
(min
utes
)
Baseline Actual * Baseline Actual * Baseline Actual *
16 06 Ker 99South Bakersfield Widening
9/18/14 100 3,061 3,265 117,240 77,999
17 10 Sta 99Kiernan IC
10/17/17 100 L 3,276 155,500
18 06 Ker 99North Bakersfield Widening
7/10/14 100 1510 1,062 25,371
19 10 Mer 99Merced Atwater Expwy Ph 1A
10/12/16 100 209 14,765
20 03 Sac 99Elk Grove Blvd SR99 IC
10/16/15 100 630 650 25,750 19,390
21 03 Sac 99Elkhorn Blvd IC
7/30/15 100 145 1,600
22 10 Sta 99Pelandale Ave IC
6/30/17 100 6,595 79,140
23 06 Tul 99Cartmill Interchange
6/7/16 100 Not Applicable-Modify Interchange
California Department of Transportation FY 2017-18 Third Quarter Report
State Route 99 Corridor ProgramPage 7 of 8

(3) SR99 Action Plans Third Quarter FY 2017-18
(3a) Major Project Issues
The following projects have major issues that may result in action plans at a later date to adjust the project schedule or budget.
Project #2 Island Park 6-lane Construction Support over-expenditures are a result of construction contractor resolution process. The Final Estimate was run in October and is complete. Construction Support over-expenditures have been investigated. It is anticipated changes will be corrected next quarter and will result in eliminating the over-expenditures.
Project # 8 SR 99 (South Stockton) Widening District proposes to increase R/W Support from $7,000,000 to $8,100,000 and Construction Support from $20,000,000 to $22,000,000, it is also proposed to decrease R/W Capital from $55,470,000 to $39,605,000 so there will be a significant net decrease in the total project cost. All changes are pending the confirmation of EAC values.
Project #13 Goshen to Kingsburg 6 Ln Landscape Mitigation Construction Support over-expenditures are suspected to be a result of mischarging to a parent project. It is anticipated that these charges will be corrected next quarter and will result in eliminating the over-expenditures.
Project #15 Tulare to Goshen 6 Ln Construction Support over-expenditures are resulting from contractor disputes and potential claims resolution. Negotiations with the contractor are complete. A Final Estimate has been processed and accepted by the Contractor. Construction Support over-expenditures have been investigated. It is anticipated that charges will be corrected next quarter and will result in eliminating the over-expenditures.
California Department of Transportation FY 2017-18 Third Quarter Report
State Route 99 Corridor ProgramPage 8 of 8
FY 2017-18 Third Quarter Report
Local Bridge Seismic Retrofit Program
Federal Fiscal Year 2018
Quarterly Report to the California Transportation
Commission

California Department of Transportation FY 2017-18 3rd Quarter Report
Proposition 1B Local Bridge Seismic Retrofit Program Page 1 of 6
Local Bridge Seismic Retrofit Program Status Third Quarter Fiscal Year 2017-18
The purpose of this report is to provide information on program delivery status of the Local Bridge Seismic Retrofit Program (LBSRP) for the 479 bridges adopted by the California Transportation Commission (Commission) on May 28, 2007. In previous quarterly reports, we have reported changes that had reduced the number of bond funded bridges to 375. The Highway Safety, Traffic Reduction, Air Quality and Port Security Bond Act of 2006 (Prop 1B) provides $125 million of state matching funds to complete LBSRP. These funds are to be allocated to provide the 11.47 percent required local match for right of way and construction phases of the remaining seismic retrofit work on local bridges, ramps, and overpasses, and includes $2.5 million set aside for bond administrative costs. An additional $32.9 million of state funds has been identified to cover the non-federal match. These funds are available through an exchange of a portion of local funds received from the federal Highway Bridge Program (HBP). These funds are available to accommodate the current $7.7 million shortfall in required local match. Consistent with the Local Bridge Seismic Retrofit Account (LBSRA) Guidelines adopted by the Commission, the Department sub-allocates
bond funds on a first come, first serve basis for new phases of right of way and construction. The Commission has allocated $13.3 million, $4.4 million, $12.2 million, 5.2 million, $4.1 million, $11.2 million, 7 million, 10.2 million, 9.8 million, and $2.2 million bond funds for Fiscal Years (FYs) 2007-08, 2008-09, 2009-10, 2011-12, 2012-13, 2013-14, 2014-15, 2015-16, 2016-17, and 2017-18 respectively. The Department did not request a bond allocation from the Commission for FY 2010-11. The bond funds allocated by the Commission are available for sub-allocation in one fiscal year. Therefore, bond funds that were not sub-allocated from any of the previous FYs will be available for future years. Consistent with the LBSRA Guidelines, the Department has exchanged $24.3 million of the local share of funds received through the federal HBP for state funds to accommodate local non-federal match needs for Bay Area Rapid Transit (BART) and other bridges. To date, $21.64 million of State match funds and $64.1 million of seismic bond funds have been sub-allocated to local agency bridges for a total of $85.74 million. The match needs for FY 2010/11 used state funds remaining from the exchange mentioned above.
This report satisfies the Commission’s quarterly reporting requirement for Proposition 1B Quarterly Report on the LBSRP.

California Department of Transportation FY 2017-18 3rd Quarter Report
Proposition 1B Local Bridge Seismic Retrofit Program Page 2 of 6
Local Bridge Seismic Retrofit Program Progress Report
Overall Bond Program Status To date, pre-strategy work has been completed on all 375 bridges in the program, the design phase has been completed on 325 bridges, construction is underway on 14 bridges, and retrofit is complete on 311 bridges. Progress of LBSRP is tracked based on the Federal Fiscal Year (FFY). Project Benefits The result of seismically retrofitted bridges are bridges that are safe from collapse during a credible earthquake.
FFY 2018 Bond Program Accomplishments Progress continues to be made to deliver and implement the LBSRP. Local agencies have identified six bridges to be delivered in FFY 2018. The following bridges completed major project delivery milestone in the last quarter:
Ten Longest Delivery Schedules Reported by Local Agencies
District Local Agency Bridge
Number
Project Description Estimated
Bond Value
Estimated
Construction
Begin Date
Design phase
(% Complete)
as of 12/31/17
Design Phase
(% Complete)
as of 3/31/18
04 Orinda 28C0331 Bear Creek $11,929 10/1/20 50* 10
01 Humboldt County 04C0055 Mattole Road $688,200 10/2/20 50 50
04 Orinda 56C0330 Miner Road $144,000 12/1/20 10 10
04 Contra Costa County 28C0442 Marsh Drive $506,928 1/4/21 0 15
08 Lake Elsinore 56C0309 Auto Center Drive $379,794 2/1/21 0 0
08 Barstow 54C0583 Yucca Street $50,000 7/5/21 0 0
11 Imperial County 58C0014 Forrester Road $725,569 8/21/21 0 0
08 Barstow 54C0089 North 1st Avenue $82,010 9/1/21 0 0
04 Sonoma County 20C0018 Bohemian Highway $2,992,454 5/2/22 15 15
11 Oceanside 57C0010 Douglas Boulevard $743,065 11/12/23 0 0
*Design phase (% Complete) reduction from 50% to 10% was due to reporting error in the previous quarter by the local agency.
Local Agency
Br. No. Project Milestone
Pittsburg 28C0165 North Parkside Drive Move to Construction

California Department of Transportation FY 2017-18 3rd Quarter Report
Proposition 1B Local Bridge Seismic Retrofit Program Page 3 of 6
Program Management The following table shows the list of LBSRP bridges that are programmed for delivery in
FFY 2018. Each project in the LBSRP is monitored at the component level for potential scope, cost, and schedule changes to ensure timely delivery of the full scope as approved and adopted. The following projects are locked in for delivery in FFY 2018 and local agencies will not be allowed to change their schedules. Projects programmed in the current FFY, for which federal funds are not obligated by end of the FFY, may be removed from fundable element of the Federal Transportation Improvement Program at the discretion of the Department.
Bridges Programmed in FFY 2018
District Agency Bridge
Number Description Phase Bond Amount Programmed
Bond Funds Sub-
Allocated as of
3/31/18
State Fund
04 San Francisco County Transportation Authority
YBI On east side of Yerba Buena Island, Reconstruct ramps on and off of I-80
Construction (AC Conversion)
$910,145
04 Pittsburg 28C0165 North Parkside Drive Construction $32,690 $32,690
04 Oakland 33C0148 23rd Avenue, over UP, BNSF, Amtrak
Construction $1,149,868
04 Oakland 33C0215 Leimert BLVD, over Sausal Creek
Right of Way
$28,675
06 Bakersfield 50C0021 R & L
Manor Street, over Kern River
Construction $60,103
08 Indio 56C0292 North Bond Indio BLVD, over Whitewater River
Right of Way
$5,735
Total $2,187,216 $32,690
Allocation Summary
Funds allocated for FY 2017-18
Sub-allocation as of 3/31/2018 Remaining Allocation for
FFY 2018 Projects programmed in FFY 2018 Projects advanced to FFY 2018
Number of Projects Amount Number of projects
Amount
Bond $2,187,216 1 32,690 $2,154,526 State $2,645,341* $2,645,341 Total $4,832,557 1 32,690 $4,799,867
*Remaining state allocation carried over from FY 2008-09

California Department of Transportation FY 2017-18 3rd Quarter Report
Proposition 1B Local Bridge Seismic Retrofit Program Page 4 of 6
LBSRP Bond and State Capital Allocations (millions)
Funds are tracked based on a Federal Fiscal Year. Sub-Allocation is based on the approved program supplement. The projected bond fund is lowered due to use of toll credit instead of bond match for R/W phase of 6th street in City of Los Angeles. * Projection is based on LA-ODIS information for first quarter of FFY 2017-18. These Projections are not financially constraint and should not be used for budgeting purposes. High cost projects programmed after FY 2011-12 will be cash managed since there is not sufficient federal fund to fully fund these projects. Therefore the need for bond funds matching federal funds for these cash managed projects will be well beyond 2019 federal fiscal year.
Number of Bond Funded Bridges by Phase
Bond Funds Committed and Expended (millions)
Component Available CTC Allocated Expended LBSRP Bond RW & Const. $122.5 $79.65 $64.1
State RW & Const. $32.9 $24.30 $21.64 Total $155.4 $103.95 $85.74
Bond Administrative Cost $2.5 $2.5 $2.5
Prior 11-12 12-13 13-14 14-15 15-16 16-17 17-18 18-19 19-20 TotalBaseline (State, Bond) $51.60 $4.20 $5.10 $12.50 $7.80 $14.80 $9.80 $4.50 $10.40 $14.00 $134.70Projection (State, Bond)* $47.40 $4.10 $4.20 $11.00 $7.90 $10.03 $7.45 $3.30 $15.70 $19.20 $130.28Allocated (Bond) $29.90 $5.20 $4.10 $11.20 $7.02 $10.24 $9.79 $2.20 $79.65Sub-Allocated (Bond) $29.90 $3.70 $4.00 $7.10 $1.31 $9.02 $9.08 $64.11Allocated (State) $24.30 $0.00 $0.00 $0.00 $0.00 $0.00 $0.00 $24.30Sub-Allocated (State) $20.17 $0.41 $0.75 $0.17 $0.14 $0.00 $0.00 $21.64
$0
$30
$60
$90
$120
$150
14%4%
82%
Post-Strategy
Under Construction
Completed

California Department of Transportation FY 2017-18 3rd Quarter Report
Proposition 1B Local Bridge Seismic Retrofit Program Page 5 of 6
Status of Local Bridges Identified to Receive Bond Match by Phase of Work
Some agencies have requested to Re-Strategy two bridges that completed Pre-Strategy phase. They have not send in their formal request. Status of phases provided in this table is confirmed by the Department and may be different from the attached report, which contains unconfirmed data submitted by local agencies.
Adjustment to the Number of Local Bridges Identified to Receive Bond Match
Total
Bridges in the Program
Number of Bridges
Removed
Number of Bridges Added
Responsible Agency
Justification
Remaining Bridges in the Bond Program
479 45 Bay Area Rapid Transit (BART)
Funded by other sources
434
434 8 YBI Project Split 442 442 2 San Jose Bridges Demolished 440 440 1 Monterey County Private Ownership 439 439 3 Santa Barbara Private Ownership 436
436 1 Department of Water Resources
Private Ownership 435
435 2 Los Angeles County Previously Completed 433 433 1 Los Angeles County Private Ownership 432
432 1 Merced County Being replaced under a different program
431
431 1 Peninsula Joint Powers
Board Funded by other
sources 430
430 2 Lassen County Funded by other sources
428
428 1 Santa Barbra County Funded by other
sources 427
427 1 Santa Clara County Funded by other
sources 426
Agency Group Number of Agencies
Bridges in Pre-
Strategy
Bridges in Post-Strategy
Bridges in Construction Completed Total No.
Los Angeles Region (CITY and County) 2 0 6 4 59 69
Department of Water Resources 1 0 0 0 23 23
BART 1 0 0 0 152 152 San Francisco
(YBI) 0 7 1 0 8
All Other Agencies 59 0 37 9 77 123
Total 63 0 50 14 311 375
Status per
December 31 , 2017 Report
63 0 51 13 311 375
Status per Year-End Report for
September 30, 2017 63 0 51 13 311 375

California Department of Transportation FY 2017-18 3rd Quarter Report
Proposition 1B Local Bridge Seismic Retrofit Program Page 6 of 6
Total Bridges in
the Program
Number of Bridges
Removed
Number of Bridges Added
Responsible Agency
Justification
Remaining Bridges in the Bond Program
426 2 City of Oakland Funded by other
sources
424
424 2 BART BART 4 contracts was
not award on time 422
422 1 City of Larkspur Funded by other sources
421
421 2 Nevada County Funded by other sources
419
419 5 Sonoma County Funded by other sources
414
414 1 Tehama County Funded by other sources
413
413 27 BART Funded by others sources
386
386 1 City of Los Angeles Did not meet award deadline
385
385 1 Monterey County Will not proceed 384
384 1 City of Oceanside Funded by other sources
383
383 1 City of Indio Did not meet award deadline
382
382 1 City of Newport Beach Funded by other sources
381
381 1 City of San Diego Funded by other sources
380
380 1 City of San Benito Funded by other sources
379
379 1 San Francisco County
Transportation Authority (YBI)
Combining two bridges into one
378
378 1 Peninsula Joint Power
Board Funded by local funds 377
377 1 City of Fairfax Funded by other
Sources 376
376 1 City of Santee No Retrofit needed 375
375 Bridges Remaining in the Program – 311 Bridges Completed = 64 Bridges in Progress

California Department of Transportation
Local Bridge Seismic Retrofit Program Delivery Report
Bond Project Delivery ReportFY 2017-18 Third Quarter
June 27-28, 2018D
IST
RIC
T
AG
EN
CY
BR
IDG
E N
O.
PR
OJE
CT
DE
SC
RIP
TIO
N
ES
TIM
AT
ED
BO
ND
R
IGH
T O
F W
AY
VA
LU
E
ES
TIM
AT
ED
BO
ND
C
ON
ST
RU
CT
ION
VA
LU
E
EN
D S
TR
AT
EG
Y
EN
D D
ES
IGN
EN
D R
IGH
T O
F W
AY
EN
D C
ON
ST
RU
CT
ION
CU
RR
EN
T P
HA
SE
(% C
OM
PL
ET
E)
SC
OP
E
BU
DG
ET
SC
HE
DU
LE
FIN
AL
DE
LIV
ER
Y R
EP
OR
T
AP
PR
OV
ED
01 Humboldt County 04C0055 Mattole Road (Honeydew) $3,441 $688,200 3/25/19 9/27/20 10/2/22 50% Design 01 Humboldt County 04C0104 Waddington Road $1,147 $150,000 36068 40816 42062 12/1/17 99% Construction 01 Mendocino County 10C0034 Eureka Hill Road $0 $464,535 40273 8/15/19 8/15/18 3/31/21 70% Design 80% ROW 02 Tehama County 08C0043 Jellys Ferry Road $11,000 $4,574,950 7/2/18 10/8/18 10/18/21 75% Design 10% ROW 04 Concord 28C0442 Marsh Drive $0 $506,928 42735 6/30/20 8/31/20 4/30/23 15% Design 04 Fremont 33C0128 Niles Boulevard $0 $589,299 36320 41732 41697 4/30/18 95% Construction 04 Oakland 33C0030 Embarcadero Street $0 $1,696,681 35611 41729 41455 12/31/18 50% Construction 04 Oakland 33C0148 23rd Avenue $108,965 $1,149,868 35611 43008 12/31/19 12/31/19 50% ROW 04 Oakland 33C0215 Leimert Boulevard $28,675 $557,968 42794 2/20/20 9/19/19 11/12/20 35% Design 04 Orinda 28C0330 Miner Road $3,854 $141,091 38791 2/28/20 9/30/20 1/1/22 10% Design 04 Orinda 28C0331 Bear Creek Road $0 $11,929 35591 8/31/20 7/31/20 12/31/21 10% Design 04 Pittsburg 28C0165 North Parkside Drive $0 $52,006 41110 2/28/18 No R/W 8/31/18 Waiting Award 04 San Francisco County
Transportation Authority 01CA0001 West Bound SFOBB on ramp West of Yerba Buena Island $0 $47,890 40816 9/30/19 9/30/19 7/31/21 75% Design 75% ROW
04 San Francisco County Transporation Authority 01CA0002 West Bound I-80 on ramp West of Yerba
Buena Island $63,085 $2,471,629 40816 9/30/19 9/30/19 7/31/21 76% Design 76% ROW
04 San Francisco County Transporation Authority 01CA0003 East Bound I-80 off ramp connecting to
Treasure Island Road (2 Bridges) $34,410 $1,096,115 40816 9/30/19 9/30/19 6/30/21 75% Design 75% ROW 04 San Francisco County
Transporation Authority 01CA0004 Treasure Island Road West of SFOBB $0 $223,487 40816 9/30/19 9/30/19 7/31/21 76% Design 76% ROW
04 San Francisco County Transporation Authority 01CA0006 Hillcrest Road West of Yerba Buena Island
$0 $264,67240816 12/31/17 12/31/17 12/30/19 76% Design 76% ROW
04 San Francisco County Transporation Authority 01CA0008 Treasure Island road West of SFOBB $0 $65,450 40816 9/30/19 9/30/19 7/31/21 76% Design 76% ROW
04 San Francisco County Transporation Authority 01CA007A Treasure Island Road West of SFOBB $0 $35,119 40816 9/30/19 9/30/19 7/31/21 76% Design 76% ROW
04 San Francisco County Transporation Authority 01CA007B Treasure Isand Road west of SFOBB $0 $46,294 40816 9/30/19 9/30/19 7/31/21 76% Design 76% ROW
04 San Francisco County Transporation Authority 34U0003 Ramps on East side of Yerba Buena Island
Tunnel at SFOBB on/off of I-80 $114,700 $8,659,398 40816 41362 41362 7/31/18 99% Construction
Estimated costs and schedule are input by local agencies into the LA-ODIS and are compared with Baseline Agreement Data. Report data entered as of 03/31/2018.LBSRP Page 1 of 13

California Department of Transportation
Local Bridge Seismic Retrofit Program Delivery Report
Bond Project Delivery ReportFY 2017-18 Third Quarter
June 27-28, 2018D
IST
RIC
T
AG
EN
CY
BR
IDG
E N
O.
PR
OJE
CT
DE
SC
RIP
TIO
N
ES
TIM
AT
ED
BO
ND
R
IGH
T O
F W
AY
VA
LU
E
ES
TIM
AT
ED
BO
ND
C
ON
ST
RU
CT
ION
VA
LU
E
EN
D S
TR
AT
EG
Y
EN
D D
ES
IGN
EN
D R
IGH
T O
F W
AY
EN
D C
ON
ST
RU
CT
ION
CU
RR
EN
T P
HA
SE
(% C
OM
PL
ET
E)
SC
OP
E
BU
DG
ET
SC
HE
DU
LE
FIN
AL
DE
LIV
ER
Y R
EP
OR
T
AP
PR
OV
ED
04 Sonoma County 20C0017 Watmaugh Road $28,675 $573,500 8/13/18 12/29/18 12/27/19 85% Design 04 Sonoma County 20C0018 Bohemian Highway $45,880 $1,912,508 2/1/20 12/1/21 10/15/23 15% Design 04 Sonoma County 20C0155 Wohler Road $11,470 $1,591,563 39448 5/31/18 3/29/19 12/31/20 97% Design 85% ROW 04 Sonoma County 20C0262 Boyes Boulevard $74,555 $676,730 36433 3/1/18 8/2/18 11/30/20 96% Design 95% ROW 04 Vallejo 23C0152 Sacramento Street $0 $219,000 41122 42979 12/31/18 12/31/19 90% Design 50% ROW 05 Monterey County 44C0009 Nacimiento Lake Drive $34,339 $0 35828 3/1/18 6/30/18 12/31/19 97% Design 95% ROW 05 Santa Barbara County 51C0001 Cathedral Oaks Road $0 $229,400 39659 41713 41713 6/19/19 99% Construction 05 Santa Barbara County 51C0006 Floradale Avenue $29,822 $1,243,578 35519 11/30/18 4/30/19 10/31/20 99% Design 15% ROW 05 Santa Barbara County 51C0017 Jalama Road $9,176 $244,175 39659 42086 42155 8/31/18 97% Construction 05 Santa Cruz 36C0108 Murray Avenue $38,540 $1,065,678 36192 1/31/19 1/31/19 4/1/20 97% Design 94% ROW 06 Bakersfield 50C0021L Manor Street North Bound $0 $298,220 42312 43007 No R/W 12/31/19 100% Design 06 Bakersfield 50C0021R Manor Street South Bound $0 $298,220 42312 43007 No R/W 12/31/19 100% Design 07 Los Angeles 53C0045 Beverly-First Street $0 $848,780 37714 42825 2/28/19 5% Construction 07 Los Angeles 53C0859 North Spring Street $0 $229,400 37991 41121 41090 9/30/18 90% Construction 07 Los Angeles 53C1880 Sixth Street $0 $31,851,593 38168 3/20/19 12/31/21 12/31/21 99% Design 86% ROW
40% Construction 07 Los Angeles 53C1881 Hyperion Avenue
$0 $1,220,37138168 12/31/18 12/31/18 6/30/22 87% Design
07 Los Angeles 53C1882 Hyperion Avenue $0 $290,191 38168 12/31/18 No R/W 6/30/22 87% Design 07 Los Angeles 53C1883 Glendale Boulevard $0 $114,700 38168 12/31/18 12/31/18 6/30/22 87% Design 07 Los Angeles 53C1884 Glendale Boulevard $0 $114,700 38168 12/31/18 12/31/18 6/30/22 87% Design 07 Los Angeles County 53C0084 Slauson Avenue $0 $128,805 35246 39650 42060 9/30/20 Waiting Award 07 Los Angeles County 53C1403 The Old Road $0 $402,429 10/31/19 12/31/19 3/31/22 85% Design
Estimated costs and schedule are input by local agencies into the LA-ODIS and are compared with Baseline Agreement Data. Report data entered as of 03/31/2018.LBSRP Page 2 of 13

California Department of Transportation
Local Bridge Seismic Retrofit Program Delivery Report
Bond Project Delivery ReportFY 2017-18 Third Quarter
June 27-28, 2018D
IST
RIC
T
AG
EN
CY
BR
IDG
E N
O.
PR
OJE
CT
DE
SC
RIP
TIO
N
ES
TIM
AT
ED
BO
ND
R
IGH
T O
F W
AY
VA
LU
E
ES
TIM
AT
ED
BO
ND
C
ON
ST
RU
CT
ION
VA
LU
E
EN
D S
TR
AT
EG
Y
EN
D D
ES
IGN
EN
D R
IGH
T O
F W
AY
EN
D C
ON
ST
RU
CT
ION
CU
RR
EN
T P
HA
SE
(% C
OM
PL
ET
E)
SC
OP
E
BU
DG
ET
SC
HE
DU
LE
FIN
AL
DE
LIV
ER
Y R
EP
OR
T
AP
PR
OV
ED
08 Barstow 54C0088 North 1st Avenue $0 $350,000 42705 5/6/19 5/1/19 5/3/21 5% Design 08 Barstow 54C0089 North 1st Avenue $0 $82,010 1/2/19 7/5/21 7/5/21 3/5/23 25% Strategy 08 Barstow 54C0583 Yucca Street $0 $50,000 1/4/21 7/2/21 7/5/21 7/4/22 Request Re-Strategy 08 Colton 54C0077 La Cadena Drive $0 $134,199 35481 12/31/18 No R/W 9/30/21 95% Design 08 Colton 54C0100 Mount Vernon Avenue $0 $71,285 33998 12/31/19 No R/W 12/31/21 90% Design 08 Colton 54C0101 Mount Vernon Avenue $0 $19,384 33998 12/31/18 No R/W 9/30/21 95% Design 95% ROW 08 Grand Terrace 54C0379 Barton Road $0 $52,188 35582 40968 40968 12/31/19 Waiting Award 08 Indio 56C0084 Jackson Street $0 $277,777 35507 40693 10/25/19 95% Right of Way 08 Indio 56C0292 North Bound Indio Boulevard $5,735 $241,868 35507 11/28/19 95% Right of Way 08 Lake Elsinore 56C0309 Auto Center Drive $0 $379,794 1/26/18 8/1/20 No R/W 2/1/22 98% Strategy 08 Riverside County 56C0071 Mission Boulevard//Buena Vista $57,350 $2,518,000 11/15/18 7/15/20 7/15/20 7/15/23 58% Strategy 08 San Bernardino 54C0066 Mount Vernon Avenue $0 $3,452,670 40723 10/4/19 10/4/19 2/24/23 30% Design 10 San Joaquin County 38C0032 Mchenry Avenue $0 $238,576 35475 42646 42594 4/24/20 25% Construction 10 Stanislaus County 38C0003 Santa Fe Avenue $0 $536,796 37467 42886 42185 12/31/19 10% Construction 10 Stanislaus County 38C0004 Hickman Road $0 $820,105 37530 3/1/19 3/1/19 9/30/20 65% Design 10 Stanislaus County 38C0010 Crows Landing $0 $745,550 12/31/18 No R/W 12/30/20 70% Design 10 Stanislaus County 39C0001 River Road $0 $670,995 42689 6/15/19 4/15/19 2/25/21 27% Design 10 Tracy 29C0126 Eleventh Street $0 $2,278,743 12/30/17 18% Construction 11 Imperial County 58C0014 Forrester Road $28,675 $725,569 12/21/18 7/21/20 1/21/21 2/21/22 Waiting Award 11 Imperial County 58C0094 Winterhaven Drive $0 $152,780 41629 4/21/18 No R/W 9/21/18 90% Design 11 Oceanside 57C0010 Douglas Drive $0 $2,090,866 6/24/19 11/11/24 No R/W 8/19/26 5% Strategy
Estimated costs and schedule are input by local agencies into the LA-ODIS and are compared with Baseline Agreement Data. Report data entered as of 03/31/2018.LBSRP Page 3 of 13

California Department of Transportation
Local Bridge Seismic Retrofit Program Delivery Report
Bond Project Delivery ReportFY 2017-18 Third Quarter
June 27-28, 2018D
IST
RIC
T
AG
EN
CY
BR
IDG
E N
O.
PR
OJE
CT
DE
SC
RIP
TIO
N
ES
TIM
AT
ED
BO
ND
R
IGH
T O
F W
AY
VA
LU
E
ES
TIM
AT
ED
BO
ND
C
ON
ST
RU
CT
ION
VA
LU
E
EN
D S
TR
AT
EG
Y
EN
D D
ES
IGN
EN
D R
IGH
T O
F W
AY
EN
D C
ON
ST
RU
CT
ION
CU
RR
EN
T P
HA
SE
(% C
OM
PL
ET
E)
SC
OP
E
BU
DG
ET
SC
HE
DU
LE
FIN
AL
DE
LIV
ER
Y R
EP
OR
T
AP
PR
OV
ED
01 Humboldt County 04C0007 Bald Hills Road $0 $649,334 Project Complete 01 Humboldt County 04C0207 Williams Creek Road $0 $140,080 Project Complete YES
01 Mendocino County 10C0048 Moore Street $5,337 $169,229 Project Complete YES
01 Mendocino County 10C0084 School Way $0 $476,025 Project Complete 02 Redding 06C0108L Cypress Avenue West Bound $0 $114,700 Project Complete YES
02 Redding 06C0108R Cypress Avenue East Bound $0 $114,700 Project Complete YES
02 Tehama County 08C0009 Bowman Road $9,000 $1,123,900 Project Complete YES
03 Butte County 12C0120 Ord Ferry Road $3,000 $1,525,510 Project Complete YES
03 Placer County 19C0060 Auburn-Foresthill Road $0 $5,558,133 Project Complete YES
03 Yolo County 22C0074 County Road 57 $2,556 $225,697 Project Complete YES
04 Alameda 33C0230 Ballena Boulevard $0 $62,309 Project Complete YES
04 Alameda County 33C0026 High Street $0 $121,194 Project Complete YES
04 Alameda County 33C0027 Park Street $0 $91,211 Project Complete YES
04 Alameda County 33C0147 Fruitvale Avenue $0 $50,715 Project Complete YES
04 Alameda County 33C0237 Elgin Street $0 $8,819 Project Complete YES
04 Antioch 28C0054 Wilbur Avenue $0 $917,600 Project Complete 04 Healdsburg 20C0065 Healdsburg Avenue $0 $244,311 Project Complete 04 Oakland 33C0178 Park Boulevard $0 $77,756 Project Complete YES
04 Oakland 33C0179 Park Boulevard $0 $77,756 Project Complete YES
04 Oakland 33C0180 Park Boulevard $0 $77,756 Project Complete YES
04 Oakland 33C0202 Hegenberger Road $0 $659,686 Project Complete
Estimated costs and schedule are input by local agencies into the LA-ODIS and are compared with Baseline Agreement Data. Report data entered as of 03/31/2018.LBSRP Page 4 of 13

California Department of Transportation
Local Bridge Seismic Retrofit Program Delivery Report
Bond Project Delivery ReportFY 2017-18 Third Quarter
June 27-28, 2018D
IST
RIC
T
AG
EN
CY
BR
IDG
E N
O.
PR
OJE
CT
DE
SC
RIP
TIO
N
ES
TIM
AT
ED
BO
ND
R
IGH
T O
F W
AY
VA
LU
E
ES
TIM
AT
ED
BO
ND
C
ON
ST
RU
CT
ION
VA
LU
E
EN
D S
TR
AT
EG
Y
EN
D D
ES
IGN
EN
D R
IGH
T O
F W
AY
EN
D C
ON
ST
RU
CT
ION
CU
RR
EN
T P
HA
SE
(% C
OM
PL
ET
E)
SC
OP
E
BU
DG
ET
SC
HE
DU
LE
FIN
AL
DE
LIV
ER
Y R
EP
OR
T
AP
PR
OV
ED
04 Oakland 33C0238 Campus Drive $0 $113,072 Project Complete YES
04 Oakland 33C0253 Coliseum Way $0 $497,029 Project Complete YES
04 Peninsula Joint Powers Board 35C0087 Tilton Avenue $0 $69,837 Project Complete YES
04 Peninsula Joint Powers Board 35C0090 Santa Inez Avenue $0 $104,756 Project Complete YES
04 Peninsula Joint Powers Board 35C0091 East Poplar Avenue $0 $120,275 Project Complete YES
04 Peninsula Joint Powers Board 35C0161 Southern Pacific Transportation Company $0 $93,116 Project Complete YES
04 San Francisco Bay Area Rapid Transit District
BART Various
BART 1: Projects authorized in FFY 2008/09 and prior (83 Bridges) $636,279 $6,968,709 Project Complete YES
04 San Francisco Bay Area Rapid Transit District
BART Various
BART 2: R-Line North Aerials over Public Road (28 Bridges) $0 $501,754 Project Complete YES
04 San Francisco Bay Area Rapid Transit District
BART Various
BART 3: A-Line South Aerials over Public Roads (21 Bridges) $0 $344,329 Project Complete YES
04 San Francisco Bay Area Rapid Transit District
BART Various
BART 5: A-Line North Aerials over public Roads (19 Bridges) $0 $367,876 Project Complete YES
04 San Francisco Bay Area Rapid Transit District 33C0321 West Oakland Pier 110 to Transbay Tube
Portal $0 $124,083 Project Complete YES
04 San Francisco International Airport 35C0133 Departing Flight Traffic $0 $1,467,021 Project Complete YES
04 San Jose 37C0052L Southwest Expressway $0 $35,678 Project Complete YES
04 San Jose 37C0701 East Julian Street $0 $83,164 Project Complete YES
04 San Jose 37C0732 East William Street $0 $15,762 Project Complete YES
04 Santa Clara County 37C0121 Shoreline Boulevard $0 $54,107 Project Complete YES
04 Santa Clara County 37C0173 Aldercroft Heights Road $0 $93,460 Project Complete YES
04 Santa Clara County 37C0183 Central & Lawrence Expressway $0 $82,549 Project Complete YES
04 Sonoma County 20C0141 Annapolis Road$0 $154,327
Project Complete YES
Estimated costs and schedule are input by local agencies into the LA-ODIS and are compared with Baseline Agreement Data. Report data entered as of 03/31/2018.LBSRP Page 5 of 13

California Department of Transportation
Local Bridge Seismic Retrofit Program Delivery Report
Bond Project Delivery ReportFY 2017-18 Third Quarter
June 27-28, 2018D
IST
RIC
T
AG
EN
CY
BR
IDG
E N
O.
PR
OJE
CT
DE
SC
RIP
TIO
N
ES
TIM
AT
ED
BO
ND
R
IGH
T O
F W
AY
VA
LU
E
ES
TIM
AT
ED
BO
ND
C
ON
ST
RU
CT
ION
VA
LU
E
EN
D S
TR
AT
EG
Y
EN
D D
ES
IGN
EN
D R
IGH
T O
F W
AY
EN
D C
ON
ST
RU
CT
ION
CU
RR
EN
T P
HA
SE
(% C
OM
PL
ET
E)
SC
OP
E
BU
DG
ET
SC
HE
DU
LE
FIN
AL
DE
LIV
ER
Y R
EP
OR
T
AP
PR
OV
ED
04 Union City 33C0111 Decoto Road $0 $522,223 Project Complete 04 Union City 33C0223 Whipple Road $0 $94,607 Project Complete YES
05 King City 44C0059 First Street $0 $39,342 Project Complete YES
05 Monterey County 44C0115 Schulte Road $0 $441,900 Project Complete YES
05 Monterey County 44C0151 Peach Tree Road $12,959 $201,816 Project Complete 05 Monterey County 44C0158 Lonoak Road $0 $233,250 Project Complete 05 San Benito County 43C0043 Lone Tree Road $0 $194,891 Project Complete YES
05 San Luis Obispo County 49C0338 Moonstone Beach $0 $68,034 Project Complete YES
05 Santa Barbara County 51C0002 San Marcos Road $0 $109,874 Project Complete YES
05 Santa Barbara County 51C0039 Rincon Hill Road $5,735 $71,841 Project Complete YES
05 Solvang 51C0008 Alisal Road $181 $107,151 Project Complete YES
05 Santa Barbara County 51C0014 Jalama Road $0 $73,497 Project Complete YES
05 Santa Barbara County 51C0016 Jalama Road $0 $55,842 Project Complete YES
05 Santa Barbara County 51C0018 Union Pacific Railroad & Amtrak $3,885 $170,308 Project Complete 05 Santa Barbara County 51C0173 Santa Rosa Road $4,553 $166,734 Project Complete YES
05 Santa Cruz 36C0103 Soquel Drive $0 $24,380 Project Complete YES
06 Department of Water Resources 42C0140 West Shields Avenue $0 $34,241 Project Complete 06 Department of Water Resources 42C0141 North Russell Avenue $0 $58,936 Project Complete 06 Department of Water Resources 42C0143 West Nees Avenue $0 $56,543 Project Complete 06 Department of Water Resources 42C0156 West Jayne Avenue $0 $27,137 Project Complete
06 Department of Water Resources 42C0159 West Mount Whitney Avenue $0 $23,983 Project Complete
Estimated costs and schedule are input by local agencies into the LA-ODIS and are compared with Baseline Agreement Data. Report data entered as of 03/31/2018.LBSRP Page 6 of 13

California Department of Transportation
Local Bridge Seismic Retrofit Program Delivery Report
Bond Project Delivery ReportFY 2017-18 Third Quarter
June 27-28, 2018D
IST
RIC
T
AG
EN
CY
BR
IDG
E N
O.
PR
OJE
CT
DE
SC
RIP
TIO
N
ES
TIM
AT
ED
BO
ND
R
IGH
T O
F W
AY
VA
LU
E
ES
TIM
AT
ED
BO
ND
C
ON
ST
RU
CT
ION
VA
LU
E
EN
D S
TR
AT
EG
Y
EN
D D
ES
IGN
EN
D R
IGH
T O
F W
AY
EN
D C
ON
ST
RU
CT
ION
CU
RR
EN
T P
HA
SE
(% C
OM
PL
ET
E)
SC
OP
E
BU
DG
ET
SC
HE
DU
LE
FIN
AL
DE
LIV
ER
Y R
EP
OR
T
AP
PR
OV
ED
06 Department of Water Resources 42C0173 West Manning Avenue $0 $21,228 Project Complete
06 Department of Water Resources 42C0245 West Panoche Road $0 $19,160 Project Complete
06 Department of Water Resources 42C0370 West Clarkson Avenue $0 $27,773 Project Complete
06 Department of Water Resources 42C0371 South El Dorado Avenue $0 $26,933 Project Complete
06 Department of Water Resources 42C0425 West Gale Avenue $0 $28,692 Project Complete
06 Department of Water Resources 45C0071 Avenal Cutoff $0 $26,397 Project Complete
06 Department of Water Resources 45C0123 Plymouth Avenue $0 $30,448 Project Complete
06 Department of Water Resources 45C0124 30th Avenue $0 $33,128 Project Complete
06 Department of Water Resources 45C0125 Quail Avenue $0 $32,441 Project Complete
06 Department of Water Resources 50C0123 Old River Road $0 $36,762 Project Complete 06 Fresno County 42C0098 South Calaveras Avenue $0 $30,923 Project Complete YES
06 Fresno County 42C0281 West Sierra Avenue $0 $40,681 Project Complete YES
06 Tulare County 46C0027 Avenue 416 $0 $498,711 Project Complete YES
07 Los Angeles 53C0096 Fletcher Drive $0 $848,780 Project Complete YES
07 Los Angeles 53C1010 North Main Street $0 $965,295 Project Complete YES
07 Los Angeles 53C1184 4th Street $0 $148,178 Project Complete YES
07 Los Angeles 53C1335 Tampa Avenue $0 $59,644 Project Complete YES
07 Los Angeles 53C1388 Winnetka Ave $0 $45,306 Project Complete YES
07 Los Angeles 53C1875 Avenue 26 $0 $409,953 Project Complete
Estimated costs and schedule are input by local agencies into the LA-ODIS and are compared with Baseline Agreement Data. Report data entered as of 03/31/2018.LBSRP Page 7 of 13

California Department of Transportation
Local Bridge Seismic Retrofit Program Delivery Report
Bond Project Delivery ReportFY 2017-18 Third Quarter
June 27-28, 2018D
IST
RIC
T
AG
EN
CY
BR
IDG
E N
O.
PR
OJE
CT
DE
SC
RIP
TIO
N
ES
TIM
AT
ED
BO
ND
R
IGH
T O
F W
AY
VA
LU
E
ES
TIM
AT
ED
BO
ND
C
ON
ST
RU
CT
ION
VA
LU
E
EN
D S
TR
AT
EG
Y
EN
D D
ES
IGN
EN
D R
IGH
T O
F W
AY
EN
D C
ON
ST
RU
CT
ION
CU
RR
EN
T P
HA
SE
(% C
OM
PL
ET
E)
SC
OP
E
BU
DG
ET
SC
HE
DU
LE
FIN
AL
DE
LIV
ER
Y R
EP
OR
T
AP
PR
OV
ED
07 Los Angeles County 53C0031 Alondra Boulevard $0 $36,476 Project Complete YES
07 Los Angeles County 53C0036 Beverly Boulevard $0 $156,935 Project Complete YES
07 Los Angeles County 53C0070 East Fork Road $0 $329,229 Project Complete YES
07 Los Angeles County 53C0082 Washington Boulevard $0 $12,815 Project Complete YES
07 Los Angeles County 53C0085 Florence Avenue $0 $33,325 Project Complete YES
07 Los Angeles County 53C0106 Imperial Highway $0 $117,037 Project Complete YES
07 Los Angeles County 53C0138 Union Pacific Railroad $0 $3,766 Project Complete YES
07 Los Angeles County 53C0139 College Park Drive $0 $12,606 Project Complete YES
07 Los Angeles County 53C0178 Valley Boulevard $0 $236,783 Project Complete YES
07 Los Angeles County 53C0261 Avalon Boulevard $0 $30,718 Project Complete YES
07 Los Angeles County 53C0266 Willow Street $0 $34,103 Project Complete YES
07 Los Angeles County 53C0289 Azusa Avenue $0 $405,399 Project Complete YES
07 Los Angeles County 53C0329 Garey Avenue $0 $30,869 Project Complete YES
07 Los Angeles County 53C0375 Foothill Boulevard $0 $287,750 Project Complete YES
07 Los Angeles County 53C0377 Foothill Boulevard $0 $60,835 Project Complete YES
07 Los Angeles County 53C0445 Slauson Avenue $0 $209,093 Project Complete YES
07 Los Angeles County 53C0458 Union Pacific Railroad $0 $32,388 Project Complete 07 Los Angeles County 53C0459 Wilmington Avenue 223 $0 $173,933 Project Complete YES
07 Los Angeles County 53C0471 Washington Boulavard $0 $62,400 Project Complete YES
07 Los Angeles County 53C0495 Irwindale Avenue $0 $12,150 Project Complete YES
07 Los Angeles County 53C0531 Atchinson, Topeka, & Sante Fe Railroad $0 $89,294 Project Complete YES
07 Los Angeles County 53C0575 Artesia Boulevard $0 $60,486 Project Complete YES
Estimated costs and schedule are input by local agencies into the LA-ODIS and are compared with Baseline Agreement Data. Report data entered as of 03/31/2018.LBSRP Page 8 of 13

California Department of Transportation
Local Bridge Seismic Retrofit Program Delivery Report
Bond Project Delivery ReportFY 2017-18 Third Quarter
June 27-28, 2018D
IST
RIC
T
AG
EN
CY
BR
IDG
E N
O.
PR
OJE
CT
DE
SC
RIP
TIO
N
ES
TIM
AT
ED
BO
ND
R
IGH
T O
F W
AY
VA
LU
E
ES
TIM
AT
ED
BO
ND
C
ON
ST
RU
CT
ION
VA
LU
E
EN
D S
TR
AT
EG
Y
EN
D D
ES
IGN
EN
D R
IGH
T O
F W
AY
EN
D C
ON
ST
RU
CT
ION
CU
RR
EN
T P
HA
SE
(% C
OM
PL
ET
E)
SC
OP
E
BU
DG
ET
SC
HE
DU
LE
FIN
AL
DE
LIV
ER
Y R
EP
OR
T
AP
PR
OV
ED
07 Los Angeles County 53C0590 Union Pacific Railroad $0 $8,592 Project Complete YES
07 Los Angeles County 53C0592 Cherry Avenue $0 $7,833 Project Complete YES
07 Los Angeles County 53C0594 Long Beach Boulevard $0 $18,015 Project Complete YES
07 Los Angeles County 53C0596 Atchinson, Topeka, & Santa Fe Railroad $0 $16,151 Project Complete YES
07 Los Angeles County 53C0599 Alameda Street $0 $131,923 Project Complete YES
07 Los Angeles County 53C0671 Azusa Canyon Road $0 $12,540 Project Complete YES
07 Los Angeles County 53C0807 Avenue T $0 $126,437 Project Complete YES
07 Los Angeles County 53C0810 Southern Pacific Transportation Company Railroad $0 $15,088 Project Complete YES
07 Los Angeles County 53C0864 Martin Luther King Junior Avenue $0 $51,404 Project Complete YES
07 Los Angeles County 53C0867 Soto Street $0 $357,666 Project Complete YES
07 Los Angeles County 53C0885 Long Beach Freeway $0 $29,393 Project Complete YES
07 Los Angeles County 53C0890L Queens Way-South Bound $0 $268,943 Project Complete YES
07 Los Angeles County 53C0890R Queens Way-South Bound $0 $268,943 Project Complete YES
07 Los Angeles County 53C0892L Queens Way South Bound $0 $273,821 Project Complete YES
07 Los Angeles County 53C0892R Queens Way North Bound $0 $273,821 Project Complete YES
07 Los Angeles County 53C0897 S.P.T.C. R R $0 $15,990 Project Complete YES
07 Los Angeles County 53C0916 First Street $0 $19,658 Project Complete YES
07 Los Angeles County 53C0918 First Street $0 $19,658 Project Complete YES
07 Los Angeles County 53C0930 9th Street $0 $259,726 Project Complete YES
07 Los Angeles County 53C0931 10th Street Off Ramp $0 $722,148 Project Complete YES
07 Los Angeles County 53C0933 7th Street On Ramp $0 $79,055 Project Complete YES
07 Los Angeles County 53C0934 6th Street Off Ramp $0 $380,774 Project Complete YES
Estimated costs and schedule are input by local agencies into the LA-ODIS and are compared with Baseline Agreement Data. Report data entered as of 03/31/2018.LBSRP Page 9 of 13

California Department of Transportation
Local Bridge Seismic Retrofit Program Delivery Report
Bond Project Delivery ReportFY 2017-18 Third Quarter
June 27-28, 2018D
IST
RIC
T
AG
EN
CY
BR
IDG
E N
O.
PR
OJE
CT
DE
SC
RIP
TIO
N
ES
TIM
AT
ED
BO
ND
R
IGH
T O
F W
AY
VA
LU
E
ES
TIM
AT
ED
BO
ND
C
ON
ST
RU
CT
ION
VA
LU
E
EN
D S
TR
AT
EG
Y
EN
D D
ES
IGN
EN
D R
IGH
T O
F W
AY
EN
D C
ON
ST
RU
CT
ION
CU
RR
EN
T P
HA
SE
(% C
OM
PL
ET
E)
SC
OP
E
BU
DG
ET
SC
HE
DU
LE
FIN
AL
DE
LIV
ER
Y R
EP
OR
T
AP
PR
OV
ED
07 Los Angeles County 53C0951 Garey Avenue $0 $27,418 Project Complete YES
07 Los Angeles County 53C1577 Oleander Avenue $0 $17,584 Project Complete YES
07 Los Angeles County 53C1829 Oak Grove Drive $0 $242,594 Project Complete YES
07 Los Angeles County 53C1851 Oak Grove Drive $0 $243,263 Project Complete YES
07 Los Angeles County 53C1909 AT & SF Railroad $0 $29,067 Project Complete YES
07 Los Angeles County 53C1915 4th Street $0 $37,502 Project Complete YES
08 Colton 54C0078 La Cadena Drive $0 $13,092 Project Complete 08 Colton 54C0079 La Cadena Drive $0 $23,820 Project Complete 08 Colton 54C0375 West C Street $0 $7,527 Project Complete 08 Colton 54C0384 C Street $0 $13,639 Project Complete 08 Colton 54C0599 Rancho Avenue $0 $35,367 Project Complete 08 Department of Water Resources 54C0449 Ranchero Street $0 $175,000 Project Complete
08 Department of Water Resources 54C0451 Mesquite Street $0 $44,000 Project Complete
08 Department of Water Resources 54C0452 Maple Avenue $0 $132,000 Project Complete
08 Department of Water Resources 54C0495 Goodwin Drive $0 $29,000 Project Complete
08 Department of Water Resources 54C0496 Duncan Road $0 $31,000 Project Complete 08 Indio 56C0291 Jackson Street $0 $237,795 Project Complete YES
08 Loma Linda 54C0130 Anderson Street $0 $25,052 Project Complete YES
08 Riverside County 56C0001L South Bound Van Buren Boulevard $0 $1,316,701 Project Complete YES
08 Riverside County 56C0001R North Bound Van Buren Boulevard $0 $1,316,701 Project Complete YES
08 Riverside County 56C0017 River Road $0 $21,678 Project Complete YES
Estimated costs and schedule are input by local agencies into the LA-ODIS and are compared with Baseline Agreement Data. Report data entered as of 03/31/2018.LBSRP Page 10 of 13

California Department of Transportation
Local Bridge Seismic Retrofit Program Delivery Report
Bond Project Delivery ReportFY 2017-18 Third Quarter
June 27-28, 2018D
IST
RIC
T
AG
EN
CY
BR
IDG
E N
O.
PR
OJE
CT
DE
SC
RIP
TIO
N
ES
TIM
AT
ED
BO
ND
R
IGH
T O
F W
AY
VA
LU
E
ES
TIM
AT
ED
BO
ND
C
ON
ST
RU
CT
ION
VA
LU
E
EN
D S
TR
AT
EG
Y
EN
D D
ES
IGN
EN
D R
IGH
T O
F W
AY
EN
D C
ON
ST
RU
CT
ION
CU
RR
EN
T P
HA
SE
(% C
OM
PL
ET
E)
SC
OP
E
BU
DG
ET
SC
HE
DU
LE
FIN
AL
DE
LIV
ER
Y R
EP
OR
T
AP
PR
OV
ED
10 Department of Water Resources 39C0250 Mccabe Road $0 $18,810 Project Complete
10 Department of Water Resources 39C0252 Butts Road $0 $26,402 Project Complete 10 Department of Water Resources 39C0314 Mervel Avenue $0 $43,031 Project Complete 10 Modesto 38C0050 Carpenter Road $0 $1,126,801 Project Complete 10 San Joaquin County 29C0187 Airport Way $0 $420,730 Project Complete YES
10 Stanislaus County 38C0048 Geer Road $0 $141,655 Project Complete YES
10 Stanislaus County 38C0202 Pete Miller Road $0 $44,733 Project Complete YES
11 Del Mar 57C0207 North Torrey Pines Road $0 $2,679,446 Project Complete YES
11 San Diego 57C0416 First Avenue $0 $698,119 Project Complete YES
12 Newport Beach 55C0149L South Bound Jamboree Road $0 $57,003 Project Complete YES
12 Newport Beach 55C0149R North Bound Jamboree Road $0 $48,907 Project Complete YES
12 Newport Beach 55C0151 Bayside Drive $0 $18,044 Project Complete YES
12 Orange County 55C0038 Santiago Canyon Road $0 $63,477 Project Complete YES
12 Orange County 55C0655 John Wayne Airport - Macarthur $0 $457,185 Project Complete YES
12 Orange County 55C0656 Route 55 Departures $0 $106,800 Project Complete YES
12 Orange County 55C0657 Macarthur $0 $39,254 Project Complete YES
12 Orange County 55C0658 Departures Traffic $0 $182,292 Project Complete YES
Total $1,416,979 $128,798,951
Estimated costs and schedule are input by local agencies into the LA-ODIS and are compared with Baseline Agreement Data. Report data entered as of 03/31/2018.LBSRP Page 11 of 13

California Department of Transportation
Local Bridge Seismic Retrofit Program Delivery Report
Bond Project Delivery ReportFY 2017-18 Third Quarter
June 27-28, 2018D
IST
RIC
T
AG
EN
CY
BR
IDG
E N
O.
PR
OJE
CT
DE
SC
RIP
TIO
N
ES
TIM
AT
ED
BO
ND
R
IGH
T O
F W
AY
VA
LU
E
ES
TIM
AT
ED
BO
ND
C
ON
ST
RU
CT
ION
VA
LU
E
EN
D S
TR
AT
EG
Y
EN
D D
ES
IGN
EN
D R
IGH
T O
F W
AY
EN
D C
ON
ST
RU
CT
ION
CU
RR
EN
T P
HA
SE
(% C
OM
PL
ET
E)
SC
OP
E
BU
DG
ET
SC
HE
DU
LE
FIN
AL
DE
LIV
ER
Y R
EP
OR
T
AP
PR
OV
ED
02 Lassen County 07C0070 Road306/Cappezolli Bridge Removed
02 Lassen County 07C0088 County Road 417 Bridge Removed
02 Tehama County 08C0008 Evergreen Road Bridge Removed
03 Nevada County 17C0045 Hirschdale Road Bridge Removed
03 Nevada County 17C0046 Hirschdale Road Bridge Removed
04 Fairfax 27C0144 Creek Road Bridge Removed
04 Larkspur 27C0150 Alexander Avenue Bridge Removed
04 Oakland 33C0181 East 14th Street Bridge Removed
04 Oakland 33C0182 East 12th Street Bridge Removed
04 Peninsula Joint Powers Board 34C0051 Quint Street Bridge Removed
04 Peninsula Joint Powers Board 34C0052 Jerrold Avenue Bridge Removed
04 San Francisco Bay Area Rapid Transit District
BART Various
BART 4: A-Line Stations over Public Roads (2 Bridges)
Bridge Removed
04 San Jose 37C0299 Belt (Auzerias Street) Bridge Removed
04 San Jose 37C0300 Belt/Pipe(Auzerias & Del Monte) Bridge Removed
04 Santa Clara County 37C0159 Alamitos Road Bridge Removed
04 Sonoma County 20C0005 Geysers Road Bridge Removed
04 Sonoma County 20C0139 Wohler Road Bridge Removed
04 Sonoma County 20C0242 Chalk Hill Road Bridge Removed
04 Sonoma County 20C0248 Lambert Bridge Road Bridge Removed
04 Sonoma County 20C0407 West Dry Creek Road Bridge Removed
05 Monterey County 44C0099 Boronda Road Bridge Removed
Estimated costs and schedule are input by local agencies into the LA-ODIS and are compared with Baseline Agreement Data. Report data entered as of 03/31/2018.LBSRP Page 12 of 13

California Department of Transportation
Local Bridge Seismic Retrofit Program Delivery Report
Bond Project Delivery ReportFY 2017-18 Third Quarter
June 27-28, 2018D
IST
RIC
T
AG
EN
CY
BR
IDG
E N
O.
PR
OJE
CT
DE
SC
RIP
TIO
N
ES
TIM
AT
ED
BO
ND
R
IGH
T O
F W
AY
VA
LU
E
ES
TIM
AT
ED
BO
ND
C
ON
ST
RU
CT
ION
VA
LU
E
EN
D S
TR
AT
EG
Y
EN
D D
ES
IGN
EN
D R
IGH
T O
F W
AY
EN
D C
ON
ST
RU
CT
ION
CU
RR
EN
T P
HA
SE
(% C
OM
PL
ET
E)
SC
OP
E
BU
DG
ET
SC
HE
DU
LE
FIN
AL
DE
LIV
ER
Y R
EP
OR
T
AP
PR
OV
ED
05 Montery County 44C0042 Union Pacific Railroad & Amtrak Bridge Removed
05 San Benito County 43C0027 Panoche Road Bridge Removed
05 Santa Barbara 51C0144 Southern Pacific Transportation Company Bridge Removed
05 Santa Barbara 51C0146 Union Pacific Railroad & Amtrak Bridge Removed
05 Santa Barbara 51C0150 Union Pacific Railroad & Amtrak Bridge Removed
05 Santa Barbara 51C0250 Chapala Street Bridge Removed
06 Fresno County 42C0280 West Althea Avenue Bridge Removed
06 Department of Water Resources 50C0113 Elk Hills Road Bridge Removed
07 Los Angeles 53C0784 At&Sf RR Bridge Removed
07 Los Angeles 53C0884 Ocean Boulevard Bridge Removed
07 Los Angeles 53C1362 Vanowen Street Bridge Removed
07 Los Angeles County 53C1710 Fruitland Avenue Bridge Removed
08 Indio 56C0283 S/B Indio Blvd. Bridge Removed
10 Merced County 39C0339 Canal School Road Bridge Removed
11 Imperial County 58C0092 Araz Road Bridge Removed
11 San Diego 57C0015 North Harbor Drive Bridge Removed
11 Oceanside 57C0322 Hill Street Bridge Removed
11 San Diego 57C0418 Georgia Street Bridge Removed
11 Santee 57C0398 Carlton Oaks Drive Bridge Removed
12 Newport Beach 55C0015 Park Avenue Bridge Removed
Estimated costs and schedule are input by local agencies into the LA-ODIS and are compared with Baseline Agreement Data. Report data entered as of 03/31/2018.LBSRP Page 13 of 13

FY 2017-18 Third Quarter Report
State-Local Partnership Program
Quarterly Report to the California Transportation
Commission

California Department of Transportation FY 2017-18 3rd Quarter Report
Proposition 1B State-Local Partnership Program Page 1 of 34
SUMMARY: This report covers the third quarter of the State Fiscal Year (FY) 2017-18 for the State-Local Partnership Program (SLPP). There were 279 allocations with a total value of $981 million in SLPP funds that were approved by the California Transportation Commission (Commission) for this program. All $981 million has been allocated. Three of the allocated projects have been removed by the respective agencies; the remaining 276 allocations total $980 million in programmed SLPP funds. There are 257 projects shown on the tables in this report due to some of these projects receiving funding in multiple cycles of the program. Based on the programmed amounts for the open projects and the actual amounts for the closed projects, these 257 projects have a total project cost of $11.6 billion, total construction cost of $9.4 billion and a total SLPP amount of $972 million. Currently there are 17 projects still in construction and 205 projects are completed with approved final delivery reports. The SLPP was set at $200 million each year for five years, for a total of $1 billion. It is split into two sub-programs. The first is a “formula” based program and the second is a “competitive” based program. The formula program matches local sales tax, property tax and/or bridge tolls and is 95 percent of the total SLPP. The competitive program matches local uniform developer fees and represents five percent of the SLPP. Any SLPP funds that were not programmed in either the “formula” or “competitive” programs in a given fiscal year remained available for future programming in the remaining cycles of the SLPP. Based on guidelines and legislation, the remaining funds after final expenditures are no longer available for programming. FORMULA PROGRAM: Each year the Commission reviewed projects that were nominated for the formula program. The Commission adopted those projects that met the requirements of Proposition 1B, the Highway Safety, Traffic Reduction and Port Security Bond Act of 2006, and had a commitment of the required match and any required supplementary funding. The following is the status of the formula program projects. See the attached lists for specific project information.
• Cycle 1: In FY 2008-09, eight projects were allocated for formula share funding totaling $72.6 million in SLPP bond funds. Two of these projects had an approved Letter of No Prejudice (LONP) prior to allocation and seven of these projects have completed construction.
State-Local Partnership Program Progress Report
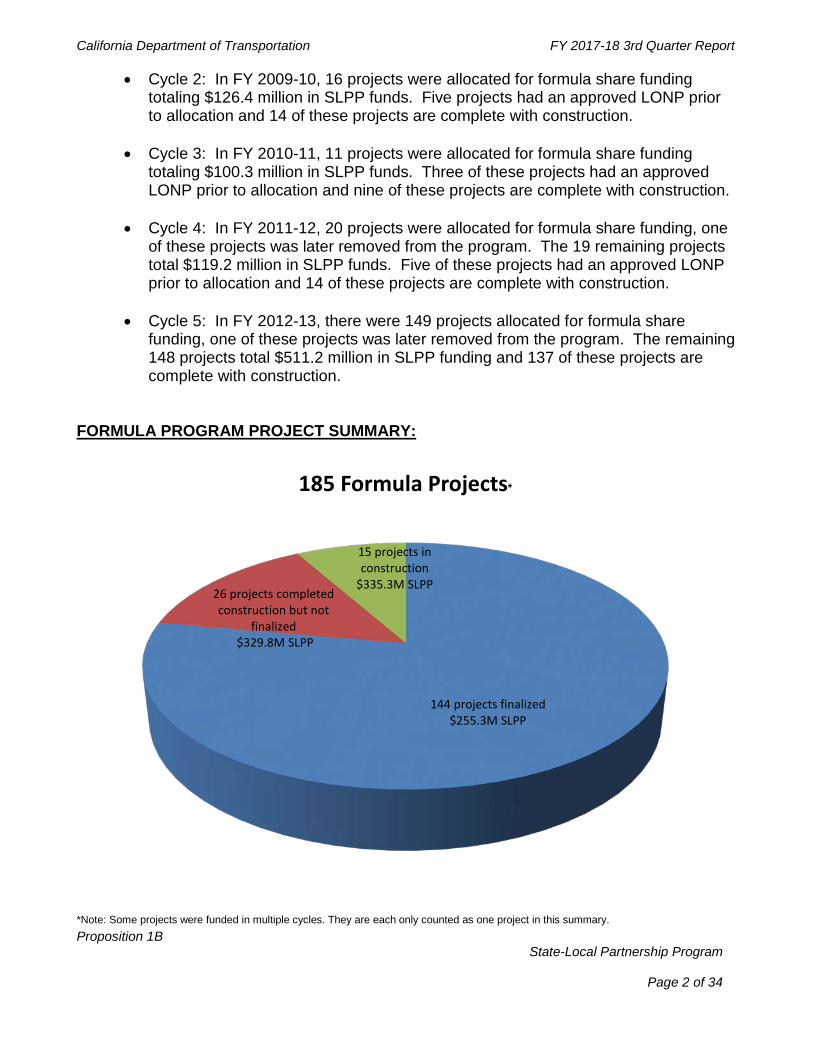
California Department of Transportation FY 2017-18 3rd Quarter Report
Proposition 1B State-Local Partnership Program Page 2 of 34
• Cycle 2: In FY 2009-10, 16 projects were allocated for formula share funding totaling $126.4 million in SLPP funds. Five projects had an approved LONP prior to allocation and 14 of these projects are complete with construction.
• Cycle 3: In FY 2010-11, 11 projects were allocated for formula share funding
totaling $100.3 million in SLPP funds. Three of these projects had an approved LONP prior to allocation and nine of these projects are complete with construction.
• Cycle 4: In FY 2011-12, 20 projects were allocated for formula share funding, one
of these projects was later removed from the program. The 19 remaining projects total $119.2 million in SLPP funds. Five of these projects had an approved LONP prior to allocation and 14 of these projects are complete with construction.
• Cycle 5: In FY 2012-13, there were 149 projects allocated for formula share
funding, one of these projects was later removed from the program. The remaining 148 projects total $511.2 million in SLPP funding and 137 of these projects are complete with construction.
FORMULA PROGRAM PROJECT SUMMARY:
*Note: Some projects were funded in multiple cycles. They are each only counted as one project in this summary.
144 projects finalized $255.3M SLPP
26 projects completed construction but not
finalized$329.8M SLPP
15 projects in construction
$335.3M SLPP
185 Formula Projects*

California Department of Transportation FY 2017-18 3rd Quarter Report
Proposition 1B State-Local Partnership Program Page 3 of 34
COMPETITIVE PROGRAM: Each year the Commission reviewed eligible projects that were nominated for the competitive grant program. Projects had to meet the requirements of Proposition 1B and must have had a commitment of the required match and any supplementary funding needed. No single grant could exceed $1million. The Commission selected projects that met the following specified criteria:
• Geographic balance • Cost-effectiveness • Multimodal • Safety • Reliability • Construction schedule • Leverage of funding • Air quality improvements
The following is the status of the competitive program projects. See the attached lists for specific project information.
• Cycle 1: In FY 2008-09, 11 projects were programmed for competitive share funding totaling $8.6 million in programmed SLPP bond funds. That amount was reduced to $7.6 million after bid savings were accounted for on the completed projects. One project had an approved LONP prior to allocation and all 11 of these projects are complete with construction.
• Cycle 2: In FY 2009-10, 13 projects were allocated for competitive share funding totaling $9 million in SLPP bond funds. That amount was reduced to $7.8 million after bid savings were accounted for on the completed projects. Five of these projects had an approved LONP prior to allocation and all 13 of these projects are complete with construction.
• Cycle 3: In FY 2010-11, 13 projects were allocated for competitive share funding totaling $8.4 million in SLPP bond funds. That amount was reduced to $8.3 million after bid savings were accounted for on completed projects. Three of these projects had an approved LONP prior to allocation and all 13 of these projects are complete with construction.
• Cycle 4: In FY 2011-12, ten projects were allocated for competitive share funding,
totaling $8.2 million in SLPP bond funds. Nine of these projects are complete with construction.

California Department of Transportation FY 2017-18 3rd Quarter Report
Proposition 1B State-Local Partnership Program Page 4 of 34
• Cycle 5: In FY 2012-13, 28 projects were allocated for competitive share funding; one of these projects was later removed from the program. The remaining 27 projects total $18 million in SLPP bond funds. 26 of these projects are complete with construction.
COMPETITIVE PROGRAM PROJECT SUMMARY:
*Note: Some projects were funded in multiple cycles. They are each only counted as one project in this summary.
61 projects finalized $37.6M SLPP
9 projects completed construction but not
finalized $9.8M SLPP
2 projects in construction
$2M SLPP
72 Competitive Projects*

California Department of Transportation FY 2017-18 3rd Quarter Report
Proposition 1B State-Local Partnership Program Page 5 of 34
LONP: The LONP Guidelines were approved in December 2009. There were 22 projects that were approved for a LONP; all 22 of these projects have since been allocated. BACKGROUND: On November 7, 2006, the voters approved Proposition 1B, which authorized $1 billion for the State-Local Partnership Program to be available, upon appropriation by the Legislature, for allocation by the Commission over a five-year period to eligible transportation projects nominated by eligible transportation agencies. Proposition 1B requires a dollar for dollar match of local funds for an applicant agency to receive state funds under the program. CURRENT STATUS: This report includes several attachments that provide detailed information on project status. Please note that the “Project Numbers” in these lists are for clarification in this report and are only for reference to indicate the number of projects in this report. These “Project Numbers” are subject to change in subsequent reports as projects are added and deleted. Currently there are 257 projects shown in the tables in these reports. COMPLETED PROJECTS and PROJECT BENEFITS: This report shows projects that are completed and have an approved Final Delivery Report in separate tables at the end of the project status and detail tables. Benefit tables have been added that show the project benefits from programming on the Project Programming Request (PPR) and the project benefits at completion on the Final Delivery Report (FDR). REMOVED PROJECTS: Three projects were removed from the program after allocation. They are no longer shown in the project totals.
Three Projects Removed from the SLPP Program After Allocation
Fo
rmu
la (
F)
Or
Co
mp
etit
ive
(C)
DIS
TR
ICT
CO
UN
TY
AGENCY
PR
OJE
CT
ID
PROJECT NAME/ (SLPP Cycle)
TO
TA
L S
LP
P
FU
ND
S
X $
1,00
0
AP
PR
OV
ED
B
EG
IN C
ON
ST
/ A
WA
RD
DA
TE
DA
TE
OF
A
LL
OC
AT
ION
F 1 MEN City of Point Arena 7687 Port & Windy Hollow Rd Rehab (5) $11 4/2014 6/2013 C 6 FRE City of Fresno 7669 Friant Rd Widening at Shepherd Ave (5) $145 10/2013 6/2013 F 12 ORA City of Mission Viejo 7508 La Paz Bridge & Road Widening (4) $1,275 11/2013 5/2012
Total SLPP Funds X $1,000 $1,431

California Department of Transportation FY 2017-18 3rd Quarter Report
Proposition 1B State-Local Partnership Program Page 6 of 34
Formula Projects - Status and Detail: Scope Budget and Schedule
PR
OJE
CT
NU
MB
ER
DIS
TR
ICT
CO
UN
TY
/ A
gen
cy
AGENCY
PR
OJE
CT
ID
PROJECT NAME/ (SLPP Cycle)
TO
TA
L P
RO
JEC
T
CO
ST
X
$1,
000
TO
TA
L C
ON
ST
C
OS
T
X $
1,00
0
TO
TA
L S
LP
P
FU
ND
S
X $
1,00
0
AP
PR
OV
ED
B
EG
IN C
ON
ST
/ A
WA
RD
DA
TE
DA
TE
OF
A
LL
OC
AT
ION
CO
NS
TR
UC
TIO
N
% C
OM
PL
ET
E
DA
TE
C
ON
ST
RU
CT
ION
C
OM
PL
ET
ED
CO
NS
TR
UC
TIO
N
AW
AR
DE
D
AL
LO
CA
TE
D B
UT
N
OT
AW
AR
DE
D
S
CO
PE
BU
DG
ET
SC
HE
DU
LE
1 4 Vari. Bay Area Rapid Transit 7489 BART - Warm Springs Extension (1,2,3,4,5) $890,000 $746,904 $99,180 6/2011
1/2010 1/2010 1/2011
10/2011 9/2012
99% X
2 4 CC Caltrans SR 4 East Somersville to 160 Segment 3 (2,4) $92,407 $59,775 $8,534 4/2012 1/2012
1/2012 100% 6/2017 X
3 4 CC Contra Costa Transp Auth SR 4 East Widening Segment 3B (5) $88,161 $76,740 $5,868 10/2012 8/2012 99% X
4 4 MRN Sonoma Marin Rail Trans Dist 7530 Sonoma-Marin Area Rail Transit (4,5) $397,060 $294,970 $8,322 12/2011 12/2011
8/2012 100% 6/2017 X
5 4 SF Caltrans 7698 Doyle Drive (5) P3 project $849,169 $605,799 $19,366 1/2011 6/2013 93% X
6 4 SM Peninsula Cnty Jnt Pwrs Brd 7514 Positive Train Control (4,5) $227,691 $203,700 $6,300 10/2011 10/2011
5/2013 47% X
7 4 Vari Peninsula Cnty Jnt Pwrs Brd 7671 Signal System Rehab (5) $2,600 $2,600 $233 3/2013 3/2013 98% X
8 4 SCL Santa Clara Vly Trans Auth 7534 BART – Vehicle Procurement (4,5) $213,112 $213,112 $34,865 6/2012 5/2013
5/2013 11% X
9 4 SON Caltrans 101 – Petaluma River Bridge (4) $127,347 $77,000 $1,865 10/2012 5/2012 100% 6/2017 X
10 6 TUL Dinuba 7511 Avenue 416 Widening -Rd 56 to Rd 80 (5) $22,730 $22,730 $7,551 11/2013 6/2013 95% X
11 7 LA LACMTA 7555 Transit Bus Acquisition (5) $297,070 $297,070 $36,250 1/2013 8/2012 100% 6/2017 X
12 7 LA LACMTA 7695 Crenshaw LAX Transit Corridor (5) $1,762,725 $1,571,975 $49,529 7/2013 5/2013 29% X
13 7 LA SCRRA 7495 Positive Train Control (3,4) $231,112 $209,282 $20,000 1/2011 1/2011 8/2011 99% X
14 7 LA Caltrans 7484 I-5 Carmenita Interchange (2) $395,167 $171,930 $14,925 7/2011 6/2010 98% X
15 7 LA Caltrans I-5 HOV Empire Ave I/C (4) $341,859 $195,787 $13,061 10/2012 5/2012 65% X
16 8 RIV City of Corona 7546 Foothill Parkway Westerly Extension (5) $23,500 $23,500 $7,000 12/2013 3/2013 100% 4/2017 X
17 8 RIV Riverside Cnty 7653 Rte 91 Corridor Improvement (5) $1,344,829 $942,109 $37,173 5/2013 3/2013 100% 3/2018 X
18 8 SBD SANBAG 7681 Downtown Passenger Rail Project (5) $92,757 $66,347 $10,921 12/2013 6/2013 100% 8/2017 X 19 8 SBD City of Ontario 7688 South Milliken Avenue RR Grade Sep (5) $82,016 $71,300 $7,210 12/2013 6/2013 100% 11/2017 X
20 10 SJ Caltrans Rte 99 South Stockton 6 Lane (5) $214,458 $113,958 $16,065 10/2012 6/2012 1/2013 100% 9/2017 X
21 11 SD San Diego Assoc of Gov 7531 Blue Line Station Rehab (5) $136,818 $135,761 $30,993 5/2013 8/2012
5/2013 98% X
22 11 SD San Diego Assoc of Gov 7559 Blue Line Traction and Power Substation (5) $19,019 $16,587 $4,658 9/2012 8/2012 99% X

California Department of Transportation FY 2017-18 3rd Quarter Report
Proposition 1B State-Local Partnership Program Page 7 of 34
Formula Projects - Status and Detail: Scope Budget and Schedule
PR
OJE
CT
NU
MB
ER
DIS
TR
ICT
CO
UN
TY
/ A
gen
cy
AGENCY
PR
OJE
CT
ID
PROJECT NAME/ (SLPP Cycle)
TO
TA
L P
RO
JEC
T
CO
ST
X
$1,
000
TO
TA
L C
ON
ST
C
OS
T
X $
1,00
0
TO
TA
L S
LP
P
FU
ND
S
X $
1,00
0
AP
PR
OV
ED
B
EG
IN C
ON
ST
/ A
WA
RD
DA
TE
DA
TE
OF
A
LL
OC
AT
ION
CO
NS
TR
UC
TIO
N
% C
OM
PL
ET
E
DA
TE
C
ON
ST
RU
CT
ION
C
OM
PL
ET
ED
CO
NS
TR
UC
TIO
N
AW
AR
DE
D
AL
LO
CA
TE
D B
UT
N
OT
AW
AR
DE
D
S
CO
PE
BU
DG
ET
SC
HE
DU
LE
23 11 SD Caltrans I-805 HOV Managed Lanes – North (4) $163,000 $127,305 $1,358 4/2012 10/2011 100% 3/2018 X
24 11 SD Caltrans 7699 I-5 Genessee Avenue Interchange (5) $83,944 $64,857 $8,000 12/2014 5/2013 90% X
25 12 ORA Orange County 7543 La Pata Avenue (5) $57,220 $45,220 $5,110 12/2013 6/2013 100% 1/2017 X
26 12 ORA Caltrans 7700 I-5 HOV Pac Coast Hwy-San Juan Clark (5) $63,093 $49,272 $20,789 12/2013 6/2013 97% X
Totals $8.2B $6.4B $475M
Project is on time, on budget, or within scope. Schedule, scope and/or budget is unavailable or needs further action. See Corrective Actions. Project Closeout is delayed by 6 months or longer.

California Department of Transportation FY 2017-18 3rd Quarter Report
Proposition 1B State-Local Partnership Program Page 8 of 34
Formula Projects – FINAL DELIVERY REPORT IS PAST DUE
PR
OJE
CT
NU
MB
ER
DIS
TR
ICT
CO
UN
TY
/ A
gen
cy
AGENCY
PR
OJE
CT
ID
PROJECT NAME/ (SLPP Cycle)
TO
TA
L P
RO
JEC
T
CO
ST
X
$1,
000
TO
TA
L C
ON
ST
C
OS
T
X $
1,00
0
TO
TA
L S
LP
P
FU
ND
S
X $
1,00
0
AP
PR
OV
ED
B
EG
IN C
ON
ST
/ A
WA
RD
DA
TE
DA
TE
OF
A
LL
OC
AT
ION
CO
NS
TR
UC
TIO
N
% C
OM
PL
ET
E
DA
TE
C
ON
ST
RU
CT
ION
C
OM
PL
ET
ED
CO
NS
TR
UC
TIO
N
AW
AR
DE
D
AL
LO
CA
TE
D B
UT
N
OT
AW
AR
DE
D
S
CO
PE
BU
DG
ET
SC
HE
DU
LE
27 3 SAC Sacramento Cnty 7536 Hwy 50 / Watt Ave (5) $38,750 $30,448 $8,586 9/2012 4/2012 100% 7/2016 X
28 4
Bay Area Toll Auth
Bay Area Rapid Transit 7499 Oakland Airport Connector (2,4,5) $484,111 $454,081 $20,000 11/2010
1/2011 10/2011 12/2012
100% 9/2015 X
29 4 CC Caltrans SR 4 East Somersville to 160 Segment 2 (1,3) $83,967 $48,717 $9,984 10/2011 10/2011
10/2011 100% 2/2016 X
30 4 SM Sam Trans 7655 Replacement Gillig Buses (5) $35,630 $34,279 $5,505 1/2013 12/2012 100% 9/2016 X 31 4 SM Sam Trans 7694 Communications System Upgrade (5) $13,400 $13,400 $101 82013 5/2013 100% 8/2016 X 32 4 SON Caltrans 7697 101 – Old Redwood Hwy OC & IC (5) $41,388 $26,798 $4,610 2/2013 9/2012 100% 11/2016 X
33 5 SCR Santa Cruz Metro Transit District 7557 Metro Base Consolidated Facility (5) $74,824 $63,376 $5,812 12/2012 8/2012 100% 12/2016 X
34 6 FRE Caltrans 7696 Kings Canyon Expressway Seg 2 (5) $43,600 $23,000 $11,500 6/2013 1/2013 100% 10/2014 X
35 7 LA LACMTA 7496 LA - San Fernando Valley Transit Ext (2,3) $160,600 $151,500 $32,300 3/2010 1/2011 1/2011 100% 6/2015 X
36 7 LA LACMTA 7664 Exposition Light Rail (5) $110,315 $101,930 $28,259 6/2013 3/2013 100% 5/2016 X 37 7 LA Caltrans I-5 N. Carpool Lanes SR 118-170 (1) $236,001 $136,075 $25,075 5/2010 5/2009 100% 7/2016 X 38 8 SBD SANBAG 7538 I-15 / Ranchero Rd Interchange (4) $57,622 $44,221 $4,550 11/2012 5/2012 100% 12/2015 X 39 8 SBD City of Ontario 7691 Vineyard Avenue RR Grade Sep (5) $55,195 $50,800 $19,490 12/2013 6/2013 100% 9/2016 X 40 12 ORA City of Cypress 7568 Cerritos Avenue Widening (5) $439 $378 $168 5/2013 3/2013 100% 11/2016 X 41 12 ORA Caltrans 7701 SR 91 Aux Lane / Tustin Ave - SR 55 IC (5) $41,930 $28,000 $14,000 10/2013 6/2013 100% 10/2016 X
Totals $1.5B $1.2B $190M
Project is on time, on budget, or within scope. Schedule, scope and/or budget is unavailable or needs further action. See Corrective Actions. Project Closeout is delayed by 12 months or longer.

California Department of Transportation FY 2017-18 3rd Quarter Report
Proposition 1B State-Local Partnership Program Page 9 of 34
Formula Projects - Completed
PR
OJE
CT
NU
MB
ER
DIS
TR
ICT
CO
UN
TY
/ A
GE
NC
Y
AGENCY PROJECT NAME/
(SLPP Cycle)/ Project ID
AP
PR
OV
ED
TO
TA
L
PR
OJE
CT
CO
ST
X
$1,
000
AC
TU
AL
TO
TA
L
PR
OJE
CT
CO
ST
X
$1,
000
AP
PR
OV
ED
TO
TA
L
CO
NS
T C
OS
T
X $
1,00
0
AC
TU
AL
TO
TA
L
CO
NS
T C
OS
T
X $
1,00
0
AP
PR
OV
ED
SL
PP
F
UN
DS
X
$1,
000
AC
TU
AL
SL
PP
F
UN
DS
X
$1,
000
DE
-AL
LO
CA
TE
D
SL
PP
SA
VIN
GS
X
$1,0
00
NO
N
DE
-AL
LO
CA
TE
D
SL
PP
SA
VIN
GS
X
$1,0
00
AL
LO
CA
TIO
N
DA
TE
AC
TU
AL
CO
NS
T
ST
AR
T D
AT
E
AC
TU
AL
CO
NS
T
EN
D D
AT
E
42 1 MEN City of Fort Bragg Street Resurfacing Project (5) 7615 $1,445 $1,197.6 $1,445 $1,197.6 $163 $163 5/2013 5/13/13 1/13/14 43 1 MEN City of Willits Street Rehab (5) 7614 $712 $486.1 $712 $486.1 $116 $116 5/2013 6/03/13 9/12/13 44 3 NEV Truckee Annual Slurry Seal Project (2) 7430 $673 $505.6 $673 $505.6 $163 $163 5/2010 7/29/10 10/08/10 45 3 NEV Truckee 2012 Slurry Seal Project (4) 7509 $825 $606.4 $825 $606.4 $144 $144 10/2011 6/07/12 9/14/12 46 3 NEV Truckee 2013 Slurry Seal Project (5) 7548 $660 $734.6 $660 $734.6 $71 $71 3/2013 6/18/13 9/24/13 47 3 NEV Nevada City Nevada City Paving- Various Locations (2) 7424 $62 $74.6 $62 $74.6 $31 $31 1/2011 6/08/11 6/14/11 48 3 NEV Nevada City New Mohawk Road Paving (5) 7692 $101 $83.6 $101 $83.6 $41 $41 6/2013 7/10/13 8/13/13 49 3 SAC CalTrans Hwy 50 HOV Lanes (1) $160,925 $96,306.4 $147,125 $81,542.3 $7,214 $7,208 $6 6/2009 10/26/09 5/10/13
50 3 SAC City of Rancho Cordova Folsom Boulevard Enhancements (3) 7474 $6,837 $6,295 $6,037 $5,665 $2,724 $2,724 10/2011 9/01/11 5/09/13
51 3 SAC City of Sacramento Cosumnes Blvd I-5 IC (5) 7558 $95,307 $93,266 $82,446 $67,223 $7,691 $7,691 12/2012 1/08/13 7/18/16 52 3 SAC Sac RT South Sac Light Rail Phase 2 Ext (3) 7501 $31,500 $30,793.4 $31,500 $30,793.4 $7,200 $7,200 10/2011 11/01/11 10/31/14
53 4 ALA Alameda County Transit AC Transit Bus Procurement Program (2,5) 7502 $118,753 $118,773.1 $118,753 $118,773.1 $21,007 $21,007 10/2011
9/2012 4/01/12 7/31/16
54 4 CC City of El Cerrito 2013 Street Improvement Program (5) 7693 $832 $817.4 $751 $738.4 $354 $354 6/2013 10/09/13 9/30/14 55 4 SM City of Brisbane Retrofit Safety Systems at School Xings (5) 7647 $74 $97.9 $74 $97.9 $37 $37 5/2013 7/25/13 3/17/14 56 4 SM City of Brisbane Bayshore Blvd Rehab (5) 7648 $120 $132.4 $120 $132.4 $60 $60 5/2013 8/05/13 9/18/13 57 4 SM City of Brisbane Sidewalk Improvement Various Locations (5) 7649 $100 $124.1 $100 $124.1 $50 $50 5/2013 8/26/13 2/24/14 58 4 SM City of Burlingame 2013 Street Resurfacing Program (5) 7646 $1,000 $889.4 $950 $844.4 $411 $411 5/2013 7/25/13 1/31/14 59 4 SM Town of Colma Hillside Blvd Pavement Rehab (5) 7644 $144 $140.5 $144 $140.5 $49 $49 3/2013 6/12/13 07/11/13 60 4 SM City of E Palo Alto Street Resurfacing Program FY 12/13 (5) 7638 $1,090 $941.7 $990 $911.7 $495 $456 $39 5/2013 2/20/14 5/17/16 61 4 SM City of Foster City Street Resurfacing Project (5) 7639 $1,016 $1,085.2 $1,016 $1,085.2 $508 $508 1/2013 3/18/13 12/16/13
62 4 SM City of Half Moon Bay Road Rehab Program (5) 7651 $484 $685.1 $484 $685.1 $242 $242 5/2013 8/20/13 1/21/14
63 4 SM Town of Hillsborough 2013 Street Resurfacing (5) 7645 $914 $1,853.5 $914 $1,853.5 $457 $457 3/2013 5/06/13 8/31/13
64 4 SM San Mateo Cnty Resurface and Restripe Alpine Rd (5) 7643 $215 $564.6 $215 $564.6 $88 $88 5/2013 8/01/13 10/25/13 65 4 SM San Mateo Cnty Resurface Various Streets (5) 7654 $1,850 $1,354.9 $1,850 $1,354.9 $605 $605 5/2013 7/09/13 5/19/13 66 4 SM City of San Mateo Street Rehab (5) 7637 $1,287 $1,497.5 $1,247 $1,471 $431 $431 5/2013 7/2013 7/08/14 67 4 SM City of San Mateo Citywide Street Rehab (5) 7641 $1,281 $1,410.6 $1,280 $1,410.6 $613 $613 3/2013 7/15/13 4/22/14
68 4 SM City of South San Francisco 2013 Street Rehab (5) 7642 $1,014 $1,403.7 $1,004 $1,393.2 $502 $502 5/2013 8/26/13 12/13/13

California Department of Transportation FY 2017-18 3rd Quarter Report
Proposition 1B State-Local Partnership Program Page 10 of 34
Formula Projects - Completed
PR
OJE
CT
NU
MB
ER
DIS
TR
ICT
CO
UN
TY
/ A
GE
NC
Y
AGENCY PROJECT NAME/
(SLPP Cycle)/ Project ID
AP
PR
OV
ED
TO
TA
L
PR
OJE
CT
CO
ST
X
$1,
000
AC
TU
AL
TO
TA
L
PR
OJE
CT
CO
ST
X
$1,
000
AP
PR
OV
ED
TO
TA
L
CO
NS
T C
OS
T
X $
1,00
0
AC
TU
AL
TO
TA
L
CO
NS
T C
OS
T
X $
1,00
0
AP
PR
OV
ED
SL
PP
F
UN
DS
X
$1,
000
AC
TU
AL
SL
PP
F
UN
DS
X
$1,
000
DE
-AL
LO
CA
TE
D
SL
PP
SA
VIN
GS
X
$1,0
00
NO
N
DE
-AL
LO
CA
TE
D
SL
PP
SA
VIN
GS
X
$1,0
00
AL
LO
CA
TIO
N
DA
TE
AC
TU
AL
CO
NS
T
ST
AR
T D
AT
E
AC
TU
AL
CO
NS
T
EN
D D
AT
E
69 4 SM Town of Woodside 2013 Road Rehab (5) 7657 $534 $580.7 $534 $580.7 $267 $267 5/2013 7/30/13 3/25/14 70 4 SM SMCTD Purchase Buses for Paratransit (2) 7491 $241 $171.8 $241 $171.8 $49 $23 $22 $4 1/2011 9/14/11 2/28/12 71 4 SM SMCTD Replacement Mini Vans (3) 7492 $604 $468.7 $604 $468.7 $100 $47 $53 1/2011 9/14/11 2/15/12 72 4 SM SMCTD Replacement Bus Washer (3) 7493 $676 $302.1 $676 $302.1 $150 $31 $119 1/2011 2/08/12 3/31/14 73 4 SON City of Santa Rosa Hybrid Bus Acquisition (1) 7488 $2,400 $2,400 $2,400 $2,400 $1,200 $1,200 1/2010 3/30/10 10/19/11
74 4 SON Caltrans 101 Airport OC and IC (4,5) $49,208 $49,849 $38,313 $35,927 $3,693 $3,693 4/2012 9/2012 12/27/12 8/03/15
75 5 SB City of Goleta Patterson Ave Sidewalk Infill (5) 7678 $335 $153.1 $314 $149.3 $54 $54 5/2013 11/19/13 7/15/14 76 5 SB City of Lompoc 2013 Laurel Ave Rehab (5) 7673 $300 $283.4 $300 $283.4 $77 $77 5/2013 11/05/13 6/02/14
77 5 SB County of Santa Barbara Overlay Various County Roads (5) 7684 $1,109 $2,633.0 $1,109 $2,633.0 $242 $242 5/2013 11/12/13 5/20/14
78 5 SB City of Santa Barbara Carillo Street Pavement Overlay (5) 7686 $320 $321.2 $320 $321.2 $160 $160 5/2013 5/15/13 9/15/13
79 5 SB City of Santa Maria Central Santa Maria Roadway Repairs (5) 7683 $600 $577.1 $600 $577.1 $180 $180 5/2013 8/06/13 3/11/14 80 5 SB City of Santa Maria Union Valley Parkway Arterial Ph III (5) 7510 $5,039 $4,078.3 $5,039 $4,078.3 $2,163 $2,040 $123 12/2012 2/15/13 1/02/14
81 5 SCR Santa Cruz Metro Transit Dist CNG Bus Purchase (4) 7515 $5,820 $5,721.5 $5,820 $5,721.5 $427 $427 10/2011 11/23/11 5/04/12
82 6 MAD Madera County Avenue 12 Sidewalk between Rds 36&37 (1) 7406 $320 $416.1 $309 $405.1 $150 $150 1/2010 7/12/10 10/06/10 83 6 MAD City of Chowchilla Presidential Street Resurfacing (5) 7613 $527 $510.9 $480 $494.6 $240 $240 6/2013 12/10/13 12/0714 84 6 FRE City of Clovis Herndon, Clovis-Fowler (5) 7662 $1,598 $1,458.8 $1,598 $1,458.8 $799 $730 $69 1/2013 4/15/13 8/29/14 85 6 FRE City of Clovis Temperance, Bullard-Herndon (5) 7663 $2,597 $2,334 $2,597 $2,334 $1,298 $1,172 $126 1/2013 4/15/13 3/10/14 86 6 FRE City of Clovis Temperance, Enterprise Canal-Shepherd (5) 7680 $1,594 $2,015.1 $1,594 $2,015.1 $728 $728 6/2013 12/09/13 6/15/15 87 6 FRE City of Fresno Willow Ave Widen Barstow to Escalon (5) 7667 $2,367 $2,368 $1,930 $1,9622.3 $965 $955 $10 3/2013 9/26/13 2/26/16 88 6 FRE City of Fresno Peach Ave Widening (5) 7668 $12.311 $10.664.2 $7,300 $6,119.8 $3,650 $2,997 $653 1/2013 6/27/13 5/28/15 89 6 FRE City of Fresno Herndon EB Widening (5) 7675 $2,044 $1,402.8 $1,715 $1,250.2 $818 $626 $192 6/2013 10/24/13 8/07/14 90 6 FRE City of Fresno 180 W Frontage Rd Improvements (5) 7685 $7,519 $5,714.1 $4,426 $2,734.9 $2,213 $1,334 $879 6/2013 11/21/13 9/12/15
91 6 MAD Madera County Transp Comm Road 200 Reconstruction & Widening (2) 7445 $1,195 $2,022 $742 $727 $371 $364 $7 5/2010 7/11/11 1/24/12
92 6 MAD Madera County Avenue 9 Improvements (5) 7549 $3,419 $2,152.1 $3,204 $2,029.7 $1,454 $1,016 $438 3/2013 6/17/13 2/25/14 93 6 MAD City of Madera Rehab, Resurface, Reconstruct & ADA (2) 7442 $356 $366.9 $336 $346.9 $150 $150 4/2010 10/06/10 12/21/11 94 6 MAD City of Madera Street 3R and ADA Improvements (2) 7444 $365 $252.4 $355 $242.4 $137 $122 $15 1/2011 7/06/11 12/21/11 95 6 MAD City of Madera 3R & ADA – D Street & Almond Drive (3) 7485 $566 $380.4 $546 $373.9 $273 $187 $86 10/2012 4/17/13 11/06/13 96 6 MAD City of Madera 3R & ADA – S Gateway Drive (3) 7486 $437 $212 $417 $205.2 $206 $103 $103 10/2012 4/17/13 11/06/13

California Department of Transportation FY 2017-18 3rd Quarter Report
Proposition 1B State-Local Partnership Program Page 11 of 34
Formula Projects - Completed
PR
OJE
CT
NU
MB
ER
DIS
TR
ICT
CO
UN
TY
/ A
GE
NC
Y
AGENCY PROJECT NAME/
(SLPP Cycle)/ Project ID
AP
PR
OV
ED
TO
TA
L
PR
OJE
CT
CO
ST
X
$1,
000
AC
TU
AL
TO
TA
L
PR
OJE
CT
CO
ST
X
$1,
000
AP
PR
OV
ED
TO
TA
L
CO
NS
T C
OS
T
X $
1,00
0
AC
TU
AL
TO
TA
L
CO
NS
T C
OS
T
X $
1,00
0
AP
PR
OV
ED
SL
PP
F
UN
DS
X
$1,
000
AC
TU
AL
SL
PP
F
UN
DS
X
$1,
000
DE
-AL
LO
CA
TE
D
SL
PP
SA
VIN
GS
X
$1,0
00
NO
N
DE
-AL
LO
CA
TE
D
SL
PP
SA
VIN
GS
X
$1,0
00
AL
LO
CA
TIO
N
DA
TE
AC
TU
AL
CO
NS
T
ST
AR
T D
AT
E
AC
TU
AL
CO
NS
T
EN
D D
AT
E
97 6 MAD City of Madera 4th St – Pine to K St (5) 7541 $1,512 $1,588.7 $1,360 $975.3 $567 $567 1/2013 5/15/13 2/15/14 98 6 TUL Tulare County Road 80 Widening Phase 1A (1) 7431 $6,000 $8,125 $6,000 $8,125 $2,294 $2,294 5/2010 9/15/10 1/15/13 99 6 TUL Tulare County Road 108 Widening (2) 7429 $29,498 $12,613.4 $29,498 $12,613.4 $2,295 $2,295 1/2011 2/07/11 5/15/13
100 7 LA LACMTA I-10 & I-110 Convert HOV to HOT Lanes (2) 7449 $69,300 $123,885 $64,710 $116,538 $20,000 $20,000 1/2011 7/06/11 2/23/14
101 7 LA LACMTA CNG Bus Procurement (3,4) 7494 $86,830 $85,762.4 $86,830 $85,762.4 $38,550 $38,257 $293 1/2011 2/2012 12/16/11 8/28/13
102 8 RIV Riverside County Fred Waring Drive Improvements (5) 7652 $9,432 $10,653.8 $8,000 $7,312.7 $4,000 $3,640 $360 6/2013 11/26/13 1/12/16 103 8 RIV City of Indian Wells Highway 111 Improvements (5) 7556 $3,100 $3,008 $3,100 $3,008 $1,550 $1,505 $45 3/2013 4/14/13 5/15/14 104 8 RIV City of Indio Monroe Street Improvements (5) 7544 $2,750 $3,203 $2,750 $3,203 $1,375 $1,375 10/2012 11/07/12 6/24/13 105 8 RIV City of Indio Varner Road at Jefferson Street (5) 7545 $4,500 $1,837.1 $4,500 $1,837.1 $2,250 $882 $1,368 6/2013 11/06/13 11/03/14] 106 8 RIV City of La Quinta Hwy 111/Washington St Improvements (5) 7656 $566 $743.4 $566 $743.4 $283 $283 6/2013 8/26/13 2/04/14
107 8 RIV City of Murrieta I-15 Los Alamos Rd OC (5) 7636 (Project has Competitive Funds also which are shown in Competitive Chart)
$9,900 $7,302.7 $9,900 $7,302.7 $2,500 $2,500 10/2015 4/1/13 8/18/15
108 8 RIV City of Palm Desert I-10 Monterey Ave IC Ramp Modification (5) 7640 $8,361 $8,044.2 $8,361 $8,044.2 $2,800 $2,586 $214 5/2013 1/23/14 3/24/16
109 8 SBD San Bernardino County
Maple Lane Drainage and Slope Improvements (5) 7658 $2,892 $2,094 $2,604 $1,844.8 $1,302 $923 $379 3/2013 8/20/13 9/19/14
110 8 SBD Town of Apple Valley Yucca Loma Bridge and Yates Rd (5) 7682 $45,250 $45,263.3 $42,087 $41,734 $9,712 $9,638 $74 6/2013 12/18/13 9/13/16
111 8 SBD City of Big Bear Lake Village “L” Street Improvements (5) 7666 $4,710 $5,995.3 $4,541 $5,826.3 $1,200 $1,200 1/2013 3/11/13 2/10/14
112 8 SBD City of Twentynine Palms National Park Drive Improvements Ph 2 (5) 7659 $850 $1,079.7 $800 $1,044.7 $400 $400 1/2013 5/28/13 7/22/14
113 8 SBD Town of Yucca Valley RT 62 – Apache Trail and Palm Ave (5) 7660 $3,757 $3,663.4 $2,930 $2,734.3 $723 $597 $126 3/2013 12/20/13 7/31/14
114 8 SBD Town of Yucca Valley RT 62 – La Honda and Dumosa (5) 7661 $3,702 $3,076.5 $2,594 $1,968.5 $778 $535 $243 1/2013 7/23/13 5/20/14
115 10 SJ City of Stockton Grade Separating Lower Sacramento Rd & UPRR Tracks (2) 7448 $34,000 $22,566.7 $30,040 $18,606.6 $5,100 $5,100 4/2010 10/19/10 3/10/14
116 10 SJ City of Stockton French Camp Rd I-5 Interchange (4) 7533 $53,058 $47,769 $33,199 $28,224.4 $3,800 $3,800 4/2012 9/25/12 5/21/15 117 11 IMP Imperial County Willoughby Road (5) 7560 $1,300 $1,013.1 $1,300 $1,013.1 $650 $425 $225 3/2013 8/13/13 4/15/14 118 11 IMP Imperial County Dogwood Road Resurface (5) 7561 $1,802 $1,345.3 $1,802 $1,345.3 $901 $575 $326 3/2013 8/13/13 6/20/14 119 11 IMP City of Brawley Eastern Ave Rehab (5) 7550 $1,250 $1,289.2 $1,250 $1,289.2 $625 $625 3/2013 6/18/13 10/29/14 120 11 IMP City of Calexico Downtown Repaving (5) 7562 $800 $662.7 $800 $662.7 $400 $332 $68 3/2013 3/28/14 1/20/15 121 11 IMP City of Calexico 5th Street Repaving (5) 7563 $1,030 $599.5 $1,030 $599.5 $515 $300 $215 3/2013 3/28/14 1/20/15

California Department of Transportation FY 2017-18 3rd Quarter Report
Proposition 1B State-Local Partnership Program Page 12 of 34
Formula Projects - Completed
PR
OJE
CT
NU
MB
ER
DIS
TR
ICT
CO
UN
TY
/ A
GE
NC
Y
AGENCY PROJECT NAME/
(SLPP Cycle)/ Project ID
AP
PR
OV
ED
TO
TA
L
PR
OJE
CT
CO
ST
X
$1,
000
AC
TU
AL
TO
TA
L
PR
OJE
CT
CO
ST
X
$1,
000
AP
PR
OV
ED
TO
TA
L
CO
NS
T C
OS
T
X $
1,00
0
AC
TU
AL
TO
TA
L
CO
NS
T C
OS
T
X $
1,00
0
AP
PR
OV
ED
SL
PP
F
UN
DS
X
$1,
000
AC
TU
AL
SL
PP
F
UN
DS
X
$1,
000
DE
-AL
LO
CA
TE
D
SL
PP
SA
VIN
GS
X
$1,0
00
NO
N
DE
-AL
LO
CA
TE
D
SL
PP
SA
VIN
GS
X
$1,0
00
AL
LO
CA
TIO
N
DA
TE
AC
TU
AL
CO
NS
T
ST
AR
T D
AT
E
AC
TU
AL
CO
NS
T
EN
D D
AT
E
122 11 IMP City of Calipatria Lake Avenue Improvements (5) 7552 $282 $281.9 $282 $281.9 $133 $133 3/2013 6/11/13 9/27/13 123 11 IMP City of El Centro FY 2013 Streets Rehab Project (5) 7553 $2,073 $2,206.2 $2,073 $2,206.2 $1,036 $1,036 3/2013 9/03/13 9/26/14 124 11 IMP City of Holtville Grape Avenue Improvements Ph2 (5) 7551 $323 $297.1 $323 $297.1 $161 $149 $12 3/2013 6/10/13 11/22/13 125 11 IMP City of Imperial South N Street Reconstruction (5) 7564 $768 $807.6 $768 $807.6 $384 $384 3/2013 9/25/13 8/05/14
126 11 IMP City of Westmorland 6th Street and G Street Improvements (5) 7554 $136 $149.5 $136 $149.5 $68 $68 3/2013 8/7/13 3/27/14
127 11 SD SANDAG Blue Line Light Rail Vehicles (2) 7497 $233,178 $268,967 $233,178 $268,967 $31,097 $31,097 1/2011 1/20/11 1/20/14 128 11 SD SANDAG Blue Line Crossovers and Signals (4) 7513 $42,971 $40,793 $40,278 $37,915 $10,200 $10,200 10/2011 4/04/11 9/19/16 129 12 ORA OCTA Oso Parkway Widening (5) 7503 $5,815 $5,758.7 $3,180 $3,671.4 $1,204 $1,204 5/2013 5/19/14 12/08/15
130 12 ORA OCTA Tustin Ranch Road Extension (4,5) 7535 $21,303 $29,161 $19,388 $27,246 $4,927 $4,927 5/2012 6/2013 8/1/12 6/3/14
131 12 ORA OCTA Laguna Niguel/Mission Viejo Metrolink (5) 7542 $4,132 $4,179.6 $1,469 $1,499 $695 $695 9/2012 01/28/13 10/28/13 132 12 ORA Orange County Dale Street Reconstruction (5) 7610 $261 $257 $214 218.2 $107 $107 3/2013 5/21/13 10/10/13
133 12 ORA Orange County La Colina Drive Pavement Rehab (5) 7650 $1,818 $1,612.5 $1,665 $1,520 $815 $761 $54 3/2013 6/2013 4/23/13 8/26/13
134 12 ORA Orange County Moulton Parkway Smart Street Seg 3- Phase II (5) 7608 $6,844 $9,489.7 $6,844 $9,489.7 $3,422 $3,422 6/2012 12/4/12 10/2/14
135 12 ORA Orange County Skyline Drive Reconstruction (5) 7609 $580 $657.6 $504 $606.5 $252 $252 3/2013 8/09/13 12/03/13 136 12 ORA Orange County Cow Camp Rd (5) 7504 $31,434 $46,178 $29,434 $44,178 $4,160 $3,915 $245 5/2013 6/19/13 9/8/16 137 12 ORA City of Aliso Viejo Aliso Creek Rd Rehab (5) 7565 $743 $573.8 $644 $484.6 $318 $259 $59 3/2013 8/21/13 10/29/13 138 12 ORA City of Anaheim Brookhurst St Improvements (5) 7505 $8,961 $9,809 $8,961 $9,809 $3,393 $2,964 $429 5/2013 6/11/13 3/21/16 139 12 ORA City of Anaheim Tustin & Riverdale Ave Improvements (5) 7584 $554 $574.5 $554 $574.5 $277 $277 12/2012 4/16/13 9/16/13 140 12 ORA City of Anaheim Broadway Improvements (5) 7585 $374 $642.4 $354 $588.1 $187 $187 12/2012 5/07/13 1/03/14 141 12 ORA City of Anaheim Anaheim Blvd Improvements (5) 7580 $664 $723.8 $664 $723.8 $332 $332 12/2012 5/07/13 2/06/14 142 12 ORA City of Anaheim Orange Ave Improvements (5) 7581 $348 $411.3 $348 $411.3 $174 $174 12/2012 5/07/13 2/06/14 143 12 ORA City of Anaheim Sunkist Street Improvements (5) 7582 $1,670 $1,697.4 $1,670 $1,697.4 $835 $835 12/2012 4/30/13 1/21/14 144 12 ORA City of Anaheim Knott Ave Improvements (5) 7583 $448 $643.2 $448 $643.2 $224 $224 12/2012 5/07/13 2/06/13 145 12 ORA City of Brea Imperial Hwy and Assoc. Rd Smart St. (1) 7408 $1,900 $1,292 $1,900 $1,292 $200 $200 4/2010 10/25/10 6/30/11 146 12 ORA City of Brea Lambert Rd Phase 2 Rehab (5) 7570 $794 $$1,755.3 $724 $1,674.5 $362 $362 3/2013 8/20/13 6/03/14 147 12 ORA City of Buena Park La Palma Ave Rehab (5) 7618 $1,182 $1,572.4 $1,142 $1,532.4 $571 $571 3/2013 7/09/13 11/15/13 148 12 ORA City of Costa Mesa Harbor Blvd & Adams Ave (5) 7507 $4,779 $4,503 $3,914 $3,670 $1,482 $1,388 $94 5/2013 11/5/13 10/6/15 149 12 ORA City of Costa Mesa Redhill Avenue Rehab (5) 7567 $1,901 $1,844.0 $1,901 $1,844.0 $922 $922 1/2013 6/10/13 7/15/14

California Department of Transportation FY 2017-18 3rd Quarter Report
Proposition 1B State-Local Partnership Program Page 13 of 34
Formula Projects - Completed
PR
OJE
CT
NU
MB
ER
DIS
TR
ICT
CO
UN
TY
/ A
GE
NC
Y
AGENCY PROJECT NAME/
(SLPP Cycle)/ Project ID
AP
PR
OV
ED
TO
TA
L
PR
OJE
CT
CO
ST
X
$1,
000
AC
TU
AL
TO
TA
L
PR
OJE
CT
CO
ST
X
$1,
000
AP
PR
OV
ED
TO
TA
L
CO
NS
T C
OS
T
X $
1,00
0
AC
TU
AL
TO
TA
L
CO
NS
T C
OS
T
X $
1,00
0
AP
PR
OV
ED
SL
PP
F
UN
DS
X
$1,
000
AC
TU
AL
SL
PP
F
UN
DS
X
$1,
000
DE
-AL
LO
CA
TE
D
SL
PP
SA
VIN
GS
X
$1,0
00
NO
N
DE
-AL
LO
CA
TE
D
SL
PP
SA
VIN
GS
X
$1,0
00
AL
LO
CA
TIO
N
DA
TE
AC
TU
AL
CO
NS
T
ST
AR
T D
AT
E
AC
TU
AL
CO
NS
T
EN
D D
AT
E
150 12 ORA City of Cypress Valley View Ave Overlay (5) 7569 $438 $420.7 $402 $384.7 $180 $180 3/2013 8/19/13 9/23/13 151 12 ORA City of Dana Point Residential Roadway Rehab (5) 7566 $824 $549.8 $824 $549.8 $318 $275 $43 1/2013 4/18/13 4/20/14
152 12 ORA City of Fountain Valley Brookhurst Street Improvements (5) 7575 $933 $1,228 $933 $1,228 $396 $396 3/2013 6/18/13 12/24/13
153 12 ORA City of Fullerton Berkeley Ave Reconstruction (5) 7572 $780 $826.6 $700 $718.7 $343 $343 1/2013 5/29/13 1/24/14 154 12 ORA City of Fullerton Magnolia Ave Reconstruction (5) 7573 $1,230 $1,535 $1,130 $1,449.9 $410 $410 1/2013 5/21/13 11/15/13
155 12 ORA City of Garden Grove Local Road Rehab (5) 7571 $1,684 $2,330.6 $1,684 $2,330.6 $842 $842 3/2013 8/13/13 7/10/14
156 12 ORA City of Huntington Beach Goldenwest St and Garfield Ave Rehab (5) 7574 $2,266 $2,881 $2,266 $2,881 $1,133 $1,133 12/2012 5/06/13 12/30/13
157 12 ORA City of Irvine Campus Dr Rehab (5) 7604 $2,774 $2,695.8 $2,500 $2,461.6 $1,138 $1,138 1/2013 6/2013 6/11/13 8/11/14
158 12 ORA City of Irvine Jamboree Road Rehab (5) 7605 $1,628 $834.7 $1,394 $752.1 $435 $376 $59 1/2013 7/08/13 10/16/13
159 12 ORA City of Laguna Beach Acquisition of Alternate Fuel Trolleys (5) 7611 $636 $597.2 $636 $597.2 $318 $299 $19 1/2013 6/18/13 9/9/15
160 12 ORA City of Laguna Hills El Toro Road Rehab (5) 7598 $1,280 $1,047.7 $1,280 $1,047.7 $343 $343 1/2013 6/25/13 12/09/14
161 12 ORA City of Laguna Niguel La Paz Road Rehab (5) 7577 $826 $846.1 $826 $846.1 $413 $413 3/2013 9/23/13 12/16/13
162 12 ORA City of Laguna Woods El Toro Rd Reconstruction (5) 7616 $591 $637.1 $591 $637.1 $293 $293 3/2013 8/21/13 8/20/14
163 12 ORA City of La Habra Idaho St Pavement Rehab (5) 7603 $492 $440.5 $492 $440.5 $246 $221 $25 3/2013 3/18/13 07/01/13 164 12 ORA City of La Palma La Palma Ave Rehab – Valley View /WCL (5) 7576 $676 $824.8 $636 $784.8 $318 $318 3/2013 6/04/13 3/04/14 165 12 ORA City of Lake Forest Lake Forest & Rockfield Resurface (5) 7578 $1,035 $868.8 $1,035 $868.8 $479 $430 $49 3/2013 7/29/13 11/19/13 166 12 ORA City of LosAlamitos Business Area Street Improvement (5) 7617 $636 $627.5 $636 $627.5 $318 $314 $4 3/2013 5/21/13 9/06/13
167 12 ORA City of Mission Viejo Jeronimo Rd Resurface (5) 7597 $1,378 $1,476.1 $1,278 $1,417.1 $574 $574 12/2012 4/30/13 12/02/13
168 12 ORA City of Newport Beach Balboa Blvd & Channel Rd (5) 7593 $1,586 $1,593.8 $1,386 $1,393.8 $693 $674 $19 1/2013 3/18/13 7/03/13
169 12 ORA City of Orange Jamboree Rd Rehab (5) 7591 $2,112 $2,158.1 $2,072 $2,118.1 $1,036 $1,036 3/2013 5/28/13 3/20/14 170 12 ORA City of Placentia Rose Drive and Yorba Linda Blvd Int (5) 7599 $300 $147.4 $300 $147.4 $95 $74 $21 1/2013 4/16/13 11/01/13 171 12 ORA City of Placentia Valencia Ave Rehab (5) 7600 $636 $642.3 $636 $642.3 $318 $318 1/2013 5/07/13 11/05/13
172 12 ORA City of Rancho Santa Margarita Santa Margarita Parkway Rehab (5) 7606 $600 $432.4 $535 $367.7 $99 $99 1/2013 4/10/13 5/30/13
173 12 ORA City of Rancho Santa Margarita FY 12/13 Residential Rehab (5) 7607 $500 $494.3 $480 $488.8 $216 $216 1/2013 2/27/13 6/04/13

California Department of Transportation FY 2017-18 3rd Quarter Report
Proposition 1B State-Local Partnership Program Page 14 of 34
Formula Projects - Completed
PR
OJE
CT
NU
MB
ER
DIS
TR
ICT
CO
UN
TY
/ A
GE
NC
Y
AGENCY PROJECT NAME/
(SLPP Cycle)/ Project ID
AP
PR
OV
ED
TO
TA
L
PR
OJE
CT
CO
ST
X
$1,
000
AC
TU
AL
TO
TA
L
PR
OJE
CT
CO
ST
X
$1,
000
AP
PR
OV
ED
TO
TA
L
CO
NS
T C
OS
T
X $
1,00
0
AC
TU
AL
TO
TA
L
CO
NS
T C
OS
T
X $
1,00
0
AP
PR
OV
ED
SL
PP
F
UN
DS
X
$1,
000
AC
TU
AL
SL
PP
F
UN
DS
X
$1,
000
DE
-AL
LO
CA
TE
D
SL
PP
SA
VIN
GS
X
$1,0
00
NO
N
DE
-AL
LO
CA
TE
D
SL
PP
SA
VIN
GS
X
$1,0
00
AL
LO
CA
TIO
N
DA
TE
AC
TU
AL
CO
NS
T
ST
AR
T D
AT
E
AC
TU
AL
CO
NS
T
EN
D D
AT
E
174 12 ORA City of San Clemente Camino De Los Mares Rehab (5) 7602 $1,400 $941.2 $1,400 $941.2 $318 $318 3/2013 8/20/13 4/15/14
175 12 ORA City of San Juan Capistrano Local Street Rehab (5) 7592 $804 $1,401.4 $804 $1,401.4 $318 $318 3/2013 9/3/13 8/5/14
176 12 ORA City of Santa Ana Bristol St Widening (4) 7506 $9,600 $7,992 $9,600 $7,992 $3,120 $1,874 $1,246 8/2012 1/22/13 2/20/15 177 12 ORA City of Santa Ana Broadway & McFadden Rehab (5) 7601 $3,765 $3,932.7 $3,765 $3,932.7 $1,551 $1,551 3/2013 8/05/13 11/24/14 178 12 ORA City of Seal Beach Arterial and Local Street Rehab (5) 7596 $655 $682.3 $655 $682.3 $318 $318 3/2013 6/13/13 8/12/13 179 12 ORA City of Stanton Citywide Street Rehab (5) 7590 $817 $816.8 $817 $816.8 $318 $318 3/2013 3/25/13 5/28/13 180 12 ORA City of Tustin Irvine Blvd & McFadden Ave Rehab (5) 7586 $913 $920.7 $913 $920.7 $358 $358 3/2013 8/20/13 9/02/14 181 12 ORA City of Tustin Newport Ave Bicycle Trail (5) 7587 $450 $690 $$400 $628.6 $200 $200 3/2013 8/20/13 7/15/14 182 12 ORA City of Tustin Enderle Cntr & Vandenberg Intersection (5) 7588 $145 $231.2 $70 $192.1 $35 $35 3/2013 8/20/13 9/02/14 183 12 ORA City of Villa Park Street Rehab (5) 7594 $676 $859 $619 $859 $125 $125 6/2013 10/2013 9/2014 184 12 ORA City of Westminster Brookhurst Street Improvement (5) 7589 $1,212 $1,220.7 $1,212 $1,220.7 $520 $520 3.2013 8/28/13 4/09/14 185 12 ORA City of Yorba Linda Yorba Linda Blvd Rehab (5) 7595 $761 $515.8 $674 $428.8 $336 $214 $122 1/2013 6/22/13 8/27/13
Total Completed Formula SLPP $1.33B $1.34B $1.24B $1.24B $264.6M $255.3M $22K $9.3M

California Department of Transportation FY 2017-18 3rd Quarter Report
Proposition 1B State-Local Partnership Program Page 15 of 34
Benefits of Completed Formula Projects
SL
PP
PR
OJE
CT
DIS
TR
ICT
CO
UN
TY
PROJECT PROJECT BENEFIT on PPR PROJECT BENEFIT on FDR
7614 1 MEN Street Rehabilitation Replace failing storm drains to prevent roadway deterioration Replaced undersized failing storm drain pipe 7615 1 MEN Street Resurfacing Resurface various streets in Fort Bragg Resurfaced 22 streets 7424 3 NEV Nevada City Paving- Various Locations Rehab Searls Ave - add 20 yrs useful life. Rehabbed .25 miles of Searls Ave 7692 3 NEV New Mohawk Rd Paving New pavement on New Mohawk Rd and Gold Flat Ct. Safety. 20+
years life. Grinded and removed existing asphalt with new Asphalt.
7548 3 NEV 2013 Slurry Seal Town wide slurry seal program. Slurry sealed roads to add 15+ years life. 7474 3 SAC Folsom Blvd Enhancement, Ph 2 Provide connectivity between light rail and peds. Rehabbed 1.5 mi roadway, bike & ped path. Increased safety.
Beautification 7501 3 SAC South Sacramento Light Rail, Ph 2 Add pkg structure at CRC, the end of South Line ph2. Added pkg spaces. Enhanced regional connectivity.
Accommodate future travel demand. Alleviate congestion on Hwy99.
7536 3 SAC Hwy 50 / Watt Ave (CMIA) Project not closed out yet. Project not closed out yet. 7558 3 SAC Cosumnes Rvr Blvd I-5 IC Reduce traffic congestion, improve mobility and promote economic
development. Reduced traffic congestion. Added access to new Delta Shores development. New bike lanes and sidewalks.
3 SAC Sac 50 - HOV Improve mobility - HOV from Watt Ave to Sunrise EB and WB HOV lane added. Increased avg travel speed by 7.38mph WB and 10.24mph during peak
7430 3 NEV Annual Slurry Seal Project Town wide slurry seal program. Slurry sealed roads to add 15+ years life. 7509 3 NEV 2012 Slurry Seal Project Town wide slurry seal program Slurry sealed roads to add 15+ years life. 7502 4 ALA Bus Procurement Program (2,5) Improve ridership, safety, timely transit service and minimize
maintenance costs. Improved ridership, safety, timely transit service, minimized maintenance cost.
7489 4 BART BART - Warm Springs Extension Project not closed out yet. Project not closed out yet. 7499 4 BATA Oakland Airport Connector (2,4,5) Project not closed out yet. Project not closed out yet. 7693 4 CC 2013 Street Improvement Program Extend useful life of roadway infrastructure by 15+yrs, improve safety, Extended useful life of infrastructure and improve safety. Used
rubberized asphalt seal. Extend life 15+yrs. 4 CC SR 4 East Somersville - 160 segment 3
(2,4) Project not closed out yet. Project not closed out yet.
4 CC SR 4- East Widening segment 3B Project not closed out yet. Project not closed out yet. 4 CC SR 4 East Somersville - 160 segment 2
(1,2) Project not closed out yet. Project not closed out yet.
7530 4 MAR Sonoma-Marin Area Rail Tansit (4,5) Project not closed out yet. Project not closed out yet. 7698 4 SF Doyle Drive Replacement Project Project not closed out yet. Project not closed out yet. 7491 4 SM Purchase Buses for Paratran Expect ridership to increase by 3% Actually ridership decreased by .9% due to economy. 7492 4 SM Replacement Mini Vans Procurement of new vans will help ensure that ADA paratransit service
is reliable. Procurement of minivans helped ensure that paratransit services are reliable.

California Department of Transportation FY 2017-18 3rd Quarter Report
Proposition 1B State-Local Partnership Program Page 16 of 34
Benefits of Completed Formula Projects
SL
PP
PR
OJE
CT
DIS
TR
ICT
CO
UN
TY
PROJECT PROJECT BENEFIT on PPR PROJECT BENEFIT on FDR
7493 4 SM Bus Washer Replacing bus washer for clean, attractive vehicles to encourage transit ridership.
Replacement bus washer provides clean attractive vehicles that encourage transit ridership. Reduced cost of repairs of old equip.
7514 4 SM Positive Train Control (4,5) Project not closed out yet. Project not closed out yet. 7637 4 SM Road Rehab - Var Loc Improve 12,500’ at various locations in the City. Extend pavement life by
15+ years. Rehabbed 12,500’ of roadway. Installed ADA ramps, replaced curb/gutter, Adjust utility covers to grade, striping. Extended life by 15+ years.
7638 4 SM Street Resurfacing - Var Loc Resurface 8000LF roadway. Raise PCI from 25 to 90. Extend 25 yrs. Resurfaced 8000LF roadway. Raised PCI 7639 4 SM Street Resurfacing - Var Loc AC overlay 3-4 miles of roadway. AC base repair, grinding, utility
adjustment and striping. AC over layed 3-4 miles with AC base repair, grinding, utility adjustment and striping. Extends life 15+ yrs.
7641 4 SM Road Rehab - Var Loc Rehab 2.3 miles roadway. Add 15+ service life. Remove/replace pavement section and subsection. Installed storm system. Replaced curb, gutter sidewalk. Striped adjusted manholes
7642 4 SM Road Rehab - Var Loc Improve 2.92 miles of street at various locations. Raise PCI from 27-70pts. Extend life by 15+ yrs.
Improved 2.92 miles of street at various locations. Raised PCI from 27-70. Extend life of pvmt by 15+yrs.
7643 4 SM Alpine Rd at Hwy 280 Resurf Improve pavement on Alpine Rd at Hwy 280 IC. Extend useful life by 15+ yrs.
Extended useful life of pavement by 15 yrs. 0.2' AC placed on roadway, new striping bike lane treatments, signage & pvmt repairs.
7644 4 SM Hillside Blvd Pavement Rehab Improve Hillside Blvd and extend useful life by 15+ yrs. Save travel time and fuel.
Asphalt pvmt rehab & striping btwn Serramonte Blvd and the southern town limits with City of SF. Extended life 15+ yrs.
7645 4 SM Street Resurfacing - Var Loc Street resurface 6.5 miles of roads in Hillsborough. Expect to increase PCI by 3 pts to 75.
Street resurfacing actually increased PCI level by 4 pts from 72 to 76. Expected to extend the life of streets by 15+ yrs.
7646 4 SM Street Resurfacing - Var Loc Improve 1.7miles of roadway. Extend life by 15+ yrs. Improved 2.2miles of city streets. PCI increased by 1. Extend life by 15+ yrs.
7647 4 SM School Crossing Safety Systems Create safe, navigable Xings on busy streets and school routes for safety and visibility.
Created safe, navigable Xings at busy intersections on school routes with ped use. Increased safety, encourage ped use.
7648 4 SM Bayshore Drive Rehab Rehab 1500 to 3000 feet of roadway. Extend pavement life by 20 yrs. Reduce congestion and pollution.
Improved 2000ft of Principal Arterial rdwy. Extended pavement by 20yrs. Reduced congestion, air and stormwater pollution.
7649 4 SM Sidewalk Improvement - Var Loc Create safe, navigable sidewalks to encourage ped travel including school children.
Provided safe, navigable sidewalks that encourage ped travel including school children. Eliminated over 137 trip hazards.
7651 4 SM Road Rehab - Var Loc Improve congestion and air quality and extend useful life of streets by 15+yrs. Raise PCI from 59 to 62
Repaired failing pavement on several streets. PCI increased from 59 to 67. Extended useful life by 15+yrs.
7654 4 SM Street Resurf - Var Loc Improve PCI and extend useful life by 15+yrs on many roadways. .2' AC placed on roadways, new striping & pvmt repairs. 7655 4 SM Replacement of 1998 Gilllig Buses Project not closed out yet. Project not closed out yet. 7657 4 SM Road Rehab - Var Loc Extend useful life of pavement on selected roadways by 15+ years. Improved the life of pavement and provide smoother, safer and
more durable roads. 7694 4 SM Advanced Comm System Upgrade Project not closed out yet. Project not closed out yet. 7534 4 SCL BART - Vehicle Procurement (4,5) Project not closed out yet. Project not closed out yet.
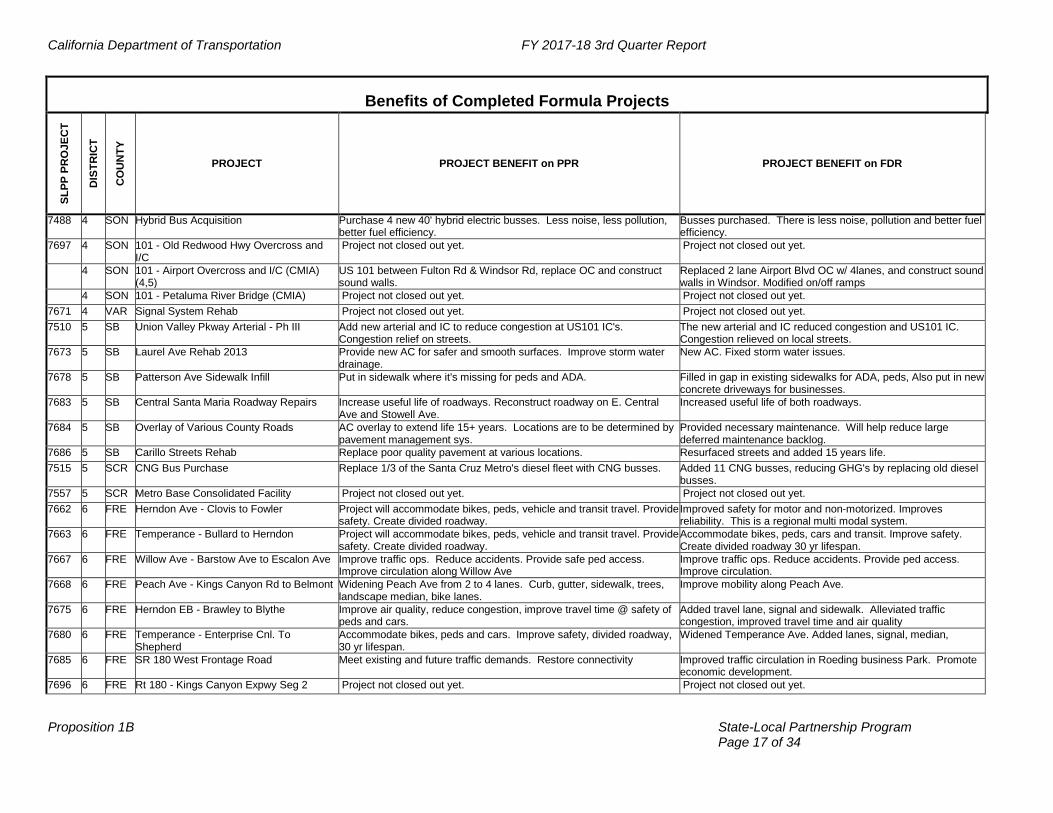
California Department of Transportation FY 2017-18 3rd Quarter Report
Proposition 1B State-Local Partnership Program Page 17 of 34
Benefits of Completed Formula Projects
SL
PP
PR
OJE
CT
DIS
TR
ICT
CO
UN
TY
PROJECT PROJECT BENEFIT on PPR PROJECT BENEFIT on FDR
7488 4 SON Hybrid Bus Acquisition Purchase 4 new 40' hybrid electric busses. Less noise, less pollution, better fuel efficiency.
Busses purchased. There is less noise, pollution and better fuel efficiency.
7697 4 SON 101 - Old Redwood Hwy Overcross and I/C
Project not closed out yet. Project not closed out yet.
4 SON 101 - Airport Overcross and I/C (CMIA) (4,5)
US 101 between Fulton Rd & Windsor Rd, replace OC and construct sound walls.
Replaced 2 lane Airport Blvd OC w/ 4lanes, and construct sound walls in Windsor. Modified on/off ramps
4 SON 101 - Petaluma River Bridge (CMIA) Project not closed out yet. Project not closed out yet. 7671 4 VAR Signal System Rehab Project not closed out yet. Project not closed out yet. 7510 5 SB Union Valley Pkway Arterial - Ph III Add new arterial and IC to reduce congestion at US101 IC's.
Congestion relief on streets. The new arterial and IC reduced congestion and US101 IC. Congestion relieved on local streets.
7673 5 SB Laurel Ave Rehab 2013 Provide new AC for safer and smooth surfaces. Improve storm water drainage.
New AC. Fixed storm water issues.
7678 5 SB Patterson Ave Sidewalk Infill Put in sidewalk where it's missing for peds and ADA. Filled in gap in existing sidewalks for ADA, peds, Also put in new concrete driveways for businesses.
7683 5 SB Central Santa Maria Roadway Repairs Increase useful life of roadways. Reconstruct roadway on E. Central Ave and Stowell Ave.
Increased useful life of both roadways.
7684 5 SB Overlay of Various County Roads AC overlay to extend life 15+ years. Locations are to be determined by pavement management sys.
Provided necessary maintenance. Will help reduce large deferred maintenance backlog.
7686 5 SB Carillo Streets Rehab Replace poor quality pavement at various locations. Resurfaced streets and added 15 years life. 7515 5 SCR CNG Bus Purchase Replace 1/3 of the Santa Cruz Metro's diesel fleet with CNG busses. Added 11 CNG busses, reducing GHG's by replacing old diesel
busses. 7557 5 SCR Metro Base Consolidated Facility Project not closed out yet. Project not closed out yet. 7662 6 FRE Herndon Ave - Clovis to Fowler Project will accommodate bikes, peds, vehicle and transit travel. Provide
safety. Create divided roadway. Improved safety for motor and non-motorized. Improves reliability. This is a regional multi modal system.
7663 6 FRE Temperance - Bullard to Herndon Project will accommodate bikes, peds, vehicle and transit travel. Provide safety. Create divided roadway.
Accommodate bikes, peds, cars and transit. Improve safety. Create divided roadway 30 yr lifespan.
7667 6 FRE Willow Ave - Barstow Ave to Escalon Ave Improve traffic ops. Reduce accidents. Provide safe ped access. Improve circulation along Willow Ave
Improve traffic ops. Reduce accidents. Provide ped access. Improve circulation.
7668 6 FRE Peach Ave - Kings Canyon Rd to Belmont Widening Peach Ave from 2 to 4 lanes. Curb, gutter, sidewalk, trees, landscape median, bike lanes.
Improve mobility along Peach Ave.
7675 6 FRE Herndon EB - Brawley to Blythe Improve air quality, reduce congestion, improve travel time @ safety of peds and cars.
Added travel lane, signal and sidewalk. Alleviated traffic congestion, improved travel time and air quality
7680 6 FRE Temperance - Enterprise Cnl. To Shepherd
Accommodate bikes, peds and cars. Improve safety, divided roadway, 30 yr lifespan.
Widened Temperance Ave. Added lanes, signal, median,
7685 6 FRE SR 180 West Frontage Road Meet existing and future traffic demands. Restore connectivity Improved traffic circulation in Roeding business Park. Promote economic development.
7696 6 FRE Rt 180 - Kings Canyon Expwy Seg 2 Project not closed out yet. Project not closed out yet.

California Department of Transportation FY 2017-18 3rd Quarter Report
Proposition 1B State-Local Partnership Program Page 18 of 34
Benefits of Completed Formula Projects
SL
PP
PR
OJE
CT
DIS
TR
ICT
CO
UN
TY
PROJECT PROJECT BENEFIT on PPR PROJECT BENEFIT on FDR
7485 6 MAD 3R & ADA - D Street and Almond Ave Rehab, resurface and reconstruct arterial and collector streets. Pavement improvements eliminated existing defects and improved the flow of traffic and safety.
7486 6 MAD 3R & ADA - South Gateway Drive Rehab, resurface and reconstruct arterial and collector streets. Pavement improvements eliminated existing defects and improved the flow of traffic and safety.
7541 6 MAD 4th St, Pine to K St Rehab, resurface & Reconstruct city streets and improve drainage. Add 15+years.
Pavement improvements eliminated defects and Improved storm water conveyance. ADA ramps.
7549 6 MAD Avenue 9 Improvements Provide thru lanes for safety for left turns at 2 intersections. Rehabbed roadway between SR41&SR99, safer for public, improved drainage
7613 6 MAD Presidential Street Resurfacing Overlay streets with asphalt. Overlay several residential streets. Smooth surface. Pulverized streets to fix damaged areas.
7406 6 MAD Ave 12 Sidewalk between Rds 36 & 37 Add new 5'sidewalk. Safety and encourage ped traffic. Added sidewalk. Safer for peds. 7442 6 MAD Rehab, Resurface, Reconstruct & ADA Rehab, resurface, reconstruct roadways and install ADA curb returns.
Add 15+ years life. Pavement improvements improved flow of traffic and safety. ADA ramps are safer for peds too.
7444 6 MAD Street 3R and ADA Improvements Various roads, Rehab, resurface, reconstruct roadways and install ADA curb returns. 15+ years added
Pavement improvements improved flow of traffic and safety. ADA ramps are safer for peds too.
7445 6 MAD Road 200 Reconstruction & Widening Reconstruct and widen Rd 200. 40' wide. Completed bridge over Ladd Creek. Part of a multi-phase project.
7429 6 TUL Road 108 Widening Widen Rd 108 from Leland to Caldwell from 2 to 4 lanes. Added new traffic signals at Ave 272 & Ave 264. Increased the efficiency of traffic. Safer. 4 lanes and left turn pockets enhanced traffic on Rd 108
7431 6 TUL Road 80 Widening - Phase 1A 1.75 mile widen from 2 to 4 lanes. Widened less than 2 miles of the 14 mile corridor, including turn pocket and acceleration lane. Reduced accidents.
7511 6 TUL Avenue 416 Widening (Rd 56 to Rd 80) Project not closed out yet. Project not closed out yet. 7449 7 LA I-10 & I-110 Convert to HOT Lanes Reduce congestion, GHG's, emissions and increase travel time savings. Convert HOV to HOT lanes. New toll funds. Increased ridership
on Silver Line. 7484 7 LA I-5 Carmenita Interchange Project not closed out yet. Project not closed out yet. 7494 7 LA CNG Bus Procurement (3,4) Reduce emissions. CNG Busses procured. Improve service quality. Lower average
fleet age. Increase reliability 7495 7 LA Positive Train Control (3,4) Project not closed out yet. Project not closed out yet. 7496 7 LA LA- San Fernando Valley Transit Ext (2,3) Project not closed out yet. Project not closed out yet. 7555 7 LA Transit Bus Acquisition Project not closed out yet. Project not closed out yet. 7664 7 LA Exposition Light Rail Transitt Ph II Project not closed out yet. Project not closed out yet. 7695 7 LA Crenshaw/LAX Transit Corridor Project not closed out yet. Project not closed out yet. 7 LA I-5 N. Carpool Lns SR 118-170 Project not closed out yet. Project not closed out yet. 7 LA I-5 HOV Empire Ave I/C Project not closed out yet. Project not closed out yet. 7544 8 RIV Monroe Street Improvements Eliminate gap closure, congestion, and complete system. Improve
mobility, safer for peds, bikes. Eliminated gap closure, congestion. Completed the system. Improved mobility. Sidewalk, bike lanes, multi use trail

California Department of Transportation FY 2017-18 3rd Quarter Report
Proposition 1B State-Local Partnership Program Page 19 of 34
Benefits of Completed Formula Projects
SL
PP
PR
OJE
CT
DIS
TR
ICT
CO
UN
TY
PROJECT PROJECT BENEFIT on PPR PROJECT BENEFIT on FDR
7545 8 RIV Varner Rd at Jefferson St Improv. Eliminate gap closure, remove congestion, complete system. Increase mobility.
Widened Varner from 2 to 4 lanes, eliminated gap closure, congestion, Improved flow.
7546 8 RIV Foothill Parkway Westerly Extension Project not closed out yet. Project not closed out yet. 7556 8 RIV Highway 111 Improvements Reduce congestion, improve safety. Traffic signal improvements. Bus
turnouts. Reduced congestion. Improved safety. Traffic signal improvements. Bus turnouts.
7636 8 RIV I-15 / Los Alamos Crossing (Comp $ also) Gap closure to existing 4 lane Los Alamos Rd. Relieve bottleneck. Improve circulation. Min vert clearance.
Same as PPR
7640 8 RIV I-10 / Monterey Ave I/C Eliminate congestion on NB Monterey Avenue Congestion has been relieved. Air Quality improved. 7652 8 RIV Fred Waring Drive Provide 3 thru lanes each dir. To reduce future congestion. Raised
median for safety. Drainage. Sound wall Widened Fred Waring Dr to provide 3 lanes each direction. Raised median for safety. Drainage improvements added. Sound wall constructed reducing noise. Traffic signals modified to accommodate new widened roadway. ADA ramps.
7653 8 RIV Rt 91 Corridor Improvement Project not closed out yet. Project not closed out yet. 7656 8 RIV Hwy 111 at Washington St Improve LOS to E or better at peak hour, season. Brought LOS to E or better at peak times. Added left turn lanes,
dedicated right turn lanes. Median mod. Restriping, replaced bus turnout
7538 8 SBD I-15/Ranchero Rd I/C Project not closed out yet. Project not closed out yet. 7658 8 SBD Maple Lane Improvements Minimize hazards and structure damage with reduced flooding. Improved condition of roadway and improved drainage and
erosion. 7659 8 SBD National Park Dr. Improvements Construct curb/gutter for drainage improvement. Sidewalk/bike path
connecting trails. Pavement Rehab Construct curbs/gutter for drainage improvement. Sidewalks bike path provide access to visitor center. Pavement rehab.
7660 8 SBD Rt 62 Imp. Apache Trail to Palm Ave Increase ped safety, reduce vehicle conflicts, upgrade non-standard ADA.
Provided geometric traffic control and infrastructure improvements for increased circulation and safety for car, bike and ped.
7661 8 SBD Rt 62 Imp. La Honda Wy to Dumosa Ave Increase ped safety, reduce vehicle conflicts, upgrade non-standard ADA.
Provided geometric traffic control and infrastructure improvements for increased circulation and safety for car, bike and ped.
7666 8 SBD Village "L" St Impr - Various Loc Reconstruct Pine Knot & Village Drive. Improve safety for cars & peds. Improve drainage. Improve safety.
Resurface streets, improve ADA access, replace curb, gutter, sidewalk. New drainage.
7681 8 SBD San Bernardino Downtown Rail Ext Project not closed out yet. Project not closed out yet. 7682 8 SBD Yucca Loma Bridge and Yates Rd
Improvements New corridor, interchange. Relieve congestion A segment in a larger project that hasn't opened yet. Expects to
open summer 2017 7688 8 SBD Milliken Grade Sep Project not closed out yet. Project not closed out yet. 7691 8 SBD Vineyard Ave Grade Sep Project not closed out yet. Project not closed out yet. 7448 10 SJ Lower Sacramento Rd Grade Sep Eliminate 1,650 mins/day vehicle delay. Reduce emissions by 2,500
kg/yr. Potential alignment for HSR. Improve safety Promote safety by providing safe access for all modes. Eliminate 1,650 mins /day vehicle delay. Reduce emissions by 2,500 kg/yr
7533 10 SJ I-5 French Camp Road I/C Improve traffic on I5 w/ aux lanes between French Camp & Downing Ave. Improve goods movement. Provide freight rte.
Improved traffic at French Camp I-5. Aux lanes between French Camp and Sperry Rd. Added alt route for freight mvmt.

California Department of Transportation FY 2017-18 3rd Quarter Report
Proposition 1B State-Local Partnership Program Page 20 of 34
Benefits of Completed Formula Projects
SL
PP
PR
OJE
CT
DIS
TR
ICT
CO
UN
TY
PROJECT PROJECT BENEFIT on PPR PROJECT BENEFIT on FDR
10 SJ Rt 99 - South Stockton 6-Lane Project not closed out yet. Project not closed out yet. 7550 11 IMP Eastern Ave Rehab Resurface 1.2 mi. Create safer surface for ped, bike & car traffic.
Increase safety, Reduce street noise. Reduce dust. Resurfaced 1.5 mi. Created safer surface for ped, bike & car traffic. Increased safety. Reduce street noise.
7551 11 IMP Grape Ave Improvements Reduce hazards. Add Cl1 bike lane, Benefit school children with safety. Reduce hazards to car and ped. Added new Cl1 bike lane. Safety for school children. Smoother driving surface.
7552 11 IMP Lake Ave Improvements Increase safety and improve aesthetics. Extend life by 15+ years. Replaced deteriorated AC, Improved storm water conveyance, established ADA curb returns.
7553 11 IMP FY 2013 Streets Rehab Supports SCAG regional Transportation Plan. Maximize mobility for all people and goods. Remove potholes, cracks.
Maximizes mobility for all people and goods in region by removing potholes. Ensures safety and reliability. Bikes/peds.
7554 11 IMP 6th St and G St Improvements Bring traffic back to 6th & G Sts by removing potholes. Maximize mobility and accessibility for all people and goods. Safety
Maximize mobility and accessibility for all people and goods. Remove potholes & cracks. Level road surface, add curb/ gutter
7560 11 IMP Willoughby Road Provide safety benefits, ease of travel, reduce vehicle wear, Removed potholes and cracks.
Repaired potholes, cracks. Created smoother driving surface. Improved safety and reliability. 15+ yrs life.
7561 11 IMP Dogwood Road Will resurface .5mile Dogwood Rd. Provide safety, ease of travel, reduce vehicle wear.
Resurfaced .5miles Dogwood Rd. Removed potholes, cracks. Created smoother driving surface. Safety. Ease of travel.
7562 11 IMP Downtown Repaving Resurface 3,800 ft of local roads. Pavement rehab. Provided safety. 7563 11 IMP 5th Street Repaving Rehab. Increase safety. Solve drainage issues. Increase air quality. Pavement rehab. Provided safety. 7564 11 IMP South N Street Reconstruction Reconstruct South N St. Improved larger area than PPR. Was 1,120.68' improved.
Actual 2,225' improved. 7497 11 SD Blue Line Light Rail Vehicles Replace existing Light Rail vehicles to increase passenger capacity by
6%, reduce maintenance, reduce ADA boarding time. Increased efficiency along blue, orange and green lines with new low floor LRT vehicles. Easier for ADA
7513 11 SD Blue Line Crossovers and Signals Increased capacity. Improved performance, Can single track or reverse. Improved flexibility.
Same as PPR. Increased system capacity, improved on time performance, ability to single track, Improved flexibility
7531 11 SD Blue Line Station Rehab Project not closed out yet. Project not closed out yet. 7559 11 SD Blue Line Traction and Power Substations Project not closed out yet. Project not closed out yet. 7699 11 SD I-5 Genessee Project not closed out yet. Project not closed out yet. 11 SD I-805 HOV Managed Lanes - North Project not closed out yet. Project not closed out yet. 7408 12 ORA Imperial Hwy and Assoc. Rd Smart St. Improve traffic congestion by maintaining LOS D or better. Improve
traffic flow onto NB SR 57. Maintain LOS D or better. Improved traffic flow. Same as PPR.
7503 12 ORA Oso Parkway Widening Add capacity relieve congestion. LOS from E to C . V/C ratio of 0.748. Widened Oso Pkwy from 6 lanes to 8 lanes over .4mile. Added capacity, relieved congestion, LOS increase to C
7504 12 ORA Cow Camp Rd Add capacity and relieve traffic congestion. LOS to improve from F to A VC ratio to improve from 1 to .71
Once the segment 2 project is complete the LOS will improve from F to A and VC ratio will improve from 1 to .71
7505 12 ORA Brookhurst St Widening Add capacity and relieve traffic congestion. LOS to improve from D to B VC ratio to improve from .80 to .64
LOS improved to A. VC ratio improved to .52
7506 12 ORA Bristol St Widening Add capacity and improve LOS from E to B. VC ratio to improve from .93 to .62
LOS improved to B. VC ratio improved to .69
7507 12 ORA Harbor Blvd & Adams Ave LOS to improve from E to B. VC ratio to improve from .96 to .67 LOS improved to B. VC ratio improved to .67

California Department of Transportation FY 2017-18 3rd Quarter Report
Proposition 1B State-Local Partnership Program Page 21 of 34
Benefits of Completed Formula Projects
SL
PP
PR
OJE
CT
DIS
TR
ICT
CO
UN
TY
PROJECT PROJECT BENEFIT on PPR PROJECT BENEFIT on FDR
7535 12 ORA Tustin Ranch Road Extension (4,5) Improve livability and economic competitiveness. Improve congestion on parallel routes. Decrease travel time.
Constructed new roadway to close gap. Included bike /ped facilities. Improved livability & economic competitiveness
7542 12 ORA Laguna Niguel/Mission Viejo Metrolink Add 176 pkg spaces to Laguna/Nigel Metrolink pkg lot. Added 176 pkg spaces. 7543 12 ORA La Pata Avenue Project not closed out yet. Project not closed out yet. 7565 12 ORA Aliso Creek Rehab Maintain roadway at high level of service - increase useful life 15+ years Same as PPR 7566 12 ORA Residential Rehab Maximize mobility, ensure travel safety and maximize the productivity of
our transportation system. Maximize mobility, ensure travel safety and maximize the productivity of our transportation system.
7567 12 ORA Redhill Avenue Rehab Eliminate blight and provide a safe and smooth commute. Extend its lifecycle.
Resurface the roadway for system preservation including: striping, loop detector replacement and traffic control.
7568 12 ORA Cerritos Avenue Widening Project not closed out yet. Project not closed out yet. 7569 12 ORA Valley View Ave Overlay Eliminated the existing pavement distress and provided a new road
surface. Eliminated the existing pavement distress and provided a new road surface.
7570 12 ORA Lambert Rd Ph 2 Rehab Extend the useful service life of the existing roadway segment. Extend the useful service life of the existing roadway segment. 7571 12 ORA Local Road Rehab Prolong the service life of the road, add structural capacity to the
roadway, and improve the smoothness of the ride. Prolong the service life of the road, add structural capacity to the roadway, and improve the smoothness of the ride.
7572 12 ORA Berkeley Avenue Reconstruction Extend the useful life of the pavement. Extend the useful life of the pavement. 7573 12 ORA Magnolia Avenue Reconstruction Provide adequate pavement strength and a more uniform surface for
vehicular traffic. Extend the useful life of the pavement.
7574 12 ORA Goldenwest St & Garfield Ave Rehab Provide smoother ride-ability and extend the life of the streets. Provide smoother ride-ability and extend the life of the streets. 7575 12 ORA Brookhurst Street Improvement Smoother driving surface, reduce smog and extend the useful life of the
pavement. The improvements provide a better ride quality and service life for Brookhurst Street and provide ADA compliant pathways for pedestrians.
7576 12 ORA La Palma Ave Rehab - Valley View/ WCL Extend the pavement life by a minimum of 15 years. Extend the pavement life by a minimum of 15 years. 7577 12 ORA La Paz Road Rehab Extend the life of roadway. Ensure traffic safety and reliability. Extend the life of roadway. Ensure traffic safety and reliability. 7578 12 ORA Lake Forest Dr / Rockfield Bl Resurface Extend the useful life of these highly travelled arterial roads. 2” rubberized asphalt overlay, new sidewalks, curbs & gutters 7580 12 ORA Anaheim Blvd Improvements Extend the useful life of the pavement, maximize mobility and
accessibility and productivity of transportation system. New street surface and increasing the pavement life of the roadway.
7581 12 ORA Orange Avenue Improvements Extend the useful life of the pavement, maximize mobility and accessibility and productivity of transportation system.
New street surface and increasing the pavement life of the roadway.
7582 12 ORA Sunkist St Improvements Extend the useful life of the pavement, maximize mobility and accessibility and productivity of transportation system.
New street surface and increasing the pavement life of the roadway.
7583 12 ORA Knott Avenue Improvements Extend the useful life of the pavement, maximize mobility and accessibility and productivity of transportation system.
New street surface and increasing the pavement life of the roadway.
7584 12 ORA Tustin Avenue / Riverdale Ave Improvement
Extend the useful life of the pavement, maximize mobility and accessibility and productivity of transportation system.
New street surface and increasing the pavement life of the roadway.
7585 12 ORA Broadway Improvements Extend the useful life of the pavement, maximize mobility and accessibility and productivity of transportation system.
New street surface and increasing the pavement life of the roadway.

California Department of Transportation FY 2017-18 3rd Quarter Report
Proposition 1B State-Local Partnership Program Page 22 of 34
Benefits of Completed Formula Projects
SL
PP
PR
OJE
CT
DIS
TR
ICT
CO
UN
TY
PROJECT PROJECT BENEFIT on PPR PROJECT BENEFIT on FDR
7586 12 ORA Irivne Blvd & McFadden Ave Rehab Extend the useful life of the roadway, reduce future maintenance needs and costs, and upgrade curb ramps to current federal ADA requirements.
Extend the useful life of the roadway, reduce future maintenance needs and costs, and upgrade curb ramps to current federal ADA requirements.
7587 12 ORA Newport Ave Bike Trail Reconstruct Extend the useful life of the facility, reduce future maintenance needs and costs, and provide an aesthetic benefit.
Extend the useful life of the facility, reduce future maintenance needs and costs, and provide an aesthetic benefit.
7588 12 ORA Enderle Center / Vandenburg Ln Intersection
Provide greater safety for motorists, pedestrians and reducing collisions as well as aesthetic benefits.
Provide greater safety for motorists, pedestrians and reducing collisions as well as aesthetic benefits.
7589 12 ORA Brookhurst Street Improvement Improved driving and drainage conditions; enhance traffic safety. Improved driving and drainage conditions; enhance traffic safety.
7590 12 ORA Citywide Street Rehab Rehabilitate various roads within the City of Stanton to increase the useful life of these roads.
Rehabilitate roadways to prolong the lifespan of these roadways.
7591 12 ORA Jamboree Rd Rehab Rehabilitation of Jamboree to prevent the street from deteriorating further. Will extend useful life of pavement.
Rehabilitation of Jamboree to prevent the street from deteriorating further. Will extend useful life of pavement.
7592 12 ORA Local Street Rehab Rehab has extended the life of the streets pavement and helped eliminate total roadway reconstruction. Bringing to current ADA compliance.
Rehab has extended the life of the streets pavement and helped eliminate total roadway reconstruction. Bringing to current ADA compliance.
7593 12 ORA Balboa Blvd / Channel Rd Enhance safety and extend pavement life by at least 15 years. Enhance safety and extend pavement life by at least 15 years. 7594 12 ORA Street Rehab Pavement rehab. Improve drainage. Increase life by at least 15 years. Removed and repaved surface of various streets with
rubberized asphalt. Extend life by at least 15 years. Curb ramps installed to meet ADA requirements.
7595 12 ORA Yorba Linda Blvd Rehab Increase of overall mobility and accessibility for motorists and provided a smooth driving surface.
Increase of overall mobility and accessibility for motorists and provided a smooth driving surface.
7596 12 ORA Arterial and Local Street Rehab Resurfacing project is a longer lasting road and cost efficiency. Provide a longer lasting roadway surface to roads in significant need before any further delays increased the cost.
7597 12 ORA Jeronimo Road Resurfacing Restore the roadway surface improving drivability of the roadway preventing deterioration.
Replace deficient asphalt, curb, gutter, sidewalk, and curb ramps and to resurface Jeronimo Road to extend useful life.
7598 12 ORA El Toro Road / Ridge Route Drive Rehab Roadway maintenance to current standards. Extended the roadways useful life term. 7599 12 ORA Rose Drive / Yorba Linda Blvd Increase current and future traffic flows. Increase access. Reduce traffic congestion, air quality, maximize mobility and
accessibility. 7600 12 ORA Valencia Avenue Rehab Restore road surface in support of current and future traffic. Improve air quality, maximizes mobility and accessibility. 7601 12 ORA Broadway & McFadden Rehab Extend the useful life of the pavement by at least 15 years. Will prevent further deterioration of the street and will save the
city money in the long run. 7602 12 ORA Camino De Los Mares Rehab Rehabilitate a 4 lane Secondary Arterial Hwy, extend useful life of the
roadway. Ensure the travel safety and reliability; preserve and ensure sustainable regional transportation system by extending useful life.
7603 12 ORA Idaho Street Rehab Repair and restore existing infrastructure and extend useful life. Replace failed curb and gutter areas, reconstructed failed pavement, and extend useful life.
7604 12 ORA Campus Drive Rehab Increase travel comfort and reduce wear and tear; extend useful life. Extended useful life, rehabilitated and restored pavement structural stability.

California Department of Transportation FY 2017-18 3rd Quarter Report
Proposition 1B State-Local Partnership Program Page 23 of 34
Benefits of Completed Formula Projects
SL
PP
PR
OJE
CT
DIS
TR
ICT
CO
UN
TY
PROJECT PROJECT BENEFIT on PPR PROJECT BENEFIT on FDR
7605 12 ORA Jamboree Road Rehab Extend useful life of the roadway, increase travel comfort and reduce normal vehicle wear and tear.
Rehabilitate the pavement and restore structural stability and extend useful life of the roadway.
7606 12 ORA Santa Margarita Parkway Rehab Extend useful life of the pavement. Pavement preservation, improved ride quality, and aesthetics. 7607 12 ORA Residential Rd Rehab Extend useful life of the pavement. Pavement preservation, improved ride quality, and aesthetics. 7608 12 ORA Moulton Pkwy Smart Street, Seg. 3 Project not closed out yet. Project not closed out yet. 7609 12 ORA Skyline Drive Reconstruction Provide a new, more durable pavement and upgrade the existing curb
access ramps to ADA compliant ramps. Provide a new structural section of pavement to repair and extend pavement life.
7610 12 ORA Dale Street Reconstruction Provide a new, more durable pavement and upgrade the existing curb access ramps to ADA compliant ramps.
Provide a new, more durable pavement and upgrade the existing curb access ramps to ADA compliant ramps.
7611 12 ORA Trolley Bus Acquisition Transit vehicle purchase. Purchase of 3 trolleys. 7616 12 ORA El Toro Road Reconstruction Increase mobility and accessibility for motorists and increase pedestrian
safety and mobility. Upgrade of several access ramps throughout the project and surrounding areas to meet ADA standards.
7617 12 ORA Business Area Street Improvement Maximize mobility and accessibility and ensure travel safety and reliability, ensure sustainable transportation system.
Maximize mobility and accessibility and ensure travel safety and reliability, ensure sustainable transportation system.
7618 12 ORA La Palma Ave Rehab - Beach Blvd/ECL Extend useful service life of existing roadway segment, improve reliability and enhance safety.
Pavement reconstruction, wheelchair ramps reconstructed to comply with ADA requirements.
7650 12 ORA La Colina Drive Pavement Rehab Provide new structural section to extend pavement life. Improve serviceability.
Provide new structural section to extend pavement life. Improve serviceability.
7700 12 ORA I-5 HOV Pac. Coast Hwy - San Juan Clark Rd
Project not closed out yet. Project not closed out yet.
7701 12 ORA SR 91 Aux Lane, Tustin Ave-SR55 I/C Project not closed out yet. Project not closed out yet.

California Department of Transportation FY 2017-18 3rd Quarter Report
Proposition 1B State-Local Partnership Program Page 24 of 34
SLPP Closeout Corrective Actions – Formula Projects
Project 4: Sonoma Marin Area Rail Transit Agency did not report status update for the quarter ending March 31, 2018. Project 18: Downtown Passenger Rail Agency did not report status update for the quarter ending March 31, 2018.
SLPP Corrective Actions – Formula Projects There are no SLPP Formula project Corrective Actions this quarter.
SLPP Updates – Formula Projects Project 6: Positive Train Control Agency previously reported 100% complete with construction, project has been changed to 47% complete with construction to reflect the entire project progress. Project 10: Avenue 416 Widening Agency previously reported 100% complete with construction, project has been changed to 95% complete with construction with an estimated completion date of May 2018.

California Department of Transportation FY 2017-18 3rd Quarter Report
Proposition 1B State-Local Partnership Program Page 25 of 34
Competitive Projects - Status and Detail: Scope Budget and Schedule
PR
OJE
CT
NU
MB
ER
DIS
TR
ICT
CO
UN
TY
/ A
gen
cy
AGENCY
PR
OJE
CT
ID
PROJECT NAME/ (SLPP cycle)
TO
TA
L P
RO
JEC
T
CO
ST
X
$1,
000
TO
TA
L C
ON
ST
C
OS
T
X $
1,00
0
TO
TA
L S
LP
P
FU
ND
S
X $
1,00
0
AP
PR
OV
ED
B
EG
IN C
ON
ST
/ A
WA
RD
DA
TE
DA
TE
OF
A
LL
OC
AT
ION
CO
NS
TR
UC
TIO
N
% C
OM
PL
ET
E
DA
TE
C
ON
ST
RU
CT
ION
C
OM
PL
ET
ED
CO
NS
TR
UC
TIO
N
AW
AR
DE
D
AL
LO
CA
TE
D B
UT
N
OT
AW
AR
DE
D
S
CO
PE
BU
DG
ET
SC
HE
DU
LE
186 3 ED El Dorado Cnty 7526 Silva Valley Parkway / US 50 IC (4) $52,323 $38,200 $1,000 9/2013 1/2013 75% X
187 3 SAC Sac RT 7674 Cosumnes River College Transit Station (5) $89,822 $89,822 $1,000 7/2013 5/2013 100% 3/2017 X
188 8 RIV City of Moreno Valley 7518 SR 60 / Nason St OC (4) $17,130 $15,030 $1,000 9/2012 5/2012 100% 8/2017 X
189 8 SBD City of Fontana 7471 I-15 / Duncan Canyon IC (3,4) $31,752 $24,414 $1,972 10/2012 6/2012 6/2012 100% 6/2017 X
190 8 SBD City of Rancho Cucamonga 7635 I-15 Baseline Rd Interchange
Improvements (5) $50,883 $37,983 $1,000 4/2014 6/2013 99% X
Totals $242M $205.5M $5.9M
Project is on time, on budget, or within scope. Schedule, scope and/or budget is unavailable, or needs further action. See Corrective Actions. Project Closeout is delayed by 12 months or longer.

California Department of Transportation FY 2017-18 3rd Quarter Report
Proposition 1B State-Local Partnership Program Page 26 of 34
Competitive Projects - FINAL DELIVERY REPORT IS PAST DUE
PR
OJE
CT
NU
MB
ER
DIS
TR
ICT
CO
UN
TY
/ A
gen
cy
AGENCY
PR
OJE
CT
ID
PROJECT NAME/ (SLPP cycle)
TO
TA
L P
RO
JEC
T
CO
ST
X
$1,
000
TO
TA
L C
ON
ST
C
OS
T
X $
1,00
0
TO
TA
L S
LP
P
FU
ND
S
X $
1,00
0
AP
PR
OV
ED
B
EG
IN C
ON
ST
/ A
WA
RD
DA
TE
DA
TE
OF
A
LL
OC
AT
ION
CO
NS
TR
UC
TIO
N
% C
OM
PL
ET
E
DA
TE
C
ON
ST
RU
CT
ION
C
OM
PL
ET
ED
CO
NS
TR
UC
TIO
N
AW
AR
DE
D
AL
LO
CA
TE
D B
UT
N
OT
AW
AR
DE
D
S
CO
PE
BU
DG
ET
SC
HE
DU
LE
191 3 ED El Dorado Cnty 7527 Pleasant Valley Rd/ Patterson Dr. (4) $4,107 $2,442 $600 10/2013 6/2013 100% 4/2015 X
192 4 CC Contra Costa Transportation Authority
7524 I-680 Auxiliary Lane Project (4) $33,170 $25,140 $1,000 12/2012 8/2012 100% 12/2014 X
193 8 SBD City of Highland 7520 SR 210 / Greenspot Rd (4,5) $9,047 $8,399 $1,886 12/2012 6/2012 3/2013 6/2013
100%
10/2016
X
194 8 SBD City of Highland 7632 Greenspot Rd Bridge at Santa Ana River (5) $13,534 $13,534 $1,000 11/2013 5/2013 100% 4/2016 X 195 8 SBD City of Highland 7631 5th Street Corridor Improvements (5) $3,795 $3,795 $1,000 11/2013 6/2013 100% 1/2017 X 196 8 SBD City of Highland 7690 Baseline Greenspot Traffic Safety (5) $974 $974 $393 11/2013 6/2013 100% 10/2015 X
Totals $65.6M $54.3M $5.9M
Project is on time, on budget, or within scope. Schedule, scope and/or budget is unavailable, or needs further action. See Corrective Actions. Project Closeout is delayed by 12 months or longer.

California Department of Transportation FY 2017-18 3rd Quarter Report
Proposition 1B State-Local Partnership Program Page 27 of 34
Competitive Projects - Completed
PR
OJE
CT
NU
MB
ER
DIS
TR
ICT
CO
UN
TY
/ A
GE
NC
Y
AGENCY PROJECT NAME/
(SLPP Cycle)
AP
PR
OV
ED
TO
TA
L
PR
OJE
CT
CO
ST
X
$1,
000
AC
TU
AL
TO
TA
L
PR
OJE
CT
CO
ST
X
$1,
000
AP
PR
OV
ED
TO
TA
L
CO
NS
T C
OS
T
X $
1,00
0
AC
TU
AL
TO
TA
L
CO
NS
T C
OS
T
X $
1,00
0
AP
PR
OV
ED
SL
PP
F
UN
DS
X
$1,
000
AC
TU
AL
SL
PP
F
UN
DS
X
$1,
000
DE
-AL
LO
CA
TE
D
SL
PP
SA
VIN
GS
X
$1,
000
NO
N
DE
-AL
LO
CA
TE
D
SL
PP
SA
VIN
GS
X
$1,0
00
A
LL
OC
AT
ION
D
AT
E
AC
TU
AL
CO
NS
T
ST
AR
T D
AT
E
AC
TU
AL
CO
NS
T
EN
D D
AT
E
197 3 SAC City of Elk Grove Franklin / Elk Grove (1) 7397 $4,015 $3,103.4 $1,976 $1,064.4 $988 $533 $455 1/2010 4/01/10 12/08/10
198 3 SAC City of Elk Grove Waterman / Grant Line Lane (1) 7398 $4,294 $3,841.7 $3,703 $3,250.9 $1,000 $1,000 1/2010 7/14/10 1/13/12
2199 3 ED El Dorado County Silva Valley Parkway Widening (2) 7414 $2,735 $1,164 $1,985 $730.7 $993 $365 $628 4/2010 10/29/10 4/13/12
200 3 ED El Dorado County
Durock Rd / Business Dr. Intersection (2) 7413 $1,740 $2,046.9 $1,440 $1,294.8 $710 $648 $62 4/2010 8/24/10 9/13/11
201 3 ED El Dorado County
White Rock Road Widening & Signal (2) 7415 $1,132 $1,322.1 $1,000 $995.1 $500 $498 $2 4/2010 10/29/10 4/13/12
202 3 ED City of Placerville Point View Drive (1) 7402 $3,160 $2,399.5 $2,455 $1,674.5 $750 $750 1/2010 6/01/11 1/10/12
203 3 PLA Placer County Tahoe City Transit (1) 7487 $7,342 $7,342 $5,808 $5,808 $226 $226 1/2010 6/29/10 10/29/12 204 3 PLA Placer County Auburn Folsom Rd Widening (5) 7619 $7,720 $9,249 $6,670 $7,946.7 $1,000 $1,000 6/2013 9/10/13 1/24/17 205 3 PLA Placer County Kings Beach Commercial Imp (5) 7621 $45,875 $29,406 $33,025 $22,325 $1,000 $1,000 6/2013 12/31/13 11/22/16 206 3 PLA City of Lincoln Nicolaus Road Widening (4) 7525 $1,578 $1,648 $1,516 $1,450 $758 $725 $33 6/2012 8/01/12 4/30/13 207 3 PLA City of Lincoln Nelson Lane Improvements (5) 7620 $1,400 $7,037.6 $1,200 $6,582.7 $600 $600 6/2013 4/10/14 3/10/15
208 3 PLA City of Roseville Blue Oaks Blvd Widening (5) 7622 $3,950 $3,741.9 $3,800 $3,366.3 $1,000 $1,000 6/2013 10/16/13 2/04/15
209 3 PLA City of Roseville Fiddyment Road Widening (4) 7529 $3,660 $2,877 $3,100 $2,616.6 $1,000 $1,000 1/2012 5/31/12 4/17/13
210 3 SAC City of Elk Grove
Elk Grove-Florin Rd/ E Stockton Blvd (5) 7689 $1,108 $1,227.9 $838 $938.2 $419 $419 6/2013 10/28/13 3/11/15
211 3 YOL City of West Sacramento
Tower Bridge Gateway - East Phase (2) 7425 $6,488 $6,345.2 $6,488 $6,345.2 $1,000 $1,000 1/2011 9/30/10 1/27/12
212 5 SLO San Luis Obispo County Willow Road Extension (1) 7409 $6,500 $4,866.8 $6,500 $4,866.8 $1,000 $1,000 1/2010 6/14/10 8/09/11
213 5 SLO San Luis Obispo County
Willow Road Extension Phase II (2) 7423 $27,821 $16,878.8 $27,821 $16,878.8 $1,000 $1,000 1/2011 3/21/11 9/22/15
214 5 SLO San Luis Obispo County
Willow Road Extension Mitigation (5) 7623 $750 $1,029.7 $750 $1,029.7 $375 $375 3/2013 3/19/13 4/7/17
215 5 SLO San Luis Obispo County Los Osos Valley Road (4) 7523 $600 $232.9 $600 $232.9 $174 $117 $57 5/2013 9/24/13 2/04/14

California Department of Transportation FY 2017-18 3rd Quarter Report
Proposition 1B State-Local Partnership Program Page 28 of 34
Competitive Projects - Completed
PR
OJE
CT
NU
MB
ER
DIS
TR
ICT
CO
UN
TY
/ A
GE
NC
Y
AGENCY PROJECT NAME/
(SLPP Cycle)
AP
PR
OV
ED
TO
TA
L
PR
OJE
CT
CO
ST
X
$1,
000
AC
TU
AL
TO
TA
L
PR
OJE
CT
CO
ST
X
$1,
000
AP
PR
OV
ED
TO
TA
L
CO
NS
T C
OS
T
X $
1,00
0
AC
TU
AL
TO
TA
L
CO
NS
T C
OS
T
X $
1,00
0
AP
PR
OV
ED
SL
PP
F
UN
DS
X
$1,
000
AC
TU
AL
SL
PP
F
UN
DS
X
$1,
000
DE
-AL
LO
CA
TE
D
SL
PP
SA
VIN
GS
X
$1,
000
NO
N
DE
-AL
LO
CA
TE
D
SL
PP
SA
VIN
GS
X
$1,0
00
A
LL
OC
AT
ION
D
AT
E
AC
TU
AL
CO
NS
T
ST
AR
T D
AT
E
AC
TU
AL
CO
NS
T
EN
D D
AT
E
216 5 SB City of Goleta Fairview/Berkeley Traffic Signal (2) 7417 $315 $223.1 $300 $203.3 $150 $102 $48 4/2010 2/07/11 4/14/11
217 5 SB City of Goleta Los Carneros/Calle Roundabout (3) 7478 $2,218 $1,631.6 $1,285 $1,319.4 $335 $335 10/2011 3/01/12 11/15/13
218 5 SB County of Santa Barbara
Union Valley Parkway / Bradley Road Intersection (2) 7412 $1,278 $572.76 $1,100 $530.69 $550 $266 $284 4/2010 6/28/10 11/01/10
219 6 FRE City of Clovis Shaw Avenue Improvement (3) 7468 $569 $493.7 $485 $410 $243 $205 $38 10/2011 04/09/12 8/07/12
220 6 FRE City of Clovis DeWolf / Nees Street Improvement (3) 7469 $1,374 $1,490.6 $759 $575.4 $379 $282 $97 10/2011 4/09/12 10/08/12
221 6 FRE City of Clovis Bullard/ Locan (3) 7466 $860 $781.7 $730 $651.2 $315 $315 10/2011 8/01/12 1/22/13 222 6 FRE City of Fresno Traffic Sig Shields/Temperance(5) 7670 $445 $339.9 $430 $325.4 $215 $159 $56 6/2013 6/05/14 3/17/15 223 6 FRE City of Fresno Traffic Sig Audubon/Cole (5) 7672 $377 $327.3 $362 $318.6 $181 $151 $30 6/2013 4/03/14 7/08/15
224 6 KER City of Bakersfield Mohawk Street Extension (5) 7626 $2,393 $3,416.8 $2,028 $3,051.7 $1,000 $1,000 3/2013 9/11/13 6/6/14
225 6 KER City of Bakersfield
Hageman Road – Install and Sync Signals (5) 7676 $450 $553.5 $450 $553.5 $225 $225 6/2013 11/20/13 7/24/14
226 6 KER City of Bakersfield Hosking Ave Widening (5) 7677 $872 $815.2 $872 $815.2 $436 $408 $28 6/2013 11/20/13 5/23/14
227 6 KIN City of Hanford Greenfield Avenue Extension (1) 7399 $895 $639.9 $825 $608.9 $250 $185 $65 1/2010 8/1/10 6/07/11 228 6 KIN City of Hanford 12th Ave Widening (1) 7400 $2,370 $2,476.1 $2,150 $2,182.5 $600 $487 $113 1/2010 8/1/10 6/07/11 229 6 KIN City of Hanford 11th Ave Widening (2) 7411 $1,448 $1,153.6 $1,320 $1,045.4 $500 $396 $104 4/2010 6/28/10 4/05/11 230 6 KIN City of Hanford 12th Ave Widening/Reconstruct (3) 7470 $3,140 $3,310.5 $2,795 $2,678.9 $750 $750 12/2011 7/30/12 2/08/13 231 6 KIN City of Hanford 10th Ave Widening (4) 7522 $1,930 $2,225.9 $1,650 $1,988.9 $750 $750 6/2012 2/04/14 9/24/14 232 6 KIN City of Hanford Campus Dr / UPRR Crossing (5) 7627 $740 $827.5 $640 $751 $320 $320 6/2013 12/3/13 9/3/14
233 7 LA City of Lancaster 25th Street East Alignment (5) 7665 $722 $489.9 $722 $489.9 $361 $244 $117 6/2013 12/10/13 1/12/16
234 8 RIV City of Indio Golf Center Parkway Rehab (2) 7418 $3,400 $2,426 $3,000 $2,026 $433 $433 4/2010 2/22/10 7/12/10
235 8 RIV City of Moreno Valley Cactus Ave Improvements (2) 7439 $6,350 $4,926 $5,500 $4,076 $1,000 $1,000 1/2011 3/13/12 5/27/13
236 8 RIV City of Moreno Valley
Cactus Ave Widening EB 3rd Lane (5) 7628 $1,515 $1,558.8 $1,120 $1,193.8 $560 $549 $11 5/2013 10/08/13 8/17/14
237 8 RIV City of Moreno Valley Perris Blvd Improvements (5) 7679 $6,000 $5,730.4 $6,000 $5,730.4 $1,000 $955 $45 6/2013 5/13/14 12/21/15
238 8 RIV City of Murrieta I-15 Los Alamos Rd OC (5) 7636 (Project has Formula Funds also, project totals are shown in Formula Chart)
$1,000 $1,000 10/2015 4/1/13 8/18/15

California Department of Transportation FY 2017-18 3rd Quarter Report
Proposition 1B State-Local Partnership Program Page 29 of 34
Competitive Projects - Completed
PR
OJE
CT
NU
MB
ER
DIS
TR
ICT
CO
UN
TY
/ A
GE
NC
Y
AGENCY PROJECT NAME/
(SLPP Cycle)
AP
PR
OV
ED
TO
TA
L
PR
OJE
CT
CO
ST
X
$1,
000
AC
TU
AL
TO
TA
L
PR
OJE
CT
CO
ST
X
$1,
000
AP
PR
OV
ED
TO
TA
L
CO
NS
T C
OS
T
X $
1,00
0
AC
TU
AL
TO
TA
L
CO
NS
T C
OS
T
X $
1,00
0
AP
PR
OV
ED
SL
PP
F
UN
DS
X
$1,
000
AC
TU
AL
SL
PP
F
UN
DS
X
$1,
000
DE
-AL
LO
CA
TE
D
SL
PP
SA
VIN
GS
X
$1,
000
NO
N
DE
-AL
LO
CA
TE
D
SL
PP
SA
VIN
GS
X
$1,0
00
A
LL
OC
AT
ION
D
AT
E
AC
TU
AL
CO
NS
T
ST
AR
T D
AT
E
AC
TU
AL
CO
NS
T
EN
D D
AT
E
239 8 RIV City of Riverside Route 91 Auxiliary Lane (2) 7426 $3,100 $2,267 $2,746 $1,913.1 $1,000 $957 $43 1/2011 3/21/11 7/31/11
240 8 RIV Riverside Cnty Magnolia Ave and Neece St (2) 7435 $781 $903.1 $620 $665.9 $150 $150 10/2011 6/25/12 11/05/12 241 8 RIV Riverside Cnty I-15 Indian Truck Trail IC (3) 7480 $9,100 $10,343 $6,300 $7,775.6 $1,000 $1,000 10/2011 9/27/11 3/18/14
242 8 SBD Town of Apple Valley Bear Valley / Deep Creek Rd (3) 7473 $184 $175.1 $184 $175.1 $92 $88 $4 10/2011 8/15/11 11/30/11
233 8 RIV Town of Apple Valley Kiowa Road Widening (5) 7629 $640 $663.8 $640 $663.8 $320 $320 1/2013 6/25/13 12/16/13
244 8 SBD City of Chino Signal Interconnect (5) 7630 $900 $776.7 $900 $776.7 $450 $389 $61 6/2013 12/03/13 12/16/14
245 8 SBD City of Hesperia Ranchero Rd Grade Sep (3) 7481 $30,845 $31,646.9 $25,000 $27,210.1 $1,000 $1,000 3/2011 8/31/11 9/30/13
246 8 SBD City of Montclair Monte Vista Ave Widening (5) 7633 $663 $522.6 $360 $461.8 $180 $180 5/2013 4/07/14 9/29/14
247 8 SBD City of Redlands
Redlands Blvd / Alabama Street Improvements (5) 7634 $5,581 $6,339.4 $5,581 $6,339.4 $1,000 $1,000 6/2013 11/19/13 3/24/16
248 8 SBD City of Upland Foothill Blvd (Route 66) (3) 7479 $2,100 $5,159 $2,100 $5,159 $1,000 $1,000 1/2012 7/09/12 8/12/13 249 10 AMA Amador Cnty Mission Blvd Gap (1) 7404 $1,955 $1,262.8 $1,600 $845.6 $800 $423 $377 1/2010 4/19/10 1/27/11
250 10 AMA Amador Count Transp. Comm
SR 104 / Prospect Drive Relocation (3) 7465 $2,132 $2,296.3 $1,771 $1,935.3 $885 $885 10/2011 6/18/12 5/31/13
251 10 MER City of Merced Parsons Avenue (1) 7410 $2,319 $2,261.9 $1,590 $2,116.3 $1,000 $1,000 4/2010 09/20/10 11/11/11 252 10 MER City of Merced Parsons Ave/Ada Givens Gap (3) 7482 $1,650 $1,274 $800 $825 $400 $400 10/2011 5/01/12 11/17/12 253 10 MER City of Merced Yosemite Ave Reconstruction (2) 7428 $2,100 $2,114 $1,850 $2,007 $1,000 $1,000 1/2011 1/10/12 11/29/12 254 10 MER City of Merced Highway 59 / Cooper Avenue (1) 7419 $5,020 $3,307 $2,300 $2,077 $1,000 $1,000 1/2011 8/08/11 12/31/12
255 11 SD San Diego County
South Santa Fe Ave North Reconstruction (1) 7403 $29,652 $31,267.4 $21,387 $23,751.4 $1,000 $1,000 4/2010 4/01/10 3/01/13
256 12 ORA City of Anaheim Katella Ave Widening (5) 7579 $7,300 $7,195.6 $7,300 $7,195.6 $1,000 $1,000 6/2013 11/19/13 4/30/15 257 12 ORA City of Anaheim Tustin & La Palma Ave Widen (3) 7476 $6,200 $13,067.7 $4,000 $10,227.8 $1,000 $1,000 6/2013 4/16/13 7/09/15
Total Completed Competitive SLPP $284M $265M $232.2M $223M $40.3M $37.6M $2.32M $438K

California Department of Transportation FY 2017-18 3rd Quarter Report
Proposition 1B State-Local Partnership Program Page 30 of 34
Benefits of Completed Competitive Projects
SL
PP
PR
OJE
CT
DIS
TR
ICT
CO
UN
TY
PROJECT PROJECT BENEFIT on PPR PROJECT BENEFIT on FDR
7402 3 ED Point View Drive Improve mobility and safety for Apple Hill visitors. Connect Point View Dr to Jacquier Rd. Class 2 bike lanes.
Improved mobility and safety for Apple Hill visitors. Connected Point View Dr to Jacquier Rd. Class 2 bike lanes.
7413 3 ED Durock Rd / Busines Dr. Intersection Ped signal, ADA ramps, Cl2 bike lanes, bike detector loops. Safety and mobility.
New turn pockets, signal, ped ramps, crosswalk and Cl2 bike lanes. Safety and multimobility.
7414 3 ED Silva Valley Parkway Widening Increase capacity decrease delays at school. Bring roadway to LOS F. School traffic to LOS B. Add bike lane
Added thru lane, left turn storage lane improved travel. Bike lane is being used.
7415 3 ED White Rock Rd. Widen & Signal Coordinate signals. Add sidewalks, bike lanes, signals. Improve safety. Increase transit. Multi modal.
Improved mobility, operations for peds, bikes, and cars. Also increased capacity of White Rock Rd
7526 3 ED Silva Valley Parkway/US 50 Interchange Project not closed out yet. Project not closed out yet. 7527 3 ED Pleasant Valley Rd/Patterson Dr. Signals Project not closed out yet. Project not closed out yet. 7525 3 PLA Nicolaus Rd Widening Widen Nicolaus Rd, 32' wide widening. Widened Nicolaus Rd. Adds future traffic capacity to airport.
7529 3 PLA Fiddyment Road Widening Widen Fiddyment Rd between Baseline and Pleasant Grove Blvd. From 2 to 5 lanes.
Constructed lanes due to increased ADT. Project is in line with CIP in City of Roseville.
7619 3 PLA Auburn Folsom Widening Will complete the 4 lane road widening and eliminate bottleneck. Also add pedestrian path and bike lane.
Improved traffic capacities. Lessened the constraint on the alternate routes. Increased safety with left turn pockets. ADA standards now met with ramps and sidewalks. Ped path added.
7620 3 PLA Nelson Lane Improvements Widen Nicolaus Ln to 4 lns in between two other widenings. Adds future planned traffic to SR 65.
Widened Nicolaus Rd. Bike and electric vehicle use increased in corridor
7621 3 PLA Kings Beach Commercial Improvement Improve safety w/ Cl2 bike lanes, 10’ sidewalks, roundabouts, improve parking, drainage improvements.
1.1 miles of SR 28 improved safety and alt modes of transportation. Bike lanes, roundabouts, ADA sidewalks, new parking lots. Water quality improvements to Lake Tahoe.
7622 3 PLA Blue Oaks Blvd Widening Widen Blue Oaks from 4 to 6 lns. Safety for peds, bikes, cars. Widened Blue Oaks blvd from 4 to 6 lanes between Crocker Ranch Rd & Industrial Blvd (1.7mi)
7487 3 PLA Tahoe City Transit Build new transit center for ped, bike, bus, car and watercraft accessibility to transit. Improve air quality.
Completed intermodal transit center. 130 pkg spaces. Ped/bike path. Increased accessibility by various modes of transp.
7397 3 SAC Franklin/ Elk Grove 2 12' SB thru lanes, 1 bike lane, 1 NB to EB right turn lane, bus shelter, sidewalk Added EB thru lane and 2 EB to SB right turn lanes
7398 3 SAC Waterman / Grant Ln 1500 ft new roadway. New signal. LOS F to LOS D or better. Multi phases. Improve mobility on Grantline
Add lanes at expanded intersection. Signal for protected left turn. New curb ramps, storm drain signage and striping
7674 3 SAC Cosumnes River College Transit Station Project not closed out yet. Project not closed out yet.
7689 3 SAC Elk Grove - Florin Rd/ Stockton Int Re-align Elk Grove Blvd-Florin & E. Stockton Blvd intersection, left & right turn lanes, raised median.
Re-aligned Elk Grove-Florin to intersect with E. Stockton Blvd at 90 degree angle. New signal, curb ramps, ditches and drainage
7425 3 YOL Tower Bridge Gateway - East ph Reconstruct Tower Bridge Gateway to improve safety and access for multi modal traffic. Support other upcoming projects.
Improved access and safety for cars, public transit, peds, bikes. Supported new urban development in other areas of West Sac and Streetcar system.
7524 4 CC I-680 Auxiliary Lane Project Project not closed out yet. Project not closed out yet. 7623 5 SLO Willow Road Extension Mitigation Mitigate impacts to sensitive habitats and special status plants. Installed irrigation lines, planted environmental required trees.

California Department of Transportation FY 2017-18 3rd Quarter Report
Proposition 1B State-Local Partnership Program Page 31 of 34
Benefits of Completed Competitive Projects
SL
PP
PR
OJE
CT
DIS
TR
ICT
CO
UN
TY
PROJECT PROJECT BENEFIT on PPR PROJECT BENEFIT on FDR
7523 5 SLO Los Osos Valley Rd Project Add 2 way left turn lane. Widen road and additional shoulder for safety. Widened Los Osos Rd. Added center turn lane and bike lanes. Reduces congestion. Safer for bikes.
7409 5 SLO Willow Rd. Extension Expected to relieve congestion, improve traffic flow and LOS at interchanges. Reduce GHG's, improve safety
Ph1 extended Willow Rd for ease of access onto Hwy 101. Reduced truck traffic out of urban area.
7423 5 SLO Willow Rd Extension ph II Construct US101/Willow Rd IC. Relieve congestion, improve traffic flow. Provided link between Hwy 1 and 101. Improved traffic flow and LOS.
7412 5 SB Union Valley Pkwy / Bradley Rd Widen UVP to signal controlled 4 lane, Cl2 bikes, Right turn lane. Will provide better circulation and increased safety. Reduce travel times.
Provided better circulation & safety for cars, peds, bike and transit users. Signal controlled intersection.
7417 5 SB Fairview / Berkely Traffic Signal Install traffic signal at Fairview/Berkely. Will increase safety for ped/bike.
Installed traffic signal and it improved traffic flow and increased ped/bike safety.
7478 5 SB Los Carneros / Calle Roundabout Install roundabout to allow for safer bike and ped passage. Better for GHG's.
Constructed the City's first roundabout intersection. Paving, striping, landscaping, sidewalk, lighting.
7466 6 FRE Bullard / Locan Convert 2 ln undivided to 3 ln divided, bike lanes. Project accommodated bikes, peds, vehicle and transit modes of travel. Improved safety. 30yrs lifespan.
7468 6 FRE Shaw Ave Improvements Convert Shaw from undivided arterial to a divided arterial. Install landscaped median island, bike
Project accommodates bikes, peds, vehicle and transit. Improve safety. 30+yr lifespan. Divided roadway.
7469 6 FRE DeWolf Ave and Nees Avenue to SR 168 Construct N&SB center lanes, NB outside lane. Median curb island, N&SB bike lanes
Built to accommodate bikes, peds, vehicle and transit. Improves safety. Clearly delineate motorized and non- motorized travel
7670 6 FRE Traffic Signal at Shields / Temperance Install traffic signal Shields& Temperance. Will operate at LOS B in am and LOS C in pm.
Signalized Shields & Temperance. Alleviated traffic congestion. More ped friendly.
7672 6 FRE Traffic Signal at Audobon / Cole Install traffic signal at Audobon & Cole to improve travel in the area. Phasing for R/W to both ped and cars.
Signal at Audobon & Cole. Alleviated congestion. Improved travel time and air quality. More ped friendly.
7626 6 KER Mohawk St Ext Improve air quality, reduce VMT, Reduce congestion, support planned development. Improve connectivity.
Improved air quality. Less idling. Reduced vehicle miles. Reduced congestion. Improved connectivity
7676 6 KER Hageman Road Signal Install and Synch Improve air quality, reduce congestion, support current and planned development, increase capacity.
Air quality improved. Congestion reduced. Increased capacity of network. Improved access
7677 6 KER Hosking Ave Widening Widening lanes, air quality improvements, reduce congestion, support planned development.
Improved air quality, reduced congestion, increased capacity, support development.
7399 6 KIN Greenfield Ave. Ext Extend Greenfield Ave and add access to developments. Extended Garfield Ave. Installed sidewalks, bike lanes, lighting. Increased safety.
7400 6 KIN 12th Ave. Widening Add lanes, reduce travel delays and GHG's. Raised median. Sidewalks, bike lanes, lighting, signal.
Added 2 adtl travel lanes ea direction to 12th ave. Raised median. Traffic Signal. Increased capacity, reduced delays & emissions. Added sidewalks, safety.
7411 6 KIN 11th Avenue Widening Add 2 travel lanes each direction to 11th ave. Add bike route, raised median, sidewalks, lighting.
Added 2 travel lanes each direction to 11th ave. increase capacity & safety, reduce delay and emissions. Sidewalk, bike lane and lighting adds safety
7470 6 KIN 12th Avenue Widening / Reconstruction Widen roadway adding travel lane capacity, reducing travel delays and GHG's. Safety.
Added 2 lane miles by widening from 2to4 lanes. Installed curb, gutter, sidewalk, landscaped medians, storm drainage lighting decrease traffic congestion

California Department of Transportation FY 2017-18 3rd Quarter Report
Proposition 1B State-Local Partnership Program Page 32 of 34
Benefits of Completed Competitive Projects
SL
PP
PR
OJE
CT
DIS
TR
ICT
CO
UN
TY
PROJECT PROJECT BENEFIT on PPR PROJECT BENEFIT on FDR
7522 6 KIN 10th Ave Widening/Reconstruction Add adtl travel lane capacity reducing delays and GHG's. Add protected turn lane. Curb, gutter, sidewalks, lighting. Safety
Added 3 miles of travel lane capacity reducing congestion, delays & GHG's. Installed continuous turn lane - safety
7627 6 KIN Campus Drive / UPRR - Crossing Encourage infill development by improving access and connectivity. Reduce congestion and GHG's.
Install new public at grade crossing with UPRR providing access to an area that was land locked. Improve congestion.
7665 7 LA 25th Street East Alignment Align 25th St. Improve traffic flow, circulation and reduce delays. Improve safety
Aligned 25th St. Reduced delays, improved driver confidence, safer
7418 8 RIV Golf Center Parkway Rehab Improve roadway surface, reduce noise levels & hazards. Add efficient traffic flow.
Improved traffic flow, reduced emissions and congestion by eliminating 4way stop and adding thru lane. Improved roadway surface
7426 8 RIV Rte 91 Auxiliary Lane EB aux lane will reduce congestion, improve safety. Useful life of 50 yrs. Same as PPR
7435 8 RIV Magnolia Ave / Neece St. Signal Improve safety for peds, bikes & fire engines. Encourage peds. Increase capacity. Reduce response time for fire dept.
Installed left turn pockets, signal & lighting. Encourages ped and bike traffic. Safety with nearby fire station.
7439 8 RIV Cactus Ave Street Improvements Increase Cactus Ave's ability for greater traffic volume, eliminate constriction, safe flow.
Same as PPR and additional accessibility to medical center. Increased LOS, improved emergency response times
7480 8 RIV I-15 / Indian Truck Trail IC Improve from LOS F - to LOS B in the am and LOS C in the pm. Improves local circulation, congestion, safety Same as PPR
7518 8 RIV State Route 60/Nason St. Overcrossing Project not closed out yet. Project not closed out yet.
7628 8 RIV Cactus Ave EB 3rd Lane Widen Bring EB lane to design standard, align intersection, increase LOS. Increase safety. Long term env impacts.
Reduced conflict of vehicles exiting fwy, NB to EB. Traffic flow is increased. Better access to Air Reserve Base.
7636 8 RIV I-15 / Los Alamos Rd OC Gap closure to existing 4 lane Los Alamos Rd. Relieve bottleneck. Improve circulation. Min vert clrs. Same as PPR
7679 8 RIV Perris Blvd Improvements Widen 1.25mi to improve capacity, relieve congestion. Add bike, bus routes, reduce travel time. Increase safety
Widened 1.25mi of Perris Blvd. Reduced congestion. Added std bike, bus, ped and ramps. Enhanced safety. Safer for students
7471 8 SBD I-15 / Duncan Canyon Interchange (3,4) Project not closed out yet. Project not closed out yet.
7473 8 SBD Bear Valley and Deep Creek Roads Enhance traffic safety. Install signal Raise from LOS F to LOS A New signal enhanced safety and reduced liability. Went from LOS F to LOS A.
7479 8 SBD Foothill Blvd (Route 66) Accommodate existing and projected car and continuous ped traffic safely. Provide access for businesses.
Add car and bike traffic. Provided access for developments. Continuous ped walkways.
7481 8 SBD Ranchero Road Grade Sep Separation is to improve traffic circulation, decrease response times, reduce commuter travel time.
Decreased emergency response times by 4.5 minutes and up to 7 miles. Also saved school district $1M in gas costs annually.
7520 8 SBD SR-210/Greenspot Rd Improvements (4,5) Project not closed out yet. Project not closed out yet.
7629 8 SBD Kiowa Rd Widening Ph II Improve safety for cars, bikes. Improve efficiency of road network. Improve bike safety w/ CL2 bike lane,
Same as PPR. Improves safety for cars, bikes. Improves quality and efficiency of roadway. Add bike lane.
7630 8 SBD Signal Interconnect Reduce pollution from emissions, improve air quality. Increase in safety. Provided communications backbone to interconnect signals. Improved traffic flow. Increased capacity.
7631 8 SBD 5th St Corridor Improvements Project not closed out yet. Project not closed out yet. 7632 8 SBD Greenspot Rd Bridge at Santa Ana River Project not closed out yet. Project not closed out yet.

California Department of Transportation FY 2017-18 3rd Quarter Report
Proposition 1B State-Local Partnership Program Page 33 of 34
Benefits of Completed Competitive Projects
SL
PP
PR
OJE
CT
DIS
TR
ICT
CO
UN
TY
PROJECT PROJECT BENEFIT on PPR PROJECT BENEFIT on FDR
7633 8 SBD Monte Vista Ave Widening Widening will provide adtl travel options for I60 &I10. Reduce traffic and time delays.
Provide adtl travel options for commuters between I60 & I10. Reduce traffic and time delays.
7634 8 SBD Redlands Blvd / Alabama St Int Widen and realign Redlands Blvd/ Alabama St. intersection. Alleviated offset on Alabama St. Widened Redlands Blvd. LOS went from F to C.
7635 8 SBD I-15 / Baseline Road IC Project not closed out yet. Project not closed out yet. 7690 8 SBD Baseline Greenspot Rd Traf Safety Project not closed out yet. Project not closed out yet.
7404 10 AMA Mission Blvd Gap Relieve congestion, Improve air quality, Completes larger project, Reduces Daily VMT by 800, infill project
Travel time savings, increase in throughput, lane miles added, reduced emissions. Also provides alternate route for hospital
7465 10 AMA SR 104 / Prospect Drive Relocation Eliminate 2 T-intersections. Safety for peds, bikes and NEV's crossing SR104. Access to Transit Center.
Realigned 700' of Prospect Dr to SR 104. Eliminated T intersections. Eliminated gap for bikes, peds
7410 10 MER Parsons Ave Upgrade street to necessary capacity. Increase safety for peds. Safer for peds. Increased from 2 to 4 lanes. Lighted crosswalk.
7419 10 MER 59/ Cooper Ave Sig Increases jobs with less traffic delays. Reduce emissions by 22lb/day Same as PPR. Project well received by public. Police, fire and public spend less time waiting at intersection. Improved traffic
7428 10 MER Yosemite Ave Reconstruction Improve safety. Permanent repair of drainage. Increased system reliability, reduced driving times, reduced emissions, increase in traffic safety
7482 10 MER Parson's Avenue Ada Givens Gap Will improve traffic safety. Shorten distance to major arterial. Connection to Cl1 bike system. Direct rte to trailhead
Removed street barrier. Increased safety, school and general circulation. Increased air quality.
7403 11 SD S. Santa Fe Ave Enhance safety, increase capacity, reduce delays, add 1.78 mi roadway. Improve air quality.
Enhanced safety, increased capacity, reduced travel delays, added 1.78 miles of roadway.
7476 12 ORA Tustin Ave and La Palma Ave Widening Improve am & pm LOS from F to D. 25 year useful life. Travel time savings of 35-40% am & 12-34%pm.
Increasing roadway capacity, provide new street surface, increase pavement life by 20yrs.
7579 12 ORA Katella Ave Widening Improve am & pm LOS from F to A. 25 yr useful life. Relieve congestion, enhance aesthetics, provide infrastructure improvement.
Increased pavement life of 20 years and increased roadway capacity.

California Department of Transportation FY 2017-18 3rd Quarter Report
Proposition 1B State-Local Partnership Program Page 34 of 34
SLPP Closeout Corrective Actions – Competitive Projects Project 189: I-15 Duncan Canyon Interchange Agency did not report status update for the quarter ending March 31, 2018. Project 192: I-680 Auxiliary Lane Project Agency did not report status update for the quarter ending March 31, 2018.
SLPP Corrective Actions – Competitive Projects There are no SLPP Competitive project corrective actions this quarter.
SLPP Updates – Competitive Projects There are no SLPP Competitive project updates this quarter.

Quarterly Report to the California Transportation
Commission
FY 2017-18 Third Quarter Report
Traffic Light Synchronization Program

Proposition 1B Traffic Light Synchronization Program Page 1
TRAFFIC LIGHT SYNCHRONIZATION PROGRAM PROGRESS REPORT
BACKGROUND The Highway Safety, Traffic Reduction, Air Quality, and Port Security Bond Act of 2006 (Proposition 1B) was passed by California voters on November 7, 2006 and created the Traffic Light Synchronization Program (TLSP). Proposition 1B provides $250 million, upon appropriation by the Legislature, for TLSP projects approved by the California Transportation Commission (CTC). The California Department of Transportation is required to provide quarterly reports to the CTC on the status of progress by the local agencies on completing TLSP work funded by the Proposition 1B bond funds. The guidelines for the TLSP were adopted on February 13, 2008. The CTC has approved 22 TLSP projects totaling $147,000,000 for the City of Los Angeles, and 59 additional TLSP projects totaling $96,845,933 for agencies other than the City of Los Angeles. Program Summary TLSP Third Quarter Progress Report for fiscal year 2017-2018. The CTC has allocated a total of $243,845,933 to 81 TLSP projects. The City of Los Angeles has received allocations for 22 projects, totaling $147,000,000, while agencies other than the City of Los Angeles have received allocations for 59 projects, totaling $96,845,933. Of the 81 TLSP projects receiving an allocation, 76 have completed construction. The City of Los Angeles has completed construction on 19 projects with a total allocation of $121,692,500, while agencies other than the City of Los Angeles have completed construction on 58 projects with a total allocation of $75,606,017. The TLSP program has been fully allocated. Project savings to date - $1,542,068 (non-Los Angeles)

California Department of Transportation FY 2017-18 Third Quarter Report
Proposition 1B Traffic Light Synchronization Program Page 2
Project Status – City of Los Angeles (Active Projects)
DIST. CO. AGENCY PROJ. ID PROJECT NAME TLSP PROG.
COST
T
OT
AL
C
ON
ST
. C
OS
T
CU
RR
EN
T
TL
SP
E
XP
EN
DIT
UR
E
A
LL
OC
AT
ION
D
AT
E
BE
GIN
C
ON
ST
. D
AT
E
EN
D
CO
NS
T. D
AT
E
CO
NS
T.
PE
RC
EN
T
CO
MP
LE
TE
SC
OP
E
BU
DG
ET
SC
HE
DU
LE
CL
OS
EO
UT
R
EP
OR
T
CO
MM
EN
TS
7 LA Los Angeles 6760 ATCS - Central Business District $748,000 $9,215,000 $0 Oct -16 May-17 Jun-18 60 See pg 9
7 LA Los Angeles 6761 ATCS - Central City East $0 $4,885,000 $0 Oct -16
Aug-16 Aug-19 90 100% Local
Funds
7 LA Los Angeles 6763 ATCS - Los Angeles $11,528,500 $15,344,800 $3,254,755 Oct-16 Aug-17 Dec-18 70 See pg 9
Los Angeles Prog Total
$12,276,500
$29,444,800
$3,254,755
Project Status – Other Agencies (Active Projects)
DIST. CO. AGENCY PROJ. ID PROJECT NAME TLSP PROG.
COST
TO
TA
L
CO
NS
T.
CO
ST
C
UR
RE
NT
T
LS
P
EX
PE
ND
ITU
RE
A
LL
OC
AT
ION
D
AT
E
BE
GIN
C
ON
ST
. D
AT
E
EN
D
CO
NS
T. D
AT
E
CO
NS
T.
PE
RC
EN
T
CO
MP
LE
TE
SC
OP
E
BU
DG
ET
SC
HE
DU
LE
CL
OS
EO
UT
R
EP
OR
T
CO
MM
EN
TS
4 Ala Alameda CMA** 6744 San Pablo Corridor $18,718,405 $25,618,405 $18,357,177 Jan-11 Apr-11 Dec-19 97 See pg 9
Agencies other than City of Los Angeles Prog Total
$18,718,405
$25,618,405 $18,357,177
* *Note: Projects for the Orange County Transportation Authority (OCTA), the City of San Jose, the City/County Association of Governments of San Mateo County (San Mateo C/CAG), and Alameda County Congestion Management Agency (CMA) fall under several categories, as the projects have been phased or segmented.
Project is on time, on budget, or within scope. Issue has been identified.

California Department of Transportation FY 2017-18 Third Quarter Report
Proposition 1B Traffic Light Synchronization Program Page 3
Project Status – City of Los Angeles (Completed Projects)
DIST. CO. AGENCY PROJ. ID PROJECT NAME TLSP PROG.
COST
T
OT
AL
C
ON
ST
. C
OS
T
CU
RR
EN
T
TL
SP
E
XP
EN
DIT
UR
E
A
LL
OC
AT
ION
D
AT
E
BE
GIN
C
ON
ST
. D
AT
E
EN
D
CO
NS
T. D
AT
E
SC
OP
E
BU
DG
ET
SC
HE
DU
LE
CL
OS
EO
UT
R
EP
OR
T
CO
MM
EN
TS
7 LA Los Angeles 6762 ATCS - Echo Park / Silver Lake $3,215,000 $3,480,000 $3,215,000 Dec-08 Jul-09 Aug-12
7 LA Los Angeles 6764 ATCS - Santa Monica Fwy Corridor Phase 1 $6,515,500 $7,507,800 $4,155,329 Jun-12 Aug-12 Sep-15
7 LA Los Angeles 6765 ATCS - Santa Monica Fwy Corridor Phase 2 $6,515,500 $7,507,800 $421,044 Dec-13 Jan-14 Jan-15
7 LA Los Angeles 6766 ATCS - West Adams $4,250,800 $4,870,120 $2,191,093 Jun-14 May-15 May-18 See pg 9
7 LA Los Angeles 6826 ATCS - Echo Park / Silver Lake Phase 2 $4,076,500 $3,186,471 $3,028,059 Mar-15 Nov -15 Dec-18 See pg 9 7 LA Los Angeles 6768 ATCS - Wilshire East $4,877,900 $4,784,736 $4,349,179 Feb-14 Jan-15 Feb-18 See pg 9 7 LA Los Angeles 6767 ATCS - Westwood / West Los Angeles $3,484,200 $4,009,200 $2,628,800 Jun-12 Jan-12 Mar-16
7 LA Los Angeles 6769 ATSAC - Canoga Park $10,316,400 $11,031,100 $9,051,395 Jan-11 Jul-11 Apr-14
7 LA Los Angeles 6770 ATSAC - Canoga Park Phase 2 $9,228,900 $9,943,600 $8,899,031 Jan-11 Jun-11 Jul-14
7 LA Los Angeles 6771 ATSAC – Foothill $8,802,900 $9,425,400 $8,615,317 Oct-11 Jul-11 Jul-14 7 LA Los Angeles 6772 ATSAC - Harbor - Gateway 2 $7,899,000 $8,891,000 $7,899,000 Apr-10 Mar-11 Apr-14
7 LA Los Angeles 6773 ATSAC - Pacific Palisades / Canyons $6,922,200 $7,548,300 $6,922,156 Jan-11 Jul-11 Jul-14 . 7 LA Los Angeles 6774 ATSAC - Platt Ranch $4,358,600 $4,905,000 $4,358,000 May-09 Dec-09 Jan-13
7 LA Los Angeles 6775 ATSAC - Reseda $8,506,300 $9,333,000 $8,506,300 Oct-08 Jan-09 Feb-12 7 LA Los Angeles 6776 ATSAC - Reseda Phase 2 $7,221,000 $7,898,000 $7,220,700 Jan-10 Jul-10 Aug-13
7 LA Los Angeles 6777 ATSAC - San Pedro $8,911,000 $9,802,000 $8,911,000 May-09 Sep-09 Oct-12
7 LA Los Angeles 6778 ATSAC - Wilmington $11,073,000 $12,319,700 $10,411,479 Jan-11 Jul-11 Apr-14
7 LA Los Angeles 6779 ATSAC - Coliseum / Florence $8,107,000 $9,007,500 $6,611,901 Oct-11 Jul-11 Sep-14 See pg 9
7 LA Los Angeles 6780 ATSAC - Coliseum / Florence Phase 2 $10,441,800 $11,342,300 $8,702,743 Oct-11 Jul-11 Jun-14 See pg 9
* *Note: Projects for the Orange County Transportation Authority (OCTA), the City of San Jose, the City/County Association of Governments of San Mateo County (San Mateo C/CAG), and Alameda County Congestion Management Agency (CMA) fall under several categories, as the projects have been phased or segmented.
Los Angeles Prog Total
$134,723,500
$146,793,027
$116,097,526
Project is on time, on budget, or within scope. Issue has been identified. Closeout report is being reviewed.

California Department of Transportation FY 2017-18 Third Quarter Report
Proposition 1B Traffic Light Synchronization Program Page 4
Project Status – Other Agencies (Completed Projects)
DIST. CO. AGENCY PROJ. ID PROJECT NAME TLSP PROG.
COST
TO
TA
L
CO
NS
T.
CO
ST
C
UR
RE
NT
T
LS
P
EX
PE
ND
ITU
RE
A
LL
OC
AT
ION
D
AT
E
BE
GIN
C
ON
ST
. D
AT
E
EN
D
CO
NS
T. D
AT
E
SC
OP
E
BU
DG
ET
SC
HE
DU
LE
CL
OS
EO
UT
R
EP
OR
T
CO
MM
EN
TS
3 Pla Roseville 6794 East ITS Coordination $912,414 $1,013,456 $912,414 Sep-08 Jun-09 Dec-09
3 Sac Citrus Heights 6745 TLSP Phase II Greenback Lane $180,000 $238,000 $180,000 Sep-08 Jul-08 Nov-08
3 Sac Citrus Heights 6746 TLSP Phase III Antelope Road $102,000 $124,000 $102,000 Apr-10 Sep-10 Apr-11
3 Sac Rancho Cordova 6792 Folsom Boulevard $180,000 $460,000 $180,000 May-09 Sep-09 Dec-09 3 Sac Sacramento 6795 TLSP $2,862,000 $4,072,000 $2,862,000 Jan-10 Jun-10 May-11
3 Sac Sacramento County 6796 Florin Road $401,000 $552,000 $401,000 Dec-08 Jun-09 Apr-10
3 Sac Sacramento County 6797 Madison Avenue $142,000 $652,000 $142,000 Aug-08 Sep-08 Feb-09
4 SF SFMTA 6800 Franklin, Gough & Polk Streets $5,110,000 $12,020,000 $5,110,000 Oct-08 Jan-10 Dec-13 4 Ala Alameda County 6743 Redwood Road $124,000 $159,000 $120,542 May-09 Mar-10 Sep-10 4 Ala San Leandro 6802 ATMS Expansion $350,000 $558,000 $350,000 Oct-08 Jul-09 Jun-11 4 CC San Ramon 6806 Bollinger Canyon $475,000 $739,000 $474,398 Jan10 Sep-09 Mar-10 4 CC San Ramon 6807 Crow Canyon $310,000 $435,000 $310,000 Jan-10 Sep-09 Mar-10 4 CC Walnut Creek 6824 Ygnacio Valley Road Corridor $1,489,000 $2,139,000 $1,460,594 Dec-08 Jun-09 Nov-10 4 Mrn Marin County 6781 Sir Francis Drake Boulevard $208,000 $260,000 $199,639 Sep-08 May-09 Dec-09 4 SCl San Jose** 6801 TLSP $15,000,000 $20,000,000 $15,000,000 Jan-10 Jan-09 Jun-13
4 SCl Santa Clara County 6814 County Expressway TDCS for TLSP $900,000 $1,030,000
$900,000 May-10 Oct-10 Nov-11
4 Son Santa Rosa 6816 Steele Lane / Guerneville $1,100,000 $1,600,000
$1,099,647 Aug-08 Aug-08 Sep-09
5 SCr Watsonville 6825 Signal Corridor Upgrade $120,000 $180,000 $96,973 Apr-10 Jun-10 Apr-13
6 Fre Fresno 6751 Clovis Avenue $2,100,000 $3,270,733 $1,958,569 Apr-10 Feb-11 Oct-11 6 Fre Fresno 6752 Shaw Avenue $2,100,000 $3,165,800 $1,686,289 Oct-11 Sep-12 Jun-13 6 Kin Hanford 6757 12th Avenue $76,126 $173,408 $70,430 Sep-08 Dec-09 Feb-10 7 LA Culver City 6749 Citywide TLSP $199,224 $249,030 $199,224 Jan-10 Apr-10 May-11 7 LA Glendale 6754 Brand Boulevard $850,000 $952,333 $747,772 Jan-12 Jul-12 Mar-13
7 LA Glendale 6755 Colorado Street / San Fernando Road $613,000 $885,982
$452,244 Jan-12 Jul-12 Mar-13
7 LA Glendale 6756 Glendale Avenue / Verdugo Road $1,798,000 $1,642,199 $1,291,918 Jan-12 Jul-12 Mar-13 7 LA Pasadena 6785 Del Mar Boulevard $138,000 $172,000 $138,000 Jan-12 Apr-12 Aug-14 See pg 9 7 LA Pasadena 6787 Hill Avenue $66,000 $83,000 66,000 Jan-12 Apr-12 Aug-14 See pg 9 7 LA Pasadena 6789 Orange Grove Boulevard $188,000 $235,000 $188,000 Jan-12 Apr-12 Aug-14 See pg 9 7 LA Pasadena 6784 California Boulevard $68,000 $76,000 $51,909 Jan-12 Apr-12 Mar-16 See pg 9 7 LA Pasadena 6788 Los Robles Avenue $107,000 $134,000 $100,000 Jan-12 Apr-12 Mar-16 See pg 9
7 LA Pasadena 6791 Sierra Madre Boulevard $110,000 $138,000 $104,000 Jan-12 Apr-12 Mar-16 See pg 9
7 LA Compton 6747 Rosecrans Avenue $682,734 $944,176
$611,361 Apr-10 Feb-11 Jun-16
See pg 9
7 LA Inglewood 6758 La Brea Avenue $426,000 $606,000 $388,228 Aug-13 Aug-13 Jan-14 7 LA Santa Clarita 6815 Advanced System Detection Expansion $345,079 $414,111 $345,079 Dec-08 Oct-09 Jan-10 8 Riv Murrieta 6782 Murrieta Hot Springs Road $335,387 $470,125 $335,387 Oct-08 Aug-09 Dec-10 8 Riv Corona 6748 TLSP ATMS Phase II $4,488,000 $5,511,000 $4,487,493 Oct-08 Jun-09 Sep-11 8 Riv Temecula 6819 Citywide Traffic Signal Synchronization $515,000 $618,000 $515,000 Apr-10 Sep-10 Mar-11 8 SBd SANBAG 6808 TLSP Tier 3 & 4 $1,537,041 $6,256,105 $1,537,041 Jan-11 Dec-10 Jun-12

California Department of Transportation FY 2017-18 Third Quarter Report
Proposition 1B Traffic Light Synchronization Program Page 5
DIST. CO. AGENCY PROJ. ID PROJECT NAME TLSP PROG.
COST
TO
TA
L
CO
NS
T.
CO
ST
C
UR
RE
NT
T
LS
P
EX
PE
ND
ITU
RE
A
LL
OC
AT
ION
D
AT
E
BE
GIN
C
ON
ST
. D
AT
E
EN
D
CO
NS
T. D
AT
E
SC
OP
E
BU
DG
ET
SC
HE
DU
LE
CL
OS
EO
UT
R
EP
OR
T
CO
MM
EN
TS
8 SBd Rancho Cucamonga 6793 Foothill Boulevard $225,000 $712,250
$225,000 Aug-08 Mar-09 Dec-09
10 SJ Tracy 6820 Grant Line Road $162,830 $217,107
$162,830 May-09 Jan-10 Oct-10
10 SJ Tracy 6821 Tracy Boulevard $111,211 $148,281 $111,211 May-09 Jan-10 Oct-10 11 SD El Cajon 6750 Main Street $38,956 $38,956 $38,956 May-09 Nov-09 Feb-10
11 SD San Diego County 6798
Bonita Road, Sweetwater Road, Briarwood Road $632,494 $1,319,620
$632,494 Aug-08 Sep-09 Oct-10
11 SD San Diego County 6799 South Mission Road $78,000 $115,000
$78,000 Aug-08 Sep-09 Oct-10
11 SD San Marcos 6803 Rancho Santa Fe Road $265,024 $359,696 $263,298 Aug-08 Apr-10 Aug-10 11 SD San Marcos 6804 San Marcos Boulevard Smart Corridor $549,000 $686,000 $539,597 Aug-08 Dec-08 Jun-11
11 SD SANDAG 6809 At-grade Crossing Traffic Synchronization $820,000 $1,100,000
$820,000 Oct-08 Oct-08 Dec-12
11 SD SANDAG 6810 East-West Metro Corridor $1,267,000 $1,417,000 $1,267,000 Oct-08 Jun-10 Jun-11
11 SD SANDAG 6811 I-15 Corridor $2,162,000 $2,412,000 $2,153,685 Oct-08 Jun-10 Jun-11 11 SD SANDAG 6812 I-805 Corridor $273,739 $337,908 $273,739 Oct-08 Oct-08 Aug-09 11 SD SANDAG 6813 Transit Signal Priority $951,000 $2,947,000 $941,775 Oct-08 Nov-08 Nov-12 11 SD Santee 6817 Magnolia Avenue $93,030 $116,288 $93,030 May-09 Mar-10 May-10 11 SD Santee 6818 Mission Gorge Road $322,483 $403,104 $322,483 May-09 Feb-10 May-10 11 SD Vista 6822 North Santa Fe Avenue $155,574 $210,662 $155,574 Aug-08 Oct-08 Jan-09 11 SD Vista 6823 South Melrose Drive $183,182 $230,534 $183,182 Aug-08 Oct-08 Jan-09 12 Ora Garden Grove 6753 TMC Upgrade $1,859,000 $4,758,000 $1,859,000 Oct-08 Jun-10 Nov-11 12 Ora OCTA** 6783 Countywide TLSP $4,000,000 $8,000,000 $3,845,510 Jan-11 Jul-10 Sep-12 7 LA Long Beach 6759 Long Beach Area TLSP withdrawn 7 LA Pasadena 6786 Fair Oaks Avenue withdrawn 7 LA Pasadena 6790 San Gabriel Boulevard withdrawn
Agencies other than City of Los Angeles Prog Total
$60,857,528
$97,757,864
$59,141,515
* *Note: Projects for the Orange County Transportation Authority (OCTA), the City of San Jose, the City/County Association of Governments of San Mateo County (San Mateo C/CAG), and Alameda County Congestion Management Agency (CMA) fall under several categories, as the projects have been phased or segmented.
Project is on ime, on budget, or within scope. Issue has been identified. Closeout report is being reviewed.
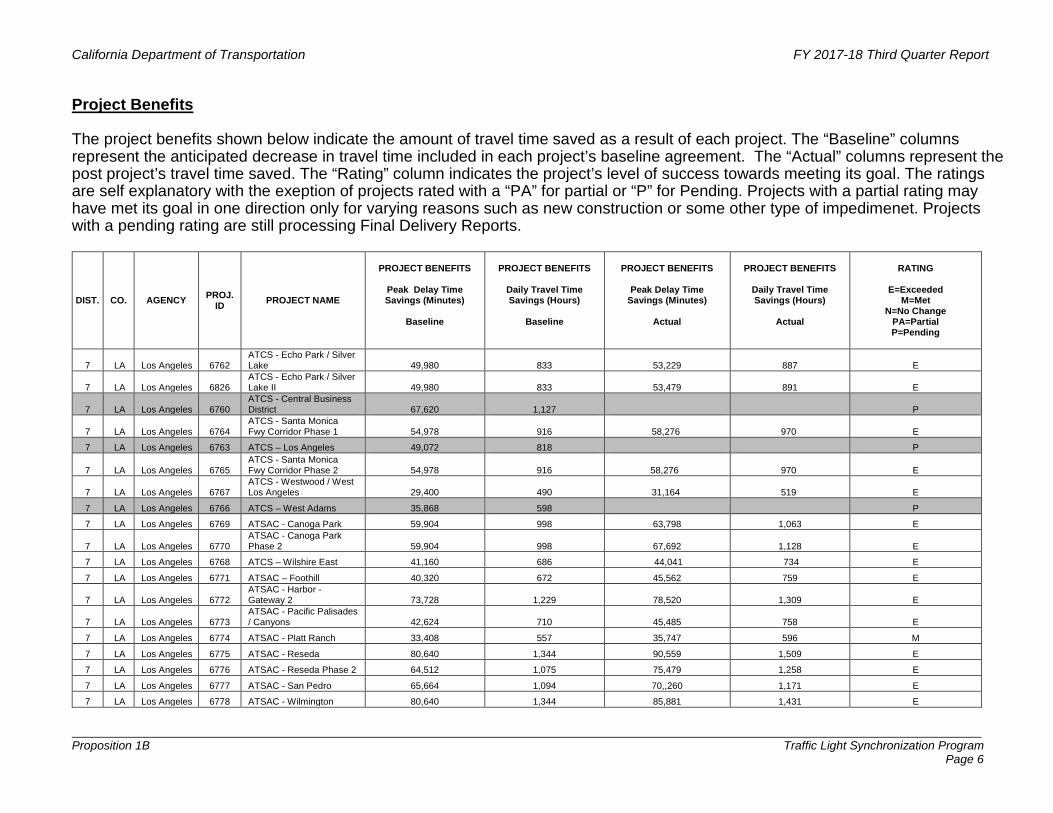
California Department of Transportation FY 2017-18 Third Quarter Report
Proposition 1B Traffic Light Synchronization Program Page 6
Project Benefits The project benefits shown below indicate the amount of travel time saved as a result of each project. The “Baseline” columns represent the anticipated decrease in travel time included in each project’s baseline agreement. The “Actual” columns represent the post project’s travel time saved. The “Rating” column indicates the project’s level of success towards meeting its goal. The ratings are self explanatory with the exeption of projects rated with a “PA” for partial or “P” for Pending. Projects with a partial rating may have met its goal in one direction only for varying reasons such as new construction or some other type of impedimenet. Projects with a pending rating are still processing Final Delivery Reports.
DIST. CO. AGENCY PROJ.
ID PROJECT NAME
PROJECT BENEFITS
Peak Delay Time Savings (Minutes)
Baseline
PROJECT BENEFITS
Daily Travel Time Savings (Hours)
Baseline
PROJECT BENEFITS
Peak Delay Time
Savings (Minutes)
Actual
PROJECT BENEFITS
Daily Travel Time Savings (Hours)
Actual
RATING
E=Exceeded
M=Met N=No Change
PA=Partial P=Pending
7 LA Los Angeles 6762 ATCS - Echo Park / Silver Lake 49,980 833 53,229 887 E
7 LA Los Angeles 6826 ATCS - Echo Park / Silver Lake II 49,980 833 53,479 891 E
7 LA Los Angeles 6760 ATCS - Central Business District 67,620 1,127 P
7 LA Los Angeles 6764 ATCS - Santa Monica Fwy Corridor Phase 1 54,978 916 58,276 970 E
7 LA Los Angeles 6763 ATCS – Los Angeles 49,072 818 P
7 LA Los Angeles 6765 ATCS - Santa Monica Fwy Corridor Phase 2 54,978 916 58,276 970 E
7 LA Los Angeles 6767 ATCS - Westwood / West Los Angeles 29,400 490 31,164 519 E
7 LA Los Angeles 6766 ATCS – West Adams 35,868 598 P
7 LA Los Angeles 6769 ATSAC - Canoga Park 59,904 998 63,798 1,063 E
7 LA Los Angeles 6770 ATSAC - Canoga Park Phase 2 59,904 998 67,692 1,128 E
7 LA Los Angeles 6768 ATCS – Wilshire East 41,160 686 44,041 734 E
7 LA Los Angeles 6771 ATSAC – Foothill 40,320 672 45,562 759 E
7 LA Los Angeles 6772 ATSAC - Harbor - Gateway 2 73,728 1,229 78,520 1,309 E
7 LA Los Angeles 6773 ATSAC - Pacific Palisades / Canyons 42,624 710 45,485 758 E
7 LA Los Angeles 6774 ATSAC - Platt Ranch 33,408 557 35,747 596 M
7 LA Los Angeles 6775 ATSAC - Reseda 80,640 1,344 90,559 1,509 E
7 LA Los Angeles 6776 ATSAC - Reseda Phase 2 64,512 1,075 75,479 1,258 E
7 LA Los Angeles 6777 ATSAC - San Pedro 65,664 1,094 70,,260 1,171 E
7 LA Los Angeles 6778 ATSAC - Wilmington 80,640 1,344 85,881 1,431 E

California Department of Transportation FY 2017-18 Third Quarter Report
Proposition 1B Traffic Light Synchronization Program Page 7
DIST. CO. AGENCY PROJ.
ID PROJECT NAME
PROJECT BENEFITS
Peak Delay Time Savings (Minutes)
Baseline
PROJECT BENEFITS
Daily Travel Time Savings (Hours)
Baseline
PROJECT BENEFITS
Peak Delay Time
Savings (Minutes)
Actual
PROJECT BENEFITS
Daily Travel Time Savings (Hours)
Actual
RATING
E=Exceeded
M=Met N=No Change
PA=Partial P=Pending
7 LA Los Angeles 6779 ATSAC - Coliseum / Florence 77,184 1,286 82,201 1,370 E
7 LA Los Angeles 6780 ATSAC - Coliseum / Florence Phase 2 77,184 1,286 82,607 1,377 E
3 Pla Roseville 6794 East ITS Coordination 4,214 70 5,227 87 E
3 Sac Citrus Heights 6745
TLSP Phase II Greenback Lane 3,912 65 4,993 83 E
3 Sac Citrus Heights 6746
TLSP Phase III Antelope Road 1,600 27 1,872 31 E
3 Sac Rancho Cordova 6792 Folsom Boulevard 4,650 78 4,627 77 PA
3 Sac Sacramento 6795 TLSP 20,327 339 23,244 387 E
3 Sac Sacramento County 6796 Florin Road 18,586 310 22,489 375 E
3 Sac Sacramento County 6797 Madison Avenue 13,010 217 16,262 271 E
4 SF SFMTA 6800 Franklin, Gough & Polk Streets 25,901 432 25,901 432 N
4 Ala Alameda County 6743 Redwood Road 0 0 1.0 .01 E
4 Ala San Leandro 6802 ATMS Expansion 11,177 1,962 12,358 2,060 E
4 Ala ACCMA San Pablo Corridor 30,940 516 516 9 N
4 CC San Ramon 6806 Bollinger Canyon 4,620 77 6,237 104 E
4 CC San Ramon 6807 Crow Canyon 6,510 109 9,309 156 E
4 CC Walnut Creek 6824
Ygnacio Valley Road Corridor 15,552 259 17,107 285 E
4 Mrn Marin County 6781
Sir Francis Drake Boulevard 3,390 57 4,068 68 E
4 SCl San Jose** 6801 TLSP 11,056 184 22,112 368 E
4 SCl Santa Clara County 6814
County Expressway TDCS for TLSP 103,382 1,723 110,802 1,844 E
4 Son Santa Rosa 6816 Steele Lane / Guerneville 11,779 196 14,723 245 E
4 SM San Mateo C/CAG** 6805 SMART Corridor Projects 53,318 889 P
5 SCr Watsonville 6825 Signal Corridor Upgrade 2,595 43 3,306 55 E 6 Fre Fresno 6751 Clovis Avenue 33,448 557 42,713 712 E
6 Fre Fresno 6752 Shaw Avenue 77,215 1,287 87,760 1,441 E 6 Kin Hanford 6757 12th Avenue 2,760 46 3,588 60 E 7 LA Culver City 6749 Citywide TLSP 25,604 3,928 34,821 5,343 E 7 LA Glendale 6754 Brand Boulevard 7,207 120 8,403 140 E
7 LA Glendale 6755 Colorado Street/ San Fernando Road 18,744 312 25,904 431 E
7 LA Glendale 6756 Glendale Avenue/Verdugo Road 8,778 146 10,665 177 E
7 LA Pasadena 6785 Del Mar Boulevard 3,658 61 4,060 68 E

California Department of Transportation FY 2017-18 Third Quarter Report
Proposition 1B Traffic Light Synchronization Program Page 8
DIST. CO. AGENCY PROJ.
ID PROJECT NAME
PROJECT BENEFITS
Peak Delay Time Savings (Minutes)
Baseline
PROJECT BENEFITS
Daily Travel Time Savings (Hours)
Baseline
PROJECT BENEFITS
Peak Delay Time
Savings (Minutes)
Actual
PROJECT BENEFITS
Daily Travel Time Savings (Hours)
Actual
RATING
E=Exceeded
M=Met N=No Change
PA=Partial P=Pending
7 LA Pasadena 6787 Hill Avenue 1,497 25 1,662 28 E 7 LA Pasadena 6789 Orange Grove Boulevard 2,827 47 3,138 52 E 7 LA Pasadena 6784 California Boulevard 1,127 19 1,251 21 E 7 LA Pasadena Fair Oaks 2,379 40 2,641 44 E 7 LA Pasadena 6788 Los Robles Avenue 1,322 22 1,467 24 E 7 LA Pasadena 6791 Sierra Madre Boulevard 1,320 22 1,465 24 E 7 LA Pasadena San Gabriel 440 7 488 8 E 7 LA Compton 6747 Rosecrans Avenue 16,605 277 P 7 LA Inglewood 6758 La Brea Avenue 5,400 90 5,400 90 N
7 LA Santa Clarita 6815
Advanced System Detection Expansion 29,149 486 35,416 590
E
7 LA Long Beach Long Beach Area TLSP 361,139 6,019 361,139 6,019 N
8 Riv Murrieta 6782 Murrieta Hot Springs Road 6,519 109 7,758 129 E
8 Riv Corona 6748 TLSP ATMS Phase II 40,316 672 58,055 968 E
8 Riv Temecula 6819 Citywide Traffic Signal Synchronization 37,725 629 43,006 717 E
8 SBd SANBAG 6808 TLSP Tier 3 & 4 121,742 2,029 140,003 2,333 E
8 SBd Rancho Cucamonga 6793 Foothill Boulevard 18,240 304 23,712 395 E
10 SJ Tracy 6820 Grant Line Road 5,460 91 6,224 104 E 10 SJ Tracy 6821 Tracy Boulevard 2,730 46 3,140 52 E 11 SD El Cajon 6750 Main Street 2,185 36 2,480 41 E
11 SD San Diego County 6798
Bonita Road, Sweetwater Road, Briarwood Road 6,422 107 7,706 128 E
11 SD San Diego County 6799 South Mission Road 1,075 18
1,312 22 E
11 SD San Marcos 6803 Rancho Santa Fe Road 5,250 88 7,600 110 E
11 SD San Marcos 6804 San Marcos Boulevard Smart Corridor 17,893 298 25,498 425 E
11 SD SANDAG 6809 At-grade Crossing Traffic Synchronization 11,086 185 12,860 214 E
11 SD SANDAG 6810 East-West Metro Corridor 5,252 88 5,856 98 E
11 SD SANDAG 6811 I-15 Corridor 28,817 480 31,411 524 E 11 SD SANDAG 6812 I-805 Corridor 6,689 111 7,625 127 E 11 SD SANDAG 6813 Transit Signal Priority 12,137 202 12,380 206 E 11 SD Santee 6817 Magnolia Avenue 1,824 30 2,353 39 PA 11 SD Santee 6818 Mission Gorge Road 6,986 116 8,837 147 E 11 SD Vista 6822 North Santa Fe Avenue 3,150 53 9,750 68 E 11 SD Vista 6823 South Melrose Drive 3,409 57 9,500 73 E
12 Ora Garden Grove 6753 TMC Upgrade 18,975 316 18,975 316
N
12 Ora OCTA** 6783 Countywide TLSP 174,830 2,914 197,558 3,293 E

California Department of Transportation FY 2017-18 Third Quarter Report
Proposition 1B Traffic Light Synchronization Program Page 9
Corrective Actions The City of Los Angeles recently submitted a status update on five of their projects. Two projects have submitted close-out reports, two projects will complete construction in June of 2018 and one will complete construction in December 2018. The memo providing status has been attached for reference. City of Los Angeles – ATCS - Wilshire East (Project ID 6768) Construction was completed in February 2018. The FDR was submitted in March 2018. City of Los Angeles – ATCS – Echo Park/Silver Lake Phase 2 (Project ID 6826) Construction was completed in February 2018 with the FDR submitted in March 2018. City of Los Angeles – ATCS – West Adams (Project ID 6766) The agency has completed construction as of May 2018. The Closeout Report is scheduled for submission in June 2018. City of Los Angeles – ATCS – Central Business District (Project ID 6760) Project allocation was delayed. Construction should be completed in June 2018. City of Los Angeles – ATCS – Los Angeles (Project ID 6763) The agency stated delays in construction were due to conflicts in the construction schedule between multiple projects. The project began construction in August 2017 and anticipates completing construction by December 2018. City of Los Angeles – ATSAC- Coliseum / Florence Phase 1 and 2 (Project IDs 6779,6780) Final delivery reports were submitted in Feb. 2017. Discrepencies in close-out information has been reported. The agency has been notified and will correct the problems. City of Pasadena – Total of three projects (Project IDs 6785, 6787 & 6789) The projects completed construction in August 2014. The agency stated the projects were behind schedule due to delays in design engineering. The supplemental FDR is scheduled for delivery in April. 2018. City of Pasadena – Total of three projects (Project IDs 6784, 6788, 6791) The projects completed construction in March 2016. The agency stated the projects were behind schedule due to delays in design engineering. The agency is currently working on the supplemental FDR which is scheduled for delivery in April. 2018. City of Compton – Rosecrans Avenue (Project ID 6747) The project completed construction June 2016. The agency stated delays in construction were due to conflicts in construction schedules between multiple projects. The agency is currently working on the supplemental FDR which is scheduled for delivery in April. 2018. Alameda County Congestion Management Agency – San Pablo Corridor (Project ID 6744) The project is part of a Corridor Mobility Improvement Account project currently under construction. The agency received CTC approval to split the project into 2 projects and 5 segments. The agency stated that delays were due to conflicts in construction schedules between multiple projects. The project is behind schedule by 42 months from the currently approved schedule. The agency desires to apply for surplus funds from savings derived from other TLSP projects. The agency anticipates completing construction by Dec. 2019.

FY 2017-18 Third Quarter Report
Highway Railroad Crossing Safety Account
Quarterly Report to the California Transportation
Commission

California Department of Transportation FY 2017-18, Third Quarter Report January – March 2018
Proposition 1B Highway Railroad Crossing Safety Account Page 1
PROGRAM SUMMARY:
This report is for the Highway Railroad Crossing Safety Account (HRCSA) for the third quarter of the 2017-18 fiscal year. This report includes the status of the HRCSA 2008, 2010, 2012, 2014, and 2016 program.
The HRCSA program has a total of 38 projects programmed with $250 million of which $221,592,000 has been expended, and $243,788,000 has been allocated to 37 projects. Included are the administrative costs of $5 million. Thirty-five of the allocated projects have completed construction. Four projects are pending the final project delivery report. Current estimated savings available is approximately $2.5 million. The plan for the savings is to use the funds in the winter of 2018.
FUNDING SUMMARY:
2008 Sixteen projects have been allocated in the amount of $116,682,000. The total expenditure
is $116,484,000. Sixteen projects have completed construction.
2010 Eight projects have been allocated in the amount of $66,035,000. The total expenditure is $61,133,000. Seven projects have completed construction.
2012 Twelve projects have been allocated in the amount of $42,765,000. The total expenditure
is $40,302,000. Twelve projects have completed construction.
2014 The Fullerton Road Grade Separation project has been allocated in the amount of $18,306,000. The total expenditure is $3,673,000.
2016 The Durfee Avenue Grade Separation project has been programmed in the amount of
$2,706,000. Agency has requested an allocation for HRCSA funds for the June 2018 Commission meeting.
BACKGROUND:
Proposition 1B was passed by California voters on November 7, 2006. Proposition 1B authorized $250 million for HRCSA in two parts, $150 million for projects on the Public Utilities Commission (PUC) priority list and $100 million for high-priority railroad crossing improvements, including grade separation projects. The Guidelines for HRCSA were adopted on March 12, 2008.

California Department of Transportation FY 2017-18, Third Quarter Report January – March 2018
Proposition 1B Highway Railroad Crossing Safety Account Page 2
OPEN PROJECTS (numbers in thousands)
PN-Project Number PY-Program Year PT – Part D-District C-County *Final Delivery Report (FDR) Pending*
PN PY PT D C Applicant Project Name Actual Total
Project Programmed Allocated Expended
Date Allocated
Date
Approved to Start
CON
Date CON
Started
Date Approved
to End CON
Percentage Completed
Sco
pe
Bu
dg
et
Sch
edu
le
1 10 1 7 LA City of Los Angeles
North Spring Street GS $48,766 $5,001 $5,001 $3,749 5/23/12 6/2012 5/2013 12/2014 95%
2 14 1 7 LA ACE Fullerton Road GS $153,184 $18,306 $18,306 $3,673 12/10/16 3/2016 7/2016 9/2019 22%
3 16 1-2 7 LA ACE Durfee Avenue GS $91,143 $2,706 $0 $0 - 4/2018 - 10/2020 0%
TOTALS FOR OPEN PROJECTS: $293,093 $26,013 $23,307 $7,422
Project is on-time, on-budget, and/or within scope Project behind schedule Potential schedule, scope or cost is changing, pending review and acceptance
PN-Project Number PY-Program Year PT – Part D-District C-County Date Approved to Start CON is the Approved Baseline Dates Alameda Corridor-East Construction Authority (ACE) Orange County Transportation Authority (OCTA) Peninsula Corridor Joint Powers Board (PCJPB) Southern California Regional Rail Authority (SCRRA) Completed at *100%: Projects are completed and open to traffic, but need close out reports.

California Department of Transportation FY 2017-18, Third Quarter Report January – March 2018
Proposition 1B Highway Railroad Crossing Safety Account Page 3
PROJECTS COMPLETED OPERATIONAL/FINAL REPORT SUBMITTED
(numbers in thousands)
PN-Project Number PY-Program Year PT – Part D-District C-County *Final Delivery Report (FDR) Pending*
PN PY PT D C Applicant Project Name Actual Total
Project
Approved HRCSA
Allocation
Date Allocated
Date CON Started
Actual Date CON Completed
FDR/Close Out
Report
HRCSA Final Expenditures
4 08 1 6 KER County of Kern
BNSF GS 7th Standard
Road/Santa Fe Way
$18,924 $7,044 1/13/10 2/2010 6/2013 8/2013 $7,044
5 08 1 4 SM PCJPB San Mateo Bridges GS $10,774 $955 5/19/10 11/2010 5/2013 12/2013 $955
6 08 1 4 SF PCJPB Jerrold Avenue &
Quint Street Bridges GS
$10,749 $2,668 5/13/10 11/2010 5/2013 6/2013 $2,668
7 08 1 10 MER City of Merced
G Street Undercrossing $18,162 $7,413 1/13/10 11/2010 6/2012 7/2012 $7,413
8 08 1 6 KER County of Kern
Hageman Road/BNSF
Railroad $35,997 $13,759 6/30/10 10/2010 4/2013 5/2013 $13,759
9 08 1 4 SM PCJPB San Bruno GS $160,169 $26,727 6/30/10 9/2010 7/2014 12/2014 $26,727
10 08 1 10 SJ City of Stockton
Lower Sacramento Road $23,619 $6,484 4/7/10 7/2010 9/2014 3/2015 $6,484
11 08 2 11 SD City of San Diego
Park Blvd. at Harbor
Drive/Pedestrian Bridge
$27,000 $6,000 12/10/08 6/2008 10/2011 4/2012 $6,000
12 08 2 3 SAC City of Sacramento
6th Street Overcrossing -
Bridge $9,361 $4,837 12/9/09 2/2010 6/2013 12/2013 $4,837
13 08 2 6 TUL City of Tulare
Cartmill Avenue GS $21,969 $10,051 6/30/10 12/2010 9/2012 6/2013 $10,051
14 08 2 6 TUL County of Tulare Betty Drive GS $14,070 $4,885 6/30/10 11/2010 6/2013 8/2013 $4,885
15 08 2 10 SJ Port of Stockton
Port of Stockton Expressway $8,424 $1,537 6/30/10 11/2010 11/2012 6/2013 $1,537
16 08 2 10 SJ City of Stockton
Eight Mile Road/UPRR (East) GS
$22,023 $5,280 4/07/10 7/2010 9/2014 3/2015 $5,280
17 08 2 10 SJ City of Stockton
Eight Mile Road/UPRR (West) GS
$22,751 $7,424 4/07/10 7/2010 9/2014 3/2015 $7,424
18 08 2 12 ORA OCTA Sand Canyon GS $55,590 $6,618 6/30/10 9/2011 1/2016 12/2016 $6,618

California Department of Transportation FY 2017-18, Third Quarter Report January – March 2018
Proposition 1B Highway Railroad Crossing Safety Account Page 4
PROJECTS COMPLETED (Continued)
OPERATIONAL/FINAL REPORT SUBMITTED (numbers in thousands)
PN-Project Number PY-Program Year PT – Part D-District C-County *Final Delivery Report (FDR) Pending*
PN PY PT D C Applicant Project Name Actual Total
Project
Approved HRCSA
Allocation
Date Allocated
Date CON Started
Actual Date CON
Completed
FDR/Close Out Report
HRCSA Final Expenditures
19 8 1 7 LA City of Los Angeles
Riverside Drive GS Replacement $60,964 $5,000 6/30/10 6/20/11 10/2017 *FDR Pending **$4,802
20 10 2 12 ORA OCTA San Clemente Beach Trail Crossing $4,500 $2,170 6/27/12 5/2013 6/2015 9/2015 $2,170
21 10 2 3 SAC City of
Sacramento
6th Street, Overcrossing
Roadway $15,730 $7,151 6/27/12 2/2012 6/2015 8/2015 $7,151
22 10 2 4 ALA City of Fremont Kato Road GS $52,265 $9,124 8/10/11 9/2011 5/2015 8/2015 $9,124
23 10 2 7 LA SCRRA Broadway-Brazil
Street Grade Crossing
$9,100 $233 2/22/12 3/2012 12/2013 3/2016 $233
24 10 1 6 TUL City of Tulare Bardsley Avenue GS $18,498 $7,156 5/23/12 2/2013 3/2015 9/2016 $7,027
25 10 1 7 LA ACE Nogales Street GS $85,430 $25,600 4/25/12 2/2012 10/2017 *FDR Pending **$23,867
26 10 1 4 ALA City of Fremont Warren Avenue GS $60,558 $9,600 3/28/12 6/2012 1/2017 4/2017 $7,812
27 12 2 12 ORA OCTA Dana Point & San Clemente Crossing
$4,075 $2,100 1/9/11 2/2011 1/2014 3/2014 $2,100
28 12 2 7 LA SCRRA Grandview Avenue Grade Crossing
Safety
$2,630 $580 5/7/13 3/2013 10/2014 9/2015 $580
29 12 2 7 LA SCRRA Sonora Avenue Grade Crossing
Safety
$2,630 $580 5/7/13 9/2012 10/2014 9/2015 $580
30 12 2 7 LA SCRRA Woodley Avenue Grade Crossing
Safety
$1,000 $438 12/10/16 5/2013 5/2015 3/2016 $438
31 12 1 3 SAC City of Elk Grove
Grant Line Road GS Project
$24,040 $5,000 5/3/13 12/2013 4/2016 8/2016 $3,156
32 12 1 10 SJ City of Lathrop
Lathrop Road GS with UPRR
$16,855 $5,000 5/7/13 6/2013 4/2016 9/2016 $5,000
33.1 12 1 10 SJ Port of Stockton
Navy Drive/BNSF Underpass (1 of 2)
$6,530 $3,173 6/25/14 12/2014 7/2016 8/2016 $3,173
33.2 12 1 10 SJ Port of Stockton
Navy Drive/BNSF Underpass (2 of 2)
$2,567 $2,567 6/25/14 12/2014 7/2016 8/2016 $2,567

California Department of Transportation FY 2017-18, Third Quarter Report January – March 2018
Proposition 1B Highway Railroad Crossing Safety Account Page 5
*Final Delivery Report (FDR) Pending or Past Due **Pending Final Invoice
PROJECTS COMPLETED (Continued) OPERATIONAL/FINAL REPORT SUBMITTED
(numbers in thousands)
PN-Project Number PY-Program Year PT – Part D-District C-County *Final Delivery Report (FDR) Pending*
PN PY PT D C Applicant Project Name Actual Total
Project
Approved HRCSA
Allocation
Date Allocated
Date CON Started
Actual Date CON
Completed
FDR/Close Out Report
HRCSA Final Expenditures
34 12 2 4 CC City of Richmond
Officer Bradley A. Moody/Marina Bay $42,180 $4,230 5/3/13 2/2013 7/2017 *FDR Past Due $3,975
35 12 2 6 TUL City of Tulare
Santa Fe Trail at UPRR GS $7,131 $3,931 6/25/14 2/2014 7/2016 12/2016 $3,931
36 12 2 7 LA SCRRA Branford Road Grade Crossing
Safety $2,526 $1,325 12/11/13 3/2013 11/2016 6/2017 $1,220
37 12 1 4 SM PCJPB San Mateo Bridges GS Project, Phase II $41,223 $9,000 5/21/14 5/2014 9/2016 12/2017 $8,864
38 12 2 7 LA SCRRA Moorpark Avenue GS Safety $5,041 $4,841 6/25/14 12/2014 2/2017 *FDR Past Due **$4,718
TOTALS FOR COMPLETED PROJECTS PROGRAMMED IN 2008, 2010 AND 2012:
$925,055 $220,481 $214,170

California Department of Transportation FY 2017-18, Third Quarter Report January – March 2018
Proposition 1B Highway Railroad Crossing Safety Account Page 6
The original approved baseline benefits were not quantitative, but new measures have been implemented during the final project closeout. In the table below, Yes or No output met the qualitative achieved benefits. The Congestion Reduction and Emissions Reductions output were based on the reported calculated value. Currently, 35 out of 38 projects have been completed, and those projects have achieved all of the category benefits identified in the original baseline.
HRCSA BOND PROGRAM PERFORMANCE OUTCOME – BENEFITS FOR OPEN PROJECTS
PN-Project Number PY-Program Year D-District C-County
PN PY D C Applicant Project Name Safety Velocity Throughput Reliability
Yes/No Yes/No Yes/No Yes/No
1 10 7 LA City of Los Angeles North Spring Street Grade Separation Yes Yes Yes Yes
2 14 7 LA ACE Fullerton Road Grade Separation Yes Yes Yes Yes
3 16 7 LA ACE Durfee Avenue Grade Separation Yes Yes Yes Yes

California Department of Transportation FY 2017-18, Third Quarter Report January – March 2018
Proposition 1B Highway Railroad Crossing Safety Account Page 7
HRCSA BOND PROGRAM PERFORMANCE OUTCOME – BENEFITS FOR CLOSED PROJECTS
PN-Project Number PY-Program Year D-District C-County DVHD-Daily Vehicle Hours of Delay
PN PY D C Applicant Project Name Safety Velocity Throughput Reliability Congestion Reduction (DVHD)
Emissions Reductions Yearly
Yes/No Yes/No Yes/No Yes/No Reported Reported
4 08 6 KER County of Kern
BNSF GS 7th Standard
Road/Santa Fe Way Yes Yes Yes Yes
5 08 4 SM PCJPB San Mateo Bridges GS Yes Yes Yes Yes
6 08 4 SF PCJPB Jerrold Avenue &
Quint Street Bridges GS
Yes Yes Yes Yes
7 08 10 MER City of Merced
G Street Undercrossing Yes Yes Yes Yes 1,369 lbs. criteria pollutants
8 08 6 KER County of Kern
Hageman Road/BNSF
Railroad Yes Yes Yes Yes
9 08 4 SM PCJPB San Bruno GS Yes Yes Yes Yes 1.5 hours DVHD
10 08 10 SJ City of Stockton
Lower Sacramento Road Yes Yes Yes Yes 27.5 hours DVHD 2,500 kilograms
11 08 11 SD City of San Diego
Park Blvd. at Harbor Drive/Pedestrian
Bridge Yes Yes Yes Yes
12 08 3 SAC City of Sacramento
6th Street Overcrossing -
Bridge Yes Yes Yes Yes
13 08 6 TUL City of Tulare Cartmill Avenue GS Yes Yes Yes Yes
14 08 6 TUL County of Tulare Betty Drive GS Yes Yes Yes Yes
15 08 10 SJ Port of Stockton
Port of Stockton Expressway Yes Yes Yes Yes 1 hour DVHD 36.7 tons criteria pollutants,
4,500 tons CO2

California Department of Transportation FY 2017-18, Third Quarter Report January – March 2018
Proposition 1B Highway Railroad Crossing Safety Account Page 8
HRCSA BOND PROGRAM PERFORMANCE OUTCOME – BENEFITS FOR CLOSED PROJECTS
PN-Project Number PY-Program Year D-District C-County NP-Not Provided DVHD-Daily Vehicle Hours of Delay
PN PY D C Applicant Project Name Safety Velocity Throughput Reliability Congestion Reduction (DVHD) Emissions Reductions Yearly
Yes/No Yes/No Yes/No Yes/No Reported Reported
16 08 10 SJ City of Stockton
Eight Mile Road/UPRR (East) GS
Yes Yes Yes Yes 18 hours DVHD 1,700 kilograms criteria pollutants
17 08 10 SJ City of Stockton
Eight Mile Road/UPRR (West)
GS Yes Yes Yes Yes 33 hours DVHD 3,200 kilograms criteria pollutants
18 08 12 ORA OCTA Sand Canyon GS Yes Yes Yes Yes 50 hours DVHD
19 08 7 LA City of Los Angeles
Riverside Drive Grade Separation
Replacement Yes Yes Yes Yes Pending Pending
20 10 2 ORA OCTA San Clemente
Beach Trail Crossing
Yes Yes Yes Yes Non Traffic Non Traffic
21 10 2 SAC City of Sacramento
6th Street, Overcrossing
Roadway Yes Yes Yes Yes 28 hours DVHD 386 tons ROG, 5343 tons NOx,
202 tons PM2.5
22 10 2 ALA City of Fremont Kato Road GS Yes Yes Yes Yes 13 hours DVHD 110 tons GHG
23 10 2 LA SCRRA Broadway-Brazil
Street Grade Crossing
Yes Yes Yes Yes 2 hours DVHD 1 ton of CO2
24 10 1 TUL City of Tulare Bardsley Avenue GS Yes Yes Yes Yes 1 hour DVD 1 ton of criteria pollutants
25 10 1 LA ACE Nogales Street GS Yes Yes Yes Yes Pending Pending
26 10 1 ALA City of Fremont Warren Avenue GS Yes Yes Yes Yes 56 hours DVHD
27 12 2 ORA OCTA Dana Point & San
Clemente Crossing
Yes Yes Yes Yes
28 12 2 LA SCRRA Grandview Avenue
Grade Crossing Safety
Yes Yes Yes Yes 2 hours DVHD 1 ton of CO2
29 12 2 LA SCRRA Sonora Avenue Grade Crossing
Safety Yes Yes Yes Yes 2 hours DVHD 1 ton of CO2

California Department of Transportation FY 2017-18, Third Quarter Report January – March 2018
Proposition 1B Highway Railroad Crossing Safety Account Page 9
HRCSA BOND PROGRAM PERFORMANCE OUTCOME – BENEFITS FOR CLOSED PROJECTS
PN-Project Number PY-Program Year D-District C-County NP-Not Provided DVHD-Daily Vehicle Hours of Delay
PN PY D C Applicant Project Name Safety Velocity Throughput Reliability Congestion Reduction
(DVHD)
Emissions Reductions Yearly Yes/No Yes/No Yes/No Yes/No Reported Reported
30 12 2 LA SCRRA Woodley Avenue Grade Crossing
Safety Yes Yes Yes Yes 2 hours DVHD 1 ton of CO2
31 12 1 SAC City of Elk Grove
Grant Line Road GS Project Yes Yes Yes Yes 17 hours DVHD 2 tons of criteria pollutants
32 12 1 SJ City of Lathrop
Lathrop Road GS with UPRR Yes Yes Yes Yes 49.5 hours DVHD 10,783 kilograms criteria pollutants
33.1 12 1 SJ Port of Stockton
Navy Drive/BNSF Underpass (1 of 2) Yes Yes Yes Yes 881 hours DVHD 16 tons of criteria pollutants
33.2 12 1 SJ Port of Stockton
Navy Drive/BNSF Underpass (2 of 2) Yes Yes Yes Yes 881 hours DVHD 16 tons of criteria pollutants
34 12 2 CC City of Richmond
Officer Bradley A. Moody/Marina Bay Pending Pending Pending Pending Pending Pending
35 12 2 TUL City of Tulare
Santa Fe Trail at UPRR GS Yes Yes Yes Yes Non Traffic Non Traffic
36 12 2 LA SCRRA Branford Road Grade Crossing
Safety Yes Yes Yes Yes 2 hours DVHD 1 ton of CO2
37 12 4 SM PCJPB San Mateo Bridges GS Project, Phase II Yes Yes Yes Yes
38 12 7 LA SCRRA Moorpark Avenue GS Safety Pending Pending Pending Pending Pending Pending

California Department of Transportation FY 2017-18, Third Quarter Report January – March 2018
Proposition 1B Highway Railroad Crossing Safety Account Page 10
REASON FOR DELAY: PROJECT 1: City of Los Angeles – North Spring Street Grade Separation The project is behind schedule due to several factors: unforeseen soil conditions, permit issues, river conditions, utility and easement delays with the vendors, and bridge work delays. Utility relocations, all foundation work, all pier walls and abutments, the approach decks, the concrete arches, the deck across the river, and fiber wrap of the existing superstructure are complete. Currently, sidewalk curb and gutter work at the East approach is on-going. Anticipate final closeout summer 2018. PROJECT 3: Alameda Corridor East Construction Authority – Durfee Avenue The agency has requested an allocation for the HRCSA funds for the June 2018 Commission meeting. The project was behind schedule due to right of way issues and delays in Union Pacific Railroad reviews of project plans. PROJECT 19: CLOSED PROJECT – FINAL DELIVERY REPORT PENDING: City of Los Angeles – Riverside Drive Grade Separation Replacement The project was completed and accepted by the City as of October 1, 2017. City of Los Angeles, Bureau of Contract Administration, performing labor compliance final review. Anticipate final closeout by summer 2018. PROJECT 25: CLOSED PROJECT – FINAL DELIVERY REPORT PENDING: Alameda Corridor East Construction Authority – Nogales Street Grade Separation Project was completed and open to traffic. The landscaping irrigation controller issue with the City of Industry, pump station issue with Rowland Water District and additional work requested by Caltrans and County of Los Angeles had all been completed. Anticipate final closeout by June 2018. PROJECT 34: CLOSED PROJECT - FINAL DELIVERY REPORT PENDING: City of Richmond – Officer Bradley A. Moody/Marina Bay All required drainage improvements have now been installed. The punch list work for the pump station telemetry and landscaping is 100 percent complete. No other construction activities are required. The full and final project closeout phase is now initiated. Anticipate final closeout by summer 2018. PROJECT 38: CLOSED PROJECT – FINAL DELIVERY REPORT PENDING: Southern California Regional Rail Authority – Moorpark Avenue Grade Separation Completed negotiations of final change orders with the contractor. Contractor has provided all remaining back up information on the claims. Final change order payment was approved by the Board and was paid to the contractor. Anticipate final closeout by May 2018.

FY 2017-18 Third Quarter Report
Intercity Rail
Improvement Program
Quarterly Report to the California Transportation
Commission

California Department of Transportation FY 2017-18 Third Quarter Report January – March 2018
Proposition 1B Intercity Rail Improvement Program 1 of 7
SUMMARY This report is for the third quarter of Fiscal Year (FY) 2017-18 for the Proposition 1B Intercity Rail Improvement Program (IRI), which consists of 28 projects. To date, the California Transportation Commission (CTC) has allocated a total of $335,111,993 in funding to 24 projects; 7 projects totaling $180,426,000 are currently in construction, 17 projects totaling $162,099,000 are completed with $154,579,993 in expenditures and a potential for approximately $6,000,000 in savings and $8,000,000 for administration, and 4 projects totaling $50,756,000 remain unallocated. BACKGROUND Proposition 1B was passed by California voters on November 7, 2006, and provides $400 million, upon appropriation by the Legislature, to the California Department of Transportation for intercity passenger rail improvement projects. A minimum of $125 million is designated for procurement of additional intercity passenger railcars and locomotives. This $400 million program is part of the $4 billion Proposition 1B Public Transportation Modernization, Improvement, and Service Enhancement Account (PTMISEA). This Account is to be used to fund public transportation projects. Pursuant to paragraph (2) of subdivision (c) of section 8879.50 of the Government Code, the Department is the administrative agency for PTMISEA. The Commission approved the guidelines for intercity passenger rail projects in the PTMISEA. At its February 2008 meeting, the Commission approved the list of Proposition 1B intercity rail projects to be funded in the IRI.

California Department of Transportation FY 2017-18 Third Quarter Report January – March 2018
Proposition 1B Intercity Rail Improvement Program 2 of 7
PR
OJE
CT N
UM
BER
CO
RR
IDO
R AG
ENCY
PR
OJE
CT T
ITLE
D
ELIV
ERY
PH
ASE
AL
LOCA
TIO
N
DAT
E
BE
GIN
PH
ASE
EN
D P
HAS
E
EN
D
CLO
SEO
UT
PRO
GRA
MM
ED
SCO
PE
BUD
GET
SCH
EDU
LE
4.2
PS
LACMTA
Raymer to Bernson Double Track
CON
9/1/2020
3/1/2021
2/29/2024
12/31/2024
$12,980
9.2
PS
Caltrans, UPRR
Seacliff Siding
CON
10/01/2020
01/01/2021
12/31/2023
09/01/2024
$20,526
11
CC,PS,SJ Capitol Corridor,
LOSSAN, San Joaquin
Capitalized Maintenance
CON
VAR
VAR
VAR
VAR
$1,025
21.2
CC CCJPA
Sacramento to Roseville 3rd Track
CON
03/01/2019
10/01/2019
09/01/2022
03/01/2023
$16,225
CC Capitol Corridor PS Pacific Surfliner SJ San Joaquin
TOTAL
$50,756
PROPOSITION 1B INTERCITY RAIL IMPROVEMENT PROGRAM UNALLOCATED PROJECTS
(NUMBERS IN THOUSANDS)
No Known Scope, Budget, or Schedule Impact Known Scope, Budget, or Schedule Impact Potential Impact

California Department of Transportation FY 2017-18 Third Quarter Report January – March 2018
Proposition 1B Intercity Rail Improvement Program 3 of 7
PRO
JECT
N
UM
BER
CO
RR
IDO
R
AG
ENCY
PR
OJE
CT
TITL
E
D
ELIV
ERY
PH
ASE
AL
LOCA
TIO
N
DAT
E
BE
GIN
PH
ASE
EN
D
PHAS
E
%
CO
MPL
ETE
EN
D
CLO
SEO
UT
PR
OG
RAM
MED
AL
LOCA
TED
EXPE
ND
ITU
RES
SCO
PE
BUD
GET
SCH
EDU
LE
1.1
CC, PS, SJ
Caltrans
Procurement of Locomotives and Railcars
CON
12/2011
11/2012
09/2018
15%
03/2019
$42,000
$42,000
$11,941
1.2
CC, PS, SJ
Caltrans
Option Locomotives
CON
12/2014
10/2015
09/2019
14%
03/2020
$103,000
$103,000
$10,666
5.2
PS
SCRRA
Van Nuys North Platform
CON
01/2016 04/2017 04/2019 22%
01/2020
$30,500
$30,500
$2,635
8
CC
CCJPA
Wayside Power and Storage
CON
05/2016
05/2016
05/2019
82%
11/2019
$900
$900
$690
9.1
PS
Caltrans, UPRR
Seacliff Siding
PA&ED
10/2016
11/2013
06/2019
30%
12/2019
$1,000
$1,000
$7
20
PS
North County Transit District
Left Hand Turnout Project
CON
03/2017
9/2017
3/2019
0%
6/2019
$1,000
$1,000
$0
21.1
CC
CCJPA
Sacramento to Roseville third track phase 1
PS&E ROW
06/2017
01/2018
06/2019
0%
06/2019
$2,026
$2,026
$0
CC Capitol Corridor PS Pacific Surfliner SJ San Joaquin
TOTALS
$180,426
$180,426
$25,939
PROPOSITION 1B INTERCITY RAIL IMPROVEMENT PROGRAM ALLOCATED PROJECTS
(NUMBERS IN THOUSANDS)
No Known Scope, Budget, or Schedule Impact Known Scope, Budget, or Schedule Impact Potential Impact

California Department of Transportation FY 2017-18 Third Quarter Report January – March 2018
Proposition 1B Intercity Rail Improvement Program 4 of 7
PR
OJE
CT
NU
MBE
R
COR
RID
OR
AG
ENCY
PR
OJE
CT
TITL
E PR
OJE
CT
PHAS
E
ALL
OC
ATI
ON
D
ATE
BEG
IN P
HAS
E
EN
D
PHAS
E EN
D
CLO
SEO
UT
PR
OG
RAM
MED
AL
LOCA
TED
EXPE
ND
ITU
RES
CLO
SE O
UT
REP
ORT
R
ECIE
VED
1.3
CC, PS, SJ
Caltrans
On-Board Information System (OBIS)
CON
12/2014
04/2012
06/2017
06/2017
$5,000,000
$5,000,000
$5,000,000
2.1
PS
SANDAG
San Onofre to Pulgas Double Track Phase 1 & 2
PA&ED
01/2010
01/2010
05/2011
06/2017
$3,146,000
$3,146,000
$3,146,000
2.2
PS
SANDAG
San Onofre to Pulgas Double Track Phase 2 PS&E
09/2015
09/2015
02/2015
06/2017
$1,100,000
$1,100,000
$972,000
2.3
PS
SANDAG
San Onofre to Pulgas Double Track Phase 1
CON
03/2013
09/2013
06/2016
06/2017
$25,754,000
$25,754,000
$25,284,000
3
SJ
Caltrans
Oakley-Port Chicago Double Track Segment 3
CON
10/2011
12/2012
02/2017
08/2017
$25,450,000
$25,450,000
$23,150,000
5.1
PS
SCRRA
Van Nuys North Platform
PS&E
12/2013
06/2014
02/2017
08/2017
$4,000,000
$4,000,000
$3,532,185
4.1
PS
LACMTA
Raymer to Bernson Double Track
PS&E
01/2014
04/2014
06/2016
12/2016
$6,500,000
$6,500,000
$6,080,563
12
PS
Caltrans
Commerce/Fullerton Triple Track
CON
08/2008
02/2009
06/2012
05/2013
$31,992,000
$31,992,000
$31,992,000
13
PS
Caltrans
New Station Track at LA Union Station
CON
04/2008
07/2009
06/2015
12/2015
$21,800,000
$21,800,000
$19,453,245
14
SJ
Caltrans
Kings Park Track and Signal Improvements
CON
08/2008
10/2008
06/2012
10/2012
$3,500,000
$3,500,000
$3,500,000
15
CC, SJ
Caltrans
Wireless Network for Northern California
IPR Fleet
CON
01/2011
04/2011
06/2015
06/2015
$3,750,000
$3,750,000
$2,927,000
16
PS
Caltrans
Santa Margarita Bridge and Double Track
CON
04/2008
08/2008
05/2014
12/2015
$16,206,000
$16,206,000
$15,748,000
17
CC, SJ
Caltrans
Emeryville Station and Track Improvements
CON
05/2008
09/2008
07/2012
07/2012
$6,151,000
$6,151,000
$6,151,000
18
CC
Caltrans
Bahia Benicia Crossover
CON
04/2008
09/2008
07/2012
03/2014 $3,445,000
$3,445,000
$3,445,000
19
PS
Caltrans
SCRRA Sealed Corridor
CON
04/2008
11/2011
07/2012
03/2014
$2,782,000
$2,782,000
$2,782,000
6
CC
CCJPA
Capital Corridor Track, Bridge and Signal
Upgrade
CON
05/2014
06/2014
05/2017
11/2017
$1,305,000
$1,305,000
$1,305,000
7
PS
SCRRA
Ventura County Sealed Corridor Crossing
Improvement
CON
08/2014
12/2014
03/2018
04/2017
$218,000
$218,000
$112,000
CC Capitol Corridor PS Pacific Surfliner SJ San Joaquin
TOTALS
$162,099,000
$162,099,000
$154,579,993
PROPOSITION 1B INTERCITY RAIL IMPROVEMENT PROGRAM COMPLETED PROJECTS
No Known Scope, Budget, or Schedule Impact Known Scope, Budget, or Schedule Impact Potential Impact
Proposition 1B Intercity Rail Improvement Program 5 of 7
ACTION PLANS Project 1.1 - Procurement of Locomotives, Railcars and Install On-Board Information System
Statute requires at least $125 million be used for the procurement of intercity passenger railcars and locomotives. A total of $150 million was allocated for new railcars, new locomotive and on-board passenger information systems. A significant delay for bi-level railcar due to design, testing issues and the sub-contractor no longer able to perform. A new sub-contractor has been secured and will produce single level railcars. There will be 22 locomotives and 49 railcars constructed. Project 11 – Capitalized Maintenance This is strategized to use as Rail funds spread over three corridors to develop funding. Scope, schedule and budget yet to be determined. Capitalized maintenance work includes activities to maintain and upgrade the physical assets of the railroad. This work includes the following types of projects: track geometry maintenance, replacement of railroad diamonds, replacement of ties or switch ties, upgrade mainline switch points, replace turnout components or complete turnouts, replace railroad crossing components, tie and fastener maintenance, ballast maintenance and signal maintenance.

California Department of Transportation FY 2017-18 Third Quarter Report January – March 2018
Completed project benefits: Yes = Project benefit No = No project benefit
Project Name
New Track
Capacity
Increased Speed
Reliability
Safety
Other
Emeryville Station & Track
Yes No Yes Yes Yes No
Kings Park Track & Signal
Yes No Yes Yes Yes No
Commerce to Fullerton Triple Track Segment 6
Yes Yes Yes Yes Yes No
SCRRA Sealed Corridor
Yes No Yes Yes Yes Yes
Bahia Benicia Crossover & Track
Yes Yes Yes Yes No No
Santa Margarita River Bridge & Double Track
Yes Yes Yes Yes Yes No
New Station Track at LA Union Station
Yes Yes Yes Yes Yes Yes
Wireless Network for North Cal IPR Fleet
No Yes No No No Yes
Oakley to Port Chicago Double Track Segment 3
Yes Yes Yes Yes No No
San Onofre to Pulgas Double Track Phase 1
Yes Yes Yes Yes Yes No
On-Board Information Systems 1.3
No No No No No Yes
Totals 9 7 9 9 7 4
Out of 11 projects nine were new track, seven were capacity, nine were increased speed, nine were reliable, seven were safety and four were other.
Proposition 1B Intercity Rail Improvement Program 6 of 7

California Department of Transportation FY 2017-18 Third Quarter Report January – March 2018
Active and unallocated project benefits:
Yes = Project benefit No = No project benefit
Project Name
New Track
Capacity
Increased Speed
Reliability
Safety
Other
Locomotives & Railcars 1.1
No Yes Yes Yes Yes No
Option Locomotives 1.2
No Yes Yes Yes Yes No
Van Nuys 5.2 Yes No No Yes No No
Capital Corridor Track, Bridge & Signal Upgrade 6
Yes Yes Yes Yes Yes No
Ventura County Sealed 7
No Yes Yes Yes Yes No
Wayside Power Storage 8
No No No Yes Yes Yes
Seacliff Siding Extension 9
No Yes Yes Yes Yes No
Left Hand Turnout 20
No Yes Yes Yes Yes No
Sacramento to Roseville Third Track Phase 1
Yes Yes Yes Yes No No
Raymer to Bernson Double Track
Yes Yes Yes Yes Yes No
Capitalized Maintenance
No Yes Yes Yes Yes No
Totals 4 9 9 11 9 2
Out of 11 projects four were new track, nine were capacity, nine were increased speed, eleven were reliable, nine were safety and one was other.
Proposition 1B Intercity Rail Improvement Program 7 of 7

FY 2017-18 Third Quarter Report
Trade Corridors
Improvement Fund Program
Quarterly Report to the California Transportation
Commission

California Department of Transportation FY 2017-18 Third Quarter Report
Page 1
SUMMARY This report covers the third quarter of Fiscal Year (FY) 2017-18 (January through March) for the Trade Corridors Improvement Fund (TCIF) program. At the close of the third quarter, there were a total of 100 projects with a TCIF programmed value of $2,445,665,000 and a total project value of $9,431,767,000. The California Transportation Commission (Commission) has approved all baseline agreements. The Commission updated the Savings Policy to extend the savings utilization deadline by three years. Newly programmed projects must be allocated by June 2019 and awarded by December 2019.
To date, 97 projects have received bond allocations totaling $2,426,416,960. Sixty-six of the allocated projects have been completed. The available unallocated TCIF funds from savings, total $23,583,040, of which $12,152,215 is available for programming.
Target Available per AB 268 Programmed Allocated
Available Funds Unallocated
SCCG Total $1,500,000,000 $1,496,358,000 $1,484,935,000 $15,065,000 Bond $1,200,205,000 $1,196,563,000 $1,185,140,000 $15,065,000
SHOPP $299,795,000 $299,795,000 $299,795,000 $0 NCTCC Total $640,000,000 $639,307,000 $639,307,000 $693,000
Bond $449,795,000 $449,111,000 $449,111,000 $684,000 SHOPP $190,205,000 $190,196,000 $190,196,000 $9,000
SDBR - Bond $250,000,000 $249,999,960 $242,174,960 $7,825,040 OTHER - Bond $60,000,000 $60,000,000 $60,000,000 $0 TOTAL $2,450,000,000 $2,445,664,960 $2,426,416,960 $23,583,040
The benefits derived from the completed grade separation, new and relocated railroad tracks, and operations improvements include congestion and emission reductions, safety enhancements, increased velocity, and reliability. CURRENT STATUS The tables below show the actions that were taken during this quarter. The spreadsheets that follow separate the projects into three categories: Projects Unallocated, Projects Allocated, and Projects Completed. Project Benefits The Baseline benefits shown on pages 9-14 are all submitted by the local agencies and show the actual benefits after construction completion as compared to the benefits stated in their original TCIF baseline agreement. From all the closeouts submitted, twenty-one projects reported actual benefits for safety, velocity, throughput, reliability, congestion reduction and emissions reduction. Some projects submitted a closeout report for partial benefits, and noted that the remaining benefits will be captured at the Supplemental Closeout Report. Benefits for segmented projects will be achieved once all segments have completed construction.
Trade Corridors Improvement Fund Progress Report

California Department of Transportation FY 2017-18 Third Quarter Report
Page 2
Allocations ID D Co. Rte. Project Title/Amendment Resolution Bond
$ x1000 Total
$ x1000 Action
127 3 SAC State Route 99 Auxiliary lanes Project,
Resolution TCIF-A-1718-03, Approved 1/31/18 $900 $7,095 Allocation
Programming Actions ID D Co. Rte. Project Title/Amendment Resolution Bond
$ x1000 Total
$ x1000 Action
127 3 SAC State Route 99 Auxiliary lanes Project,
Resolution TCIF-P-1718-07, Approved 1/31/18 $900 $7,095 Program project
into TCIF
Baseline Agreement Approvals ID D Co. Rte. Project Title/Amendment Resolution Bond
$ x1000 Total
$ x1000 Action
127 3 SAC State Route 99 Auxiliary lanes Project,
Resolution TCIF-P-1718-08B, Approved 1/31/18 $900 $7,095 Approve Baseline
Baseline Agreement Amendments ID D Co. Rte. Project Title/Amendment Resolution Bond
$ x1000 Total
$ x1000 Action
68.2A 11 SD SR 11/Otay Mesa East Port of Entry
[Segment 2A: SR 11-Construct 4-lane highway project] Resolution TCIF-P-1718-09, Approved 1/31/18
$7,825 $60,453 Program TCIF savings to new project: Segment 2A
Environmental Actions None this quarter
BACKGROUND The Highway Safety, Traffic Reduction, Air Quality, and Port Security Bond Act of 2006, approved by the voters as Proposition 1B on November 7, 2006, provided $2 billion for the TCIF. In the TCIF Guidelines, the Commission recognized the need for goods movement improvements far exceed the amount authorized in the TCIF program, that other funding sources should be explored, and that delivery challenges could limit project funding. The Commission supported increasing TCIF funding by approximately $500 million from the State Highway Account to fund state-level priorities that are critical to goods movement.

California Department of Transportation Trade Corridors Improvement Fund Delivery Report Schedule and Cost
Unallocated Projects
TCIF Project Delivery Report3rd Quarter FY 2017-18
(January through March 2018)
Page 3
Phase Complete No Known Scope, Budget, or Schedule Impact Known Scope, Budget, or Schedule Impact Potential Impact
PRO
JEC
T N
UM
BER
DIS
TRIC
T
CO
UN
TY
NO
MIN
ATED
BY
RO
UTE
PRO
JEC
TD
ESC
RIP
TIO
N
DIV
ISIO
N
END
ENVI
RO
END
DES
IGN
END
RIG
HT
OF
WAY
BEG
INC
ON
STR
APPR
OVE
D E
ND
C
ON
STR
CU
RR
ENT
PHAS
E(%
CO
MPL
ETE)
TOTA
L PR
OJE
CT
CO
ST (x
1,00
0)
TCIF
CO
ST(x
1,0
00)
ENVI
RO
CO
ST(P
AED
) (x
1,00
0)
DES
IGN
CO
ST
(PSE
)(x
1,00
0)
RIG
HT
OF
WAY
C
OST
(X1,
000)
CO
NST
R C
OST
(X1,
000)
SCO
PE
BUD
GET
SCH
EDU
LE
68.2A 11 SD San Diego Association of Governments
11 SR 11/Otay Mesa East Port of Entry[Segment 2A - SR 11 - Constuct 4-lane highway project]
DPM 04/30/12 04/22/18 04/01/18 07/30/18 07/20/20 Env 100%Des 0% Const
$60,453 $7,825 $0 $0 $0 $60,453
117 8 RIV Riverside County ACE: Avenue 66/UP Railroad Grade Separation Bypass
DLA 7/29/2017 12/29/2017 7/29/2018 7/30/2019 7/29/2021 Env 100%Des 0% RW 0%Const
$39,080 $5,709 $2,530 $2,350 $2,500 $31,700
123 12 ORA Orange County Transportation Authority
San Juan Creek Bridge Replacement DPM 2/28/2017 5/31/2017 2/6/2018 10/31/18 10/31/20 Env 0%Des 0% RW 0%Const
$34,200 $3,094 $0 $0 $0 $34,200
125 7 LA Alameda Corridor East Construction Authority
Durfee Avenue Grade Separation Project DLA 7/31/2014 11/30/2017 10/31/2017 04/30/18 10/31/20 Env 100%Des 0% RW 0%Const
$91,143 $2,620 $0 $9,046 $32,624 $49,473
224,876$ 19,248$

California Department of Transportation Trade Corridors Improvement Fund Delivery Report Schedule and CostAllocated Projects
TCIF Project Delivery Report3rd Quarter FY 2017-18
(January through March 2018)
Page 4
Behind Schedule No Known Scope, Budget, or Schedule ImpactAwarded / Begin Construction Known Scope, Budget, or Schedule ImpactAllocated but Not Awarded Potential Impact
PR
OJE
CT
NU
MB
ER
DIS
TRIC
T
CO
UN
TY
NO
MIN
ATE
D B
Y
RO
UTE
PR
OJE
CT
DE
SC
RIP
TIO
N
ALL
OC
ATI
ON
DA
TE
AW
AR
D D
ATE
BE
GIN
CO
NS
TR
AP
PR
OV
ED
EN
D
CO
NS
TR
CU
RR
EN
T P
HA
SE
(% C
OM
PLE
TE)
AP
PR
OV
ED
EN
D
CLO
SE
OU
T
TOTA
L P
RO
JEC
T C
OS
T (x
1,00
0)
TCIF
CO
ST
(x 1
,000
)
EN
VIR
O C
OS
T(P
AE
D) (
x 1,
000)
DE
SIG
N C
OS
T (P
SE
)(x 1
,000
)
RIG
HT
OF
WA
YC
OS
T (X
1,00
0)
CO
NS
TR C
OS
T(X
1,00
0)
CO
NS
TRE
XP
EN
DIT
UR
ES
(X1,
000)
SC
OP
E
BU
DG
ET
SC
HE
DU
LE
3.1 4 ALA Port of Oakland/City of Oakland
Outer Harbor Intermodal Terminals (OHIT)[Segment 1-Environmental Remediation]
N/A 01/01/10 10/15/18 Const 99% 04/16/19 $11,400 $0 $0 $0 $0 $11,400 $11,488
3.3 4 ALA Port of Oakland/City of Oakland
Outer Harbor Intermodal Terminals (OHIT)[Segment 3 - City Site Prep Work and Backbone Infrastructure 3]
05/07/13 10/14/13 10/15/18 Const 99%Design-Build
04/16/19 $247,241 $176,341 $4,500 $25,900 $0 $216,841 $261,241
3.4 4 ALA Port of Oakland/City of Oakland
Outer Harbor Intermodal Terminals (OHIT)[Segment 4 - Recycling Facilities]
N/A 06/30/13 07/31/18 Const 0% 12/31/18 $46,600 $0 $0 $600 $0 $46,000
3.5 4 ALA Port of Oakland/City of Oakland
Outer Harbor Intermodal Terminals (OHIT)[Segment 5 - City Trade and Logistics Facilities]
N/A 12/31/19 Const 22% 06/30/20 $99,400 $0 $0 $3,500 $0 $95,900 $26,187
4 4 ALA Metropolitan Transportation Commission
880 I-880 Reconstruction, 29th & 23rd Avenues, Oakland [SHOPP/TCIF]
08/06/13 04/30/14 07/31/17 Const 72% 08/31/18 $97,912 $73,000 $4,200 $7,387 $6,325 $80,000 $61,270
11 10 SJ Port of Stockton / Contra Costa County
San Francisco Bay to Stockton Ship Channel Deepening Project
05/23/12 06/29/12 11/30/13 Const 98% 06/30/14 $15,000 $7,200 $100 $500 $0 $14,400 $5,476
15.01 7 LA Alameda Corridor East Construction Authority
San Gabriel Valley Grade Separation Program[Phase I - Archaeological Services]
10/26/11 08/22/11 09/30/17 Const 93% 10/31/18 $4,000 $4,000 $0 $0 $0 $4,000
15.02 7 LA Alameda Corridor East Construction Authority
San Gabriel Valley Grade Separation Program[Phase II - Trench and Fiber Optic relocation]
10/26/11 07/23/12 09/30/17 Const 94% 10/31/18 $302,758 $233,778 $0 $34,021 $33,034 $235,703 $323,548
15.12 7 LA Alameda Corridor East Construction Authority
San Gabriel Valley Grade Separation Program[Motebello Corridor - Match]
N/A 11/30/19 11/30/22 RW %Const %
05/31/23 $142,000 $0 $8,738 $28,771 $40,872
21 7 LA City of Commerce Washington Boulevard Widening & Reconstruction 06/25/14 12/02/14 03/01/16 Const 95% 07/01/16 $32,000 $5,800 $39 $2,524 $3,198 $26,239 $18,795
23 7 LA Port of Long Beach 710 Gerald Desmond Bridge Replacement[Design-Build] [SHOPP/TCIF]
06/22/11 10/01/12 Design-Build 06/27/16 Const 83% 09/26/16 $1,336,061 $299,795 $11,862 $38,239 $324,700 $961,260 $733,131
46 8 RIV City of Banning Sunset Avenue Grade Separation 06/11/13 12/03/13 02/28/16 Const 95% 08/01/16 $33,042 $8,278 $900 $2,300 $1,142 $28,700 $2,572 53 8 RIV Riverside County Grade Separation at Magnolia Avenue Railroad
Grade Crossing - BNSF06/11/13 12/10/13 06/01/16 Const 97% 11/30/16 $51,609 $17,673 $563 $3,700 $1,923 $45,423 $43,230
54 8 RIV City of Riverside 215 March Island Cargo Port Airport -
I-215 Van Buren Boulevard - Ground Access Improvements
10/26/11 08/13/12 04/30/14 Const 99% 09/30/14 $66,776 $8,835 $3,463 $4,786 $7,000 $51,527 $37,897
68.2 11 SD San Diego Association of Governments
11 SR 11/Otay Mesa East Port of Entry[Segment 2 - SR 11 and Commercial Vehicle Enforcement Facility]
N/A 10/30/13 06/30/16 Des 45%Const %
10/30/18 $245,400 $0 $0 $17,500 $52,000 $175,900 $0
68.3 11 SD San Diego Association of Governments
11 SR 11/Otay Mesa East Port of Entry[Segment 3 - East Otay Mesa Land POE]
N/A 09/30/13 03/31/16 Des 40%Const %
04/30/18 $336,900 $0 $0 $10,000 $41,900 $285,000 $0
91 7 VEN Ventura County Transportation Commission
101 Route 101 Improvements 06/11/13 11/21/13 08/10/15 Const 99% 12/08/15 $46,525 $10,346 $1,600 $5,197 $500 $39,228 $38,350
92.3 3 YOL Port of West Sacramento West Sacramento/Port of West Sacramento Rail Plan [Phase 3 - Washington Overpass]
N/A 06/01/13 07/01/13 Const 0% 12/01/13 $1,540 $0 $0 $0 $0 $1,540
92.4 3 YOL Port of West Sacramento West Sacramento/Port of West Sacramento Rail Plan [Phase 4 - Loop Track]
N/A 01/15/14 08/15/14 Const 0% 12/01/14 $1,124 $0 $3 $100 $5 $1,016
95 7 LA Alameda Corridor East Construction Authority
ACE Puente Avenue Grade Separation 03/20/14 06/23/14 09/30/17 Const 92% 03/31/18 $99,019 $48,000 $300 $9,090 $32,868 $56,761 $41,240
96 7 LA Alameda Corridor East Construction Authority
ACE Fairway Drive Grade Separation 06/25/14 10/27/14 06/30/18 Const 44% 12/31/18 $142,213 $71,000 $300 $8,456 $38,655 $94,802 $37,887
99 12 ORA Orange County Transportation Authority
Raymond Avenue Grade Separation 01/29/14 02/04/14 07/15/18 Const 99% 07/15/21 $112,190 $11,890 $0 $5,370 $34,901 $71,919 $63,383
103 4 SOL City of Fairfield Fairfield/Vacaville Intermodal Station - New track and Grade Separation
08/20/14 11/18/14 11/01/16 Const 91% 03/01/17 $22,600 $11,000 $0 $0 $0 $22,600 $21,654
105 5 MON City of Salinas 101 Sanborn Rd/US 101 Interchange Improvements & Elvee Drive Extension
01/22/15 07/07/15 07/28/15 Const 60% 07/26/16 $4,300 $1,700 $0 $0 $0 $4,300 $4,341

California Department of Transportation Trade Corridors Improvement Fund Delivery Report Schedule and CostAllocated Projects
TCIF Project Delivery Report3rd Quarter FY 2017-18
(January through March 2018)
Page 5
Behind Schedule No Known Scope, Budget, or Schedule ImpactAwarded / Begin Construction Known Scope, Budget, or Schedule ImpactAllocated but Not Awarded Potential Impact
PR
OJE
CT
NU
MB
ER
DIS
TRIC
T
CO
UN
TY
NO
MIN
ATE
D B
Y
RO
UTE
PR
OJE
CT
DE
SC
RIP
TIO
N
ALL
OC
ATI
ON
DA
TE
AW
AR
D D
ATE
BE
GIN
CO
NS
TR
AP
PR
OV
ED
EN
D
CO
NS
TR
CU
RR
EN
T P
HA
SE
(% C
OM
PLE
TE)
AP
PR
OV
ED
EN
D
CLO
SE
OU
T
TOTA
L P
RO
JEC
T C
OS
T (x
1,00
0)
TCIF
CO
ST
(x 1
,000
)
EN
VIR
O C
OS
T(P
AE
D) (
x 1,
000)
DE
SIG
N C
OS
T (P
SE
)(x 1
,000
)
RIG
HT
OF
WA
YC
OS
T (X
1,00
0)
CO
NS
TR C
OS
T(X
1,00
0)
CO
NS
TRE
XP
EN
DIT
UR
ES
(X1,
000)
SC
OP
E
BU
DG
ET
SC
HE
DU
LE
109 8 SBD San Bernardino Associated Governments
10 I-10 Pepper Avenue Interchange 05/28/15 01/06/16 08/17/17 Const 99% 8/17/18 $10,111 $1,158 $64 $561 N/A $9,486 $8,381
110 8 SBD Southern California Regional Rail Authority
Hellman Avenue Crossing Improvements 06/30/16 11/02/16 12/31/16 Const 70% 12/31/17 $3,580 $1,790 $200 $3,380 $1,177 111 7 LA Southern California Regional
Rail AuthorityCitrus Avenue Crossing Improvements 06/30/16 12/09/16 04/30/18 Const 85% 04/30/19 $3,485 $1,455 $250 $325 $2,910 $2,073
112 7 LA Southern California Regional Rail Authority
Ramona Boulevard Crossing Improvements 06/30/16 12/09/16 04/30/18 Const 85% 4/30/19 $3,485 $1,455 $250 $325 $2,910 $2,338
114 7 LA Alameda Corridor East Construction Authority
Fullerton Road Grade Separation Project 12/09/15 03/28/16 9/30/2019 Const 21% 03/30/20 $145,184 $35,060 $0 $11,107 $32,123 $101,954 $18,124
115.1 4 ALA Port of Oakland Cool Port Oakland Project 06/30/16 09/28/17 06/30/17 Const 40% 10/01/17 $8,605 $5,000 $105 $300 $0 $8,200 $12,750 115.2 4 ALA Port of Oakland Cool Port Oakland Project 06/30/16 09/28/17 10/01/17 Const 50% 10/01/17 $83,300 $0 $0 $1,700 $0 $81,600 118 11 SD San Diego Association of
GovernmentsSan Elijo Lagoon Double Track 06/30/16 02/01/17 09/16/18 Const 18% 09/17/23 $70,254 $4,343 $1,378 $7,669 $1,585 $59,622
119 10 SJ Port of Stockton Navy Drive Widening 06/30/16 07/11/17 10/01/17 Const 65% 06/01/18 $6,813 $2,000 $200 $650 $0 $5,963 $500 120 8 SBD SBCAG Monte Vista Ave Grade Separation 08/17/16 07/12/17 05/01/19 Const 27% 03/05/20 $24,138 $1,019 $0 $0 $0 $24,138 $3,189 121 7 LA Port of Long Beach Middle Harbor Terminal Redevelopment Project
Phase 206/28/17 11/21/17 12/01/17 09/30/20 Const 0% 11/30/20 $156,355 $15,436 $0 $0 $0 $156,355
122 12 ORA Orange County
Transportation AuthorityI-405 HOV Lane[Design-Build]
10/19/16 01/13/17 Design-Build 08/31/26 RW 46%Const 16%
08/31/27 $1,506,136 $7,771 $84,622 $269,052 $298,651 $853,771 $367
124 4 SON Northern California Trade Corridors Coalition/Sonoma County Transportation Authority
US-101 Marin Sonoma Narrows HOV Lane Project Phase 2
10/18/17 03/06/18 12/31/19 Env 100%Des %RW %
Const %
12/30/20 $37,662 $3,000 $0 $2,642 $20 $35,000
126 3 PLA Northern California Trade Corridors Coalition/Placer County Transportation Planning Agency
I-80/SR-65 Interchange Phase 1 - Third Lane Project
08/16/17 02/14/18 11/14/17 11/01/20 Const 0% 12/02/23 $11,900 $3,600 $0 $0 $0 $11,900
127 3 SAC Northern California Trade Corridors Coalition/Sacramento Area Council of Governments'
SR99 Auxiliary Lanes Project 01/31/18 08/20/18 12/01/19 Const 0% 12/01/23 $7,095 $900 $170 $600 $25 $6,300
5,575,713$ 1,072,623$ 4,415,657$

California Department of Transportation Trade Corridors Improvement Fund Delivery Report Schedule and CostCompleted Projects
TCIF Project Delivery Report3rd Quarter FY 2017-18
(January through March 2018)
Page 6
Phase Complete No Known Scope, Budget, or Schedule ImpactBehind Schedule Known Scope, Budget, or Schedule Impact
Potential Impact
PR
OJE
CT
NU
MB
ER
DIS
TRIC
T
CO
UN
TY
NO
MIN
ATE
D B
Y
RO
UTE
PR
OJE
CT
DE
SC
RIP
TIO
N
AC
TUA
L E
ND
CO
NS
TR
AP
PR
OV
ED
EN
D
CLO
SE
OU
T
FOR
EC
AS
T E
ND
C
LOS
EO
UT
FDR
DU
E D
ATE
(Six
mon
ths
afte
r Act
ual
End
Con
st)
SFD
R D
UE
DA
TE(S
ix m
onth
s af
ter
Act
ual E
nd C
lose
out)
TOTA
L P
RO
JEC
T C
OS
T (x
1,00
0)
TCIF
CO
ST
(x 1
,000
)
EN
VIR
O C
OS
T(P
AE
D) (
x 1,
000)
DE
SIG
N C
OS
T (P
SE
)(x 1
,000
)
RIG
HT
OF
WA
Y
CO
ST(
X1,
000)
CO
NS
TR C
OS
T(X
1,00
0)
CO
NS
TRE
XP
EN
DIT
UR
ES
(X1,
000)
SC
OP
E
BU
DG
ET
SC
HE
DU
LE
FDR
/SFD
R S
TATU
S
COMMENTS - CTC ACTIONS DURING QUARTER
2 4 CC Caltrans / BNSF Richmond Rail Connector $22,650 $10,880 $300 $550 $4,590 $17,210 $15,883 FDR/SFDR Approved
3.2 4 ALA Port of Oakland/City of Oakland Outer Harbor Intermodal Terminals (OHIT)[Segment 2 - Rail Access Improvements and Manifest Yard]
$74,600 $65,800 $100 $8,700 $0 $65,800 $74,600
FDR/SFDR Approved
3.6 4 ALA Port of Oakland/City of Oakland Outer Harbor Intermodal Terminals (OHIT)[Segment 6 - Unit Train Support Rail Yard]
$20,000 $0 $0 $5,000 $0 $15,000 $19,428 FDR/SFDR Approved
5 4 ALA Metropolitan Transportation Commission
580 I-580 Eastbound Truck Climbing Lane[SHOPP/TCIF]
12/31/16 12/01/15 07/29/17 06/30/17 $44,903 $44,903 $2,490 $5,140 $105 $37,168 $54,911
6 6 KER Caltrans / BNSF Tehachapi Trade Corridor Rail Improvement 12/31/16 03/31/17 04/30/18 06/30/17 $26,040 $12,270 $9,500 $1,000 $0 $15,540 $12,270 9.1 3 SAC City of Sacramento Sacramento Intermodal Track Relocation
[Phase 1 - Initial Project]$80,636 $25,266 $3,143 $8,349 $0 $69,145 $69,145
FDR/SFDR Approved
9.2 3 SAC City of Sacramento Sacramento Intermodal Track Relocation[Phase 2 - West Ped-Bicycle Tunnel Ramps]
$3,747 $0 $0 $0 $0 $3,747 $3,747
FDR/SFDR Approved
10 10 SJ San Joaquin Council of Governments
4 State Route 4 West Crosstown Freeway Extension Stage 1
12/1/2017 12/01/17 12/07/17 06/30/18 $165,678 $69,458 $4,000 $10,400 $44,600 $106,678 $79,019
12 4 SOL Metropolitan Transportation Commission
80 I-80 Eastbound Cordelia Truck Scales Relocation[SHOPP/TCIF]
03/31/15 12/31/15 12/31/15 09/30/15 $88,392 $38,292 $6,800 $12,200 $7,500 $61,892 $63,056
15.3 7 LA Alameda Corridor East Construction Authority
San Gabriel Valley Grade Separation Program[Brea Canyon Grade Separation - Match]
08/31/08 08/31/10 08/31/10 02/31/09 $38,922 $0 $0 $538 $9,708 $28,676
Segmented project. Requested FDR/SFDR to conform with updated policy.
15.6 7 LA Alameda Corridor East Construction Authority
San Gabriel Valley Grade Separation Program[Ramona Boulevard Grade Separation - Match]
04/30/08 05/31/10 05/31/10 10/30/08 $14,965 $0 $0 $34 $2,959 $11,972
Segmented project. Requested FDR/SFDR to conform with updated policy.
15.7 7 LA Alameda Corridor East Construction Authority
San Gabriel Valley Grade Separation Program[Reservoir Street Grade Separation - Match]
07/31/08 09/30/11 09/30/11 01/31/09 $12,480 $0 $0 $0 $1,125 $11,355
Segmented project. Requested FDR/SFDR to conform with updated policy.
15.8 7 LA Alameda Corridor East Construction Authority
San Gabriel Valley Grade Separation Program[Sunset Avenue Grade Separation - Match]
12/31/10 06/31/12 06/31/12 06/30/11 $35,208 $0 $0 $339 $3,226 $31,643
Segmented project. Requested FDR/SFDR to conform with updated policy.
15.9 7 LA Alameda Corridor East Construction Authority
San Gabriel Valley Grade Separation Program[Temple Avenue Train Diversion - Match]
03/30/10 12/31/14 12/31/14 09/30/10 $45,177 $0 $0 $540 $2,923 $41,714
Segmented project. Requested FDR/SFDR to conform with updated policy.
17 7 LA City of Santa Fe Springs ACE: Gateway-Valley View Grade Separation Project 02/12/16 $63,997 $18,012 $0 $4,000 $15,281 $44,716 $40,959
FDR approved. Agency working on SFDR.
18 7 LA Southern California Regional Rail Authority
New Siding on the Antelope Valley Line (MP44 to MP61) For Freight Trains
05/18/12 06/30/11 12/14/14 12/15/12 $14,700 $7,200 $0 $1,500 $0 $13,200 $9,742
19 7 LA Port of Los Angeles 47/110 I-110 Fwy Access Ramp Improvement SR 47/I-110 NB Connector Widening
06/30/16 06/30/16 05/01/17 03/30/17 $40,773 $13,205 $700 $5,568 $0 $34,505 $31,296
20 7 LA Port of Los Angeles 110 I-110 Freeway & C Street Interchange Improvements
06/30/17 04/30/17 10/15/19 12/30/17 $39,385 $8,300 $801 $3,491 $0 $35,093 $29,568
22 7 LA Port of Los Angeles South Wilmington Grade Separation 11/01/15 $74,844 $15,021 $520 $6,631 $0 $67,693 $51,827
FDR approved. Agency working on SFDR.
24 7 LA Port of Long Beach Ports Rail System - Tier 1 (Pier F Support Yard) 06/30/16 $29,129 $4,093 $88 $4,265 $0 $24,776 $29,129
FDR approved. Agency is working on SFDR.
25 7 LA Port of Long Beach Ports Rail System - Tier 1 (Track Realignment at Ocean Boulevard)
06/30/16 $44,756 $16,216 $4,270 $2,850 $0 $37,636 $34,233
FDR approved. Agency is working on SFDR.
32.1 7 LA Port of Los Angeles Ports Rail System - Tier 1 (West Basin Road Rail Access Improvements)[Segment 1 - Berth 200 Rail Yard Improvements]
05/31/16 $111,956 $40,718 $6 $7,980 $0 $103,970 $91,527
FDR approved. Agency is working on SFDR.
32.2 7 LA Port of Los Angeles Ports Rail System - Tier 1 (West Basin Road Rail Access Improvements)[Segment 2 - Berth 200 Rail Yard Track Connections]
12/31/16 01/01/15 03/31/17 06/30/17 $23,141 $9,423 $0 $1,000 $0 $22,141 $19,381
34 12 ORA Orange County Transportation Authority
91 State Route 91 Connect Aux. Lanes through Interchange on Westbound State Route 91 between State Routes 57 and I-5
12/01/15 11/01/16 11/01/16 06/30/16 $62,977 $27,227 $1,400 $6,234 $7,066 $48,277 $40,703
35 12 ORA Orange County Transportation Authority
State College Boulevard Grade Separation 06/30/18 08/01/19 07/31/20 09/30/18 $74,644 $35,890 $305 $3,595 $19,092 $51,652 $49,831
36 12 ORA Orange County Transportation Authority
Placentia Avenue Undercrossing $56,794 $9,548 $21 $3,401 $15,371 $38,001 $34,558
FDR/SFDR Approved
37 12 ORA Orange County Transportation Authority
Orangethorpe Avenue Grade Separation 09/30/18 $104,182 $41,632 $631 $8,292 $24,863 $70,396 $56,956
FDR approved. Agency working on SFDR.
38 12 ORA Orange County Transportation Authority
Kraemer Boulevard Undercrossing $53,185 $15,513 $631 $5,043 $9,382 $38,129 $40,099
FDR/SFDR Approved
40 12 ORA Orange County Transportation Authority
Lakeview Avenue Overcrossing 09/30/18 $87,873 $27,629 $631 $7,867 $39,688 $39,687 $36,142
FDR approved. Agency working on SFDR.

California Department of Transportation Trade Corridors Improvement Fund Delivery Report Schedule and CostCompleted Projects
TCIF Project Delivery Report3rd Quarter FY 2017-18
(January through March 2018)
Page 7
Phase Complete No Known Scope, Budget, or Schedule ImpactBehind Schedule Known Scope, Budget, or Schedule Impact
Potential Impact
PR
OJE
CT
NU
MB
ER
DIS
TRIC
T
CO
UN
TY
NO
MIN
ATE
D B
Y
RO
UTE
PR
OJE
CT
DE
SC
RIP
TIO
N
AC
TUA
L E
ND
CO
NS
TR
AP
PR
OV
ED
EN
D
CLO
SE
OU
T
FOR
EC
AS
T E
ND
C
LOS
EO
UT
FDR
DU
E D
ATE
(Six
mon
ths
afte
r Act
ual
End
Con
st)
SFD
R D
UE
DA
TE(S
ix m
onth
s af
ter
Act
ual E
nd C
lose
out)
TOTA
L P
RO
JEC
T C
OS
T (x
1,00
0)
TCIF
CO
ST
(x 1
,000
)
EN
VIR
O C
OS
T(P
AE
D) (
x 1,
000)
DE
SIG
N C
OS
T (P
SE
)(x 1
,000
)
RIG
HT
OF
WA
Y
CO
ST(
X1,
000)
CO
NS
TR C
OS
T(X
1,00
0)
CO
NS
TRE
XP
EN
DIT
UR
ES
(X1,
000)
SC
OP
E
BU
DG
ET
SC
HE
DU
LE
FDR
/SFD
R S
TATU
S
COMMENTS - CTC ACTIONS DURING QUARTER
41 12 ORA Orange County Transportation Authority
Tustin Avenue / Rose Drive Overcrossing 09/30/18 $86,381 $30,862 $601 $7,085 $32,245 $46,450 $38,947 FDR approved. Agency working on SFDR.
42 8 RIV City of Riverside Columbia Avenue Grade Separation $33,003 $4,953 $143 $1,657 $6,800 $24,403 $21,594 FDR/SFDR Approved
43 8 RIV City of Corona Auto Center Drive Grade Separation 09/30/15 05/30/14 10/30/16 03/30/16 $32,675 $16,000 $630 $1,370 $2,720 $27,955 $16,026 44 8 RIV City of Riverside Magnolia Avenue Grade Separation - UPRR $50,248 $17,288 $160 $2,500 $23,500 $24,088 $24,322 FDR/SFDR Approved
45 8 RIV City of Riverside Iowa Avenue Grade Separation 06/01/15 $32,000 $13,000 $500 $1,500 $5,500 $24,500 $19,528 FDR approved. Agency working on SFDR.
47 8 RIV City of Riverside Streeter Avenue Grade Separation 02/20/17 $36,000 $15,500 $1,500 $1,000 $7,500 $26,000 $23,048 FDR approved. Agency working on SFDR.
48 8 RIV Riverside County Avenue 56 Grade Separation 06/30/17 10/15/16 10/15/16 12/30/17 $29,394 $12,802 $295 $2,268 $3,289 $23,542 $25,544 50 8 RIV Riverside County Grade Separation at Clay Street Railroad Grade
Crossing06/30/17 12/15/16 12/15/16 12/30/17 $30,806 $13,247 $502 $2,843 $7,385 $20,076 $20,105
51 8 RIV City of Riverside Riverside Avenue Grade Separation 06/30/17 $32,154 $10,434 $1,047 $1,453 $6,892 $22,762 $20,713 FDR approved. Agency working on SFDR.
56 8 SBD San Bernardino Associated Governments
10 Route 10 Cherry Avenue Interchange Reconstruction $77,806 $30,773 $935 $5,822 $9,503 $61,546 $63,027
FDR/SFDR Approved
58 8 SBD San Bernardino Associated Governments
10 Route 10 Riverside Ave Interchange Reconstruction $31,170 $9,837 $0 $2,185 $1,723 $27,262 $27,262
FDR/SFDR Approved
59 8 SBD San Bernardino Associated Governments
ACE Glen Helen Parkway Grade Separation 05/19/16 $25,885 $7,172 $0 $2,650 $6,400 $16,835 $18,038
FDR approved. Agency working on SFDR.
61 8 SBD San Bernardino Associated Governments
ACE South Milliken Avenue Grade Separation 12/31/17 02/01/17 12/01/17 06/30/18 $75,649 $21,846 $750 $4,745 $5,221 $64,933 $46,562
63 8 SBD San Bernardino Associated Governments
Palm Avenue Grade Separation 09/30/18 $23,738 $1,900 $774 $2,024 $8,320 $12,620 $11,245
FDR/SFDR Approved
64 8 SBD San Bernardino Associated Governments
Lenwood Road Grade Separation 09/30/18 $31,154 $8,276 $0 $4,409 $4,792 $21,953 $20,102
FDR/SFDR Approved
66 7 VEN City of Oxnard 101 Route 101 Rice Avenue Interchange Reconstruction 12/21/16 $73,597 $14,194 $3,458 $3,766 $26,594 $39,779 $45,056
FDR Approved. Agency is working on SFDR.
67 11 SD San Diego Association of Governments
905 State Route 905 02/11/18 $82,953 $66,804 $0 $499 $0 $82,454 $81,154
FDR Approved. Agency is working on SFDR.
68 11 SD San Diego Association of Governments
11 SR 11/Otay Mesa East Port of Entry[Parent - Environmental Programming for Entire Corridor]
04/01/18 04/01/18 $12,300 $0 $12,300 $0 $0 $0 $0
Segmented project. Requested FDR/SFDR to conform with updated policy.
68.1 11 SD San Diego Association of Governments
11 SR 11/Otay Mesa East Port of Entry[Segment 1 - SR 11/SR 905 Freeway to Freeway Connectors]
03/30/18 $107,330 $66,330 $0 $7,300 $33,700 $66,330 $64,978
FDR Approved
69 11 SD Port of San Diego 5/15 Bay Marina Drive at I-5 At-Grade Improvements 06/03/15 $2,603 $792 $440 $345 $20 $1,798 $2,276 FDR Approved. Agency is working on SFDR.
70 11 SD Port of San Diego 10th Avenue/Harbor Drive At-Grade Improvements 03/30/15 $3,953 $598 $1,163 $1,031 $0 $1,760 $1,759
72 11 SD Port of San Diego 5 Civic Center Drive at Harbor Drive and I-5 At-Grade Improvements
06/03/15 $1,731 $361 $531 $300 $37 $863 $1,956
FDR Approved. Agency is working on SFDR.
74 11 SD San Diego Association of Governments
Southline Rail Improvements - San Ysidro Yard Expansion
07/31/16 04/02/15 01/31/17 01/31/17 $40,460 $25,900 $540 $2,482 $6,870 $30,568 $25,900
75.1 11 SD San Diego Association of Governments
Southline Rail Improvements - Mainline Improvements[Phase 1 - Aerial Cabling]
07/15/12 09/30/12 07/31/14 01/31/13 $4,458 $4,458 $0 $0 $0 $4,458 $4,458
Segmented project. Requested FDR/SFDR to conform with updated policy.
75.2 11 SD San Diego Association of Governments
Southline Rail Improvements - Mainline Improvements[Phase 2 - Signaling for Reverse Running and Initial Track Improvements]
06/30/14 10/31/13 07/30/15 12/01/14 $10,431 $10,010 $0 $0 $0 $10,431 $10,010
Segmented project. Requested FDR/SFDR to conform with updated policy.
75.3 11 SD San Diego Association of Governments
Southline Rail Improvements - Mainline Improvements[Phase 3 - Palomar Siding and Mainline Track
07/03/15 12/21/15 08/24/16 01/03/16 $3,445 $3,445 $0 $0 $0 $3,445 $3,445
Segmented project. Requested FDR/SFDR to conform with updated policy.
75.4 11 SD San Diego Association of Governments
Southline Rail Improvements - Mainline Improvements[Phase 4 - Final Palomar Siding and System Upgrades]
11/30/16 01/01/16 02/28/17 05/30/17 $30,591 $21,621 $220 $8,750 $0 $21,621 $21,621
Segmented project. Requested FDR/SFDR to conform with updated policy.
76 11 SD San Diego Association of Governments
LOSSAN N Rail Corridor at Sorrento $44,000 $10,800 $2,024 $3,774 $2,553 $35,649 $35,649
FDR/SFDR Approved
77 11 IMP Imperial Valley Association of Governments
78/111
Brawley Bypass State Route 78/111 11/30/16 $70,305 $43,122 $1,206 $6,500 $18,569 $44,030 $42,600
FDR Approved. Agency is working on SFDR.
81 10 SJ Northern California Trade Corridors Coalition
Sperry Road Extension 06/30/16 $56,582 $23,582 $1,000 $5,000 $7,000 $43,582 $36,935
FDR Approved. Agency is working on SFDR.
82 4 CC Northern California Trade Corridors Coalition
Marina Bay Parkway Grade Separation 06/30/16 06/01/15 09/30/16 12/30/16 $42,180 $18,975 $500 $2,780 $100 $38,800 $39,011
83 8 SBD Caltrans / BNSF / UP Colton Crossing Project $83,477 $27,847 $3,689 $5,570 $433 $73,785 $73,784 FDR/SFDR Approved

California Department of Transportation Trade Corridors Improvement Fund Delivery Report Schedule and CostCompleted Projects
TCIF Project Delivery Report3rd Quarter FY 2017-18
(January through March 2018)
Page 8
Phase Complete No Known Scope, Budget, or Schedule ImpactBehind Schedule Known Scope, Budget, or Schedule Impact
Potential Impact
PR
OJE
CT
NU
MB
ER
DIS
TRIC
T
CO
UN
TY
NO
MIN
ATE
D B
Y
RO
UTE
PR
OJE
CT
DE
SC
RIP
TIO
N
AC
TUA
L E
ND
CO
NS
TR
AP
PR
OV
ED
EN
D
CLO
SE
OU
T
FOR
EC
AS
T E
ND
C
LOS
EO
UT
FDR
DU
E D
ATE
(Six
mon
ths
afte
r Act
ual
End
Con
st)
SFD
R D
UE
DA
TE(S
ix m
onth
s af
ter
Act
ual E
nd C
lose
out)
TOTA
L P
RO
JEC
T C
OS
T (x
1,00
0)
TCIF
CO
ST
(x 1
,000
)
EN
VIR
O C
OS
T(P
AE
D) (
x 1,
000)
DE
SIG
N C
OS
T (P
SE
)(x 1
,000
)
RIG
HT
OF
WA
Y
CO
ST(
X1,
000)
CO
NS
TR C
OS
T(X
1,00
0)
CO
NS
TRE
XP
EN
DIT
UR
ES
(X1,
000)
SC
OP
E
BU
DG
ET
SC
HE
DU
LE
FDR
/SFD
R S
TATU
S
COMMENTS - CTC ACTIONS DURING QUARTER
84 8 SBD San Bernardino Associated Governments
Laurel Street/BNSF Grade Separation $58,725 $23,583 $0 $4,657 $11,053 $43,016 $41,900 FDR/SFDR Approved
85 8 RIV Riverside County Avenue 52 Grade Separation 06/30/16 09/01/15 09/30/16 12/30/16 $29,866 $10,000 $2,668 $0 $3,000 $24,198 $27,848 86 7 LA Port of Los Angeles Alameda Corridor West Terminus Intermodal
Railyard -West Basin Railyard Extension04/30/16 02/28/17 04/30/17 10/30/16 $72,987 $20,712 $0 $3,292 $0 $69,695 $72,751
87.1 7 LA Port of Los Angeles Cargo Transportation Improvement Emission Reduction Program - Phase 1
04/24/14 05/31/15 06/30/16 10/24/14 $26,695 $12,705 $0 $1,285 $0 $25,410 $39,166
Segmented project. Requested FDR/SFDR to conform with updated policy.
87.2 7 LA Port of Los Angeles Cargo Transportation Improvement Emission Reduction Program - Phase 2
03/30/17 09/30/18 03/30/18 06/30/17 $143,000 $26,664 $0 $8,470 $0 $134,530 $105,684
Segmented project. Requested FDR/SFDR to conform with updated policy.
88 7 LA Alameda Corridor East Construction Authority
Baldwin Avenue Grade Separation $71,625 $27,739 $0 $1,902 $41,930 $27,739 $27,738
FDR/SFDR Approved
89 4 SOL Northern California Trade Corridors Coalition
80/ 680/ 12
Solano I-80/680/12 Connector[SHOPP/TCIF]
12/31/17 01/31/17 12/31/19 06/30/18 $101,580 $22,847 $3,500 $8,880 $23,160 $66,040 $63,128
90 7 VEN Ventura County Transportation Commission / Alameda Corridor Transportation Authority
Hueneme Road Widening 03/31/17 $2,924 $1,462 $0 $0 $0 $2,924 $2,618
FDR Approved. Agency is working on SFDR.
92.1 3 YOL Port of West Sacramento West Sacramento/Port of West Sacramento Rail Plan [Phase I - UPRR Track Improvements]
06/30/12 09/30/12 $7,500 $0 $0 $0 $0 $7,500
Segmented project. Requested FDR/SFDR to conform with updated policy.
92.2 3 YOL Port of West Sacramento West Sacramento/Port of West Sacramento Rail Plan [Phase 2 - Cemex Track/Unit Track 2]
01/25/12 06/28/12 07/25/12 $1,800 $0 $0 $100 $0 $1,700
Segmented project. Requested FDR/SFDR to conform with updated policy.
92.5 3 YOL Port of West Sacramento West Sacramento/Port of West Sacramento Rail Plan [Phase 5 - Pioneer Bluff Bridge]
09/24/17 $10,561 $9,678 $210 $653 $20 $9,678 $11,350
FDR Approved. Agency is working on SFDR.
93 11 SD San Diego Association of Governments
Sorrento Valley Double Track 06/30/16 11/01/20 11/01/20 12/30/16 $34,810 $12,994 $3,352 $1,653 $345 $29,460 $27,083 FDR Approved. Agency is working on SFDR.
94 4 SCL Metropolitan Transportation Commission
101 US-101 Freeway Performance Initiative (FPI)[SHOPP/TCIF]
10/30/15 10/24/15 10/30/16 04/30/16 $24,764 $13,840 $2,120 $2,120 $67 $20,457 $16,316
97 3 YUB Yuba County 70 SR 70 / Feather River Boulevard Interchange 11/30/15 06/01/16 06/01/16 05/30/16 $19,350 $4,361 $900 $950 $1,000 $16,500 $16,500 98 3 SAC Northern California Trade
Corridors Coalition50 Natoma Overhead Widening and Onramp
Improvements[SHOPP/TCIF]
04/21/16 12/01/17 12/01/17 06/30/17 $8,459 $7,959 $125 $198 $253 $7,883 $6,592
100 8 SBD San Bernardino Associated Governments
10 Tippecanoe Interchange Improvements, Phase II 06/30/17 08/01/17 11/24/17 12/30/17 $57,811 $8,691 $0 $5,189 $34,175 $18,447 $20,425
101 10 SJ San Joaquin Council of Governments /Caltrans
99 State Route 99 Ramp Improvements[SHOPP/TCIF]
03/22/16 05/01/16 03/31/18 09/22/16 $2,973 $2,333 $130 $400 $110 $2,333 $2,728
102 7 LA Port of Los Angeles TraPac Terminal Automation-Automated Shuttle Carrier Maintenance & Repair
05/31/17 08/30/17 05/31/18 03/30/18 $5,681 $2,841 $0 $376 $0 $5,305 $8,484
104 11 SD San Diego Association of Governments
905/ 125 State Route 905/State Route 125 Northbound Connectors
03/30/18 $18,628 $13,719 $0 $2,621 $521 $15,486 $15,112 FDR Approved. Agency is working on SFDR.
106 7 LA Southern California Regional Rail Authority
Vincent Siding at CP Quartz and 2nd Platform at Vincent Grade/Acton
03/31/17 04/30/17 6/30/2018 12/30/17 $17,400 $8,200 $350 $650 $0 $16,400 $16,851
107 10 SJ San Joaquin Council of Governments /Caltrans
99 Southbound State Route 99 from Hammer Lane to Fremont Street Interchanges Ramp Metering [SHOPP/TCIF]
02/12/17 08/24/17 09/30/17 $2,000 $2,000 $0 $0 $0 $2,000 $6,091
108.1 7 LA Port of Los Angeles YTI Terminal Enhancement & Truck Trip Reduction Program [Phase 1 - Berth/Wharf Improvements]
06/29/17 05/31/18 06/30/18 $45,115 $8,401 $2,600 $2,549 $39,966 $42,373
108.2 7 LA Port of Los Angeles YTI Terminal Enhancement & Truck Trip Reduction Program[Phase 2 - On-Dock Railyard]
12/31/2017 12/31/17 12/31/18 09/30/18 $6,083 $1,132 $0 $357 $5,726 $2,019
113 7 LA Southern California Regional Rail Authority
Control Point Soledad Speed Increase Project 6/30/2018 04/30/19 06/30/19 09/30/18 $6,648 $2,708 $616 $616 $5,416 $4,852 3,631,178$ 1,353,794$ 4,371,265$

California Department of Transportation Trade Corridors Improvement Fund Delivery Report Benefits for Active Projects
TCIF Project Delivery Report3rd Quarter FY 2017-18
(January through March 2018)
Page 9
No actual since projects are either in construction or not allocated LegendProject not allocated I=Identified benefit
Y=Achieved benefit
PROJECT NUMBER DISTRICT COUNTY NOMINATED BY ROUTE PROJECT
DESCRIPTION
3.1 4 ALA Port of Oakland/City of Oakland Outer Harbor Intermodal Terminals (OHIT)[Segment 1-Environmental Remediation]
I I I I I I3.3 4 ALA Port of Oakland/City of Oakland Outer Harbor Intermodal Terminals (OHIT)
[Segment 3 - City Site Prep Work and Backbone Infrastructure 3] I I I I I I
3.4 4 ALA Port of Oakland/City of Oakland Outer Harbor Intermodal Terminals (OHIT)[Segment 4 - Recycling Facilities]
I I I I I I3.5 4 ALA Port of Oakland/City of Oakland Outer Harbor Intermodal Terminals (OHIT)
[Segment 5 - City Trade and Logistics Facilities]
I I I I I I4 4 ALA Metropolitan Transportation
Commission880 I-880 Reconstruction, 29th & 23rd Avenues, Oakland
[SHOPP/TCIF]
I I I I I I11 10 SJ Port of Stockton / Contra Costa
CountySan Francisco Bay to Stockton Ship Channel Deepening Project I I I I I
15.01 7 LA Alameda Corridor East Construction Authority
San Gabriel Valley Grade Separation Program[Phase I - Archaeological Services] I I I I I I
15.02 7 LA Alameda Corridor East Construction Authority
San Gabriel Valley Grade Separation Program[Phase II - Trench and Fiber Optic relocation] I I I I I I
15.12 7 LA Alameda Corridor East Construction Authority
San Gabriel Valley Grade Separation Program[Motebello Corridor - Match] I I I I I I
21 7 LA City of Commerce Washington Boulevard Widening & Reconstruction I I I I I I23 7 LA Port of Long Beach 710 Gerald Desmond Bridge Replacement
[Design-Build] [SHOPP/TCIF] I I I I I I46 8 RIV City of Banning Sunset Avenue Grade Separation I I I I I I53 8 RIV Riverside County Grade Separation at Magnolia Avenue Railroad Grade
Crossing - BNSF I I I I I I54 8 RIV City of Riverside 215 March Island Cargo Port Airport -
I-215 Van Buren Boulevard - Ground Access Improvements I I I I I I
68.2 11 SD San Diego Association of Governments
11 SR 11/Otay Mesa East Port of Entry[Segment 2 - SR 11 and Commercial Vehicle Enforcement Facility] I I I I I I
68.2A 11 SD San Diego Association of Governments
11 SR 11/Otay Mesa East Port of Entry[Segment 2A - SR 11 - Constuct 4-lane highway project] I I I I I I
68.3 11 SD San Diego Association of Governments
11 SR 11/Otay Mesa East Port of Entry[Segment 3 - East Otay Mesa Land POE] I I I I I I
91 7 VEN Ventura County Transportation Commission
101 Route 101 Improvements
I I I I92.3 3 YOL Port of West Sacramento West Sacramento/Port of West Sacramento Rail Plan
[Phase 3 - Washington Overpass] I I I I92.4 3 YOL Port of West Sacramento West Sacramento/Port of West Sacramento Rail Plan
[Phase 4 - Loop Track] I I I I95 7 LA Alameda Corridor East Construction
AuthorityACE Puente Avenue Grade Separation
I I I I I I96 7 LA Alameda Corridor East Construction
AuthorityACE Fairway Drive Grade Separation
I I I I I I99 12 ORA Orange County Transportation
AuthorityRaymond Avenue Grade Separation
I I I I I I
Emissions ReductionBaseline Actual
SafetyBaseline Actual
VelocityBaseline Actual
ThroughputBaseline Actual
ReliabilityBaseline Actual
Congestion ReductionBaseline Actual

California Department of Transportation Trade Corridors Improvement Fund Delivery Report Benefits for Active Projects
TCIF Project Delivery Report3rd Quarter FY 2017-18
(January through March 2018)
Page 10
No actual since projects are either in construction or not allocated LegendProject not allocated I=Identified benefit
Y=Achieved benefit
PROJECT NUMBER DISTRICT COUNTY NOMINATED BY ROUTE PROJECT
DESCRIPTIONEmissions Reduction
Baseline ActualSafety
Baseline ActualVelocity
Baseline ActualThroughput
Baseline ActualReliability
Baseline ActualCongestion Reduction
Baseline Actual
103 4 SOL City of Fairfield Fairfield/Vacaville Intermodal Station - New track and Grade Separation I I I I I
105 5 MON City of Salinas 101 Sanborn Rd/US 101 Interchange Improvements & Elvee Drive Extension
I I I109 8 SBD San Bernardino Associated
Governments10 I-10 Pepper Avenue Interchange
I I I110 8 SBD Southern California Regional Rail
AuthorityHellman Avenue Crossing Improvements
I I I I I I111 7 LA Southern California Regional Rail
AuthorityCitrus Avenue Crossing Improvements
I I I I I I112 7 LA Southern California Regional Rail
AuthorityRamona Boulevard Crossing Improvements
I I I I I I114 7 LA Alameda Corridor East Construction
AuthorityFullerton Road Grade Separation Project
I I I I I I115.1 4 ALA Port of Oakland Cool Port Oakland Project
I I I I I115.2 4 ALA Port of Oakland Cool Port Oakland Project I I I I I117 8 RIV Riverside County ACE: Avenue 66/UP Railroad Grade Separation Bypass
I I I I I I118 11 SD San Diego Association of
GovernmentsSan Elijo Lagoon Double Track
I I I I I I119 10 SJ Port of Stockton Navy Drive Widening I I I I I I120 8 SBD SBCAG Monte Vista Ave Grade Separation I I I I I I121 7 LA Port of Long Beach Middle Harbor Terminal Redevelopment Project Phase
2 I I I I I122 12 ORA Orange County Transportation
AuthorityI-405 HOV Lane[Design-Build] I I I I I I
123 12 ORA Orange County Transportation Authority
San Juan Creek Bridge Replacement
I I I I I I124 4 SON Northern California Trade Corridors
Coalition/Sonoma County Transportation Authority
US-101 Marin Sonoma Narrows HOV Lane Project Phase 2
I I I I I I125 7 LA Alameda Corridor East Construction
AuthorityDurfee Avenue Grade Separation Project
I I I I I I126 3 PLA Northern California Trade Corridors
Coalition/Placer County Transportation Planning Agency
I-80/SR-65 Interchange Phase 1 - Third Lane Project
I I I127 3 SAC Northern California Trade Corridors
Coalition/Sacramento Area Council of Governments'
SR99 Auxiliary Lanes Project
I I

California Department of Transportation Trade Corridors Improvement Fund Delivery Report Benefits for Completed Projects
TCIF Project Delivery Report3rd Quarter FY 2017-18
(January through March 2018)
Page 11
No benefit was reported in baseline and/or acutal Legend No Known Scope, Budget, or Schedule ImpactSegmented project, benefits will be calculated once all phases are complete I=Identified benefit Known Scope, Budget, or Schedule Impact
Y=Achieved benefit Potential Impact P=Pending, benefits will be captured at Supplemental Final Delivery Report
PROJECT NUMBER DISTRICT COUNTY NOMINATED BY ROUTE PROJECT
DESCRIPTIONFDR/SFDR STATUS
COMMENTS - CTC ACTIONS DURING QUARTER
2 4 CC Caltrans / BNSF Richmond Rail Connector FDR/SFDR Approved Y Y Y Y Y Y3.2 4 ALA Port of Oakland/City of Oakland Outer Harbor Intermodal Terminals (OHIT)
[Segment 2 - Rail Access Improvements and Manifest Yard]
FDR/SFDR Approved
Y Y Y Y Y Y Y Y Y Y Y Y3.6 4 ALA Port of Oakland/City of Oakland Outer Harbor Intermodal Terminals (OHIT)
[Segment 6 - Unit Train Support Rail Yard] FDR/SFDR Approved
Y Y Y Y Y Y Y Y Y Y Y Y5 4 ALA Metropolitan Transportation
Commission580 I-580 Eastbound Truck Climbing Lane
[SHOPP/TCIF] Y Y Y Y Y Y
6 6 KER Caltrans / BNSF Tehachapi Trade Corridor Rail Improvement Y Y Y Y Y Y9.1 3 SAC City of Sacramento Sacramento Intermodal Track Relocation
[Phase 1 - Initial Project] FDR/SFDR Approved
Y Y Y Y Y Y Y Y9.2 3 SAC City of Sacramento Sacramento Intermodal Track Relocation
[Phase 2 - West Ped-Bicycle Tunnel Ramps] FDR/SFDR Approved
Y Y Y Y Y Y Y Y10 10 SJ San Joaquin Council of
Governments4 State Route 4 West Crosstown Freeway Extension
Stage 1 Y Y Y Y Y Y
12 4 SOL Metropolitan Transportation Commission
80 I-80 Eastbound Cordelia Truck Scales Relocation[SHOPP/TCIF]
Y Y Y Y Y Y15.3 7 LA Alameda Corridor East
Construction AuthoritySan Gabriel Valley Grade Separation Program[Brea Canyon Grade Separation - Match]
Segmented project. Requested FDR/SFDR to conform with updated policy. Y Y Y Y Y Y
15.6 7 LA Alameda Corridor East Construction Authority
San Gabriel Valley Grade Separation Program[Ramona Boulevard Grade Separation - Match]
Segmented project. Requested FDR/SFDR to conform with updated policy. Y Y Y Y Y Y
15.7 7 LA Alameda Corridor East Construction Authority
San Gabriel Valley Grade Separation Program[Reservoir Street Grade Separation - Match]
Segmented project. Requested FDR/SFDR to conform with updated policy. Y Y Y Y Y Y
15.8 7 LA Alameda Corridor East Construction Authority
San Gabriel Valley Grade Separation Program[Sunset Avenue Grade Separation - Match]
Segmented project. Requested FDR/SFDR to conform with updated policy. Y Y Y Y Y Y
15.9 7 LA Alameda Corridor East Construction Authority
San Gabriel Valley Grade Separation Program[Temple Avenue Train Diversion - Match]
Segmented project. Requested FDR/SFDR to conform with updated policy. Y Y Y Y Y Y
17 7 LA City of Santa Fe Springs ACE: Gateway-Valley View Grade Separation Project
FDR approved. Agency working on SFDR.
Y Y Y Y Y Y Y Y Y Y Y Y18 7 LA Southern California Regional Rail
AuthorityNew Siding on the Antelope Valley Line (MP44 to MP61) For Freight Trains Y Y Y Y Y Y
19 7 LA Port of Los Angeles 47/110 I-110 Fwy Access Ramp Improvement SR 47/I-110 NB Connector Widening Y Y Y Y Y Y
20 7 LA Port of Los Angeles 110 I-110 Freeway & C Street Interchange Improvements Y Y Y Y Y Y
22 7 LA Port of Los Angeles South Wilmington Grade Separation
FDR approved. Agency working on SFDR. Y Y Y Y Y Y Y Y Y Y Y
TBD by 2030.
24 7 LA Port of Long Beach Ports Rail System - Tier 1 (Pier F Support Yard)
FDR approved. Agency is working on SFDR. Y P Y P Y Y Y P Y P Y P
25 7 LA Port of Long Beach Ports Rail System - Tier 1 (Track Realignment at Ocean Boulevard)
FDR approved. Agency is working on SFDR. Y Y Y P Y Y Y P Y P Y P
32.1 7 LA Port of Los Angeles Ports Rail System - Tier 1 (West Basin Road Rail Access Improvements)[Segment 1 - Berth 200 Rail Yard Improvements]
FDR approved. Agency is working on SFDR.
Y Y Y Y Y Y32.2 7 LA Port of Los Angeles Ports Rail System - Tier 1 (West Basin Road Rail
Access Improvements)[Segment 2 - Berth 200 Rail Yard Track Connections]
Y Y Y Y Y Y34 12 ORA Orange County Transportation
Authority91 State Route 91 Connect Aux. Lanes through
Interchange on Westbound State Route 91 between State Routes 57 and I-5
Y Y Y Y Y Y
35 12 ORA Orange County Transportation Authority
State College Boulevard Grade Separation Agency is working on FDR.
Y Y Y Y Y Y36 12 ORA Orange County Transportation
AuthorityPlacentia Avenue Undercrossing
FDR/SFDR Approved
Y Y Y Y Y Y Y Y Y Y Y Y37 12 ORA Orange County Transportation
AuthorityOrangethorpe Avenue Grade Separation
FDR approved. Agency working on SFDR. Y Y Y Y Y Y Y Y Y Y Y Y
Emissions ReductionBaseline Actual
SafetyBaseline Actual
VelocityBaseline Actual
ThroughputBaseline Actual
ReliabilityBaseline Actual
Congestion ReductionBaseline Actual

California Department of Transportation Trade Corridors Improvement Fund Delivery Report Benefits for Completed Projects
TCIF Project Delivery Report3rd Quarter FY 2017-18
(January through March 2018)
Page 12
No benefit was reported in baseline and/or acutal Legend No Known Scope, Budget, or Schedule ImpactSegmented project, benefits will be calculated once all phases are complete I=Identified benefit Known Scope, Budget, or Schedule Impact
Y=Achieved benefit Potential Impact P=Pending, benefits will be captured at Supplemental Final Delivery Report
PROJECT NUMBER DISTRICT COUNTY NOMINATED BY ROUTE PROJECT
DESCRIPTIONFDR/SFDR STATUS
COMMENTS - CTC ACTIONS DURING QUARTER
Emissions ReductionBaseline Actual
SafetyBaseline Actual
VelocityBaseline Actual
ThroughputBaseline Actual
ReliabilityBaseline Actual
Congestion ReductionBaseline Actual
38 12 ORA Orange County Transportation Authority
Kraemer Boulevard Undercrossing FDR/SFDR ApprovedY Y Y Y Y Y Y Y Y Y Y Y
40 12 ORA Orange County Transportation Authority
Lakeview Avenue Overcrossing
FDR approved. Agency working on SFDR. Y Y Y Y Y Y Y Y Y Y Y Y
41 12 ORA Orange County Transportation Authority
Tustin Avenue / Rose Drive Overcrossing
FDR approved. Agency working on SFDR. Y Y Y Y Y Y Y Y Y Y Y Y
42 8 RIV City of Riverside Columbia Avenue Grade Separation FDR/SFDR Approved Y Y Y Y Y Y Y Y Y Y Y Y43 8 RIV City of Corona Auto Center Drive Grade Separation Y Y Y Y Y Y44 8 RIV City of Riverside Magnolia Avenue Grade Separation - UPRR FDR/SFDR Approved
Y Y Y Y Y Y Y Y Y Y Y Y45 8 RIV City of Riverside Iowa Avenue Grade Separation
FDR approved. Agency working on SFDR. Y Y Y Y Y Y Y Y Y Y Y Y
47 8 RIV City of Riverside Streeter Avenue Grade Separation
FDR approved. Agency working on SFDR. Y Y Y Y Y Y Y Y Y Y Y Y
48 8 RIV Riverside County Avenue 56 Grade Separation Y Y Y Y Y Y50 8 RIV Riverside County Grade Separation at Clay Street Railroad Grade
Crossing Y Y Y Y Y Y51 8 RIV City of Riverside Riverside Avenue Grade Separation FDR approved. Agency working on
SFDR. Y Y Y Y Y Y Y Y Y Y Y Y56 8 SBD San Bernardino Associated
Governments10 Route 10 Cherry Avenue Interchange Reconstruction
FDR/SFDR Approved
Y Y Y Y Y Y Y Y Y Y Y Y58 8 SBD San Bernardino Associated
Governments10 Route 10 Riverside Ave Interchange Reconstruction
FDR/SFDR Approved
Y Y Y Y Y Y Y Y Y Y Y Y59 8 SBD San Bernardino Associated
GovernmentsACE Glen Helen Parkway Grade Separation
FDR approved. Agency working on SFDR. Y Y Y Y Y Y Y Y Y Y Y Y
61 8 SBD San Bernardino Associated Governments
ACE South Milliken Avenue Grade Separation
Y Y Y Y Y Y63 8 SBD San Bernardino Associated
GovernmentsPalm Avenue Grade Separation
FDR/SFDR Approved
Y Y Y Y Y Y Y Y Y Y Y64 8 SBD San Bernardino Associated
GovernmentsLenwood Road Grade Separation
FDR/SFDR Approved
Y Y Y Y Y Y Y Y Y Y Y66 7 VEN City of Oxnard 101 Route 101 Rice Avenue Interchange Reconstruction
FDR Approved. Agency is working on SFDR.
Y Y Y Y Y Y Y Y Y Y Y Y67 11 SD San Diego Association of
Governments905 State Route 905
FDR Approved. Agency is working on SFDR. Y P Y P Y P Y P Y P Y P
68 11 SD San Diego Association of Governments
11 SR 11/Otay Mesa East Port of Entry[Parent - Environmental Programming for Entire Corridor]
Segmented project. Requested FDR/SFDR to conform with updated policy.
Y Y Y Y Y Y68.1 11 SD San Diego Association of
Governments11 SR 11/Otay Mesa East Port of Entry
[Segment 1 - SR 11/SR 905 Freeway to Freeway Connectors]
FDR Approved
Y Y Y P Y P Y P Y P Y P69 11 SD Port of San Diego 5/15 Bay Marina Drive at I-5 At-Grade Improvements
FDR Approved. Agency is working on SFDR. Y Y Y Y Y Y Y Y Y Y Y P
70 11 SD Port of San Diego 10th Avenue/Harbor Drive At-Grade Improvements Y P Y P Y P Y P Y P Y P
72 11 SD Port of San Diego 5 Civic Center Drive at Harbor Drive and I-5 At-Grade Improvements
FDR Approved. Agency is working on SFDR. Y Y Y Y Y Y Y Y Y Y Y P
74 11 SD San Diego Association of Governments
Southline Rail Improvements - San Ysidro Yard Expansion Y Y Y Y Y Y
75.1 11 SD San Diego Association of Governments
Southline Rail Improvements - Mainline Improvements[Phase 1 - Aerial Cabling]
Segmented project. Requested FDR/SFDR to conform with updated policy.
Y Y Y Y Y Y75.2 11 SD San Diego Association of
GovernmentsSouthline Rail Improvements - Mainline Improvements[Phase 2 - Signaling for Reverse Running and Initial Track Improvements]
Segmented project. Requested FDR/SFDR to conform with updated policy. Y Y Y Y Y Y
75.3 11 SD San Diego Association of Governments
Southline Rail Improvements - Mainline Improvements[Phase 3 - Palomar Siding and Mainline Track Improvements]
Segmented project. Requested FDR/SFDR to conform with updated policy. Y Y Y Y Y Y
75.4 11 SD San Diego Association of Governments
Southline Rail Improvements - Mainline Improvements[Phase 4 - Final Palomar Siding and System Upgrades]
Segmented project. Requested FDR/SFDR to conform with updated policy.
Y Y Y Y Y Y76 11 SD San Diego Association of
GovernmentsLOSSAN N Rail Corridor at Sorrento
FDR/SFDR Approved
Y Y Y Y Y Y Y Y Y Y Y Y

California Department of Transportation Trade Corridors Improvement Fund Delivery Report Benefits for Completed Projects
TCIF Project Delivery Report3rd Quarter FY 2017-18
(January through March 2018)
Page 13
No benefit was reported in baseline and/or acutal Legend No Known Scope, Budget, or Schedule ImpactSegmented project, benefits will be calculated once all phases are complete I=Identified benefit Known Scope, Budget, or Schedule Impact
Y=Achieved benefit Potential Impact P=Pending, benefits will be captured at Supplemental Final Delivery Report
PROJECT NUMBER DISTRICT COUNTY NOMINATED BY ROUTE PROJECT
DESCRIPTIONFDR/SFDR STATUS
COMMENTS - CTC ACTIONS DURING QUARTER
Emissions ReductionBaseline Actual
SafetyBaseline Actual
VelocityBaseline Actual
ThroughputBaseline Actual
ReliabilityBaseline Actual
Congestion ReductionBaseline Actual
77 11 IMP Imperial Valley Association of Governments
78/111
Brawley Bypass State Route 78/111
FDR Approved. Agency is working on SFDR. Y P Y Y Y P Y P Y P Y P
81 10 SJ Northern California Trade Corridors Coalition
Sperry Road Extension
FDR Approved. Agency is working on SFDR. Y Y Y Y Y Y Y Y Y Y Y Y
82 4 CC Northern California Trade Corridors Coalition
Marina Bay Parkway Grade Separation
Y Y Y83 8 SBD Caltrans / BNSF / UP Colton Crossing Project FDR/SFDR Approved
Y Y Y Y Y Y Y Y Y Y Y Y84 8 SBD San Bernardino Associated
GovernmentsLaurel Street/BNSF Grade Separation
FDR/SFDR Approved
Y Y Y Y Y Y Y Y Y Y Y Y85 8 RIV Riverside County Avenue 52 Grade Separation Y Y Y Y Y Y86 7 LA Port of Los Angeles Alameda Corridor West Terminus Intermodal Railyard -
West Basin Railyard Extension Y Y Y Y Y Y87.1 7 LA Port of Los Angeles Cargo Transportation Improvement Emission
Reduction Program - Phase 1 Segmented project. Requested FDR/SFDR to conform with updated policy. Y Y Y Y Y Y
87.2 7 LA Port of Los Angeles Cargo Transportation Improvement Emission Reduction Program - Phase 2
Segmented project. Requested FDR/SFDR to conform with updated policy. Y Y Y Y Y Y
88 7 LA Alameda Corridor East Construction Authority
Baldwin Avenue Grade Separation
FDR/SFDR Approved
Y Y Y Y Y Y Y Y Y Y Y Y89 4 SOL Northern California Trade
Corridors Coalition80/ 680/
12Solano I-80/680/12 Connector[SHOPP/TCIF]
90 7 VEN Ventura County Transportation Commission / Alameda Corridor Transportation Authority
Hueneme Road Widening
FDR Approved. Agency is working on SFDR.
Y Y Y Y Y Y Y Y Y Y Y92.1 3 YOL Port of West Sacramento West Sacramento/Port of West Sacramento Rail Plan
[Phase I - UPRR Track Improvements] Segmented project. Requested FDR/SFDR to conform with updated policy. Y Y Y Y
92.2 3 YOL Port of West Sacramento West Sacramento/Port of West Sacramento Rail Plan [Phase 2 - Cemex Track/Unit Track 2]
Segmented project. Requested FDR/SFDR to conform with updated policy. Y Y Y Y
92.5 3 YOL Port of West Sacramento West Sacramento/Port of West Sacramento Rail Plan [Phase 5 - Pioneer Bluff Bridge]
FDR Approved. Agency is working on SFDR.
Y P Y P Y P Y P93 11 SD San Diego Association of
GovernmentsSorrento Valley Double Track
FDR Approved. Agency is working on SFDR. Y Y Y Y Y Y Y Y Y Y Y Y
94 4 SCL Metropolitan Transportation Commission
101 US-101 Freeway Performance Initiative (FPI)[SHOPP/TCIF]
Y Y97 3 YUB Yuba County 70 SR 70 / Feather River Boulevard Interchange Y Y98 3 SAC Northern California Trade
Corridors Coalition50 Natoma Overhead Widening and Onramp
Improvements[SHOPP/TCIF]
Y Y Y Y Y Y
100 8 SBD San Bernardino Associated Governments
10 Tippecanoe Interchange Improvements, Phase II
Y Y Y Y Y Y101 10 SJ San Joaquin Council of
Governments /Caltrans99 State Route 99 Ramp Improvements
[SHOPP/TCIF] Y Y Y Y Y Y
102 7 LA Port of Los Angeles TraPac Terminal Automation-Automated Shuttle Carrier Maintenance & Repair Y Y Y Y Y Y
104 11 SD San Diego Association of Governments
905/ 125 State Route 905/State Route 125 Northbound Connectors
FDR Approved. Agency is working on SFDR. Y Y Y Y Y Y Y Y Y Y Y Y
106 7 LA Southern California Regional Rail Authority
Vincent Siding at CP Quartz and 2nd Platform at Vincent Grade/Acton Y Y Y Y Y Y
107 10 SJ San Joaquin Council of Governments /Caltrans
99 Southbound State Route 99 from Hammer Lane to Fremont Street Interchanges Ramp Metering [SHOPP/TCIF]
Y Y Y Y Y Y

California Department of Transportation Trade Corridors Improvement Fund Delivery Report Benefits for Completed Projects
TCIF Project Delivery Report3rd Quarter FY 2017-18
(January through March 2018)
Page 14
No benefit was reported in baseline and/or acutal Legend No Known Scope, Budget, or Schedule ImpactSegmented project, benefits will be calculated once all phases are complete I=Identified benefit Known Scope, Budget, or Schedule Impact
Y=Achieved benefit Potential Impact P=Pending, benefits will be captured at Supplemental Final Delivery Report
PROJECT NUMBER DISTRICT COUNTY NOMINATED BY ROUTE PROJECT
DESCRIPTIONFDR/SFDR STATUS
COMMENTS - CTC ACTIONS DURING QUARTER
Emissions ReductionBaseline Actual
SafetyBaseline Actual
VelocityBaseline Actual
ThroughputBaseline Actual
ReliabilityBaseline Actual
Congestion ReductionBaseline Actual
108.1 7 LA Port of Los Angeles YTI Terminal Enhancement & Truck Trip Reduction Program [Phase 1 - Berth/Wharf Improvements]
Agency is working on FDR.
Y Y Y Y Y Y108.2 7 LA Port of Los Angeles YTI Terminal Enhancement & Truck Trip Reduction
Program[Phase 2 - On-Dock Railyard]
Y Y Y Y Y Y
113 7 LA Southern California Regional Rail Authority
Control Point Soledad Speed Increase Project Agency is working on FDR.Y Y Y Y Y Y

Page 15
TCIF Project Action Plan Report Third Quarter FY 2017-18
Each project in the program is being monitored at the component level for potential scope, cost, and schedule changes to ensure timely delivery of the full scope as approved and adopted. Listed below are project action plans that have been identified to address known scope, cost, or schedule issues on projects.
ID D Co. Rte. Project Title Bond $ x1000
Total $ x1000
Variance
3.3 4 ALA N/A City of Oakland Outer Harbor Intermodal Terminals (OHIT) Segment 3 – City Site Prep Work and Backbone Infrastructure
$176,341
$247,241
Budget
3.4 4 ALA N/A City of Oakland Outer Harbor Intermodal Terminal (OHIT) Segment 4 – Recycling Facilities
$0
$46,600
Schedule
3.5 4 ALA N/A City of Oakland Outer Harbor Intermodal Terminals (OHIT) [Segment 5 - City Trade & Logistics Facilities]
$0
$99,400
Budget
Project Action Plan: #3.3: Construction cost has increased due to pricing for construction coming in higher than originally anticipated due primarily to the cost and quality of available soils required for import as well as additional environmental remediation requirements.
#3.4: The Project milestone schedule for Segment 4 has changed from baseline agreement as a result of extenuated difficulty effectuating a rail easement exchange with Burlington Northern Santa Fe Railway in addition to having to renegotiate price and terms with the Port of Oakland for the sale of an adjoining the 1.6 acre parcel (the “Inner Claw) which will provide primary and emergency access as well as additional on-site parking at the southern end of the North Gateway parcel to and from the East Burma Road for one of the two proposed Recycling Facilities. The rail easement has been resolved, executed and recorded. The purchase and sale agreement with the Port will be concluded by the end of May 2017and begin construction prior to the end of the second quarter of 2018. Construction is currently scheduled to be complete prior to the end of the fourth quarter of 2019 and closeout prior to the end of the second quarter 2020. #3.5: The City of Oakland has notified the CTC in presentations and communications that there will be a funding increase in the future. The money is coming from the Alameda County Transportation Commission (ACTC) in the amount of $41 million. The agreement is partially executed but currently not signed by all parties. Once the agreement is fully executed the City will include the information in the quarterly reports.
ID D Co. Rte. Project Title Bond $ x1000 Total $ x1000 Variance 4 4 ALA 880 I-880 Reconstruction, 29th & 23rd Avenues,
Oakland $97,912 $73,000 Schedule
Project Action Plan: Construction has been delayed approximately two years due to Buy America issues. Project was awarded 4/30/14, construction is 4 year duration plus1 year plant establishment. Project is scheduled to complete construction 11/01/19.
ID D Co. Rte. Project Title Bond $ x1000
Total $ x1000
Variance
11
10
SJ
N/A
San Francisco Bay to Stockton Ship Channel Deepening Project
$7,200
$15,000
Schedule

Page 16
Project Action Plan: #11: No change from previous report. Due to US Army Corps of Engineers scheduling of annual over dredging, annual contract specifications require work to commence in the Sacramento River, the Stockton Deep Water Channel work is scheduled to be the last reach of the contract. In order to maximize work in the annual dredging window, the Port has solicited for a supplemental Operations and Maintenance over dredging contract to advance the dredging work typically delayed by the USACOE contractor to the end of the dredging season. The dredging contractor hired by the Port may operate under the supplemental contract within the Stockton Deep Water Channel while the USACOE contractor is working in the Sacramento River. Once the USCOE contractor locates to the Stockton Deep Water Channel, by Federal Regulations, the Port supplemental contractor must cease operations and allow the USACOE contractor to dredge under the USACOE contract. The supplemental over dredging contract will enable the Port to meet the revised completion date 11/01/18.
ID D Co. Rte. Project Title Bond $ x1000
Total $ x1000
Variance
15.01
7
LA
N/A
San Gabriel Valley Grade Separation Program (Phase I – Archaeological Services)
$4,000
$4,000
Schedule
15.02
7
LA
N/A
San Gabriel Valley Grade Separation Program (Phase II – Trench and Fiber Optic relocation)
$233,778
$302,758
Schedule
Project Action Plan: #15.01 & 15.02: The project was delayed due to unprecedented rainstorms resulting in official declarations of emergencies throughout the state due to flooding in winter of 2017. Union Pacific Railroad work crews and material had to be diverted from the project to make emergency repairs to flood-damaged UPRR track, primarily in Northern California. As a result, ACE Construction Authority worked with the contractor to extend the contract by 257 calendar days.
ID D Co. Rte. Project Title Bond $ x1000
Total $ x1000
Variance
21
7
LA
N/A
Washington Boulevard Widening & Reconstruction
$5,800
$32,000
Schedule
Project Action Plan: #21: No change from previous report. The end of construction date has changed due to delays in relocating utility poles prior to the start of construction. After a six month delay with the utility company, the contractor was approved to start working on the south side of the project site in order to allow utility pole relocation work on the north end. The original delay has not produced any additional cost to the projected project budget. The estimated end of construction date is April 11, 2018.
ID D Co. Rte. Project Title Bond $ x1000
Total $ x1000
Variance
23
7
LA
710
Gerald Desmond Bridge Replacement
$299,795
$1,336,061
Schedule Budget
Project Action Plan: #23: Gerald Desmond Bridge (Also in the CMIA program) – $47,960,000 in additional SHOPP were allocated at the October 2016 CTC meeting. The funds will be used for Redesign of the tower - Construction Capital and Capital Outlay

Page 17
Support oversight to complete the project. The Main Span Bridge Released for Construction design is delayed as well as the main towers construction, the estimated end of construction date is March 22, 2019.
ID D Co. Rte. Project Title Bond $ x1000
Total $ x1000
Variance
46
8
RIV
N/A
Sunset Avenue Grade Separation
$8,278
$33,042
Schedule
Project Action Plan: #46: Construction is almost complete. However, three years have been added to the End Construction date due to a 3-year re-vegetation establishment requirement.
ID D Co. Rte. Project Title Bond $ x1000
Total $ x1000
Variance
53
8
RIV
N/A
Grade Separation at Magnolia Avenue Railroad Grade Crossing – BNSF
$17,673
$51,609
Schedule
Project Action Plan: #53: The End Construction date was delayed due to punch list items. Construction Contract Acceptance is currently waiting Board of Supervisors approval.
ID D Co. Rte. Project Title Bond $ x1000
Total $ x1000
Variance
54
8
RIV
N/A
March Inland Cargo Port Airport-I-215 Van Buren Blvd-Ground Access Improvements
$66,766
$8,835
Schedule
Project Action Plan: #54: The End Construction date was delayed due to processing landscape maintenance agreements and to complete the plant establishment activities. All construction items are now complete and accepted. Construction Contract Acceptance is awaiting Relief of Maintenance document processing. Project is scheduled to complete construction 04/01/18.
ID D Co. Rte. Project Title Bond $ x1000
Total $ x1000
Variance
68.2
11
SD
11
Segment 2 – SR 11 and Commercial Vehicle Enforcement Facility
$0
$245,400
Schedule
Project Action Plan: #68.2: Project delivery is delayed from FY 2016-17 to 2017-18 in order to gain time to achieve consensus in some areas, including the Intelligent Transportation Systems concept of operations on both sides of the border (i.e., flexible lanes, Port of Entry approach lanes), and agreements for the proposed facility regarding operations, maintenance and staffing commitments. This segment was split into two phases, 68.2 and 68.2A. Segment 68.2A will construct a four-lane highway, including the Siempre Viva Interchange. Construction completion is scheduled for June 20, 2020.

Page 18
ID D Co. Rte. Project Title Bond $ x1000
Total $ x1000
Variance
68.3
11
SD
11
Segment 3 – East Otay Mesa Land Port of Entry
$0
$336,900
Schedule
Project Action Plan: #68.3: Project delivery is delayed from FY 2016-17 to 2017-18 in order to gain time to achieve consensus in some areas, including the Intelligent Transportation Systems concept of operations on both sides of the border (i.e., flexible lanes, Port of Entry approach lanes), and agreements for the proposed facility regarding operations, maintenance and staffing commitments. Project schedule has been impacted by segment 68.2 being split into two segments 68.2 and 68.2A. Construction completion is scheduled for June 20, 2020.
ID D Co. Rte. Project Title Bond $ x1000
Total $ x1000
Variance
91
7
LA
101
Route 101 Improvements
$10,346
$46,525
Schedule
Project Action Plan: #91: Construction completion was delayed due to additional work needed on a retaining wall/sound wall because of field conditions. The additional work had to be evaluated and designed. This work affected the overall project schedule. Approval of additional Local funds held suspended construction completion for approximately 6 months. The new CCA, including Plant Establishment Period is the end of July 2018.
ID D Co. Rte. Project Title Bond
$ x1000 Total
$ x1000 Variance
95
7
LA
ACE Puente Avenue Grade Separation
$48,000
$99,019
Schedule
Project Action Plan: #95: Project schedule delays resulted from delays in relocating utilities. The project was also delayed due to unprecedented rainstorms resulting in official declarations of emergencies throughout the state due to flooding in winter of 2017. Union Pacific Railroad work crews and material had to be diverted from the project to make emergency repairs to flood-damaged UPRR track.
ID D Co. Rte. Project Title Bond
$ x1000 Total
$ x1000 Variance
103
4
SOL
Fairfield/Vacaville Intermodal Station-New track and Grade Separation
$11,000
$22,600
Schedule
Project Action Plan: #103: The End Construction date was delayed due the project having both PTA and TCIF funding on two separate contracts. The PTA contract was set to expire October 31, 2016, but was amended and extended to match the TCIF funding, which the estimated end of construction date is May 1, 2018.

Page 19
ID D Co. Rte. Project Title Bond $ x1000
Total $ x1000
Variance
105
5
MON
101
Sanborn Rd/US 101 Interchange Improvements & Elvee Drive Extension
$1,700
$4,300
Schedule
Project Action Plan: #105: The schedule change is due to conflicts with Overhead PG&E Utility lines. The 60kV overhead wire brought about a vertical clearance conflict with the proposed 6’ surcharge over the ground for consolidation. The consolidation method for the soil was modified to avoid the vertical clearance issue. Additional soils tested were done to design for new consolidation method and final report was completed February 2016. The contractor and resident engineer are working on the schedule to reduce the critical path to shorten the time for construction. Additionally, the new settlement method is mitigating time lost. Project is scheduled to complete construction 01/01/19.
ID D Co. Rte. Project Title Bond $ x1000 Total $ x1000 Variance 109
8
SBD
10
I-10 Pepper Avenue Interchange
$1,158
$10,111
Schedule
Project Action Plan: #109: The End Construction date was delayed due to punch list items including and adding detectable warning strips at the curb ramps. The estimated end of construction date is May 1, 2018.
ID D Co. Rte. Project Title Bond $ x1000 Total $ x1000 Variance 110 8 SB N/A Hellman Avenue Crossing Improvements
$1,790 $3,580 Schedule
Project Action Plan: #110: The City of Ranchos Cucamonga’s schedule is delayed due to complications with contract negotiation. The projected notice to proceed (NTP) date is changed from 12/31/16 to 04/01/17 due to the delay of the receipt of the fully executed funding agreement. Caltrans does not have delegated authority and was dependent on the Division of Procurement and Contracts to execute agreement.
ID D Co. Rte. Project Title Bond $ x1000 Total $ x1000 Variance 111 7 LA N/A Citrus Avenue Crossing Improvements
$1,455 $3,485 Schedule
Project Action Plan: #111: The notice to proceed date was changed due to delay of the receipt of the fully executed funding agreement. Caltrans does not have delegated authority and was dependent on the Division of Procurement and Contracts to execute agreement. The overall project construction end schedule remains the same. The project was awarded on December 9, 2016.
ID D Co. Rte. Project Title Bond $ x1000 Total $ x1000 Variance 112 7 LA N/A Ramona Boulevard Crossing Improvements
$1,455 $3,485 Schedule
Project Action Plan: #112: The notice to proceed date was changed due to delay of the receipt of the fully executed funding agreement. Caltrans does not have delegated authority and was dependent on the Division of Procurement and Contracts to execute agreement. The overall project construction end schedule remains the same. The project was awarded on December 9, 2016.

Page 20
ID D Co. Rte. Project Title Bond $ x1000 Total $ x1000 Variance
115.1 4 ALA N/A Cool Port Oakland Project $5,000 $8,605 Schedule 115.2 4 ALA N/A Cool Port Oakland Project $0 $83,300 Schedule
Project Action Plan: #115.1 and 115.2: The schedule to award the contract has been delayed because of two factors. The first, negotiations with relocating the tenant have taken longer than anticipated. Second, the construction schedule is reliant on the Union Pacific Railroad that is reviewing and approving the rail design which needs to be finalized before requesting bids. Projects are currently in construction and scheduled to complete construction 11/01/18.
ID D Co. Rte. Project Title Bond $ x1000 Total $ x1000 Variance 119 10 SJ N/A Navy Drive Widening $2,000 $6,813 Schedule
Project Action Plan: #119: The project is currently behind schedule. The federal matching funds caused a delay in awarding the project, however the project was awarded in July 11, 2017. Projects are currently in construction and scheduled to complete construction 09/15/18.
ID D Co. Rte. Project Title Bond $ x1000
Total $ x1000
Variance
121
7
LA
Middle Harbor Terminal Redevelopment Project Phase 2
$15,436
$156,355
Schedule
Project Action Plan: #121: The project is currently behind schedule. The project received allocation June 28, 2016 and the agency awarded the project November 21, 2017.