California Senate Health Committee Hearing on Hospital ...
41
1 Office of Statewide Health Planning and Development Office of Statewide Health Planning and Development California Senate Health Committee Hearing on Hospital Seismic Safety February 17, 2010 Testimony by: The Office of Statewide Health Planning and Development (OSHPD) Presented by: David M. Carlisle, M.D., Ph.D. OSHPD Director and Paul A. Coleman, Architect Deputy Director, OSHPD Facilities Development Division
Transcript of California Senate Health Committee Hearing on Hospital ...

1
Office of Statewide Health Planning and
Development
Office of Statewide Health Planning and
Development
California Senate Health Committee Hearing on Hospital Seismic SafetyFebruary 17, 2010
Testimony by: The Office of Statewide HealthPlanning and Development (OSHPD)
Presented by:
David M. Carlisle, M.D., Ph.D.
OSHPD Director
and
Paul A. Coleman, Architect
Deputy Director, OSHPD Facilities Development Division

2
Office of Statewide Health Planning and
Development
2
Office of Statewide Health Planning and
Development
Office of Statewide Health Planning and
Development
2
Module 1Hospital Seismic Safety Overview
Why is hospital seismic safety important?
Safety of patients and staff
Evacuation of seriously ill patients can be fatal
Provide medical assistance to earthquake victims
Beacon of life and hope for a community
Important to protect taxpayer, community, and investor dollars
Replacing a hospital building after it is destroyed can take a decadeor longer
Prolonged earthquake recovery retards an area’s long-term economicand social renewal, as well as its healthcare access
Showing the collapse of Olive View Medical Center and the Sepulveda VA hospital in the 1971 Sylmar earthquake along with destruction at Holy Cross Medical Center in the 1994 Northridge earthquake.
3
Office of Statewide Health Planning and
Development
3
Office of Statewide Health Planning and
Development
U.S. Seismic Zone Map
Large portions of California, containing our State’s mostpopulated regions, are in Seismic Zone 4 areas
With the exception of Alaska, Hawaii, and Nevada, most other states do not have large populations in Seismic Zone 4 regions. Most of California’s population, most of its hospitals, and 85% of its hospital buildings are located in Seismic Zone 4 regions.
“California is one of the world's most seismically active regions. More than 300 faults crisscross the state, which sits atop two of Earth's major tectonic plates, the Pacific and North American plates. About 10,000 quakes each year rattle Southern California alone, although most of them are too small to be felt.” – Sacramento Bee, 1/10/10 (after Magnitude 6.5 Ferndale Earthquake).
4
Office of Statewide Health Planning and
Development
4
Office of Statewide Health Planning and
Development
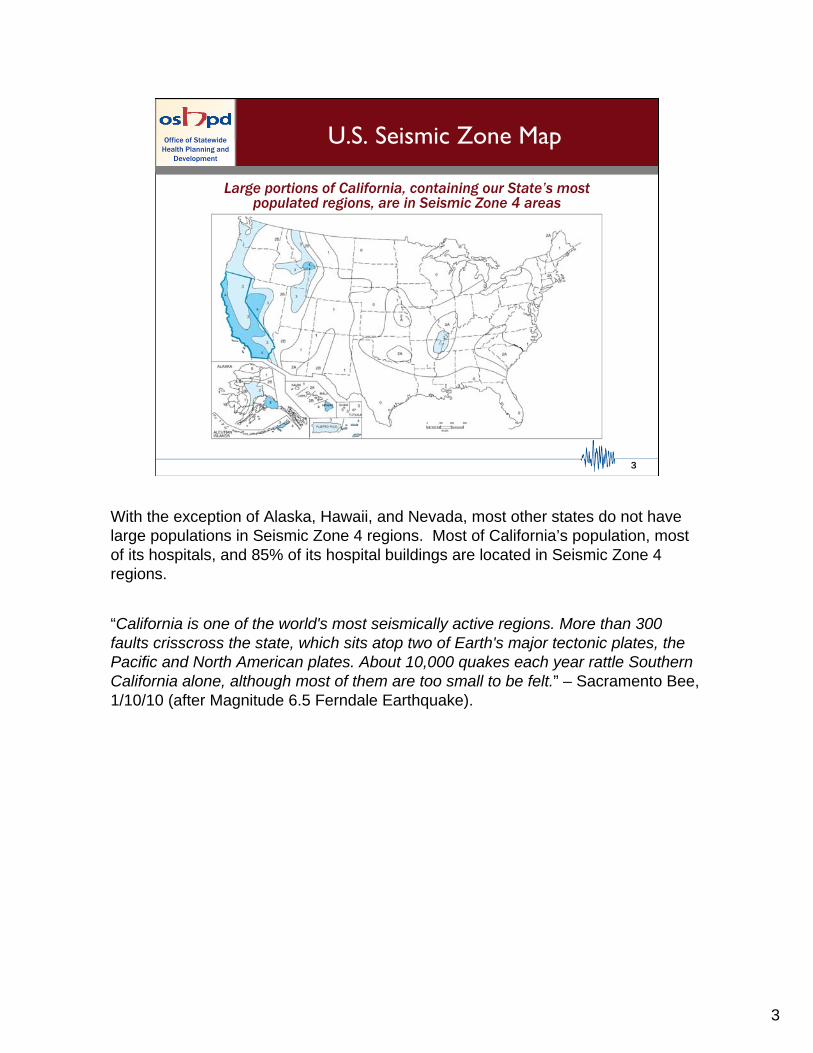
Seismicity and HospitalDensity in California
PGA* in g’s
• California has a 99% chance of experiencing an earthquake of magnitude 6.7 or greater in the next 30 years
• Most of California’s Hospitals are in Seismic
Zone 4 areas - Many of these are among the oldest hospital buildings in California
• 608 SPC-1 buildings are in the top three PGA regions (0 are in the bottom three)
• However:
Building Risk = Seismicity + Vulnerability
CaliforniaPeak GroundAcceleration (PGA)Map
California has a 99% chance of experiencing an earthquake (EQ) of magnitude6.7 or greater in the next 30 years
The chance is 97% in Southern California
The chance is 93% in Northern California
California has a 23% chance of a magnitude 6.7+ EQ between 2013and 2020
Chance of even larger EQs in California in the next 30 years:
Magnitude 7.0: 94%
Magnitude 7.5: 46%
Magnitude 8.0: 5%
Note: Buildings versus Facilities (or Hospitals) - Hospitals are usually comprised of more than one “building;” the average in California is 4-6 buildings per Facility (Hospital)

5
Office of Statewide Health Planning and
Development
5
Office of Statewide Health Planning and
Development
Age of California’s Hospital Buildings(Based on 2001 Survey)
Most of California’s hospital buildings were constructed prior to the 1973 Hospital Seismic Safety Act (HSSA).
YEAR BUILT (19XX)
Building Risk = Seismicity + Vulnerability
Most of these older buildings are in California’s most seismically-active regions.
When the HSSA was enacted, it was anticipated that hospitals would replace aging infrastructure, thus increasing the stock of complying hospital buildings in California.
This progressive compliance did not occur leading to the signing of SB 1953 mandating hospital compliance by certain deadlines.

6
Office of Statewide Health Planning and
Development
6
Office of Statewide Health Planning and
Development
An Important Lesson from the1994 Northridge EQ
Post-HSSA (1973) buildings had significantly better performance
24 (77%)20 (39%)Minor
7 (23%)31 (61%)Major
Nonstructural Damage
30 (97%)22 (43%)Green tagged
1 (3%)17 (33%)Yellow tagged
0 (0%)12 (24%)Red tagged (Major Damage)
Structural Damage
Post-Act(31 Buildings)
Pre-Act(51 Buildings)
Hospital buildings constructed after the HSSA (1973) were much less likely to sustain major structural or non-structural damage in the 1994 Northridge earthquake.

7
Office of Statewide Health Planning and
Development
7
Office of Statewide Health Planning and
Development
Initial SB 1953 Major Milestones
1973 1994 2002
2008 2030
2001
Seismic evaluations and plans for compliance submitted to OSHPD
Seismic evaluations and plans for compliance submitted to OSHPD
Improvements to allow
Evacuation
Improvements to allow
Evacuation
Prevent collapseand loss of life
Prevent collapseand loss of life
2013
Dim. Cap. Extension
Dim. Cap. Extension
All buildingscapable of
continued operation
All buildingscapable of
continued operation
------------ 19 years ------------
------------------------------ 36 years --------------------------
---------------------------------------------- 57 years --------------------------------------
SB 1953 EnactedSB 1953 Enacted
Alfred E. Alquist HSSA Enacted
Alfred E. Alquist HSSA Enacted
------------- 21 years ------------
---------- 15 years ---------! !
! – 1971 Sylmar, 1989 Loma Prieta, and 1994 Northridge EQs
!
California’s original Hospital Seismic Safety Act was enacted in 1973, 36 years ago.
SB 1953 was passed in 1994, 15 years ago, mandating HSSA compliance.
Hospital compliance with the “Collapse Hazard/Loss of Life” deadline is to occur in 2013, 19 years after SB 1953 became law and 40 years after the original HSSA.

8
Office of Statewide Health Planning and
Development
8
Office of Statewide Health Planning and
Development
Prevent collapseand loss of life
1.1.2008
Prevent collapseand loss of life
1.1.2008
Extensions to SB 1953 Milestones
1998 1999 2000 2002
2008 2030
2001
Seismic evaluations and plans for compliance submitted to OSHPD
Seismic evaluations and plans for compliance submitted to OSHPD
Improvements to allow
evacuation1.1.2002
Improvements to allow
evacuation1.1.2002
2013
SB 306SB 306
2015
SB 1661SB 1661
2020
All buildingscapable of
continued operation
All buildingscapable of
continued operation
SB1801SB1801SB 499SB 499
Four deadline extensions (extension dates are shown) have been passed since the enactment of SB 1953:
-SB 1801
-SB 1661
-SB 306
-SB 499
They will be described in detail in subsequent slides

9
Office of Statewide Health Planning and
Development
9
Office of Statewide Health Planning and
Development
Hospital Seismic Safety Definitions
SPC1SPC1 SPC2SPC2 SPC3SPC3 SPC4SPC4 SPC5SPC5
May be Capable of Providing Services to the Public after a Major EQ
SignificantRisk of
Collapse ina Major EQ
2008/2013 2030 2030+ 2030+ 2030+
LowRisk of
Collapse ina Major EQ
There are five “Structural Performance Categories” for hospital buildings:
-SPC-1 (“collapse hazard”) buildings must be removed from service by 2013
-SPC-2 buildings must be removed from service by 2030
-SPC-3, -4, and -5 buildings are able to stay in service after 2030
Note: SPC-3 and SPC-4 categories refer to existing building types only. New construction can only be SPC-5.

10
Office of Statewide Health Planning and
Development
10
Office of Statewide Health Planning and
Development
Original Inventory of Hospital Buildingsby Structural Performance Category: 2001
(*By Hospital Self-Report)
SPC-5342
(13%)
SPC-4724
(27.5%)
SPC-3334
(13%)
SPC-2200
(7.5%)
SPC-11027(39%)
The original inventory of SPC-1 buildings is based on results from the 2001 Hospital Survey (voluntary hospital “self-report”), using then-“state-of-the-art” FEMA 178 standards from 1996.

11
Office of Statewide Health Planning and
Development
11
Office of Statewide Health Planning and
Development
Initial NPC Ratingsof Hospital Buildings (2001)
(*By Hospital Self-Report)
NPC-12000(76%)
NPC-2412
(16%)NPC-3
50(2%)
NPC-4150(6%)
NPC-54
(<1%)
Unrated11
(<1%)
There are also five “Non-structural Performance Category” (NPC) classifications
(Non-structural systems that are critical to patient care must also comply with the HSSA: HVAC, Medical Gases & Storage, Sewage, Emergency Power & Fuel Storage, etc.)
Definitions:
NPC-1: does not meet any non-structural requirements
NPC-2: means of egress for building evacuation
NPC-3: critical care areas can provide limited services after EQ
NPC-4: only utility services may be disrupted
NPC-5: capable of providing all non-structural services after major EQ
• All buildings must be NPC-2 by 2002
• All buildings must be NPC-3 or greater by 2013/15
• All buildings must be NPC-4, or -5 by 2030

12
Office of Statewide Health Planning and
Development
12
Office of Statewide Health Planning and
Development
Module 2Hospital Seismic Safety Compliance

13
Office of Statewide Health Planning and
Development
13
Office of Statewide Health Planning and
Development
Compliance Options
• Mitigation Strategies― Remove from service ― Convert from patient care― Seismic Retrofit― Replacement― HAZUS
• Compliance Extensions― Diminished Capacity (from 2008 to 2013) – original SB 1953 legislation
― SB 1801 ― SB 1661― SB 306― SB 499
SB 1801 (only 2 facilities obtained extensions to 2013)
SB 1661 - allows SPC-1 extension from 2013 to 2015 for facilities with active compliance projects that are delayed due to circumstances beyond their control
SB 306 - SPC-1 mitigation later/fully functional hospital buildings sooner for financially challenged hospitals
SB 499 (2009) - expands HAZUS and SB 1661 extension eligibility
The effect of each legislative compliance extension (except for SB 1801) will be described in subsequent slides.
14
Office of Statewide Health Planning and
Development
14
Office of Statewide Health Planning and
Development
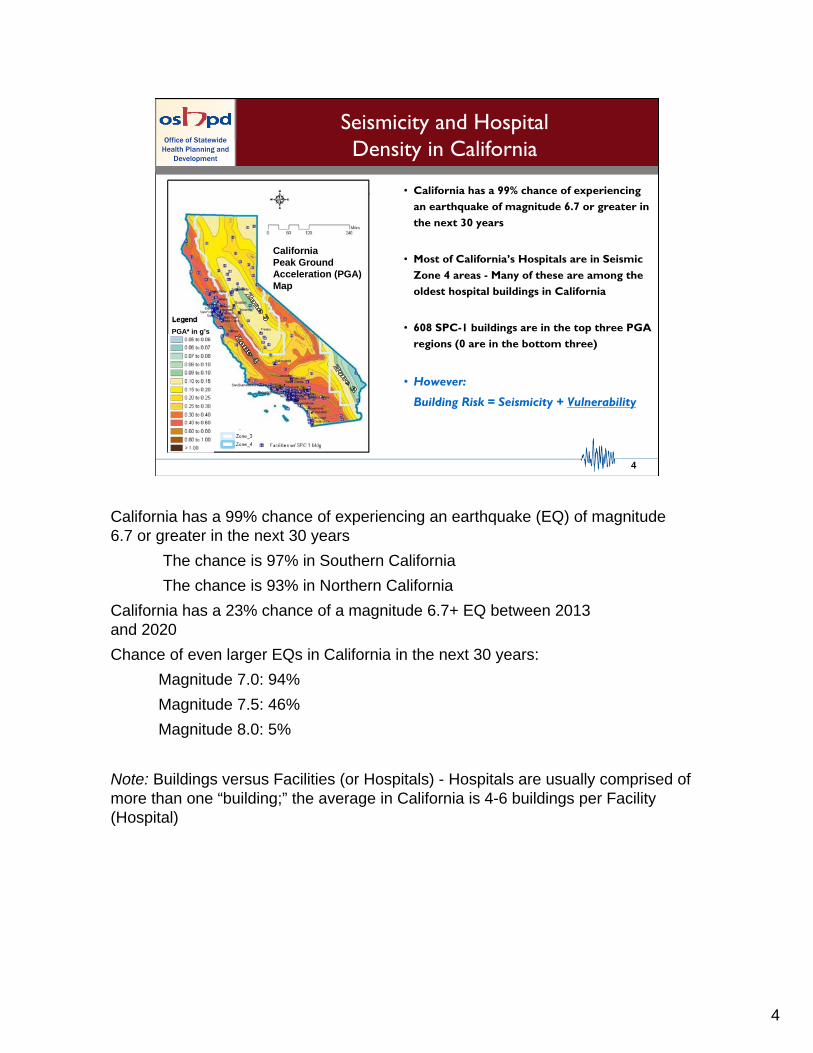
What is HAZUS?
SPC-1 Ratings – A Closer Look
--SPC1SPC1
SPC2SPC2 SPC3SPC3 SPC4SPC4 SPC5SPC5
Significant Risk of
Collapse inMajor EQ
2013
SPC2SPC2
2030
Imminent Threat
Minor Risk to Life
Little Riskof Collapse in
Major EQ
HAZUS:
“Not all SPC-1 Buildings are created equal”
“Risk equals Seismicity plus Vulnerability”
Hazards United States (HAZUS) is a standardized publicly available and contemporary nationally applicable earthquake loss estimation methodology.
HAZUS was developed and is supported and distributed by FEMA.
HAZUS estimates damage potential considering four building-specific attributes:
•The ground motion potential at the site (seismicity + soil quality)
•The type of construction (steel, concrete, wood frame, etc.)
•The building codes in force at the time of construction
•The quality of construction
HAZUS review allows a number of SPC-1 buildings to be re-classifiedto SPC-2.
Participation by hospitals in HAZUS is voluntary.

15
Office of Statewide Health Planning and
Development
15
Office of Statewide Health Planning and
Development
Collapse Probability of 303HAZUS-Evaluated Buildings
0.00%
2.00%
4.00%
6.00%
8.00%
10.00%
12.00%
14.00%
16.00%
18.00%
20.00%
22.00%
24.00%
26.00%
28.00%
30.00%
32.00%
34.00%
0 50 100 150 200 250 300 350
Number of Buildings as of 11/09
P (
Co
llap
se)
%
Current HAZUS Pass Threshold of
<0.75% Collapse Probability*
PASS FAIL
*
Hospitals have elected to have SPC-1 buildings reassessed by HAZUS.
To illustrate the HAZUS pass/fail concept the probability of collapse for 303 SPC-1 buildings calculated by the HAZUS methodology is illustrated graphically in ascending order.
Of these, 215 passed HAZUS (with a collapse probability of <0.75%) and became SPC-2 buildings.
79 buildings did not pass HAZUS review (with collapse probabilities ranging from 0.76% to 31.8%).
16
Office of Statewide Health Planning and
Development
16
Office of Statewide Health Planning and
Development
What does SB 306 do?
2013 2030“collapse hazard”
deadline“full functionality”
deadline
SB 306
2020
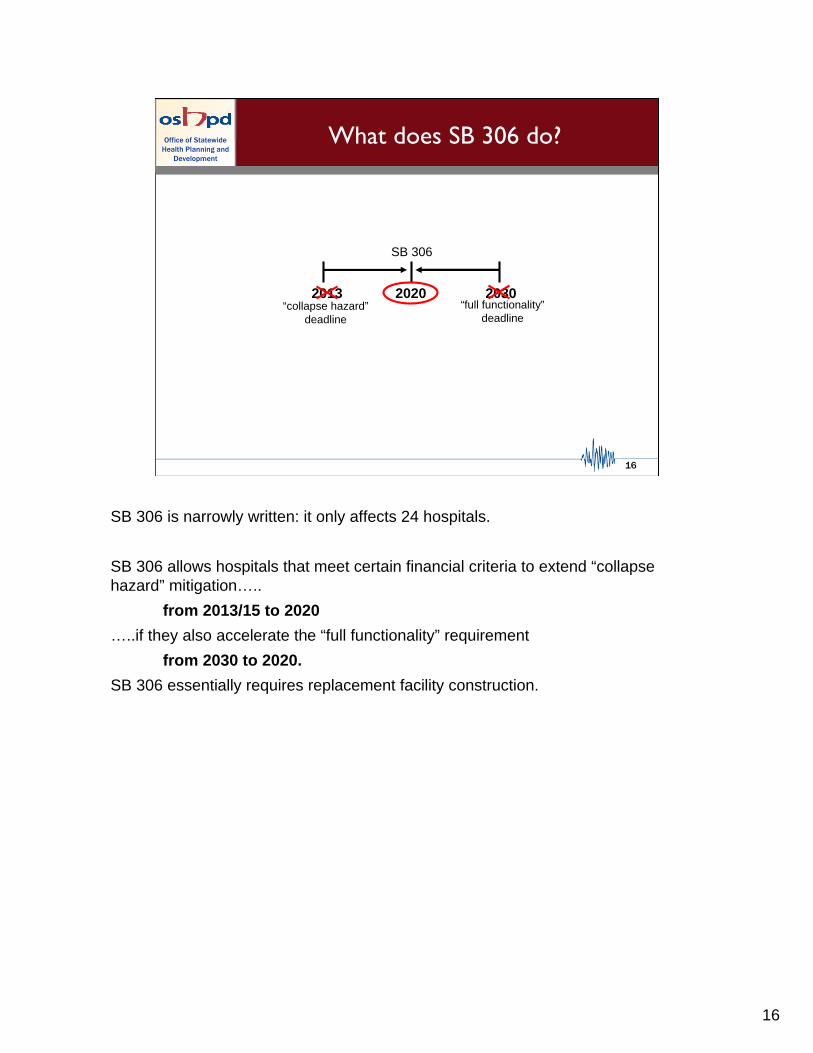
SB 306 is narrowly written: it only affects 24 hospitals.
SB 306 allows hospitals that meet certain financial criteria to extend “collapse hazard” mitigation…..
from 2013/15 to 2020
…..if they also accelerate the “full functionality” requirement
from 2030 to 2020.
SB 306 essentially requires replacement facility construction.

17
Office of Statewide Health Planning and
Development
17
Office of Statewide Health Planning and
Development
Summary of SB 1953Compliance (1/2010)
Total Hospital Buildings (2001):
2627
Total SPC-1 Buildings (2001):
1027
Total SPC-1 Buildings (1/2010):
825
Less thosenow
Compliant
Those now Compliant include:
• Buildings already decommissioned from General Acute Care service
• Formerly SPC-1 buildings that have already passed HAZUS
• Formerly SPC-1 buildings that have undergone advanced engineering analysis
• Buildings that have been seismically retrofitted to SPC-2

18
Office of Statewide Health Planning and
Development
18
Office of Statewide Health Planning and
Development
What does SB 1661 do?
•Allows hospitals with active “collapse hazard” mitigationprojects under construction to extend the 2013 SPC-1mitigation deadline to 2015
•Requires hospitals to report plans to mitigateSPC-1 “collapse hazard” risk
•Results of 2009 hospital report are presented today
A total of 242 hospitals, containing 819 SPC-1 buildings, reported information
Six hospitals did not provide any information on their SPC-1 buildings
As a result, findings from the 1661 hospital report should not be considered 100% complete resulting in some inconsistency in the numeric findings presented in subsequent slides

19
Office of Statewide Health Planning and
Development
19
Office of Statewide Health Planning and
Development
SB 1661 Hospital Report Results
186 hospitals reported that 576 SPC-1
buildings presently have active compliance
projects, SB 306 extensions, or will be
withdrawn from acute care service by 2013.
These 576 buildings are considered Likely To Comply (Compliance Group 1)
These are:
321 Buildings with active projects and replacement by 2013
74 Buildings with SB 306 Extensions to 2020
142 Buildings being withdrawn from acute care by 2013
39 Buildings with active projects and replacement by 2015 only if they are eligible for SB 1661 extensions
[Note: 130 Buildings in Compliance Group 1 also have HAZUS evaluations pending that may convert them from SPC-1 buildings to SPC-2 buildings]

20
Office of Statewide Health Planning and
Development
20
Office of Statewide Health Planning and
Development
SB 1661 Hospital Report Results(continued)
Of the remaining 243 buildings, 104 SPC-1 buildings from 64 hospitals are presently under HAZUS review but have no other plans for compliance.
These 104 buildings are consideredPossibly Compliant (Compliance Group 2)
If a conservative 50% HAZUS pass probability is assumed, 52 ofthese buildings will be re-categorized as SPC-2 but it is unknownwhich buildings these will be
All buildings presently under HAZUS review are eligible for a two-year extension to 2015 as permitted by SB 499

21
Office of Statewide Health Planning and
Development
21
Office of Statewide Health Planning and
Development
The remaining 139 SPC-1 buildings from 65 hospitals report no plans for compliance by the 2013/15 deadline and are not under HAZUS review.
SB 1661 Hospital Report Results(continued)
These 139 buildings are consideredPotentially Non-Compliant (Compliance Group 3)
Hospitals reported no plans for SB 1953 compliance for:
-54 Buildings to be removed from acute care service after 2013
-11 Buildings that have replacement projects that will be completed after 2013 (and no SB 1661 or SB 306 eligibility)
-14 Buildings that have active projects but reported no compliance timeline
-60 Buildings for which no compliance information at all is reported.

22
Office of Statewide Health Planning and
Development
22
Office of Statewide Health Planning and
Development
SB 1661 Hospital Report Resultsby Control Type (# SPC-1 bldgs.)
2 (7%)0 (0%)27 (93%)University of California(n=29)
139 (17%)104 (13%)576 (70%)All Buildings(n=819)
97 (20%)46 (10%)337 (70%)Not-for-profit(n=480)
22 (15%)41 (27%)86 (58%)Investor(n=149)
15 (19%)12 (15%)52 (66%)District(n=79)
3 (4%)5 (6%)74 (90%)City/County(n=82)
Potentially Non-compliant
(Group 3)
Possibly Compliant
(Group 2)
Likely to Comply
(Group 1)
Control Type
(# SPC-1 bldgs.)
Not all City/County hospitals applied for available SB 306 extensions

23
Office of Statewide Health Planning and
Development
23
Office of Statewide Health Planning and
Development
SB 1661 Hospital Report Resultsby Largest Systems (# SPC-1 bldgs.)
2 (7%)0 (0%)27 (93%)University of California(n=29)
49 (17%)39 (14%)198 (69%)unaffiliated
(n=286)
5 (13%)10 (25%)25 (62%)Adventist Health System(n=40)
23 (42%)7 (13%)25 (45%)Catholic Healthcare West(n=55)
2 (4%)4 (7%)51 (89%)Kaiser Foundation Hospitals (n=57)
4 (6%)3 (4%)63 (90%)Sutter Health(n=70)
Potentially Non-Compliant (Group 3)
Possibly Compliant
(Group 2)
Compliance Likely
(Group 1)
System Affiliation
(# SPC-1 bldgs)
It is anticipated that 50% of Compliance Group 2 will be redistributed into Group 1 after completion of HAZUS evaluation

24
Office of Statewide Health Planning and
Development
24
Office of Statewide Health Planning and
Development
Summary of SB 1953 Compliance (11/09)Includes SB 1661 Report Responses
Total Hospital Buildings (2001):
2627
Total SPC-1 Buildings (2001):
1027
Total SPC-1 Buildings (10/09):
825
Less thosenow
Compliant
Estimated SPC-1 Buildings Remaining:
~193
Likely to Complyper SB1661
Report
Likely to Comply per SB1661 Report includes:
•Those likely to pass HAZUS (assumes a 50% Pass rate)
•Those participating in the SB306 program
•Those indicating that by 2013/2015 their SPC-1 buildings will be
retrofitted
replaced or
removed from GAC service
25
Office of Statewide Health Planning and
Development
25
Office of Statewide Health Planning and
Development
Recent Legislative Change:SB 499
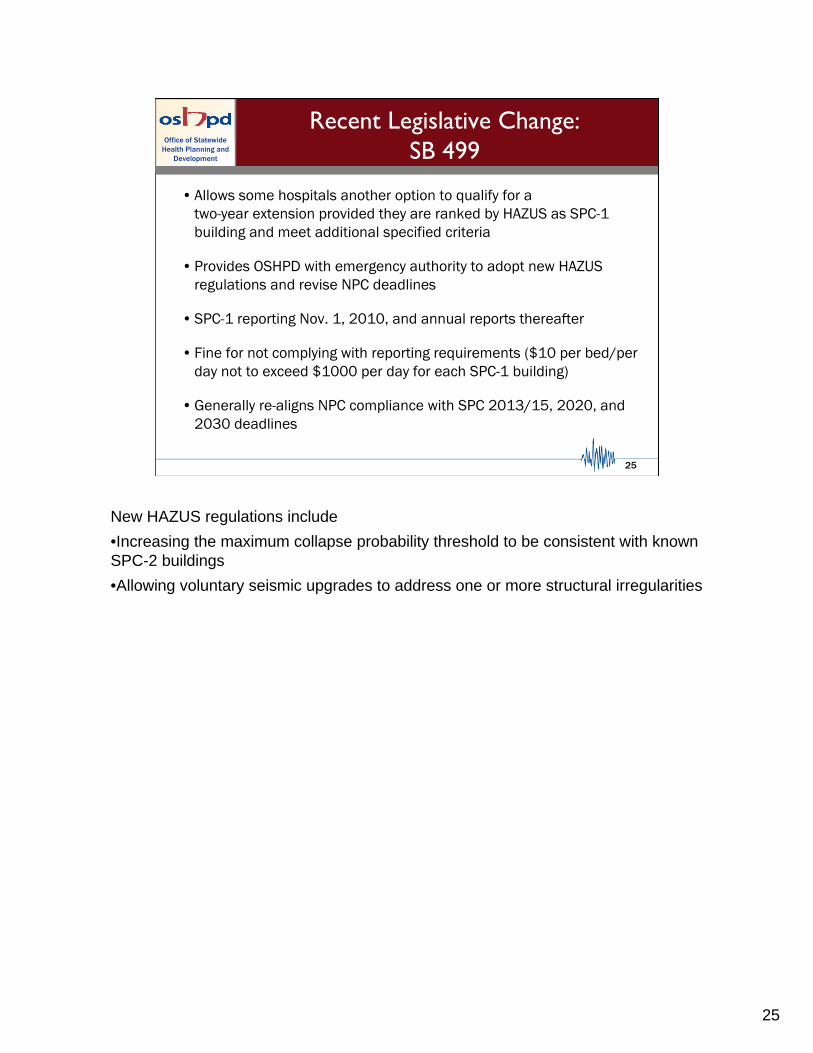
• Allows some hospitals another option to qualify for atwo-year extension provided they are ranked by HAZUS as SPC-1building and meet additional specified criteria
• Provides OSHPD with emergency authority to adopt new HAZUS regulations and revise NPC deadlines
• SPC-1 reporting Nov. 1, 2010, and annual reports thereafter
• Fine for not complying with reporting requirements ($10 per bed/per day not to exceed $1000 per day for each SPC-1 building)
• Generally re-aligns NPC compliance with SPC 2013/15, 2020, and 2030 deadlines
New HAZUS regulations include
•Increasing the maximum collapse probability threshold to be consistent with known SPC-2 buildings
•Allowing voluntary seismic upgrades to address one or more structural irregularities
26
Office of Statewide Health Planning and
Development
26
Office of Statewide Health Planning and
Development
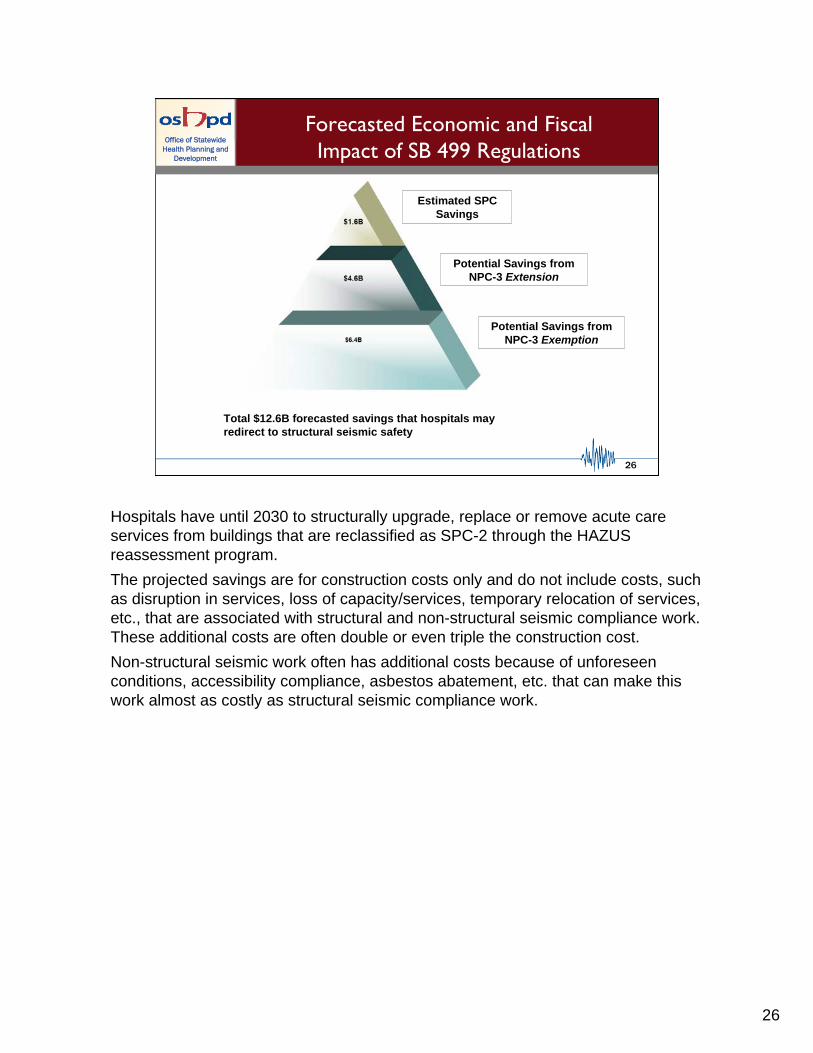
Total $12.6B forecasted savings that hospitals may redirect to structural seismic safety
Estimated SPC Savings
Potential Savings from NPC-3 Extension
Potential Savings from NPC-3 Exemption
Office of Statewide Health Planning and
Development
Forecasted Economic and FiscalImpact of SB 499 Regulations
Hospitals have until 2030 to structurally upgrade, replace or remove acute care services from buildings that are reclassified as SPC-2 through the HAZUS reassessment program.
The projected savings are for construction costs only and do not include costs, such as disruption in services, loss of capacity/services, temporary relocation of services, etc., that are associated with structural and non-structural seismic compliance work. These additional costs are often double or even triple the construction cost.
Non-structural seismic work often has additional costs because of unforeseen conditions, accessibility compliance, asbestos abatement, etc. that can make this work almost as costly as structural seismic compliance work.
27
Office of Statewide Health Planning and
Development
27
Office of Statewide Health Planning and
Development
0.00%
0.25%
0.50%
0.75%
1.00%
1.25%
1.50%
1.75%
2.00%
0 50 100 150 200 250 300 350
Number of Buildings as of 11/09
P (
Co
llap
se)
%
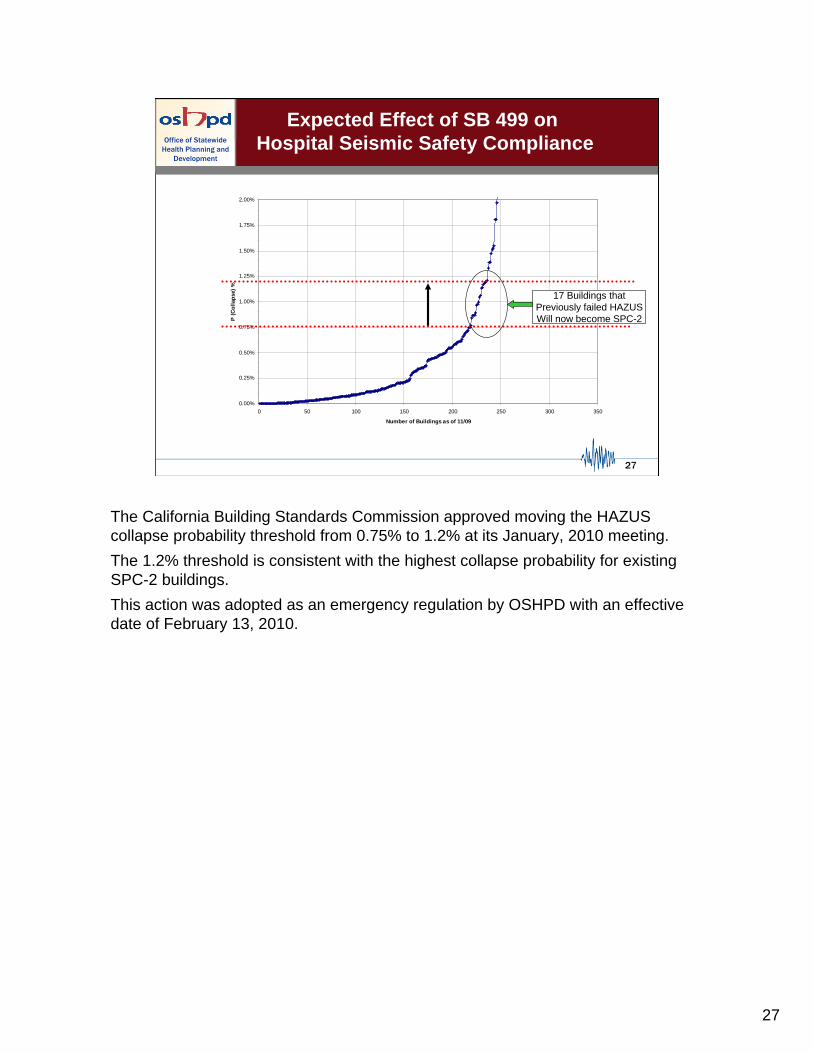
17 Buildings thatPreviously failed HAZUSWill now become SPC-2
Expected Effect of SB 499 on Hospital Seismic Safety Compliance
The California Building Standards Commission approved moving the HAZUS collapse probability threshold from 0.75% to 1.2% at its January, 2010 meeting.
The 1.2% threshold is consistent with the highest collapse probability for existing SPC-2 buildings.
This action was adopted as an emergency regulation by OSHPD with an effective date of February 13, 2010.
28
Office of Statewide Health Planning and
Development
28
Office of Statewide Health Planning and
Development
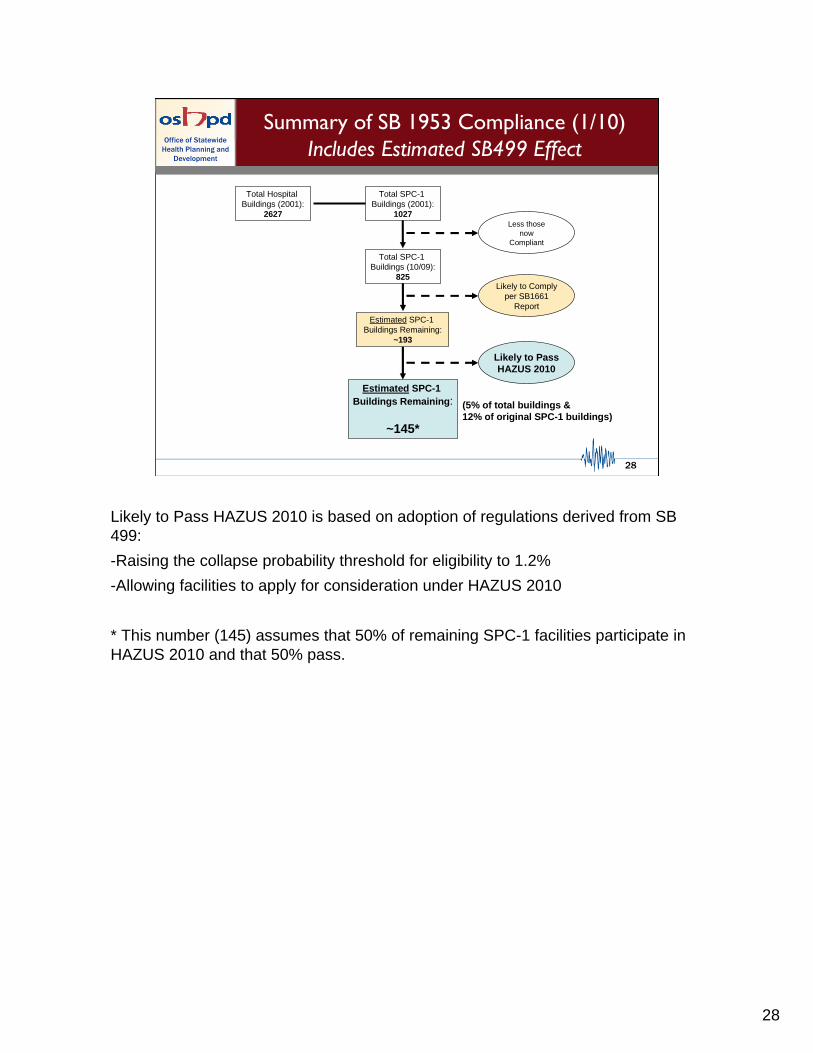
Summary of SB 1953 Compliance (1/10)Includes Estimated SB499 Effect
Total Hospital Buildings (2001):
2627
Total SPC-1 Buildings (2001):
1027
Total SPC-1 Buildings (10/09):
825
Less thosenow
Compliant
Estimated SPC-1 Buildings Remaining:
~193
Likely to Complyper SB1661
Report
Estimated SPC-1 Buildings Remaining:
~145*
Likely to PassHAZUS 2010
(5% of total buildings & 12% of original SPC-1 buildings)
Likely to Pass HAZUS 2010 is based on adoption of regulations derived from SB 499:
-Raising the collapse probability threshold for eligibility to 1.2%
-Allowing facilities to apply for consideration under HAZUS 2010
* This number (145) assumes that 50% of remaining SPC-1 facilities participate in HAZUS 2010 and that 50% pass.

29
Office of Statewide Health Planning and
Development
29
Office of Statewide Health Planning and
Development
Summary of SB 1953 Compliance (1/10)Includes Estimated SB499 Effect
However this number can…
…INCREASE because a number of facilities in Compliance Group 1 have placed their projects on hold
For example, if 2/3rds of the 196 Group 1 buildings with projects “on hold”ultimately fail to comply, the final number of non-compliant buildings would increase from ~145 to ~278
…DECREASE if the estimates of HAZUS 2010 participation and passage rates are too conservative
An increase in estimated participation from 50% to 75% and an increase in estimated passage from 50% to 75% would decrease the estimated final number of non-compliant buildings from ~145 to ~85
A number of Compliance Group 1 projects that are “on hold” are also pending HAZUS evaluation that could convert a significant number of these buildings to SPC-2 status, also decreasing the number of remaining SPC-1 buildings

30
Office of Statewide Health Planning and
Development
30
Office of Statewide Health Planning and
Development
Module 3
Hospital Financial Condition andSeismic Safety Compliance
OSHPD hospital financial information:
Annual Reports
Available through 2008
Quarterly Reports
Available through Quarter 3 of 2009
Hospitals are required to submit both types of financial reports to OSHPD
31
Office of Statewide Health Planning and
Development
31
Office of Statewide Health Planning and
Development
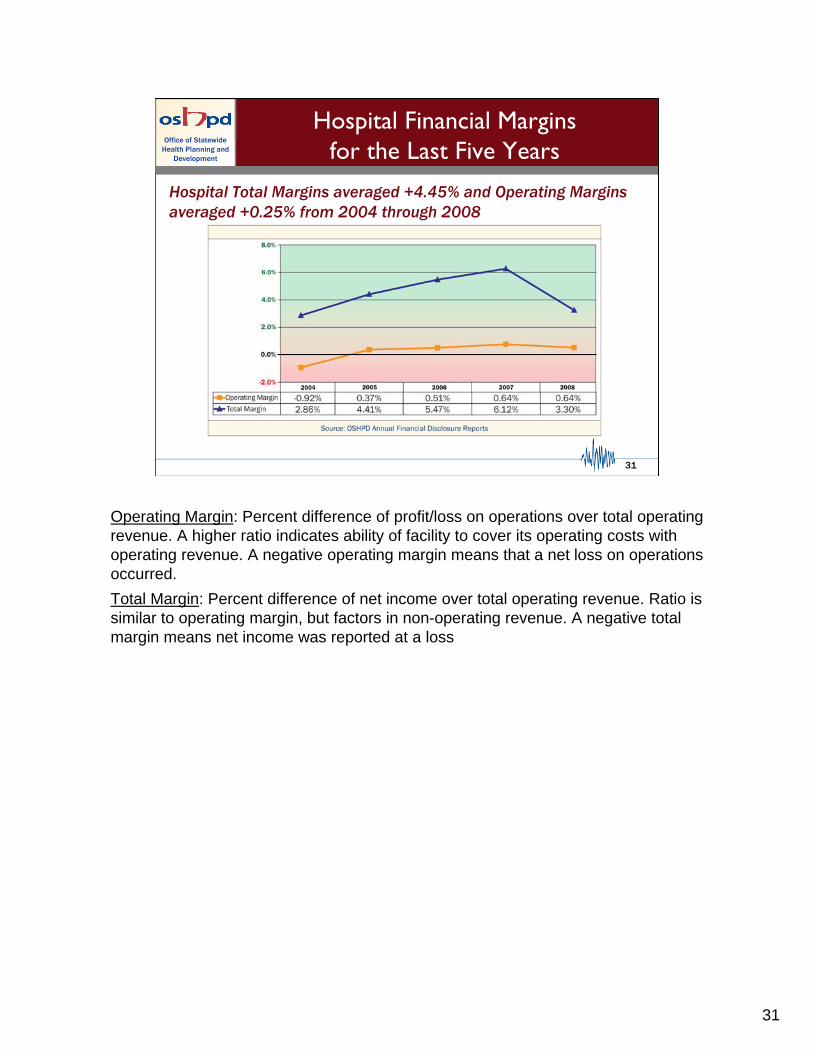
Hospital Financial Marginsfor the Last Five Years
Hospital Total Margins averaged +4.45% and Operating Margins averaged +0.25% from 2004 through 2008
Operating Margin: Percent difference of profit/loss on operations over total operating revenue. A higher ratio indicates ability of facility to cover its operating costs with operating revenue. A negative operating margin means that a net loss on operations occurred.
Total Margin: Percent difference of net income over total operating revenue. Ratio is similar to operating margin, but factors in non-operating revenue. A negative total margin means net income was reported at a loss
32
Office of Statewide Health Planning and
Development
32
Office of Statewide Health Planning and
Development
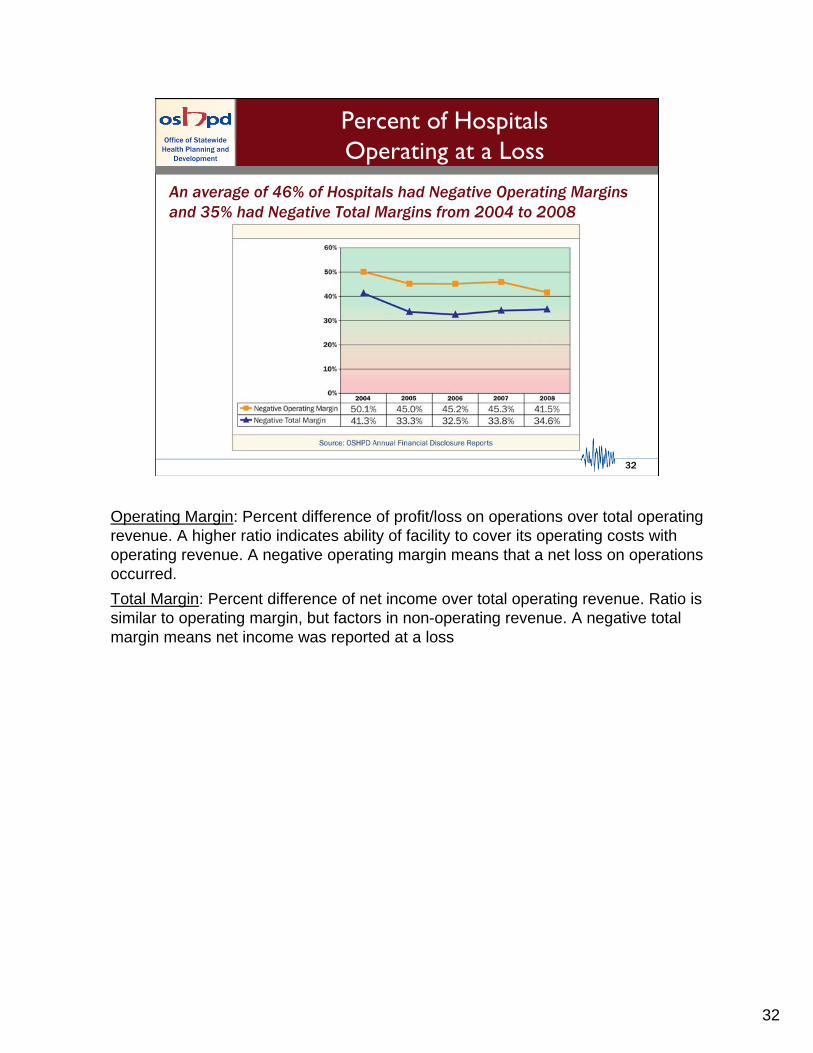
Percent of HospitalsOperating at a Loss
An average of 46% of Hospitals had Negative Operating Margins and 35% had Negative Total Margins from 2004 to 2008
Operating Margin: Percent difference of profit/loss on operations over total operating revenue. A higher ratio indicates ability of facility to cover its operating costs with operating revenue. A negative operating margin means that a net loss on operations occurred.
Total Margin: Percent difference of net income over total operating revenue. Ratio is similar to operating margin, but factors in non-operating revenue. A negative total margin means net income was reported at a loss

33
Office of Statewide Health Planning and
Development
33
Office of Statewide Health Planning and
Development
Net from Operationsvs. Net Income
Hospital net income was $12 billion ($802 million from operations) from 2004 to 2008
Net from Operations - the profit or loss from hospital operations, using only those revenue received by patients and payers, and other revenue related to operations (e.g., cafeteria sales, purchase discounts, sale of scrap, etc.). Used to calculate Operating Margin.
Formula = Total Operating Revenue (Net Patient Revenue + Other Operating Revenue) - Total Operating Expenses
Net Income - the profit or loss after all sources of revenue and expenses are included, along with income taxes and extraordinary items. Used to calculate Total Margin.
Formula = Net from Operations + Non-Operating Revenue - Non-Operating Expenses - Income Taxes - Extraordinary Items

34
Office of Statewide Health Planning and
Development
34
Office of Statewide Health Planning and
Development
Hospital Financial Marginsfor the Last Four Quarters
During the most recent four quarters, both Operating Margin and Total Margin declined below and then returned to just above their three year averages of 0.3% and 4% respectively.
12 Qtr.Averages
Operating Margin: Percent difference of profit/loss on operations over total operating revenue. A higher ratio indicates ability of facility to cover its operating costs with operating revenue. A negative operating margin means that a net loss on operations occurred.
Total Margin: Percent difference of net income over total operating revenue. Ratio is similar to operating margin, but factors in non-operating revenue. A negative total margin means net income was reported at a loss

35
Office of Statewide Health Planning and
Development
35
Office of Statewide Health Planning and
Development
Sources of Non-Operating Revenue
Investment Income declined precipitously in 2008 (but was anet positive of $2.6 billion from 2004 to 2008)
Contributions - unrestricted cash donations from third parties or individuals - a type of non-operating revenue.
Investment Income - income, gains and losses from unrestricted investments - a type of non-operating revenue. SEC guidelines require reporting investment income at fair market value, as well as when investments are sold.
County Funds - appropriations received by county hospitals from Realignment Funds, County General Funds, and Other County Funds - a type of non-operating revenue.
District Assessments - assessment revenue received by district hospitals - a type of non-operating revenue. There are five categories: assessments, county allocation of taxes, special district augmentations, debt service taxes, and state homeowner's property relief.

36
Office of Statewide Health Planning and
Development
36
Office of Statewide Health Planning and
Development
Operating Margin for Four of the largest Health Systems
(Kaiser does not provide comparable financial information)
Committee-Requested Examples of Operating Margin (by selected system compared to state average)

37
Office of Statewide Health Planning and
Development
37
Office of Statewide Health Planning and
Development
Total Margin for Four of the largest Health Systems
(Kaiser does not provide comparable financial information)
Committee-Requested Examples of Total Margin (by selected system compared to state average)

38
Office of Statewide Health Planning and
Development
38
Office of Statewide Health Planning and
Development
Detailed Financial Performance Data, 2008Committee-Requested Financial Indicators
(67 hospitals had missing data)
60.8%
60.3%
59.0%
Facility Occ. Rate
1.0%
2.0%
4.1%
Facility
[Total –Operating Margin]
-1.1%
0.8%
1.0%
Facility Total
Margin
-2.1%2.3%422.0
ComplianceGroup 3
“Potentially Non-Compliant”
-1.2%3.6%502.5
ComplianceGroup 2
“Possibly Compliant”
-3.1%2.3%762.1
ComplianceGroup 1
“Compliance Likely”
Facility Operating
Margin
Facility Operating Cash Flow
Margin
Facility Days
Cash on Hand
Facility Current Ratio
Occupancy Rate: Shows the percent of licensed beds occupied during the reporting period. A higher occupancy rate means more patients and generally more revenue. If occupancy rate is too high, it may mean insufficient beds exist and may result in ED overcrowding and/or ambulance diversion.
Current Ratio: Ratio of current assets to current liabilities. A higher ratio means more liquidity i.e., the ability of current assets to cover current liabilities.
Days Cash on Hand: Indicates number of days that current cash and cash equivalents area able to cover operating expenses. A higher number indicates that sufficient cash exists to meet operational needs. For hospitals operating in a health system, this ratio is often low at the facility level due to intercompany transactions involving cash.
Operating Cash Flow Margin: Percent difference of profit/loss on operations, excluding depreciation and interest, over total operating revenue. A higher ratio indicates ability of facility to cover its operating costs with operating revenue.
Operating Margin: Percent difference of profit/loss on operations over total operating revenue. A higher ratio indicates ability of facility to cover its operating costs with operating revenue. A negative operating margin means that a net loss on operations occurred.
Total Margin: Percent difference of net income over total operating revenue. Ratio is similar to operating margin, but factors in non-operating revenue. A negative total margin means net income was reported at a loss.

39
Office of Statewide Health Planning and
Development
39
Office of Statewide Health Planning and
Development
14.22%
32.32%44.64%
15%4.3%
9.42%
67.87%
37.5%
44.32%
42.17%
$0
$1,000,000,000
$2,000,000,000
$3,000,000,000
$4,000,000,000
$5,000,000,000
$6,000,000,000
$7,000,000,000
$8,000,000,000
$9,000,000,000
$10,000,000,000
2000 2001 2002 2003 2004 2005 2006 2007 2008 2009
Year
Co
ns
tru
cti
on
Co
st
SB_1953
Total Plan Review
Office of Statewide Health Planning and
Development
Investment in SB 1953/SeismicCompliance from 1/1/00 thru 12/31/09
2000-2009 Plan Review Summary
Total Plan Review$27.5 B
Seismic Compliance Projects$12.1B
44.2% of Acute Care Hospital Projects submitted for plan reviewSince 1/1/00 are SB 1953/SeismicCompliance related
All Compliance Groups
40
Office of Statewide Health Planning and
Development
40
Office of Statewide Health Planning and
Development
Office of Statewide Health Planning and
Development
40
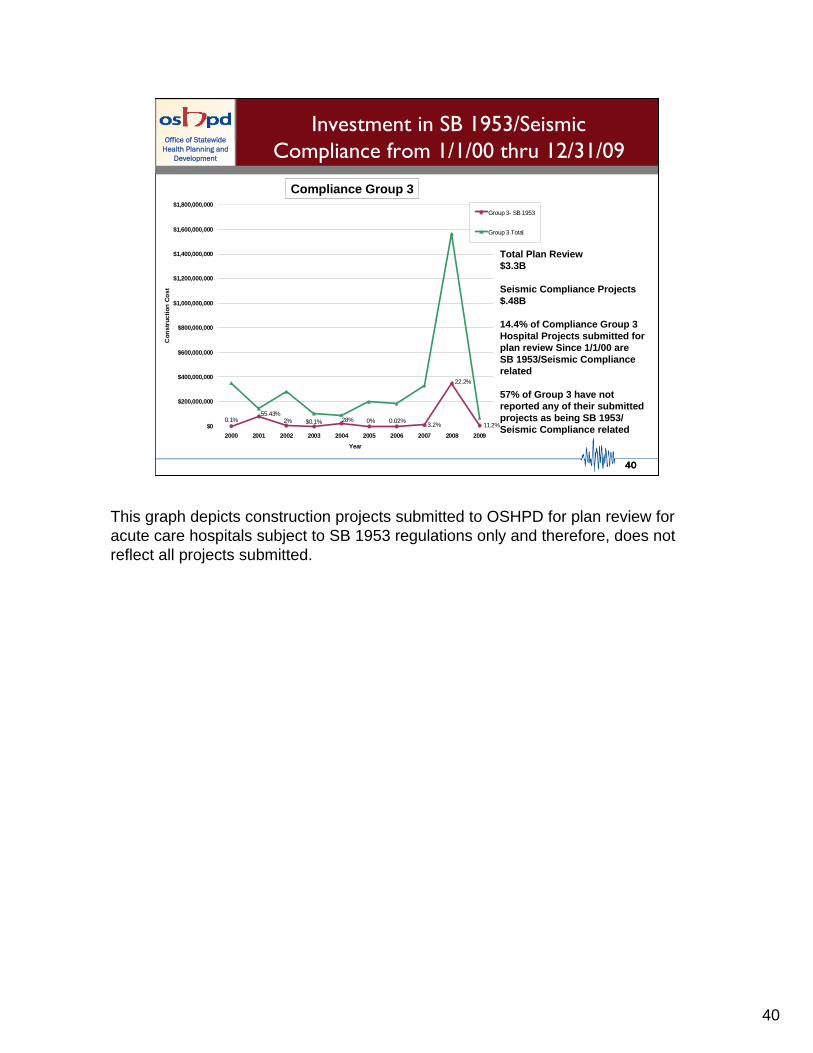
Investment in SB 1953/SeismicCompliance from 1/1/00 thru 12/31/09
Compliance Group 3
0.1%55.43%
2% $0.1% 28% 0% 0.02%3.2%
22.2%
11.2%$0
$200,000,000
$400,000,000
$600,000,000
$800,000,000
$1,000,000,000
$1,200,000,000
$1,400,000,000
$1,600,000,000
$1,800,000,000
2000 2001 2002 2003 2004 2005 2006 2007 2008 2009
Year
Co
ns
tru
cti
on
Co
st
Group 3- SB 1953
Group 3 Total
Total Plan Review$3.3B
Seismic Compliance Projects$.48B
14.4% of Compliance Group 3Hospital Projects submitted for plan review Since 1/1/00 are SB 1953/Seismic Compliance related
57% of Group 3 have not reported any of their submittedprojects as being SB 1953/Seismic Compliance related
This graph depicts construction projects submitted to OSHPD for plan review for acute care hospitals subject to SB 1953 regulations only and therefore, does not reflect all projects submitted.

41
Office of Statewide Health Planning and
Development
41
Office of Statewide Health Planning and
Development
End Slide….