California English Language Development Test · The California English Language Development Test...
98
California English Language Development Test Technical Report 2017–18 Edition
Transcript of California English Language Development Test · The California English Language Development Test...
California English Language Development Test
Technical Report 2017–18 Edition

THIS PAGE HAS
BEEN INTENTIONALLY
LEFT BLANK.
California Department of Education Assessment Development and
Administration Division
The California English Language Development Test
Annual Technical Report 2017–18 Edition

THIS PAGE HAS
BEEN INTENTIONALLY
LEFT BLANK.
CELDT 2017–18 Edition Technical Report
Table of Contents Chapter 1: Introduction ........................................................................................................... 1
1.1 Test Purpose ................................................................................................................ 11.2 Intended Population ...................................................................................................... 21.3 The CELDT Development History ................................................................................ 21.4 Testing Windows .......................................................................................................... 31.5 Significant Developments Related to the CELDT 2017–18 Edition............................... 31.6 Limitations to Test Interpretation .................................................................................. 41.7 Organizations Involved with the CELDT 2017–18 Edition ............................................ 51.8 Overview of the Technical Report................................................................................. 5
Chapter 2: Test Design and Format ....................................................................................... 72.1 The CELDT Blueprint ................................................................................................... 72.2 Item Formats, Test Components, and Language Functions ......................................... 82.3 Test Length and Timing .............................................................................................. 102.4 The CELDT Scores and Reports ................................................................................ 122.5 Equating Across CELDT Editions ............................................................................... 15
Chapter 3: Item Development ............................................................................................... 21Chapter 4: Test Assembly ..................................................................................................... 23
4.1 Rules for Item Selection ............................................................................................. 234.2 Test Forms and Structure ........................................................................................... 25
Chapter 5: Test Administration ............................................................................................ 275.1 Test Security and Confidentiality ................................................................................ 275.2 Procedures to Maintain Standardization ..................................................................... 295.3 Testing Students with Disabilities ............................................................................... 335.4 California Longitudinal Pupil Achievement Data System (CALPADS) Merge Process 38
Chapter 6: Performance Standards ..................................................................................... 396.1 Common Scale Development ..................................................................................... 396.2 Standard Setting Procedures ..................................................................................... 416.3 Standard Setting Results for All Grades and Domains ............................................... 436.4 General Test Performance Descriptors ...................................................................... 47
Chapter 7: Scoring and Reporting ....................................................................................... 497.1 Procedures for Maintaining and Retrieving Individual Scores .................................... 497.2 Multiple-Choice (MC) Scoring ..................................................................................... 51
CELDT 2017–18 Edition Technical Report
7.3 Constructed-Response (CR) Scoring ......................................................................... 527.4 Types of Scores.......................................................................................................... 557.5 Types of Reports ........................................................................................................ 567.6 Score Aggregation ...................................................................................................... 577.7 Criteria for Interpreting Test Scores ............................................................................ 61
Chapter 8: Test Analyses and Results ................................................................................. 638.1 Definition of Reporting Populations and Samples....................................................... 648.2 Classical Test Theory (CTT) Item Analysis ................................................................ 648.3 Reliability Analyses ..................................................................................................... 668.4 Decision Classification Analyses ................................................................................ 718.5 Validity Analyses ........................................................................................................ 738.6 Item Response Theory (IRT) Analyses ....................................................................... 758.7 Differential Item Functioning (DIF) Analyses .............................................................. 78
Chapter 9: Quality Control Procedures ............................................................................... 819.1 Quality Control of Test Materials ................................................................................ 819.2 Quality Control of Scanning ........................................................................................ 839.3 Quality Control of Image Editing ................................................................................. 849.4 Quality Control of Answer Document Processing and Scoring ................................... 849.5 Quality Control of Psychometric Processes ................................................................ 859.6 Quality Control of Data Aggregation and Reporting.................................................... 86
Chapter 10: Historical Comparisons .................................................................................... 87References ............................................................................................................................. 89
CELDT 2017–18 Edition Technical Report
List of Appendices A Technical History of the CELDT and CELDT Blueprints A-1 B Information Related to Content Validity B-1 C Writing and Speaking Rubrics History C-1 D Item Maps D-1 E Scale Score Summary Statistics E-1 F Descriptive Statistics and Domain Correlations F-1 G Classification Consistency and Accuracy G-1 H Raw Score to Scale Score Tables H-1 I Scale Score Frequency Distributions I-1 J Demographic Frequency Distributions J-1 K Classical Item Statistics K-1 L Comparison of Annual Assessment Versus Initial Assessment Item Difficulty L-1 M Unscaled Item Parameters M-1 N Item-Type Correlations N-1 O Rater Consistency and Reliability O-1 P Test Characteristic and Standard Error Curves P-1 Q Score Report Samples Q-1 R Proficiency by Grade and Grade Span R-1 S Cons stency of Local and Centralized Scoring S-1 T On-Scale Item Parameters T-1 U Reference Item Parameters U-1 V Long Descriptions V-1
CELDT 2017–18 Edition Technical Report
List of Tables Table 2.1: Number of Operational Items .................................................................................. 11
Table 2.2: Estimated Time Required to Administer the CELDT ............................................... 12
Table 2.3: Number of Operational Items by Type and Domain Raw Score Ranges ................ 13
Table 5.2: Number of Students Using Accommodations, Modifications, and Alternate Assessments ....................................................................................................................... 36
Table 6.1: Lowest and Highest Obtainable Scale Score Values .............................................. 40
Table 6.2: CELDT Cut Scores ................................................................................................. 44
Table 7.1: Percentage of Examinees by Performance Level, Initial Assessment .................... 58
Table 8.1: Number of Students in the 2017–18 Test Population ............................................. 63
Table 8.2: Mean p-Values, 2017–18 Initial Assessment .......................................................... 65
Table 8.3: Mean Point-Biserial Correlations, 2017–18 Initial Assessment ............................... 65
Table 8.4: Mean Omit Rates (Percent), 2017–18 Initial Assessment ...................................... 66
Table 8.5: Test Reliability Coefficients (Alpha), 2017–18 ........................................................ 68
Table 8.6a: Standard Error of Measurement (SEM) Values in Raw Score Units, 2017–18 ..... 69
Table 8.6b: Standard Error of Measurement (SEM) Values in Scale Score Units, 2017–18 ... 70
Table 8.7: Summary of Model Fit Statistics (Number of Items), 2017–18 ................................ 76
Table 8.8: Operational Test Scaling Constants, 2017–18........................................................ 77
Table 8.9: Mantel-Haenszel (MH) Data Structure, 2017–18 .................................................... 78
Table 8.10: Number of Items by Gender Differential Item Functioning Category, 2017–18 ..... 80
CELDT 2017–18 Edition Technical Report
California Department of Education November 2018 1
Chapter 1: Introduction
The California English Language Development Test (CELDT) was developed by the California Department of Education (CDE) in response to legislation requiring local educational agencies (LEAs) to
• assess students upon enrollment—based on results from a home language survey—for initial identification as English learners (ELs); and
• annually assess the English language proficiency of all ELs. As stated in California Education Code (EC) Section 60810 (Statutes of 1997), the State Superintendent of Public Instruction (SSPI) was required to select or develop a test that assesses the English language development (ELD) of pupils whose primary language is a language other than English and required LEAs to assess the ELD of all ELs. In addition, the CELDT must be aligned to the 1999 English-Language Development Standards for California Public Schools, Kindergarten Through Grade Twelve (1999 ELD Standards). The CELDT was designed to fulfill these requirements. With the adoption of new California ELD standards in 2012, the CDE began the development of a new assessment to replace the CELDT called the English Language Proficiency Assessments for California (ELPAC). The 2017–18 test cycle was a transition year between the CELDT and the new ELPAC. The ELPAC was used operationally for the first time in spring 2018 in fulfillment of requirements to annually assess the English language proficiency of ELs. The CELDT 2017–18 Edition was used solely for the purpose of assessing students upon enrollment for identification as ELs. This 2017–18 Edition Technical Report serves the purpose of discussing standard CELDT procedures, which in many cases were different for the 2017–18 test cycle because of the institution of the ELPAC, and for documenting the implementation of the 2017–18 test administration. This report makes note of modifications to standard CELDT procedures when applicable. The following sections examine the test’s purpose, intended population, development history, testing windows, and significant developments that occurred during the 2017–18 test cycle.
1.1 Test Purpose The California EC Section 60810(d) states the purpose of the CELDT.
The test shall be used for the following purposes: 1. To identify pupils who are limited English proficient. 2. To determine the level of English language proficiency of pupils who are
limited English proficient. 3. To assess the progress of limited-English-proficient pupils in acquiring the
skills of listening, speaking, reading, and writing in English. Responding to these requirements, the CDE, with the approval of the SSPI and the State Board of Education (SBE), developed the CELDT. The test assesses ELs in the domains of listening, speaking, reading, and writing. The CELDT consists of five separate tests each spanning one or more grade levels: kindergarten and grade one
CELDT 2017–18 Edition Technical Report
California Department of Education November 2018 2
(K–1), grade two (2), grades three through five (3–5), grades six through eight (6–8), and grades nine through twelve (9–12).
1.2 Intended Population All students in kindergarten through grade twelve (K–12), whose primary language is other than English as determined by a home language survey administered by the LEA (EC 52164.1[a]), must be tested with the CELDT. Students entering a California public school for the first time must be tested within 30 days from the date of enrollment to determine if they are ELs. Based on the test results, the student will be classified either as an EL or as initially fluent English proficient (IFEP). This application of the CELDT is defined as an initial assessment (IA). Students who are identified as ELs must be tested annually during the annual assessment (AA) window (July 1 through October 31) until they are reclassified as fluent English proficient (reclassified fluent English proficient—RFEP) based on the guidelines for reclassification established by the SBE (EC 313[f]). However, for the 2017–18 test cycle, students previously identified as ELs were tested with the ELPAC and not the CELDT. That means only IA testing was done in the CELDT program in 2017–18; no AA testing of EL students was done. As a result, the current 2017–18 Edition Technical Report only reports statistics calculated from the IA student population, not from the AA student population, which creates an important discontinuity relative to previous edition technical reports. Although the current technical report preserves the format, organization, tables, and charts of previous technical reports where possible, the statistics presented here are in many cases not comparable to those of previous years.
1.3 The CELDT Development History A number of committees representing California EL and English-language arts professionals developed the original blueprint for the CELDT. The CELDT field test took place in the fall of 2000 with a volunteer population of California schools administering the test to a small number of classes. The 2001–02 Edition (Form A) was then created using the field-test items and data. The original (base form) scale and performance-level cut scores created for the CELDT were based on the 2000 field test and 2001–02 Edition (Form A) data. Subsequent editions developed and used in 2002–03, 2003–04, 2004–05, and 2005–06 used these performance-level cut scores and were each anchored to the base form scale. Following the completion of the 2005–06 Edition AA testing window, the CELDT was rescaled using a common item design to place all CELDT scores onto a single, common scale. The common scale allows comparison of domain scores across adjacent grade spans and across testing administrations1. A standard setting meeting established new performance-level cut scores. The new CELDT common scale and cut scores were used operationally beginning with the 2006–07 Edition. For more information on this
1See the California English Language Development Test 2006–07 Edition (Form F) Technical Report, p. 30.
CELDT 2017–18 Edition Technical Report
California Department of Education November 2018 3
linking procedure and the creation of new performance levels, see the California English Language Development Test 2006–07 Edition (Form F) Technical Report, which can be found on the CDE website at http://www.cde.ca.gov/ta/tg/el/techreport.asp. For more information about the technical history of the CELDT from 2006–07 to the present, see appendix A. In 2009–10, the reading and writing domains were administered to K–1 students for the first time. A standard setting was conducted in January 2010 to establish performance-level cut scores for these domains. The CELDT Technical Advisory Group (TAG) has actively advised the CDE throughout the history of the CELDT, including test blueprint creation, performance-level standard setting, content standards alignment, and technical evaluation of the test. TAG members include experts in test development, English language acquisition, applied linguistics, psychometrics, EL issues, and data analysis, representing numerous campuses of the University of California and California LEAs. See appendix B for more information about the 2017–18 group of advisors.
1.4 Testing Windows The 2017–18 IA testing window remained the same as in previous administration years, from July 1, 2017 through June 30, 2018. Unlike in past years, there was no AA testing window to assess ELs (July 1 through October 31) for the CELDT because ELs took the ELPAC in spring 2018.
1.5 Significant Developments Related to the CELDT 2017–18 Edition
1.5.1 Change in Testing Requirements LEAs were required to test only students enrolling in schools for the first time and identified by the home language survey as needing to take an IA.
1.5.2 Form Reuse All test forms used in the 2015–16 administration year were reused in their entirety for the 2017–18 administration year. No items were replaced, and no field-test items were embedded in the test forms. All items were operational and thus counted toward student scores.
1.5.3 Psychometric Activities For the 2017–18 administration, the prime contractor, Educational Data Systems, continued to perform all psychometric analyses and technical reporting. It is important to note that because the 2015–16 Edition of the test was reused, all reported scores for the 2017–18 Edition were based on item calibration, scale transformation, and raw score to scale score conversion table work that was done for the 2015–16 Edition by the subcontractor, Educational Testing Service.
CELDT 2017–18 Edition Technical Report
California Department of Education November 2018 4
1.5.4 CELDT Item Bank Data Educational Data Systems completed item calibration on the 2017–18 Edition test results; however, unlike with past editions, Educational Data Systems did not load these item calibrations into the CELDT Item Bank. This is because the CELDT Item Bank contains only data based on AA testers, and the 2017–18 population consisted of IA testers only.
1.5.5 Elimination of the Data Review Module (DRM) The Data Review Module (DRM), the online application that LEAs use to update or fill in missing demographic data, was not employed for the 2017–18 test cycle. In previous editions, accountability calculations were based on the AA population; therefore, the completeness of the demographic data was crucial. Because the 2017–18 Edition did not include any AA testers, the DRM was not needed.
1.5.6 Modification of the Demographic Fields on the Answer Book The Annual Assessment bubble option, the Most Recent Previous Scale Scores, Most Recent Previous Grade, and Most Recent Previous Test Data fields were not included in the 2017–18 Answer Book. In previous editions, these demographic data fields were used for AA tester reporting. Because the 2017–18 administration did not include AA testers, these fields were not needed in the student Answer Books.
1.6 Limitations to Test Interpretation Results should never be presented publicly for any group for which the number is so small that the confidentiality of student information would be violated (i.e., groups with three or fewer students). Furthermore, it is important not to base inferences or important decisions on the results from small numbers of students. When comparing CELDT results, it is important to remember that scores cannot be directly compared across domains (e.g., scale scores of 400 on speaking and 400 on reading do not indicate a comparable degree of proficiency). However, scores can be directly compared within a domain—
• across editions (e.g., a scale score of 400 on speaking on the 2013–14 and 2017–18 editions do indicate a comparable degree of proficiency); and
• across adjacent grade spans (e.g., a scale score of 400 on speaking in grade 4 and a 400 on speaking in grade 7 indicate a comparable degree of proficiency).
See chapter 6 for a more detailed discussion of the CELDT equating methodology and information on making score comparisons.
CELDT 2017–18 Edition Technical Report
California Department of Education November 2018 5
1.7 Organizations Involved with the CELDT 2017–18 Edition
1.7.1 Educational Data Systems As the CDE’s prime contractor for the CELDT, Educational Data Systems has the overall responsibility for working with the CDE to deliver, maintain, and improve the CELDT and to oversee and coordinate the work of its subcontractors: Sacramento County Office of Education (SCOE) of Sacramento, California and Kornerstone Technology of Westlake Village, California. Educational Data Systems manages all program activities and has direct responsibility for developing and maintaining the CELDT website and interactive applications; running the operational aspects of the program, including material printing, distribution and retrieval, and test scoring and reporting; communicating directly with CELDT District Coordinators; managing the CELDT Item Bank data and psychometric activities; compiling this Technical Report; and producing the web-based test administration training presentations.
1.7.2 Sacramento County Office of Education (SCOE) SCOE develops interpretive support materials; provides the student speaking and writing samples for training materials and the Examiner’s Manuals; develops, maintains, and provides technical assistance for the online training site; and manages and presents the Scoring Training of Trainers (STOT) workshops. SCOE is also responsible for hiring, training, and supervising the constructed-response (CR) item scorers.
1.7.3 Kornerstone Technology Kornerstone Technology manages the Customer Support Center, which handles inquiries from LEAs about the CELDT program administration.
1.8 Overview of the Technical Report This report describes test development activities and the psychometric qualities of the 2017–18 Edition of the CELDT. Chapter 2 provides a summary of the CELDT test development, the types of items used in the CELDT, and the equating processes. Chapter 3 provides the item development process. Chapters 4 and 5 discuss test assembly and administration, respectively. Chapter 6 describes the CELDT standard- setting procedures, and chapter 7 summarizes the scoring and reporting procedures. Chapter 8 contains the analyses and results, including reliability and validity analyses. Chapter 9 discusses quality control procedures. Chapter 10, which in previous editions of the technical report provided historical comparisons of examinee performance and test characteristics, was removed because the data in these tables was based only on AA students and is not applicable to this edition’s report. The appendices at the end of the report include additional tables and supporting documents. Appendix A includes a description of the technical history of the CELDT. Appendix B contains information about the participants involved in the TAG. Appendix C contains
CELDT 2017–18 Edition Technical Report
California Department of Education November 2018 6
the scoring rubrics for the writing and speaking domains. Appendix D provides “item maps,” or listings by grade span (i.e., K–1, 2, 3–5, 6–8, and 9–12) and domain, of the operational items and their positions in the test forms. Appendix E includes scale score summary statistics for the 2017–18 Edition along with those from previous editions for comparison. Appendix F reports the correlations among student performance in the domains of listening, speaking, reading, and writing. Additional appendices provide information on the consistency and accuracy of the performance-level classification (appendix G); raw score to scale score conversion tables (appendix H); frequencies of scores at each score point; student demographic information; detailed item statistics; item parameters; item-type correlations; inter-rater reliability for CR writing items; CR ratings agreement between local and centralized scoring; test characteristic and standard error curves; samples of the various reports used for the CELDT; and the number and percentage of students categorized as proficient. Note that many tables in past technical reports contained only AA or a combination of AA and IA student data. As the only data available for the 2017–18 Edition is based on IA student results, tables and figures containing AA data were not included in this report or were modified to report on only IA data. Where possible, table numbering was maintained for comparison to the same table number in past technical reports. This report provides technical details on the operational test for only the 2017–18 Edition of the CELDT. Technical reports for previous editions of the test are available on the CDE website at http://www.cde.ca.gov/ta/tg/el/techreport.asp and by request from the CDE at [email protected].
CELDT 2017–18 Edition Technical Report
California Department of Education November 2018 7
Chapter 2: Test Design and Format
The California English Language Development Test (CELDT) assesses English language proficiency as defined by the 1999 English Language Development Standards for California Public Schools, Kindergarten Through Grade Twelve (1999 ELD Standards) with respect to four domains: listening, speaking, reading, and writing. The CELDT is an assessment of student proficiency in the English language. As such, the CELDT differs from academic achievement tests in several ways.
• The CELDT content is selected to measure student proficiency in the English language—how well students can listen, speak, read, and write in English—rather than to measure their achievement on the English-language arts California academic subject frameworks and standards. The California Common Core State Standards and related state academic achievement assessments give much more attention to academic content and measurement of reading/language arts (e.g., identifying plot elements, understanding the author’s purpose, comparing and contrasting text) than to the precursory English language skills (e.g., listening and speaking) needed to access academic subject matter.
• Listening and speaking items typically do not appear on academic achievement assessments, although an assessment of oratorical skills is sometimes made at higher grades.
• The CELDT reading domain test components assess word analysis at all grade levels. In achievement tests, word analysis is usually assessed only at kindergarten through grade two, when students are learning to decode words. An English learner may be learning these skills at any age.
• In the reading and writing domains, items are written to assess errors that non-native-English-speaking students commonly make; these are special types of items included in language proficiency tests.
• The CELDT scoring rubrics focus on English proficiency and are generally the same across all grade spans, demonstrating the focus on language acquisition, not content.
2.1 The CELDT Blueprint The CELDT blueprints and blueprint preface may be found in appendix A and on the California Department of Education (CDE) website at http://www.cde.ca.gov/ta/tg/el/ (select the “Researchers” tab). The performance of the items selected for inclusion in the CELDT, both individually and as a whole, must meet certain psychometric criteria in order to ensure the reliability, validity, and fairness of the test and continuity over time. These statistical “targets” are described in more detail in section 4.1.
CELDT 2017–18 Edition Technical Report
California Department of Education November 2018 8
2.2 Item Formats, Test Components, and Language Functions The CELDT contains three item formats: multiple-choice (MC), dichotomous-constructed-response (DCR), and constructed-response (CR). The CELDT MC items consist of a stem (question) and three or four response options. DCR items, which are found primarily in the speaking test, usually require a constructed response (i.e., a reply to a question), which is then evaluated with respect to a rubric as right or wrong by the test examiner. CR items are evaluated with respect to a rubric and, depending on the type of item, may receive a score of 0 through 2 (or up to 4 points). The following sections describe the test components and language functions assessed in each domain.
2.2.1 Listening Test Components and Language Functions The CELDT listening domain assesses receptive skills that are vital for effectively processing information presented orally in English. The listening domain consists of the following test components and their associated language functions:
• Following Oral Directions: Items require students to identify classroom-related nouns, verbs, and prepositions and demonstrate understanding of the relationships of words without having to read or reconfigure the directions to show aural comprehension.
• Teacher Talk: Items require students to comprehend important details, make high-level summaries, and understand classroom directions and common contexts.
• Extended Listening Comprehension: Items require students to follow the thread of a story, dialogue, and/or presentation of ideas; extract more details, pick out what is important, and use inference; and listen to learn.
• Rhyming: Items require students to demonstrate aural discrimination of medial and final sounds in English words by producing a word that rhymes with a pair of rhyming words presented by the test examiner (grades K–1 and 2 only).
2.2.2 Speaking Test Components and Language Functions The CELDT speaking domain assesses productive skills necessary for communicating in both social and academic settings. The speaking domain consists of the following test components and their language functions:
• Oral Vocabulary: Items elicit a single word or short phrase and assess simple to complex social, academic, and classroom vocabulary.
• Speech Functions: Items elicit one declarative or interrogative statement, assess formation of a response appropriate to a situation, and focus on question formation.
CELDT 2017–18 Edition Technical Report
California Department of Education November 2018 9
• Choose and Give Reasons: Items elicit two sentences or complete thoughts and assess independent clause formation and the ability to make rudimentary explanations or persuasive statements.
• 4-Picture Narrative: Items elicit a brief oral story and assess vocabulary and sentence formation as well as the ability to describe, use transitions, use past tense, sustain ideas on a topic, and show fluency.
2.2.3 Grades K–1 Reading Test Components and Language Functions The CELDT K–1 reading domain assesses receptive skills that are required to process information that is presented in written materials in English. The reading domain consists of the following test components and their language functions:
• Word Analysis: Items require students to recognize English phonemes, name uppercase and lowercase letters of the alphabet, and recognize sound/symbol relationships.
• Fluency and Vocabulary: Items require students to read simple words and phrases.
• Comprehension: Items require students to identify basic text features such as book titles.
2.2.4 Grades 2–12 Reading Test Components and Language Functions The CELDT grades 2–12 reading domain assesses receptive skills that are required to process information that is presented in written materials in English. The reading domain consists of the following test components and their language functions:
• Word Analysis: Items require students to recognize initial, medial, and final sounds; use rhyming; and identify syllables, affixes, and root words.
• Fluency and Vocabulary: Items require students to identify multiple-meaning words, synonyms, antonyms, phrasal verbs, and common idioms; and work with items in a modified cloze format.
• Comprehension: Items require students to follow the thread of a story or informational passage; extract meaningful details and pick out what is important; determine the main idea, author purpose, and cause and effect; read idioms; determine setting, character, and theme; extend and apply skills to new situations; use inference; and read to learn.
2.2.5 Grades K–1 Writing Test Components and Language Functions The CELDT K–1 writing domain assesses productive skills in written language. The writing domain consists of the following test components and their language functions:
• Copying Letters and Words: Items require students to copy lowercase and uppercase letters and commonly used words.
CELDT 2017–18 Edition Technical Report
California Department of Education November 2018 10
• Writing Words: Items require students to write words in response to prompts.
• Punctuation and Capitalization: Items require students to identify correct sentence-ending punctuation and the correct use of capital letters for proper nouns and to begin sentences.
2.2.6 Grades 2–12 Writing Test Components and Language Functions The CELDT grades 2–12 writing domain assesses productive skills in written language that are critical for communication of ideas and assignments in English. The writing domain consists of the following test components and their language functions:
• Grammar and Structure: Items assess grammar, prepositions, plurals, apostrophes, pronouns, possession, auxiliary verbs, interrogatives, and comparatives.
• Sentences: Items assess sentence formation and the use of prepositional phrases, compound and complex structures, and descriptive language.
• Short Compositions: Items assess sentence formation, paragraph writing, composition structure, and transitions; descriptive, expository, or persuasive writing; the ability to sustain a topic and show fluency; and spelling and mechanics.
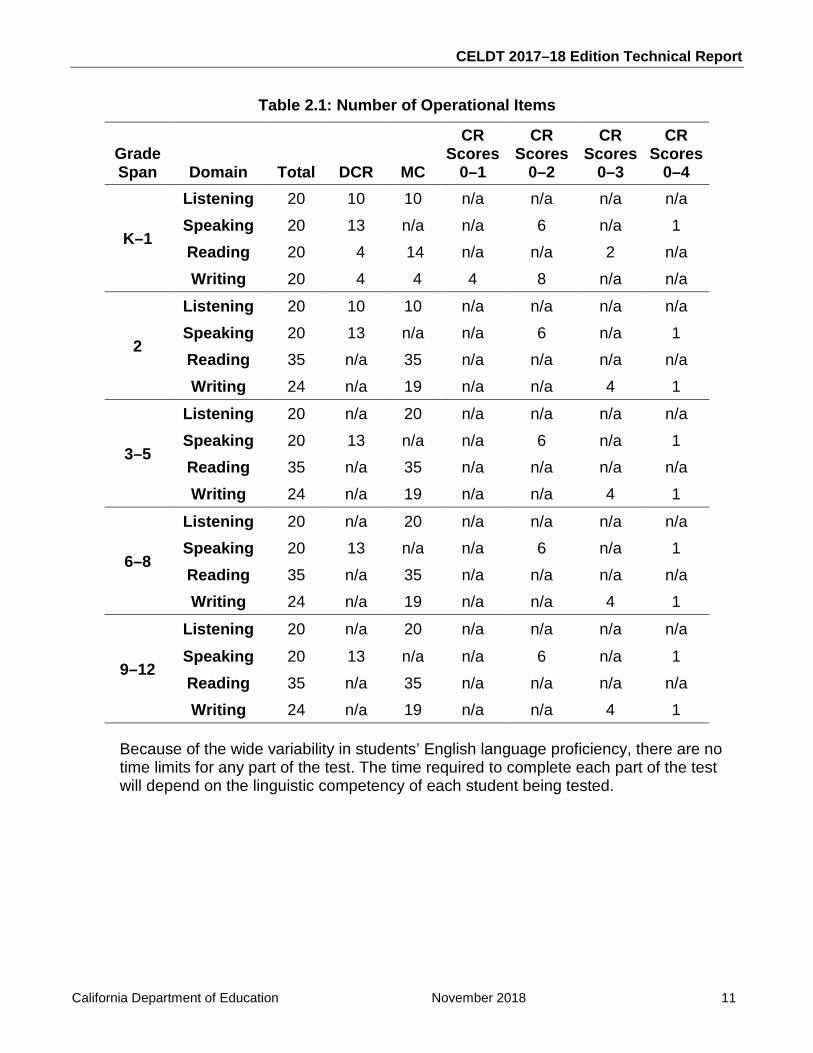
2.3 Test Length and Timing Table 2.1 presents a summary of the number of items by item type and domain. The 2017–18 Edition test form at each grade span contained only operational items (no field-test items); thus, all items contributed to a student’s score.
CELDT 2017–18 Edition Technical Report
California Department of Education November 2018 11
Table 2.1: Number of Operational Items
Grade Span Domain Total DCR MC
CR Scores
0–1
CR Scores
0–2
CR Scores
0–3
CR Scores
0–4
K–1
Listening 20 10 10 n/a n/a n/a n/a Speaking 20 13 n/a n/a 6 n/a 1 Reading 20 4 14 n/a n/a 2 n/a Writing 20 4 4 4 8 n/a n/a
2
Listening 20 10 10 n/a n/a n/a n/a Speaking 20 13 n/a n/a 6 n/a 1 Reading 35 n/a 35 n/a n/a n/a n/a Writing 24 n/a 19 n/a n/a 4 1
3–5
Listening 20 n/a 20 n/a n/a n/a n/a Speaking 20 13 n/a n/a 6 n/a 1 Reading 35 n/a 35 n/a n/a n/a n/a Writing 24 n/a 19 n/a n/a 4 1
6–8
Listening 20 n/a 20 n/a n/a n/a n/a Speaking 20 13 n/a n/a 6 n/a 1 Reading 35 n/a 35 n/a n/a n/a n/a Writing 24 n/a 19 n/a n/a 4 1
9–12
Listening 20 n/a 20 n/a n/a n/a n/a
Speaking 20 13 n/a n/a 6 n/a 1 Reading 35 n/a 35 n/a n/a n/a n/a Writing 24 n/a 19 n/a n/a 4 1
Because of the wide variability in students’ English language proficiency, there are no time limits for any part of the test. The time required to complete each part of the test will depend on the linguistic competency of each student being tested.
CELDT 2017–18 Edition Technical Report
California Department of Education November 2018 12
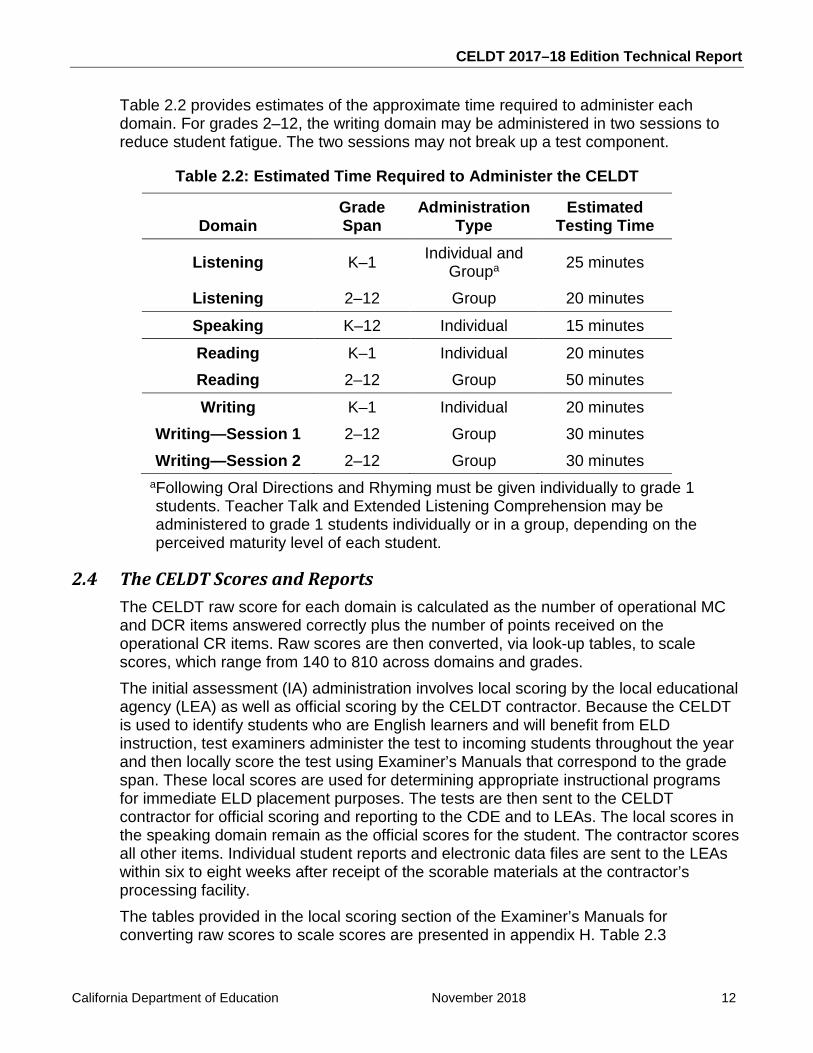
Table 2.2 provides estimates of the approximate time required to administer each domain. For grades 2–12, the writing domain may be administered in two sessions to reduce student fatigue. The two sessions may not break up a test component.
Table 2.2: Estimated Time Required to Administer the CELDT
Domain Grade Span
Administration Type
Estimated Testing Time
Listening K–1 Individual and Groupa 25 minutes
Listening 2–12 Group 20 minutes
Speaking K–12 Individual 15 minutes
Reading K–1 Individual 20 minutes Reading 2–12 Group 50 minutes
Writing K–1 Individual 20 minutes Writing—Session 1 2–12 Group 30 minutes Writing—Session 2 2–12 Group 30 minutes
aFollowing Oral Directions and Rhyming must be given individually to grade 1 students. Teacher Talk and Extended Listening Comprehension may be administered to grade 1 students individually or in a group, depending on the perceived maturity level of each student.
2.4 The CELDT Scores and Reports The CELDT raw score for each domain is calculated as the number of operational MC and DCR items answered correctly plus the number of points received on the operational CR items. Raw scores are then converted, via look-up tables, to scale scores, which range from 140 to 810 across domains and grades. The initial assessment (IA) administration involves local scoring by the local educational agency (LEA) as well as official scoring by the CELDT contractor. Because the CELDT is used to identify students who are English learners and will benefit from ELD instruction, test examiners administer the test to incoming students throughout the year and then locally score the test using Examiner’s Manuals that correspond to the grade span. These local scores are used for determining appropriate instructional programs for immediate ELD placement purposes. The tests are then sent to the CELDT contractor for official scoring and reporting to the CDE and to LEAs. The local scores in the speaking domain remain as the official scores for the student. The contractor scores all other items. Individual student reports and electronic data files are sent to the LEAs within six to eight weeks after receipt of the scorable materials at the contractor’s processing facility. The tables provided in the local scoring section of the Examiner’s Manuals for converting raw scores to scale scores are presented in appendix H. Table 2.3
CELDT 2017–18 Edition Technical Report
California Department of Education November 2018 13
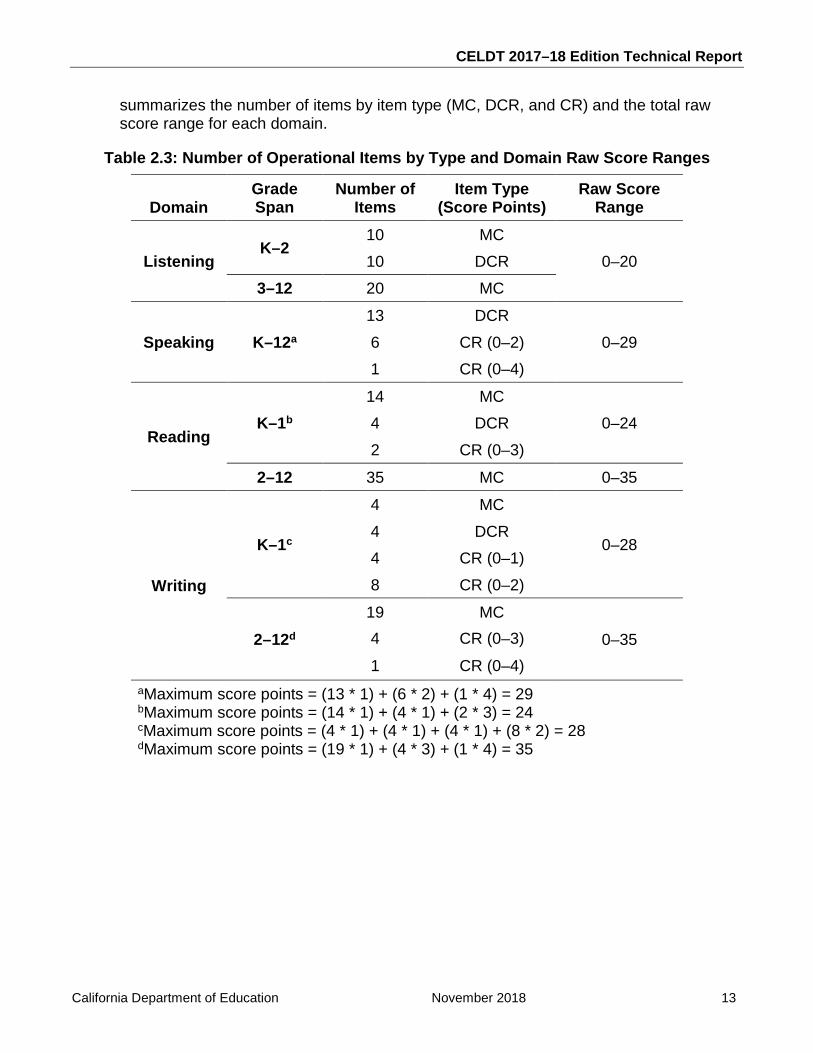
summarizes the number of items by item type (MC, DCR, and CR) and the total raw score range for each domain.
Table 2.3: Number of Operational Items by Type and Domain Raw Score Ranges
Domain Grade Span
Number of Items
Item Type (Score Points)
Raw Score Range
Listening K–2
10 MC 0–20 10 DCR
3–12 20 MC
Speaking K–12a 13 DCR
0–29 6 CR (0–2) 1 CR (0–4)
Reading K–1b
14 MC 0–24 4 DCR
2 CR (0–3)
2–12 35 MC 0–35
Writing
K–1c
4 MC
0–28 4 DCR 4 CR (0–1) 8 CR (0–2)
2–12d 19 MC
0–35 4 CR (0–3)
1 CR (0–4) aMaximum score points = (13 * 1) + (6 * 2) + (1 * 4) = 29 bMaximum score points = (14 * 1) + (4 * 1) + (2 * 3) = 24 cMaximum score points = (4 * 1) + (4 * 1) + (4 * 1) + (8 * 2) = 28 dMaximum score points = (19 * 1) + (4 * 3) + (1 * 4) = 35
CELDT 2017–18 Edition Technical Report
California Department of Education November 2018 14
2.4.1 Individual Scores and Reports Scores are reported for individual students and for groups of students. The Student Performance Level Report (SPLR) provides one scale score for each domain (listening, speaking, reading, and writing) as well as an overall scale score and a comprehension scale score. The comprehension scale score is calculated as the average of the scale scores of the reading and listening domains. For K–1, the overall scores are calculated as the weighted average scores of the four domains: .45 * listening + .45 * speaking + .05 * reading + .05 * writing. For grades 2–12, the overall scale scores are calculated as the unweighted average of the listening, speaking, reading, and writing scale scores. Individual reports also provide performance-level designations by categorizing scale scores as falling into one of five performance levels: Beginning, Early Intermediate, Intermediate, Early Advanced, and Advanced for all domains and the overall scale score. In addition to printed SPLRs, individual score results are provided on Student Record Labels and in electronic Student Score Files. Samples of the SPLRs and Student Record Labels are presented in appendix Q. The detailed methods for calculating the scale scores, performance levels, the comprehension score, and cut scores for each performance level, grade, and domain are presented in chapter 6.
2.4.2 Group Scores and Reports Group-level scores and reports are produced by aggregating individual scores. For the 2017–18 administration, two sets of group reports were provided to local educational agencies: one set with aggregated results for students tested July 1 and October 31 and a second set with aggregated results for students tested throughout the entire administration (July 1 through June 30). For the first period, the report package consisted of the Roster Report at the school level and the Performance Level Summary Report (PLSR) at the school and LEA levels. For the second period, only the PLSR was provided. The Roster Report displays an alphabetical listing by student last name of the scores for each student in the grade group. The scores listed include the scale scores and performance levels for each domain and the overall score. The PLSR is presented by grade and provides the number and percentage of students in each performance level for each domain separately and for the overall score. The total number of students, the average scale score, and the standard deviation of test scores for each group are also provided.
CELDT 2017–18 Edition Technical Report
California Department of Education November 2018 15
2.5 Equating Across CELDT Editions This section describes the equating design and process employed by the CELDT. However, because the 2017–18 Edition was a reuse of the 2015–16 Edition with no item changes, equating was not required for the 2017–18 Edition. The information in this section and the following subsections is provided to describe CELDT historical practice and is of limited relevance to 2017–18. CELDT raw scores are not comparable across different editions of the test because they are based on different sets of items, which differ in mean difficulty. Scale scores, however, are comparable across editions for a given domain because they consider changes in test difficulty caused by item replacement. A scale score of 400 in reading, for instance, indicates the same degree of reading proficiency regardless of whether the test was for IA or Annual Assessment (AA) students or was administered in 2014–15, 2015–16, 2016–17, or 2017–18, even though the test itself may have changed. Before 2006–07, this comparability only applied to comparing scale scores across CELDT editions for different years; it did not apply to comparing scores across grade spans. That changed with the introduction of the CELDT Common Scale in 2006–07, which placed all grade spans on a single scale for a given domain. Therefore, a reading scale score of 400 indicates the same degree of reading proficiency regardless of whether the student is in grade 3 or grade 10. However, this comparability does not extend across language domains. A 400 in the reading domain does not have the same meaning as a 400 in the writing, listening, or speaking domains (as these are qualitatively different content areas). In short, equating makes it possible to compare all students who take CELDT tests for a given domain—regardless of edition, grade, or IA/AA status—as if they had all taken the same test. The body of techniques used to ensure the comparability of scale scores across tests is called “test equating.” The primary technique used to ensure the comparability is to adjust the score of each student mathematically to consider the difficulty of the test. Comparability is also achieved by selecting items:
• For their strict adherence to the CELDT test blueprint
• To make tests for a given grade span as similar as possible in difficulty and discriminating power
• To match the expected average proficiency level of the target student population
• To minimize differential item functioning (DIF) so that items have the same difficulty regardless of, for example, the gender of the examinee
2.5.1 Adding New Test Items Newly written CELDT items are evaluated by field testing them with the CELDT population at least one year prior to using them operationally for scoring, meaning that they are present on the operational test but not used for assigning scores to students. Each item is calibrated using its field-test data according to one of three item response theory (IRT) probability models, which yield a set of “item parameters” that reflect the item’s difficulty, discriminating power, and tendency to promote guessing for multiple-choice items. For CR rating scale
CELDT 2017–18 Edition Technical Report
California Department of Education November 2018 16
items, there are also “step parameters” to measure the difficulty of each rating scale step. The various item parameters are converted to the metric of the CELDT Common Scale using the Stocking-Lord linking method and then stored in the CELDT Item Bank to be used later for building new test forms. The three IRT probability models are described below, along with the Stocking-Lord linking method.
2.5.2 Item Response Theory (IRT) Models IRT is used to calculate a person ability parameter and two or more item parameters that best model the probability that a given person will “succeed” on a given question. Thus, IRT is generally summarized as a set of IRT models or probability equations—the probability of success of a person on an item—with a somewhat different probability equation for each type of item. The CELDT employs three such IRT models:
• Three-parameter logistic (3PL) model for MC items
• Two-parameter logistic (2PL) model for DCR items
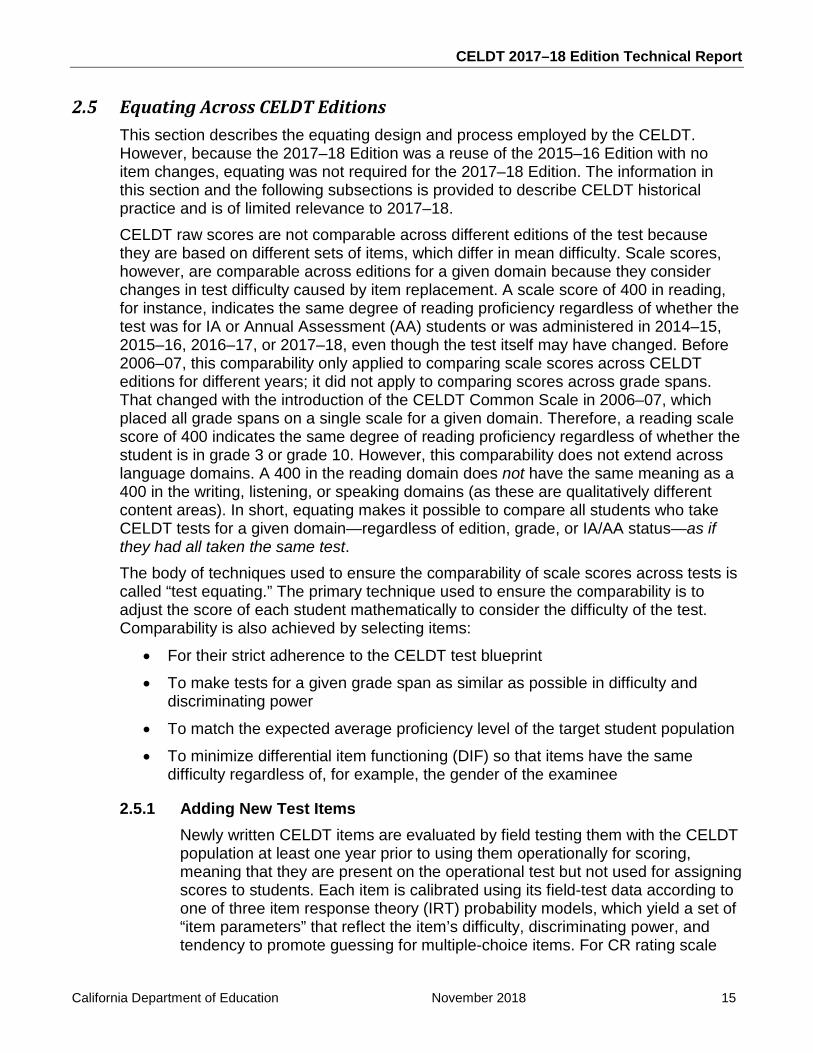
• Generalized partial credit (GPC) model for CR itemsWhat follows are the probability equations for these three IRT models. Their parameters are adjusted iteratively by IRT software to generate probabilities that yield values that fit the observed data as closely as possible. Three-Parameter Logistic (3PL) Model In the 3PL model (Lord and Novick, 1968; Lord, 1980), the probability that a student i with scale score iθ responds correctly to item j is expressed as
( ) ( )1
1 exp ( )j
j i jj i j
cP c
Da bθ
θ−
= ++ − −
,
where aj represents the item discrimination, bj the item difficulty, and cj the probability of a correct response by a very low-scoring student (also known as the “guessing” parameter). D is a scaling factor that brings the interpretation of the logistic model parameters in line with the normal distribution model parameters. Two-Parameter Logistic (2PL) Model The 2PL model, which is used for DCR items, is very similar to the 3PL model except that it drops the “guessing” parameter cj. That is,
( ) ( )1
1 exp ( )j ij i j
PDa b
θθ
=+ − −
CELDT 2017–18 Edition Technical Report
California Department of Education November 2018 17
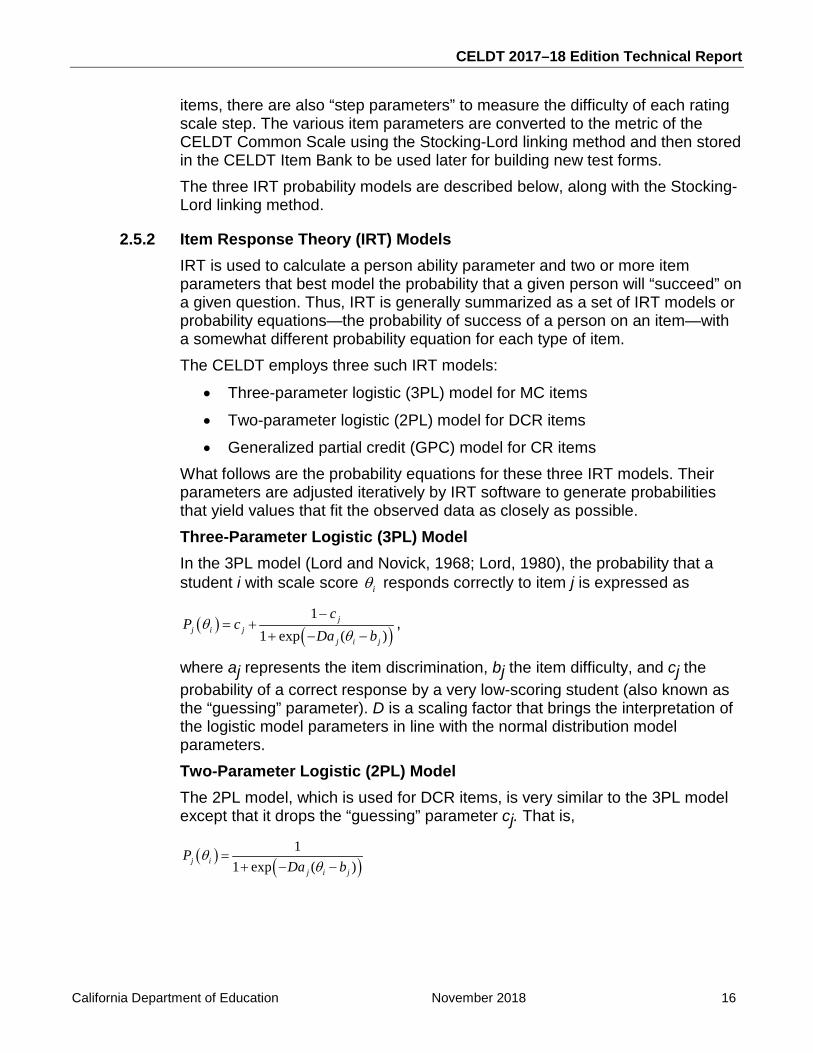
Generalized Partial Credit (GPC) Model The GPC model (Muraki, 1992) is an extension of the two-parameter logistic model to the polytomous case where an item is rubric scored. The general form of the GPC model is
( )
( )1
1 1
exp( ) ,
1 expj
k
j i j
jk i m c
j i jc
a bP
a b
νν
νν
θθ
θ
=
= =
− = + −
∑
∑ ∑
where v represents the mth score category for item j. Or equivalently,
( )( )
( )0
0 0
exp,
expj
k
j i
jk i m c
j ic
ZP
Z
νν
νν
θθ
θ
=
= =
=
∑
∑ ∑
where ( ) ( )jk i j i jkZ a bθ θ= − .
Stocking-Lord Linking Method The Stocking-Lord (1983) characteristic curve linking method is used to put the raw item-parameter estimates obtained in the calibration (reported in appendix M) onto the CELDT common scale. Once items are put on the common scale, they can be used operationally in subsequent editions. The multiplicative (m1) and additive (m2) constants (table 8.8) can be applied to the item-parameter estimates to obtain the scaled item-parameter estimates, using the following formulas:
2.5.3 Equating Process (as applied historically in the CELDT) Equating is a way to adjust for differences between tests so that students who take different tests can be compared as if they all took the same test. For the CELDT, equating begins with the analysis of data collected within the AA testing window. A random sample of approximately 75,000 students per test (for a given domain and grade span, 18 tests in all) is drawn from this test population. Because there is no established AA population for kindergarten students, students are selected from the IA population tested during the AA testing window. This represents the vast majority of kindergarten students.
CELDT 2017–18 Edition Technical Report
California Department of Education November 2018 18
The scoring key for MC items is first verified by means of an analysis of response frequencies as well as other quality control checks. IRT software is then used to calibrate items from the sample dataset, resulting in difficulty, discrimination, and “guessing” parameters for each item as applicable. These are based on a logit metric specific to each test and not yet equated to other tests. Analysts also check the adequacy of the calibration to ensure that, for example, the parameter calibrations converged properly and that the parameters yield a reasonable fit between the data and the IRT model. The Stocking-Lord linking method is used to convert all item parameters to the CELDT Common Scale. This is done by calculating scaling constants (see “Stocking-Lord Linking Method” above) that, when applied to unscaled item parameters, yield transformed parameters that match as closely as possible to the Common Scale item parameters for those items already residing in the CELDT Item Bank from previous test administrations. The same scaling constants are applied to the parameters of field-test items that have not been added to the bank yet. The new and refreshed item parameters are added to the CELDT Item Bank. Note that any given item may have multiple versions of item parameters calculated from previous administrations. A variety of classical and IRT statistics useful for diagnosing item quality—for example, point-biserial and DIF statistics—are also added to the CELDT Item Bank and used in the equating process. When it comes time to design a new test form, test designers draw suitable items from the CELDT Item Bank and use the item parameters to simulate the overall difficulty and discriminating power of the proposed test form. This analysis is represented graphically as a “test characteristic curve” (TCC), which is an ogival (S-shaped) curve that relates each possible person scale score (called “theta”) on the x-axis to an expected proportion of items correct on the y-axis (see appendix P for examples). The test information curve (TIC) and the conditional standard error of measurement (CSEM) curve, which provide vital information on how precise a student’s measure would be at each level of theta, are also used to analyze the proposed test form. The psychometric goal is to design a new test form in which the TCC line lies on top of, or is at least parallel to, the TCC lines of test forms from previous test administrations, and in which the CSEM is minimized and TIC maximized around the most important cut points and sections of the scale. Usually, the most recent version of item parameters for each item is used in these analyses. Statistics from field-test items are used only if the items have been equated and have been deemed adequate for operational selection. Once the items for a test form have been selected and the test form is deemed equated, both on statistical grounds and in terms of content validity, a raw score to scale score conversion table is generated for assigning scale scores to students based on their raw scores. Each raw score corresponds to one, and only one, scale score. These conversion tables are distributed to LEAs for local
CELDT 2017–18 Edition Technical Report
California Department of Education November 2018 19
scoring of IA and AA students. They are also used by the contractor for preparing the official scores for all students.

THIS PAGE HAS
BEEN INTENTIONALLY
LEFT BLANK.
CELDT 2017–18 Edition Technical Report
California Department of Education November 2018 21
Chapter 3: Item Development
In the 2015–16 test administration year, the California Department of Education eliminated item writing and all field testing as a result of redirecting funds to its new assessment, the English Language Proficiency Assessments for California. This decision was carried over to the 2016–17 and 2017–18 administration years; as a result, no items were developed during this period for use on any future editions of the test. Although no item development was needed for the 2017–18 Edition, we provide a brief description of the general item development and field-testing processes. For a more complete description of the California English Language Development Test (CELDT) item development process, see the CELDT 2013–14 Edition Technical Report.1 The process of developing new CELDT items involves specifying item writing guidelines, selecting and training qualified item writers, writing items, reviewing and editing newly written items, and evaluating items to determine if they meet test form specification criteria. To field-test newly written items, the CELDT uses an embedded field-testing model, which includes embedding field-test items within the operational form of the test to create multiple field-test forms. Different field-test forms are given to stratified random samples of students so that data is collected on all field-test items without overburdening students with a long test.
1The California English Language Development Test 2013–14 Edition Technical Report can be found on the CDE website at https://www.cde.ca.gov/ta/tg/el/techreport.asp.

THIS PAGE HAS
BEEN INTENTIONALLY
LEFT BLANK.
CELDT 2017–18 Edition Technical Report
California Department of Education November 2018 23
Chapter 4: Test Assembly
The California English Language Development Test (CELDT) assesses the four domains of listening, speaking, reading, and writing. All items included in the 2017–18 Edition were presented in the same order and with the same directions as in the 2015–16 Edition test. Although no new test development was required to create the 2017–18 Edition test, this chapter explains the standard procedures and rules for the CELDT item selection and the structure of the CELDT test forms.
4.1 Rules for Item Selection
4.1.1 Content Rules and Item Selection The construction of the CELDT necessitates fulfilling the requirements of the CELDT test blueprints as well as meeting the specified statistical and psychometric criteria as described in the next section. Test validity requires that content coverage adheres to test blueprints. The blueprints specify the number of items to include in each domain and which English language development (ELD) standards to assess within each domain. Although not the case for the 2017–18 Edition because it was a repeat of the 2015–16 Edition, in general no more than 70 percent of the items from the previous edition is retained in the current edition.
4.1.2 Statistical and Psychometric Criteria In addition to following the content rules for item selection, each of the CELDT forms must conform to the following psychometric criteria:
• Individual items should have p-values (a measure of difficulty) that range from 0.20 to 0.95. Some items may be chosen outside this range, with the approval of the California Department of Education, to provide more meaningful and accurate scores for students at a wider range of performance levels.
• The collection of items within each domain must represent difficulty levels that span the scale, with more items around the Early Advanced cut score.
• Point-biserial correlations (a measure of reliability) must be greater than 0.15.
• Items with C-level and B-level differential item functioning (DIF) classifications may be used only when it is necessary to meet test specifications.
When assembling tests, assessment specialists review three types of curves for each grade span by domain: the test characteristic curve (TCC), the test information curve (TIC), and the conditional standard error of measurement (CSEM) curve. To ensure that new operational tests have similar statistical
CELDT 2017–18 Edition Technical Report
California Department of Education November 2018 24
characteristics to prior tests, assessment specialists compare the curves for proposed test forms with target curves from prior forms. Target curves are developed using the most recent statistics available at test assembly time, which is generally two years before test administration. This approach to test development is called “pre-equating” because the test scale is set before the test is administered. The pre-equating model allows publication of the CELDT raw score to scale score and performance-level conversion tables concurrent with the publication of the test forms (whereas post-equating models generally publish this data after testing and scoring have been completed). This is important because there can be no delay between administering and scoring the tests. Local educational agencies that are administering the CELDT must use these tables to score the tests locally just after administering the test to determine students’ English language proficiency level and to make decisions related to additional ELD and instructional placement. The TCC and CSEM curves included in appendix P are the result of the re-estimation of the 2009–10 to 2012–13 editions item parameters described in appendix A.
4.1.3 Rules for Item Sequence and Layout Although approximately 70 percent of the test items are retained from one edition to the next, the sequencing of these items is altered on each edition to provide an additional level of test security and reduce the potential for familiarity with the items by students retaking the test. It is important, however, to ensure the stability of item parameters, which may be affected by the position of the item on the test. Thus, in order to ensure the stability of item parameters, items may be relocated only within five positions of their appearance when previously calibrated. For the 2017–18 Edition, the items were maintained in the same item positions as in the 2015–16 Edition.
4.1.4 Item Status Codes All items, their statistical data, and metadata are stored in the CELDT Item Bank. Item status metadata provide the status of the items in the bank; for example, whether an item has been used or whether it is ready to be used as a field-test item or an operational item. The full list of CELDT item status codes are as follows:
• Field-test ready: Items approved and available for use as field-test items during the current year’s test assembly.
• Field-tested awaiting statistics: Items administered as field-test items and awaiting statistics and statistical reviews to determine whether they will be rejected or approved for operational use. These items are not available for use during the current year’s test assembly.
CELDT 2017–18 Edition Technical Report
California Department of Education November 2018 25
• Operational ready: Items field-tested and approved for operational use but not used operationally yet. They are available for use as operational items during the current year’s test assembly.
• Used operationally: Items field-tested, approved as operational ready, and used operationally one or more times. They are available for use as operational items during the current year’s test assembly.
• Legacy unavailable: Items previously known as “Dormant” and made unavailable for use prior to the development of the 2013–14 Edition. They are no longer available for test assembly.
• Rejected before use: Items rejected during a content or a bias and sensitivity review. They are no longer available for test assembly.
• Rejected after use for content reasons: Items rejected after an administration for content reasons. They are no longer available for test assembly.
• Rejected after use for statistical reasons: Items rejected after an administration because the statistics were not acceptable. They are not available for test assembly.
• Released: Items used in publicly accessible materials such as an edition of CELDT Released Test Questions. They are no longer available for test assembly.
• Resting: Items used operationally and removed from use for a set period of time that can be used again after the resting period is over. These items are not available for test assembly until the resting period has passed and the item has been redesignated as used operationally.
• Ready for piloting: These items have been developed and are awaiting initial piloting or awaiting repiloting after edits were made that warrant further piloting. They are not available for use as field-test items during the current year’s test assembly.
All items in the 2017–18 Edition had the status of “used operationally.”
4.2 Test Forms and Structure The 2017–18 Edition of the CELDT was composed of one form at each grade span, and each form contained only operational items. Operational items (as opposed to field-test items) count toward student test results. Each of these test forms contained the four domains of listening, speaking, reading, and writing at each grade span. For more details on the structure of the CELDT 2017–18 Edition, including the numbers and types of items, item sequences, and item identifiers for each grade span and domain, see the item maps in appendix D. Because the 2017–18 Edition was a reproduction of the 2015–16 Edition, and because each edition’s materials look visually similar, the colors and cover identification labels
CELDT 2017–18 Edition Technical Report
California Department of Education November 2018 26
and marks were changed to make the 2017–18 Edition test materials easy to distinguish from the earlier edition.
CELDT 2017–18 Edition Technical Report
California Department of Education November 2018 27
Chapter 5: Test Administration
This chapter covers a variety of test administration procedures—from test security to data integrity—used with the California English Language Development Test (CELDT). These procedures include the following:
• Test security and confidentiality. Procedures are in place to ensure that test security is maintained throughout the testing process—from item development to reporting.
• Procedures to maintain standardization. To ensure standardization of the administration of the CELDT throughout the state, instruction manuals containing detailed instructions for administering the test and maintaining security are provided to local educational agencies (LEAs). LEA staff participate in state-run trainings that are designed to ensure that all test examiners are trained to administer and locally score the tests.
• Testing students with disabilities. Special versions of the test and accommodation procedures exist to make the test accessible to the broadest range of students possible.
• Data merge process. To improve data quality and usefulness for LEAs, a process is used to merge the CELDT data with additional data from the California Longitudinal Pupil Achievement Data System (CALPADS) prior to publishing the final data files for the test administration year.
5.1 Test Security and Confidentiality The CELDT is a secure test—meaning that items and test materials are not publicly released. Therefore, all test materials are considered secure documents, including the materials used for local scoring training and item writer training. Student scores and demographic data represent confidential private student information. A set of procedures is in place to maintain security and confidentiality throughout the test development, production, distribution, testing, scoring, and reporting processes.
5.1.1 Security Forms Every person with access to any secure CELDT materials or confidential information is required to sign one or more security forms to agree to maintain the security of the test. The CELDT District Coordinators (CDCs) and site coordinators must sign the CELDT Test Security Agreement form, and anyone serving as a test examiner, proctor, or scorer (or anyone handling secure test materials) must sign the CELDT Test Security Affidavit form. Subcontractors and vendors are informed of the secure nature of the materials and data related to the CELDT and are required to sign additional security forms related to their involvement with the CELDT.
5.1.2 Electronic Security All computer systems that store items, test results, and other secure files require password access. During the item and test development processes, electronic files reside on a server accessed by Secure File Transfer Protocol
CELDT 2017–18 Edition Technical Report
California Department of Education November 2018 28
(SFTP). Access to the site is password controlled. Transmission to and from the site is via an encrypted protocol. Secure test materials are not shared via email unless they are password protected and encrypted. All contractor sites are protected by firewall software and hardware to provide an additional level of security for sensitive information. When documents are approved for printing, they are transmitted electronically to the printing subcontractors through the SFTP site. Hardcopies of the prepress test materials are returned via traceable courier for final approval. The printing subcontractors all have extensive experience with secure testing programs and are familiar, and in compliance, with the confidentiality requirements of the CELDT program. Transfer of student data between the CELDT contractor, subcontractors, and the California Department of Education (CDE) follows secure procedures. Data files are also exchanged through an SFTP site. During analysis, the data files reside on secure servers with controlled access. Student data files containing student demographic data and scores are downloadable by LEAs through the secure CELDT District Portal of the CELDT website. This secure area uses Secure Socket Layer (SSL) encryption for all transfers of data. Unique LEA passwords to the secure CELDT District Portal are released only to CDCs and are reset at the beginning of each test administration year. The student data files are also optionally available to the CDC on a password-protected and encrypted CD-ROM.
5.1.3 Physical Security LEA and school site personnel who are responsible for the security of the CELDT materials must follow the required procedures for security as outlined in the test security forms, the District and Test Site Coordinator’s Manual, and the California Code of Regulations. Hardcopy test materials are to be kept in locked cabinets, rooms, or secure warehouses. Access to test materials, except on actual testing dates, is to be limited only to those within the LEA who are responsible for test security. All test materials are to be gathered and accounted for following each period of testing. All contractor personnel, including subcontractors, vendors, and temporary workers who have access to secure test materials, are required to agree to keep the test materials secure and to sign security forms that state the secure nature of test items and the confidentiality of student information. Access to the document-processing warehouse is by rolling gates, which are locked at all times except when opened to allow pickup or receipt of test materials. A secure chain-link fence with a barbwire top surrounds the document-processing facility. A verified electronic security system monitors access to the offices and warehouse areas 24 hours a day, seven days a week. All visitors entering the facility are required to sign in at the front desk and to obtain an entry badge that allows them access to the facility.
CELDT 2017–18 Edition Technical Report
California Department of Education November 2018 29
The following additional security procedures are maintained for the CELDT program:
• Test materials that have been received from the printing subcontractor are stored in a secure warehouse facility prior to packaging and shipping to LEAs.
• At a preapproved, designated time, the contractor disposes of all test materials that have been received but not distributed to LEAs. This work is done onsite by an experienced professional shredding contractor. LEAs have the option to securely destroy the confidential test materials locally and officially record a destruction date or to return the test materials to the contractor. Unused and used secure Test Books, Answer Books, Examiner’s Manuals, and training materials that are sent back to the contractor for secure destruction are accounted for by using the county-district code and stored in labeled boxes on pallets at the contractor’s warehouse.
• All boxes and pallets that have been placed in the secure warehouse for long-term storage are recorded electronically so that they can be retrieved at any time. Scanned (used) answer documents are stored in labeled “scan” boxes on labeled pallets in the same warehouse. The scan box and pallet numbers are scanned into a database for retrieval as needed. Documents are stored for a minimum of one year or until the CDE provides express written consent to destroy them.
5.2 Procedures to Maintain Standardization Written procedures exist for all phases of the CELDT testing process to ensure that tests are administered in a fair and standardized manner throughout California.
5.2.1 Manuals The District and Test Site Coordinator’s Manual describes procedures to be used by the CDCs and school site coordinators in receiving, inventorying, storing, and returning test materials to the contractor for scoring. The Examiner’s Manuals are to be used by the person responsible for actual test administration and include information ranging from guidelines for the testing environment to verbatim test administration scripts. The Examiner’s Manuals also provide the required information for local scoring and the compiling of test results, including scoring keys and raw score to scale score conversion tables.
5.2.2 The CELDT District Coordinator (CDC) The CDCs have extensive responsibilities for proper handling and administration of the CELDT. Each year at the start of the annual administration activities, all CDCs are required to complete and submit a Superintendent’s Designation of CELDT
CELDT 2017–18 Edition Technical Report
California Department of Education November 2018 30
District Coordinator form before any test materials are sent to the LEA. The online form is available to the current CDC through the secure CELDT District Portal or via the CELDT Customer Support Center. The CDC is responsible for ensuring the proper and consistent administration of the tests. CDCs are also responsible for securing and inventorying test materials upon receipt, distributing test materials to schools, tracking the test materials, answering questions from LEA staff and test site coordinators, retrieving test materials from schools after test administration, and returning scorable test materials to the CELDT contractor for processing. Should there be a security breach or testing irregularity during testing, it is the responsibility of the CDC to investigate and report the incident via standardized procedures outlined in the District and Test Site Coordinator’s Manual. The CDC is responsible for implementing procedures to supply other LEAs with previous CELDT scores for students who have moved out of the LEA area. Additionally, the CDC is responsible for ensuring that at least one representative of the LEA has attended a Scoring Training of Trainers (STOT) workshop, or has obtained training via the online Moodle system, and for ensuring that all test examiners within the LEA area are subsequently trained by the LEA representative(s). The collection and secure destruction of unused and nonscorable secure test materials, also the responsibility of the CDC, is completed once each year at the end of the school year. The CDC has the option to destroy locally all of the CELDT materials or request a pickup of the test materials for return to the contractor for centralized destruction.
5.2.3 The CELDT Site Coordinator The CELDT site coordinator is the test coordinator at the school level who is responsible for managing the CELDT program at the school, coordinating with LEA trainers for the training of all test examiners, ensuring the proper administration of all testing procedures, maintaining the security of the test materials at the school, and assuring the proper packing and return of test materials to the CDC.
5.2.4 Test Examiners Test examiners administer the tests to students. Test examiners must complete training for the current administration of the CELDT before administering the test and must follow the directions prescribed in the Examiner’s Manuals. Proctors must be available to assist test examiners when groups of test takers exceed 20 students.
5.2.5 Training for General Test Administration For the 2017–18 Edition, general test administration training was accomplished through regular email communications, web-based tutorials and videos, and Frequently Asked Questions (FAQs).
CELDT 2017–18 Edition Technical Report
California Department of Education November 2018 31
Monthly update emails, containing upcoming important dates and deadlines for the CELDT, were provided to CDCs. A series of recorded tutorials on how to use CELDT web applications, including tutorials for Initial Ordering, the Local Scoring Tool, Packing and Returning Scorable Documents, and Pre-Identification were created and posted to the CELDT website to support LEA staff as they used these applications. A series of short videos, called the CELDT Fundamentals, were available on the CELDT website, in both English and Spanish, to provide basic information about the CELDT to new coordinators, LEA staff, parents, and the public. These emails, tutorials, and videos were available for viewing on the CELDT website on-demand throughout the administration year. Closed captioning was available on each video, and written transcripts were tagged for accessibility and available for downloading from the website. Additional support to LEA personnel was provided through the FAQ web page, which was periodically updated with the answers to questions received through the CELDT Customer Support Center.
5.2.6 Scoring Training of Trainers (STOT) Workshops As with previous editions, the 2017–18 Edition included test administration training through a series of daylong in-person STOT workshops. The purpose of the STOT workshops is to train participants to (a) standardize the administration of the CELDT, (b) reliably score the speaking and writing constructed-response (CR) items, and (c) train other qualified persons locally as test examiners to administer and score the CELDT. The 2017–18 Edition workshops were limited to new LEA trainers for the CELDT (i.e., an LEA trainer who had not attended a STOT workshop the previous year) and people who served as lead trainers at regional training workshops. Although the attendance at STOT workshops was limited, the online Moodle Training Site was available to all LEAs. The STOT workshops were conducted at various locations around the state. A total of 616 participants from 400 LEAs and independent charter schools attended nine workshops held between March 23 and August 22, 2017. This represents approximately 23 percent of the 1,753 LEAs registered for testing at the end of August 2017. Six county offices of education hosted an additional eight regional training workshops. No participation data is available on these trainings.
• Training at the Workshops: The STOT workshop curriculum includes information about administering and scoring the current edition of the CELDT and changes in the test materials and administration procedures that all test examiners are required to know. Administration of the CELDT involves scoring a student’s responses to the speaking items during test administration and scoring a student’s responses to CR writing items just after testing. Thus, standardization of the scoring is
CELDT 2017–18 Edition Technical Report
California Department of Education November 2018 32
critical, and extensive training during the STOT workshops is provided in these two areas to accomplish this. Workshop participants receive training on scoring for listening, speaking, and CR writing items. After the training on each test component is complete, workshop participants work through exercises for administering and scoring that test component. Workshop presenters guide these activities and respond to questions throughout the process. All participants who complete the STOT workshop and training exercises are emailed a certificate of completion.
• Training Materials: Each STOT participant is provided an administration trainer’s kit binder, containing various training modules. For the 2017–18 Edition, some sections of the training kit were updated to be consistent with the changes to the 2017–18 Edition test materials. The CELDT Administration and Scoring Videos were reused from the previous year and a supplemental document, Administration and Scoring Videos—References Not Applicable to the 2017–18 Edition, explaining the updates was provided as a resource for anyone using a 2013–14 Edition training video (the last year the video was updated) for local training.
• Online Training Resources: Online test administration training is provided through an online learning management system called Moodle. The training modules used in the STOT workshops are posted to Moodle for LEA training purposes. These modules include the workshop presenters’ scripts, embedded audio samples and video clips from the training video, training exercises for scoring, and calibration quizzes for most test components. These online resources are intended to supplement local training or allow local trainers to re-create the STOT workshop training. Trainees are given access to the calibration quizzes to take them on their own after completing either in-person or online training. They can take the online quizzes as many times as necessary to achieve the required calibration level. For the Choose and Give Reasons, Speech Functions, and 4-Picture Narrative test components, test examiners can train and calibrate on items by grade span. Once a trainee completes a quiz and has met or exceeded the required calibration level, the trainee can print a report showing that she or he passed the calibration quiz. This report can be used as documentation that the trainee has been calibrated and can serve as a test examiner for the CELDT.
For the 2017–18 Edition training period, a total of 5,402 LEA staff and trainers used the online training modules in Moodle. This is a 50 percent decrease in users from the 2016–17 Edition training period because only the initial assessment (IA) was administered during the 2017–18 testing year; therefore, fewer test examiners were needed.
CELDT 2017–18 Edition Technical Report
California Department of Education November 2018 33
5.2.7 Scoring Rubrics The CELDT scoring rubrics in use during the 2017–18 Edition were developed for operational use starting with the 2006–07 Edition. The CELDT has different rubrics for the speaking and writing domains, both of which are presented in appendix C.
• Speaking. Test examiners scoring the speaking domain use a set of item-type-specific rubrics to determine the score for each item and then record the rubric score for each item on the student’s answer document.
• Writing. The writing domain has three separate rubrics: one for scoring the grades 2–12 Sentences CR items; one for scoring the grades 2–12 Short Compositions CR items; and one for scoring the grades K–1 CR items.1
5.3 Testing Students with Disabilities Some adjustments to the normal test administration process are allowed for all students who take the CELDT. These test variations include simplifying or clarifying the instructions, testing in a small group setting rather than in a full classroom, and providing extra time on a test within a testing day. Additional test variations may be made for students as long as these variations are regularly used in classroom instruction. These include testing an individual student separately, using audio amplification or visual magnifying equipment, and providing Manually Coded English or American Sign Language to present directions for administration. Two other types of administrative adjustments are allowed if specified in the student’s individualized education program (IEP) or Section 504 plan. The first type, called an accommodation, changes the way the test is given but does not change what is tested. The second type, called a modification, fundamentally changes what is being tested. The purpose of test variations, accommodations, and modifications is to enable students to take the CELDT; it is not to give them an advantage over other students or to improve their scores. Providing students with test variations and accommodations does not result in changes to student scores. However, students with test modifications receive the Lowest Obtainable Scale Score (LOSS) for each domain marked on the student’s Answer Book as a modified assessment. If the student took a modified assessment for all domains, the overall scale score is also the LOSS.
1For more information on the rationale for the development of the CELDT scoring rubrics, see the CELDT 2006–07 Edition Technical Report found on the CDE website at http://www.cde.ca.gov/ta/tg/el/techreport.asp or by request at [email protected].
CELDT 2017–18 Edition Technical Report
California Department of Education November 2018 34
5.3.1 Permitted Test Variations, Accommodations, and Modifications for CELDT Administration Below is a summary of the permitted variations, accommodations, and modifications applicable to the CELDT. Eligibility is indicated as applying to all students or requiring specification in the student’s IEP or Section 504 plan. Test Variations
• Test administration directions that are simplified or clarified (does not apply to test questions)
• Student marks in test booklet (other than responses) including highlighting (marked Test Booklets may not be used again)
• Test students in a small group setting
• Extra time on a test within a testing day
• Test individual student separately, provided that a test examiner directly supervises the student
• Visual magnifying equipment
• Audio amplification equipment
• Noise buffers (e.g., individual carrel or study enclosure)
• Special lighting or acoustics; special or adaptive furniture
• Colored overlay, mask, or other means to maintain visual attention
• Manually Coded English or American Sign Language to present directions for administration (does not apply to test questions)
Accommodations
• Test administration directions that are simplified or clarified (does not apply to test questions)
• Student marks in test booklet (other than responses) including highlighting (marked Test Booklets may not be used again)
• Test students in a small group setting
• Extra time on a test within a testing day
• Student marks responses in test booklet and responses are transferred to a scorable answer document by an employee of the school, LEA, or nonpublic school
• Student dictates multiple-choice question responses orally, or in Manually Coded English to a scribe, audio recorder, or speech-to-text converter for selected-response items
• Word processing software with spell and grammar check tools turned off for the essay responses (writing portion of the test)
CELDT 2017–18 Edition Technical Report
California Department of Education November 2018 35
• Essay responses dictated orally or in Manually Coded English to a scribe, audio recorder, or speech-to-text converter and the student provides all spelling and language conventions
• Assistive device that does not interfere with the independent work of the student on the multiple-choice and/or essay responses (writing portion of the test)
• Braille transcriptions provided by the test contractor
• Large Print versions or test items enlarged (not duplicated) to a font size larger than that used on Large Print versions
• Test over more than one day for a test or test part to be administered in a single sitting
• Supervised breaks within a section of the test
• Administration of the test at the most beneficial time of day to the student
• Test administered at home or in a hospital by a test examiner
• Manually Coded English or American Sign Language to present test questions (writing)
• Test questions read aloud to student or used audio CD presentation (writing)
Modifications
• Test administration directions that are simplified or clarified (does not apply to test questions)
• Student marks in test booklet (other than responses) including highlighting (marked Test Booklets may not be used again)
• Test students in a small group setting
• Extra time on a test within a testing day
• Dictionary
• Manually Coded English or American Sign Language to present test questions (reading, listening, speaking)
• Test questions read aloud to student or used in audio CD presentation (reading)
• Word processing software with spell and grammar check tools enabled on the essay responses writing portion of the test
• Essay responses dictated orally, in Manually Coded English or in American Sign Language to a scribe [audio recorder, or speech-to-text converter] (scribe provides spelling, grammar, and language conventions)
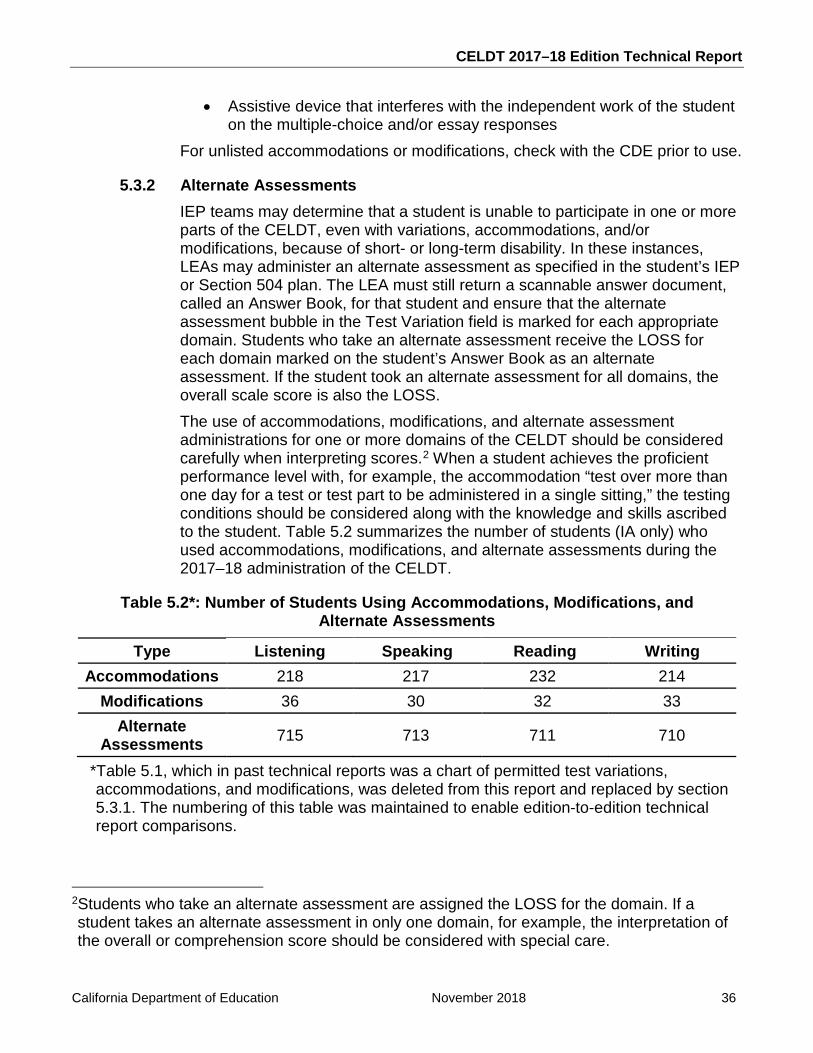
CELDT 2017–18 Edition Technical Report
California Department of Education November 2018 36
• Assistive device that interferes with the independent work of the student on the multiple-choice and/or essay responses
For unlisted accommodations or modifications, check with the CDE prior to use.
5.3.2 Alternate Assessments IEP teams may determine that a student is unable to participate in one or more parts of the CELDT, even with variations, accommodations, and/or modifications, because of short- or long-term disability. In these instances, LEAs may administer an alternate assessment as specified in the student’s IEP or Section 504 plan. The LEA must still return a scannable answer document, called an Answer Book, for that student and ensure that the alternate assessment bubble in the Test Variation field is marked for each appropriate domain. Students who take an alternate assessment receive the LOSS for each domain marked on the student’s Answer Book as an alternate assessment. If the student took an alternate assessment for all domains, the overall scale score is also the LOSS. The use of accommodations, modifications, and alternate assessment administrations for one or more domains of the CELDT should be considered carefully when interpreting scores.2 When a student achieves the proficient performance level with, for example, the accommodation “test over more than one day for a test or test part to be administered in a single sitting,” the testing conditions should be considered along with the knowledge and skills ascribed to the student. Table 5.2 summarizes the number of students (IA only) who used accommodations, modifications, and alternate assessments during the 2017–18 administration of the CELDT.
Table 5.2*: Number of Students Using Accommodations, Modifications, and Alternate Assessments
Type Listening Speaking Reading Writing Accommodations 218 217 232 214
Modifications 36 30 32 33 Alternate
Assessments 715 713 711 710
*Table 5.1, which in past technical reports was a chart of permitted test variations, accommodations, and modifications, was deleted from this report and replaced by section 5.3.1. The numbering of this table was maintained to enable edition-to-edition technical report comparisons.
2Students who take an alternate assessment are assigned the LOSS for the domain. If a student takes an alternate assessment in only one domain, for example, the interpretation of the overall or comprehension score should be considered with special care.
CELDT 2017–18 Edition Technical Report
California Department of Education November 2018 37
5.3.3 Versions of the CELDT The CELDT has three special versions: Braille, Large Print, and CD-ROM. The Braille Version is available only to students who are blind or visually impaired with documentation in an IEP or Section 504 plan. The student is allowed to have his or her responses recorded by a test proctor or aide. Specific instructions and a Braille Version Examiner’s Manual are provided for test examiners because the item content differs from that of the regular version. Despite the different item content, the Braille Version has been equated to produce scale scores equivalent to the regular edition. Braille forms of the CELDT were originally created for the 2013–14 Edition and then reused in their entirety for the 2017–18 Edition. The items on the braille forms consisted largely of braille versions of the 2013–14 items, which differed in modest ways from the 2013–14 regular version to allow for braille delivery. For example, in some cases, pictures were replaced with descriptions of pictures and some entire items were replaced when a braille version of the item was not viable. The Braille Answer Book was last printed for use with the 2016–17 Edition and was reused for the 2017–18 administration. The 2017–18 Large Print Version consisted of an enlarged version of the regular 2017–18 Edition test for each grade span. Students who use the Large Print Version are allowed certain administrative adjustments:
• Ample work space to allow for working with the large-size book
• Magnifying instruments to help in reading information that may not be enlarged sufficiently for the student
• Ample, intense lighting to assist the student in reading
• Marking answers in the Large Print Answer Book, which then must be transcribed to a regular scannable Answer Book by the test examiner or proctor
The Large Print Version includes a spiral-bound Test Book(s), a Large Print Answer Book, a regular scannable Answer Book, and special instructions to the test examiner for transcribing the student’s responses to the regular scannable Answer Book. A CD-ROM Version of the CELDT is also available for visually impaired students. The 2017–18 Edition CD-ROM Version contained an electronic file (PDF) of the regular 2017–18 Edition test for each grade span. The PDFs included on the CD-ROM can be displayed on a computer screen, which permits greater enlargement of text and graphics than is provided in the Large Print Version. Depending on need and preference, the student may respond either in a regular scannable Answer Book or in a Large Print Answer Book, which then is transcribed by the test examiner into a regular scannable Answer Book. The same environmental adjustments for the Large Print Version apply to the CD-ROM Version.
CELDT 2017–18 Edition Technical Report
California Department of Education November 2018 38
Student scores for the Braille Version, Large Print Version, and CD-ROM Version are as valid as the scores for the regular version of the CELDT.
5.4 California Longitudinal Pupil Achievement Data System (CALPADS) MergeProcessCorrect student demographic data is essential to valid test reporting. In previous test administrations, the CELDT program used a custom web-based software application called the Data Review Module (DRM) that allowed LEA staff to review and make corrections to their student demographic data prior to group reporting. The DRM was eliminated for the 2017–18 Edition. Instead, emphasis was placed on LEAs providing accurate Statewide Student Identifiers (SSIDs) and Date Testing Completed (DTC) data to merge accurately with CALPADS data at the end of the test administration. To populate CELDT student records with additional data fields (see below) not collected on the CELDT Answer Books or via Pre-Identification, CELDT student records are merged by the CDE with CALPADS data records. Two fields that are essential to an accurate match are the SSID and the DTC. Therefore, special data processing procedures are implemented to ensure that SSID and DTC data are accurate in all student records. A merge is successful if the CELDT student record matches with a CALPADS record. If there is a match, the following fields are populated into CELDT student records from the CALPADS data:
• Primary Language Code
• Primary Disability Code
• Date First Enrolled in a USA School
• Program Participation: Migrant Education
• Special Education Services at a Nonpublic School (NPS)
• NPS Code
• County/District of Residence—Only for students with individualized education programs (IEPs)
• Date of Birth
• Gender The resulting merged file is used to create all group-level data reports and data files.
CELDT 2017–18 Edition Technical Report
California Department of Education November 2018 39
Chapter 6: Performance Standards
The five California English Language Development Test (CELDT) performance levels are termed Beginning, Early Intermediate, Intermediate, Early Advanced, and Advanced and are defined by cut scores on the CELDT common scale. Descriptors of student performance at each level—called Test Performance Descriptors—define what students know and are able to do at that level. This chapter describes the development of the common scale and the process used to establish the cut scores that distinguish the five performance levels.
6.1 Common Scale Development
6.1.1 CELDT 2006–07 Scale Development A common scale across all grade levels of the CELDT was first implemented operationally with the 2006–07 Edition (Form F) and applied operationally in each administration thereafter. This scale design places all of the CELDT scores onto a common scale to allow comparisons of scores across adjacent grade spans and across testing administrations. The CELDT common scale was designed using a common item design. First, calibrations were run on the grade span 3–5 data in each domain, and then a linear transformation was applied to the calibration scale such that the mean and standard deviations of item difficulty in grade span 3–5 were 500 and 50, respectively. Using these grade span 3–5 parameters, files containing the parameters of the items common to grade spans 3–5 and 6–8 were created. These common items (“anchor” items) served to place the grade span 6–8 items onto the new common scale, and the anchor items served to equate the operational and field-test items onto the CELDT scale. This equating was conducted using the procedure by Stocking and Lord (1983). The Stocking-Lord procedure is based on determining the linear equating constants, m1 and m2, that minimize the difference between two test characteristic curves such that for a standard normal ability distribution, the average squared difference between true-score estimates is as small as possible. For each domain in grade span 6–8, a new set of m1 and m2 values was calculated. An identical procedure was run to place the grade span K–2 items onto the new common scale. For grade span 9–12, because it is not adjacent to grade span 3–5 and could not directly be equated, the newly scaled parameters from grade span 6–8 were placed into an anchor file and used to place the grade span 9–12 items onto the common scale. The use of these anchor items to establish a common metric of performance allows comparisons of the scale scores from test editions across adjacent grade spans. For further information about calibration and equating procedures, see the “Item Response Theory (IRT) Analyses” discussion in section 8.6.
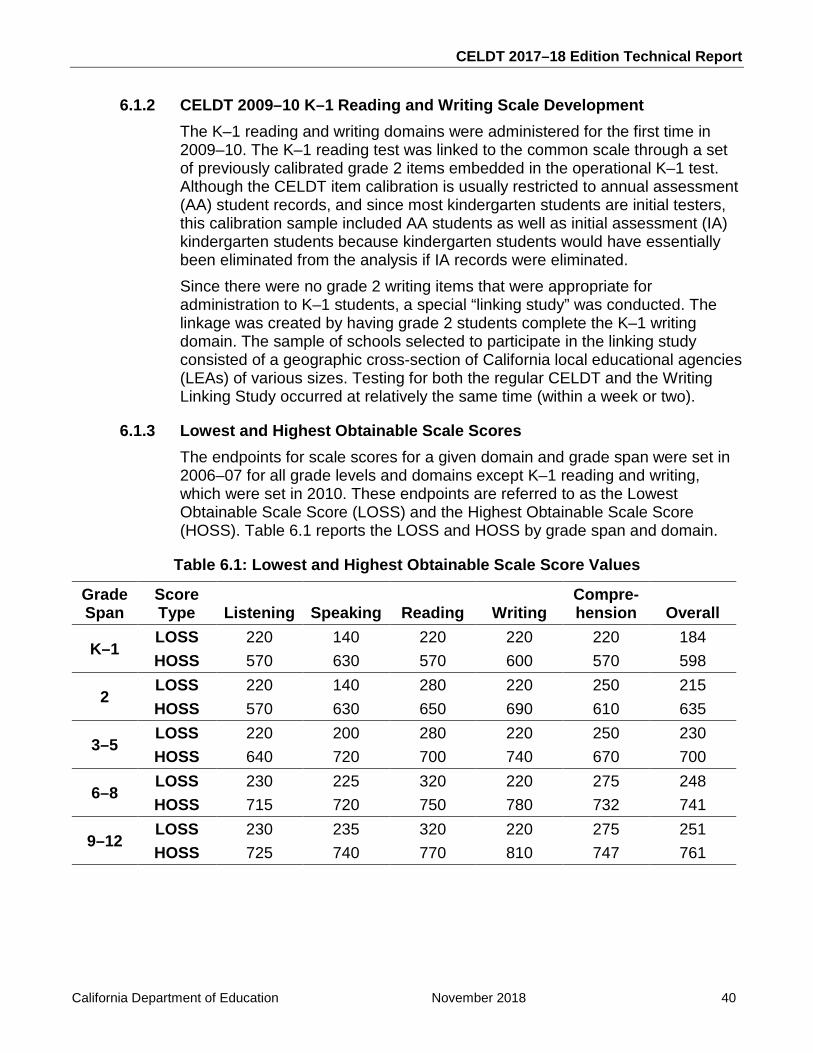
CELDT 2017–18 Edition Technical Report
California Department of Education November 2018 40
6.1.2 CELDT 2009–10 K–1 Reading and Writing Scale Development The K–1 reading and writing domains were administered for the first time in 2009–10. The K–1 reading test was linked to the common scale through a set of previously calibrated grade 2 items embedded in the operational K–1 test. Although the CELDT item calibration is usually restricted to annual assessment (AA) student records, and since most kindergarten students are initial testers, this calibration sample included AA students as well as initial assessment (IA) kindergarten students because kindergarten students would have essentially been eliminated from the analysis if IA records were eliminated. Since there were no grade 2 writing items that were appropriate for administration to K–1 students, a special “linking study” was conducted. The linkage was created by having grade 2 students complete the K–1 writing domain. The sample of schools selected to participate in the linking study consisted of a geographic cross-section of California local educational agencies (LEAs) of various sizes. Testing for both the regular CELDT and the Writing Linking Study occurred at relatively the same time (within a week or two).
6.1.3 Lowest and Highest Obtainable Scale Scores The endpoints for scale scores for a given domain and grade span were set in 2006–07 for all grade levels and domains except K–1 reading and writing, which were set in 2010. These endpoints are referred to as the Lowest Obtainable Scale Score (LOSS) and the Highest Obtainable Scale Score (HOSS). Table 6.1 reports the LOSS and HOSS by grade span and domain.
Table 6.1: Lowest and Highest Obtainable Scale Score Values
Grade Span
Score Type Listening Speaking Reading Writing
Compre-hension Overall
K–1 LOSS 220 140 220 220 220 184 HOSS 570 630 570 600 570 598
2 LOSS 220 140 280 220 250 215 HOSS 570 630 650 690 610 635
3–5 LOSS 220 200 280 220 250 230 HOSS 640 720 700 740 670 700
6–8 LOSS 230 225 320 220 275 248 HOSS 715 720 750 780 732 741
9–12 LOSS 230 235 320 220 275 251 HOSS 725 740 770 810 747 761
CELDT 2017–18 Edition Technical Report
California Department of Education November 2018 41
6.2 Standard Setting Procedures
6.2.1 CELDT 2006 Standard Setting The purpose of the standard setting was to establish new cut scores for the CELDT on the common scale for the Early Intermediate and Early Advanced performance levels. These scores were then used to establish cut scores for all five performance levels: Beginning, Early Intermediate, Intermediate, Early Advanced, and Advanced. Cut scores were established for all grade levels and domains except K–1 reading and writing, which were not administered at that time. The standard setting process requires experts to examine the standards and identify points on the score scale that operationally differentiate performance levels. Standard setting participants were recruited from across California and were selected based on their expertise with English language development (ELD), their experience in the field of education, and their knowledge of the CELDT. During the meeting, the participants were divided into two groups. One group evaluated the reading and writing domains while the other group evaluated the listening and speaking domains. Each group had 10–14 participants. Participants decided on cut scores for grades 2, 4, 7, and 10 for reading and writing and grades 1, 4, 7, and 10 for listening and speaking. Thus, approximately 100 education experts participated in establishing cut scores in eight groups (two groups each at grades 4, 7, and 10; one group each at grades 1 and 2). The panels met in Sacramento, California, February 12–16, 2006. The Bookmark method was used for establishing the cut points for each performance level. In brief, the procedure requires panelists to (a) achieve some general level of consensus on the requirements of the performance levels to be differentiated, (b) examine a Test Book in which the items have been arranged in order of difficulty from easiest to hardest, and (c) place a “bookmark” between items that best seem to differentiate the performance requirements of the levels to be differentiated. When averaged across the combined judgments of all panelists, this resulting bookmark corresponds to a cut score on the test. Panelists were provided multiple opportunities to review and change their placement of the bookmark following discussion of their placements with other panelists and a consideration of the impact of cut scores on the target population. Results of the panels’ work with the selected performance levels (Intermediate, Advanced) and grades (3, 5, 6, 8, 9, 11, 12 for reading and writing; 2, 3, 5, 6, 8, 9, 11, 12 for listening and speaking) were used to interpolate/extrapolate cuts for all performance levels and grades. Participants engaged in discussions to smoothen data and to produce a set of performance levels that best reflect continuous ELD across all grades.
CELDT 2017–18 Edition Technical Report
California Department of Education November 2018 42
The standard setting document can be found on the California Department of Education’s website at http://www.cde.ca.gov/ta/tg/el/documents/standardsetting.pdf.
6.2.2 CELDT 2010 Standard Setting The introduction of the reading and writing domains for grades K–1 in the 2009–10 Edition necessitated convening panels to set cut scores for these domains and grades. As in the 2006 standard setting, participants were recruited from across California and were selected based on their expertise with ELD, their experience in the field of education, and their knowledge of the CELDT. A panel of 15 California educators with English learner teaching experience at these early grades was selected from a much larger list of 311 people who had either applied to work with the development or review of items for the K–1 reading and writing domains or who had previously participated in the 2006 CELDT standard setting. Panelists met in Sacramento on January 13, 2010. The CELDT cut points for other grades and domains were initially set by using the Bookmark method, the well-established procedure also used for this standard setting. The work of the panel required one full day to complete. The day began with a large-group presentation that summarized the test development process, oriented participants to the task, and explained the procedures that would be followed. The panelists then focused on the draft of the K–1 reading and writing Test Performance Descriptors, which had been prepared prior to the meeting. The purpose of this exercise was to ensure that panelists had a clear picture in mind of the type of student whose responses were to be rated before they began to place their bookmarks. Because of the complexity of the task, panelists began by first considering grade one students and the reading domain. After they had individually placed their bookmarks, group discussion of the placement followed. Staff then collected and analyzed the initial ratings so that impact data could be presented to the group. This was followed by both large-group and small-group discussions of the impact data. When the discussion ended, panelists were asked to make a second set of bookmark placements for the reading items. The participants followed the same procedures for the writing items. When the grade one ratings were completed, the process was repeated for kindergarten. Agreement among the panelists was high at both grade levels, although somewhat higher with respect to the kindergarten ratings than the grade one ratings. Reading K–1 and writing K–1 links to the common scale were revised in spring 2013. This produced new scale score cut points beginning with the 2013–14 Edition but did not impact raw score performance requirements.
CELDT 2017–18 Edition Technical Report
California Department of Education November 2018 43
6.3 Standard Setting Results for All Grades and Domains Results of the standard settings summarized in table 6.2 for all grades and domains are expressed as scale scores. Cut scores for comprehension and the overall score—which are calculated from the domain scale scores—are also presented. For all grades, the cut scores for comprehension were calculated by averaging the listening and reading cut scores. For grades 2–12, the overall cut scores were calculated as the unweighted average of the listening, speaking, reading, and writing cut scores. For grades K–1, the overall cut scores were calculated as the weighted average of the cut scores of the four domains (.45 * listening + .45 * speaking + .05 * reading + .05 * writing).
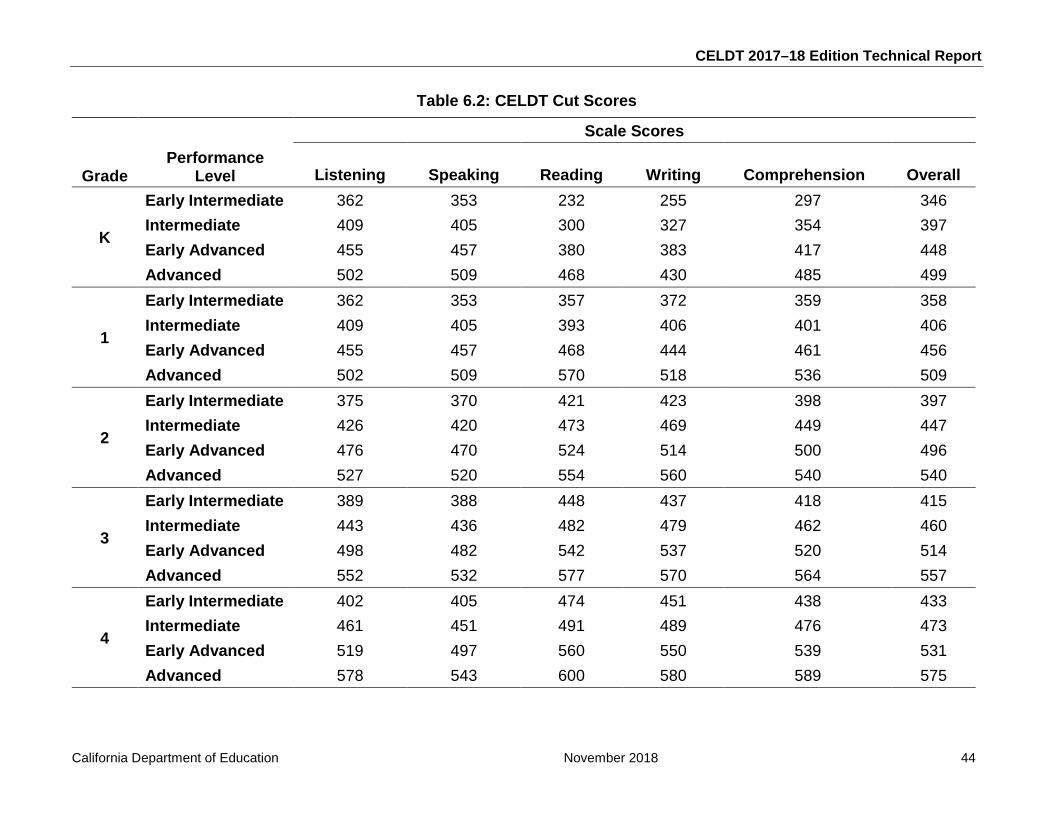
CELDT 2017–18 Edition Technical Report
California Department of Education November 2018 44
Table 6.2: CELDT Cut Scores
Grade Performance
Level
Scale Scores
Listening Speaking Reading Writing Comprehension Overall
K
Early Intermediate 362 353 232 255 297 346 Intermediate 409 405 300 327 354 397 Early Advanced 455 457 380 383 417 448 Advanced 502 509 468 430 485 499
1
Early Intermediate 362 353 357 372 359 358 Intermediate 409 405 393 406 401 406 Early Advanced 455 457 468 444 461 456 Advanced 502 509 570 518 536 509
2
Early Intermediate 375 370 421 423 398 397 Intermediate 426 420 473 469 449 447 Early Advanced 476 470 524 514 500 496 Advanced 527 520 554 560 540 540
3
Early Intermediate 389 388 448 437 418 415 Intermediate 443 436 482 479 462 460 Early Advanced 498 482 542 537 520 514 Advanced 552 532 577 570 564 557
4
Early Intermediate 402 405 474 451 438 433 Intermediate 461 451 491 489 476 473 Early Advanced 519 497 560 550 539 531 Advanced 578 543 600 580 589 575
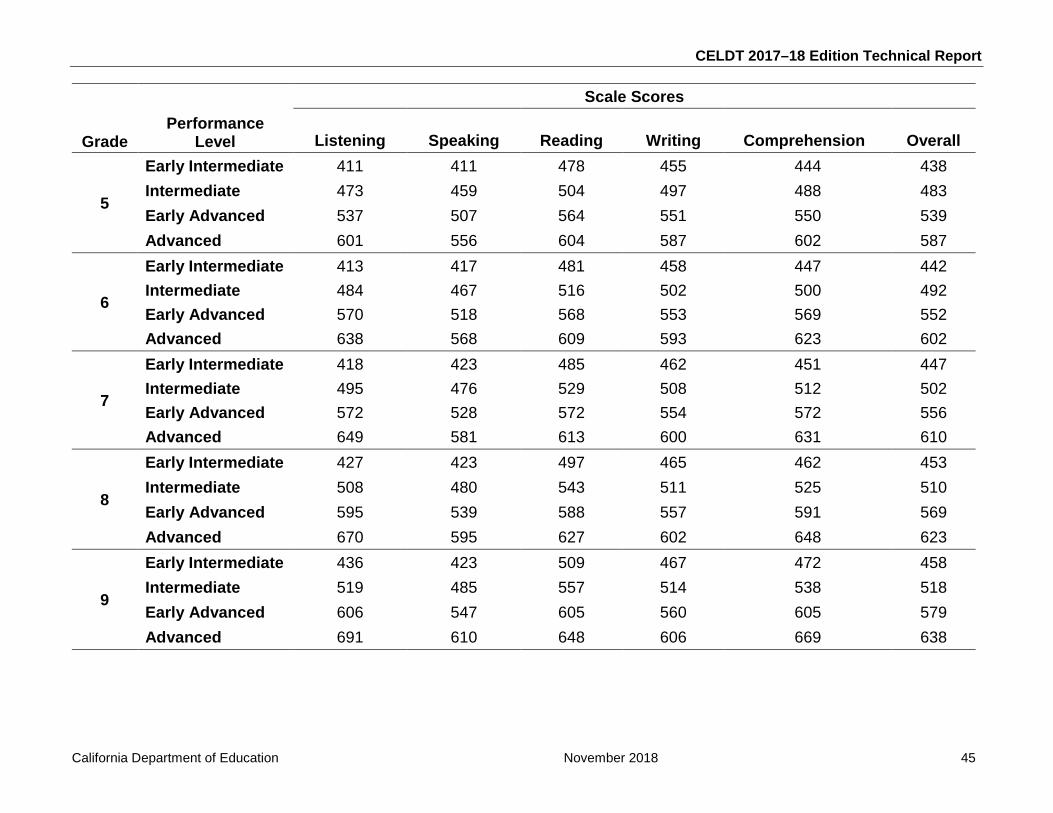
CELDT 2017–18 Edition Technical Report
California Department of Education November 2018 45
Grade Performance
Level
Scale Scores
Listening Speaking Reading Writing Comprehension Overall
5
Early Intermediate 411 411 478 455 444 438 Intermediate 473 459 504 497 488 483 Early Advanced 537 507 564 551 550 539 Advanced 601 556 604 587 602 587
6
Early Intermediate 413 417 481 458 447 442 Intermediate 484 467 516 502 500 492 Early Advanced 570 518 568 553 569 552 Advanced 638 568 609 593 623 602
7
Early Intermediate 418 423 485 462 451 447 Intermediate 495 476 529 508 512 502 Early Advanced 572 528 572 554 572 556 Advanced 649 581 613 600 631 610
8
Early Intermediate 427 423 497 465 462 453 Intermediate 508 480 543 511 525 510 Early Advanced 595 539 588 557 591 569 Advanced 670 595 627 602 648 623
9
Early Intermediate 436 423 509 467 472 458 Intermediate 519 485 557 514 538 518 Early Advanced 606 547 605 560 605 579 Advanced 691 610 648 606 669 638
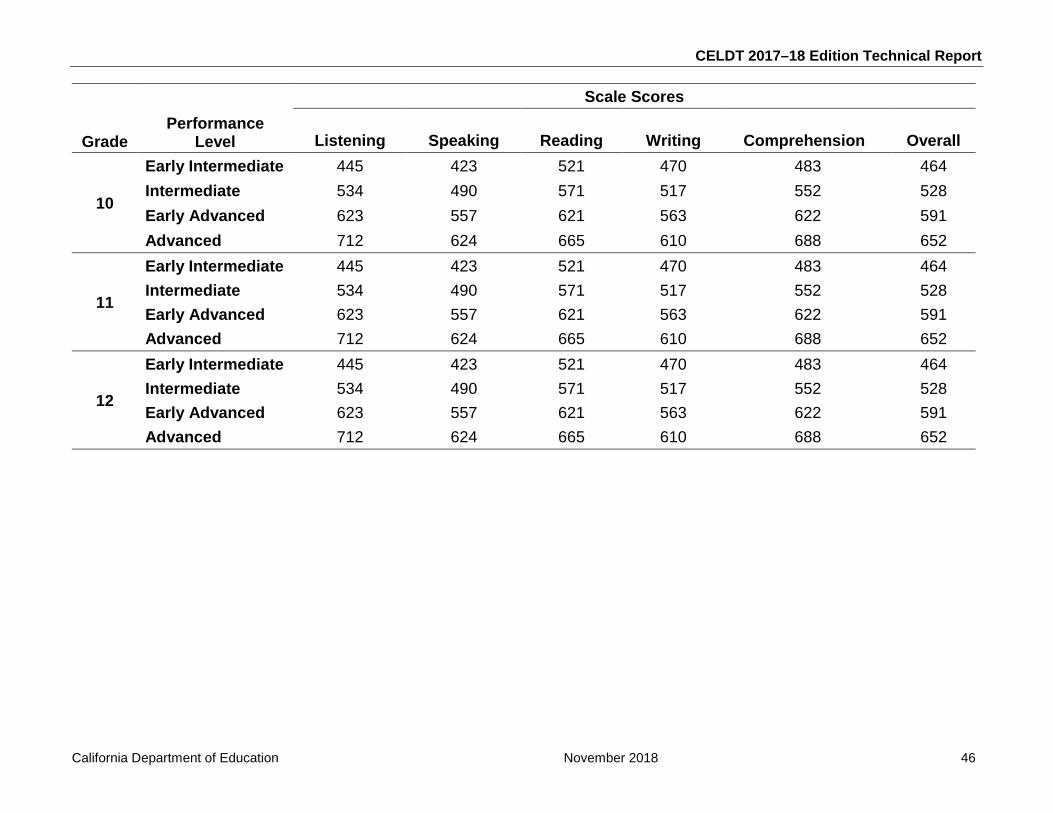
CELDT 2017–18 Edition Technical Report
California Department of Education November 2018 46
GradePerformance
Level
Scale Scores
Listening Speaking Reading Writing Comprehension Overall
10
Early Intermediate 445 423 521 470 483 464 Intermediate 534 490 571 517 552 528 Early Advanced 623 557 621 563 622 591 Advanced 712 624 665 610 688 652
11
Early Intermediate 445 423 521 470 483 464 Intermediate 534 490 571 517 552 528 Early Advanced 623 557 621 563 622 591 Advanced 712 624 665 610 688 652
12
Early Intermediate 445 423 521 470 483 464 Intermediate 534 490 571 517 552 528 Early Advanced 623 557 621 563 622 591 Advanced 712 624 665 610 688 652
CELDT 2017–18 Edition Technical Report
California Department of Education November 2018 47
6.4 General Test Performance Descriptors The CELDT General Test Performance Descriptors are shown below. These describe the competencies associated with each performance level and characterize what students at each performance level know and can do in English. Detailed Test Performance Descriptors for each grade span and domain are available in the Examiner’s Manuals and on the backs of the Student Performance Level Reports (SPLRs). Grades K–1 Students
• Performance Level: Advanced. Students at this level of English language performance communicate effectively with various audiences on a wide range of familiar and new topics to meet social and learning demands. In order to attain the English proficiency level of their native English-speaking peers, further linguistic enhancement and refinement are still necessary. They are able to orally identify and summarize concrete details and abstract concepts during unmodified instruction in all academic domains. Written production reflects grade-appropriate discourse. Errors are infrequent and do not reduce communication.
• Performance Level: Early Advanced. Students at this level of English language performance begin to combine the elements of the English language in complex, cognitively demanding situations and are able to use English as a means for learning in academic domains. They are able to identify and summarize most concrete details and abstract concepts during unmodified instruction in most academic domains. Oral production is characterized by more elaborate discourse, and written production includes simple sentences often using two-syllable words. Errors are less frequent and rarely complicate communication.
• Performance Level: Intermediate. Students at this level of English language performance begin to tailor English language skills to meet communication and learning demands with increasing accuracy. They are able to identify and understand more concrete details and some abstract concepts during unmodified instruction. They are able to respond and express themselves orally with increasing ease to more varied communication and learning demands with a reduced number of errors. Written production has usually expanded to common phrases and one-syllable words. Errors still complicate communication.
• Performance Level: Early Intermediate. Students at this level of English language performance continue to develop receptive and productive English skills. They are able to identify and understand more concrete details during unmodified instruction. They may be able to respond with increasing ease to more varied communication and learning demands with a reduced number of errors. Oral production is usually limited to phrases and memorized statements and questions. Written production is limited to letters and high-frequency, one-syllable words. Frequent errors still reduce communication.
• Performance Level: Beginning. Students at this level of English language performance may demonstrate little or no receptive or productive English skills. They are beginning to understand a few concrete details during unmodified instruction. They may be able to respond to some communication and learning
CELDT 2017–18 Edition Technical Report
California Department of Education November 2018 48
demands, but with many errors. Oral production is usually limited to disconnected words and memorized statements and questions. Written production is incomprehensible or limited to common letters. Frequent errors make communication difficult.
Grades 2–12 Students
• Performance Level: Advanced. Students at this level of English language performance communicate effectively with various audiences on a wide range of familiar and new topics to meet social and learning demands. In order to attain the English proficiency level of their native English-speaking peers, further linguistic enhancement and refinement are still necessary. They are able to identify and summarize concrete details and abstract concepts during unmodified instruction in all academic domains. Oral and written productions reflect discourse appropriate for academic domains. Errors are infrequent and do not reduce communication.
• Performance Level: Early Advanced. Students at this level of English language performance begin to combine the elements of the English language in complex, cognitively demanding situations and are able to use English as a means for learning in academic domains. They are able to identify and summarize most concrete details and abstract concepts during unmodified instruction in most academic domains. Oral and written productions are characterized by more elaborate discourse and fully developed paragraphs and compositions. Errors are less frequent and rarely complicate communication.
• Performance Level: Intermediate. Students at this level of English language performance begin to tailor English language skills to meet communication and learning demands with increasing accuracy. They are able to identify and understand more concrete details and some major abstract concepts during unmodified instruction. They are able to respond with increasing ease to more varied communication and learning demands with a reduced number of errors. Oral and written productions have usually expanded to sentences, paragraphs, and original statements and questions. Errors still complicate communication.
• Performance Level: Early Intermediate. Students at this level of English language performance continue to develop receptive and productive English skills. They are able to identify and understand more concrete details during unmodified instruction. They may be able to respond with increasing ease to more varied communication and learning demands with a reduced number of errors. Oral and written productions are usually limited to phrases and memorized statements and questions. Frequent errors still reduce communication.
• Performance Level: Beginning. Students at this level of English language performance may demonstrate little or no receptive or productive English skills. They are beginning to understand a few concrete details during unmodified instruction. They may be able to respond to some communication and learning demands, but with many errors. Oral and written production is usually limited to disconnected words and memorized statements and questions. Frequent errors make communication difficult.
CELDT 2017–18 Edition Technical Report
California Department of Education November 2018 49
Chapter 7: Scoring and Reporting
This chapter summarizes how student responses to the California English Language Development Test (CELDT) items were collected, scored, and reported for the 2017–18 Edition. As discussed in chapter 9, a sophisticated system of quality control checks was in place throughout the scoring and reporting processes.
7.1 Procedures for Maintaining and Retrieving Individual Scores As discussed in chapter 2, the CELDT employs three types of test items: multiple-choice (MC), dichotomous-constructed-response (DCR), and constructed-response (CR). The MC items elicit student responses and the DCR items elicit scores from test examiners, both of which are recorded on scannable documents for machine scoring. Written responses to the CR items are image scanned, distributed electronically through an online CR scoring application, and then scored by human scorers.
7.1.1 Scoring and Reporting Specifications Written specifications developed by the contractor prior to operational scoring help to ensure that the CELDT results are reported accurately. Unless otherwise specified, the 2017–18 Edition used these specifications documents as described.
• Test Form Distribution Plan: For editions that include field testing, the contractor develops a sampling and distribution plan that identifies which local educational agencies (LEAs) will receive the various forms of the test. For the 2017–18 Edition, there was no field testing and thus no Test Form Distribution Plan; all students were administered the same form (Form 1).
• Operations Specifications: These specifications outline how scorable answer documents are retrieved from LEAs and how they are processed through scanning along with the rules for handling anomalies found during document processing.
• Data Processing Specifications: This document provides details on how scanned data is edited, CR items are scored, and scoring calculations, including default values and override circumstances, are applied. The methods used to merge data provided by the LEA through the Pre-Identification (Pre-ID) web-based application and the California Longitudinal Pupil Achievement Data (CALPADS) merge processes are also included in the specifications.
• Reporting Specifications: These specifications provide the reporting categories and calculation rules for the information presented on the CELDT individual and summary paper reports as well as the electronic files. Approved paper report mockups, reporting rules, and footnotes to use when a domain on the answer document is marked with a testing
CELDT 2017–18 Edition Technical Report
California Department of Education November 2018 50
irregularity or modification and/or alternate assessment are also included in these specifications.
7.1.2 Types of Documents To take the CELDT, students in grades 3–12 use a scannable answer document, called an Answer Book, to mark their answers and make written responses and a separate nonscannable Test Book that provides the questions and some instructions. Students record their responses to reading, writing, and listening items, and test examiners record responses and scores to the speaking items in the Answer Book. Students in grades K–1 and grade 2 use one scannable Answer Book in which they record their own writing responses. In cases where, in grade 1 only, listening items are administered to a group, the students mark their own answers. Test examiners record student responses to the reading, speaking, and listening domains (when administered individually).
7.1.3 Scanning and Editing The scanning, editing, and scoring processes are performed throughout the administration year (July 1 through June 30), although most of the scorable materials for the 2017–18 Edition were received between September and November when students began the school year. Answer Books are scanned and scored in accordance with the Data Processing Specifications. The editing process includes steps to check the spelling of the student name (i.e., that the scanner picked up all the bubbled letters and that there were no multiple marks, no embedded blanks, and no initial blanks in the name) and that the scanner picked up all the bubbled digits in the Statewide Student Identifier (SSID). In addition, demographic fields that are crucial to merge processes are reviewed and edited so that the resulting data files are as complete as possible. The scannable Answer Books produce a single record for each student that includes demographic data, scanned responses, and the scores for DCR items entered by the test examiner.
7.1.4 Record Merge Process At the beginning of the testing window, LEAs are given the option of uploading to the secure CELDT District Portal data files that contain student demographic and identification data. Prior to accepting each student record, the Pre-ID system employs data checks according to the rules established in the Pre-ID Data File Layout. Because some of the student data comes from the CALPADS system and merges into the CELDT data files (rather than being collected during testing), the following demographic fields were not included in the Pre-ID Data File Layout for the 2017–18 Edition: District Name, School Name, Primary Language Code, Primary Disability Code, Program Participation Migrant
CELDT 2017–18 Edition Technical Report
California Department of Education November 2018 51
Education, Date First Enrolled (USA), Special Ed Services Code, Nonpublic School (NPS) Code, and County/District of Residence for students with Individualized Education Plans. Once the student records are uploaded by the LEAs and accepted by the Pre-ID system, the system applies a unique sequence number to each record in the Pre-ID file. This unique number is printed on the Pre-ID label as a barcode, and LEAs place the labels on the scannable Answer Books to identify them. After testing, when the documents are scanned, this barcode number is attached to the scan record and used as the “key” for merging the scanned data (described in section 7.1.3) with the Pre-ID file data. Checks are performed to eliminate duplicate barcode numbers during each step of the merging process.
7.2 Multiple-Choice (MC) Scoring The scanning, data editing, and merging processes generate a data file that consists of one record per student. Each student record contains student responses to MC items, recorded scores for the DCR items that have been scored locally (e.g., the speaking domain), and recorded scores for the written responses. The MC items are machine scored against the answer keys with quality control measures in place throughout the process.
7.2.1 Scoring Key Verification Process Scoring keys, in the form of item maps, are produced during the item development process and verified by performing various quality control checks for use in scoring. The item maps contain information about each test form, including item identification information, correct key (MC items), and statistics associated with each item. As a last step in the verification process, item maps are verified against the print-ready copy of the Test Book and Answer Book to ensure that any positional shifts of an item that might have occurred before the book was finalized are correctly accounted for. After the keys are programmed into the MC scoring system, another quality control step takes place to ensure that what is entered into the scoring program matches the original test maps. As a final check, the entire scoring system is verified using a test deck that contains a variety of response vectors, including sample Answer Books that have all responses marked correctly. After the above checks are complete, data analysts check and score the data file using point-biserial correlations, p-values, and response frequencies using a large sample of student records that arrive for scoring early during the administration. Analysts compare these results to those produced by the scoring system. Additionally, analysts further review all items with low point-biserial correlations by reviewing those items on the actual tests.
7.2.2 Multiple-Choice (MC) Scores To score the operational MC items, the student responses in the data file are compared to the answer keys. The answer keys for each domain are specific to
CELDT 2017–18 Edition Technical Report
California Department of Education November 2018 52
a grade span. An item is assigned a 1 if the response is correct and a 0 if the response is incorrect, blank, or contains multiple marks. These assigned values to each item are aggregated to establish student raw scores and other item statistics.
7.3 Constructed-Response (CR) Scoring CR scoring includes activities associated with the writing and speaking domains. The writing domain consists of CR items that are graded by human readers rather than machines. Local examiners may score the CR writing items, but the contractor assigns the official writing scores. Local examiners provide the official scores for the speaking items. This section describes procedures that are in place to ensure that both processes are carefully executed and that test results are reliable, valid, and fair.
7.3.1 Writing Anchor Paper Selection The purpose of anchor paper selection is the identification of student work samples used both to train and to evaluate scorers, thereby maintaining quality control throughout the scoring process. This process is referred to as range finding, and the samples of student work selected are called anchor papers. Anchor papers were selected from previously used anchor papers and from student work samples where both scorers agreed on the score point. Anchor papers were chosen and arranged to illustrate the application of the rubric to a variety of student response types.
7.3.2 Writing Scorer Selection For the 2017–18 Edition, the CELDT scorers were selected from a pool of 98 applicants of which 94 had previously scored the CELDT. The application process includes a survey and a phone interview to confirm that the applicant has the following:
• A bachelor’s degree from an accredited college or university (written proof required)
• Working knowledge of English grammar
• A teaching credential and/or experience teaching English-language arts
• Experience scoring open-ended student responses ranging from sentences to essays
Beyond the preemployment screening, applicants are required to meet a rigorous set of hand-scoring qualifications. Specific hand-scoring qualifications include:
• Completion of all required paid training
• Receipt of a passing score on post-training validation
• Ongoing attainment of minimum scoring validation and speed requirements
CELDT 2017–18 Edition Technical Report
California Department of Education November 2018 53
Twenty-two percent of the applicants had prior teaching experience or were currently teaching, and 100 percent of the scorers had previous experience scoring open-ended student responses ranging from sentences to essays. Ultimately, 100 percent of the applicants who attended training met the required hand-scoring qualifications. In addition to meeting these requirements, 100 percent of the 16 lead scoring staff (master scorers, trainers, and table leaders) scored the CELDT during the 2015–16 and 2016–17 editions, and all had extensive scoring experience. Master scorers, for example, have multiple years of CR scoring experience and work with scoring protocols for multiple programs and states. Table leaders, whose role is to respond to questions and issues of scorers as they arise during scoring, have a minimum of two years of scoring experience.
7.3.3 Writing Scorer Training Each successful applicant completes an extensive training program and demonstrated mastery of the rubrics prior to operational scoring. To guide the scorers, scorer training addresses the rubrics for each item and uses sets of anchor papers that were selected by master scorers to concretely illustrate each rubric score point. Multiple anchor papers are used throughout the training process. Writing scorer training is delivered in an interactive classroom environment. Each scorer is required to demonstrate satisfactory scoring ability based upon the results of both the calibration tests and the practice scoring environment. Once the minimum requirements are met, the scorer can score actual student responses. The training begins by orienting the scorer to the scoring process and the use of the CELDT writing rubric. It covers both general aspects of the rubric as well as aspects of the specific item(s) they will encounter. Each score point on each rubric is defined, and at least six approved examples of student work that met the criteria for each score point (i.e., anchor papers) are presented and discussed. A post-test containing at least 10 sample student responses follows the training for each prompt. Trainees whose post-test results indicate mastery of the topic move on to scoring practice items while an indication of inadequate mastery leads the trainee to additional instruction on the topic. The certification requirement is at least an 80 percent exact agreement and 100 percent adjacent (within one point) agreement with the anchor papers’ scores.
7.3.4 Ongoing Writing Scorer Evaluation Scorer evaluation continues after training and certification. As a scorer begins a live scoring session, and periodically thereafter, sets of 10 “check papers” from the anchor paper pool are presented as part of the normal workflow. Readers are required to demonstrate exact agreement with the established check-set scores on 80 percent of the check-set papers with no discrepant scores across all grade levels and items. Any time a scorer fails to meet these ongoing certification requirements, the workstation is automatically locked out of
CELDT 2017–18 Edition Technical Report
California Department of Education November 2018 54
scoring, and a master scorer addresses the issue with the scorer individually. Readers whose scores differ from the check-set papers are given additional training followed by another qualifying set of papers. Readers who are unable to maintain qualification through this process are dismissed from scoring. Additionally, scorers randomly score a sample of papers throughout the scoring process that have been scored by someone else. This 10 percent random check is called a “double-blind” read behind process because neither of the scorers is aware of the other’s scores. Master scorers monitor the "double-blind" read behind process by accessing user and prompt reports found in the online CR scoring application. See appendix O for information about scorer agreement rates.
7.3.5 Electronic Image-Based Constructed-Response (CR) Scoring To capture student written responses to CR items, scanners are programmed to identify the areas on each page of the scannable Answer Books that contain student writing and to electronically clip and save images of the written responses to be scored. The scanner program also creates an index file that stays with each clipped image and uniquely identifies it as belonging to a particular student. The CR scoring is completed under supervised conditions at a centralized scoring center located in Sacramento, California. Strict security measures are implemented to protect the privacy of student data and responses as well as the secure test items. These security measures include
• stripping student-identifying data (such as name, ID number, gender, etc.) from the image record and from the scorers’ screens;
• restricting scorers’ browsers to prevent them from printing any image or portion of an image on the screen (an exception exists for scoring supervisors who may need to print a student response in cases of the discovery of sensitive writing that requires special handling offline);
• restricting the availability of images through the scoring application, data server, and scoring network only; and
• permitting access to the system using Secure Socket Layer (SSL) browser encryption only, ensuring that communication between the scorer and the server is protected from outside hacking.
The image-based scoring system presents scanned images of student responses to the scorers on the computer screen. The scorers then read and evaluate the student responses and enter their score for that response on the computer. The system only allows input of an appropriate score for that item (e.g., items with a maximum possible score of 3 only accept a score of 0, 1, 2, or 3) or a defined nonscorable code (e.g., blank, illegible, unintelligible). Data regarding the scorers (i.e., scorer ID number, metadata related to time and date of scoring, etc.) and the scores they assign are recorded in a database dynamically at the time of scoring.
CELDT 2017–18 Edition Technical Report
California Department of Education November 2018 55
The image-based system is programmed to provide many on-demand reports of scorer performance. Reports of scorer performance are computed throughout the scoring day, and reports are generated that show the total number of items processed daily by each scorer. By using the unique ID number assigned to each scorer and data pertaining to exact, adjacent, and nonadjacent agreement, these reports also provide total production and scoring rates. Table leaders and master scoring staff review these reports to determine the necessity of retraining scoring staff or assigning staff to score different items based on the numbers of items in the queue to be scored. This helps ensure that scoring is completed within deadlines for different batches of tests and that reporting deadlines can be met.
7.4 Types of Scores The process of scoring the CELDT involves multiple steps, including scanning student Answer Books, creating student raw scores for all item types (MC, DCR, and CR), assigning scale scores, and assigning performance levels. Measures to ensure accuracy are taken at each step in the scoring and reporting process.
7.4.1 Merging Score Files The MC and CR scoring processes result in two data files that are merged for final scoring, score aggregations, and reporting. One file contains the MC responses marked by the student and DCR scores recorded by the test examiner, and the other contains the CR scores assigned by the trained writing scorers. The first part of the merge process checks that all CR items have scores. Special codes are assigned in cases where a numeric score is not given. The two data files are merged using a unique numeric key (called a lithocode) that is contained in both files, originally obtained from each student’s scannable Answer Book. The merge process is checked using two independently developed programs. Any discrepancies in the outcomes of the two separate programs are resolved before continuing with scoring and reporting.
7.4.2 Raw Scores Raw scores for each domain are obtained by summing the number of MC and DCR items answered correctly by the student and adding the total number of points obtained on the CR items. (See table 2.1.) Raw scores are computed and used to compute scale scores but are not included in any reports.
7.4.3 Scale Scores The CELDT reports student performance in terms of scale scores that express student proficiency in terms of a constant metric. For example, a scale score of 350 in one domain on one edition represents the same level of proficiency as a 350 on the same domain on another edition, even though each of these scale scores may represent a different raw score. (See section 6.1 for information on the development of the common scale.)
CELDT 2017–18 Edition Technical Report
California Department of Education November 2018 56
CELDT scale scores are expressed as three-digit numbers that range from 140 to 810 across grades and domains. Lower scores indicate lesser proficiency, and higher scores indicate greater proficiency. Student-level scale scores are shown on the Student Performance Level Report (SPLR), Student Record Labels, and Roster Report. The Performance Level Summary Report provides the mean scale score and the standard deviation of scale scores for an aggregated group. The types of reports and different aggregations are described in section 7.5. In addition to providing scale scores for the four domains of listening, speaking, reading, and writing, scale scores are also provided for overall proficiency, which is a composite of all four domains, and for comprehension, which is an average of the scale scores of reading and listening.
7.4.4 Performance Levels Each scale score is classified into one of five performance levels: Beginning, Early Intermediate, Intermediate, Early Advanced, and Advanced. These performance levels and how they are defined are described in detail in section 6.4.
7.5 Types of Reports The CELDT reports communicate results to teachers, parents, and administrators, thereby providing information needed to guide student learning and evaluate instructional programs. Results are also used for meeting state and federal accountability requirements for schools and LEAs.
7.5.1 Student Performance Level Report (SPLR) This one-page report presents results for an individual student. Scale scores are presented numerically and graphically for each domain and for the overall performance levels. The Comprehension Score is also provided. The Test Performance Descriptors, specific to the grade span of the student, are printed on the back of the report.
7.5.2 Student Record Label This report is designed to provide individual student performance scores on a label that can be attached to the student’s file for easy reference. It contains the majority of the statistical and demographic information provided in the SPLR in a compact (4-inch x 1.5-inch) format.
7.5.3 Roster Report The Roster Report displays student results as an alphabetical listing by student last name grouped by school and grade. Rosters include data for IA students tested between July 1 and October 31, 2017. The roster provides the scale score and the performance level for each domain and overall scores in addition to some student demographic data.
CELDT 2017–18 Edition Technical Report
California Department of Education November 2018 57
7.5.4 Performance Level Summary Report (PLSR) This one-page report displays aggregated scale scores and performance levels by grade, school, and LEA. It provides the number and percentage of students at each performance level for each domain and overall. The total number of students, the mean scale score, and the standard deviation1 of scale scores are also provided for each domain and overall. For the 2017–18 administration, two sets of group reports were provided to local educational agencies: one set with aggregated results for students tested between July 1 through October 31 and a second set with aggregated results for students tested throughout the entire administration (July 1 through June 30). Samples of each report are shown in appendix Q.
7.6 Score Aggregation Individual student scale scores are aggregated and reported to provide information about the performance of groups of students. Aggregated group reports and electronic data files are prepared by school and LEA/independently testing charter school. Electronic files are prepared also by state level. The number and percentage of students at each performance level by domain, mean scale scores, and standard deviations for each student group are also calculated. No students are excluded from aggregated reports. Appendix E presents scale score summary statistics of IA student performance on the CELDT. The tables show the number of examinees in each grade taking each test and the scale score means and standard deviations of student scores. Since these tables were previously generated using only annual assessment (AA) data, and the data is not comparable between the IA and AA populations, the historical tables going back to the 2006–07 administration, the first year in which the common scale was used, were removed from this report. Table 7.1 presents the percentage of IA students tested during the 2017–18 administration in each performance category by domain. The last column of the table presents the combined percentage of examinees classified at the Early Advanced level or higher.
1The standard deviation is provided only for groups of two or more students.
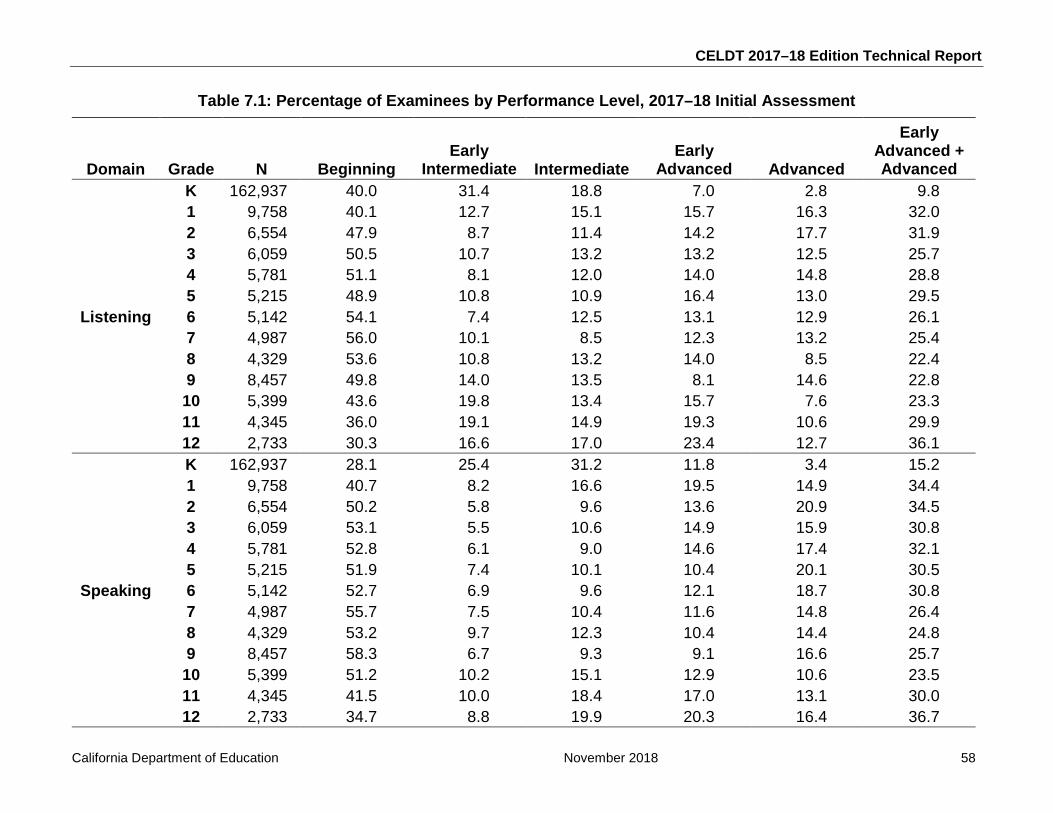
CELDT 2017–18 Edition Technical Report
California Department of Education November 2018 58
Table 7.1: Percentage of Examinees by Performance Level, 2017–18 Initial Assessment
Domain Grade N Beginning Early
Intermediate Intermediate Early
Advanced Advanced
Early Advanced + Advanced
Listening
K 162,937 40.0 31.4 18.8 7.0 2.8 9.8 1 9,758 40.1 12.7 15.1 15.7 16.3 32.0 2 6,554 47.9 8.7 11.4 14.2 17.7 31.9 3 6,059 50.5 10.7 13.2 13.2 12.5 25.7 4 5,781 51.1 8.1 12.0 14.0 14.8 28.8 5 5,215 48.9 10.8 10.9 16.4 13.0 29.5 6 5,142 54.1 7.4 12.5 13.1 12.9 26.1 7 4,987 56.0 10.1 8.5 12.3 13.2 25.4 8 4,329 53.6 10.8 13.2 14.0 8.5 22.4 9 8,457 49.8 14.0 13.5 8.1 14.6 22.8 10 5,399 43.6 19.8 13.4 15.7 7.6 23.3 11 4,345 36.0 19.1 14.9 19.3 10.6 29.9 12 2,733 30.3 16.6 17.0 23.4 12.7 36.1
Speaking
K 162,937 28.1 25.4 31.2 11.8 3.4 15.2 1 9,758 40.7 8.2 16.6 19.5 14.9 34.4 2 6,554 50.2 5.8 9.6 13.6 20.9 34.5 3 6,059 53.1 5.5 10.6 14.9 15.9 30.8 4 5,781 52.8 6.1 9.0 14.6 17.4 32.1 5 5,215 51.9 7.4 10.1 10.4 20.1 30.5 6 5,142 52.7 6.9 9.6 12.1 18.7 30.8 7 4,987 55.7 7.5 10.4 11.6 14.8 26.4 8 4,329 53.2 9.7 12.3 10.4 14.4 24.8 9 8,457 58.3 6.7 9.3 9.1 16.6 25.7 10 5,399 51.2 10.2 15.1 12.9 10.6 23.5 11 4,345 41.5 10.0 18.4 17.0 13.1 30.0 12 2,733 34.7 8.8 19.9 20.3 16.4 36.7
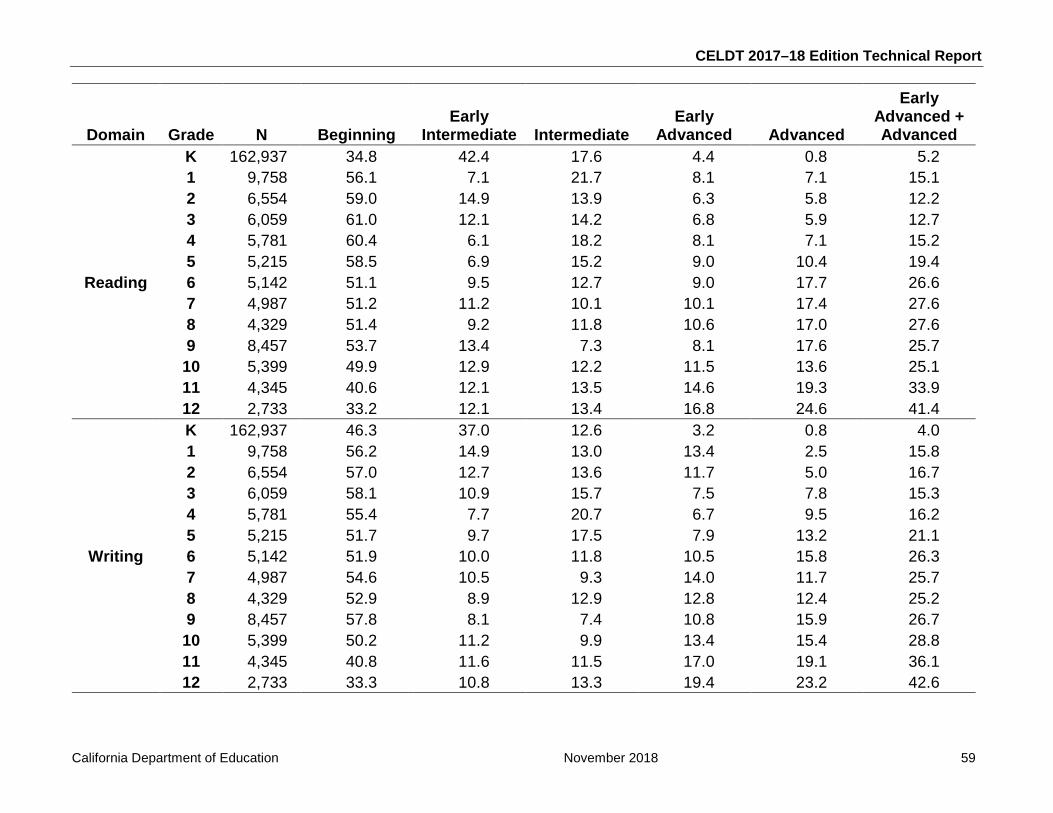
CELDT 2017–18 Edition Technical Report
California Department of Education November 2018 59
Domain Grade N Beginning Early
Intermediate Intermediate Early
Advanced Advanced
Early Advanced + Advanced
Reading
K 162,937 34.8 42.4 17.6 4.4 0.8 5.2 1 9,758 56.1 7.1 21.7 8.1 7.1 15.1 2 6,554 59.0 14.9 13.9 6.3 5.8 12.2 3 6,059 61.0 12.1 14.2 6.8 5.9 12.7 4 5,781 60.4 6.1 18.2 8.1 7.1 15.2 5 5,215 58.5 6.9 15.2 9.0 10.4 19.4 6 5,142 51.1 9.5 12.7 9.0 17.7 26.6 7 4,987 51.2 11.2 10.1 10.1 17.4 27.6 8 4,329 51.4 9.2 11.8 10.6 17.0 27.6 9 8,457 53.7 13.4 7.3 8.1 17.6 25.7 10 5,399 49.9 12.9 12.2 11.5 13.6 25.1 11 4,345 40.6 12.1 13.5 14.6 19.3 33.9 12 2,733 33.2 12.1 13.4 16.8 24.6 41.4
Writing
K 162,937 46.3 37.0 12.6 3.2 0.8 4.0 1 9,758 56.2 14.9 13.0 13.4 2.5 15.8 2 6,554 57.0 12.7 13.6 11.7 5.0 16.7 3 6,059 58.1 10.9 15.7 7.5 7.8 15.3 4 5,781 55.4 7.7 20.7 6.7 9.5 16.2 5 5,215 51.7 9.7 17.5 7.9 13.2 21.1 6 5,142 51.9 10.0 11.8 10.5 15.8 26.3 7 4,987 54.6 10.5 9.3 14.0 11.7 25.7 8 4,329 52.9 8.9 12.9 12.8 12.4 25.2 9 8,457 57.8 8.1 7.4 10.8 15.9 26.7 10 5,399 50.2 11.2 9.9 13.4 15.4 28.8 11 4,345 40.8 11.6 11.5 17.0 19.1 36.1 12 2,733 33.3 10.8 13.3 19.4 23.2 42.6
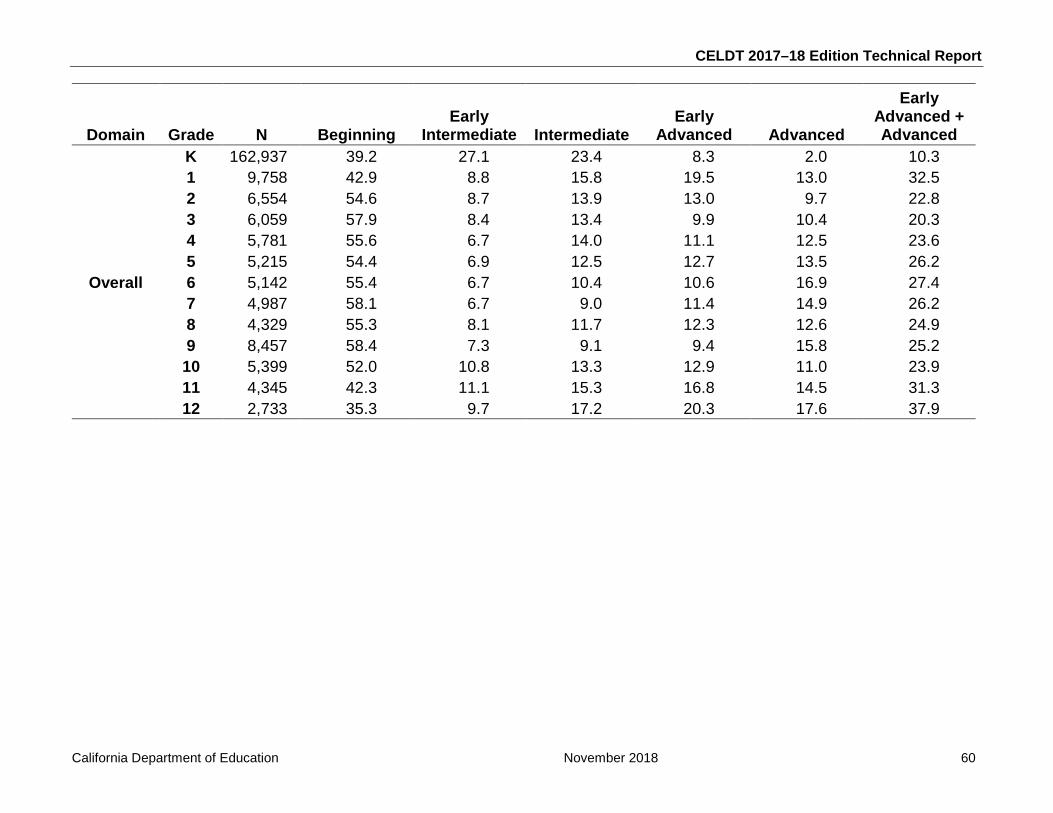
CELDT 2017–18 Edition Technical Report
California Department of Education November 2018 60
Domain Grade N Beginning Early
Intermediate Intermediate Early
Advanced Advanced
Early Advanced + Advanced
Overall
K 162,937 39.2 27.1 23.4 8.3 2.0 10.3 1 9,758 42.9 8.8 15.8 19.5 13.0 32.5 2 6,554 54.6 8.7 13.9 13.0 9.7 22.8 3 6,059 57.9 8.4 13.4 9.9 10.4 20.3 4 5,781 55.6 6.7 14.0 11.1 12.5 23.6 5 5,215 54.4 6.9 12.5 12.7 13.5 26.2 6 5,142 55.4 6.7 10.4 10.6 16.9 27.4 7 4,987 58.1 6.7 9.0 11.4 14.9 26.2 8 4,329 55.3 8.1 11.7 12.3 12.6 24.9 9 8,457 58.4 7.3 9.1 9.4 15.8 25.2 10 5,399 52.0 10.8 13.3 12.9 11.0 23.9 11 4,345 42.3 11.1 15.3 16.8 14.5 31.3 12 2,733 35.3 9.7 17.2 20.3 17.6 37.9
CELDT 2017–18 Edition Technical Report
California Department of Education November 2018 61
7.7 Criteria for Interpreting Test Scores LEAs may use the CELDT results to help make decisions about student placement in English learner (EL) programs, student exit from EL programs, and student growth in proficiency while in EL programs. The CELDT, however, is a single measure of student performance and is intended to be used in combination with other relevant information in the decision-making process. The test scores must be interpreted cautiously when making decisions about student or program performance. The CELDT performance levels represent broad ranges of proficiency with wide gradations between the lowest and highest possible scores in each range that will be reflected in student performance. While statistical procedures were carefully applied to ensure a continuous scale throughout the full range of the common scale, caution should be used in comparing individual student performance across nonadjacent grade spans. Although the common scales have the same general properties across domains, numeric comparisons across domains cannot be made. That is, a student scoring 400 in reading and 420 in speaking is not necessarily doing better in terms of oral skills.

THIS PAGE HAS
BEEN INTENTIONALLY
LEFT BLANK.
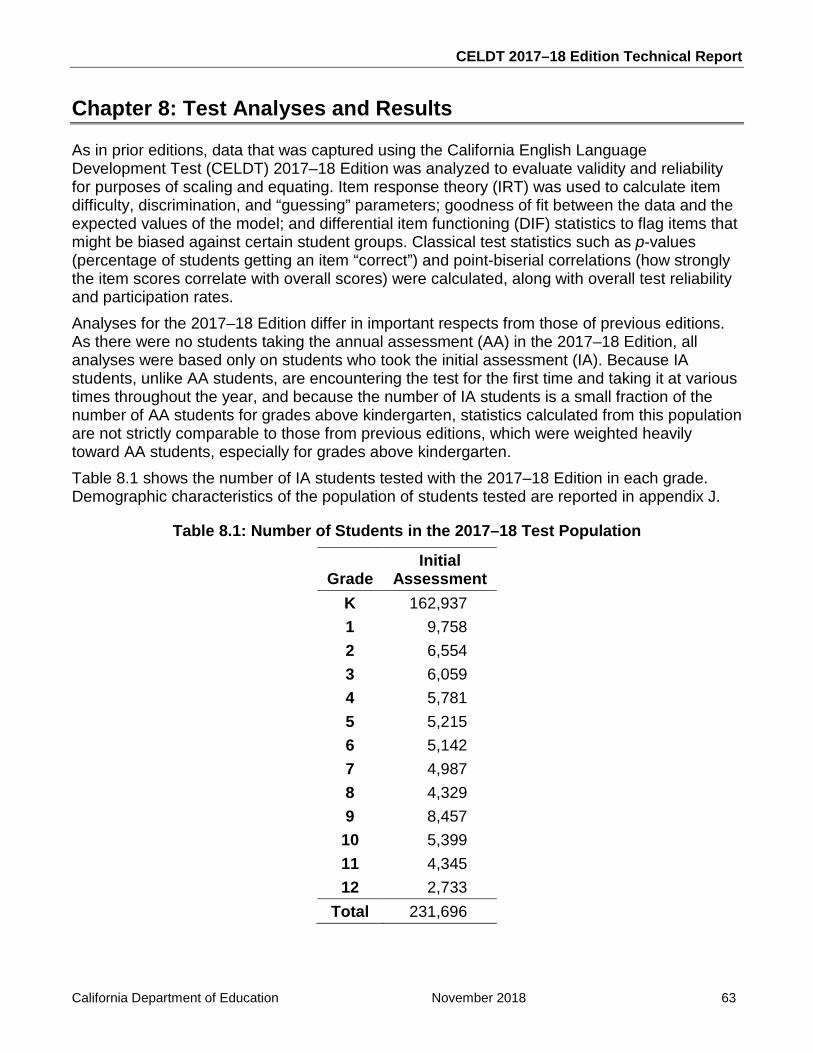
CELDT 2017–18 Edition Technical Report
California Department of Education November 2018 63
Chapter 8: Test Analyses and Results
As in prior editions, data that was captured using the California English Language Development Test (CELDT) 2017–18 Edition was analyzed to evaluate validity and reliability for purposes of scaling and equating. Item response theory (IRT) was used to calculate item difficulty, discrimination, and “guessing” parameters; goodness of fit between the data and the expected values of the model; and differential item functioning (DIF) statistics to flag items that might be biased against certain student groups. Classical test statistics such as p-values (percentage of students getting an item “correct”) and point-biserial correlations (how strongly the item scores correlate with overall scores) were calculated, along with overall test reliability and participation rates. Analyses for the 2017–18 Edition differ in important respects from those of previous editions. As there were no students taking the annual assessment (AA) in the 2017–18 Edition, all analyses were based only on students who took the initial assessment (IA). Because IA students, unlike AA students, are encountering the test for the first time and taking it at various times throughout the year, and because the number of IA students is a small fraction of the number of AA students for grades above kindergarten, statistics calculated from this population are not strictly comparable to those from previous editions, which were weighted heavily toward AA students, especially for grades above kindergarten. Table 8.1 shows the number of IA students tested with the 2017–18 Edition in each grade. Demographic characteristics of the population of students tested are reported in appendix J.
Table 8.1: Number of Students in the 2017–18 Test Population
Grade Initial
Assessment K 162,937 1 9,758 2 6,554 3 6,059 4 5,781 5 5,215 6 5,142 7 4,987 8 4,329 9 8,457 10 5,399 11 4,345 12 2,733
Total 231,696
CELDT 2017–18 Edition Technical Report
California Department of Education November 2018 64
8.1 Definition of Reporting Populations and Samples In previous years, students tested during the AA testing window (July 1 through October 31) who were classified as English learners (ELs) and had previously taken the CELDT were identified as AA students or the “AA population.” Since AA students took the English Language Proficiency Assessments for California (ELPAC) during the 2017–18 testing year, no students were classified as AA students for the CELDT. Students whose primary language was a language other than English and who took the CELDT for the first time during the administration year (July 1, 2017 through June 30, 2018) have been identified in this report as initial assessment (IA) students or the “IA population.” Results reported in most of the appendices and tables of this report are based solely on the complete IA population, excluding only those taking the Braille Version or answering fewer than five questions on a non-Braille Version. The equating analyses have previously been based on subsets of these two test populations. The subsets consisted of random samples of approximately 75,000 students for each grade span drawn from the AA population (for grades 1–12) or the AA and IA population (for kindergarten) tested during the AA testing window. Students taking the Braille Version or answering fewer than five questions on a non-Braille Version were excluded. Appendix T provides the on-scale item parameters used for student scoring, based on the 2015–16 AA equating sample. Appendix U provides the scaled item parameters calculated from appendix M and table 8.8 of the CELDT 2016–17 Edition Technical Report. Unlike previous years where appendix M was based on equating sample AA data, appendix M in this report was calculated from the 2017–18 IA population of students as all tables were based on 2017–18 student data.
8.2 Classical Test Theory (CTT) Item Analysis Many of the statistics that are commonly used for evaluating tests, such as p-values, point-biserial correlations, and reliability coefficients, arise from classical test theory (CTT). These item analyses were conducted for each item across all domains using the IA population of students. Detailed results of these item analyses are presented in appendix K (summaries of which appear in the tables below).
8.2.1 Item Difficulty Statistics For multiple-choice (MC) items, the p-value is the proportion of students answering the item correctly. For constructed-response (CR) items, the p-value is the mean item score expressed as a proportion of the total score points possible on that item (i.e., each raw item score is divided by the maximum possible score on the item). This “adjusted item mean,” while not technically a p-value (i.e., the proportion of students responding correctly), has a range of 0 to 1, like MC item means. The 2017–18 Edition p-values based on the IA population were generally within the expected range of above 0.20 and below 0.95, and all were also in the desired difficulty range of 0.30 to 0.90. These ranges were defined to produce items that discriminate most effectively throughout the range of student proficiency. Mean item p-values in the IA population are presented in table 8.2.
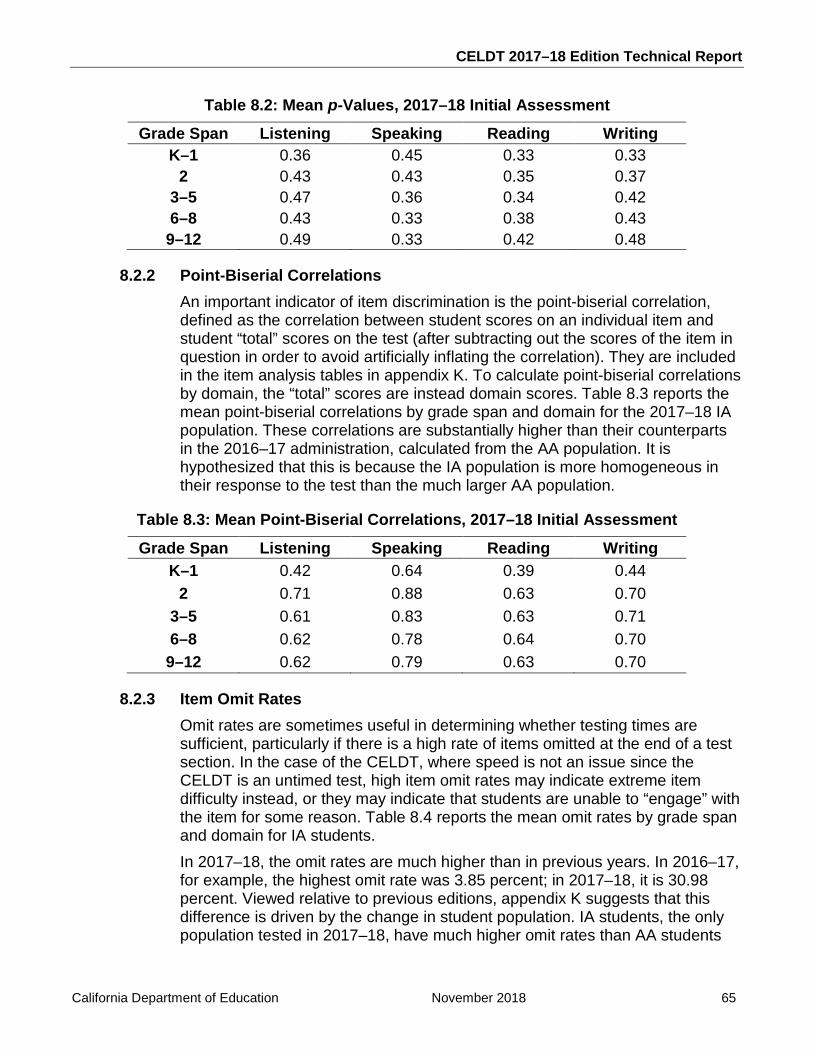
CELDT 2017–18 Edition Technical Report
California Department of Education November 2018 65
Table 8.2: Mean p-Values, 2017–18 Initial Assessment Grade Span Listening Speaking Reading Writing
K–1 0.36 0.45 0.33 0.33 2 0.43 0.43 0.35 0.37
3–5 0.47 0.36 0.34 0.42 6–8 0.43 0.33 0.38 0.43 9–12 0.49 0.33 0.42 0.48
8.2.2 Point-Biserial Correlations An important indicator of item discrimination is the point-biserial correlation, defined as the correlation between student scores on an individual item and student “total” scores on the test (after subtracting out the scores of the item in question in order to avoid artificially inflating the correlation). They are included in the item analysis tables in appendix K. To calculate point-biserial correlations by domain, the “total” scores are instead domain scores. Table 8.3 reports the mean point-biserial correlations by grade span and domain for the 2017–18 IA population. These correlations are substantially higher than their counterparts in the 2016–17 administration, calculated from the AA population. It is hypothesized that this is because the IA population is more homogeneous in their response to the test than the much larger AA population.
Table 8.3: Mean Point-Biserial Correlations, 2017–18 Initial Assessment
Grade Span Listening Speaking Reading Writing K–1 0.42 0.64 0.39 0.44
2 0.71 0.88 0.63 0.70 3–5 0.61 0.83 0.63 0.71 6–8 0.62 0.78 0.64 0.70 9–12 0.62 0.79 0.63 0.70
8.2.3 Item Omit Rates Omit rates are sometimes useful in determining whether testing times are sufficient, particularly if there is a high rate of items omitted at the end of a test section. In the case of the CELDT, where speed is not an issue since the CELDT is an untimed test, high item omit rates may indicate extreme item difficulty instead, or they may indicate that students are unable to “engage” with the item for some reason. Table 8.4 reports the mean omit rates by grade span and domain for IA students. In 2017–18, the omit rates are much higher than in previous years. In 2016–17, for example, the highest omit rate was 3.85 percent; in 2017–18, it is 30.98 percent. Viewed relative to previous editions, appendix K suggests that this difference is driven by the change in student population. IA students, the only population tested in 2017–18, have much higher omit rates than AA students
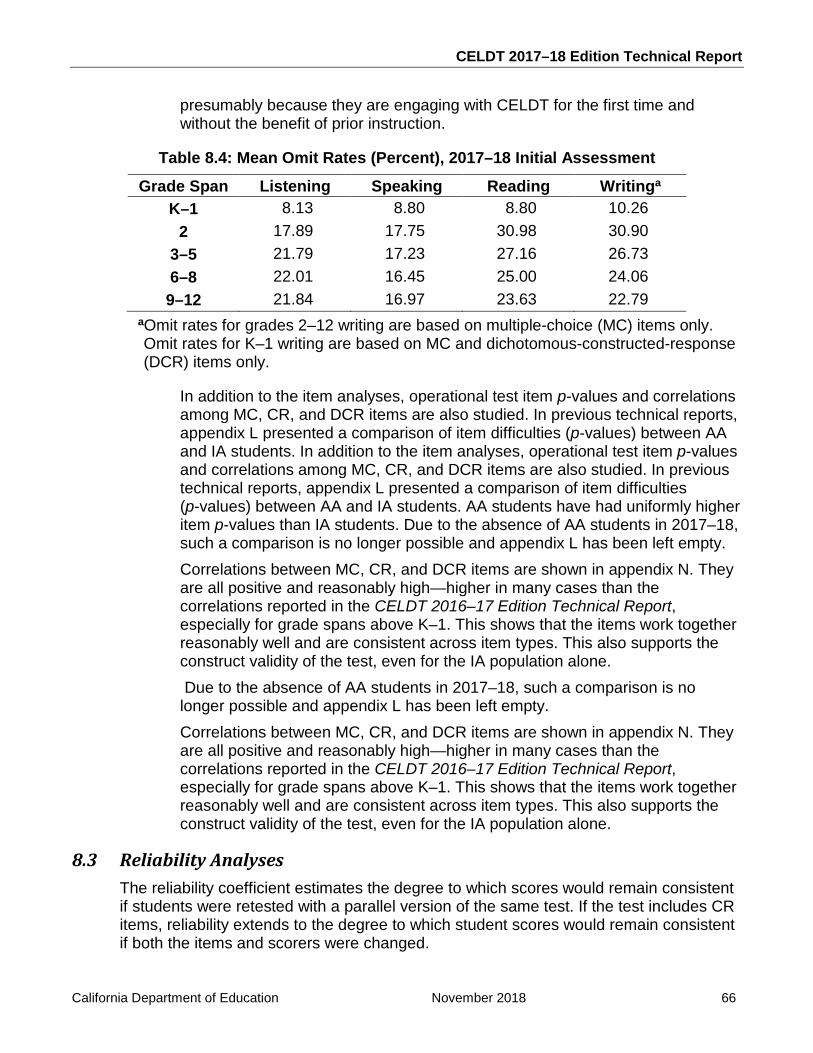
CELDT 2017–18 Edition Technical Report
California Department of Education November 2018 66
presumably because they are engaging with CELDT for the first time and without the benefit of prior instruction.
Table 8.4: Mean Omit Rates (Percent), 2017–18 Initial Assessment Grade Span Listening Speaking Reading Writinga
K–1 8.13 8.80 8.80 10.26 2 17.89 17.75 30.98 30.90
3–5 21.79 17.23 27.16 26.73 6–8 22.01 16.45 25.00 24.06 9–12 21.84 16.97 23.63 22.79
aOmit rates for grades 2–12 writing are based on multiple-choice (MC) items only. Omit rates for K–1 writing are based on MC and dichotomous-constructed-response (DCR) items only.
In addition to the item analyses, operational test item p-values and correlations among MC, CR, and DCR items are also studied. In previous technical reports, appendix L presented a comparison of item difficulties (p-values) between AA and IA students. In addition to the item analyses, operational test item p-values and correlations among MC, CR, and DCR items are also studied. In previous technical reports, appendix L presented a comparison of item difficulties (p-values) between AA and IA students. AA students have had uniformly higher item p-values than IA students. Due to the absence of AA students in 2017–18, such a comparison is no longer possible and appendix L has been left empty. Correlations between MC, CR, and DCR items are shown in appendix N. They are all positive and reasonably high—higher in many cases than the correlations reported in the CELDT 2016–17 Edition Technical Report, especially for grade spans above K–1. This shows that the items work together reasonably well and are consistent across item types. This also supports the construct validity of the test, even for the IA population alone. Due to the absence of AA students in 2017–18, such a comparison is no longer possible and appendix L has been left empty. Correlations between MC, CR, and DCR items are shown in appendix N. They are all positive and reasonably high—higher in many cases than the correlations reported in the CELDT 2016–17 Edition Technical Report, especially for grade spans above K–1. This shows that the items work together reasonably well and are consistent across item types. This also supports the construct validity of the test, even for the IA population alone.
8.3 Reliability Analyses The reliability coefficient estimates the degree to which scores would remain consistent if students were retested with a parallel version of the same test. If the test includes CR items, reliability extends to the degree to which student scores would remain consistent if both the items and scorers were changed.
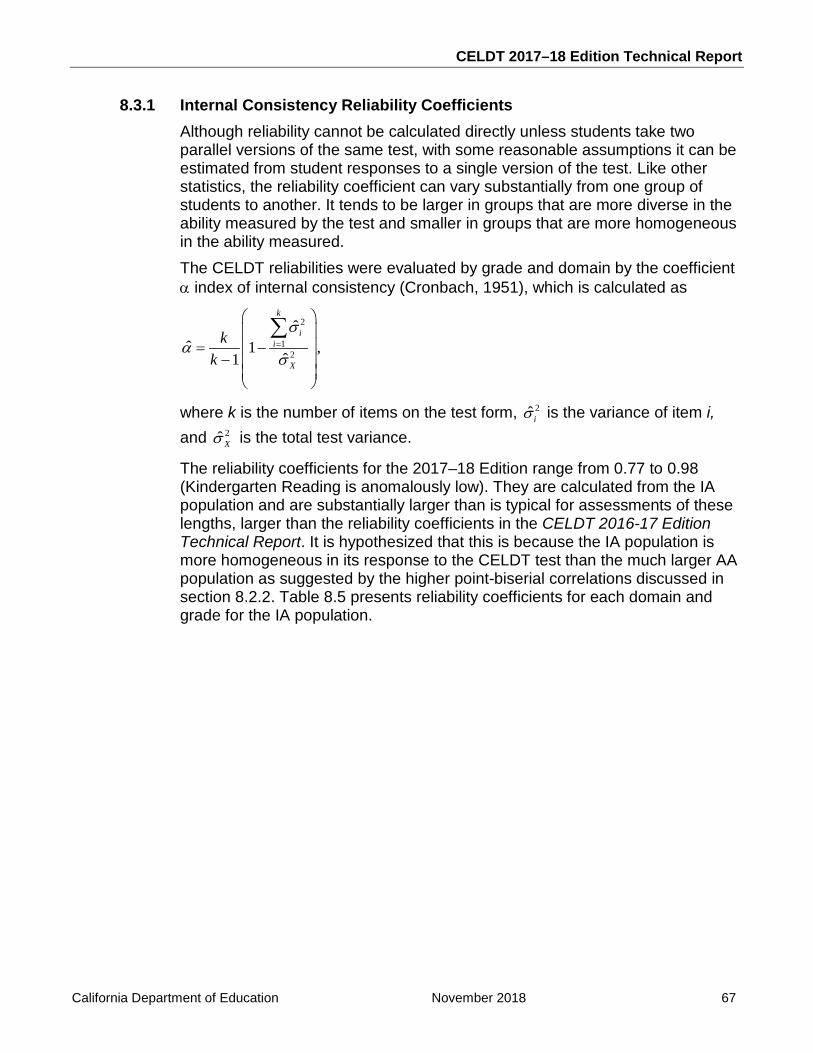
CELDT 2017–18 Edition Technical Report
California Department of Education November 2018 67
8.3.1 Internal Consistency Reliability Coefficients Although reliability cannot be calculated directly unless students take two parallel versions of the same test, with some reasonable assumptions it can be estimated from student responses to a single version of the test. Like other statistics, the reliability coefficient can vary substantially from one group of students to another. It tends to be larger in groups that are more diverse in the ability measured by the test and smaller in groups that are more homogeneous in the ability measured. The CELDT reliabilities were evaluated by grade and domain by the coefficient α index of internal consistency (Cronbach, 1951), which is calculated as
2
12
ˆˆ 1 ,
ˆ1
k
ii
X
kk
σα
σ=
= −
−
∑
where k is the number of items on the test form, 2ˆiσ is the variance of item i, and 2ˆXσ is the total test variance.
The reliability coefficients for the 2017–18 Edition range from 0.77 to 0.98 (Kindergarten Reading is anomalously low). They are calculated from the IA population and are substantially larger than is typical for assessments of these lengths, larger than the reliability coefficients in the CELDT 2016-17 Edition Technical Report. It is hypothesized that this is because the IA population is more homogeneous in its response to the CELDT test than the much larger AA population as suggested by the higher point-biserial correlations discussed in section 8.2.2. Table 8.5 presents reliability coefficients for each domain and grade for the IA population.
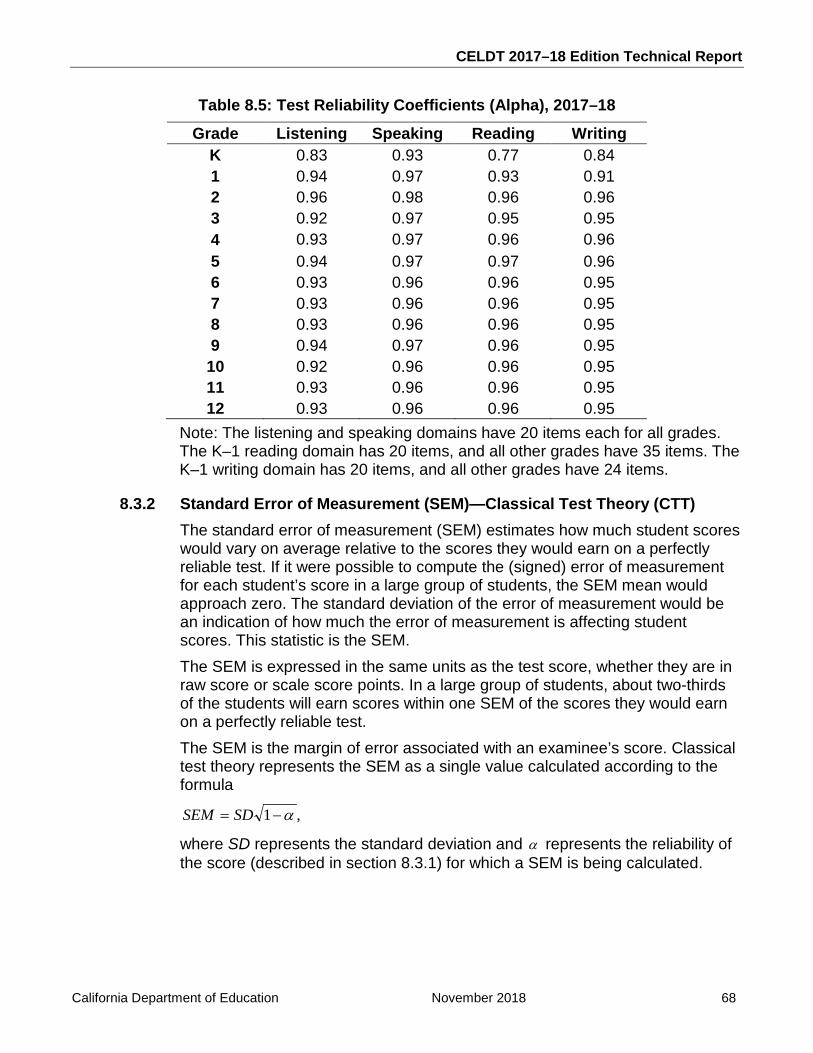
CELDT 2017–18 Edition Technical Report
California Department of Education November 2018 68
Table 8.5: Test Reliability Coefficients (Alpha), 2017–18 Grade Listening Speaking Reading Writing
K 0.83 0.93 0.77 0.84 1 0.94 0.97 0.93 0.91 2 0.96 0.98 0.96 0.96 3 0.92 0.97 0.95 0.95 4 0.93 0.97 0.96 0.96 5 0.94 0.97 0.97 0.96 6 0.93 0.96 0.96 0.95 7 0.93 0.96 0.96 0.95 8 0.93 0.96 0.96 0.95 9 0.94 0.97 0.96 0.95 10 0.92 0.96 0.96 0.95 11 0.93 0.96 0.96 0.95 12 0.93 0.96 0.96 0.95
Note: The listening and speaking domains have 20 items each for all grades. The K–1 reading domain has 20 items, and all other grades have 35 items. TheK–1 writing domain has 20 items, and all other grades have 24 items.
8.3.2 Standard Error of Measurement (SEM)—Classical Test Theory (CTT) The standard error of measurement (SEM) estimates how much student scores would vary on average relative to the scores they would earn on a perfectly reliable test. If it were possible to compute the (signed) error of measurement for each student’s score in a large group of students, the SEM mean would approach zero. The standard deviation of the error of measurement would be an indication of how much the error of measurement is affecting student scores. This statistic is the SEM. The SEM is expressed in the same units as the test score, whether they are in raw score or scale score points. In a large group of students, about two-thirds of the students will earn scores within one SEM of the scores they would earn on a perfectly reliable test. The SEM is the margin of error associated with an examinee’s score. Classical test theory represents the SEM as a single value calculated according to the formula
,1 α−= SDSEM
where SD represents the standard deviation and α represents the reliability of the score (described in section 8.3.1) for which a SEM is being calculated.
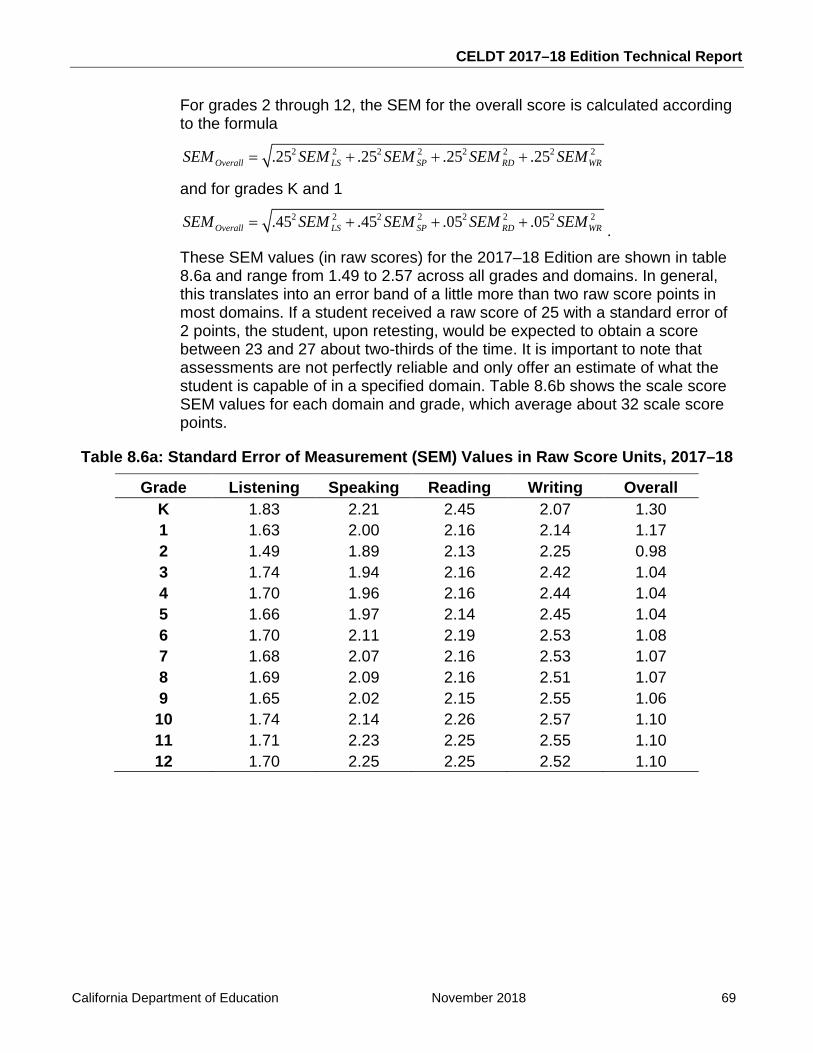
CELDT 2017–18 Edition Technical Report
California Department of Education November 2018 69
For grades 2 through 12, the SEM for the overall score is calculated according to the formula
2 2 2 2 2 2 2 2.25 .25 .25 .25Overall LS SP RD WRSEM SEM SEM SEM SEM= + + +
and for grades K and 1 2 2 2 2 2 2 2 2.45 .45 .05 .05Overall LS SP RD WRSEM SEM SEM SEM SEM= + + + .
These SEM values (in raw scores) for the 2017–18 Edition are shown in table 8.6a and range from 1.49 to 2.57 across all grades and domains. In general, this translates into an error band of a little more than two raw score points in most domains. If a student received a raw score of 25 with a standard error of 2 points, the student, upon retesting, would be expected to obtain a score between 23 and 27 about two-thirds of the time. It is important to note that assessments are not perfectly reliable and only offer an estimate of what the student is capable of in a specified domain. Table 8.6b shows the scale score SEM values for each domain and grade, which average about 32 scale score points.
Table 8.6a: Standard Error of Measurement (SEM) Values in Raw Score Units, 2017–18
Grade Listening Speaking Reading Writing Overall K 1.83 2.21 2.45 2.07 1.30 1 1.63 2.00 2.16 2.14 1.17 2 1.49 1.89 2.13 2.25 0.98 3 1.74 1.94 2.16 2.42 1.04 4 1.70 1.96 2.16 2.44 1.04 5 1.66 1.97 2.14 2.45 1.04 6 1.70 2.11 2.19 2.53 1.08 7 1.68 2.07 2.16 2.53 1.07 8 1.69 2.09 2.16 2.51 1.07 9 1.65 2.02 2.15 2.55 1.06 10 1.74 2.14 2.26 2.57 1.10 11 1.71 2.23 2.25 2.55 1.10 12 1.70 2.25 2.25 2.52 1.10
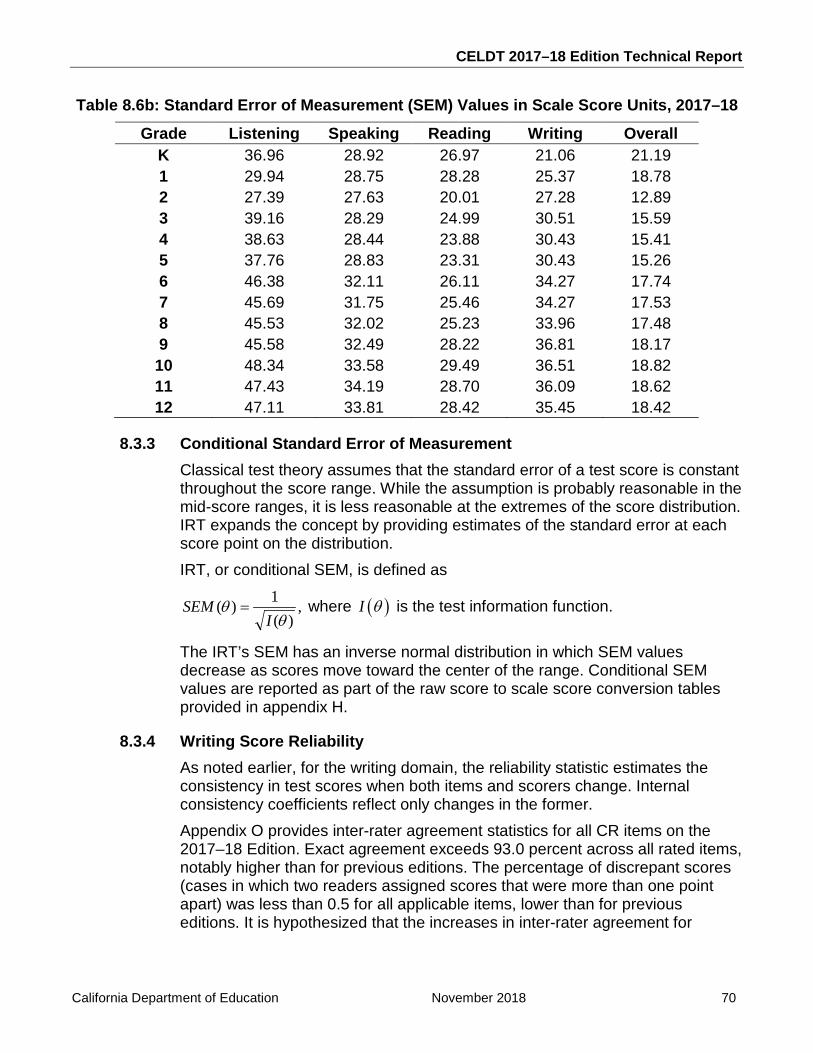
CELDT 2017–18 Edition Technical Report
California Department of Education November 2018 70
Table 8.6b: Standard Error of Measurement (SEM) Values in Scale Score Units, 2017–18 Grade Listening Speaking Reading Writing Overall
K 36.96 28.92 26.97 21.06 21.19 1 29.94 28.75 28.28 25.37 18.78 2 27.39 27.63 20.01 27.28 12.89 3 39.16 28.29 24.99 30.51 15.59 4 38.63 28.44 23.88 30.43 15.41 5 37.76 28.83 23.31 30.43 15.26 6 46.38 32.11 26.11 34.27 17.74 7 45.69 31.75 25.46 34.27 17.53 8 45.53 32.02 25.23 33.96 17.48 9 45.58 32.49 28.22 36.81 18.17 10 48.34 33.58 29.49 36.51 18.82 11 47.43 34.19 28.70 36.09 18.62 12 47.11 33.81 28.42 35.45 18.42
8.3.3 Conditional Standard Error of Measurement Classical test theory assumes that the standard error of a test score is constant throughout the score range. While the assumption is probably reasonable in the mid-score ranges, it is less reasonable at the extremes of the score distribution. IRT expands the concept by providing estimates of the standard error at each score point on the distribution. IRT, or conditional SEM, is defined as
,)(
1)(θ
θI
SEM = where ( )I θ is the test information function.
The IRT’s SEM has an inverse normal distribution in which SEM values decrease as scores move toward the center of the range. Conditional SEM values are reported as part of the raw score to scale score conversion tables provided in appendix H.
8.3.4 Writing Score Reliability As noted earlier, for the writing domain, the reliability statistic estimates the consistency in test scores when both items and scorers change. Internal consistency coefficients reflect only changes in the former. Appendix O provides inter-rater agreement statistics for all CR items on the 2017–18 Edition. Exact agreement exceeds 93.0 percent across all rated items, notably higher than for previous editions. The percentage of discrepant scores (cases in which two readers assigned scores that were more than one point apart) was less than 0.5 for all applicable items, lower than for previous editions. It is hypothesized that the increases in inter-rater agreement for
CELDT 2017–18 Edition Technical Report
California Department of Education November 2018 71
2017–18 are related to the smaller number and increased experience of scorers as well as the higher omit rates. Appendix O contains information about the official item-level writing scores, which are obtained through the contractor’s centralized scoring of writing responses. Writing scores are initially determined at the local level to support immediate decision-making. Scoring training is provided by the contractor to support the consistency and accuracy of local scoring. Appendix S reports the consistency between scoring done locally and that done centrally by the contractor. Each column represents a possible raw score discrepancy between the two scoring entities. The percentage value within each column is the percent of examinees whose scores were discrepant to the degree indicated by the column. For K–1 Writing, item 9, for instance, we see that 84.3 percent of the students had a discrepancy of zero (received the same raw score) between their local score and the contractor score.
8.4 Decision Classification Analyses The reliabilities of performance-level classifications, which are criterion referenced, are related to the reliabilities of the test scores on which they are based, but they are not identical. Glaser (1963) was among the first to draw attention to this distinction, and Feldt and Brennan (1989) extensively reviewed the topic. While test reliability evaluates the consistency of test scores, decision classification reliability evaluates the consistency of classification. Consistency in classification represents how well two versions of an assessment with equal difficulty agree in their classification of students (Livingston and Lewis, 1995). This is estimated by using actual response data and total test reliability from an administered form of the assessment from which two parallel versions of the assessment are statistically modeled and classifications compared. Decision consistency, then, is the extent to which the test classification of examinees into mastery levels agrees with classifications based on a hypothetical parallel test. The examinees’ scores on the second form are modeled statistically. Note that the values of all indexes depend on several factors such as the reliability of the actual test form, distribution of scores, number of cut scores, and location of each cut score. The probability of a correct classification is the probability that the classification the examinee received is consistent with the classification that the examinee would have received on a parallel form. This is akin to the exact agreement rate in inter-rater reliability, and the expectation is that this probability would be high. Decision accuracy is the extent to which the test’s classification of examinees into performance levels agrees with the examinees’ true classifications. The examinees’ true scores and, therefore, true classification are not known but can be modeled. The accuracy is thus the probability, given the error of the test, that the observed classification matches the classification one would expect given the model.
CELDT 2017–18 Edition Technical Report
California Department of Education November 2018 72
Commonly used indexes for decision consistency and accuracy include (a) decision consistency and accuracy at each cut score, (b) overall decision consistency and accuracy across all cut scores, and (c) coefficient kappa. Cohen’s kappa (Fleiss and Cohen, 1973) represents the agreement of the classifications between two parallel versions of the same test, considering the probability of a correct classification by chance. It measures how the test contributes to the classification of examinees over and above chance classifications. In general, the value of kappa is lower than the value of the probability of correct classification because the probability of a correct classification by chance is larger than zero. Over the course of the CELDT contract, classification accuracy and consistency have been calculated using the method proposed by Livingston and Lewis (1995). Anchored in CTT, this method offers the advantage that it can be calculated without the use of IRT software. However, it assumes that student scores can be modeled by a unimodal 4-parameter beta distribution—an assumption that is occasionally problematic and is unnecessary under an IRT paradigm. In 2016, as part of a transition between psychometric vendors, Educational Data Systems changed to an IRT-based method, which is based on work by Lawrence Rudner (2001). In Rudner’s method, the standard error associated with each scale score, assumed to be normally distributed, is used to calculate the probability that a student with that scale score will fall into each of the performance levels. The resulting probabilities are used to calculate the desired accuracy, consistency, and Cohen's kappa statistics. This method makes no assumptions about the shape of the student distribution. In January 2017, Educational Data Systems provided to the California Department of Education its Technical Report Replication Study to establish consistency between Educational Testing Service (ETS) psychometric procedures and those adopted by Educational Data Systems. Appendix 3.5 of that study compares Accuracy, Consistency, and Cohen’s kappa statistics for Educational Data Systems (Rudner’s method) and ETS (Livingston and Lewis) across all grades and domains. In general, the match was reasonably close given the difference in methodologies. Setting aside Cohen’s kappa, only around 4 percent of the differences exceeded 0.05. For Cohen’s kappa, on the other hand, the values from Educational Data Systems consistently exceeded the values from Livingston and Lewis by around 0.16—a difference that is probably a consequence of how Cohen’s kappa is calculated in the context of the Livingston and Lewis algorithm. The Educational Data Systems version of Cohen’s kappa has been cross-checked against other implementations and found to match, and it tends to be close to the consistency statistic, within a few points, which is expected given that Cohen’s kappa is an alternative measure of consistency. Results of classification consistency and accuracy are reported in appendix G by grade and domain. Tables G-1 through G-4 represent overall decision accuracy and consistency; that is, classification across all cut scores. These will tend to be lower than classification accuracy and consistency for individual cut scores. Overall accuracy ranged from 0.584 to 0.865 across domains and grades, consistency ranged from 0.459 to 0.809, and kappa ranged from 0.463 to 0.789.
CELDT 2017–18 Edition Technical Report
California Department of Education November 2018 73
Tables G-5 through G-8 represent classification accuracy at each cut point. Classification accuracy at the critical cut point between Intermediate and Early Advanced ranged from 0.805 to 0.982. Tables G-9 through G-12 represent classification consistency at each cut point. Classification consistency at the critical cut point between Intermediate and Early Advanced ranged from 0.725 to 0.973. In previous years, the accuracy, consistency, and kappa statistics calculated using Rudner’s method have been strongly consistent over time, not varying more than a percentage point. In 2017–18, the statistics differ substantially from those obtained for past editions. The 2017–18 statistics tend to be higher, with differences ranging from zero to as high as 0.26 percentage points. As remarked for other statistics calculated in this report, these differences are almost certainly due to the change in population from primarily AA students to IA students only. Not only do IA students interact with the test differently (as they are taking it for the first time at different points in the school year), but the IA population is much smaller than the AA calibration sample—on the order of a few thousand rather than 75,000 students, reducing the precision of the statistics considerably.
8.5 Validity Analyses
8.5.1 Purpose of the CELDT The CELDT was designed and developed to provide scores representing English language proficiency levels for required educational decision-making as defined by the test purposes in the California Education Code. The primary inferences from the test results include (a) the proficiency level of individual students and (b) English language development (ELD) program effectiveness based on the results of groups of students. Progress can be tracked over years and grades within a given content domain. The results can be used to analyze the strengths and weaknesses of students’ growth in the four domains measured and to report progress to parents. The results can also be used as one body of evidence in making administrative decisions about ELD program effectiveness, class grouping, needs assessment, and placement in programs for ELs. The CELDT program was developed in accordance with the criteria for test development, administration, and use described in the Standards for Educational and Psychological Testing (1999) adopted by the American Educational Research Association (AERA), the American Psychological Association (APA), and the National Council on Measurement in Education (NCME). Test validation is an ongoing process, beginning at initial conceptualization and continuing throughout the lifetime of the assessment. Every aspect of an assessment provides evidence in support of its validity (or evidence to the contrary), including design, content requirements, item development, and psychometric quality. “Validity refers to the degree to which evidence and theory support the interpretations made from test scores. Validity is, therefore, the most fundamental consideration in developing and evaluating tests. The process of
CELDT 2017–18 Edition Technical Report
California Department of Education November 2018 74
validation involves accumulating evidence to provide a sound, scientific basis for the proposed score interpretations” (AERA, APA, & NCME, 1999, p. 9).
8.5.2 Constructs to Be Measured Construct validity—what test scores mean and what kinds of inferences they support—is the central concept underlying the validation process. Evidence for the construct validity of the CELDT is cumulative and integrates evidence from both content-related and criterion-related validity studies. (See chapter 7 for a discussion of the scoring and reporting of the CELDT, including the scores generated, the interpretation of their use, and the intended test population.) The CELDT is a standardized test that assesses the construct of English language proficiency of ELs in grades K–12 in California public schools per the California Education Code. It was designed to be in alignment with the 1999 English-Language Development Standards for California Public Schools, Kindergarten Through Grade Twelve (1999 ELD Standards) for the domains of listening, speaking, reading, and writing. The CELDT is also designed to help the State of California meet the primary purpose of Title III regulations: to “assist all limited English proficient children . . . to achieve at high levels in the core academic subjects so that those children can meet the same challenging State academic content and student academic achievement standards as all children are expected to meet” (Title III, Section 3111 (b)(2)(A)). Note for the 2017–18 Edition, Title III requirements were met using the English Language Proficiency Assessments for California. In response to this and in accordance with advice from the CELDT Technical Advisory Group, a study was conducted in 2006 to assess the degree to which the CELDT items were aligned with the 1999 ELD Standards and linked to the academic content standards for English-language arts, mathematics, and science. (See http://www.cde.ca.gov/ta/tg/el/documents/linkagealignstudy.pdf.) A recommendation from the study was the inclusion of items with greater linguistic complexity than in the 1999 ELD Standards or on the test itself, and that has been the goal of test development activities ever since.
8.5.3 Validity Evidence Content-related validity for language proficiency tests is evidenced by a correspondence between test content and instructional content. To ensure such correspondence, developers conducted a comprehensive curriculum review and met with educational experts to determine common educational goals and the knowledge and skills emphasized in curricula across the country. This information guided all phases of the design and development of the CELDT. For more information about the technical history of the CELDT, see appendix A. Minimization of construct-irrelevant variance and construct underrepresentation is addressed in all the steps of the test development process through item specification, item writing, item review, field testing, test form construction, and standardized test administration. Construct-irrelevant variance means that the
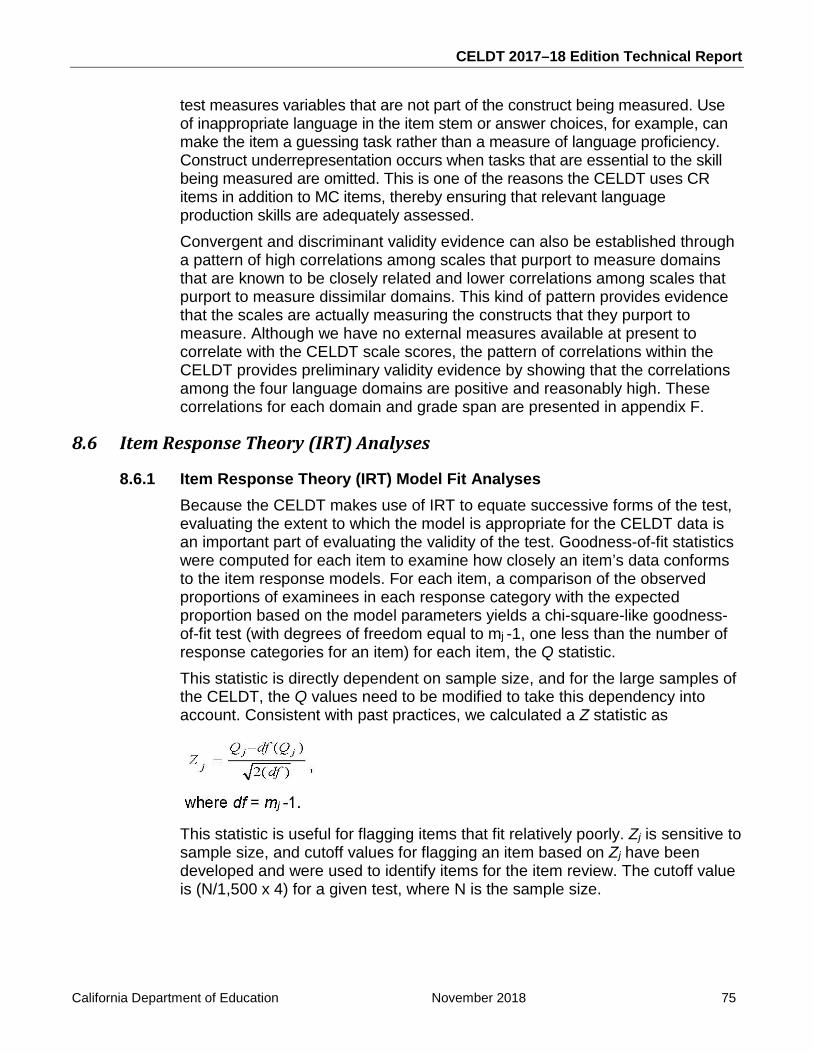
CELDT 2017–18 Edition Technical Report
California Department of Education November 2018 75
test measures variables that are not part of the construct being measured. Use of inappropriate language in the item stem or answer choices, for example, can make the item a guessing task rather than a measure of language proficiency. Construct underrepresentation occurs when tasks that are essential to the skill being measured are omitted. This is one of the reasons the CELDT uses CR items in addition to MC items, thereby ensuring that relevant language production skills are adequately assessed. Convergent and discriminant validity evidence can also be established through a pattern of high correlations among scales that purport to measure domains that are known to be closely related and lower correlations among scales that purport to measure dissimilar domains. This kind of pattern provides evidence that the scales are actually measuring the constructs that they purport to measure. Although we have no external measures available at present to correlate with the CELDT scale scores, the pattern of correlations within the CELDT provides preliminary validity evidence by showing that the correlations among the four language domains are positive and reasonably high. These correlations for each domain and grade span are presented in appendix F.
8.6 Item Response Theory (IRT) Analyses
8.6.1 Item Response Theory (IRT) Model Fit Analyses Because the CELDT makes use of IRT to equate successive forms of the test, evaluating the extent to which the model is appropriate for the CELDT data is an important part of evaluating the validity of the test. Goodness-of-fit statistics were computed for each item to examine how closely an item’s data conforms to the item response models. For each item, a comparison of the observed proportions of examinees in each response category with the expected proportion based on the model parameters yields a chi-square-like goodness-of-fit test (with degrees of freedom equal to mj -1, one less than the number of response categories for an item) for each item, the Q statistic. This statistic is directly dependent on sample size, and for the large samples of the CELDT, the Q values need to be modified to take this dependency into account. Consistent with past practices, we calculated a Z statistic as
This statistic is useful for flagging items that fit relatively poorly. Zj is sensitive to sample size, and cutoff values for flagging an item based on Zj have been developed and were used to identify items for the item review. The cutoff value is (N/1,500 x 4) for a given test, where N is the sample size.
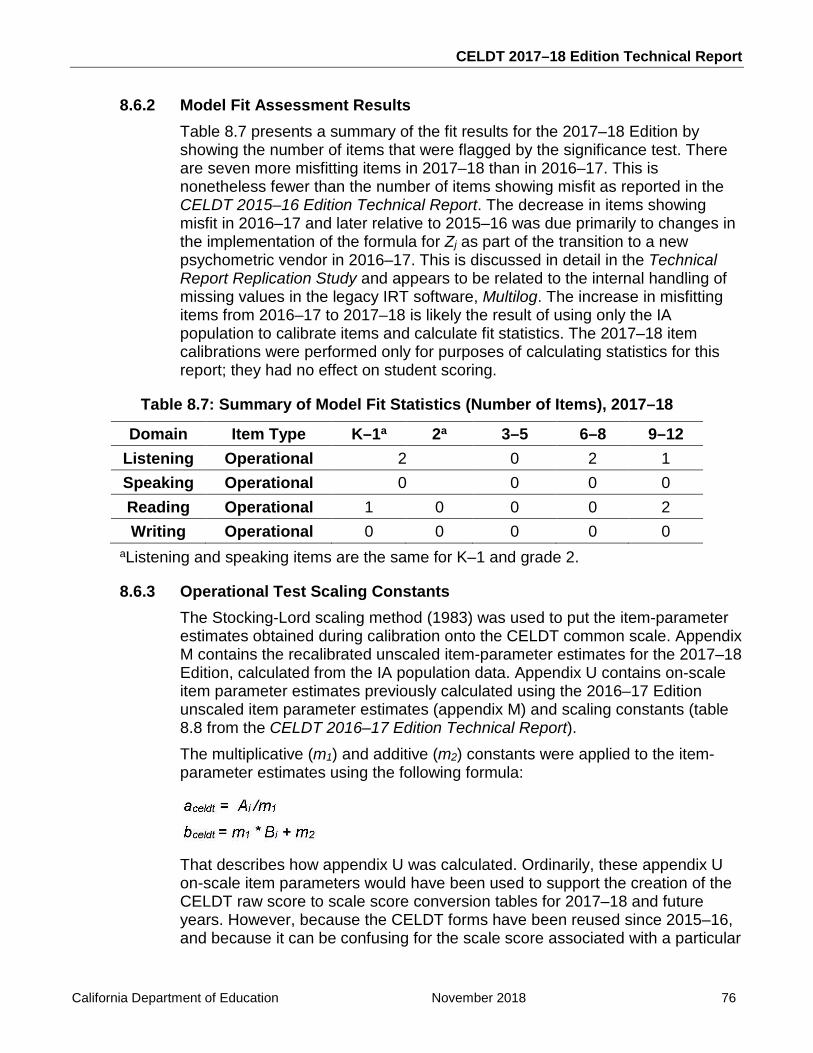
CELDT 2017–18 Edition Technical Report
California Department of Education November 2018 76
8.6.2 Model Fit Assessment Results
Table 8.7 presents a summary of the fit results for the 2017–18 Edition by showing the number of items that were flagged by the significance test. There are seven more misfitting items in 2017–18 than in 2016–17. This is nonetheless fewer than the number of items showing misfit as reported in the CELDT 2015–16 Edition Technical Report. The decrease in items showing misfit in 2016–17 and later relative to 2015–16 was due primarily to changes in the implementation of the formula for Zj as part of the transition to a new psychometric vendor in 2016–17. This is discussed in detail in the Technical Report Replication Study and appears to be related to the internal handling of missing values in the legacy IRT software, Multilog. The increase in misfitting items from 2016–17 to 2017–18 is likely the result of using only the IA population to calibrate items and calculate fit statistics. The 2017–18 item calibrations were performed only for purposes of calculating statistics for this report; they had no effect on student scoring.
Table 8.7: Summary of Model Fit Statistics (Number of Items), 2017–18
Domain Item Type K–1a 2a 3–5 6–8 9–12 Listening Operational 2 0 2 1 Speaking Operational 0 0 0 0 Reading Operational 1 0 0 0 2 Writing Operational 0 0 0 0 0
aListening and speaking items are the same for K–1 and grade 2.
8.6.3 Operational Test Scaling Constants The Stocking-Lord scaling method (1983) was used to put the item-parameter estimates obtained during calibration onto the CELDT common scale. Appendix M contains the recalibrated unscaled item-parameter estimates for the 2017–18 Edition, calculated from the IA population data. Appendix U contains on-scale item parameter estimates previously calculated using the 2016–17 Edition unscaled item parameter estimates (appendix M) and scaling constants (table 8.8 from the CELDT 2016–17 Edition Technical Report). The multiplicative (m1) and additive (m2) constants were applied to the item-parameter estimates using the following formula:
That describes how appendix U was calculated. Ordinarily, these appendix U on-scale item parameters would have been used to support the creation of the CELDT raw score to scale score conversion tables for 2017–18 and future years. However, because the CELDT forms have been reused since 2015–16, and because it can be confusing for the scale score associated with a particular
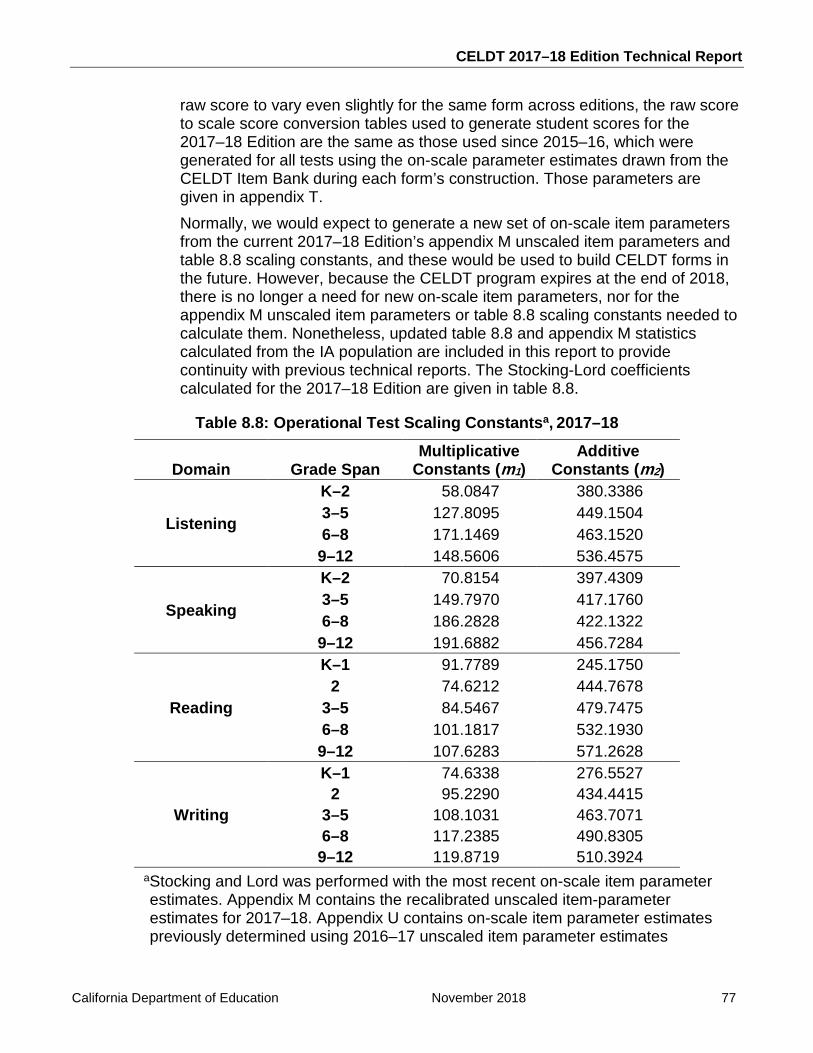
CELDT 2017–18 Edition Technical Report
California Department of Education November 2018 77
raw score to vary even slightly for the same form across editions, the raw score to scale score conversion tables used to generate student scores for the 2017–18 Edition are the same as those used since 2015–16, which were generated for all tests using the on-scale parameter estimates drawn from the CELDT Item Bank during each form’s construction. Those parameters are given in appendix T. Normally, we would expect to generate a new set of on-scale item parameters from the current 2017–18 Edition’s appendix M unscaled item parameters and table 8.8 scaling constants, and these would be used to build CELDT forms in the future. However, because the CELDT program expires at the end of 2018, there is no longer a need for new on-scale item parameters, nor for the appendix M unscaled item parameters or table 8.8 scaling constants needed to calculate them. Nonetheless, updated table 8.8 and appendix M statistics calculated from the IA population are included in this report to provide continuity with previous technical reports. The Stocking-Lord coefficients calculated for the 2017–18 Edition are given in table 8.8.
Table 8.8: Operational Test Scaling Constantsa, 2017–18
Domain Grade Span Multiplicative
Constants (m1) Additive
Constants (m2)
Listening
K–2 58.0847 380.3386 3–5 127.8095 449.1504 6–8 171.1469 463.1520 9–12 148.5606 536.4575
Speaking
K–2 70.8154 397.4309 3–5 149.7970 417.1760 6–8 186.2828 422.1322 9–12 191.6882 456.7284
Reading
K–1 91.7789 245.1750 2 74.6212 444.7678
3–5 84.5467 479.7475 6–8 101.1817 532.1930 9–12 107.6283 571.2628
Writing
K–1 74.6338 276.5527 2 95.2290 434.4415
3–5 108.1031 463.7071 6–8 117.2385 490.8305 9–12 119.8719 510.3924
aStocking and Lord was performed with the most recent on-scale item parameter estimates. Appendix M contains the recalibrated unscaled item-parameter estimates for 2017–18. Appendix U contains on-scale item parameter estimates previously determined using 2016–17 unscaled item parameter estimates
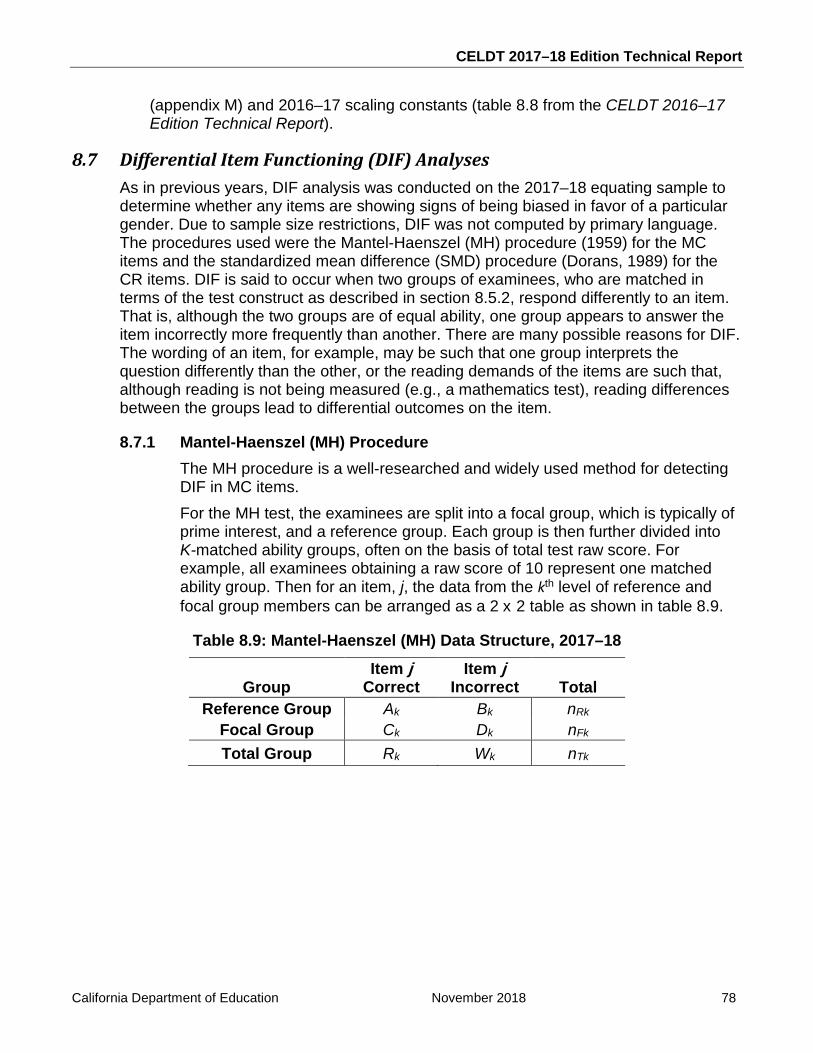
CELDT 2017–18 Edition Technical Report
California Department of Education November 2018 78
(appendix M) and 2016–17 scaling constants (table 8.8 from the CELDT 2016–17 Edition Technical Report).
8.7 Differential Item Functioning (DIF) Analyses As in previous years, DIF analysis was conducted on the 2017–18 equating sample to determine whether any items are showing signs of being biased in favor of a particular gender. Due to sample size restrictions, DIF was not computed by primary language. The procedures used were the Mantel-Haenszel (MH) procedure (1959) for the MC items and the standardized mean difference (SMD) procedure (Dorans, 1989) for the CR items. DIF is said to occur when two groups of examinees, who are matched in terms of the test construct as described in section 8.5.2, respond differently to an item. That is, although the two groups are of equal ability, one group appears to answer the item incorrectly more frequently than another. There are many possible reasons for DIF. The wording of an item, for example, may be such that one group interprets the question differently than the other, or the reading demands of the items are such that, although reading is not being measured (e.g., a mathematics test), reading differences between the groups lead to differential outcomes on the item.
8.7.1 Mantel-Haenszel (MH) Procedure The MH procedure is a well-researched and widely used method for detecting DIF in MC items. For the MH test, the examinees are split into a focal group, which is typically of prime interest, and a reference group. Each group is then further divided into K-matched ability groups, often on the basis of total test raw score. For example, all examinees obtaining a raw score of 10 represent one matched ability group. Then for an item, j, the data from the kth level of reference and focal group members can be arranged as a 2 x 2 table as shown in table 8.9.
Table 8.9: Mantel-Haenszel (MH) Data Structure, 2017–18
Group Item j
Correct Item j
Incorrect Total Reference Group Ak Bk nRk
Focal Group Ck Dk nFk Total Group Rk Wk nTk
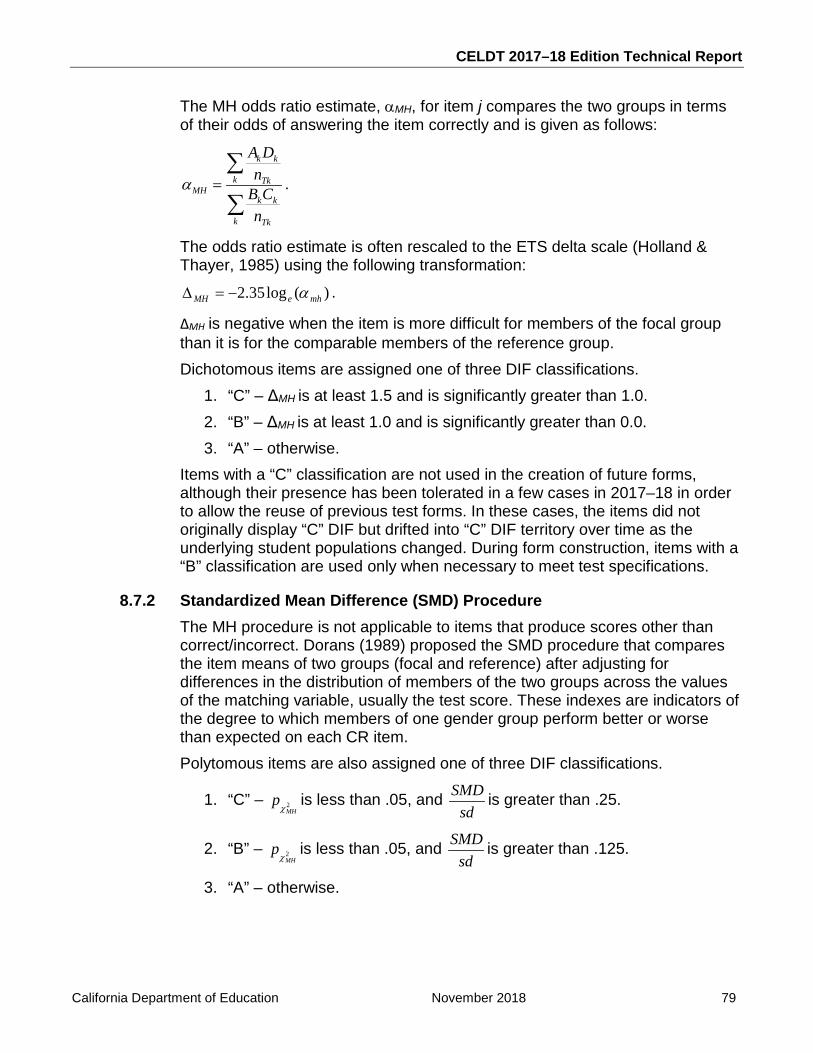
CELDT 2017–18 Edition Technical Report
California Department of Education November 2018 79
The MH odds ratio estimate, αMH, for item j compares the two groups in terms of their odds of answering the item correctly and is given as follows:
k k
k TkMH
k k
k Tk
A Dn
B Cn
α =∑
∑.
The odds ratio estimate is often rescaled to the ETS delta scale (Holland & Thayer, 1985) using the following transformation:
)(log35.2 mheMH α−=∆ .
ΔMH is negative when the item is more difficult for members of the focal group than it is for the comparable members of the reference group. Dichotomous items are assigned one of three DIF classifications.
1. “C” – ΔMH is at least 1.5 and is significantly greater than 1.0. 2. “B” – ΔMH is at least 1.0 and is significantly greater than 0.0. 3. “A” – otherwise.
Items with a “C” classification are not used in the creation of future forms, although their presence has been tolerated in a few cases in 2017–18 in order to allow the reuse of previous test forms. In these cases, the items did not originally display “C” DIF but drifted into “C” DIF territory over time as the underlying student populations changed. During form construction, items with a “B” classification are used only when necessary to meet test specifications.
8.7.2 Standardized Mean Difference (SMD) Procedure The MH procedure is not applicable to items that produce scores other than correct/incorrect. Dorans (1989) proposed the SMD procedure that compares the item means of two groups (focal and reference) after adjusting for differences in the distribution of members of the two groups across the values of the matching variable, usually the test score. These indexes are indicators of the degree to which members of one gender group perform better or worse than expected on each CR item. Polytomous items are also assigned one of three DIF classifications.
1. “C” – 2MH
pχ
is less than .05, and SMDsd
is greater than .25.
2. “B” – 2MH
pχ
is less than .05, and SMDsd
is greater than .125.
3. “A” – otherwise.
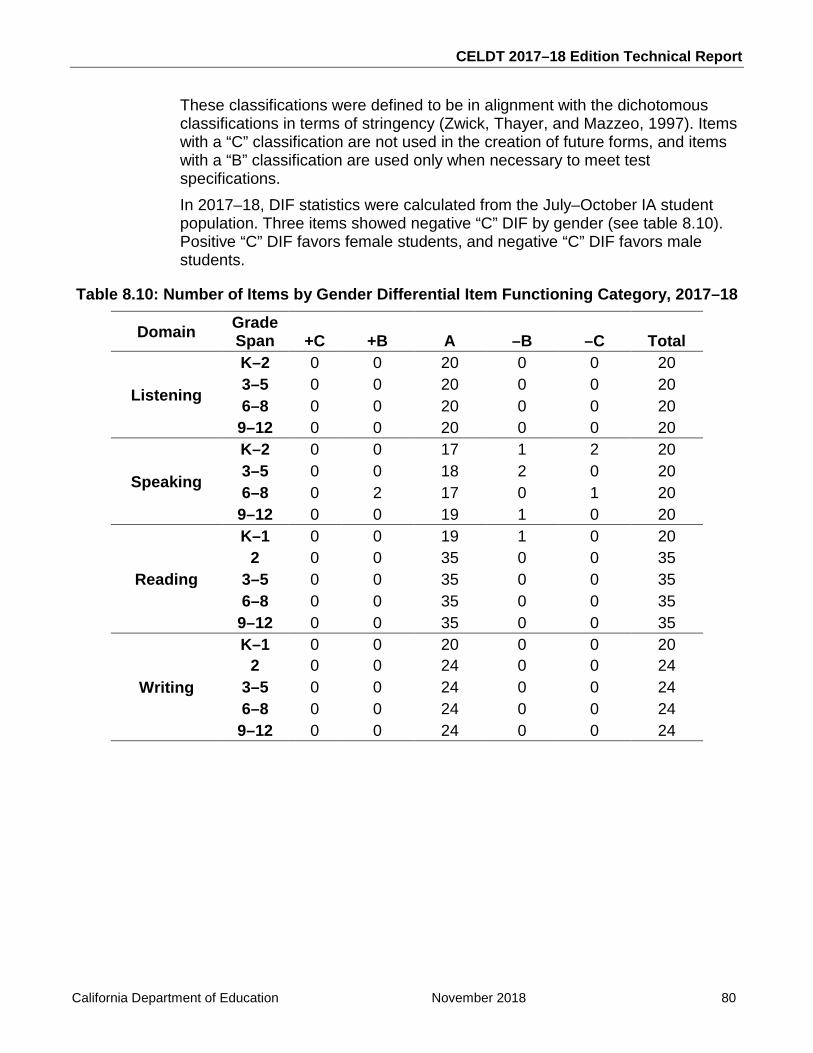
CELDT 2017–18 Edition Technical Report
California Department of Education November 2018 80
These classifications were defined to be in alignment with the dichotomous classifications in terms of stringency (Zwick, Thayer, and Mazzeo, 1997). Items with a “C” classification are not used in the creation of future forms, and items with a “B” classification are used only when necessary to meet test specifications. In 2017–18, DIF statistics were calculated from the July–October IA student population. Three items showed negative “C” DIF by gender (see table 8.10). Positive “C” DIF favors female students, and negative “C” DIF favors male students.
Table 8.10: Number of Items by Gender Differential Item Functioning Category, 2017–18
Domain Grade Span +C +B A –B –C Total
Listening
K–2 0 0 20 0 0 20 3–5 0 0 20 0 0 20 6–8 0 0 20 0 0 20
9–12 0 0 20 0 0 20
Speaking
K–2 0 0 17 1 2 20 3–5 0 0 18 2 0 20 6–8 0 2 17 0 1 20
9–12 0 0 19 1 0 20
Reading
K–1 0 0 19 1 0 20 2 0 0 35 0 0 35
3–5 0 0 35 0 0 35 6–8 0 0 35 0 0 35
9–12 0 0 35 0 0 35
Writing
K–1 0 0 20 0 0 20 2 0 0 24 0 0 24
3–5 0 0 24 0 0 24 6–8 0 0 24 0 0 24
9–12 0 0 24 0 0 24
CELDT 2017–18 Edition Technical Report
California Department of Education November 2018 81
Chapter 9: Quality Control Procedures
Quality control procedures are implemented by the contractor and subcontractors throughout all phases of item development, test assembly, printing, distribution, administration, scoring, and reporting. This chapter details the specific physical and electronic procedures that are implemented to ensure accurate processing for the California English Language Development Test (CELDT).
9.1 Quality Control of Test Materials
9.1.1 Preparation of Test Materials During the process of test development, the test materials—Test Books, Answer Books, Examiner’s Manuals, and support materials—go through many review steps by both the contractor and the California Department of Education (CDE) staff to ensure that assessment materials are accurate. When all approvals have been obtained, “print-ready” copies of the test materials are transmitted to printers via Secure File Transfer Protocol to ensure their accuracy as well as their security. Hardcopy proofs of the documents undergo a final, exhaustive review to ensure that they are accurate, complete, and properly sequenced.
9.1.2 Distribution of Test Materials A web-based ordering system located in the secure CELDT District Portal allows authorized local educational agency (LEA) personnel to enter the numbers of students to be tested by school and grade for the initial order and quantities of each material needed for additional orders. Based on this information, packing lists are generated. These lists display in detail the quantity of all the testing and support materials that the LEAs will need to administer the CELDT, including the required overage for the initial order. Before all the packing lists are printed, a few samples are checked to make sure that the quantities of the materials on the packing list are in accordance with approved 2017–18 overage formulas. Packers use the packing list to identify the exact package size and quantity of materials to be packed into boxes for each school and LEA. A second packer double-checks quantities and items before each box is labeled and sealed. A preprinted list of every LEA that placed an order is used to ensure that all the packing lists were generated and packed for shipment to LEAs. The LEA is required to inventory the materials upon receipt against each packing list and report to the CELDT Customer Support Center by the published deadline any shortages or overages to ensure that all materials arrived at the proper school and LEA. Each week, proof of delivery records are reconciled against shipment manifests. Any shipment or single box that does not appear to have been delivered is checked first through the United Parcel Service (UPS) tracking
CELDT 2017–18 Edition Technical Report
California Department of Education November 2018 82
website. Then, if sufficient information is not available, follow-up communication is sent to the LEA. Follow-up continues until the shipment is accounted for. If the problem is due to an issue with the carrier, the contractor reships test materials to the LEA while the carrier attempts to locate the materials. The CDE is informed of any missing materials, the circumstances surrounding the incident, and all communications made to reconcile and recover the missing materials.
9.1.3 Retrieval of Test Materials LEAs enter their requests for pickup of materials by the contractor for scoring through the online application within the secure CELDT District Portal, which then generates a log of materials to be received by the contractor. The contracted carrier arrives at the LEA office with the prepaid shipping labels and picks up the boxes or pallets for delivery to the contractor. Upon receipt, each shipment is checked in against the pickup log. All scorable and nonscorable requests for pickup are reconciled to ensure 100 percent accountability. The same reconciling process as detailed in section 9.1.2 is used for the retrieval of secure materials.
9.1.4 Processing of Test Materials A test materials tracking audit begins when test materials that have been received at the scoring center are matched to the shipping manifests. The CELDT program boxes are given unique LEA-identifying barcode labels, called Receiving Barcode (RBC) Labels, and box counts are reconciled against the number of boxes requested for pickup. The RBC box identifiers are used throughout processing to account for all received boxes and to make sure every box of scorable answer documents is processed through scanning. The following are additional steps to ensure accurate processing of the CELDT answer documents:
• The LEA name and a barcode identifier on each return address label placed on the boxes by the LEA is verified against the LEA name on the Group Identification Sheet (GIS)—the scannable header sheet. During a precheck step, the barcode from the return address label and the barcode on the RBC label are scanned. A Precheck Barcode (PBC) label that contains LEA and test materials identifying information is produced at this step and is attached to each box, which allows for tracking through the remainder of the scorable processing stations. Once all boxes for a shipment have been processed through precheck, a report is generated for those orders that are completely received.
• PBCs are scanned initially as the boxes move through the receiving and check-in process and again when the boxes are disassembled and the scorable contents are placed into scan boxes. All barcode numbers are reconciled prior to completing the check-in process to ensure that the entire order was processed.
CELDT 2017–18 Edition Technical Report
California Department of Education November 2018 83
• Scannable Answer Books are removed from the LEA’s shipping boxes or envelopes, checked against the GIS and School/Group List (SGL)—a listing of the schools and grades whose test materials are contained in the shipment—and placed into temporary holding scan crates and then assigned to permanent labeled scan boxes. All labeled scan boxes are accounted for by unique sequence numbers that are recorded in a database.
• After scanning, a final reconciliation of the number of scanned student records, the quantity bubbled on the scanned GIS, and the quantity written on the SGL is completed to ascertain that all documents assigned to a scan file are contained in the scan file.
9.2 Quality Control of Scanning Before scanning begins, a complete deck of controlled data, the “test deck,” is created and scanned. The test deck documents are created by bubbling the answer documents based on the test deck control file, which contains various combinations of demographic information and answer responses for all grades and all domains. The test deck also includes records from the Braille Version. To test that the scanners and programs are functioning correctly, the test deck scan file is compared to the test deck control file to ensure that the outputs match. Next, a complete check of the scanning system is performed. Intensity levels of all scanners are constantly monitored by running diagnostic sheets through each scanner before and during the scanning of each batch of answer documents. Scanners are recalibrated if discrepancies are found. Documents received in poor condition (e.g., torn, folded, or stained) that cannot be fed through the scanners are transferred to a new scannable document to ensure proper scoring of student responses. Editing and resolution procedures are followed to resolve demographic information issues on the answer documents (e.g., multiple marks, poor erasures, or incomplete data). Multiple iterations of error listings are prepared to verify correction of all errors and to correct any errors introduced during the editing process. Scanner operators perform ongoing maintenance checks, which are designed to ensure that the scanners read reliably. After two hours of scanning, operators clean and dust all open areas with continuous-stream compressed air and perform a quick check. If the quick check fails, the read heads are calibrated. Calibration occurs at a minimum of every four hours of scanning, and an Image Calibration Log is completed and checked by the lead operator. A software utility program notifies the scanner operator of a buildup of dust, erasure fragments, or other irregularities that affect the quality of the images. This utility notifies the scanner operators of an issue in time to prevent data errors. A user exit program checks whether the scanner read heads are registering values in coordinates that should be blank and alerts the operator that the read heads need cleaning. In addition, cleaning of the rollers, read-head de-skew tests, and barcode-reader tests are performed periodically.
CELDT 2017–18 Edition Technical Report
California Department of Education November 2018 84
A final check is made of the actual counts of student documents scanned compared to the expected counts from the GIS and SGL. Large discrepancies are investigated and resolved.
9.3 Quality Control of Image Editing The test deck is used to test all possible errors in the edit specifications. This set of test documents is used to verify that all images from the answer documents are saved correctly, including the following checks:
• Verifying the capture of images for constructed-response (CR) scoring by reviewing the test deck file and demonstrating that student response sections are captured completely and are readable on-screen (clear and dark enough) and when printed
• Verifying that the image-editing program correctly indexes scanned images to the correct student and that fields needing editing are completely captured as an image
• Verifying that the number of images in a given scan file (for the grades in the file) is accurate prior to loading the file into the image-editing program for scoring
9.4 Quality Control of Answer Document Processing and Scoring Before the processing and scoring system is used operationally, a complete test deck of controlled data is run through the scanning, routing, and merging programs, resulting in the production of complete student records and reports. The following quality checks are made immediately after scanning:
• The scanning process is checked to ensure that the scanner was properly calibrated.
• Data that can be captured from answer documents but was not bubbled properly into the scannable grids are edited and verified.
• The number of scanned student records, the quantity bubbled on the scanned GIS, and the quantity written on the SGL are compared to ascertain that all documents assigned to a scan file are contained in the scan file.
• The system is programmed to confirm that students are correctly coded as belonging to a valid school, LEA, and grade. Changes are made as necessary.
• All invalid or out-of-range lithocodes are reviewed and resolved. If editors find discrepancies between scan counts and counts from the GIS and SGL, they investigate these by going back to the scan boxes and counting the physical documents. They also review the GIS, SGL, and documents in the previous and subsequent group to be sure documents were not scanned out of order. All discrepant counts are verified and reconciled before the scan file is cleared for subsequent processing. CR items are routed to the electronic image-based scoring system for evaluation by trained scorers, and those results are returned electronically to the scoring system.
CELDT 2017–18 Edition Technical Report
California Department of Education November 2018 85
Multiple checks are in place to ensure that the images of the student’s CR and scored results are merged with the correct student record and that each student has a score or condition code for every CR item before final scoring and reporting. A final check is made before scoring to verify that student records include responses and scores for all components of the test. Steps are in place to process the Student Score File on two different software platforms. The student reports are printed only when the outputs from both processes match. This process continued during the monthly processing of data for the entire 2017–18 Edition.
9.5 Quality Control of Psychometric Processes
9.5.1 Score Key Verification Procedures Checks are made continuously throughout the item selection and test form assembly process to verify that the keys to be used to score the test are correct. Additionally, an empirical check is made as soon as enough data has been acquired from the LEAs to verify the accuracy of the key. Preliminary statistical analyses are conducted for each test in the CELDT (e.g., grades 3–5 reading, grades 6–8 writing) to confirm that the CELDT Item Bank characteristics remain stable for operational items. Item maps, which are assembled as the forms are created and which contain scoring information and statistical profiles of the items where available, are checked against the results of these analyses. This provides final confirmation that the keys applied to produce student scores are accurate and that no clerical errors have been made in the creation of the item maps.
9.5.2 Quality Control of the Statistical Analysis Process All psychometric analyses undergo comprehensive quality checks. Psychometricians independently check results to ensure that the proper steps were taken for all analyses and that the results are reasonable. That is, the analyses and results are reviewed by a person or persons not involved in conducting the analyses themselves. In addition, CDE psychometricians conduct independent analyses of the data sets to ensure the accuracy of the results. Chapter 2 discusses quality control of the analysis process in more detail.
9.5.3 Score Verification Process In addition to checking the accuracy of the key, psychometricians verify that the programming team has applied the key and the raw score to scale score conversion tables correctly. They do so by
• independently generating the raw and scale scores for the test deck and a sample of students prior to the release of test scores and reports;
• checking the accuracy of the scale scores converted from raw scores by hand scoring a sample of student records from each grade;
CELDT 2017–18 Edition Technical Report
California Department of Education November 2018 86
• parallel processing each student score record to detect unanticipated errors; and
• running the merged student records for the first several LEAs (also called pilot LEAs) through a third independent scoring process.
They also review the outcomes against the results of past administrations to test for reasonableness. At least with respect to student test data, large populations tend not to change dramatically from year to year. A significant shift in score levels or distributions would trigger the need for additional review to ensure that the shift is not a scoring anomaly.
9.5.4 Statistical Information for Test Development Test development staff use results of the statistical analyses for future item selection and test form development. Once the results of the analyses have been verified, the results are provided for import into the CELDT Item Bank system. The CELDT Item Bank maintains historical statistical profiles for items as they reappear in the test; these are reviewed to ensure that items have not become unstable over time and, therefore, are unusable. The CELDT Item Bank contains historical statistics based only on data from students with an annual assessment (AA) test purpose. Because the 2017–18 Edition was administered only to students with an initial assessment (IA) test purpose, the statistical information was not loaded into the CELDT Item Bank.
9.6 Quality Control of Data Aggregation and Reporting A simulated set of data, which is generated from the processing of the test deck, initially tests the accuracy of the reporting and aggregation programs prior to operational use. Next, a set of pilot reports (several of the earliest LEAs’ test materials to arrive for processing that cover all grades and include an independent charter school) is reviewed to check the format of the reports (e.g., labels, correct placement of data on the page, and all formatting) and the accuracy of the score aggregations. Finally, the calculations are verified by hand and electronically (in a different software environment than was used to create these files) and checked for consistency across all reports. Only when this process is complete and the pilot reports are approved does production of the reports begin.
CELDT 2017–18 Edition Technical Report
California Department of Education November 2018 87
Chapter 10: Historical Comparisons
Previous California English Language Development Test technical reports included a set of tables in chapter 10 that provided historical comparisons of data. Most of the data tables were based only on students with a test purpose of annual assessment. Because the 2017–18 Edition population consists of only initial assessment (IA) students and the two populations are not necessarily comparable, chapter 10 tables were not included in this report. One exception is the IA scale score summary statistics, which were previously reported in table 10.2 and appendix E. This data remains a part of appendix E in this report.

THIS PAGE HAS
BEEN INTENTIONALLY
LEFT BLANK.
CELDT 2017–18 Edition Technical Report
California Department of Education November 2018 89
References
American Educational Research Association, American Psychological Association, & National Council on Measurement in Education (1999). Standards for educational and psychological testing. Washington, D.C.: American Psychological Association.
Cronbach, L. J. (1951). Coefficient alpha and the internal structure of tests. Psychometrika, 16, 297–334.
Dorans, N. J. (1989). Two new approaches to assessing differential item functioning: Standardization and the Mantel-Haenszel method. Applied Measurement in Education, 2, 217–233.
Educational Data Systems (2017). Technical Report Replication Study, Version 4. Prepared for the California Department of Education.
Feldt, L. S. & Brennan, R. L. (1989). Reliability. In R. L. Linn (Ed.), Educational measurement (3rd edition) (pp. 105–146). New York: Macmillan.
Fleiss, J. L. & Cohen, J. (1973). The equivalence of weighted kappa and the intraclass correlation coefficient as measures of reliability. Educational and Psychological Measurement, 33, 613–619.
Glaser, R. (1963). Instructional technology and the measurement of learning outcomes: Some questions. American Psychologist, 18, 519–521.
Holland, P. W. & Thayer, D. T. (1985). An alternate definition of the ETS delta scale of item difficulty. Washington, DC: ERIC Clearing House, Document 268148.
Livingston, S. A. & Lewis, C. (1995). Estimating the consistency and accuracy of classifications based on test scores. Journal of Educational Measurement, 32, 179–197.
Lord, F. M. (1980). Applications of item response theory to practical testing problems (pp. 71, 179–181). Hillsdale, NJ: Lawrence Erlbaum.
Lord, F. M. & Novick, M. R. (1968). Statistical theories of mental test scores. Reading, MA: Addison-Wesley.
Mantel, N. & Haenszel, W. (1959). Statistical aspects of the analysis of data from retrospective studies of disease. Journal of the National Cancer Institute, 22, 719–748.
Muraki, E. (1992). A generalized partial credit model: Application of an EM algorithm. Applied Psychological Measurement, 16, 159–176.
Rudner, L. (2001). Computing the expected proportions of misclassified examinees. Practical Assessment, Research & Evaluation, 7(14).
Sato, E., Lagunoff, R., Worth, P., Bailey A. L., & Butler, F. A. (2005). ELD standards linkage and test alignment under Title III: A pilot study of the CELDT and the California ELD and content standards. Final report (June) to the California Department of Education, Sacramento, CA.
CELDT 2017–18 Edition Technical Report
California Department of Education November 2018 90
Stocking, M. L. & Lord, F. M. (1983). Developing a common metric in item response theory. Applied Psychological Measurement, 7, 201–210.
Zwick, R., Thayer, D. T., & Mazzeo, J. (1997). Describing and categorizing DIF in polytomous items. Princeton, NJ: Educational Testing Service, Research Report 97-05.