CALIFORNIA ENERGY COMMISSION ACHIEVING COST …scap1.org/Air Reference Library/CEC-AB2021 Report...
35
CALIFORNIA ENERGY COMMISSION ACHIEVING COST-EFFECTIVE ENERGY EFFICIENCY FOR CALIFORNIA: AN AB 2021 PROGRESS REPORT STAFF REPORT December 2008 CEC-200-2008-007 Arnold Schwarzenegger, Governor
Transcript of CALIFORNIA ENERGY COMMISSION ACHIEVING COST …scap1.org/Air Reference Library/CEC-AB2021 Report...
CALIFORNIA ENERGY COMMISSION
ACHIEVING COST-EFFECTIVE ENERGY EFFICIENCY FOR CALIFORNIA: AN
AB 2021 PROGRESS REPORT
STA
FF R
EPO
RT
December 2008 CEC-200-2008-007
Arnold Schwarzenegger, Governor


CALIFORNIA ENERGY COMMISSION Kae Lewis Irene Salazar Principal Authors Kae Lewis Project Manager Bill Junker Manager DEMAND ANALYSIS OFFICE Sylvia Bender Deputy Director ELECTRICITY SUPPLY ANALYSIS DIVISION Melissa Jones Executive Director
DISCLAIMER
This report was prepared by California Energy Commission staff persons. It does not necessarily represent the views of the Energy Commission, its employees, or the State of California. The Energy Commission, the State of California, its employees, contractors and subcontractors make no warrant, express or implied, and assume no legal liability for the information in this report; nor does any party represent that the uses of this information will not infringe upon privately owned rights. This report has not been approved or disapproved by the California Energy Commission nor has the California Energy Commission passed upon the accuracy or adequacy of the information in this report.

Please use the following citation for this report:
Kae Lewis and Irene Salazar, Achieving Cost-effective Energy Efficiency for California: An AB 2021 Progress Report, California Energy Commission, Electricity Supply Analysis Division, CEC-200-20078-007.

Table of Contents
Page
Executive Summary ............................................................................................................................... 1 Recommendations for POUs ............................................................................................................ 2
Introduction ............................................................................................................................................ 4 IOU Energy Efficiency Program Accomplishments in 2007 ............................................................ 6 IOU Efficiency Goals for 2009 and Beyond ........................................................................................ 7 IOU Energy Efficiency Potential Study Update ............................................................................ 8 CPUC Strategic Plan for Energy Efficiency .................................................................................... 9 IOU Goals for 2009‐2011 ................................................................................................................... 9
POU Energy Efficiency Program Accomplishments ....................................................................... 11 POU Energy Efficiency Expenditures: Reported and Projected ............................................... 12
POUs Electric Energy and Peak Savings .......................................................................................... 14 POU Progress in Tracking and Verification Methodology ........................................................ 17 Demand Response and Operational Efficiencies ......................................................................... 18 Investment Treatment ..................................................................................................................... 18
Staff Assessment of POU Progress in 2007 ....................................................................................... 18 Recommendations Regarding POU Energy Efficiency .................................................................. 22
Appendix A ............................................................................................................................................... 24
List of Figures
Page
Figure 1: POUs’ Reported and Projected Energy Efficiency Expenditures for 2006‐2008 ............. 13 Figure 2: POUs’ Energy Efficiency Spending as Percentage of Revenue ......................................... 14 Figure 3: POUs’ Reported and Projected Electric Energy Savings Relative to AB 2021 Adopted Targets (MWh) .......................................................................................................................................... 15 Figure 4: POUs’ Reported and Projected Annual Peak Savings Relative to AB 2021 Adopted Targets (MW) ............................................................................................................................................ 16
List of Tables
Page
Table 1: IOU Efficiency Savings (2006 – June 2008) ............................................................................... 7 Table 2: IOU Potential Gross Savings Versus Previous Goals ........................................................... 10 Table 3: POU Reported 2007 Energy Savings Compared to Goals and Performance Range ........ 20 Table A‐1: POU Reported and Projected Expenditures ...................................................................... 24 Table A‐2: Smaller POUs Energy Efficiency Reported Savings Versus Targets (MWh) ............... 25
i

ii

Abstract
As required by Assembly Bill 2021 (Levine, Chapter 734, Statutes of 2006), this report documents the progress that California’s utilities are making in fulfilling legislative directions to invest in all cost‐effective energy efficiency.
The report covers 2006 and 2007 during which both the investor‐owned utilities and publicly owned utilities were expanding their energy efficiency programs. The data used in this report was compiled from annual reports filed by investor‐owned utilities with the California Public Utilities Commission (CPUC) and by publicly owned utilities as compiled by the California Municipal Utilities Association with the Energy Commission.
During the CPUC’s 2006‐2008 efficiency cycle, the investor‐owned utilities have succeeded in meeting their goals as outlined in the CPUC’s Decision 04‐09‐060 and in the Energy Commission’s Assembly Bill 2021 Report. In 2007, the investor‐owned utilities achieved 170 percent of their electric energy savings goal and 140 percent of their natural gas savings goal. In the first six months of this year, the investor‐owned utilities achieved 82 percent of their total 2008 electric energy savings goal and 61 percent of their natural gas goal.
Efficiency savings recorded by publicly owned utilities increased substantially from 2006 to 2007. The aggregate electricity consumption savings reported by publicly owned utilities reached 75 percent of AB 2021 adopted goals in 2007. Publicly owned utilities demonstrated their commitment to efficiency savings over the last year by expanding both efficiency staffing and customer programs. The 2008 targets are so much higher that there is a concern that they will not be able to ramp up fast enough to meet the ambitious goals for 2008‐2011. The report recommends that the publicly owned utilities augment the information supplied to the Energy Commission in March 2009 so that the challenges they face and their ability to meet adopted goals in the near future can be thoroughly documented.
Keywords: Energy efficiency, energy savings, demand reduction, electricity consumption, electric‐peak demand reduction, energy efficiency potential estimates, energy efficiency targets, energy efficiency goals, Assembly Bill 2021, Senate Bill 1037, investor‐owned utilities, publicly owned utilities.
iii

iv

Executive Summary
In Assembly Bill 2021 (Levine, Chapter 734, Statutes of 2006), the Legislature set a goal of reducing total forecasted consumption by 10 percent over the next 10 years. This goal has been reinforced in Assembly Bill 32 (Nứñez, Chapter 488 , Statutes of 2006) and the California Air Resources Board scoping plan by the central role that energy efficiency is being counted on to reduce global warming
In the interest of promoting increased energy efficiency in all California utilities, AB 2021:
• Requires the California Energy Commission to develop statewide energy efficiency potential estimates and goals for California’s private and public utilities.
• Requires that the publicly owned utilities identify all potentially achievable cost‐effective electricity energy savings and establish annual goals for energy efficiency savings and demand reduction for the next 10‐year period.
• Requires the Energy Commission to report utility progress in implementing AB 2021 as part of its biennial Integrated Energy Policy Report process.
The statewide and utility‐specific goals requirement was fulfilled in December 2007 when 10‐year goals were adopted. The Energy Commission adopted a statewide goal equivalent to all cost‐effective potential for energy savings. The goals submitted by the publicly owned utilities and the annual goals the California Public Utilities Commission (CPUC) set for the investor‐owned utilities in Decision 04‐09‐060 comprise the bulk of the overall statewide energy goal set for 2007‐2016. The individual goals of the investor‐owned utilities and publicly owned utilities together summed to less than the magnitude of all cost‐effective efficiency potential in California. The remaining portion of the statewide goal was to be made up with energy‐saving activities requiring coordination between the utilities and local governments and other entities. This remaining portion of the goal is not addressed in this report because it is too early to identify and measure these additional activities and it is not yet known to what extent the 2008 energy efficiency potential study modifies the amount of future economic potential and the level of savings in additional activities that exceed investor‐owned utilities and publicly owned utilities goals. These issues will be addressed in The 2009 Integrated Energy Policy Report. This 2008 staff report presents the status of recent investor owned utilities and publicly owned utilities’ energy efficiency progress toward fulfilling these energy efficiency goals.
During the CPUC’s 2006‐2008 efficiency cycle, the investor‐owned utilities have been successful in meeting their goals as outlined in the CPUC’s D. 04‐09‐060 and in the Energy Commission’s AB 2021 Report. Although success in the first year (2006) was less than their targets, in 2007 investor‐owned utilities achieved 170 percent of their electric energy savings goal, 133 percent of their peak savings goal, and 140 percent of their natural gas savings goal. In the first six months of this year, the investor owned utilities achieved 82 percent of their total 2008 electric energy savings goal, 68 percent of their peak savings goal, and 61 percent of their natural gas goal. If they continue at the same pace, it seems probable that their 2008 total annual goals will be met.
1
Efficiency savings reported by publicly owned utilities increased substantially from 2006 to 2007 but did not reach the 2007 targets. The aggregate electricity consumption savings reported by publicly owned utilities reached 75 percent of their AB 202‐ adopted goals in 2007, while electricity peak savings reached 62 percent.
Energy Commission staff sees significant evidence that the publicly owned utilities community is on the right long‐term track. Publicly owned utilities appear to have demonstrated their commitment to efficiency savings over 2006 to 2007 by expanding both efficiency staffing and customer programs. The Energy Commission staff is concerned, however, about the ability of the publicly owned utilities to meet adopted goals for 2008‐2011. To meet the 2008 goals would require the publicly owned utilities to increase funding and program accomplishments.
Recommendations for Publicly Owned Utilities • Energy Commission staff should work with the publicly owned utilities in achieving
their efficiency goals through workshops and collaborative efforts that improve overall evaluation planning, develop program tracking systems, and improve savings reporting requirements for the next AB 2021 cycle.
• Energy Commission staff and publicly owned utilities should work together to understand the processes used by individual utilities to estimate their remaining economic potential and set targets.
• Before the March 2009 progress report, staff and the utilities should reach a common understanding of the Legislature’s direction on the role of energy efficiency in the utilities’ resource acquisition and develop information for the 2009 report that better explains this to customers, the Energy Commission, and the Legislature.
• The publicly owned utilities’ March 2009 report should contain:
○ An explanation of the rationale and data relied on for any publicly owned utility’s proposed modification of its adopted goals.
○ An explanation of how energy efficiency annual goals were set, comparing the cost‐effectiveness of energy efficiency to other resources.
○ Information on the cause of any yearly fluctuations in efficiency performance.
○ A table that documents historic and forecast total Public Goods Charge funding, the amount dedicated to energy efficiency, and the amounts used for other programs.
A discussion of the success utilities have had in ramping up their programs so steeply, the types of programs being added, and the program delivery mechanisms that the utilities are employing to make economically cost‐effective energy efficiency feasible to deliver.
A discussion of their progress in implementing their evaluation, measurement, and verification methods and the findings.
2
• In 2009 the publicly owned utilities and staff should develop new goals that AB 2021 mandates be revisited every three years. New goals are due to the Energy Commission no later than June 1, 2010. To facilitate this work, the publicly owned utilities should monitor the ongoing investor‐owned utilities’ activities regarding the revision of efficiency potential estimates and goals.
• The new paradigm of achieving all cost‐effective energy efficiency through multiple providers requires coordination among investor owned utilities, publicly owned utilities, and local governments. The POUs should suggest ways in which this collaboration can be facilitated.
3

Introduction As required by Assembly Bill 2021 (Levine, Chapter 734, Statutes of 2006), this report documents the progress that California’s utilities are making in fulfilling legislative direction to invest in cost‐effective energy efficiency, both for its cost savings to consumers and environmental benefits. Both investor‐owned utilities (IOUs) and publicly owned utilities (POUs) sponsor energy efficiency programs that, together with building and appliance standards, substantially reduce California’s annual electric and natural gas consumption. Of the 2007 utility efficiency programs, those of the IOUs accounted for over 90 percent of all utility energy savings.1 IOUs provide about 67 percent of the retail electricity consumed in California, while the POUs provide about 25 percent, and direct access providers supply the rest.
While California has a 20‐year history of investing in cost‐effective energy efficiency, the prominence of energy efficiency as a future resource was expanded in 2003 by the energy agencies’ first Energy Action Plan. Senate Bill 1037 (Kehoe, Chapter 366, Statutes of 2005) made this policy into law by requiring electric utilities to meet their resource needs first with energy efficiency. SB 1037 requires the California Public Utilities Commission (CPUC), along with the California Energy Commission (Energy Commission), to identify all potentially achievable cost‐effective electric and natural gas energy efficiency savings for the IOUsʹ set targets for achieving this potential, review the energy procurement plans of IOUs, and consider cost‐effective supply alternatives such as energy efficiency. In addition to these IOU requirements, SB 1037 requires that all POUs, regardless of size, report investments in energy efficiency programs annually to their customers and to the Energy Commission.
The importance of energy efficiency in California’s future was further underscored by climate change legislation Assembly Bill 32 (Nứñez, Chapter 488, Statutes of 2006) which requires greenhouse gas emissions to be reduced to 1990 levels by 2020. Customer‐side energy efficiency is one of the primary approaches to contribute to this goal in the electricity and natural gas sectors.
More specific legal directions were added in 2006 by AB 2021, which explained the reasons for focusing on energy efficiency programs as:
SECTION 1. (a) In order to ensure that prudent investments in energy efficiency continue to be made that produce cost‐effective energy savings, reduce customer demand, reduce overall system costs, increase reliability, and increase public health and environmental benefits, it is the intent of the Legislature that all load‐serving entities procure all cost‐effective, energy efficiency measures so that the state can meet the goal of reducing total forecasted electrical consumption by 10 percent over
1 California Energy Commission, California Energy Demand 2008‐2018 Staff Forecast, CEC‐200‐0007‐015‐SF2, November 2007.
4

the next 10 years. (b) Expanding California’s energy efficiency programs will promote lower energy bills, protect public health, improve environmental quality, stimulate sustainable economic development, create new employment opportunities, and reduce reliance on imported fuels. (c) Expanding California’s energy efficiency programs will ameliorate air quality problems throughout the state and will also reduce harmful greenhouse gas emissions. (d) The energy savings achieved through the enactment of this act are an essential component of the state’s plan to meet the Governor’s greenhouse gas reduction targets established in Executive Order S‐3‐05.
AB 2021 directed the POUs to “first acquire all available energy efficiency and demand reduction resources that are cost effective, reliable, and feasible.” Additionally, the legislation requires each POU to:
• Every three years, starting June 2007, identify all potentially achievable cost‐effective electricity energy savings, establish annual targets for energy efficiency savings and demand reduction for the next 10‐year period, and report these targets to the Energy Commission.
• Report annually to its customers and the Energy Commission its investment in energy efficiency programs, description of programs, expenditures, cost‐effectiveness, and expected and actual energy savings results; and sources of funding for investments.
• Report methodologies and input assumptions used to determine cost‐effectiveness.
• Report the results of independent evaluation, measurement, and verification of the energy efficiency savings.
• Treat investments made to achieve energy efficiency savings and demand reduction targets as procurement investments.
AB 2021 also directs the Energy Commission to:
• Provide a statewide estimate of energy efficiency and demand reduction potential and targets for a 10‐year period. The Energy Commission is directed to produce this estimate in consultation with the CPUC as the regulator of IOU energy efficiency programs.
• Include the POU information noted above, as well as a comparison of each utility’s energy efficiency targets and actual results for each POU, in the Integrated Energy Policy Report (IEPR).
• Provide recommendations to the POUs, Legislature, and Governor if the Energy Commission determines that improvements could be made in the level of aggregate achievement by POUs or in the level of achievement by any POU.
The first requirement was met in December 2007 when the energy agencies, together with the utilities, developed statewide targets and utility‐specific targets. 2 The Energy
2 California Energy Commission, Achieving All Cost‐Effective Energy Efficiency for California, Final Staff Report, CEC‐200‐2007‐019‐SF, December 2007.
5
Commission adopted an overall statewide goal equivalent to all cost effective efficiency economic potential. This overall goal will be achieved by utility programs and by new initiatives pursued by other entities, such as local governments, in cooperation with the utilities.
The requirement that information and recommendations be provided in the IEPR is addressed by this progress report. The report covers the IOU and POU activities that meet the objectives of AB 2021. In the IOU arena, energy efficiency potential estimates have recently been updated and goals have been revised for the next energy efficiency cycle (2009‐2011) and beyond. In the POU arena, utilities reported on activities to meet their fiscal year 2006/2007 or calendar year 2007 energy efficiency program goals in their Energy Efficiency in California’s Public Power Sector: A Status Report3.(March 2008 Report). After summarizing and assessing the POU material, this report concludes with recommendations for the POUs.
IOU Energy Efficiency Program Accomplishments in 2007 The goals that governed 2007 performance were adopted by the CPUC in D.04‐09‐060 (2004) and used in the two most recent IOU efficiency program cycles, 2004‐2005 and 2006‐2008. For the 2006‐2008 program cycle the CPUC allocated nearly $2 billion for efficiency programs for three years, roughly 85 percent for electricity and the reminder for natural gas efficiency. According to the CPUC4, the IOUs are achieving success with their 2006‐2008 efficiency programs (Table 1). In the 2006 start‐up year, the combined IOUs achieved 85 percent of electric energy savings goal, 68 percent of their peak savings goal, and 80 percent of natural gas savings. During 2006, the IOUs spent $316 million, or 16 percent, of the funding allocated by the CPUC for the three‐year cycle.
In 2007 as the programs became fully operational, the IOUs achieved 3,872 gigawatt‐hours (GWh) or 170 percent of their annual CPUC goal of 2,275 giga‐watt hours (GWh) of electric energy savings, 638 megawatts (MW) or 133 percent of their goal of 478 MW in peak savings, and 52 millions of therms (MMth) or 132 percent of their goal of 37 MMth in natural gas savings. In 2007, the IOUs spent $670 million, or 34 percent, of the program cycle’s funding.
In the first six months of this year, the IOUs achieved 82 percent of their total 2008 electric energy savings goal, 68 percent of their peak savings goal, and 61 percent of
3 California Municipal Utilities Association. Energy Efficiency in California’s Public Power Sector. A Status Report, March 2008
4 CPUC, Energy Efficiency Groupware Application Database (EEGA), August 2008; these savings estimates are ex ante meaning that they have been reported by the IOUs but not yet subject to verification. EEGA also provides the monthly expenditures for the efficiency portfolios for each IOU.
6

their natural gas goal. It is likely that the IOUs will be able to meet all annual goals of the 2006‐2008 portfolios as outlined in the CPUC’s D. 04‐09‐060 and in the Energy Commission’s 2007 AB 2021 Report. As of August, 2008, the IOUs have spent $487 million of the remaining cycle funding. Success in achieving ex ante savings raises concerns by the IOUs that funding may fall short as 2006‐2008 programs are extended into the 2009‐2011 program cycle. In anticipation of delayed approvals of the 2009‐2011 efficiency portfolios by the CPUC, the IOUs filed requests in July for “bridge funding” to continue selected existing programs past January 2009.5
Table 1: IOU Efficiency Savings (2006 – June 2008)
CPUC
Mandated Goal
Savings Percentageof Goal
2006 Energy (GWh) 2,032 1,718 85%
Peak (MW) 442 300 68% Natural Gas (MMth) 30 24 80%
2007 Energy (GWh) 2,275 3,872 170%
Peak (MW) 478 638 133% Natural Gas (MMth) 37 52 141%
2008 Energy (GWh) 2,505 2,059 82%
Peak (MW) 528 359 68% Natural Gas (MMth) 44 27 61%
Source: CPUC Energy Division staff and Energy Efficiency Groupware Application Database, August 2008
IOU Efficiency Goals for 2009 and Beyond California’s IOU energy efficiency goals are aggressive to provide least‐cost solutions for the energy and environmental needs of future years. But they must also be realistic, adjusted not to double‐count efficiency achieved in past years and based on the feasible energy‐saving opportunities that remain. Since 2006, the CPUC has been working on three projects whose results contribute to the development of new short‐ and long‐term goals. First, the CPUC commissioned an updated version of the study of energy efficiency potential to guide the development of goals and program designs for the next planning cycle (2009‐2011) and 5 Bridge funding requests are associated with program 2009‐2011 applications from the IOUs to the CPUC, which are numbered A.08‐07‐021 (Southern California Edison), A.08‐07‐021 (Sothern California Gas Company), A.08‐07‐23 (San Diego Gas & Electric Company), and A.08‐07‐31 (Pacific Gas and Electric Company).
7

future cycles beginning in 2012. Second, they coordinated with the IOUs to develop a strategic plan to guide the development of long‐term goals through innovative program designs that addressed untapped efficiency opportunities. Third, the CPUC reached a decision on short‐term (2009‐2011) and long‐term (2012‐beyond) goals that incorporates the findings of the updated potential study and the strategic plan.
IOU Energy Efficiency Potential Study Update In March 2008, the CPUC’s consultant, Itron, Inc., completed its Itron 2008 Goals Update Study6. This analysis revised the efficiency potential assessments completed in 2002, 2003, and 2006. The study was to determine where potential savings remain and which technologies offer the most future energy savings. The CPUC uses this information as a basis for its efficiency goal‐setting for the IOUs. The study determined technical potential, economic potential, and levels of market potential associated with different magnitudes of program incentives. “Technical potential” refers to the savings potential that would be captured if all energy efficiency measures were installed in all applicable and feasible applications. “Economic potential” indicates the savings potential that would be achieved if measures were installed in all applicable, feasible, and cost‐effective applications. “Market potential” is a subset of these levels and recognizes the utilities’ need to overcome customer barriers to efficiency with financial incentives. CPUC goals for the IOUs have historically been based on market potential. The potential savings were analyzed in both “gross” and “net” terms; the latter excludes any naturally occurring savings that may be associated with IOU efficiency programs but do not result directly from them.
This latest potential study provides projections of potential for the near future (2007‐ 2016) and a longer time horizon (2017‐2026). It considers updated technical inputs, most notably recent consumer appliance and equipment saturation and additional revisions in state building and federal appliance standards. It excluded all savings that have occurred or were “committed” to occur by way of current IOU programs through 2006. The notable success of both government standards and recent IOU efficiency portfolios (as described above) greatly reduced the estimates of future efficiency potential compared to earlier estimates. This key study result is reflected in the CPUC’s 2008 recommendations on future energy efficiency goals for IOU programs in the next 2009‐2011 program cycle and beyond.
6 Itron, Inc. California Energy Efficiency Potential Study (May 12, 2008) and Assistance in Updating the Energy Efficiency Savings Goals for 2012 and Beyond: Scenario Analysis to Support Updates to the CPUC Savings Goals (March 24, 2008). These reports are known as the “Itron 2008 Goals Update Study”.
8
CPUC Strategic Plan for Energy Efficiency In October 2007, the CPUC issued D.07‐10‐0327, which began an unprecedented strategic planning process that involved the IOUs and many market players and resulted in a statewide efficiency strategic plan.8 The CPUC wanted a strategic plan focused on program planning with a longer‐term vision to capture a greater magnitude of energy savings. Under the CPUC strategic plan utilities would take a comprehensive and forward‐looking approach to program development and implementation. They would integrate their programs with those of state and local agencies, especially codes and standards; achieve program economies of scale; and promote efficiency measures that have long‐lived savings and require few incentives. This approach is designed to generate the future savings envisioned by AB 2021 and AB 32.9
IOU Goals for 2009-2011 Using the Itron 2008 Goals Update Study and its strategic plan, the CPUC developed a recommendation on long‐term energy efficiency goals that offers a new paradigm in savings objectives for the IOUs.10 The CPUC adopted a “hybrid‐goal structure” that promotes a comprehensive and forward‐looking approach to statewide savings activities that is consistent with the goals adopted in the California Air Resources Board draft Climate Change Scoping Plan.
The CPUC’s decision replaced the previous IOU goals with a “hybrid goal structure” consisting of total market gross goals and utility‐specific goals for each IOU service area for 2012 to 2020. This decision sets interim total market gross goals to be used for AB 32 and resource procurement planning, but postpones setting utility‐specific goals until 2010 after the evaluations for 2006‐2008 programs are completed.
The CPUC decision modifies the existing goals set in 2004 for use in the 2009‐2011 program cycles by redefining the goals from net to gross savings.11 The CPUC and IOUs believe this savings choice is more realistic because they reflect the latest information on energy efficiency potential in the Itron 2008 Goals Update Study. Because the previous 2004‐2013
7 CPUC, Decision 07‐10‐032, Interim Opinion on Issues Relating to Future Savings Goals and Program Planning for 2009‐2011 Energy Efficiency and Beyond, October 18, 2007.
8 CPUC, California Long Term Energy Efficiency Strategic Plan, July 2008.
9 California Air Resources Board, Climate Change Draft Scoping Plan, June 2008 Discussion Draft, June 2008.
10 CPUC, D. 08‐07‐047, Decision Adopting Interim Energy Efficiency Savings Goals for 2012 through 2020, and Defining Energy Efficiency Savings Goals for 2009 through 2011, July 31, 2008.
11 Ibid., pp. 28‐32. Gross savings include naturally occurring and additional savings that may be related to a particular program but not its direct result. This broader definition will permit the IOUs to meet their goals using gross savings, that is, greater savings per efficiency measure.
9
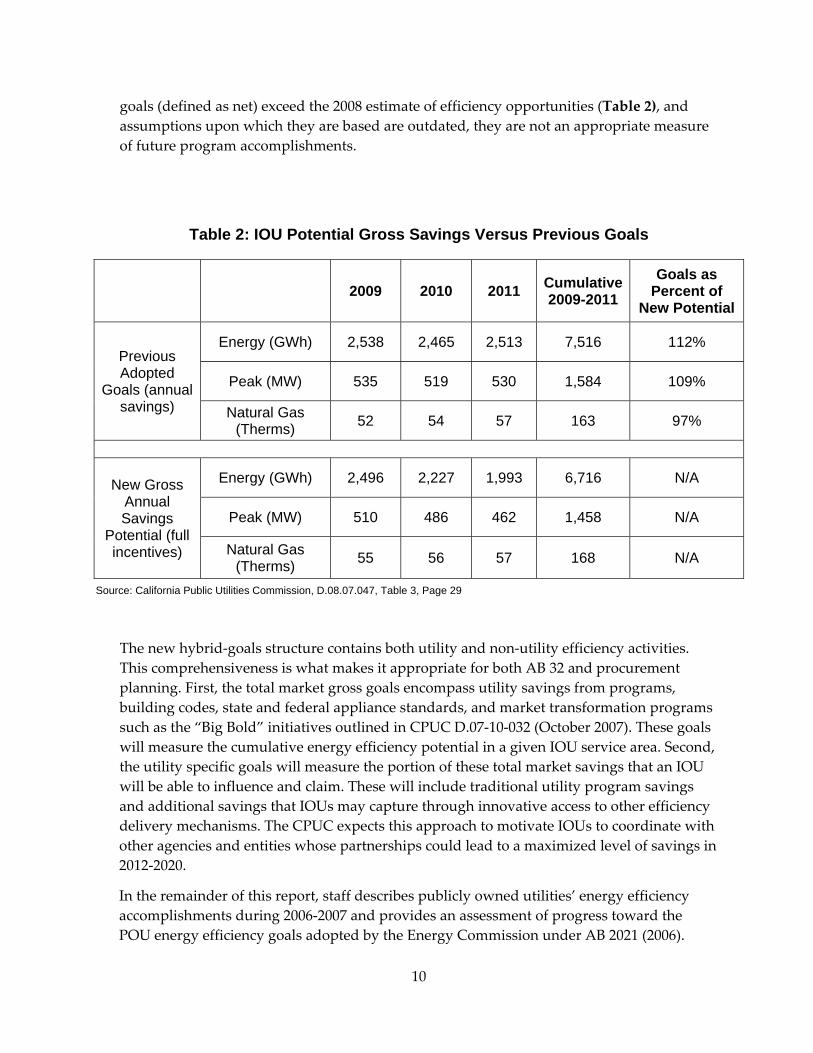
goals (defined as net) exceed the 2008 estimate of efficiency opportunities (Table 2), and assumptions upon which they are based are outdated, they are not an appropriate measure of future program accomplishments.
Table 2: IOU Potential Gross Savings Versus Previous Goals
2009 2010 2011 Cumulative 2009-2011
Goals as Percent of
New Potential
Previous Adopted
Goals (annual savings)
Energy (GWh) 2,538 2,465 2,513 7,516 112%
Peak (MW) 535 519 530 1,584 109%
Natural Gas (Therms) 52 54 57 163 97%
New Gross Annual Savings
Potential (full incentives)
Energy (GWh) 2,496 2,227 1,993 6,716 N/A
Peak (MW) 510 486 462 1,458 N/A
Natural Gas (Therms) 55 56 57 168 N/A
Source: California Public Utilities Commission, D.08.07.047, Table 3, Page 29
The new hybrid‐goals structure contains both utility and non‐utility efficiency activities. This comprehensiveness is what makes it appropriate for both AB 32 and procurement planning. First, the total market gross goals encompass utility savings from programs, building codes, state and federal appliance standards, and market transformation programs such as the “Big Bold” initiatives outlined in CPUC D.07‐10‐032 (October 2007). These goals will measure the cumulative energy efficiency potential in a given IOU service area. Second, the utility specific goals will measure the portion of these total market savings that an IOU will be able to influence and claim. These will include traditional utility program savings and additional savings that IOUs may capture through innovative access to other efficiency delivery mechanisms. The CPUC expects this approach to motivate IOUs to coordinate with other agencies and entities whose partnerships could lead to a maximized level of savings in 2012‐2020.
In the remainder of this report, staff describes publicly owned utilities’ energy efficiency accomplishments during 2006‐2007 and provides an assessment of progress toward the POU energy efficiency goals adopted by the Energy Commission under AB 2021 (2006).
10
POU Energy Efficiency Program Accomplishments California’s POUs are a widely varying set of 39 locally controlled entities that range in size from the state’s third largest utility, Los Angeles Department of Water & Power (LADWP), down to very small entities that serve under a thousand customers. Some serve densely populated urban centers, while others have customers spread far apart in rural communities. Among these 39 utilities, LADWP and Sacramento Municipal Utility District (SMUD) serve approximately 60 percent of the retail sales, and the largest 15 POUs serve 95 percent of the total POU load.
The POUs have had energy efficiency programs for their customers for many years. Since electricity deregulation legislation in 1996, Assembly Bill 1890 (Brulte, Chapter 854, Statutes of 1996), these programs have been funded from California’s Public Goods Charge. As noted in the Introduction, the energy agencies, together with the utilities, developed statewide targets and utility‐specific targets in December 200712 in response to AB 2021 (2006). The 2007 goals adopted for the POUs were essentially the same as those proposed by these utilities in June 2007 and ratified by their boards by September 2007.
The POUs decided to meet their reporting obligation by providing a joint report consolidated by the California Municipal Utilities Association (CMUA). In March 2008, CMUA provided the Energy Commission with the first progress report since the energy efficiency targets were adopted in December 2007. The CMUA reported on programs completed for most of the POUs during fiscal year 2006/2007, though some POUs reported on savings obtained through calendar year 2007. CMUA reported their principal findings and conclusions as:
• Public power energy efficiency programs provide more than three dollars of societal benefits for every dollar spent. Applying the Total Resource Cost (TRC) societal test, the weighted average cost effectiveness for all publicly owned energy efficiency programs in FY 06/07 was 3.15. By comparison, programs authorized by the California Public Utilities Commission (CPUC) for the investor‐owned utilities range between 1.6 and 2.8.
• During FY 06/07, POUs spent $63 million on energy efficiency programs, reducing peak demand by 57 megawatts (MW) and in excess of 254 million kilowatt‐hours (kWh) annually. POU energy efficiency expenditures for FY 07/08 are expected to increase to $146 million during FY06/07, reducing demand by 118 MW during the summer peak and 541 million kWh over the course of the year.
12 California Energy Commission, Achieving All Cost‐Effective Energy Efficiency for California, Final Staff Report, CEC‐200‐2007‐019‐SF, December 2007.
11
• For most of the 39 POUs, actual energy efficiency program savings in FY 06/07 exceeded the savings estimated by the group of publicly owned utilities in the 2006 report.
• Operational efficiency savings, considered “procurement” investments by the public power community, was reported by five POUs, providing 574 kW of peak demand reduction and a savings of 5.2 million kWh. Additional operational improvements by the Northern California Power Agency (NCPA) at its geothermal facilities at the geysers and hydroelectric facilities provided some additional savings, but are not reflected in the totals.
• Lighting continues to dominate public power energy efficiency programs, accounting for approximately three‐fifths of total energy savings achieved. However, POUs recognize that the growing saturation of the lighting market will require all utilities in the state to more aggressively deploy non‐lighting efficiency programs going forward.
• Energy efficiency is a critical tool for POUs to reduce greenhouse gas emissions in California. FY 06/07 programs within the public power community will reduce statewide greenhouse gas emissions by 1.5 million tons carbon dioxide (CO2) equivalent over the lifetime of the installed measures. Current year programs are expected to save another 3.3 million tons.13
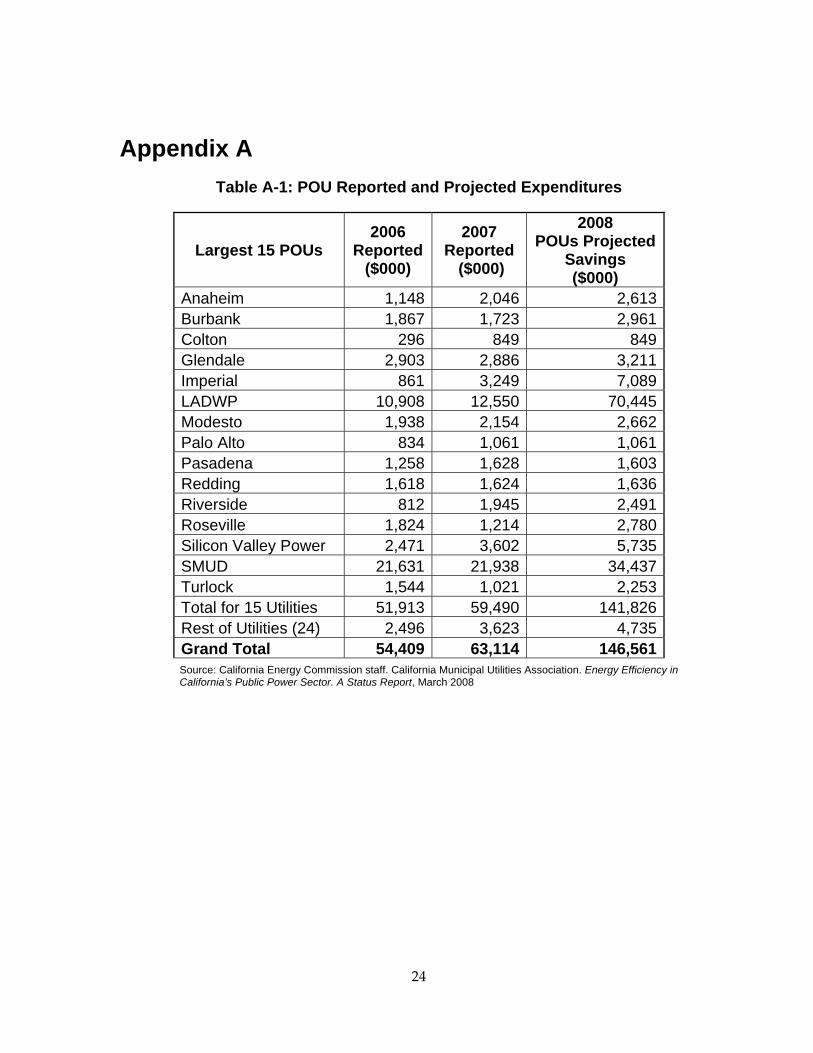
POU Energy Efficiency Expenditures: Reported and Projected The POUs collectively spent $63 million on energy efficiency programs in 2007, a 16 percent increase from their 2006 reported expenditures. Of the 39 reporting POUs, the largest 15 POUs spent $59 million, or 94 percent, of this total. SMUD spent the largest amount at $22 million, and LADWP spent the next highest at $13 million. Together they spent a combined total of 55 percent, which is roughly commensurate with their share of retail sales.
For 2008, the POUs project to spend $147 million on energy efficiency programs which is an increase of 132 percent over the previous year. LADWP is responsible for the majority of the increased projected spending. Their energy efficiency program spending is expected to increase from $13 million to $71 million dollars, an increase of 461 percent from 2007 to 2008. For 2008, a number of POUs expect to increase their spending during this period by over 100 percent. These utilities are Biggs, Corona, Gridley, Merced, Truckee Donner, and Vernon. Figure 1 illustrates the reported and projected energy efficiency expenditures for 2006 through 2008, and the supporting data is contained in the Appendix’s Table A‐1. 13 California Municipal Utility Association (CMUA), Energy Efficiency in California’s Public Power Sector: A Status Report, Executive Summary, March 2008, p. 5‐6
12

Figure 1: POUs’ Reported and Projected Energy Efficiency Expenditures for 2006-2008
Sources: California Municipal Utilities Association, Energy Efficiency in California’s Public Power Sector: A Status Report, March 2008 for the publicly owned utilities. EIA-861- Annual Electric Power Industry Report. File 2.
One way to measure utility commitment to energy efficiency is the amount of program expenditures relative to a utility’s total revenue. POUs spent a rough average of 1 percent of their total revenues on energy efficiency programs in 2007, a slight increase from 2006. Figure 2 illustrates the range of this measure for the POUs in FY 2006/2007 or calendar year 2007.
13

Figure 2: POUs’ Energy Efficiency Spending as Percentage of Revenue (Fiscal Year 2006/2007 or Calendar Year
2007)
Sources: California Municipal Utilities Association, Energy Efficiency in California’s Public Power Sector: A Status Report, March 2008 for the publicly owned utilities. EIA-861- Annual Electric Power Industry Report. File 2.
POUs Electric Energy and Peak Savings
These expenditures have resulted in increased energy efficiency savings. In 2007, the POUs collectively provided 254 GWh of electric energy savings, which is a 50 percent increase from 2006. In 2006, the POUs had projected that their energy savings would be 326 GWh in 2007. The 2007 reported savings are roughly 20 percent less than this 2006 projection and 25 percent less than their AB 2021 adopted targets (See Figure 3 and Table 3).14
14 California Energy Commission, Achieving All Cost‐Effective Energy Efficiency for California, Final Staff Report, CEC‐200‐2007‐019‐SF, December 2007. POU savings accomplishments would be considered reasonable progress if the utility comes within 20 percent of meeting its first annual goal (p.107).
14
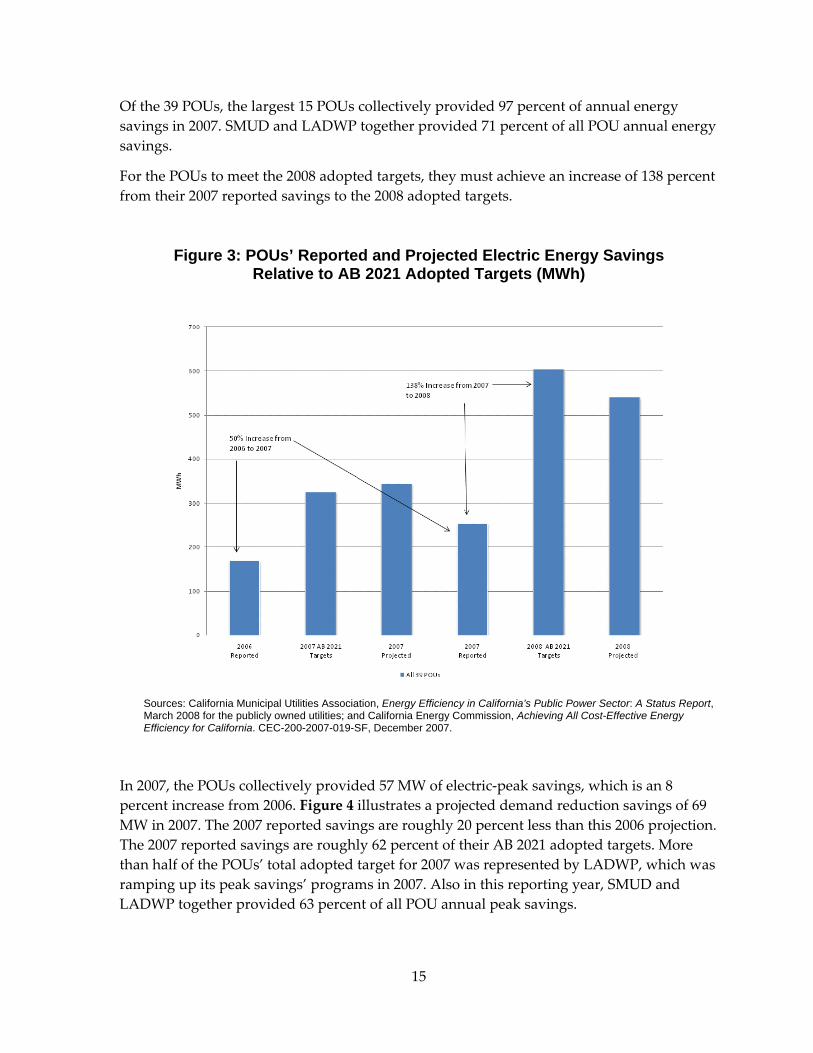
Of the 39 POUs, the largest 15 POUs collectively provided 97 percent of annual energy savings in 2007. SMUD and LADWP together provided 71 percent of all POU annual energy savings.
For the POUs to meet the 2008 adopted targets, they must achieve an increase of 138 percent from their 2007 reported savings to the 2008 adopted targets.
Figure 3: POUs’ Reported and Projected Electric Energy Savings Relative to AB 2021 Adopted Targets (MWh)
Sources: California Municipal Utilities Association, Energy Efficiency in California’s Public Power Sector: A Status Report, March 2008 for the publicly owned utilities; and California Energy Commission, Achieving All Cost-Effective Energy Efficiency for California. CEC-200-2007-019-SF, December 2007.
In 2007, the POUs collectively provided 57 MW of electric‐peak savings, which is an 8 percent increase from 2006. Figure 4 illustrates a projected demand reduction savings of 69 MW in 2007. The 2007 reported savings are roughly 20 percent less than this 2006 projection. The 2007 reported savings are roughly 62 percent of their AB 2021 adopted targets. More than half of the POUs’ total adopted target for 2007 was represented by LADWP, which was ramping up its peak savings’ programs in 2007. Also in this reporting year, SMUD and LADWP together provided 63 percent of all POU annual peak savings.
15

For the POUs’ to meet the 2008 adopted peak targets, they must achieve an increase of 98 percent from their 2007 reported peak savings to the 2008 adopted targets.
Figure 4: POUs’ Reported and Projected Annual Peak Savings Relative to AB 2021 Adopted Targets (MW)
Sources: California Municipal Utilities Association, Energy Efficiency in California’s Public Power Sector: A Status Report, March 2008 for the publicly owned utilities; and California Energy Commission, Achieving All Cost-Effective Energy Efficiency for California. CEC-200-2007-019-SF.
Programs for commercial/ industrial customers contribute more than 60 percent of the efficiency savings for the POUs as a group. The measure type that dominates the collective POU portfolio is lighting for residential and commercial/industrial customers. Lighting provided 62 percent of annual energy savings and over half of all peak savings in 2007. Residential and commercial/industrial air conditioning is the next most important end use, contributing 13 percent of the annual energy savings and 20 percent of the peak savings. For the most part, the large increases in savings that are predicted for the POUs from 2007 to
16
2008 are to be achieved by expanding residential lighting, especially the distribution of compact fluorescent lights.
The expansion of energy efficiency as a POU resource is subject to its cost‐effectiveness relative to other utility options. In their March 2008 Report, the POUs included the Total Resource Cost (TRC) test for each utility’s portfolio.15 The average TRC was over three, implying that every program dollar resulted in more than three dollars of societal benefits. For all POUs the TRC results ranged from below one for some of the smaller utilities to over five. The largest 15 POUs had solidly cost effective program portfolios with nearly all TRCs over 1.5. TRCs were not available for specific programs, and there did not appear to be a correlation between portfolio TRCs and their program composition.
POU Progress in Tracking and Verification Methodology Unlike the IOUs which have been working towards uniform standard practices for a decade, the POUs each historically used their own assessment methods. In 2006, the POUs had developed a common measurement tool that allowed them to draw on standard measure impact measurements and accounting methods. For the 2007 reporting year, POUs updated their methods further to calculate efficiency savings and measure the cost effectiveness of their efficiency program portfolios. The POU Energy Efficiency Reporting Tool, similar to that used by the IOUs, standardized quantification methods to estimate energy and peak reductions from efficiency programs. This tool incorporated updated assumptions and modified information to remain consistent with the IOUs. The TRC test was modified to include the cost of incentives paid to free riders.16 Second, transmission and distribution costs were included although not used to calculate cost effectiveness. Third, greenhouse gas emissions were incorporated into the reporting tool in 2007 and into the TRC test. This inclusion of carbon costs increases the cost‐effectiveness of the POU efficiency programs.
During the year, many POUs initiated contracts for independent evaluators to assess their program operations. They anticipate that the first results from these evaluation initiatives will be reported in the 2009 status reports. The POUs noted that the pool of energy efficiency contractors required to evaluate all IOU and POU programs needed to expand, but were confident that this deficiency would be met over time. 15 Total Resource Cost (TRC) test is the most frequently used measure of the cost effectiveness of an energy efficiency program. The TRC ratio includes the identified benefits of the program such as avoided generation costs divided by the net costs, which include both the utility and participant costs. When the TRC test ratio is greater than 1.0 for a utility program (or portfolio of programs), it is deemed cost‐effective.
16 Free riders are program participants who would have implemented the program measure in absence of the program. Including the cost of the incentives paid to them is consistent with CPUC D.07‐09‐043 (September 2007), applicable to the IOUs. See also California Municipal Utility Association, Energy Efficiency in California’s Public Power Sector: A Status Report, March 2008, page 3.
17

Demand Response and Operational Efficiencies Thirteen of the larger POUs either have some form of demand response programs or are about to initiate them. The CMUA report states:
The general findings provided in the 2006 report are still relevant here. With system reliability not a significant issue for most POUs, it should not be surprising that many of the traditional demand reduction programs are not being utilized within the various service territories. That being said, POU programs primarily target large commercial and industrial users who can either reduce a significant portion of their loads or serve the loads from another source such as a backup generator during critical peak demand periods. The programs take into account the weather sensitivity of peak loads, load shedding strategies, and economic incentives to shed load or shift the serving of it to another source during peak periods (p. 198).
Although not included in their reported savings of energy efficiency and demand reduction, the POUs also reported on their programs to reduce line losses through operational changes and increases in the energy efficiency of their generation. Five utilities (Burbank, Glendale, LADWP, Plumas‐Sierra, and Palo Alto) reported operation efficiencies through investments in reductions in line losses and system improvements, and NCPA reported generator tune‐ups that also provided energy savings and demand reductions.
Investment Treatment AB 2021 requires that POUs treat investments made to achieve energy efficiency savings and demand reduction targets as procurement investments. The CMUA report states:
The statute calls for utilities to distinguish between ʺprocurementʺ investment for energy efficiency programs and investments from traditional public benefits programs. Additionally, the statute makes it clear that additional energy efficiency program expenditures should not come at the expense of other programs. For purposes of this report, all procurement dollars are considered a component of operational improvements, as it relates to generation, transmission, and distribution upgrades. In no case are energy efficiency program expenditures increasing at the expense of other public benefits programs (page 23).
Staff Assessment of POU Progress in 2007 AB 2021 requires the Energy Commission to make recommendations to the POUs, Legislature, and Governor if the Energy Commission determines that improvements could be made in the level of aggregate achievement by POUs or in the level of achievement by
18

any POU. POU energy efficiency progress can be assessed in two ways: Compared to their starting point and compared to comparably‐sized IOUs. In general, POUs are expanding their programs substantially, but they are starting from a smaller base than where the IOUs are today and so are subject to issues about how fast programs can ramp up and what programs are cost‐effective for very small entities.
Energy Commission staff analyzed the 2007 data on efficiency program savings and expenditures relative to previous year accomplishments and projections and to AB 2021 adopted targets. Progress is considered reasonable if each POU comes within plus or minus 20 percent of its annual adopted target.17 In 2007, the POUs collectively increased their spending on energy efficiency programs and both their energy and peak savings. Their commitment is demonstrated through specific actions taken over the past year such as hiring additional efficiency staff and expanding customer programs. Many of these actions were planned and implemented at the same time that the AB 2021 targets were being developed. It is to the POUs’ credit that they anticipated the ambitious levels of the AB 2021 adopted targets and set to work.
Table 3 shows the results of this transitional year. One‐third of the 15 largest POUs (Colton, Palo Alto, Pasadena, SMUD, and Turlock Irrigation District) achieved savings in the 2007 target range. For most POUs with fiscal years that run from July 1, 2006, through June 30, 2007, their reporting year had closed before the targets were adopted in December 2007. Staff does not consider this first year to represent what may occur once full programs are in place.
17 Staff notes that there was no reported natural gas savings or adopted goals for the POUs in 2007. Only one POU, City of Palo Alto, budgets for a natural gas savings program whose savings are not expected to be reported until 2009.
19

Table 3: POU Reported 2007 Energy Savings (MWh) Compared to Goals and Performance Range
2007
Target 2007
Reported Savings
Target Plus 20%
Target Minus 20%
Anaheim 15,897 8,724 19,076 12,718
Burbank 11,307 5,607 13,568 9,046
Colton 2,625 10,247 3,150 2,100
Glendale 11,362 8,510 13,634 9,090
Imperial 13,223 8,118 15,868 10,578
LADWP 114,000 61,641 136,800 91,200
Modesto 13,586 5,561 16,303 10,869
Palo Alto 2,500 4,711 3,000 2,000
Pasadena 5,000 4,238 6,000 4,000
Redding 2,641 1,667 3,169 2,113
Riverside 22,210 5,843 26,652 17,768
Roseville 8,716 4,326 10,459 6,973
Silicon Valley Power 25,762 10,889 30,914 20,610
SMUD 70,000 95,950 84,000 56,000
Turlock 7,824 9,206 9,389 6,259
Total 326,653 245,238 391,984 261,322Source: California Energy Commission staff
Less than half of POUs achieved energy savings that fell within or exceeded the plus or minus 20 percent band around the adopted targets for 2007. A number of the remaining utilities continue to increase their efficiency staffing and expect to see substantial savings improvements in 2008. It remains to be seen if POUs can make up the difference between their 2006 and 2007 reported savings and then make the substantial increase to meet adopted savings targets of 2008 and beyond. For the largest 15 POUs this implies a one‐year increase of 130 percent, a formidable task under any set of circumstances.
In 2007, when POUs submitted targets to the Energy Commission, staff was concerned that the substantial increases or “ramp‐up rates” proposed between 2007 and 2011 were unprecedented and would be difficult to obtain. As it turns out, in 2007, nine of the 15 largest utilities project that their 2008 savings will be less than their adopted targets. Most,
20

however, plan to achieve savings within the plus or minus 20 percent band of their 2008 adopted targets (exceptions are Burbank, Modesto, Pasadena, and Riverside).
Staff is concerned with POUs revising energy and peak savings projections for 2008 downward from their adopted targets without more explanation of why the targets are currently infeasible and how the shortfall will be made up. While it is wise for the POUs to be realistic when developing savings projections, this may be construed as a unilateral resetting of targets that were adopted under AB 2021. If this practice takes hold, using adopted targets as a forecast of future energy savings will not be reliable. This could affect the confidence the authors have in efficiency savings, which are essential for meeting the state’s energy and climate change targets. Staff and POUs need to discuss the practice of changing adopted goals and the causes of this modification.
For the most part, the large increases in savings that are predicted for the POUs from 2007 to 2008 are to be achieved by expanding residential lighting. In several cases where a program design was mentioned, the POU was planning to mail out two compact fluorescent light bulbs (CFLs) per customer household. While these estimated savings appear to be extremely cost effective, the verified savings of similar lighting program designs are proving to be less, as demonstrated in an evaluation study completed by Itron.18
The ultimate resource value of all POU efficiency program savings is determined through evaluation, measurement and verification research. The POUs’ March 2008 Report indicated that evaluation, measurement and verification activities had begun for many utilities. Eleven are in the process or have contracted to develop program evaluation plans to determine savings impacts. Northern California Power Agency is working collectively with smaller POUs to outline the specific steps in the evaluation methods used by the IOUs. The POUs have much to gain from evaluation, measurement and verification; most importantly, these results will make their savings estimates more credible and reliable in statewide energy and climate change planning forums. In addition, evaluation, measurement and verification research will upgrade the ex ante savings estimates in the E3 planning tool and lead to program designs that produce increased savings in the future19.
It is clear from the cost‐effectiveness data provided for each utility’s portfolio that POU programs can be further expanded to benefit their customers and society. Such an expansion should be considered since the Legislature’s mandate (AB 2021) specifically requires POUs consider energy efficiency first when planning for energy resources to meet customer loads. The POUs have stated that their procurement investments are reserved for operational improvements (generation, transmission, and distribution upgrades) while efficiency expenditures are handled through Public Goods Charge allocations. Detailed reporting of 18 Itron, Inc., 2004‐2005 Statewide Residential Retrofit Single‐Family Energy Efficiency Rebate Evaluation Report, October 2007.
19 Energy & Environmental Economics (E3) Consulting is the lead contractor developing the reporting tools for IOUs and POUs. See CMUA, Energy Efficiency in California’s Public Power Sector: A Status Report, December 2006.
21

POUs investment sources for energy efficiency would help explain this practice. In several areas, POUs have asked the Energy Commission to evaluate their efficiency objectives and performance in light of their unique “publicly owned” status. This is only possible if the POUs supply more information for the state evaluators to consider and analyze.
Staff notes that the previous AB 2021 Report20 contained ambitious plans for Energy Commission staff to collaborate with the POUs in improving monitoring, verification and evaluation and in better understanding their individual circumstances. Staffing constraints prevent these goals from being fully achieved. Staff acknowledges that the collaboration is still needed and has initiated adding the staff necessary to meet its commitments.
Recommendations Regarding POU Energy Efficiency • Energy Commission staff should work with the publicly owned utilities in achieving
their efficiency goals through workshops and collaborative efforts that improve overall evaluation planning, develop program tracking systems and improve savings reporting requirements for the next AB 2021 cycle.
• Energy Commission staff and publicly owned utilities should work together to understand the processes used by individual utilities to estimate their unprecedented increase in efficiency expenditures and savings from 2007.
• Energy Commission staff and publicly owned utilities should work together to understand the processes used by individual utilities to estimate their remaining economic potential and set targets.
• Before the March 2009 progress report, staff and the utilities should reach a common understanding on the Legislature’s direction regarding the role of energy efficiency in the utilities resource acquisition and develop information for the 2009 report that better explains this to customers, the Energy Commission, and the Legislature.
• The POUs’ March 2009 report should contain:
○ An explanation of the rationale and data relied on by any POU that modifies its adopted goals.
○ An explanation of how energy efficiency annual goals were set, comparing the cost‐effectiveness of these energy efficiency goals to other resources.
○ Information on the cause of any yearly fluctuations in efficiency performance.
○ A table that documents historic and forecast total Public Goods Charge funding amounts allocates energy efficiency and to other programs, such as low‐income, research and development, and renewables.
20 California Energy Commission, Achieving All Cost‐Effective Energy Efficiency for California, Final Staff Report, CEC‐200‐2007‐019‐SF, December 2007.
22

○ A discussion of the success utilities have had in ramping up their programs so steeply, the types of programs being added, and the program delivery mechanisms which the utilities are employing to make cost‐effective energy efficiency feasible to deliver.
• A progress report implementing evaluation, measurement, and verification research.
• The POUs and staff should initiate a process for revisiting the goals that AB 2021 mandate is carried out every three years. New goals are due to the Energy Commission no later than June 1, 2010. Monitoring the ongoing IOU activities regarding the revision of efficiency potential estimates and goals facilitates this work.
• The new paradigm of achieving all cost‐effective energy efficiency through multiple providers requires coordination among IOUs, POUs, and local governments. In addition to their own programs, the POUs are being asked to expand their collaboration with local governments and other potential service providers.
California’s publicly owned utilities, especially the smaller ones, are entering a new era of energy supply and environmental constraints. The POUs are facing numerous newly initiated legislative mandates. California’s POUs are willing to step up to the plate by continuing to take significant strides to increase their energy efficiency activities for the benefit of their customers, and ultimately for all Californians. The Energy Commission looks forward to working with the POUs as preparations are made for the March 2009 report on energy efficiency progress.
23
Appendix A Table A-1: POU Reported and Projected Expenditures
Largest 15 POUs 2006
Reported($000)
2007 Reported
($000)
2008 POUs Projected
Savings ($000)
Anaheim 1,148 2,046 2,613Burbank 1,867 1,723 2,961Colton 296 849 849Glendale 2,903 2,886 3,211Imperial 861 3,249 7,089LADWP 10,908 12,550 70,445Modesto 1,938 2,154 2,662Palo Alto 834 1,061 1,061Pasadena 1,258 1,628 1,603Redding 1,618 1,624 1,636Riverside 812 1,945 2,491Roseville 1,824 1,214 2,780Silicon Valley Power 2,471 3,602 5,735SMUD 21,631 21,938 34,437Turlock 1,544 1,021 2,253Total for 15 Utilities 51,913 59,490 141,826Rest of Utilities (24) 2,496 3,623 4,735Grand Total 54,409 63,114 146,561Source: California Energy Commission staff. California Municipal Utilities Association. Energy Efficiency in California’s Public Power Sector. A Status Report, March 2008
24

Table A‐2 shows the 24 smaller POU’s AB 2021 adopted targets for the reporting year (either FY 2006/2007 or calendar year 2007 depending on POU), the reported energy efficiency savings, and the plus or minus 20 percent target bands that the Energy Commission set as a reasonable boundary for assessing program performance.
Table A-2: Smaller POUs Energy Efficiency Reported Savings Versus Targets (MWh)
2007
Target 2007
Reported Savings
Target Plus 20%
Target Minus 20%
Alameda 760 921 912 608
Azusa 2,084 1,041 2,501 1,667.2
Banning 873 253 1,048 698.4
Biggs 106 477 127 84.8
Corona 467 980 560 373.6
Gridley 92 86 110 73.6
Healdsburg 198 152 238 158.4
Hercules 136 46 163 108.8
Industry 0 0 0 0
Island Energy 178 0 214 142.4
Lassen 733 902 880 586.4
Lodi 2,000 383 2,400 1,600
Lompoc 1,121 102 1,345 896.8
Merced 3,619 3,773 4,343 2,895.2
Moreno Valley 822 44 986 657.6
Needles 817 109 980 653.6
Plumas-Sierra 621 487 745 496.8
Port of Oakland 884 531 1,061 707.2
Rancho Cucamonga 448 57 538 358.4
Shasta Lake 129 47 155 103.2
Trinity 0 19 0 0
Truckee Donner 1,001 603 1,201 800.8
Ukiah 198 30 238 158.4
Vernon 0 230 0 0
Total 17,287 11,273 20,744 13,829.6
25

26
Source: California Energy Commission staff: California Municipal Utilities Association. Energy Efficiency in California’s Public Power Sector. A Status Report, March 2008