PERFORMANCE ASSESSMENT OF GRATE INLETS · PDF filen Manning’s roughness n r ......
65
Prepared for The Urban Drainage and Flood Control District Prepared by Brendan C. Comport Amanda L. Cox Christopher I. Thornton April 2012 Colorado State University Daryl B. Simons Building at the Engineering Research Center Fort Collins, CO 80523 PERFORMANCE ASSESSMENT OF GRATE INLETS FOR HIGHWAY MEDIAN DRAINAGE
Transcript of PERFORMANCE ASSESSMENT OF GRATE INLETS · PDF filen Manning’s roughness n r ......

Prepared for
The Urban Drainage and Flood Control District
Prepared by
Brendan C. Comport
Amanda L. Cox
Christopher I. Thornton
April 2012
Colorado State University
Daryl B. Simons Building at the
Engineering Research Center
Fort Collins, CO 80523
PERFORMANCE ASSESSMENT OF GRATE INLETS
FOR HIGHWAY MEDIAN DRAINAGE

i
TABLE OF CONTENTS
LIST OF FIGURES ...................................................................................................................... ii
LIST OF TABLES ....................................................................................................................... iv
LIST OF SYMBOLS, UNITS OF MEASURE, AND ABBREVIATIONS ..............................v
1 INTRODUCTION.......................................................................................................................1
1.1 Project Background ..........................................................................................................1
1.2 Research Objectives .........................................................................................................3
1.3 Report Organization .........................................................................................................3
2 HYDRAULIC MODELING ......................................................................................................4
2.1 Testing Facility Description and Model Scaling .............................................................4
2.2 Inlet Configurations .........................................................................................................9
2.3 Conditions Tested ..........................................................................................................14
2.4 Model Operation and Testing Procedures......................................................................17
3 DATA AND OBSERVATIONS ...............................................................................................22
4 SUMMARY ...............................................................................................................................26
REFERENCES .............................................................................................................................27
APPENDIX A GRATE AND INLET SCHEMATICS .............................................................28
APPENDIX B TEST DATA ........................................................................................................50
APPENDIX C DATA COLLECTION ......................................................................................55

ii
LIST OF FIGURES
Figure 1-1: Map of the Urban Drainage and Flood Control District (UDFCD, 2008) ...................2
Figure 2-1: Photograph of model layout .........................................................................................5
Figure 2-2: Manning’s roughness for concrete pad (prototype) .....................................................7
Figure 2-3: Manning’s roughness for median channel (prototype) ................................................8
Figure 2-4: Surface roughness patterns...........................................................................................8
Figure 2-5: Type C inlet on-grade ..................................................................................................9
Figure 2-6: Type C inlet depressed ...............................................................................................10
Figure 2-7: Type D inlet on-grade ................................................................................................11
Figure 2-8: Type D inlet rotated ...................................................................................................12
Figure 2-9: Type D inlet depressed ...............................................................................................13
Figure 2-10: Type D inlet depressed and rotated ..........................................................................14
Figure 2-11: Model schematic ......................................................................................................18
Figure 2-12: Data-collection cart photograph (looking upstream) ...............................................20
Figure 3-1: Type C inlet ................................................................................................................22
Figure 3-2: Type C inlet depressed ...............................................................................................23
Figure 3-3: Type D inlet ...............................................................................................................23
Figure 3-4: Type D inlet depressed ...............................................................................................24
Figure 3-5: Type D inlet rotated ...................................................................................................24
Figure 3-6: Type D inlet depressed and rotated ............................................................................25
Figure A-1: Type C inlet schematics ............................................................................................29
Figure A-2: Type C inlet depressed schematics ...........................................................................31
Figure A-3: Type D inlet schematics ............................................................................................33
Figure A-4: Type D inlet rotated schematics ................................................................................35
Figure A-5: Type D inlet depressed schematics ...........................................................................37

iii
Figure A-6: Type D inlet rotated and depressed schematics ........................................................39
Figure A-7: Grate schematics .......................................................................................................41
Figure A-8: 10-degree angled insert schematics ...........................................................................42
Figure A-9: 20-degree angled insert schematics ...........................................................................44
Figure A-10: 30-degree angled insert schematics .........................................................................46
Figure A-11: Median section schematics ......................................................................................48

iv
LIST OF TABLES
Table 2-1: Prototype dimensions ....................................................................................................6
Table 2-2: Scaling ratios for geometry, kinematics, and dynamics ................................................6
Table 2-3: Test matrix ...................................................................................................................15
Table 2-4: Inflow measurement characteristics ............................................................................19
Table B-1: Test data for inlets ......................................................................................................51
Table B-2: Debris test data ...........................................................................................................54

v
LIST OF SYMBOLS, UNITS OF MEASURE, AND ABBREVIATIONS
Symbols
H head above the inlet (ft)
Lr length, width, and depth (geometry)
n Manning’s roughness
nr Manning’s roughness scaling ratio (dynamics)
Q volumetric flow rate or theoretical volumetric flow rate (cfs)
Qr discharge (kinematics)
Vr velocity (kinematics)
ρr fluid density (dynamics)
Units of Measure
cfs cubic feet per second
º, deg degree(s), as a measure of angular distance
ft feet or foot
ft2 square feet
hp horse power
in. inch(es)
% percent
Abbreviations
BMP Best Management Practice
CDOT Colorado Department of Transportation
CSU Colorado State University
ERC Engineering Research Center
ID identification
Mag meter electro-magnetic flow meter
QC quality control
® registered
TM trademark
Type C CDOT single grate inlet tested at CSU

vi
Type D CDOT double grate inlet tested at CSU
UDFCD Urban Drainage and Flood Control District
USBR U. S. Bureau of Reclamation
USDCM Urban Storm Drainage Criteria Manual

1
1 INTRODUCTION
A research program was conducted at Colorado State University (CSU) to evaluate the
performance of two highway median storm drain inlets. Inlets tested in this study are currently
used by the Urban Drainage and Flood Control District (UDFCD) of Denver, and consist of the
Colorado Department of Transportation Type C and D configurations. The Type C and D inlets
have not previously been studied or tested for development of performance equations. Current
design practices are based upon general application of the orifice and/or weir equations. The
study presented in this report focused on collecting data on Type C and D inlets under
physically-relevant design conditions for analysis by the UDFCD. A 3:1 Froude-scale model of
a highway median was designed and built at the Engineering Research Center (ERC) of CSU.
The model consisted of a constructed highway median channel with one interchangeable inlet. A
total of 120 hydraulic tests including twenty-four debris tests were performed. Details pertaining
to model construction, testing procedure, and resulting database are presented in this report.
1.1 Project Background
Storm-water runoff is typically conveyed across highway road surfaces and into a center
median where it drains through inlets. Storm-water management in the metropolitan Denver area
falls under the jurisdiction of the UDFCD. Policies, design procedures, and Best Management
Practices (BMPs) are provided in the “Urban Storm Drainage Criteria Manual” (USDCM;
UDFCD, 2008). Design methods presented in the USDCM for determining inlet efficiency
provide the currently accepted methodology for design of storm-water collection systems
throughout the region depicted in Figure 1-1. Guidance is provided in the USDCM for local
jurisdictions, developers, contractors, and industrial and commercial operations in selecting,
designing, maintaining, and carrying-out BMPs to effectively handle storm-water runoff

2
(UDFCD, 2008). Other agencies participating in this study included the University of Colorado
at Denver and the Colorado Department of Transportation (CDOT).
Figure 1-1: Map of the Urban Drainage and Flood Control District (UDFCD, 2008)
The need for the median inlet study stemmed from uncertainty in selecting appropriate
discharge coefficients for the Type C and D inlets for use in the weir and/or orifice equations.

3
Local jurisdictions depicted in Figure 1-1 often utilize the Type C and D inlets for highway
drainage. Uncertainties in sizing the inlets and in the level of flood protection afforded were
realized. Uncertainty in design practice can lead to over-design and wasted expense. Therefore,
a need was identified for greater accuracy in design for the Type C and D inlets. Results of this
research program are intended to be used to supplement the USDCM design methodology.
1.2 Research Objectives
A testing program was developed by the UDFCD to produce sufficient data for
development of discharge coefficients for use in the orifice equation.
Objectives of this project were:
to construct a 3:1 Froude-scale model of a highway median with an interchangeable
inlet;
to conduct hydraulic tests for multiple inlet configurations and grate angles where
stage-discharge data are collected; and
to conduct a debris test for each inlet configuration and provide a qualitative
assessment of the effect of debris on the inlet efficiency and overall performance.
1.3 Report Organization
This report presents the project background and research objectives, description of the
test facility and model fabrication, test data, and conclusions. Included with the report is a CD
that contains the Microsoft Word® (.doc) and Adobe
® Acrobat
® (.pdf) report files, along with the
Microsoft Excel® (.xls) spreadsheet data files. Also provided to the UDFCD with this report is
an Electronic Data Supplement (stored on a DVD) that contains the CD contents and all test data
and photographic documentation. The reader is referred to the UDFCD for obtaining
photographs and video documentation.

4
2 HYDRAULIC MODELING
A physical model was designed and constructed which served to represent common field
conditions. Testing was performed on the Type C and D inlets from September 2009 through
June 2010. A total of 120 tests were performed where data collection focused on inlet flow
depth and volumetric flow rate. This chapter details the testing facility, model construction, test
conditions, and testing procedures.
2.1 Testing Facility Description and Model Scaling
Model construction and testing was performed at the ERC of CSU. A photograph of the
flume, pipe network, and drainage facilities is presented in Figure 2-1. The model consisted of a
headbox to supply water, a flume section containing the highway median section and inlets,
supporting pumps, piping, several flow-measurement devices, a tailbox to capture returning
flow, and the supporting superstructure.

5
Figure 2-1: Photograph of model layout
Contained within the flume section were the highway median surface and all inlet
components. The median section was constructed as a 2-in. by 4 in. (2x4) tubular steel
framework and decked with 1/8-in. thick sheet steel. Upstream of the median section, a
horizontal approach section was constructed to allow flow to become fully developed before the
test section. A diffuser screen was installed at the junction between the headbox and the
approach section to minimize turbulence and to distribute flow evenly across the width of the
model. Prototype dimensions and characteristics are presented in Table 2-1.
Headbox
Sharp-crested
Weir
Pumps
Pipe Network
Inlet
Flume Section
(Median)
6
Table 2-1: Prototype dimensions
Feature Prototype Design
Scale (prototype:model) 3:1 Channel length (ft) 64 Channel width (ft) 24 Channel side slopes (%) 10 Channel longitudinal slope (%) 1.35 Approach section length (ft) 42 Downstream back slope (%) 10 Side slopes at inlet (%) 10 Average Manning’s roughness 0.037 Surface material 1/8-in. steel plate Inflow control butterfly valve / diffuser screen Inflow measurement electro-magnetic flow meter Outflow measurement weir / point gage Grate opening area – single grate (ft2) 5.9 Depth of flow (ft) 3
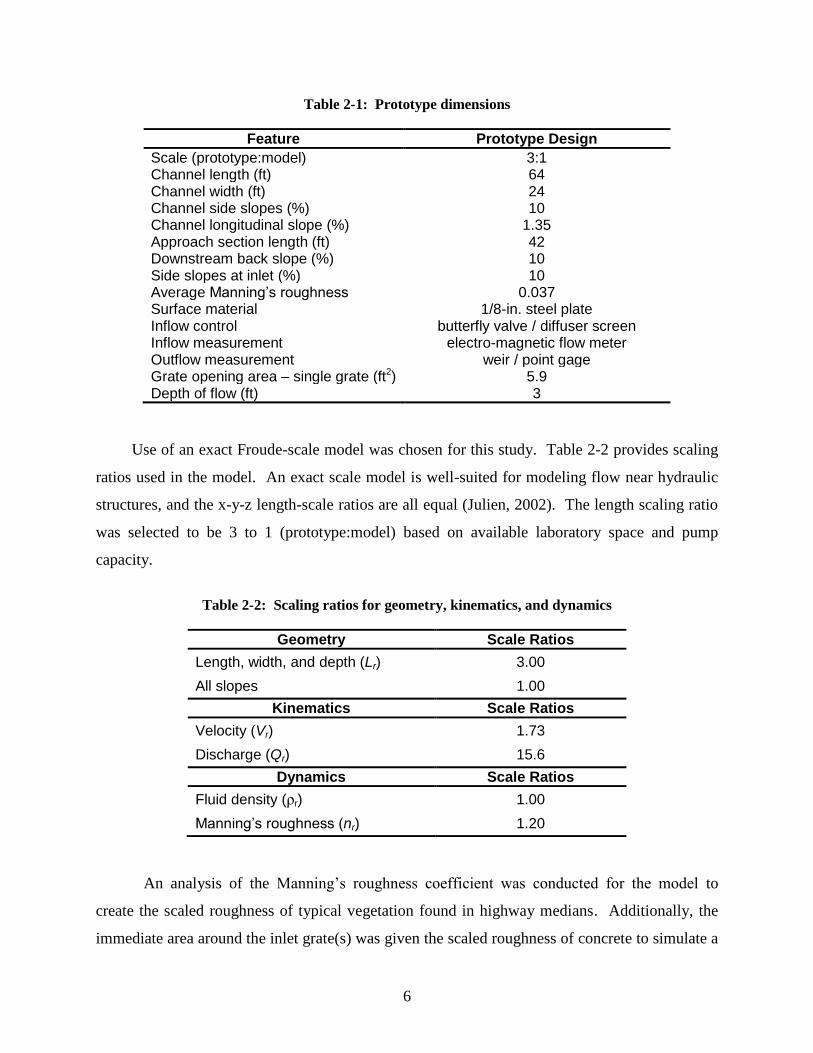
Use of an exact Froude-scale model was chosen for this study. Table 2-2 provides scaling
ratios used in the model. An exact scale model is well-suited for modeling flow near hydraulic
structures, and the x-y-z length-scale ratios are all equal (Julien, 2002). The length scaling ratio
was selected to be 3 to 1 (prototype:model) based on available laboratory space and pump
capacity.
Table 2-2: Scaling ratios for geometry, kinematics, and dynamics
Geometry Scale Ratios
Length, width, and depth (Lr) 3.00
All slopes 1.00
Kinematics Scale Ratios
Velocity (Vr) 1.73
Discharge (Qr) 15.6
Dynamics Scale Ratios
Fluid density (ρr) 1.00
Manning’s roughness (nr) 1.20
An analysis of the Manning’s roughness coefficient was conducted for the model to
create the scaled roughness of typical vegetation found in highway medians. Additionally, the
immediate area around the inlet grate(s) was given the scaled roughness of concrete to simulate a
7
concrete pad typically used in application. Dimensions of the concrete pad for each inlet
configuration are located in Appendix A. An average friction slope over the range of expected
flows was used with Manning’s equation to calculate a roughness value for each of these
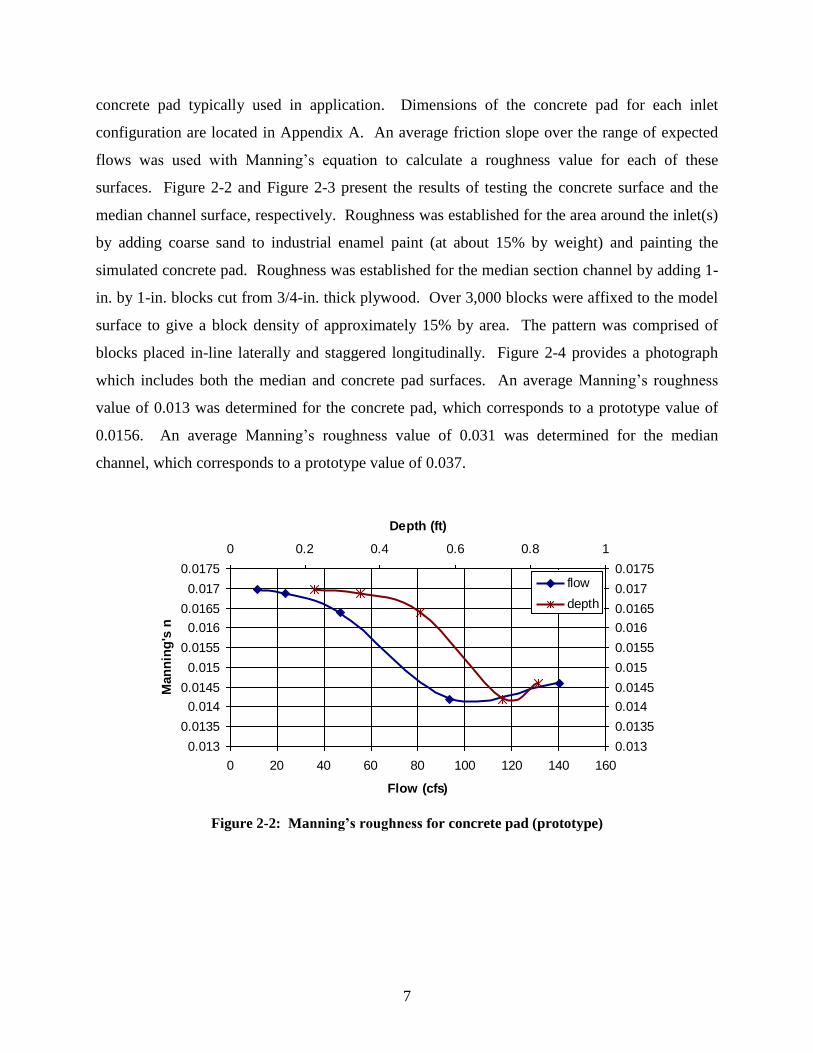
surfaces. Figure 2-2 and Figure 2-3 present the results of testing the concrete surface and the
median channel surface, respectively. Roughness was established for the area around the inlet(s)
by adding coarse sand to industrial enamel paint (at about 15% by weight) and painting the
simulated concrete pad. Roughness was established for the median section channel by adding 1-
in. by 1-in. blocks cut from 3/4-in. thick plywood. Over 3,000 blocks were affixed to the model
surface to give a block density of approximately 15% by area. The pattern was comprised of
blocks placed in-line laterally and staggered longitudinally. Figure 2-4 provides a photograph
which includes both the median and concrete pad surfaces. An average Manning’s roughness
value of 0.013 was determined for the concrete pad, which corresponds to a prototype value of
0.0156. An average Manning’s roughness value of 0.031 was determined for the median
channel, which corresponds to a prototype value of 0.037.
0.013
0.0135
0.014
0.0145
0.015
0.0155
0.016
0.0165
0.017
0.0175
0 20 40 60 80 100 120 140 160
Flow (cfs)
Man
nin
g's
n
0.013
0.0135
0.014
0.0145
0.015
0.0155
0.016
0.0165
0.017
0.0175
0 0.2 0.4 0.6 0.8 1
Depth (ft)
flow
depth
Figure 2-2: Manning’s roughness for concrete pad (prototype)

8
0.0245
0.0295
0.0345
0.0395
0.0445
0 20 40 60 80 100 120 140 160
Flow (cfs)
Ro
ug
hn
ess
0.0245
0.0295
0.0345
0.0395
0.0445
0 0.5 1 1.5 2
Depth (ft)
flow
depth
Figure 2-3: Manning’s roughness for median channel (prototype)
Figure 2-4: Surface roughness patterns

9
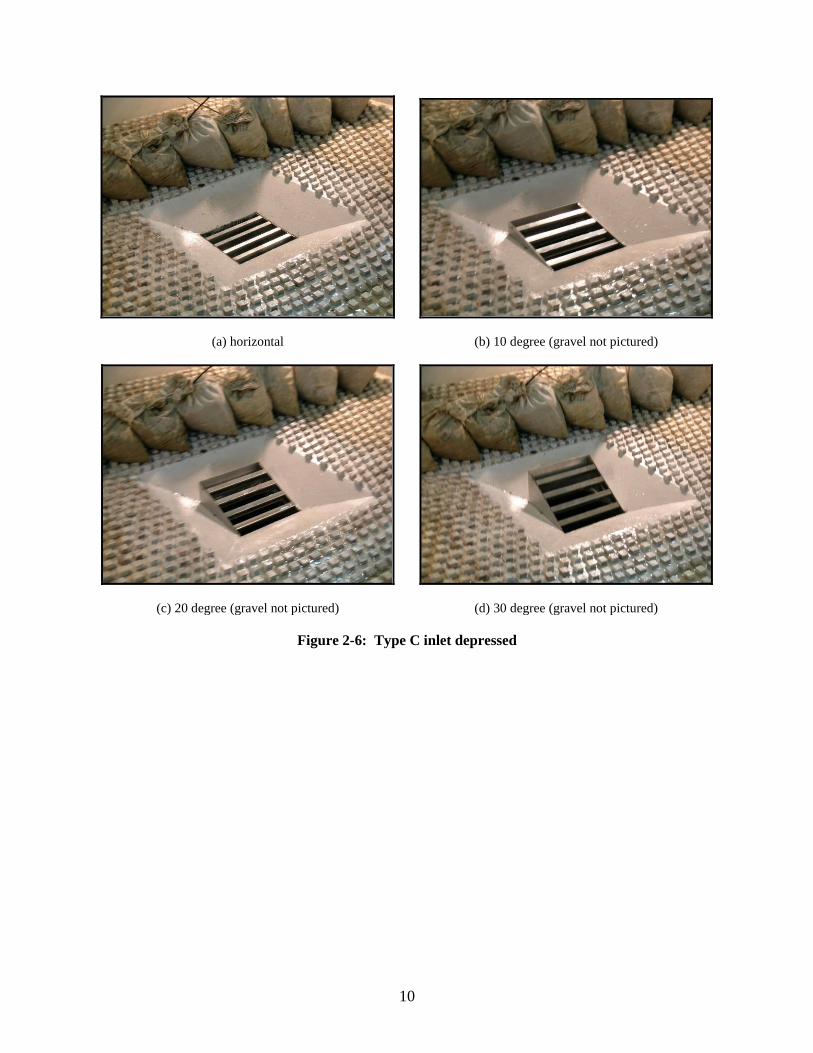
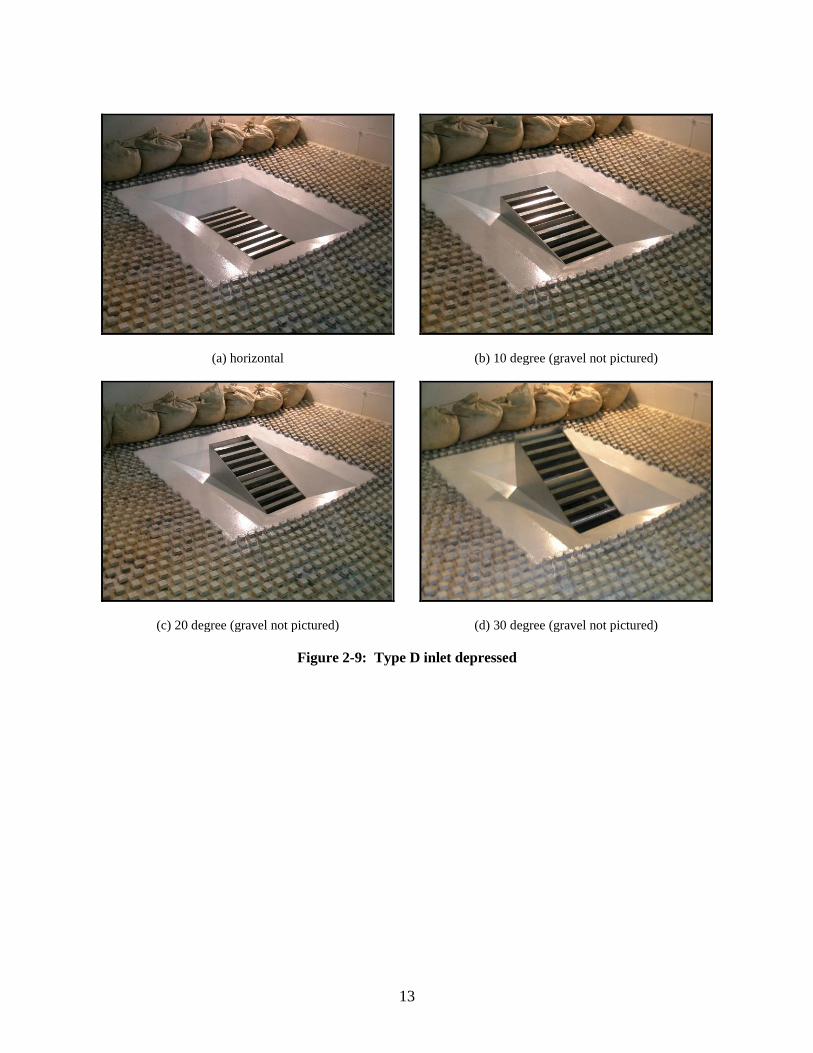
2.2 Inlet Configurations
One model was used for all inlet configurations. Only the area of the model around the
grate(s) was re-constructed for each inlet configuration (i.e., the simulated concrete pad and
several rows of wood blocks). Inlet panels were fabricated from 1/8-in. thick sheet steel and
grates were constructed of 1/8-in. thick aluminum plate. Angled supports were made at 10, 20,
and 30 degrees from 1/8-in. thick sheet steel and fit to the inlet opening. The grate(s) were then
fastened to the appropriate angled support and placed in the inlet opening when required. When
angled grates were used in the on-grade configuration, the area around the grates was filled to the
edge of the opening with gravel to provide a smooth transition. Sandbags were placed behind
the inlets to simulate a small berm typically constructed in field application. Construction
drawings of the model with each inlet type are presented in Appendix A. Photographs provided
in Figure 2-5 through Figure 2-10 illustrate the inlet types and configurations.
(a) horizontal
(b) 10 degree
(c) 20 degree
(d) 30 degree
Figure 2-5: Type C inlet on-grade
10
(a) horizontal
(b) 10 degree (gravel not pictured)
(c) 20 degree (gravel not pictured)
(d) 30 degree (gravel not pictured)
Figure 2-6: Type C inlet depressed

11
(a) horizontal
(b) 10 degree
(c) 20 degree
(d) 30 degree
Figure 2-7: Type D inlet on-grade

12
(a) horizontal (grates not pictured)
(b) 10 degree
(c) 20 degree
(d) 30 degree
Figure 2-8: Type D inlet rotated
13
(a) horizontal
(b) 10 degree (gravel not pictured)
(c) 20 degree (gravel not pictured)
(d) 30 degree (gravel not pictured)
Figure 2-9: Type D inlet depressed

14
(a) horizontal
(b) 10 degree (gravel not pictured)
(c) 20 degree (gravel not pictured)
(d) 30 degree (gravel not pictured)
Figure 2-10: Type D inlet depressed and rotated
2.3 Conditions Tested
A test matrix was developed to organize the variation of parameters through all
configurations. Target flow depths were provided by the UDFCD and typically consisted of 1-,
1.5-, 2.25-, and 3-ft depths at the prototype scale. Rationale for selection of these depths was
based on a typical maximum design flow depth of 3 to 4 ft for highway medians. One grate
design was used for both the Type C and D inlets. The Type C inlet consisted of a single grate
and was used in on-grade and depressed configurations. The inlet was depressed approximately
4 in. below the existing grade for the depressed Type C configuration. The Type D inlet
consisted of two grates configured laterally or in-line with the direction of flow. A depressed
15
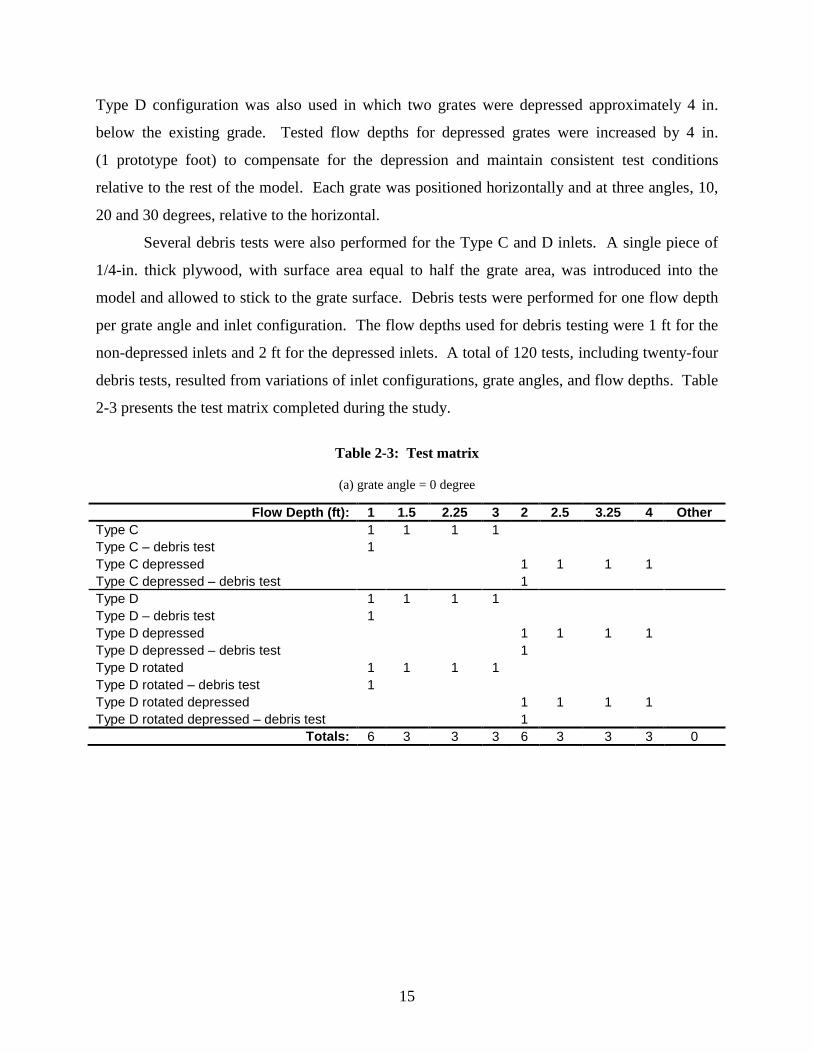
Type D configuration was also used in which two grates were depressed approximately 4 in.
below the existing grade. Tested flow depths for depressed grates were increased by 4 in.
(1 prototype foot) to compensate for the depression and maintain consistent test conditions
relative to the rest of the model. Each grate was positioned horizontally and at three angles, 10,
20 and 30 degrees, relative to the horizontal.
Several debris tests were also performed for the Type C and D inlets. A single piece of
1/4-in. thick plywood, with surface area equal to half the grate area, was introduced into the
model and allowed to stick to the grate surface. Debris tests were performed for one flow depth
per grate angle and inlet configuration. The flow depths used for debris testing were 1 ft for the
non-depressed inlets and 2 ft for the depressed inlets. A total of 120 tests, including twenty-four
debris tests, resulted from variations of inlet configurations, grate angles, and flow depths. Table
2-3 presents the test matrix completed during the study.
Table 2-3: Test matrix
(a) grate angle = 0 degree
Flow Depth (ft): 1 1.5 2.25 3 2 2.5 3.25 4 Other
Type C 1 1 1 1
Type C – debris test 1
Type C depressed 1 1 1 1
Type C depressed – debris test 1
Type D 1 1 1 1
Type D – debris test 1
Type D depressed 1 1 1 1
Type D depressed – debris test 1
Type D rotated 1 1 1 1
Type D rotated – debris test 1
Type D rotated depressed 1 1 1 1
Type D rotated depressed – debris test 1
Totals: 6 3 3 3 6 3 3 3 0

16
(b) grate angle = 10 degree
Flow Depth (ft): 1 1.5 2.25 3 2 2.5 3.25 4 Other
Type C 1 1 1 1
Type C – debris test 1
Type C depressed 1 1 1 1
Type C depressed – debris test 1
Type D 1 1 1 1
Type D – debris test 1
Type D depressed 1 1 1 1
Type D depressed – debris test 1
Type D rotated 1 1 1 1
Type D rotated – debris test 1
Type D rotated depressed 1 1 1 1
Type D rotated depressed – debris test 1
Totals: 3 3 3 3 3 3 3 3 6
(c) grate angle = 20 degree
Flow Depth (ft): 1 1.5 2.25 3 2 2.5 3.25 4 Other
Type C 1 1 1 1
Type C – debris test 1
Type C depressed 1 1 1 1
Type C depressed – debris test 1
Type D 1 1 1 1
Type D – debris test 1
Type D depressed 1 1 1 1
Type D depressed – debris test 1
Type D rotated 1 1 1 1
Type D rotated – debris test 1
Type D rotated depressed 1 1 1 1
Type D rotated depressed – debris test 1
Totals: 3 3 3 3 3 3 3 3 6
(d) grate angle = 30 degree
Flow Depth (ft): 1 1.5 2.25 3 2 2.5 3.25 4 Other
Type C 1 1 1 1
Type C – debris test 1
Type C depressed 1 1 1 1
Type C depressed – debris test 1
Type D 1 1 1 1
Type D – debris test 1
Type D depressed 1 1 1 1
Type D depressed – debris test 1
Type D rotated 1 1 1 1
Type D rotated – debris test 1
Type D rotated depressed 1 1 1 1
Type D rotated depressed – debris test 1
Totals: 3 3 3 3 3 3 3 3 6

17
2.4 Model Operation and Testing Procedures
Water was supplied from the sump to the model headbox by a 40-horsepower (hp) pump
through a network of pipes and valves. Water flowed from the inlet valve to the headbox,
through the flume section and inlets, and then exited into the sump beneath the model. All flow
entering the model was captured by the inlets. Figure 2-11 provides a schematic of the entire
model. A lined channel below the flume conveyed flow away from the inlet and back into the
sump.

18
Median section Approach
4" Venturi Line
18" Mag-Meter Line
24" Annubar Line
Diffuser
Headbox
Location for measurement of inlet flow
(point gage)
P
P
Legend
Photo point (typ).
Inlets
Flow direction (typ).
Direction of flow
Data cart
Sharp crested weir
Inlet
Approach
section
Diffuser
Headbox
Floor of flume
Flume wall
Screen diffuser
D Flow depth data collection locations
D
D
Figure 2-11: Model schematic

19
Flow entering and exiting the model was measured as part of the data-collection process.
A full-bore electro-magnetic flow meter (Mag-meter) manufactured by the Endress and Hauser
Company was used to measure inflow. Table 2-4 summarizes flow-measurement characteristics
for the Mag-meter.
Table 2-4: Inflow measurement characteristics
Instrument Type Flow Range (cfs)
Pipeline (in.)
Pump (hp)
Accuracy (%)
Mag-meter 0.13 - 10 18 40 0.5
Outflow from the channel below the model was measured by a rectangular sharp-crested
weir. The weir was constructed in accordance with published specifications (USBR, 2001), and
calibrated prior to testing. A rating equation was developed by regression analysis of flow-depth
data over the expected operating range, and is given as Equation 2-1. An R-squared value of
0.994 was determined for the regression:
48.14.15 HQ Equation 2-1
where:
Q = discharge (cfs); and
H = head above the weir crest (ft).
Flow depths for each test were measured at two locations, each lateral to the front edge of
the grate(s) at the flume walls. The average of the two flow-depth readings was reported. The
locations were chosen to be free of surface curvature from flow being drawn into the inlets and
served as a control section to establish the depth and adjust the flow into the model for each test.
Flow depth was measured using a point gage with ±0.001 ft accuracy, which was mounted on a
data-collection cart designed to slide along the model and perform other water-surface
measurements as well. Figure 2-12 provides a photograph of the data-collection cart. Three
photograph taking and video recording locations were used for documentation: 1) an oblique
view from adjacent to the data cart looking down at the inlets, 2) a view from directly behind the
inlets looking upstream, and 3) a plan view from directly above the inlets.

20
Figure 2-12: Data-collection cart photograph (looking upstream)
Following a standardized testing procedure assured consistency and facilitated data
collection by multiple technicians. Prior to testing, the model was configured with the
appropriate inlet and grate angle. The desired flow depth was set on the point gage and the flow
into the model was adjusted to contact the point gage. The tolerance for achieving target flow
depths was allowed to be 1 in. (or 3 prototype inches). Technicians waited approximately 10
minutes for flow conditions to stabilize once the depth was set. Outflow measurement point
gages were checked periodically during this time until the readings stabilized. When flow into
the model equaled outflow, indicating a steady-state condition, flow depth, discharge, and
channel inundation extents were recorded and a qualitative description of the flow into the inlet
was documented. Inundation extents were recorded by measuring the top width at every 1-ft
longitudinal station. Fixed measuring tapes were used to determine lateral and longitudinal
extents of water. Both tapes were graduated in tenths of a foot and had ±0.01 ft accuracy.
Inundation data for each test are provided in the Electronic Data Supplement. A new flow depth
was then set on the point gage and the flow adjusted accordingly for subsequent tests with the
same grate angle. The pumps were shut off and the model was reconfigured for consecutive tests
with different inlet configurations or grate angles.
Debris testing entailed a single piece of 1/4-in. plywood introduced into the model at the
upstream end. Several trials were performed to determine patterns in debris behavior. Debris
tended to stick to the grate in predictable locations (i.e., top, middle, or bottom) for a given grate
Point Gage
Tape Measure Used for Longitudinal Positioning

21
angle and flow depth. Once the debris was introduced into the channel, the flow depth was
allowed to stabilize and a new flow-depth reading was collected.
Data collection was documented by completing a data sheet for each test, taking still
photographs, and recording short videos. The data-collection sheet used for all testing is
presented in Appendix C. Data collection was comprised of the following information: date,
operator name, water temperature, test ID number, start and end times, inlet configuration, depth
of flow, extent of flow, and flow characteristics. Flow characteristics consisted of any general
observations that the operator recorded for a particular test. Typical observations included the
condition of flow around the inlets, magnitude of vortex formation, and patterns observed in
debris behavior. Several measures were taken to maintain data quality. After the testing
procedures described above were followed, data were entered into the database by the operator,
and then checked by a second person for accuracy with the original data sheets. A survey of the
model was performed every time the model inlet type was changed which confirmed that the
model was not shifting or settling, and that the slope was accurate to within allowable limits of
0.05% for longitudinal and cross slopes.

22
3 DATA AND OBSERVATIONS
Results of testing presented in this report have been collected using the previously
described test procedures and quality control (QC) measures, and are presented at the prototype
scale. Appendix B provides resulting data from the hydraulic model testing. Data are presented
in this section in graphical form, by inlet type, and qualitative observations are made concerning
the performance of the Type C and D inlets. Figure 3-1 through Figure 3-6 provide the stage-
discharge relationships for each inlet configuration. The entire collected data set is presented in
tabular form in Appendix B, where it is organized by: test ID number, inlet configuration, depth,
and flow.
0
10
20
30
40
50
60
70
0.5 1 1.5 2 2.5 3 3.5
depth (ft)
flo
w (
cfs
)
0 deg 10 deg 20 deg 30 deg
Figure 3-1: Type C inlet
23
0
10
20
30
40
50
60
70
1.5 2 2.5 3 3.5 4 4.5
depth (ft)
flo
w (
cfs
)
0 deg 10 deg 20 deg 30 deg
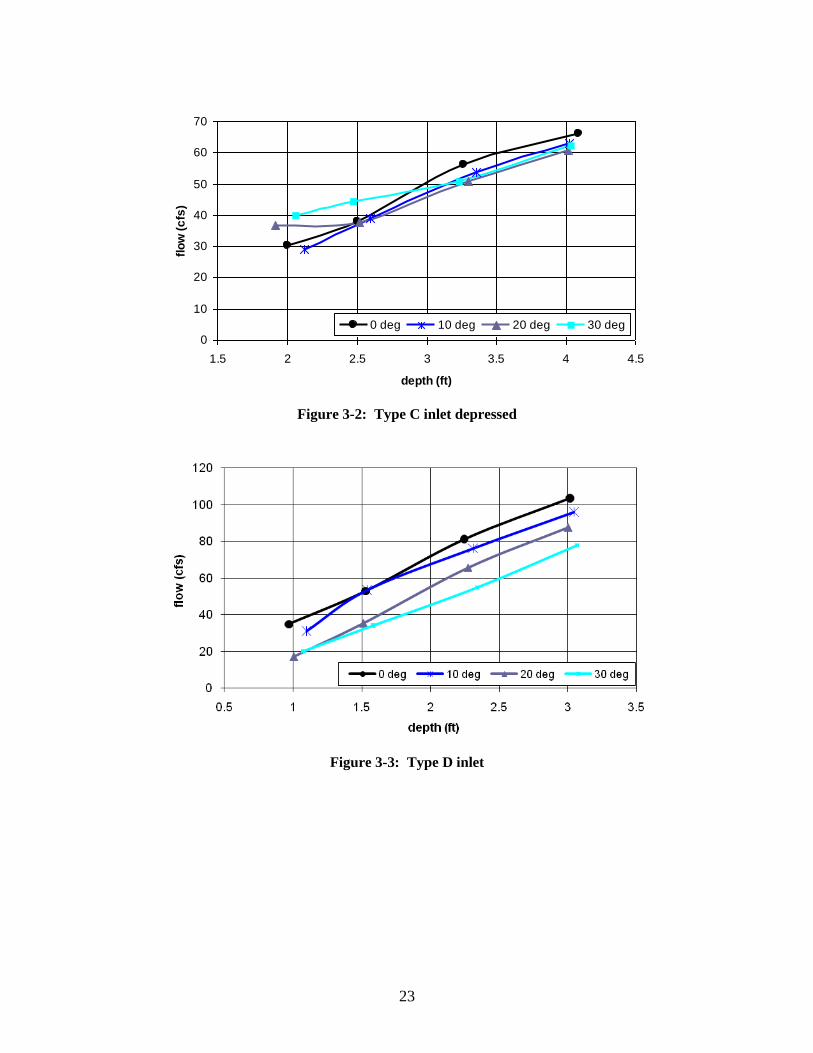
Figure 3-2: Type C inlet depressed
Figure 3-3: Type D inlet

24
Figure 3-4: Type D inlet depressed
Figure 3-5: Type D inlet rotated

25
Figure 3-6: Type D inlet depressed and rotated
Several trends were observed during testing and in the test data:
The stage-discharge relationship for a given inlet configuration was greatly affected
by the magnitude of vortex formation. A larger vortex resulted in less flow passing
for a given flow depth.
Large changes in flow depth often resulted from small changes in flow when vortex
formation occurred.
As inlet angle increased, the flow through the inlet generally increased for a given
flow depth.
Debris tend to stick as high up a grate as the flow depth will allow (i.e., at the water
surface).
After debris stick to a grate surface, flow depth typically increased due to the reduced
flow area.
For the 0- and 10-degree grate angles, the stage-discharge relationship often exhibited
a convex curve shape commonly found with orifice flow.
For the 20- and 30-degree grate angles, the stage-discharge relationship often
exhibited a concave curve shape commonly found with weir flow.

26
4 SUMMARY
A research program was conducted at Colorado State University to evaluate the
performance of the Colorado Department of Transportation Type C and D highway median
storm drain inlets. A 3:1 Froude-scale model of a highway median was designed and constructed
at the Engineering Research Center of CSU. The model consisted of a constructed highway
median channel with one interchangeable inlet. A total of 120 hydraulic tests, including twenty-
four debris tests, were conducted from September 2009 to June 2010. Variations in inlet
configuration and grate angle were investigated to provide flow-depth and discharge data.
Resulting stage-discharge data were tabulated and plotted, and several qualitative observations
were reported regarding the hydraulic conditions during testing and debris assessments.

27
REFERENCES
Julien, P. Y. (2002). River Mechanics. New York, NY: Cambridge University Press.
U. S. Bureau of Reclamation (2001). Water Measurement Manual. Third Edition, U. S.
Department of the Interior, Denver, CO.
Urban Drainage and Flood Control District (2008). Urban Storm Drainage Criteria Manual.
Denver, CO.

28
APPENDIX A
GRATE AND INLET SCHEMATICS

29
(a) plan view
Figure A-1: Type C inlet schematics

30
(b) Section B-B
(c) Section A-A
Figure A-1 (continued): Type C inlet schematics
31
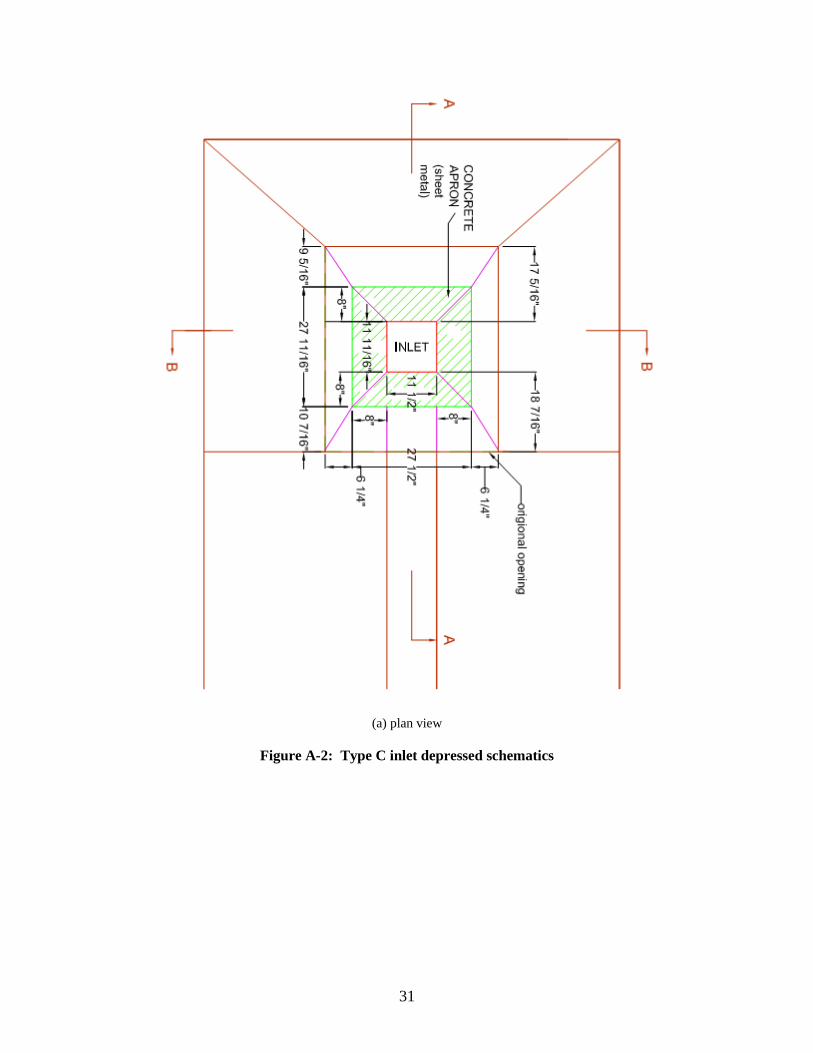
(a) plan view
Figure A-2: Type C inlet depressed schematics

32
(b) Section B-B
(c) Section A-A
Figure A-2 (continued): Type C inlet depressed schematics

33
(a) plan view
Figure A-3: Type D inlet schematics

34
(b) Section B-B
(c) Section A-A
Figure A-3 (continued): Type D inlet schematics
35
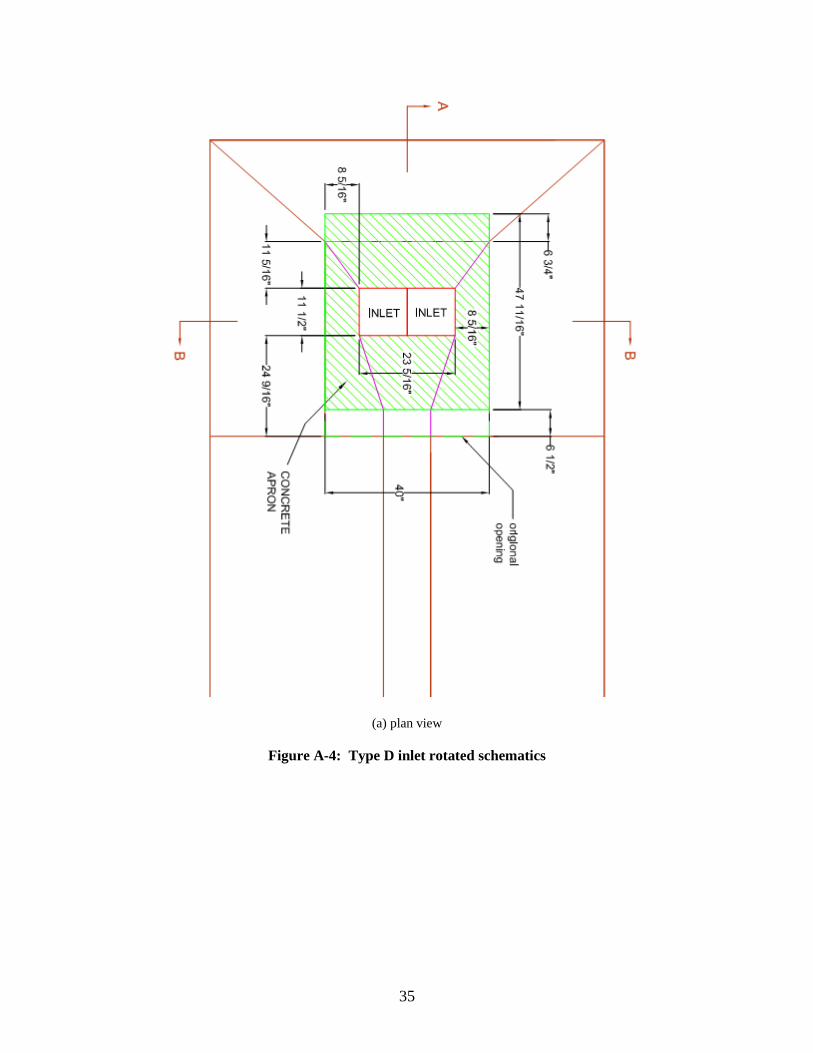
(a) plan view
Figure A-4: Type D inlet rotated schematics
36
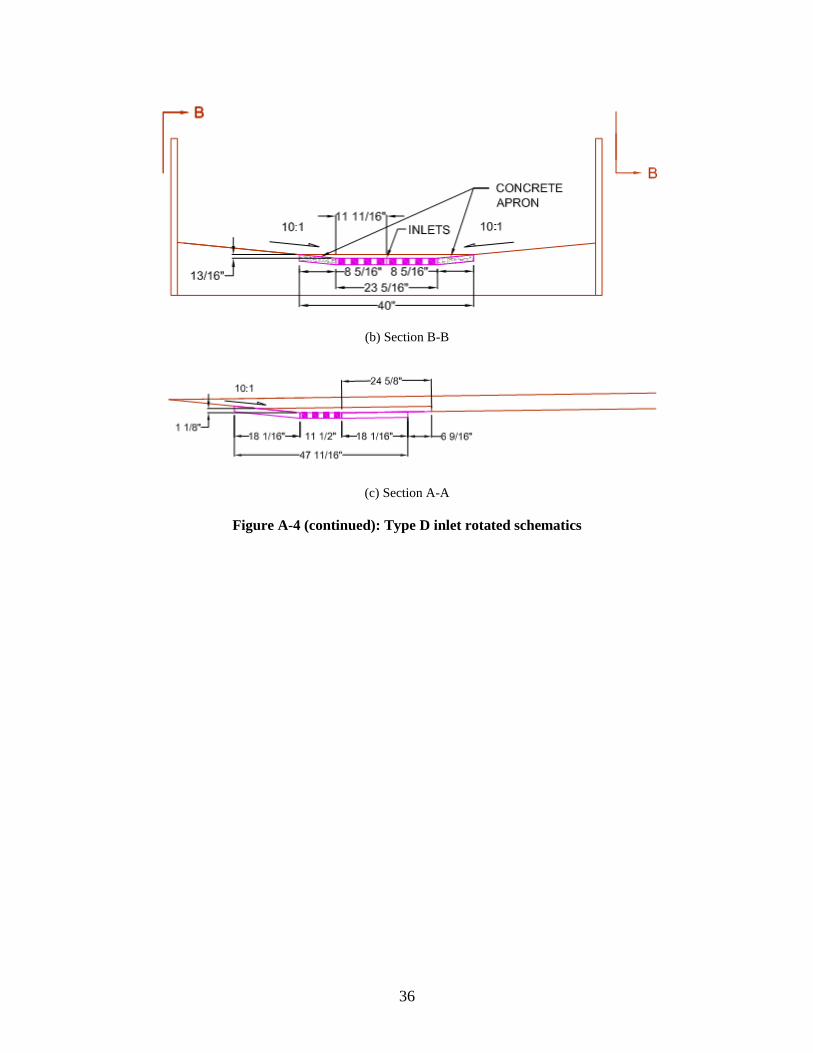
(b) Section B-B
(c) Section A-A
Figure A-4 (continued): Type D inlet rotated schematics

37
(a) plan view
Figure A-5: Type D inlet depressed schematics

38
(b) Section B-B
(c) Section A-A
Figure A-5 (continued): Type D inlet depressed schematics

39
(a) plan view
Figure A-6: Type D inlet rotated and depressed schematics

40
(b) Section B-B
(c) Section A-A
Figure A-6 (continued): Type D inlet rotated and depressed schematics

41
(a) plan view
(b) profile view
Figure A-7: Grate schematics
42
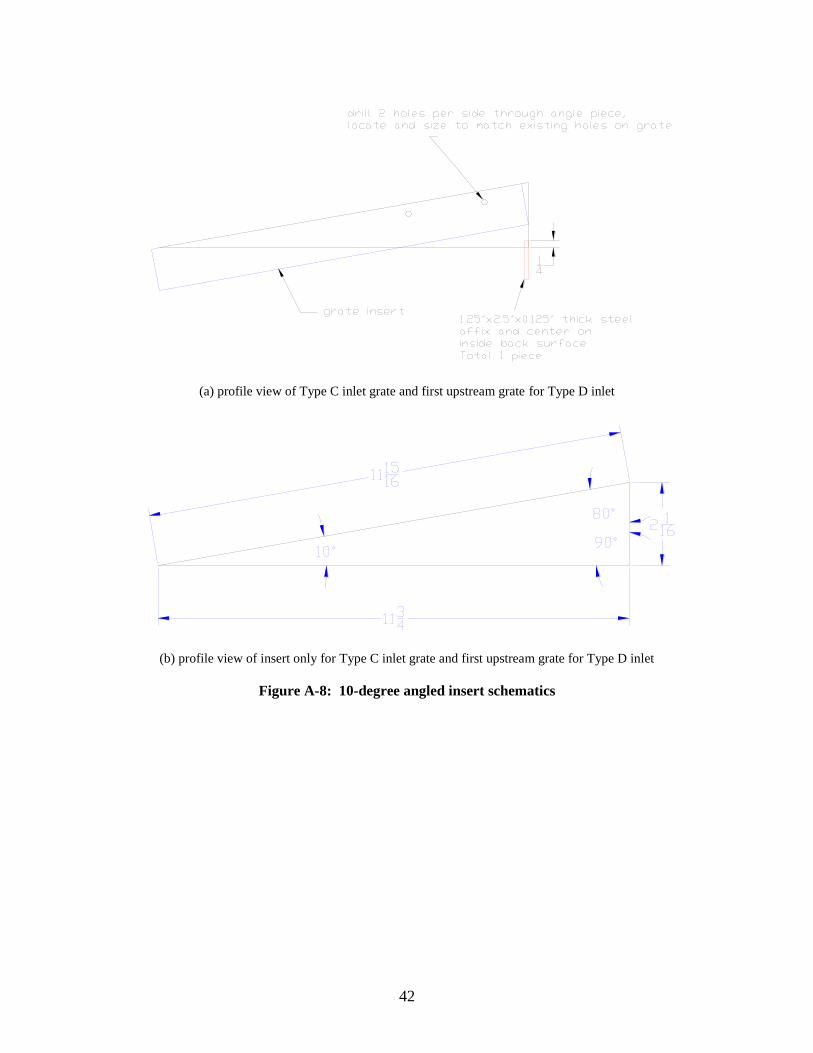
(a) profile view of Type C inlet grate and first upstream grate for Type D inlet
(b) profile view of insert only for Type C inlet grate and first upstream grate for Type D inlet
Figure A-8: 10-degree angled insert schematics

43
(c) profile view of Type D inlet downstream grate
(d) profile view of insert only for Type D inlet downstream grate
Figure A-8 (continued): 10-degree angled insert schematics
44
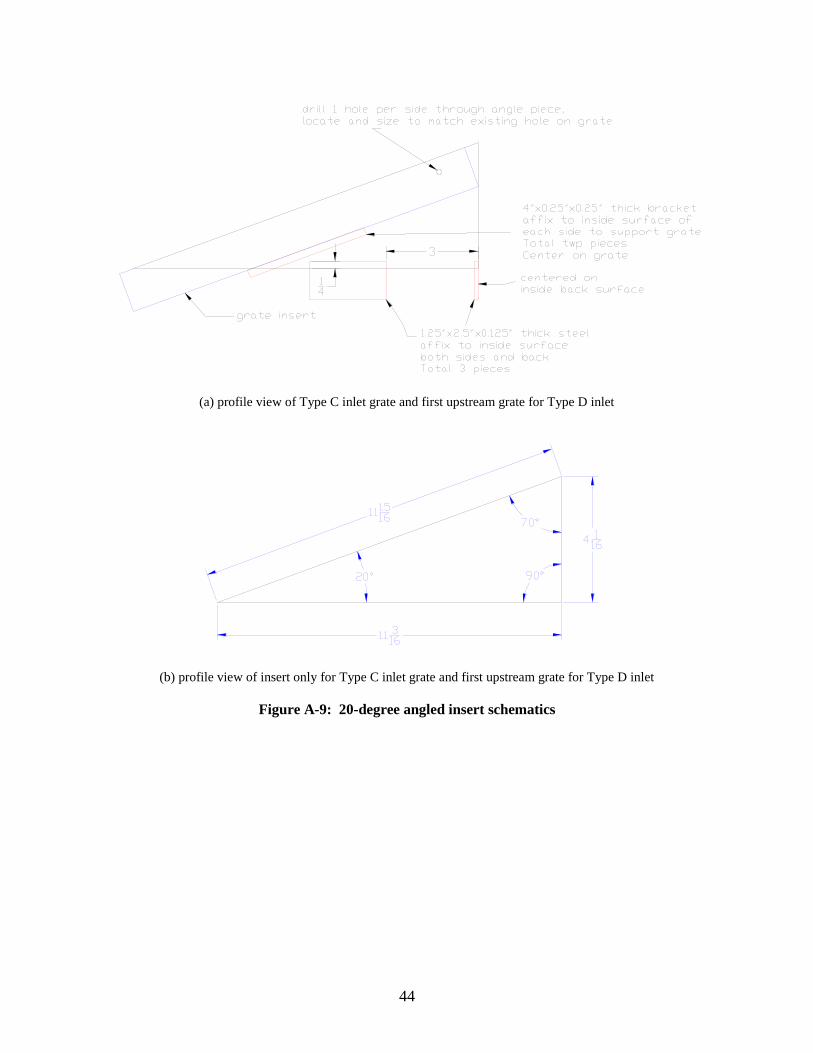
(a) profile view of Type C inlet grate and first upstream grate for Type D inlet
(b) profile view of insert only for Type C inlet grate and first upstream grate for Type D inlet
Figure A-9: 20-degree angled insert schematics
45
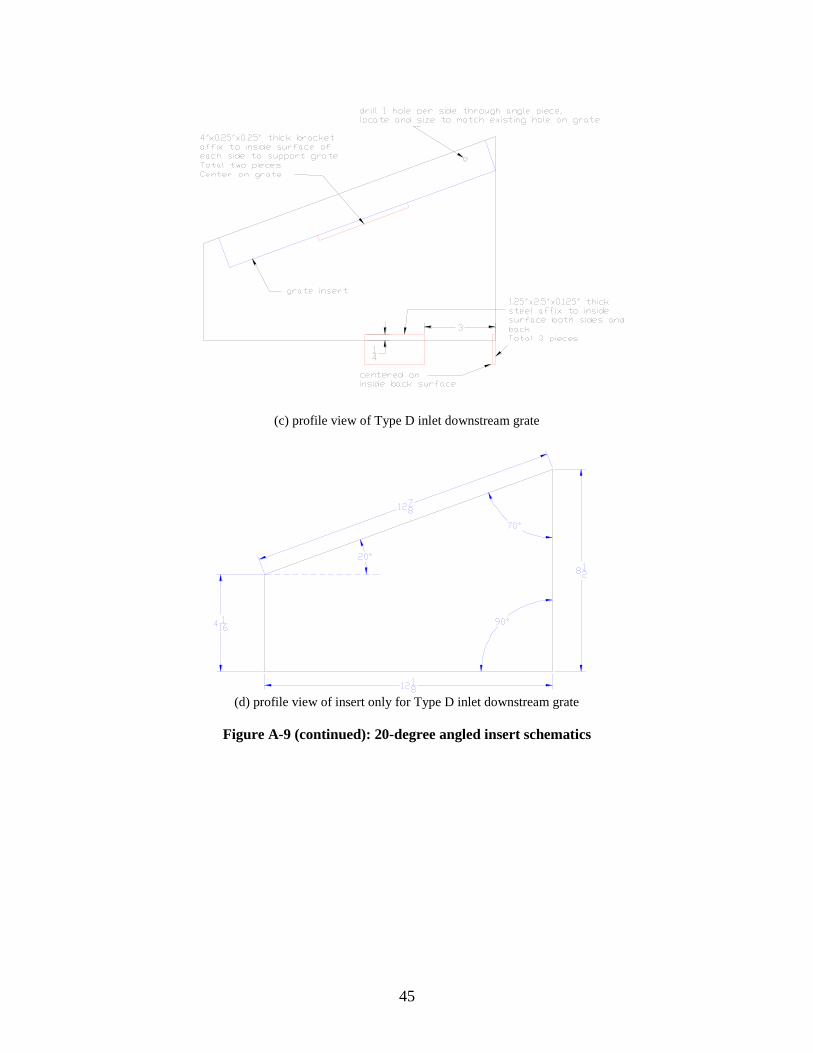
(c) profile view of Type D inlet downstream grate
(d) profile view of insert only for Type D inlet downstream grate
Figure A-9 (continued): 20-degree angled insert schematics

46
(a) profile view of Type C inlet grate and first upstream grate for Type D inlet
(b) profile view of insert only for Type C inlet grate and first upstream grate for Type D inlet
Figure A-10: 30-degree angled insert schematics

47
(c) profile view of Type D inlet downstream grate
(d) profile view of insert only for Type D inlet downstream grate
Figure A-10 (continued): 30-degree angled insert schematics

48
(a) plan view and Section A-A
Figure A-11: Median section schematics

49
(b) plan view with stationing
(c) Section B-B
(d) Section C-C
Figure A-11 (continued): Median section schematics

50
APPENDIX B
TEST DATA

51
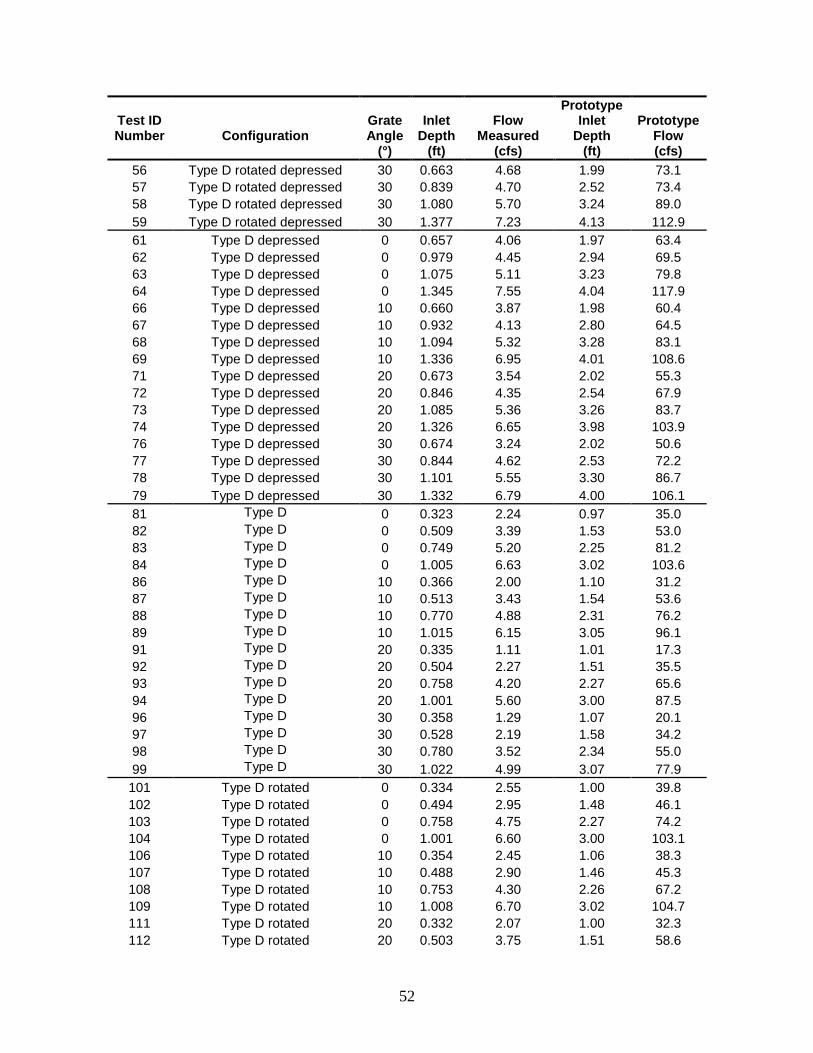
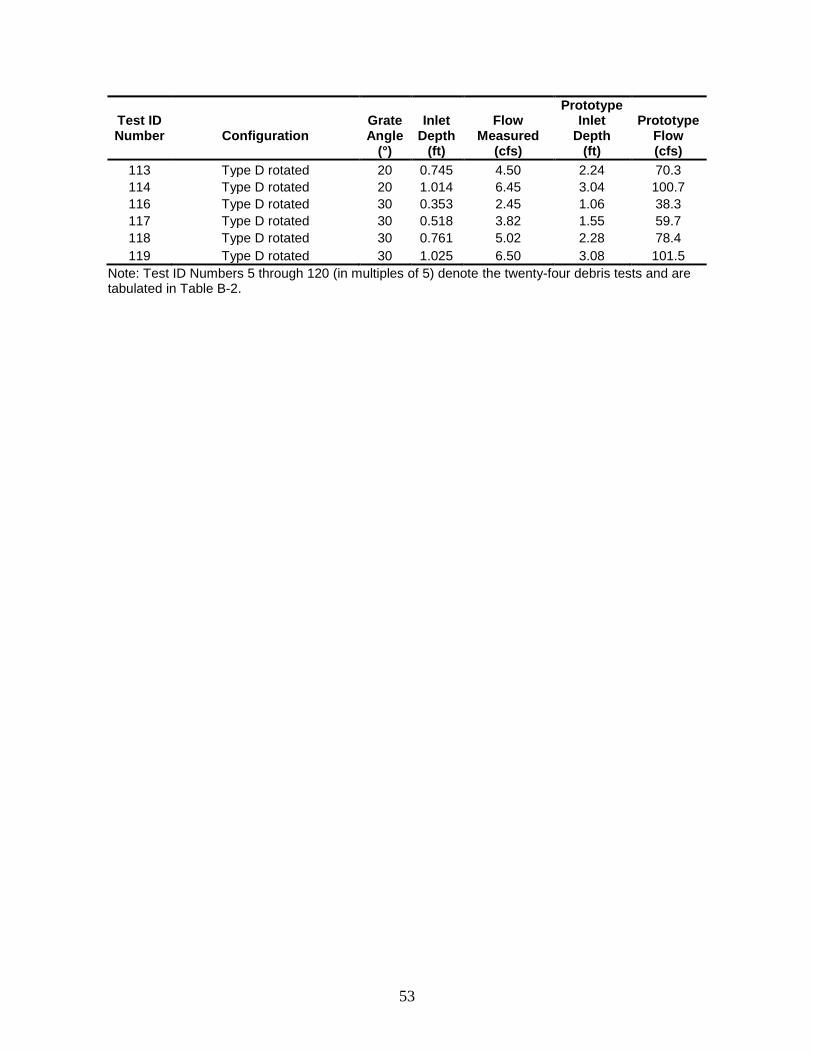
Table B-1: Test data for inlets
Test ID Number
Configuration
Grate Angle
(°)
Inlet Depth
(ft)
Flow Measured
(cfs)
Prototype Inlet
Depth (ft)
Prototype Flow (cfs)
1 Type C 0 0.352 1.84 1.06 28.7
2 Type C 0 0.513 2.46 1.54 38.4
3 Type C 0 0.795 3.39 2.39 53.0
4 Type C 0 1.037 3.75 3.11 58.6
6 Type C 10 0.370 1.85 1.11 28.9
7 Type C 10 0.528 2.46 1.58 38.4
8 Type C 10 0.765 3.14 2.30 49.0
9 Type C 10 1.044 3.62 3.13 56.5
11 Type C 20 0.369 1.72 1.11 26.9
12 Type C 20 0.506 2.24 1.52 35.0
13 Type C 20 0.798 2.98 2.39 46.5
14 Type C 20 0.989 3.41 2.97 53.3
16 Type C 30 0.362 1.53 1.09 23.9
17 Type C 30 0.516 2.24 1.55 35.0
18 Type C 30 0.748 2.86 2.24 44.7
19 Type C 30 1.008 3.50 3.02 54.7
21 Type C depressed 0 0.668 1.95 2.00 30.5
22 Type C depressed 0 0.834 2.43 2.50 38.0
23 Type C depressed 0 1.089 3.60 3.27 56.2
24 Type C depressed 0 1.365 4.23 4.10 66.1
26 Type C depressed 10 0.707 1.87 2.12 29.2
27 Type C depressed 10 0.864 2.50 2.59 39.1
28 Type C depressed 10 1.118 3.43 3.35 53.6
29 Type C depressed 10 1.341 4.04 4.02 63.1
31 Type C depressed 20 0.639 2.35 1.92 36.7
32 Type C depressed 20 0.840 2.42 2.52 37.8
33 Type C depressed 20 1.098 3.25 3.29 50.8
34 Type C depressed 20 1.337 3.89 4.01 60.8
36 Type C depressed 30 0.685 2.55 2.06 39.8
37 Type C depressed 30 0.825 2.84 2.48 44.4
38 Type C depressed 30 1.078 3.25 3.23 50.8
39 Type C depressed 30 1.345 3.99 4.04 62.3
41 Type D rotated depressed 0 0.632 4.46 1.90 69.7
42 Type D rotated depressed 0 0.849 3.80 2.55 59.4
43 Type D rotated depressed 0 1.080 5.55 3.24 86.7
44 Type D rotated depressed 0 1.354 7.93 4.06 123.9
46 Type D rotated depressed 10 0.638 4.16 1.91 65.0
47 Type D rotated depressed 10 0.856 3.44 2.57 53.7
48 Type D rotated depressed 10 1.074 5.06 3.22 79.0
49 Type D rotated depressed 10 1.327 7.68 3.98 120.0
51 Type D rotated depressed 20 0.673 4.27 2.02 66.7
52 Type D rotated depressed 20 0.826 3.85 2.48 60.1
53 Type D rotated depressed 20 1.083 5.12 3.25 80.0
54 Type D rotated depressed 20 1.341 6.97 4.02 108.9
52
Test ID Number
Configuration
Grate Angle
(°)
Inlet Depth
(ft)
Flow Measured
(cfs)
Prototype Inlet
Depth (ft)
Prototype Flow (cfs)
56 Type D rotated depressed 30 0.663 4.68 1.99 73.1
57 Type D rotated depressed 30 0.839 4.70 2.52 73.4
58 Type D rotated depressed 30 1.080 5.70 3.24 89.0
59 Type D rotated depressed 30 1.377 7.23 4.13 112.9
61 Type D depressed 0 0.657 4.06 1.97 63.4
62 Type D depressed 0 0.979 4.45 2.94 69.5
63 Type D depressed 0 1.075 5.11 3.23 79.8
64 Type D depressed 0 1.345 7.55 4.04 117.9
66 Type D depressed 10 0.660 3.87 1.98 60.4
67 Type D depressed 10 0.932 4.13 2.80 64.5
68 Type D depressed 10 1.094 5.32 3.28 83.1
69 Type D depressed 10 1.336 6.95 4.01 108.6
71 Type D depressed 20 0.673 3.54 2.02 55.3
72 Type D depressed 20 0.846 4.35 2.54 67.9
73 Type D depressed 20 1.085 5.36 3.26 83.7
74 Type D depressed 20 1.326 6.65 3.98 103.9
76 Type D depressed 30 0.674 3.24 2.02 50.6
77 Type D depressed 30 0.844 4.62 2.53 72.2
78 Type D depressed 30 1.101 5.55 3.30 86.7
79 Type D depressed 30 1.332 6.79 4.00 106.1
81 Type D 0 0.323 2.24 0.97 35.0
82 Type D 0 0.509 3.39 1.53 53.0
83 Type D 0 0.749 5.20 2.25 81.2
84 Type D 0 1.005 6.63 3.02 103.6
86 Type D 10 0.366 2.00 1.10 31.2
87 Type D 10 0.513 3.43 1.54 53.6
88 Type D 10 0.770 4.88 2.31 76.2
89 Type D 10 1.015 6.15 3.05 96.1
91 Type D 20 0.335 1.11 1.01 17.3
92 Type D 20 0.504 2.27 1.51 35.5
93 Type D 20 0.758 4.20 2.27 65.6
94 Type D 20 1.001 5.60 3.00 87.5
96 Type D 30 0.358 1.29 1.07 20.1
97 Type D 30 0.528 2.19 1.58 34.2
98 Type D 30 0.780 3.52 2.34 55.0
99 Type D 30 1.022 4.99 3.07 77.9
101 Type D rotated 0 0.334 2.55 1.00 39.8
102 Type D rotated 0 0.494 2.95 1.48 46.1
103 Type D rotated 0 0.758 4.75 2.27 74.2
104 Type D rotated 0 1.001 6.60 3.00 103.1
106 Type D rotated 10 0.354 2.45 1.06 38.3
107 Type D rotated 10 0.488 2.90 1.46 45.3
108 Type D rotated 10 0.753 4.30 2.26 67.2
109 Type D rotated 10 1.008 6.70 3.02 104.7
111 Type D rotated 20 0.332 2.07 1.00 32.3
112 Type D rotated 20 0.503 3.75 1.51 58.6
53
Test ID Number
Configuration
Grate Angle
(°)
Inlet Depth
(ft)
Flow Measured
(cfs)
Prototype Inlet
Depth (ft)
Prototype Flow (cfs)
113 Type D rotated 20 0.745 4.50 2.24 70.3
114 Type D rotated 20 1.014 6.45 3.04 100.7
116 Type D rotated 30 0.353 2.45 1.06 38.3
117 Type D rotated 30 0.518 3.82 1.55 59.7
118 Type D rotated 30 0.761 5.02 2.28 78.4
119 Type D rotated 30 1.025 6.50 3.08 101.5
Note: Test ID Numbers 5 through 120 (in multiples of 5) denote the twenty-four debris tests and are tabulated in Table B-2.
54
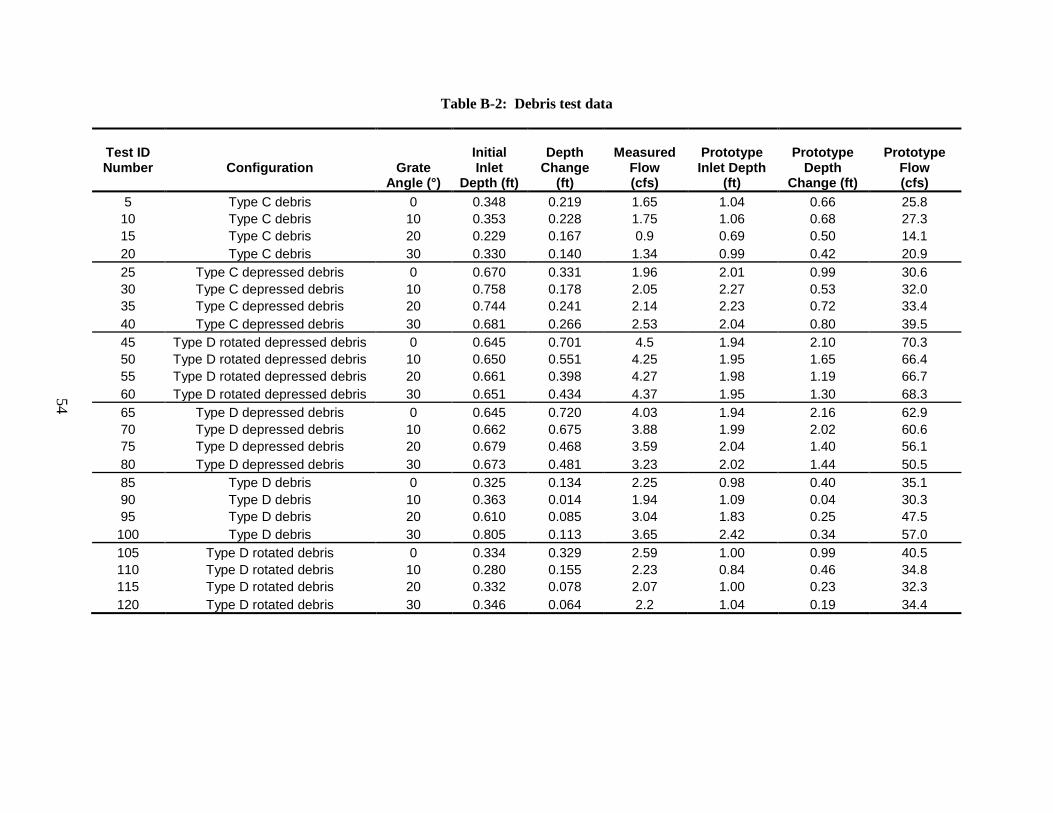
Table B-2: Debris test data
Test ID Number
Configuration
Grate
Angle (°)
Initial Inlet
Depth (ft)
Depth Change
(ft)
Measured Flow (cfs)
Prototype Inlet Depth
(ft)
Prototype Depth
Change (ft)
Prototype Flow (cfs)
5 Type C debris 0 0.348 0.219 1.65 1.04 0.66 25.8
10 Type C debris 10 0.353 0.228 1.75 1.06 0.68 27.3
15 Type C debris 20 0.229 0.167 0.9 0.69 0.50 14.1
20 Type C debris 30 0.330 0.140 1.34 0.99 0.42 20.9
25 Type C depressed debris 0 0.670 0.331 1.96 2.01 0.99 30.6
30 Type C depressed debris 10 0.758 0.178 2.05 2.27 0.53 32.0
35 Type C depressed debris 20 0.744 0.241 2.14 2.23 0.72 33.4
40 Type C depressed debris 30 0.681 0.266 2.53 2.04 0.80 39.5
45 Type D rotated depressed debris 0 0.645 0.701 4.5 1.94 2.10 70.3
50 Type D rotated depressed debris 10 0.650 0.551 4.25 1.95 1.65 66.4
55 Type D rotated depressed debris 20 0.661 0.398 4.27 1.98 1.19 66.7
60 Type D rotated depressed debris 30 0.651 0.434 4.37 1.95 1.30 68.3
65 Type D depressed debris 0 0.645 0.720 4.03 1.94 2.16 62.9
70 Type D depressed debris 10 0.662 0.675 3.88 1.99 2.02 60.6
75 Type D depressed debris 20 0.679 0.468 3.59 2.04 1.40 56.1
80 Type D depressed debris 30 0.673 0.481 3.23 2.02 1.44 50.5
85 Type D debris 0 0.325 0.134 2.25 0.98 0.40 35.1
90 Type D debris 10 0.363 0.014 1.94 1.09 0.04 30.3
95 Type D debris 20 0.610 0.085 3.04 1.83 0.25 47.5
100 Type D debris 30 0.805 0.113 3.65 2.42 0.34 57.0
105 Type D rotated debris 0 0.334 0.329 2.59 1.00 0.99 40.5
110 Type D rotated debris 10 0.280 0.155 2.23 0.84 0.46 34.8
115 Type D rotated debris 20 0.332 0.078 2.07 1.00 0.23 32.3
120 Type D rotated debris 30 0.346 0.064 2.2 1.04 0.19 34.4

55
APPENDIX C
DATA COLLECTION

56
UDFCD Median Drain Inlet Study Data Sheet
Date: Test ID number:
Operators (first initial and last name):
Start time: End time:
Water temperature (ºF):
Model Information Inlet type (circle one): Type C Type D
Inlet modification (circle one): None Depressed Rotated Rotated depressed
Grate angle (deg) (circle one): 0 10 20 30
Other:
Debris (circle one): Y N Type:
Discharge Information Mag meter reading (cfs): Weir (ft):
Depth Readings (zero at the front of the first grate; depth readings lateral to the grate center)
Zero:
Depth:
Description of Flow into Inlets and Observations (i.e., Is there a vortex and where over the inlet is it located? For the Type D inlet, which
grate has more flow? Where is the flow most turbulent over the grates? etc.)
Extent of Flow Station (x) Spread (y) Notes

57
ELECTRONIC DATA SUPPLEMENT
CONTENTS AND ORGANIZATION
(stored on a DVD)
Folder Files and/or Sub-folders
Client Final Report Microsoft Word® (.doc) and Adobe® Acrobat® (.pdf) files; and SureThing (.std) CD label file
Data and Photographs* Type C inlet Type C inlet depressed Type D inlet Type D inlet depressed Type D inlet rotated Type D inlet rotated and depressed
*The reader is referred to the UDFCD for obtaining photographs and video documentation.