Calgary Housing - Rental Market Stats Dec 2015 Report
31
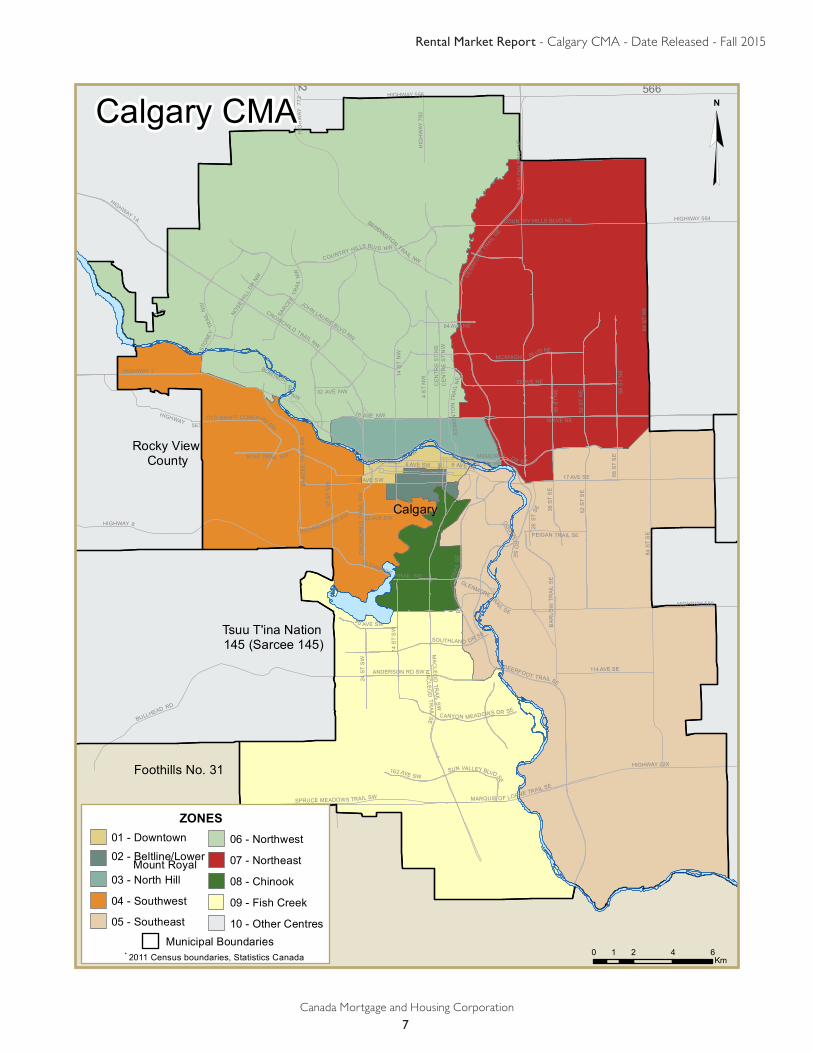
Table of Contents SUBSCRIBE NOW! Access CMHC’s Market Analysis Centre publications quickly and conveniently on the Order Desk at www.cmhc.ca/housingmarketinformation. View, print, download or subscribe to get market information e-mailed to you on the day it is released. CMHC’s electronic suite of national standardized products is available for free. Housing Market Information RENTAL MARKET REPORT Date Released: Canada Mortgage and Housing Corporation Housing market intelligence you can count on Calgary CMA Fall 2015 Highlights The apartment vacancy rate in the purpose-built rental market was 5.3 per cent in the Calgary CMA, up from 1.4 per cent in October 2014. The monthly rent for a two-bedroom apartment in new and existing structures averaged $1,332 in October 2015. In rental structures common to both the October 2014 and 2015 surveys, the average rent for two-bedroom apartments was relatively unchanged. 1 Highlights 2 Overview: Vacancies and rents in the Calgary CMA 3 Submarket Results: Vacancy rates increase in rental apartment and row units 4 Supply and Demand Factors: The stock of purpose-built rental units increases for the second consecutive year 5 Secondary Rental Market Survey: Vacancy rates move higher for condominium rental apartments 10 17.2% 06 4.5% 07 3.9% 04 2.2% 03 4.5% 01 6.9% 02 4.8% 05 4.4% 09 7.8% 08 4.0% 76 HIGHWAY 772 N Legend 2015 vacancy rate for Zone 01 ç Vacancy rate in 2015 the same as 2014 Vacancy rate in 2015 higher than 2014 Vacancy rate in 2015 lower than 2014 6.9% The 2015 apartment vacancy rate for the Calgary CMA is : 5.3% 0 3.5 7 1.75 Km Figure 1
-
Upload
jerry-charlton -
Category
Real Estate
-
view
211 -
download
0
Transcript of Calgary Housing - Rental Market Stats Dec 2015 Report
Table of Contents
SUBSCRIBE NOW!Access CMHC’s Market Analysis Centre publications quickly and conveniently on the Order Desk at www.cmhc.ca/housingmarketinformation. View, print, download or subscribe to get market information e-mailed to you on the day it is released. CMHC’s electronic suite of national standardized products is available for free.
H o u s i n g M a r k e t I n f o r m a t i o n
RENTAL MARKET REPORT
Date Released:
C a n a d a M o r t g a g e a n d H o u s i n g C o r p o r a t i o n
Housing market intelligence you can count on
Calgary CMA
Fall 2015
Highlights�� The apartment vacancy rate in the purpose-built rental market was 5.3 per
cent in the Calgary CMA, up from 1.4 per cent in October 2014.
�� The monthly rent for a two-bedroom apartment in new and existing structures averaged $1,332 in October 2015.
�� In rental structures common to both the October 2014 and 2015 surveys, the average rent for two-bedroom apartments was relatively unchanged.
1 Highlights
2 Overview: Vacancies and rents in the Calgary CMA
3 Submarket Results: Vacancy rates increase in rental apartment and row units
4 Supply and Demand Factors: The stock of purpose-built rental units increases for the second consecutive year
5 Secondary Rental Market Survey: Vacancy rates move higher for condominium rental apartments
1017.2%
064.5% 07
3.9%
042.2%
034.5%
016.9%
024.8%
054.4%
097.8%
084.0%
766 H
IGH
WA
Y 772 N
Legend2015 vacancy rate for Zone 01
ç Vacancy rate in 2015 the same as 2014
Vacancy rate in 2015 higher than 2014
Vacancy rate in 2015 lower than 2014
6.9%
The 2015 apartment vacancy rate for the Calgary CMA is : 5.3%
0 3.5 71.75 Km
Figure 1
Rental Market Report - Calgary CMA - Date Released - Fall 2015
Canada Mortgage and Housing Corporation
2
Primary Rental Market Survey
Overview: Vacancies and rents in the Calgary CMA
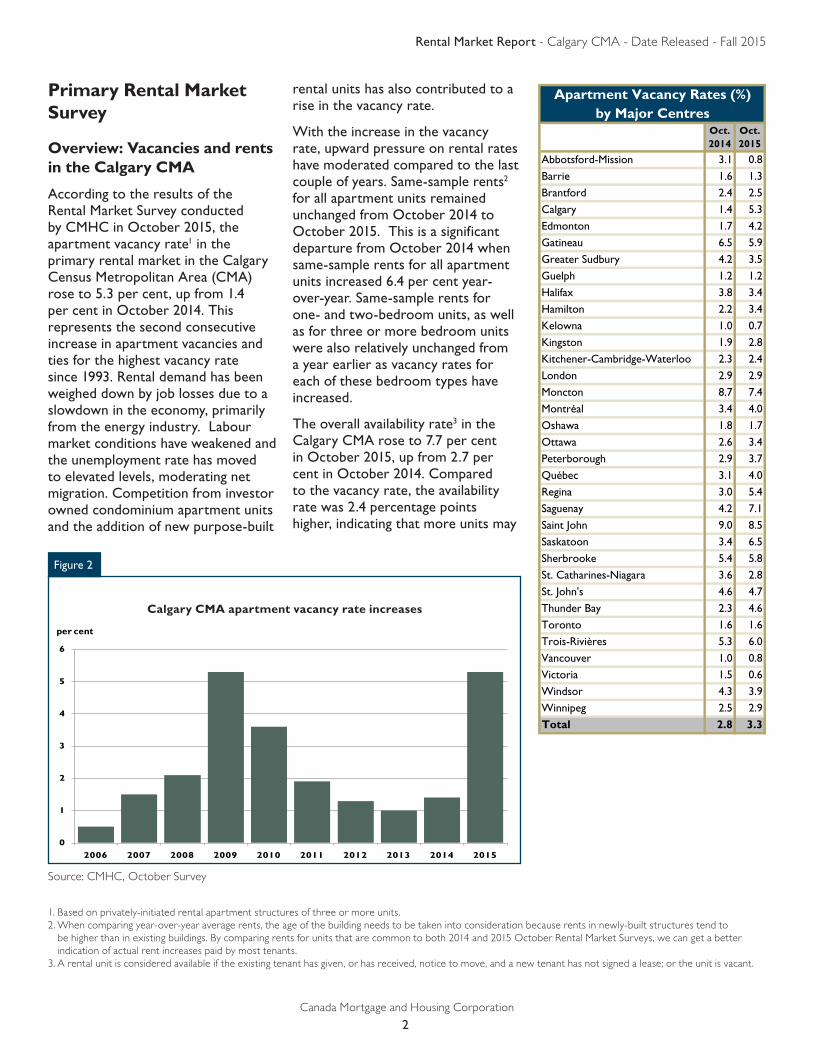
According to the results of the Rental Market Survey conducted by CMHC in October 2015, the apartment vacancy rate1 in the primary rental market in the Calgary Census Metropolitan Area (CMA) rose to 5.3 per cent, up from 1.4 per cent in October 2014. This represents the second consecutive increase in apartment vacancies and ties for the highest vacancy rate since 1993. Rental demand has been weighed down by job losses due to a slowdown in the economy, primarily from the energy industry. Labour market conditions have weakened and the unemployment rate has moved to elevated levels, moderating net migration. Competition from investor owned condominium apartment units and the addition of new purpose-built
rental units has also contributed to a rise in the vacancy rate.
With the increase in the vacancy rate, upward pressure on rental rates have moderated compared to the last couple of years. Same-sample rents2 for all apartment units remained unchanged from October 2014 to October 2015. This is a significant departure from October 2014 when same-sample rents for all apartment units increased 6.4 per cent year-over-year. Same-sample rents for one- and two-bedroom units, as well as for three or more bedroom units were also relatively unchanged from a year earlier as vacancy rates for each of these bedroom types have increased.
The overall availability rate3 in the Calgary CMA rose to 7.7 per cent in October 2015, up from 2.7 per cent in October 2014. Compared to the vacancy rate, the availability rate was 2.4 percentage points higher, indicating that more units may
Apartment Vacancy Rates (%)by Major Centres
Oct.2014
Oct.2015
Abbotsford-Mission 3.1 0.8
Barrie 1.6 1.3
Brantford 2.4 2.5
Calgary 1.4 5.3
Edmonton 1.7 4.2
Gatineau 6.5 5.9
Greater Sudbury 4.2 3.5
Guelph 1.2 1.2
Halifax 3.8 3.4
Hamilton 2.2 3.4
Kelowna 1.0 0.7
Kingston 1.9 2.8
Kitchener-Cambridge-Waterloo 2.3 2.4
London 2.9 2.9
Moncton 8.7 7.4
Montréal 3.4 4.0
Oshawa 1.8 1.7
Ottawa 2.6 3.4
Peterborough 2.9 3.7
Québec 3.1 4.0
Regina 3.0 5.4
Saguenay 4.2 7.1
Saint John 9.0 8.5
Saskatoon 3.4 6.5
Sherbrooke 5.4 5.8
St. Catharines-Niagara 3.6 2.8
St. John's 4.6 4.7
Thunder Bay 2.3 4.6
Toronto 1.6 1.6
Trois-Rivières 5.3 6.0
Vancouver 1.0 0.8
Victoria 1.5 0.6
Windsor 4.3 3.9
Winnipeg 2.5 2.9
Total 2.8 3.3
0
1
2
3
4
5
6
2006 2007 2008 2009 2010 2011 2012 2013 2014 2015
Source: CMHC, October Survey
Figure 2
Calgary CMA apartment vacancy rate increases
per cent
1. Based on privately-initiated rental apartment structures of three or more units.2. When comparing year-over-year average rents, the age of the building needs to be taken into consideration because rents in newly-built structures tend to
be higher than in existing buildings. By comparing rents for units that are common to both 2014 and 2015 October Rental Market Surveys, we can get a better indication of actual rent increases paid by most tenants.
3. A rental unit is considered available if the existing tenant has given, or has received, notice to move, and a new tenant has not signed a lease; or the unit is vacant.
Rental Market Report - Calgary CMA - Date Released - Fall 2015
Canada Mortgage and Housing Corporation
3
become vacant in the next couple of months. Further moderation in rental demand is expected as other industries including the energy sector shed more jobs towards the end of 2015 and into the beginning of 2016. The availability rate was the highest among one- and two-bedroom units at 7.7 and 8.2 per cent, respectively. For bachelor units, the availability rate increased from 2.3 per cent in October 2014 to 4.3 per cent in October 2015. Units with three or more bedrooms recorded an availability rate of 6.0 per cent in October 2015, up from 2.8 per in the same month a year earlier.
Submarket results: Vacancy rates increase in rental apartment and row units
The apartment vacancy rate for every zone in the Calgary CMA rose in October 2015 compared October 2014. The city of Calgary recorded a vacancy rate of 4.9 per cent in October 2015, up from 1.4 per cent in the same month in 2014. The Downtown zone had one of the highest vacancy rates in the city of Calgary at 6.9 per cent. This zone is home to many oil and gas companies
that have laid-off workers due to low oil prices. The highest vacancy rate in the Calgary CMA was in Other Centres, which includes centres such as Cochrane, Chestermere and Airdrie. This zone reported a vacancy rate of 17.2 per cent in October 2015, up from 1.2 per cent in October 2014. While the elevated vacancy rate can be partly attributed to a slowdown in economic activity, the supply of purpose-built rental units in this zone more than doubled from the previous year.
The vacancy rate for the various bedroom types in the Calgary CMA rose year-over-year in October 2015. The vacancy rate for two-bedroom units was among the highest at 6.0 per cent, increasing from 1.6 per cent in October 2014. Part of the increase in the vacancy rate was due to the addition of 655 two-bedroom units in 2015. For bachelor units, the vacancy rate was 2.4 per cent in this year’s survey, up from 1.1 per cent in October 2014. Both one-bedroom units and apartments with three or more bedrooms posted a vacancy rate of 4.9 per cent in October 2015, increasing from 1.3 per cent in October 2014.
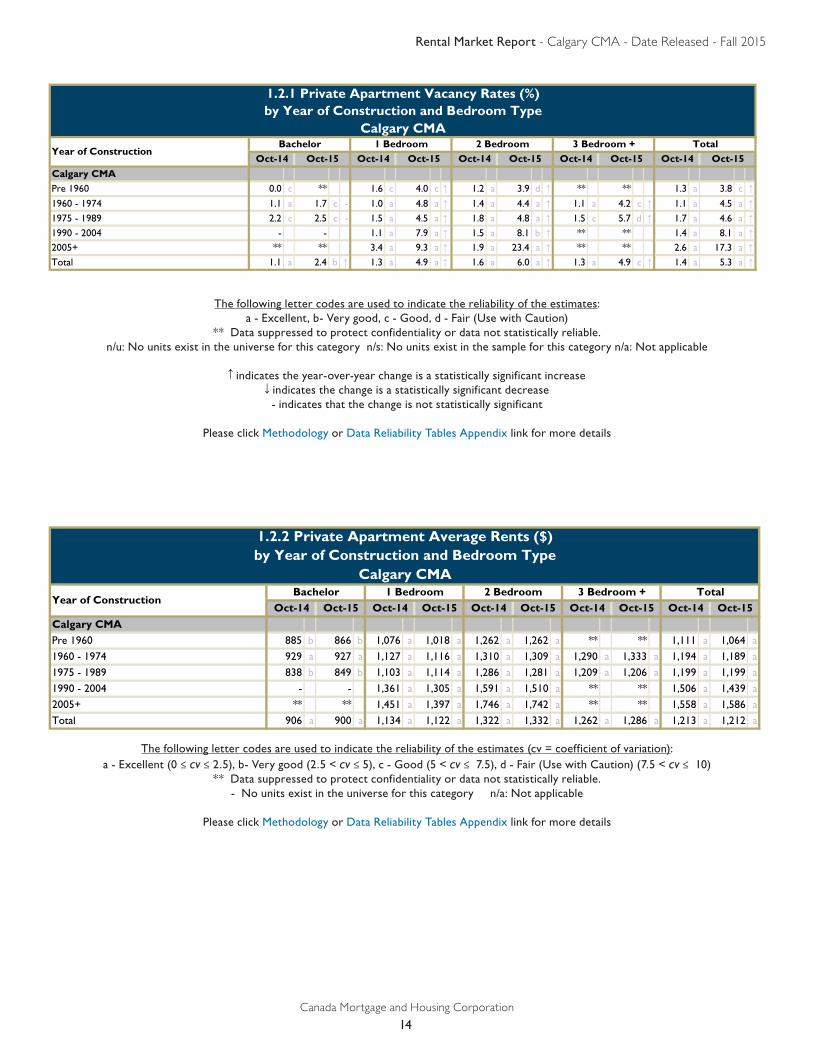
The apartment vacancy rate for structures by year of construction ranged from 3.8 per cent to 17.3 per cent, and increased in every age range compared to the previous year. The highest vacancy rate were in structures built in 2005 and later, at 17.3 per cent in October 2015, up from 2.6 per cent in October 2014. There were 865 purpose-built rental units added to the universe in 2015, mostly representing new units, some of which remained vacant after construction was completed. A vacancy rate of 8.1 per cent was found in structures built between 1990 and 2004. Vacancy rates among newer buildings can be elevated compared to older structures, as average rents are typically higher and compete with some investor owned apartment condominium units.
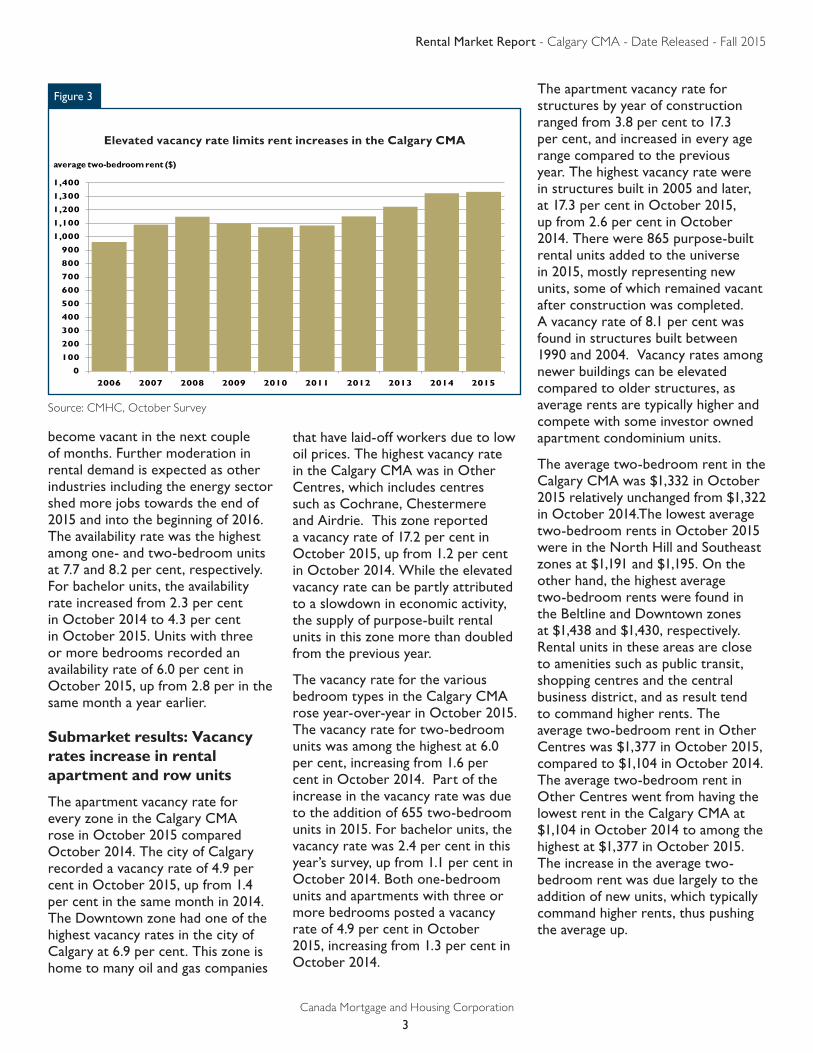
The average two-bedroom rent in the Calgary CMA was $1,332 in October 2015 relatively unchanged from $1,322 in October 2014.The lowest average two-bedroom rents in October 2015 were in the North Hill and Southeast zones at $1,191 and $1,195. On the other hand, the highest average two-bedroom rents were found in the Beltline and Downtown zones at $1,438 and $1,430, respectively. Rental units in these areas are close to amenities such as public transit, shopping centres and the central business district, and as result tend to command higher rents. The average two-bedroom rent in Other Centres was $1,377 in October 2015, compared to $1,104 in October 2014. The average two-bedroom rent in Other Centres went from having the lowest rent in the Calgary CMA at $1,104 in October 2014 to among the highest at $1,377 in October 2015. The increase in the average two-bedroom rent was due largely to the addition of new units, which typically command higher rents, thus pushing the average up.
0
100
200
300
400
500
600
700
800
900
1,000
1,100
1,200
1,300
1,400
2006 2007 2008 2009 2010 2011 2012 2013 2014 2015
Source: CMHC, October Survey
Figure 3
Elevated vacancy rate limits rent increases in the Calgary CMA
average two-bedroom rent ($)
Rental Market Report - Calgary CMA - Date Released - Fall 2015
Canada Mortgage and Housing Corporation
4
Same-sample rents for two-bedroom units declined 1.0 per cent in the Downtown zone where the vacancy rate increased to 8.1 per cent in October 2015. The Chinook zone also posted a decline in same-sample two-bedroom rents while rents in the Beltline, North Hill and Northeast were relatively unchanged from the previous year. Despite the increase in vacancy rates in every zone in the Calgary CMA, some zones posted an increase in same-sample rents. These zones include the Southwest, Northwest, Fish Creek and Other Centres.
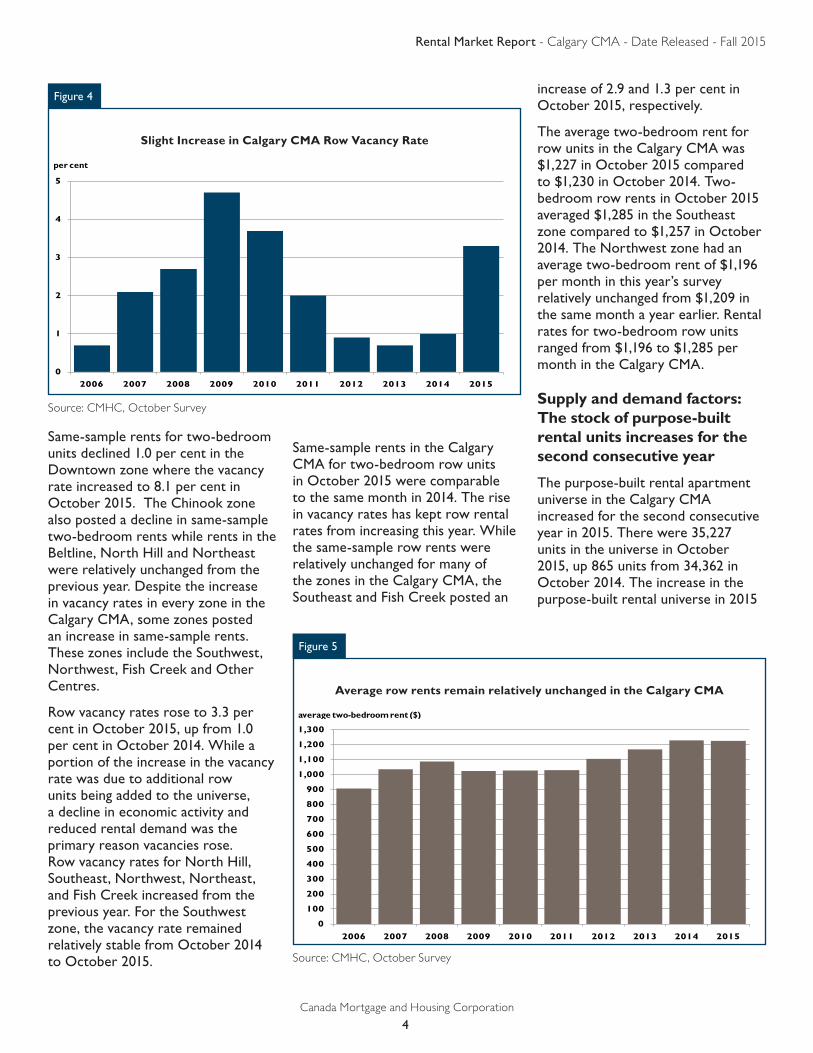
Row vacancy rates rose to 3.3 per cent in October 2015, up from 1.0 per cent in October 2014. While a portion of the increase in the vacancy rate was due to additional row units being added to the universe, a decline in economic activity and reduced rental demand was the primary reason vacancies rose. Row vacancy rates for North Hill, Southeast, Northwest, Northeast, and Fish Creek increased from the previous year. For the Southwest zone, the vacancy rate remained relatively stable from October 2014 to October 2015.
Same-sample rents in the Calgary CMA for two-bedroom row units in October 2015 were comparable to the same month in 2014. The rise in vacancy rates has kept row rental rates from increasing this year. While the same-sample row rents were relatively unchanged for many of the zones in the Calgary CMA, the Southeast and Fish Creek posted an
increase of 2.9 and 1.3 per cent in October 2015, respectively.
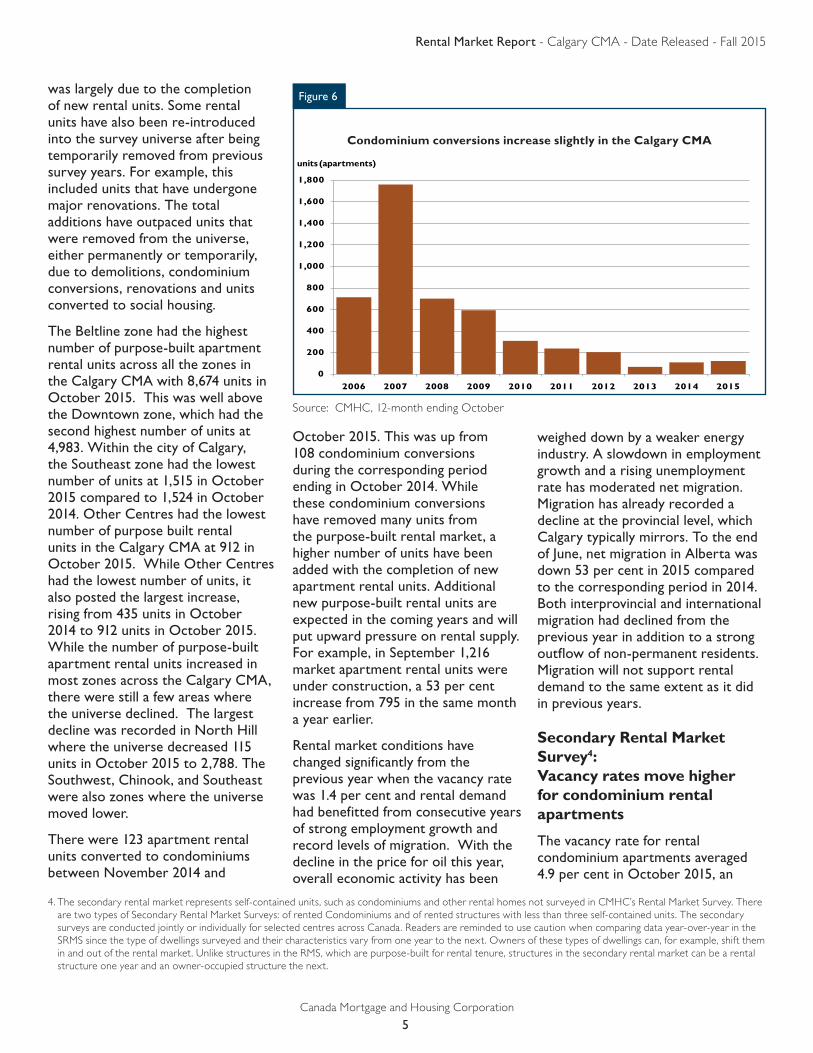
The average two-bedroom rent for row units in the Calgary CMA was $1,227 in October 2015 compared to $1,230 in October 2014. Two-bedroom row rents in October 2015 averaged $1,285 in the Southeast zone compared to $1,257 in October 2014. The Northwest zone had an average two-bedroom rent of $1,196 per month in this year’s survey relatively unchanged from $1,209 in the same month a year earlier. Rental rates for two-bedroom row units ranged from $1,196 to $1,285 per month in the Calgary CMA.
Supply and demand factors: The stock of purpose-built rental units increases for the second consecutive year
The purpose-built rental apartment universe in the Calgary CMA increased for the second consecutive year in 2015. There were 35,227 units in the universe in October 2015, up 865 units from 34,362 in October 2014. The increase in the purpose-built rental universe in 2015
0
1
2
3
4
5
2006 2007 2008 2009 2010 2011 2012 2013 2014 2015
Source: CMHC, October Survey
Figure 4
Slight Increase in Calgary CMA Row Vacancy Rate
per cent
0
100
200
300
400
500
600
700
800
900
1,000
1,100
1,200
1,300
2006 2007 2008 2009 2010 2011 2012 2013 2014 2015
Source: CMHC, October Survey
Figure 5
Average row rents remain relatively unchanged in the Calgary CMA
average two-bedroom rent ($)
Rental Market Report - Calgary CMA - Date Released - Fall 2015
Canada Mortgage and Housing Corporation
5
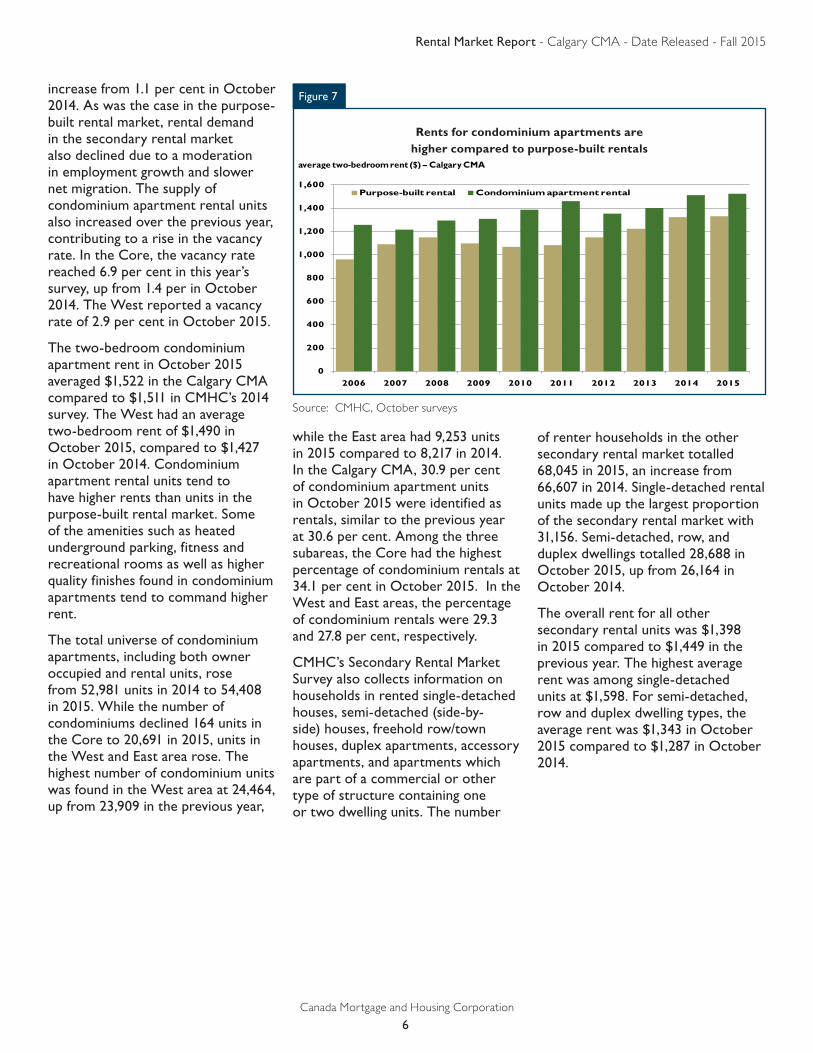
was largely due to the completion of new rental units. Some rental units have also been re-introduced into the survey universe after being temporarily removed from previous survey years. For example, this included units that have undergone major renovations. The total additions have outpaced units that were removed from the universe, either permanently or temporarily, due to demolitions, condominium conversions, renovations and units converted to social housing.
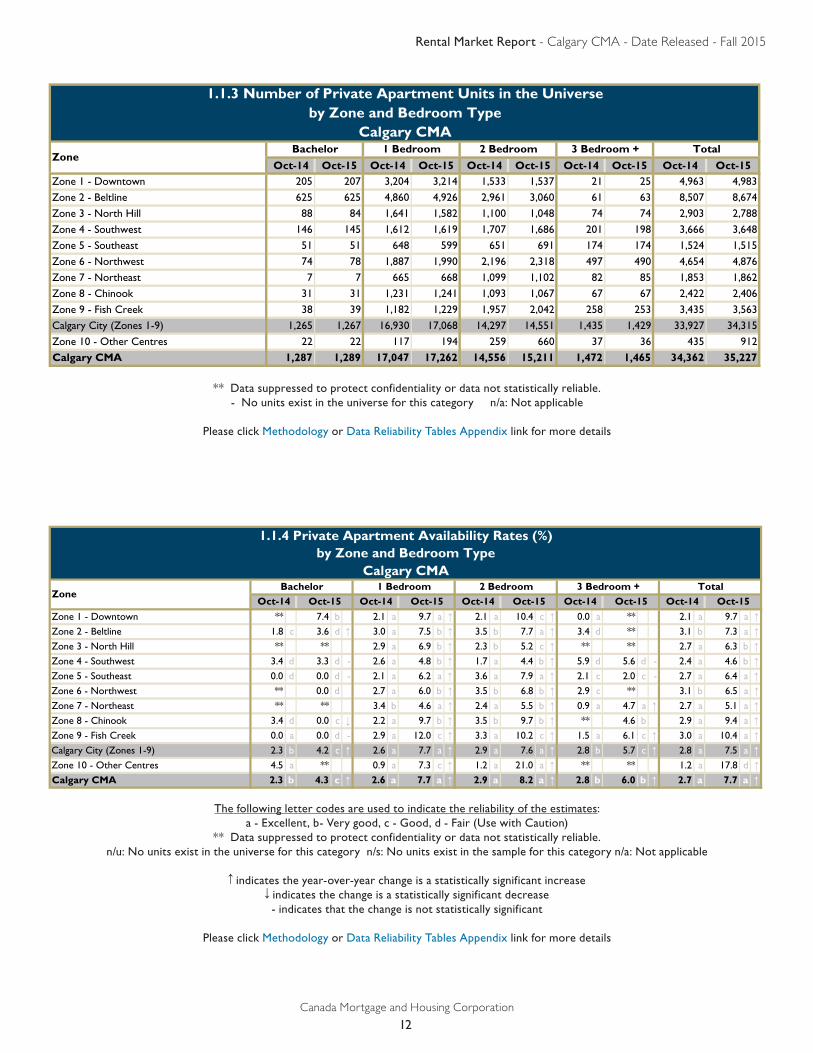
The Beltline zone had the highest number of purpose-built apartment rental units across all the zones in the Calgary CMA with 8,674 units in October 2015. This was well above the Downtown zone, which had the second highest number of units at 4,983. Within the city of Calgary, the Southeast zone had the lowest number of units at 1,515 in October 2015 compared to 1,524 in October 2014. Other Centres had the lowest number of purpose built rental units in the Calgary CMA at 912 in October 2015. While Other Centres had the lowest number of units, it also posted the largest increase, rising from 435 units in October 2014 to 912 units in October 2015. While the number of purpose-built apartment rental units increased in most zones across the Calgary CMA, there were still a few areas where the universe declined. The largest decline was recorded in North Hill where the universe decreased 115 units in October 2015 to 2,788. The Southwest, Chinook, and Southeast were also zones where the universe moved lower.
There were 123 apartment rental units converted to condominiums between November 2014 and
October 2015. This was up from 108 condominium conversions during the corresponding period ending in October 2014. While these condominium conversions have removed many units from the purpose-built rental market, a higher number of units have been added with the completion of new apartment rental units. Additional new purpose-built rental units are expected in the coming years and will put upward pressure on rental supply. For example, in September 1,216 market apartment rental units were under construction, a 53 per cent increase from 795 in the same month a year earlier.
Rental market conditions have changed significantly from the previous year when the vacancy rate was 1.4 per cent and rental demand had benefitted from consecutive years of strong employment growth and record levels of migration. With the decline in the price for oil this year, overall economic activity has been
weighed down by a weaker energy industry. A slowdown in employment growth and a rising unemployment rate has moderated net migration. Migration has already recorded a decline at the provincial level, which Calgary typically mirrors. To the end of June, net migration in Alberta was down 53 per cent in 2015 compared to the corresponding period in 2014. Both interprovincial and international migration had declined from the previous year in addition to a strong outflow of non-permanent residents. Migration will not support rental demand to the same extent as it did in previous years.
Secondary Rental Market Survey4: Vacancy rates move higher for condominium rental apartments
The vacancy rate for rental condominium apartments averaged 4.9 per cent in October 2015, an
0
200
400
600
800
1,000
1,200
1,400
1,600
1,800
2006 2007 2008 2009 2010 2011 2012 2013 2014 2015
Source: CMHC, 12-month ending October
Figure 6
Condominium conversions increase slightly in the Calgary CMA
4. The secondary rental market represents self-contained units, such as condominiums and other rental homes not surveyed in CMHC’s Rental Market Survey. There are two types of Secondary Rental Market Surveys: of rented Condominiums and of rented structures with less than three self-contained units. The secondary surveys are conducted jointly or individually for selected centres across Canada. Readers are reminded to use caution when comparing data year-over-year in the SRMS since the type of dwellings surveyed and their characteristics vary from one year to the next. Owners of these types of dwellings can, for example, shift them in and out of the rental market. Unlike structures in the RMS, which are purpose-built for rental tenure, structures in the secondary rental market can be a rental structure one year and an owner-occupied structure the next.
units (apartments)
Rental Market Report - Calgary CMA - Date Released - Fall 2015
Canada Mortgage and Housing Corporation
6
increase from 1.1 per cent in October 2014. As was the case in the purpose-built rental market, rental demand in the secondary rental market also declined due to a moderation in employment growth and slower net migration. The supply of condominium apartment rental units also increased over the previous year, contributing to a rise in the vacancy rate. In the Core, the vacancy rate reached 6.9 per cent in this year’s survey, up from 1.4 per in October 2014. The West reported a vacancy rate of 2.9 per cent in October 2015.
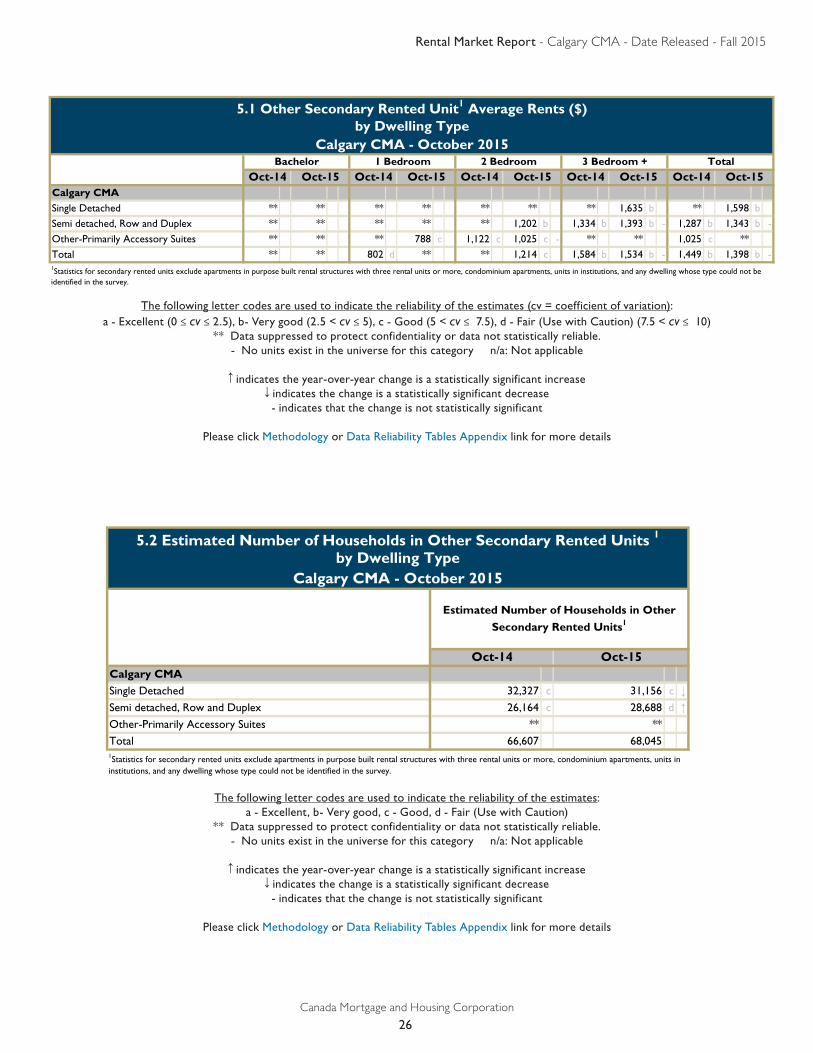
The two-bedroom condominium apartment rent in October 2015 averaged $1,522 in the Calgary CMA compared to $1,511 in CMHC’s 2014 survey. The West had an average two-bedroom rent of $1,490 in October 2015, compared to $1,427 in October 2014. Condominium apartment rental units tend to have higher rents than units in the purpose-built rental market. Some of the amenities such as heated underground parking, fitness and recreational rooms as well as higher quality finishes found in condominium apartments tend to command higher rent.
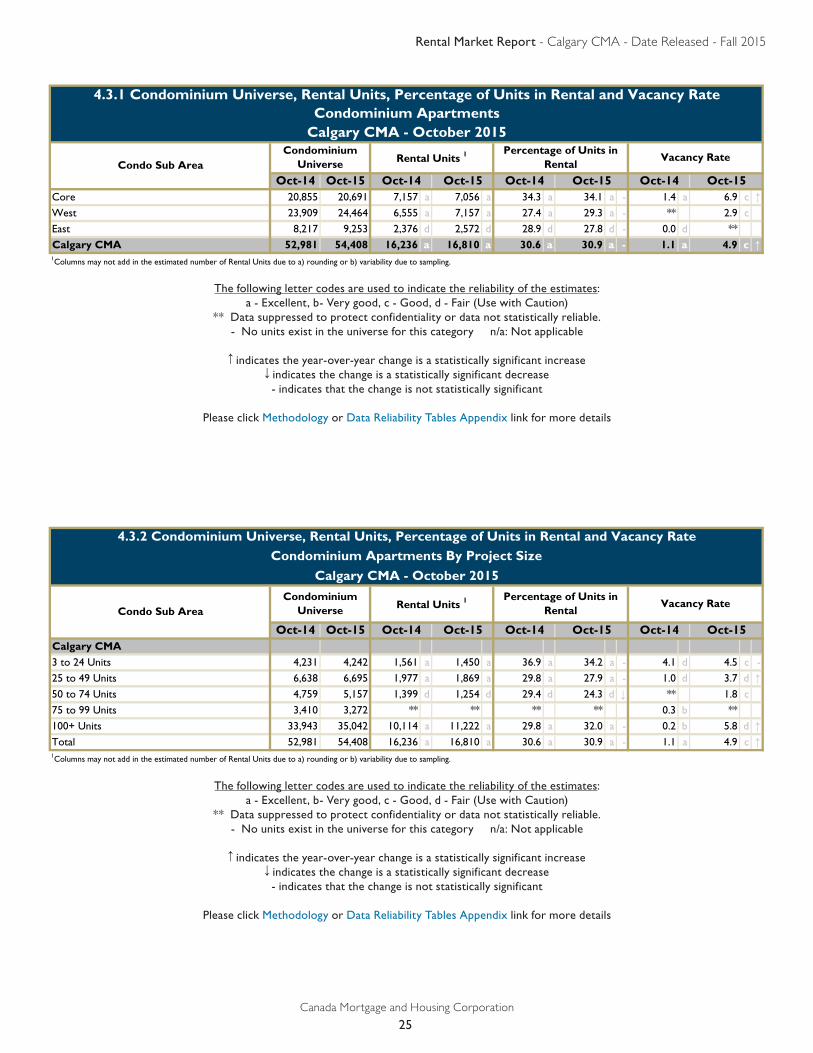
The total universe of condominium apartments, including both owner occupied and rental units, rose from 52,981 units in 2014 to 54,408 in 2015. While the number of condominiums declined 164 units in the Core to 20,691 in 2015, units in the West and East area rose. The highest number of condominium units was found in the West area at 24,464, up from 23,909 in the previous year,
while the East area had 9,253 units in 2015 compared to 8,217 in 2014. In the Calgary CMA, 30.9 per cent of condominium apartment units in October 2015 were identified as rentals, similar to the previous year at 30.6 per cent. Among the three subareas, the Core had the highest percentage of condominium rentals at 34.1 per cent in October 2015. In the West and East areas, the percentage of condominium rentals were 29.3 and 27.8 per cent, respectively.
CMHC’s Secondary Rental Market Survey also collects information on households in rented single-detached houses, semi-detached (side-by-side) houses, freehold row/town houses, duplex apartments, accessory apartments, and apartments which are part of a commercial or other type of structure containing one or two dwelling units. The number
of renter households in the other secondary rental market totalled 68,045 in 2015, an increase from 66,607 in 2014. Single-detached rental units made up the largest proportion of the secondary rental market with 31,156. Semi-detached, row, and duplex dwellings totalled 28,688 in October 2015, up from 26,164 in October 2014.
The overall rent for all other secondary rental units was $1,398 in 2015 compared to $1,449 in the previous year. The highest average rent was among single-detached units at $1,598. For semi-detached, row and duplex dwelling types, the average rent was $1,343 in October 2015 compared to $1,287 in October 2014.
0
200
400
600
800
1,000
1,200
1,400
1,600
2006 2007 2008 2009 2010 2011 2012 2013 2014 2015
Purpose-built rental Condominium apartment rental
Source: CMHC, October surveys
Figure 7
Rents for condominium apartments are higher compared to purpose-built rentals
average two-bedroom rent ($) – Calgary CMA
Rental Market Report - Calgary CMA - Date Released - Fall 2015
Canada Mortgage and Housing Corporation
7
566
772Calgary
Rocky View County
Tsuu T'ina Nation 145 (Sarcee 145)
Foothills No. 31
9 AVE SEMEMORIAL DR NW
36 S
T N
E
MARQUIS OF LORNE TRAIL SE
16 AVE NW
BOWNESS
RD
NW
52 S
T N
E
90 AVE SW
NOSE
HILL
DRNW
CROWCHILD TRAIL NW
32 AVE NEM
AC
L EO
DT R
AIL
SW
BOW TRAIL SW
COUNTRY HILLS BLVD NE
MA
CLE
OD
TR
AIL
SE
9 AVE SW
JOHN LAURIE BLVD NW
32 AVE NW
MCKNIGHT BLVD NE
SARCEE
TRA
ILN
W
17 AVE SE
HIGHWAY 22X162 AVE SW
16 AVE NE4
ST
NW
HIGHWAY 1
64 AVE NE
SOUTHLAND DR SE
STO
NEY
TRAI
LN
W
68 S
T N
E
OGDEN
RD
SE
PEIGAN TRAIL SE
BEDDINGTONTRAIL NW
14 S
T S
W
MEMORIAL DR SE
GLENMORETRAIL SW
COUNTRY HILLS BLVD NW
RICHMOND RD SW
ANDERSON RD SW
MEMORIAL DR NE
GLENMORE TRAIL
SE
CANYON MEADOWS DR SE
17 AVE SW
33 AVE SW
84 S
T N
E
HIGHWAY563
SPRUCE MEADOWS TRAIL SW
84 S
T S
E
HIGHWAY 8
12 AVE SW
HIG
HW
AY 7
72
6 AVE SW
BULLHEAD RD
114 AVE SE
HIGHWAY 564
HIGHWAY 560
HIG
HW
AY 7
82
HIGHWAY 566
HIGHWAY 1A
CE
NTR
E S
T N
E
CR
OW
CH
ILD
TR
AIL
SW
24 S
T S
W
OLD BANFF COACHRD SW
26S
TSE
DEERFOOT TRAIL SE
36 S
T S
EB
AR
LOW
TRA
ILS
E
BLA
CK
FOO
TTR
AIL
SE
52 S
T S
E
ED
MO
NTO
NTR
AIL
NE
37 S
T S
W
DEERFO
OT
TRAILNE
CE
NTR
E S
T N
W
68 S
T S
E
14 S
T N
W
1 S
T S
E
SUN VALLEY BLVDSE
SA
RC
EE
TR
AIL
SW
BA
RLO
WTR
AIL
NE
N
0 2 4 61Km
ZONES01 - Downtown
02 - Beltline/Lower Mount Royal03 - North Hill
04 - Southwest
05 - Southeast
06 - Northwest
07 - Northeast
08 - Chinook
09 - Fish Creek
10 - Other Centres*Municipal Boundaries
2011 Census boundaries, Statistics Canada*
Calgary CMA
Rental Market Report - Calgary CMA - Date Released - Fall 2015
Canada Mortgage and Housing Corporation
8
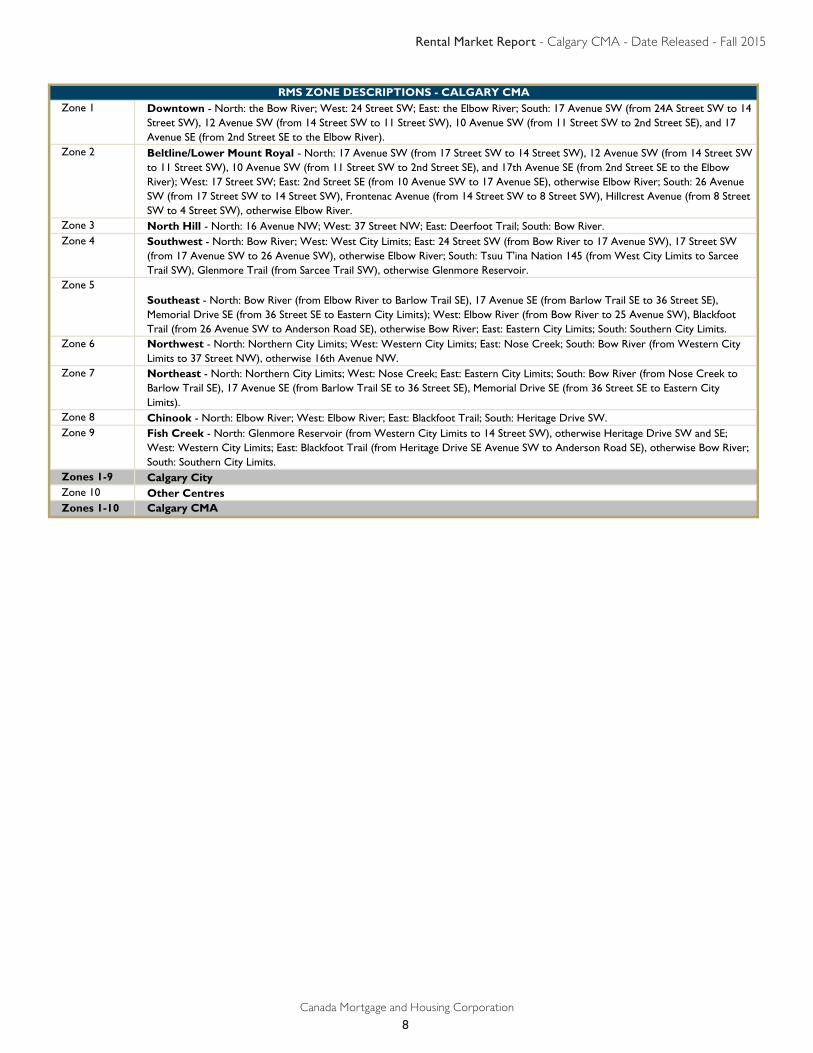
Zone 1 Downtown - North: the Bow River; West: 24 Street SW; East: the Elbow River; South: 17 Avenue SW (from 24A Street SW to 14 Street SW), 12 Avenue SW (from 14 Street SW to 11 Street SW), 10 Avenue SW (from 11 Street SW to 2nd Street SE), and 17 Avenue SE (from 2nd Street SE to the Elbow River).
Zone 2 Beltline/Lower Mount Royal - North: 17 Avenue SW (from 17 Street SW to 14 Street SW), 12 Avenue SW (from 14 Street SW to 11 Street SW), 10 Avenue SW (from 11 Street SW to 2nd Street SE), and 17th Avenue SE (from 2nd Street SE to the Elbow River); West: 17 Street SW; East: 2nd Street SE (from 10 Avenue SW to 17 Avenue SE), otherwise Elbow River; South: 26 Avenue SW (from 17 Street SW to 14 Street SW), Frontenac Avenue (from 14 Street SW to 8 Street SW), Hillcrest Avenue (from 8 Street SW to 4 Street SW), otherwise Elbow River.
Zone 3 North Hill - North: 16 Avenue NW; West: 37 Street NW; East: Deerfoot Trail; South: Bow River.Zone 4 Southwest - North: Bow River; West: West City Limits; East: 24 Street SW (from Bow River to 17 Avenue SW), 17 Street SW
(from 17 Avenue SW to 26 Avenue SW), otherwise Elbow River; South: Tsuu T'ina Nation 145 (from West City Limits to Sarcee Trail SW), Glenmore Trail (from Sarcee Trail SW), otherwise Glenmore Reservoir.
Zone 5Southeast - North: Bow River (from Elbow River to Barlow Trail SE), 17 Avenue SE (from Barlow Trail SE to 36 Street SE), Memorial Drive SE (from 36 Street SE to Eastern City Limits); West: Elbow River (from Bow River to 25 Avenue SW), Blackfoot Trail (from 26 Avenue SW to Anderson Road SE), otherwise Bow River; East: Eastern City Limits; South: Southern City Limits.
Zone 6 Northwest - North: Northern City Limits; West: Western City Limits; East: Nose Creek; South: Bow River (from Western City Limits to 37 Street NW), otherwise 16th Avenue NW.
Zone 7 Northeast - North: Northern City Limits; West: Nose Creek; East: Eastern City Limits; South: Bow River (from Nose Creek to Barlow Trail SE), 17 Avenue SE (from Barlow Trail SE to 36 Street SE), Memorial Drive SE (from 36 Street SE to Eastern City Limits).
Zone 8 Chinook - North: Elbow River; West: Elbow River; East: Blackfoot Trail; South: Heritage Drive SW.Zone 9 Fish Creek - North: Glenmore Reservoir (from Western City Limits to 14 Street SW), otherwise Heritage Drive SW and SE;
West: Western City Limits; East: Blackfoot Trail (from Heritage Drive SE Avenue SW to Anderson Road SE), otherwise Bow River; South: Southern City Limits.
Zones 1-9 Calgary CityZone 10 Other CentresZones 1-10 Calgary CMA
RMS ZONE DESCRIPTIONS - CALGARY CMA
Rental Market Report - Calgary CMA - Date Released - Fall 2015
Canada Mortgage and Housing Corporation
9
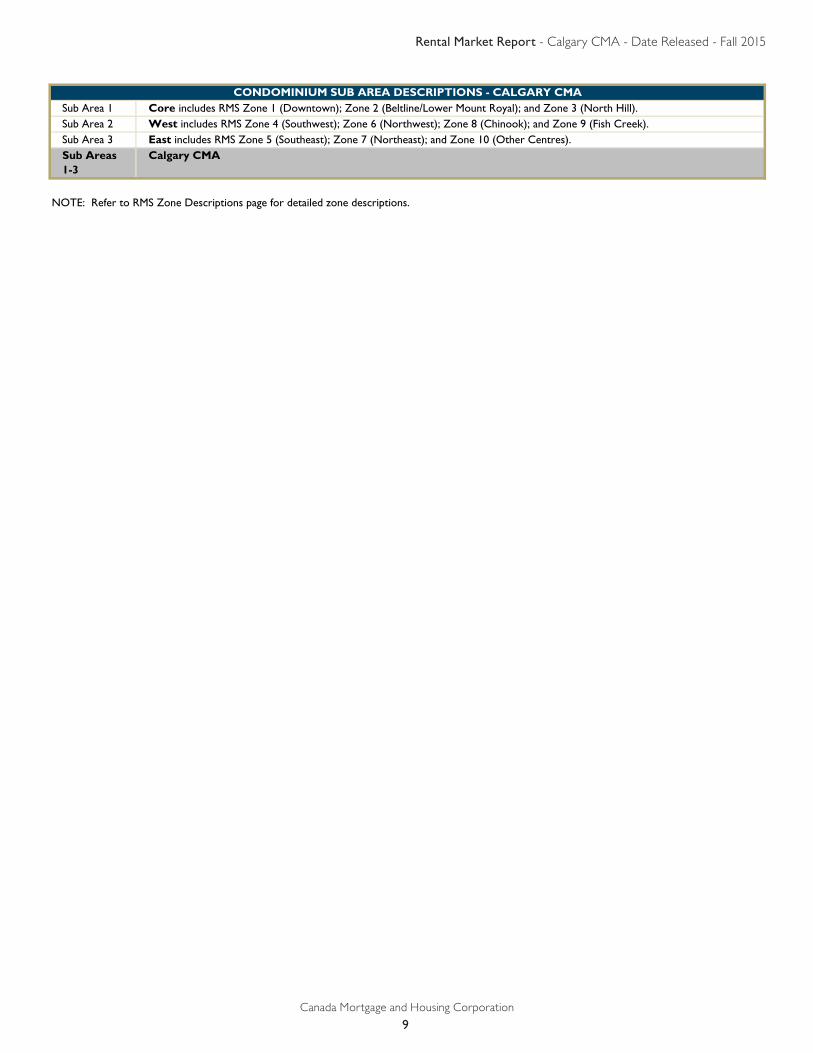
Sub Area 1 Core includes RMS Zone 1 (Downtown); Zone 2 (Beltline/Lower Mount Royal); and Zone 3 (North Hill).Sub Area 2 West includes RMS Zone 4 (Southwest); Zone 6 (Northwest); Zone 8 (Chinook); and Zone 9 (Fish Creek).Sub Area 3 East includes RMS Zone 5 (Southeast); Zone 7 (Northeast); and Zone 10 (Other Centres).Sub Areas 1-3
Calgary CMA
NOTE: Refer to RMS Zone Descriptions page for detailed zone descriptions.
CONDOMINIUM SUB AREA DESCRIPTIONS - CALGARY CMA
Rental Market Report - Calgary CMA - Date Released - Fall 2015
Canada Mortgage and Housing Corporation
10
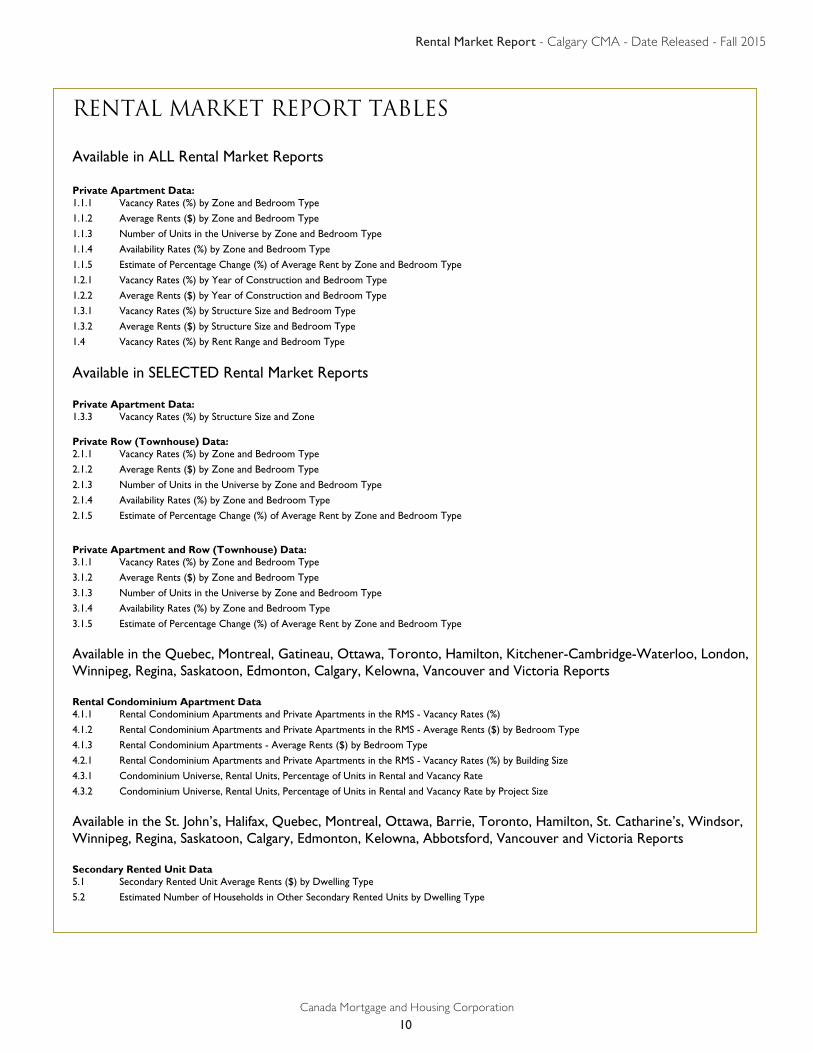
Rental Market Report Tables Available in ALL Rental Market Reports Private Apartment Data: 1.1.1 Vacancy Rates (%) by Zone and Bedroom Type 1.1.2 Average Rents ($) by Zone and Bedroom Type
1.1.3 Number of Units in the Universe by Zone and Bedroom Type 1.1.4 Availability Rates (%) by Zone and Bedroom Type
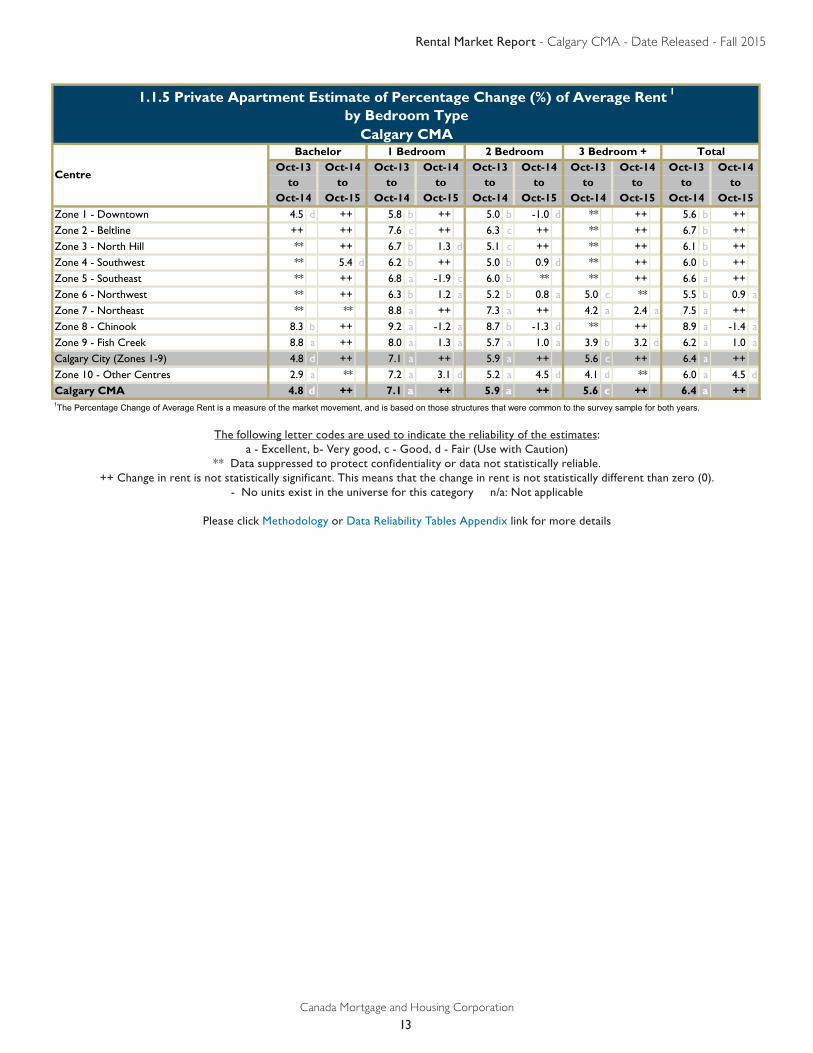
1.1.5 Estimate of Percentage Change (%) of Average Rent by Zone and Bedroom Type 1.2.1 Vacancy Rates (%) by Year of Construction and Bedroom Type
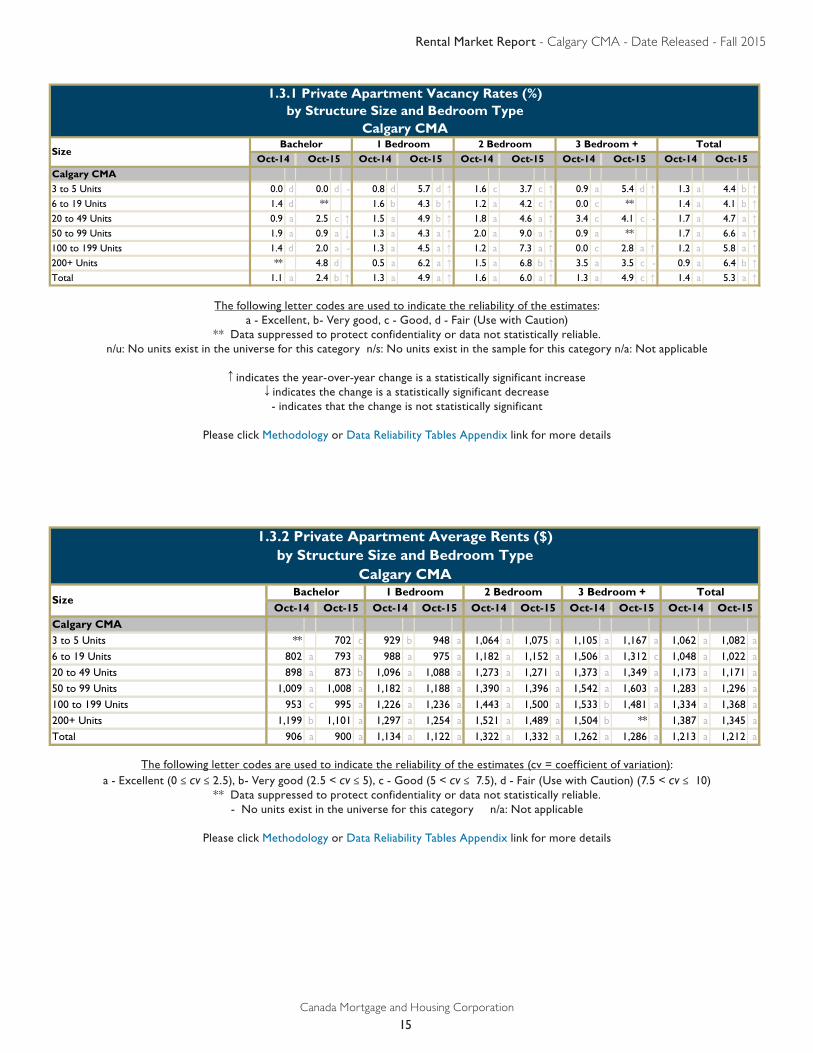
1.2.2 Average Rents ($) by Year of Construction and Bedroom Type 1.3.1 Vacancy Rates (%) by Structure Size and Bedroom Type
1.3.2 Average Rents ($) by Structure Size and Bedroom Type 1.4 Vacancy Rates (%) by Rent Range and Bedroom Type
Available in SELECTED Rental Market Reports Private Apartment Data: 1.3.3 Vacancy Rates (%) by Structure Size and Zone Private Row (Townhouse) Data: 2.1.1 Vacancy Rates (%) by Zone and Bedroom Type 2.1.2 Average Rents ($) by Zone and Bedroom Type
2.1.3 Number of Units in the Universe by Zone and Bedroom Type 2.1.4 Availability Rates (%) by Zone and Bedroom Type
2.1.5 Estimate of Percentage Change (%) of Average Rent by Zone and Bedroom Type
Private Apartment and Row (Townhouse) Data: 3.1.1 Vacancy Rates (%) by Zone and Bedroom Type 3.1.2 Average Rents ($) by Zone and Bedroom Type
3.1.3 Number of Units in the Universe by Zone and Bedroom Type 3.1.4 Availability Rates (%) by Zone and Bedroom Type
3.1.5 Estimate of Percentage Change (%) of Average Rent by Zone and Bedroom Type
Available in the Quebec, Montreal, Gatineau, Ottawa, Toronto, Hamilton, Kitchener-Cambridge-Waterloo, London, Winnipeg, Regina, Saskatoon, Edmonton, Calgary, Kelowna, Vancouver and Victoria Reports Rental Condominium Apartment Data 4.1.1 Rental Condominium Apartments and Private Apartments in the RMS - Vacancy Rates (%)
4.1.2 Rental Condominium Apartments and Private Apartments in the RMS - Average Rents ($) by Bedroom Type 4.1.3 Rental Condominium Apartments - Average Rents ($) by Bedroom Type
4.2.1 Rental Condominium Apartments and Private Apartments in the RMS - Vacancy Rates (%) by Building Size 4.3.1 Condominium Universe, Rental Units, Percentage of Units in Rental and Vacancy Rate
4.3.2 Condominium Universe, Rental Units, Percentage of Units in Rental and Vacancy Rate by Project Size
Available in the St. John’s, Halifax, Quebec, Montreal, Ottawa, Barrie, Toronto, Hamilton, St. Catharine’s, Windsor, Winnipeg, Regina, Saskatoon, Calgary, Edmonton, Kelowna, Abbotsford, Vancouver and Victoria Reports Secondary Rented Unit Data 5.1 Secondary Rented Unit Average Rents ($) by Dwelling Type
5.2 Estimated Number of Households in Other Secondary Rented Units by Dwelling Type
Rental Market Report - Calgary CMA - Date Released - Fall 2015
Canada Mortgage and Housing Corporation
11
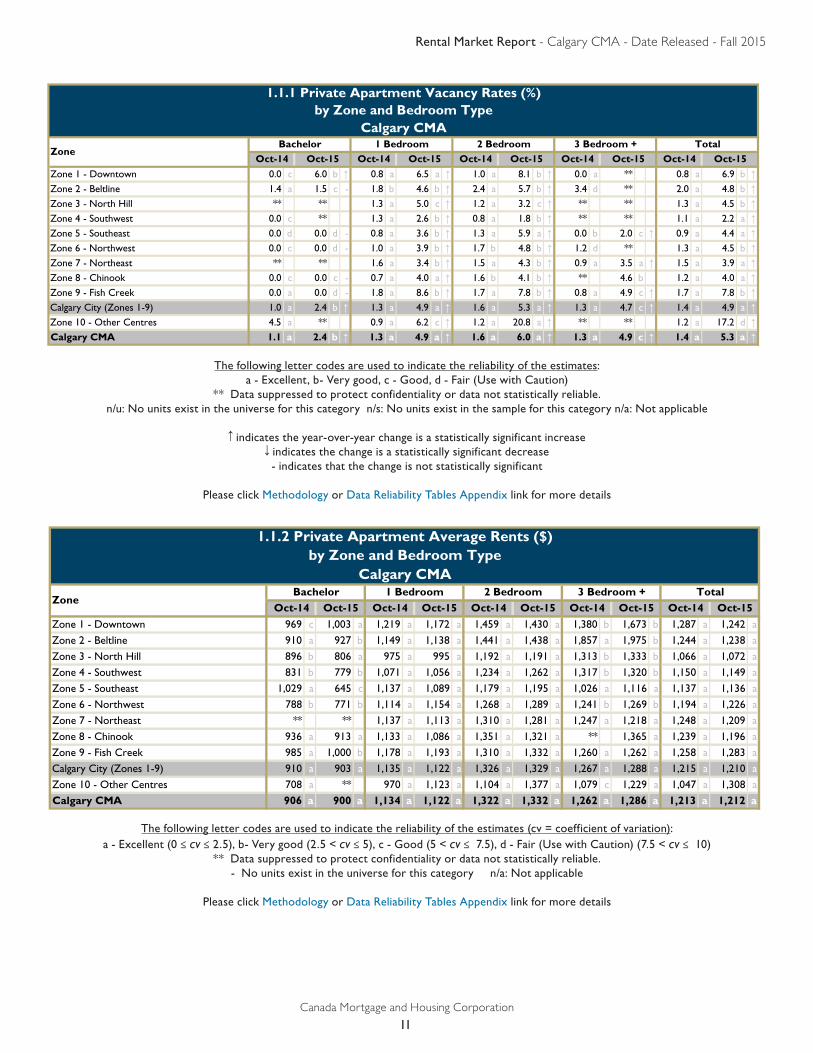
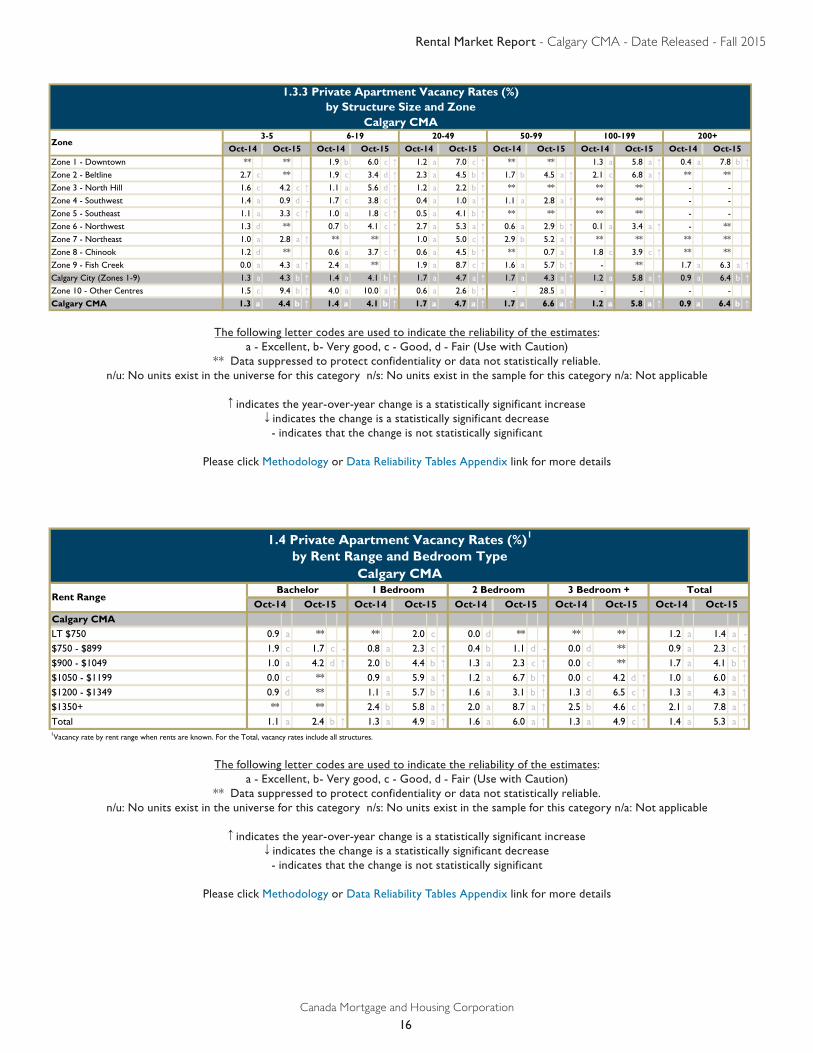
Zone 1 - Downtown 0.0 c 6.0 b ↑ 0.8 a 6.5 a ↑ 1.0 a 8.1 b ↑ 0.0 a ** 0.8 a 6.9 b ↑Zone 2 - Beltline 1.4 a 1.5 c - 1.8 b 4.6 b ↑ 2.4 a 5.7 b ↑ 3.4 d ** 2.0 a 4.8 b ↑Zone 3 - North Hill ** ** 1.3 a 5.0 c ↑ 1.2 a 3.2 c ↑ ** ** 1.3 a 4.5 b ↑Zone 4 - Southwest 0.0 c ** 1.3 a 2.6 b ↑ 0.8 a 1.8 b ↑ ** ** 1.1 a 2.2 a ↑Zone 5 - Southeast 0.0 d 0.0 d - 0.8 a 3.6 b ↑ 1.3 a 5.9 a ↑ 0.0 b 2.0 c ↑ 0.9 a 4.4 a ↑Zone 6 - Northwest 0.0 c 0.0 d - 1.0 a 3.9 b ↑ 1.7 b 4.8 b ↑ 1.2 d ** 1.3 a 4.5 b ↑Zone 7 - Northeast ** ** 1.6 a 3.4 b ↑ 1.5 a 4.3 b ↑ 0.9 a 3.5 a ↑ 1.5 a 3.9 a ↑Zone 8 - Chinook 0.0 c 0.0 c - 0.7 a 4.0 a ↑ 1.6 b 4.1 b ↑ ** 4.6 b 1.2 a 4.0 a ↑Zone 9 - Fish Creek 0.0 a 0.0 d - 1.8 a 8.6 b ↑ 1.7 a 7.8 b ↑ 0.8 a 4.9 c ↑ 1.7 a 7.8 b ↑Calgary City (Zones 1-9) 1.0 a 2.4 b ↑ 1.3 a 4.9 a ↑ 1.6 a 5.3 a ↑ 1.3 a 4.7 c ↑ 1.4 a 4.9 a ↑Zone 10 - Other Centres 4.5 a ** 0.9 a 6.2 c ↑ 1.2 a 20.8 a ↑ ** ** 1.2 a 17.2 d ↑Calgary CMA 1.1 a 2.4 b ↑ 1.3 a 4.9 a ↑ 1.6 a 6.0 a ↑ 1.3 a 4.9 c ↑ 1.4 a 5.3 a ↑
1.1.1 Private Apartment Vacancy Rates (%)by Zone and Bedroom Type
Calgary CMA3 Bedroom + Total
ZoneBachelor 1 Bedroom 2 Bedroom
Oct-14 Oct-15Oct-15 Oct-14 Oct-15 Oct-14Oct-15 Oct-14 Oct-15 Oct-14
Zone 1 - Downtown 969 c 1,003 a 1,219 a 1,172 a 1,459 a 1,430 a 1,380 b 1,673 b 1,287 a 1,242 a
Zone 2 - Beltline 910 a 927 b 1,149 a 1,138 a 1,441 a 1,438 a 1,857 a 1,975 b 1,244 a 1,238 a
Zone 3 - North Hill 896 b 806 a 975 a 995 a 1,192 a 1,191 a 1,313 b 1,333 b 1,066 a 1,072 a
Zone 4 - Southwest 831 b 779 b 1,071 a 1,056 a 1,234 a 1,262 a 1,317 b 1,320 b 1,150 a 1,149 a
Zone 5 - Southeast 1,029 a 645 c 1,137 a 1,089 a 1,179 a 1,195 a 1,026 a 1,116 a 1,137 a 1,136 a
Zone 6 - Northwest 788 b 771 b 1,114 a 1,154 a 1,268 a 1,289 a 1,241 b 1,269 b 1,194 a 1,226 a
Zone 7 - Northeast ** ** 1,137 a 1,113 a 1,310 a 1,281 a 1,247 a 1,218 a 1,248 a 1,209 a
Zone 8 - Chinook 936 a 913 a 1,133 a 1,086 a 1,351 a 1,321 a ** 1,365 a 1,239 a 1,196 a
Zone 9 - Fish Creek 985 a 1,000 b 1,178 a 1,193 a 1,310 a 1,332 a 1,260 a 1,262 a 1,258 a 1,283 a
Calgary City (Zones 1-9) 910 a 903 a 1,135 a 1,122 a 1,326 a 1,329 a 1,267 a 1,288 a 1,215 a 1,210 a
Zone 10 - Other Centres 708 a ** 970 a 1,123 a 1,104 a 1,377 a 1,079 c 1,229 a 1,047 a 1,308 a
Calgary CMA 906 a 900 a 1,134 a 1,122 a 1,322 a 1,332 a 1,262 a 1,286 a 1,213 a 1,212 a
1.1.2 Private Apartment Average Rents ($)by Zone and Bedroom Type
Calgary CMA
ZoneBachelor 1 Bedroom 2 Bedroom 3 Bedroom + Total
Oct-14 Oct-15Oct-15 Oct-14 Oct-15 Oct-14Oct-15 Oct-14 Oct-15 Oct-14
The following letter codes are used to indicate the reliability of the estimates (cv = coefficient of variation):a - Excellent (0 ≤ cv ≤ 2.5), b- Very good (2.5 < cv ≤ 5), c - Good (5 < cv ≤ 7.5), d - Fair (Use with Caution) (7.5 < cv ≤ 10)
** Data suppressed to protect confidentiality or data not statistically reliable.- No units exist in the universe for this category n/a: Not applicable
Please click Methodology or Data Reliability Tables Appendix link for more details
The following letter codes are used to indicate the reliability of the estimates:a - Excellent, b- Very good, c - Good, d - Fair (Use with Caution)
** Data suppressed to protect confidentiality or data not statistically reliable.n/u: No units exist in the universe for this category n/s: No units exist in the sample for this category n/a: Not applicable
indicates the year-over-year change is a statistically significant increase indicates the change is a statistically significant decrease- indicates that the change is not statistically significant
Please click Methodology or Data Reliability Tables Appendix link for more details
Rental Market Report - Calgary CMA - Date Released - Fall 2015
Canada Mortgage and Housing Corporation
12
by Zone and Bedroom TypeCalgary CMA
Oct-14 Oct-15 Oct-14 Oct-15 Oct-14 Oct-15 Oct-14 Oct-15 Oct-14 Oct-15Zone 1 - Downtown 205 207 3,204 3,214 1,533 1,537 21 25 4,963 4,983
Zone 2 - Beltline 625 625 4,860 4,926 2,961 3,060 61 63 8,507 8,674
Zone 3 - North Hill 88 84 1,641 1,582 1,100 1,048 74 74 2,903 2,788
Zone 4 - Southwest 146 145 1,612 1,619 1,707 1,686 201 198 3,666 3,648
Zone 5 - Southeast 51 51 648 599 651 691 174 174 1,524 1,515
Zone 6 - Northwest 74 78 1,887 1,990 2,196 2,318 497 490 4,654 4,876
Zone 7 - Northeast 7 7 665 668 1,099 1,102 82 85 1,853 1,862
Zone 8 - Chinook 31 31 1,231 1,241 1,093 1,067 67 67 2,422 2,406
Zone 9 - Fish Creek 38 39 1,182 1,229 1,957 2,042 258 253 3,435 3,563
Calgary City (Zones 1-9) 1,265 1,267 16,930 17,068 14,297 14,551 1,435 1,429 33,927 34,315
Zone 10 - Other Centres 22 22 117 194 259 660 37 36 435 912
Calgary CMA 1,287 1,289 17,047 17,262 14,556 15,211 1,472 1,465 34,362 35,227
Total
1.1.3 Number of Private Apartment Units in the Universe
ZoneBachelor 1 Bedroom 2 Bedroom 3 Bedroom +
** Data suppressed to protect confidentiality or data not statistically reliable.- No units exist in the universe for this category n/a: Not applicable
Please click Methodology or Data Reliability Tables Appendix link for more details
1.1.4 Private Apartment Availability Rates (%)by Zone and Bedroom Type
Calgary CMA
Zone 1 - Downtown ** 7.4 b 2.1 a 9.7 a ↑ 2.1 a 10.4 c ↑ 0.0 a ** 2.1 a 9.7 a ↑Zone 2 - Beltline 1.8 c 3.6 d ↑ 3.0 a 7.5 b ↑ 3.5 b 7.7 a ↑ 3.4 d ** 3.1 b 7.3 a ↑Zone 3 - North Hill ** ** 2.9 a 6.9 b ↑ 2.3 b 5.2 c ↑ ** ** 2.7 a 6.3 b ↑Zone 4 - Southwest 3.4 d 3.3 d - 2.6 a 4.8 b ↑ 1.7 a 4.4 b ↑ 5.9 d 5.6 d - 2.4 a 4.6 b ↑Zone 5 - Southeast 0.0 d 0.0 d - 2.1 a 6.2 a ↑ 3.6 a 7.9 a ↑ 2.1 c 2.0 c - 2.7 a 6.4 a ↑Zone 6 - Northwest ** 0.0 d 2.7 a 6.0 b ↑ 3.5 b 6.8 b ↑ 2.9 c ** 3.1 b 6.5 a ↑Zone 7 - Northeast ** ** 3.4 b 4.6 a ↑ 2.4 a 5.5 b ↑ 0.9 a 4.7 a ↑ 2.7 a 5.1 a ↑Zone 8 - Chinook 3.4 d 0.0 c ↓ 2.2 a 9.7 b ↑ 3.5 b 9.7 b ↑ ** 4.6 b 2.9 a 9.4 a ↑Zone 9 - Fish Creek 0.0 a 0.0 d - 2.9 a 12.0 c ↑ 3.3 a 10.2 c ↑ 1.5 a 6.1 c ↑ 3.0 a 10.4 a ↑Calgary City (Zones 1-9) 2.3 b 4.2 c ↑ 2.6 a 7.7 a ↑ 2.9 a 7.6 a ↑ 2.8 b 5.7 c ↑ 2.8 a 7.5 a ↑Zone 10 - Other Centres 4.5 a ** 0.9 a 7.3 c ↑ 1.2 a 21.0 a ↑ ** ** 1.2 a 17.8 d ↑Calgary CMA 2.3 b 4.3 c ↑ 2.6 a 7.7 a ↑ 2.9 a 8.2 a ↑ 2.8 b 6.0 b ↑ 2.7 a 7.7 a ↑
3 Bedroom + TotalZone
Bachelor 1 Bedroom 2 BedroomOct-14 Oct-15 Oct-14 Oct-15 Oct-14 Oct-15Oct-14 Oct-15 Oct-14 Oct-15
The following letter codes are used to indicate the reliability of the estimates:a - Excellent, b- Very good, c - Good, d - Fair (Use with Caution)
** Data suppressed to protect confidentiality or data not statistically reliable.n/u: No units exist in the universe for this category n/s: No units exist in the sample for this category n/a: Not applicable
indicates the year-over-year change is a statistically significant increase indicates the change is a statistically significant decrease- indicates that the change is not statistically significant
Please click Methodology or Data Reliability Tables Appendix link for more details
Rental Market Report - Calgary CMA - Date Released - Fall 2015
Canada Mortgage and Housing Corporation
13
1.1.5 Private Apartment Estimate of Percentage Change (%) of Average Rent 1
by Bedroom TypeCalgary CMA
Zone 1 - Downtown 4.5 d ++ 5.8 b ++ 5.0 b -1.0 d ** ++ 5.6 b ++Zone 2 - Beltline ++ ++ 7.6 c ++ 6.3 c ++ ** ++ 6.7 b ++Zone 3 - North Hill ** ++ 6.7 b 1.3 d 5.1 c ++ ** ++ 6.1 b ++Zone 4 - Southwest ** 5.4 d 6.2 b ++ 5.0 b 0.9 d ** ++ 6.0 b ++Zone 5 - Southeast ** ++ 6.8 a -1.9 c 6.0 b ** ** ++ 6.6 a ++Zone 6 - Northwest ** ++ 6.3 b 1.2 a 5.2 b 0.8 a 5.0 c ** 5.5 b 0.9 aZone 7 - Northeast ** ** 8.8 a ++ 7.3 a ++ 4.2 a 2.4 a 7.5 a ++Zone 8 - Chinook 8.3 b ++ 9.2 a -1.2 a 8.7 b -1.3 d ** ++ 8.9 a -1.4 aZone 9 - Fish Creek 8.8 a ++ 8.0 a 1.3 a 5.7 a 1.0 a 3.9 b 3.2 d 6.2 a 1.0 aCalgary City (Zones 1-9) 4.8 d ++ 7.1 a ++ 5.9 a ++ 5.6 c ++ 6.4 a ++Zone 10 - Other Centres 2.9 a ** 7.2 a 3.1 d 5.2 a 4.5 d 4.1 d ** 6.0 a 4.5 dCalgary CMA 4.8 d ++ 7.1 a ++ 5.9 a ++ 5.6 c ++ 6.4 a ++
Oct-14 Oct-15to to
Oct-14 Oct-15to to
Oct-13 Oct-14 Oct-133 Bedroom + Total
Oct-13 Oct-14 Oct-13 Oct-14to to
2 Bedroom
Centre
Bachelor 1 Bedroom
to to to to
1The Percentage Change of Average Rent is a measure of the market movement, and is based on those structures that were common to the survey sample for both years.
Oct-14 Oct-15
Oct-14
Oct-14 Oct-15 Oct-14
Oct-13
Oct-15
Oct-14
The following letter codes are used to indicate the reliability of the estimates:a - Excellent, b- Very good, c - Good, d - Fair (Use with Caution)
** Data suppressed to protect confidentiality or data not statistically reliable.++ Change in rent is not statistically significant. This means that the change in rent is not statistically different than zero (0).
- No units exist in the universe for this category n/a: Not applicable
Please click Methodology or Data Reliability Tables Appendix link for more details
Rental Market Report - Calgary CMA - Date Released - Fall 2015
Canada Mortgage and Housing Corporation
14
1.2.1 Private Apartment Vacancy Rates (%)by Year of Construction and Bedroom Type
Calgary CMA
Calgary CMAPre 1960 0.0 c ** 1.6 c 4.0 c ↑ 1.2 a 3.9 d ↑ ** ** 1.3 a 3.8 c ↑1960 - 1974 1.1 a 1.7 c - 1.0 a 4.8 a ↑ 1.4 a 4.4 a ↑ 1.1 a 4.2 c ↑ 1.1 a 4.5 a ↑1975 - 1989 2.2 c 2.5 c - 1.5 a 4.5 a ↑ 1.8 a 4.8 a ↑ 1.5 c 5.7 d ↑ 1.7 a 4.6 a ↑1990 - 2004 - - 1.1 a 7.9 a ↑ 1.5 a 8.1 b ↑ ** ** 1.4 a 8.1 a ↑2005+ ** ** 3.4 a 9.3 a ↑ 1.9 a 23.4 a ↑ ** ** 2.6 a 17.3 a ↑Total 1.1 a 2.4 b ↑ 1.3 a 4.9 a ↑ 1.6 a 6.0 a ↑ 1.3 a 4.9 c ↑ 1.4 a 5.3 a ↑
3 Bedroom + TotalYear of Construction
Bachelor 1 Bedroom 2 BedroomOct-14 Oct-15 Oct-14 Oct-15 Oct-14 Oct-15Oct-14 Oct-15 Oct-14 Oct-15
The following letter codes are used to indicate the reliability of the estimates:a - Excellent, b- Very good, c - Good, d - Fair (Use with Caution)
** Data suppressed to protect confidentiality or data not statistically reliable.n/u: No units exist in the universe for this category n/s: No units exist in the sample for this category n/a: Not applicable
indicates the year-over-year change is a statistically significant increase indicates the change is a statistically significant decrease- indicates that the change is not statistically significant
Please click Methodology or Data Reliability Tables Appendix link for more details
Calgary CMAPre 1960 885 b 866 b 1,076 a 1,018 a 1,262 a 1,262 a ** ** 1,111 a 1,064 a
1960 - 1974 929 a 927 a 1,127 a 1,116 a 1,310 a 1,309 a 1,290 a 1,333 a 1,194 a 1,189 a
1975 - 1989 838 b 849 b 1,103 a 1,114 a 1,286 a 1,281 a 1,209 a 1,206 a 1,199 a 1,199 a
1990 - 2004 - - 1,361 a 1,305 a 1,591 a 1,510 a ** ** 1,506 a 1,439 a
2005+ ** ** 1,451 a 1,397 a 1,746 a 1,742 a ** ** 1,558 a 1,586 a
Total 906 a 900 a 1,134 a 1,122 a 1,322 a 1,332 a 1,262 a 1,286 a 1,213 a 1,212 a
1.2.2 Private Apartment Average Rents ($)by Year of Construction and Bedroom Type
Calgary CMA
Year of ConstructionBachelor 1 Bedroom 2 Bedroom 3 Bedroom + Total
Oct-14 Oct-15Oct-15 Oct-14 Oct-15 Oct-14Oct-15 Oct-14 Oct-15 Oct-14
The following letter codes are used to indicate the reliability of the estimates (cv = coefficient of variation):a - Excellent (0 ≤ cv ≤ 2.5), b- Very good (2.5 < cv ≤ 5), c - Good (5 < cv ≤ 7.5), d - Fair (Use with Caution) (7.5 < cv ≤ 10)
** Data suppressed to protect confidentiality or data not statistically reliable.- No units exist in the universe for this category n/a: Not applicable
Please click Methodology or Data Reliability Tables Appendix link for more details
Rental Market Report - Calgary CMA - Date Released - Fall 2015
Canada Mortgage and Housing Corporation
15
1.3.1 Private Apartment Vacancy Rates (%)by Structure Size and Bedroom Type
Calgary CMA
Calgary CMA3 to 5 Units 0.0 d 0.0 d - 0.8 d 5.7 d ↑ 1.6 c 3.7 c ↑ 0.9 a 5.4 d ↑ 1.3 a 4.4 b ↑6 to 19 Units 1.4 d ** 1.6 b 4.3 b ↑ 1.2 a 4.2 c ↑ 0.0 c ** 1.4 a 4.1 b ↑20 to 49 Units 0.9 a 2.5 c ↑ 1.5 a 4.9 b ↑ 1.8 a 4.6 a ↑ 3.4 c 4.1 c - 1.7 a 4.7 a ↑50 to 99 Units 1.9 a 0.9 a ↓ 1.3 a 4.3 a ↑ 2.0 a 9.0 a ↑ 0.9 a ** 1.7 a 6.6 a ↑100 to 199 Units 1.4 d 2.0 a - 1.3 a 4.5 a ↑ 1.2 a 7.3 a ↑ 0.0 c 2.8 a ↑ 1.2 a 5.8 a ↑200+ Units ** 4.8 d 0.5 a 6.2 a ↑ 1.5 a 6.8 b ↑ 3.5 a 3.5 c - 0.9 a 6.4 b ↑Total 1.1 a 2.4 b ↑ 1.3 a 4.9 a ↑ 1.6 a 6.0 a ↑ 1.3 a 4.9 c ↑ 1.4 a 5.3 a ↑
3 Bedroom + TotalSize
Bachelor 1 Bedroom 2 BedroomOct-14 Oct-15 Oct-14 Oct-15 Oct-14 Oct-15Oct-14 Oct-15 Oct-14 Oct-15
The following letter codes are used to indicate the reliability of the estimates:a - Excellent, b- Very good, c - Good, d - Fair (Use with Caution)
** Data suppressed to protect confidentiality or data not statistically reliable.n/u: No units exist in the universe for this category n/s: No units exist in the sample for this category n/a: Not applicable
indicates the year-over-year change is a statistically significant increase indicates the change is a statistically significant decrease- indicates that the change is not statistically significant
Please click Methodology or Data Reliability Tables Appendix link for more details
Calgary CMA3 to 5 Units ** 702 c 929 b 948 a 1,064 a 1,075 a 1,105 a 1,167 a 1,062 a 1,082 a
6 to 19 Units 802 a 793 a 988 a 975 a 1,182 a 1,152 a 1,506 a 1,312 c 1,048 a 1,022 a
20 to 49 Units 898 a 873 b 1,096 a 1,088 a 1,273 a 1,271 a 1,373 a 1,349 a 1,173 a 1,171 a
50 to 99 Units 1,009 a 1,008 a 1,182 a 1,188 a 1,390 a 1,396 a 1,542 a 1,603 a 1,283 a 1,296 a
100 to 199 Units 953 c 995 a 1,226 a 1,236 a 1,443 a 1,500 a 1,533 b 1,481 a 1,334 a 1,368 a
200+ Units 1,199 b 1,101 a 1,297 a 1,254 a 1,521 a 1,489 a 1,504 b ** 1,387 a 1,345 a
Total 906 a 900 a 1,134 a 1,122 a 1,322 a 1,332 a 1,262 a 1,286 a 1,213 a 1,212 a
1.3.2 Private Apartment Average Rents ($)by Structure Size and Bedroom Type
Calgary CMA
SizeBachelor 1 Bedroom 2 Bedroom 3 Bedroom + Total
Oct-14 Oct-15Oct-15 Oct-14 Oct-15 Oct-14Oct-15 Oct-14 Oct-15 Oct-14
The following letter codes are used to indicate the reliability of the estimates (cv = coefficient of variation):a - Excellent (0 ≤ cv ≤ 2.5), b- Very good (2.5 < cv ≤ 5), c - Good (5 < cv ≤ 7.5), d - Fair (Use with Caution) (7.5 < cv ≤ 10)
** Data suppressed to protect confidentiality or data not statistically reliable.- No units exist in the universe for this category n/a: Not applicable
Please click Methodology or Data Reliability Tables Appendix link for more details
Rental Market Report - Calgary CMA - Date Released - Fall 2015
Canada Mortgage and Housing Corporation
16
1.3.3 Private Apartment Vacancy Rates (%)by Structure Size and Zone
Calgary CMA
Zone 1 - Downtown ** ** 1.9 b 6.0 c ↑ 1.2 a 7.0 c ↑ ** ** 1.3 a 5.8 a ↑ 0.4 a 7.8 b ↑Zone 2 - Beltline 2.7 c ** 1.9 c 3.4 d ↑ 2.3 a 4.5 b ↑ 1.7 b 4.5 a ↑ 2.1 c 6.8 a ↑ ** **
Zone 3 - North Hill 1.6 c 4.2 c ↑ 1.1 a 5.6 d ↑ 1.2 a 2.2 b ↑ ** ** ** ** - -
Zone 4 - Southwest 1.4 a 0.9 d - 1.7 c 3.8 c ↑ 0.4 a 1.0 a ↑ 1.1 a 2.8 a ↑ ** ** - -
Zone 5 - Southeast 1.1 a 3.3 c ↑ 1.0 a 1.8 c ↑ 0.5 a 4.1 b ↑ ** ** ** ** - -
Zone 6 - Northwest 1.3 d ** 0.7 b 4.1 c ↑ 2.7 a 5.3 a ↑ 0.6 a 2.9 b ↑ 0.1 a 3.4 a ↑ - **
Zone 7 - Northeast 1.0 a 2.8 a ↑ ** ** 1.0 a 5.0 c ↑ 2.9 b 5.2 a ↑ ** ** ** **
Zone 8 - Chinook 1.2 d ** 0.6 a 3.7 c ↑ 0.6 a 4.5 b ↑ ** 0.7 a 1.8 c 3.9 c ↑ ** **
Zone 9 - Fish Creek 0.0 a 4.3 a ↑ 2.4 a ** 1.9 a 8.7 c ↑ 1.6 a 5.7 b ↑ - ** 1.7 a 6.3 a ↑Calgary City (Zones 1-9) 1.3 a 4.3 b ↑ 1.4 a 4.1 b ↑ 1.7 a 4.7 a ↑ 1.7 a 4.3 a ↑ 1.2 a 5.8 a ↑ 0.9 a 6.4 b ↑Zone 10 - Other Centres 1.5 c 9.4 b ↑ 4.0 a 10.0 a ↑ 0.6 a 2.6 b ↑ - 28.5 a - - - -
Calgary CMA 1.3 a 4.4 b ↑ 1.4 a 4.1 b ↑ 1.7 a 4.7 a ↑ 1.7 a 6.6 a ↑ 1.2 a 5.8 a ↑ 0.9 a 6.4 b ↑
50-99 200+100-199Oct-14 Oct-15 Oct-14 Oct-15Oct-14 Oct-15
Zone3-5 6-19 20-49
Oct-14 Oct-15 Oct-14 Oct-15 Oct-14 Oct-15
The following letter codes are used to indicate the reliability of the estimates:a - Excellent, b- Very good, c - Good, d - Fair (Use with Caution)
** Data suppressed to protect confidentiality or data not statistically reliable.n/u: No units exist in the universe for this category n/s: No units exist in the sample for this category n/a: Not applicable
indicates the year-over-year change is a statistically significant increase indicates the change is a statistically significant decrease- indicates that the change is not statistically significant
Please click Methodology or Data Reliability Tables Appendix link for more details
Calgary CMALT $750 0.9 a ** ** 2.0 c 0.0 d ** ** ** 1.2 a 1.4 a -
$750 - $899 1.9 c 1.7 c - 0.8 a 2.3 c ↑ 0.4 b 1.1 d - 0.0 d ** 0.9 a 2.3 c ↑$900 - $1049 1.0 a 4.2 d ↑ 2.0 b 4.4 b ↑ 1.3 a 2.3 c ↑ 0.0 c ** 1.7 a 4.1 b ↑$1050 - $1199 0.0 c ** 0.9 a 5.9 a ↑ 1.2 a 6.7 b ↑ 0.0 c 4.2 d ↑ 1.0 a 6.0 a ↑$1200 - $1349 0.9 d ** 1.1 a 5.7 b ↑ 1.6 a 3.1 b ↑ 1.3 d 6.5 c ↑ 1.3 a 4.3 a ↑$1350+ ** ** 2.4 b 5.8 a ↑ 2.0 a 8.7 a ↑ 2.5 b 4.6 c ↑ 2.1 a 7.8 a ↑Total 1.1 a 2.4 b ↑ 1.3 a 4.9 a ↑ 1.6 a 6.0 a ↑ 1.3 a 4.9 c ↑ 1.4 a 5.3 a ↑
1.4 Private Apartment Vacancy Rates (%)1
by Rent Range and Bedroom TypeCalgary CMA
3 Bedroom + TotalRent Range
Bachelor 1 Bedroom 2 BedroomOct-14
1Vacancy rate by rent range when rents are known. For the Total, vacancy rates include all structures.
Oct-15Oct-15 Oct-14 Oct-15 Oct-14Oct-15 Oct-14 Oct-15 Oct-14
The following letter codes are used to indicate the reliability of the estimates:a - Excellent, b- Very good, c - Good, d - Fair (Use with Caution)
** Data suppressed to protect confidentiality or data not statistically reliable.n/u: No units exist in the universe for this category n/s: No units exist in the sample for this category n/a: Not applicable
indicates the year-over-year change is a statistically significant increase indicates the change is a statistically significant decrease- indicates that the change is not statistically significant
Please click Methodology or Data Reliability Tables Appendix link for more details
Rental Market Report - Calgary CMA - Date Released - Fall 2015
Canada Mortgage and Housing Corporation
17
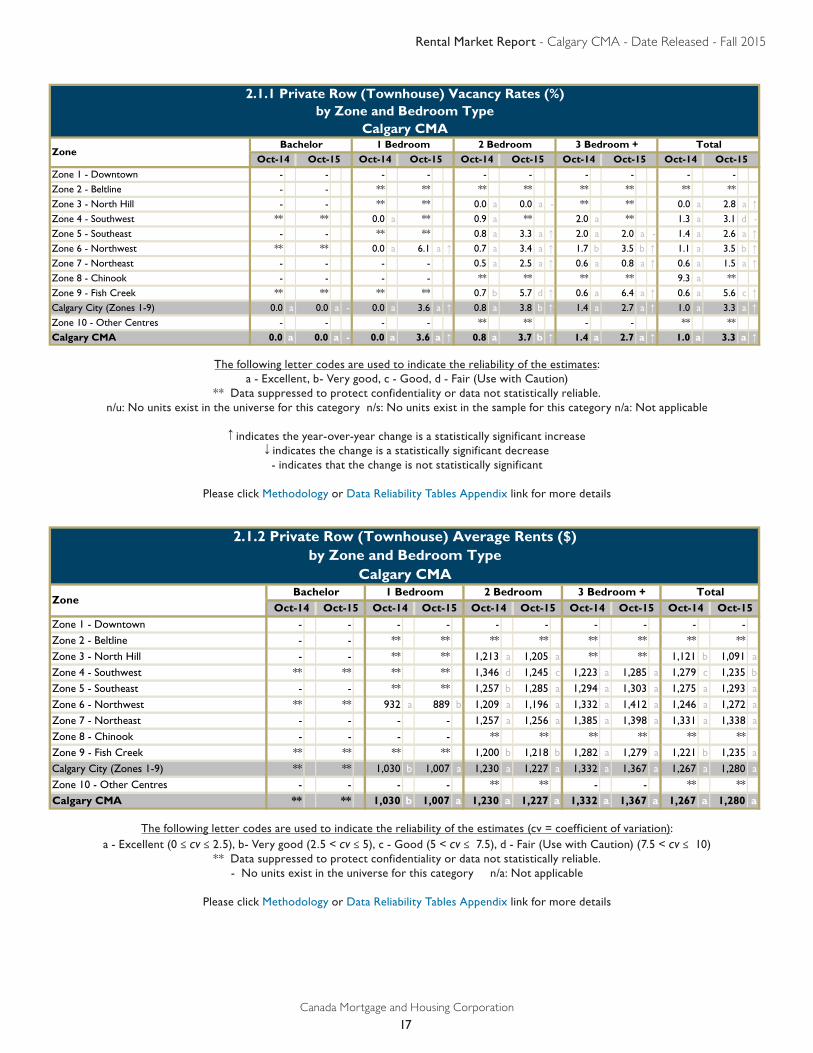
2.1.1 Private Row (Townhouse) Vacancy Rates (%)by Zone and Bedroom Type
Calgary CMA
Zone 1 - Downtown - - - - - - - - - -
Zone 2 - Beltline - - ** ** ** ** ** ** ** **
Zone 3 - North Hill - - ** ** 0.0 a 0.0 a - ** ** 0.0 a 2.8 a ↑Zone 4 - Southwest ** ** 0.0 a ** 0.9 a ** 2.0 a ** 1.3 a 3.1 d -
Zone 5 - Southeast - - ** ** 0.8 a 3.3 a ↑ 2.0 a 2.0 a - 1.4 a 2.6 a ↑Zone 6 - Northwest ** ** 0.0 a 6.1 a ↑ 0.7 a 3.4 a ↑ 1.7 b 3.5 b ↑ 1.1 a 3.5 b ↑Zone 7 - Northeast - - - - 0.5 a 2.5 a ↑ 0.6 a 0.8 a ↑ 0.6 a 1.5 a ↑Zone 8 - Chinook - - - - ** ** ** ** 9.3 a **
Zone 9 - Fish Creek ** ** ** ** 0.7 b 5.7 d ↑ 0.6 a 6.4 a ↑ 0.6 a 5.6 c ↑Calgary City (Zones 1-9) 0.0 a 0.0 a - 0.0 a 3.6 a ↑ 0.8 a 3.8 b ↑ 1.4 a 2.7 a ↑ 1.0 a 3.3 a ↑Zone 10 - Other Centres - - - - ** ** - - ** **
Calgary CMA 0.0 a 0.0 a - 0.0 a 3.6 a ↑ 0.8 a 3.7 b ↑ 1.4 a 2.7 a ↑ 1.0 a 3.3 a ↑
3 Bedroom + TotalZone
Bachelor 1 Bedroom 2 BedroomOct-14 Oct-15 Oct-14 Oct-15 Oct-14 Oct-15Oct-14 Oct-15 Oct-14 Oct-15
Zone 1 - Downtown - - - - - - - - - -
Zone 2 - Beltline - - ** ** ** ** ** ** ** **
Zone 3 - North Hill - - ** ** 1,213 a 1,205 a ** ** 1,121 b 1,091 a
Zone 4 - Southwest ** ** ** ** 1,346 d 1,245 c 1,223 a 1,285 a 1,279 c 1,235 b
Zone 5 - Southeast - - ** ** 1,257 b 1,285 a 1,294 a 1,303 a 1,275 a 1,293 a
Zone 6 - Northwest ** ** 932 a 889 b 1,209 a 1,196 a 1,332 a 1,412 a 1,246 a 1,272 a
Zone 7 - Northeast - - - - 1,257 a 1,256 a 1,385 a 1,398 a 1,331 a 1,338 a
Zone 8 - Chinook - - - - ** ** ** ** ** **
Zone 9 - Fish Creek ** ** ** ** 1,200 b 1,218 b 1,282 a 1,279 a 1,221 b 1,235 a
Calgary City (Zones 1-9) ** ** 1,030 b 1,007 a 1,230 a 1,227 a 1,332 a 1,367 a 1,267 a 1,280 a
Zone 10 - Other Centres - - - - ** ** - - ** **
Calgary CMA ** ** 1,030 b 1,007 a 1,230 a 1,227 a 1,332 a 1,367 a 1,267 a 1,280 a
2.1.2 Private Row (Townhouse) Average Rents ($)by Zone and Bedroom Type
Calgary CMA
ZoneBachelor 1 Bedroom 2 Bedroom 3 Bedroom + Total
Oct-14 Oct-15Oct-15 Oct-14 Oct-15 Oct-14Oct-15 Oct-14 Oct-15 Oct-14
The following letter codes are used to indicate the reliability of the estimates (cv = coefficient of variation):a - Excellent (0 ≤ cv ≤ 2.5), b- Very good (2.5 < cv ≤ 5), c - Good (5 < cv ≤ 7.5), d - Fair (Use with Caution) (7.5 < cv ≤ 10)
** Data suppressed to protect confidentiality or data not statistically reliable.- No units exist in the universe for this category n/a: Not applicable
Please click Methodology or Data Reliability Tables Appendix link for more details
The following letter codes are used to indicate the reliability of the estimates:a - Excellent, b- Very good, c - Good, d - Fair (Use with Caution)
** Data suppressed to protect confidentiality or data not statistically reliable.n/u: No units exist in the universe for this category n/s: No units exist in the sample for this category n/a: Not applicable
indicates the year-over-year change is a statistically significant increase indicates the change is a statistically significant decrease- indicates that the change is not statistically significant
Please click Methodology or Data Reliability Tables Appendix link for more details
Rental Market Report - Calgary CMA - Date Released - Fall 2015
Canada Mortgage and Housing Corporation
18
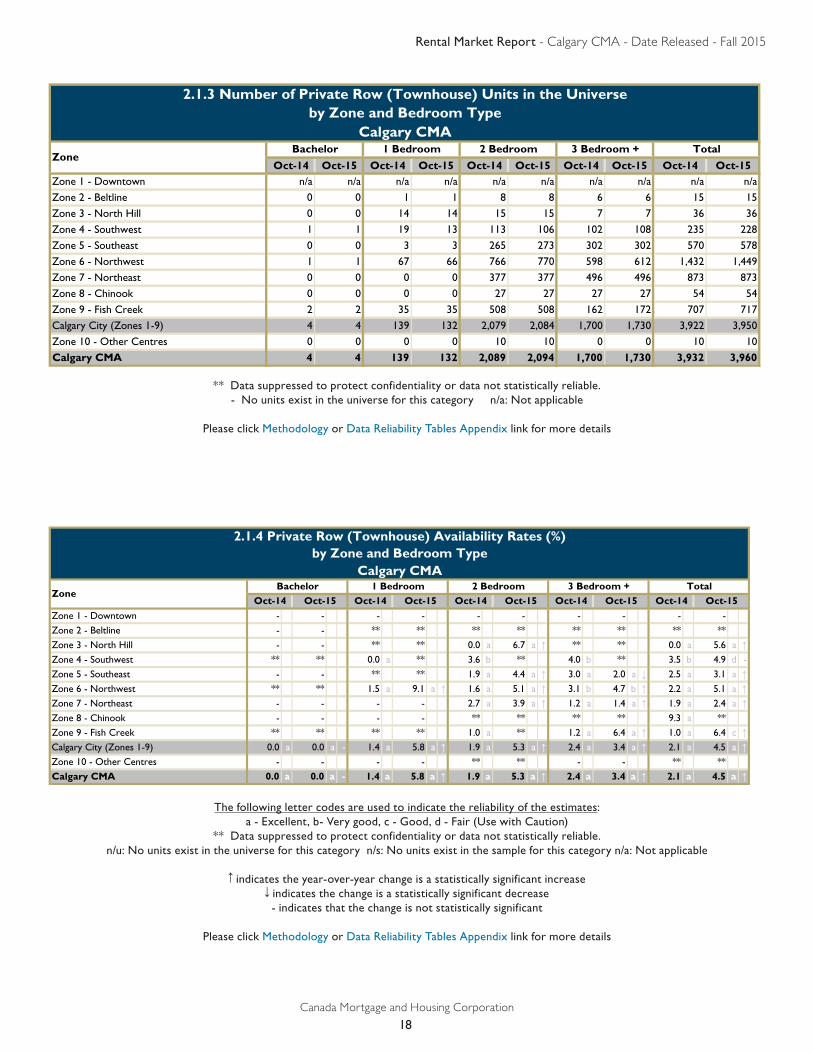
2.1.3 Number of Private Row (Townhouse) Units in the Universeby Zone and Bedroom Type
Calgary CMA
Oct-14 Oct-15 Oct-14 Oct-15 Oct-14 Oct-15 Oct-14 Oct-15 Oct-14 Oct-15Zone 1 - Downtown n/a n/a n/a n/a n/a n/a n/a n/a n/a n/a
Zone 2 - Beltline 0 0 1 1 8 8 6 6 15 15
Zone 3 - North Hill 0 0 14 14 15 15 7 7 36 36
Zone 4 - Southwest 1 1 19 13 113 106 102 108 235 228
Zone 5 - Southeast 0 0 3 3 265 273 302 302 570 578
Zone 6 - Northwest 1 1 67 66 766 770 598 612 1,432 1,449
Zone 7 - Northeast 0 0 0 0 377 377 496 496 873 873
Zone 8 - Chinook 0 0 0 0 27 27 27 27 54 54
Zone 9 - Fish Creek 2 2 35 35 508 508 162 172 707 717
Calgary City (Zones 1-9) 4 4 139 132 2,079 2,084 1,700 1,730 3,922 3,950
Zone 10 - Other Centres 0 0 0 0 10 10 0 0 10 10
Calgary CMA 4 4 139 132 2,089 2,094 1,700 1,730 3,932 3,960
3 Bedroom + TotalZone
Bachelor 1 Bedroom 2 Bedroom
** Data suppressed to protect confidentiality or data not statistically reliable.- No units exist in the universe for this category n/a: Not applicable
Please click Methodology or Data Reliability Tables Appendix link for more details
2.1.4 Private Row (Townhouse) Availability Rates (%)by Zone and Bedroom Type
Calgary CMA
Zone 1 - Downtown - - - - - - - - - -
Zone 2 - Beltline - - ** ** ** ** ** ** ** **
Zone 3 - North Hill - - ** ** 0.0 a 6.7 a ↑ ** ** 0.0 a 5.6 a ↑Zone 4 - Southwest ** ** 0.0 a ** 3.6 b ** 4.0 b ** 3.5 b 4.9 d -
Zone 5 - Southeast - - ** ** 1.9 a 4.4 a ↑ 3.0 a 2.0 a ↓ 2.5 a 3.1 a ↑Zone 6 - Northwest ** ** 1.5 a 9.1 a ↑ 1.6 a 5.1 a ↑ 3.1 b 4.7 b ↑ 2.2 a 5.1 a ↑Zone 7 - Northeast - - - - 2.7 a 3.9 a ↑ 1.2 a 1.4 a ↑ 1.9 a 2.4 a ↑Zone 8 - Chinook - - - - ** ** ** ** 9.3 a **
Zone 9 - Fish Creek ** ** ** ** 1.0 a ** 1.2 a 6.4 a ↑ 1.0 a 6.4 c ↑Calgary City (Zones 1-9) 0.0 a 0.0 a - 1.4 a 5.8 a ↑ 1.9 a 5.3 a ↑ 2.4 a 3.4 a ↑ 2.1 a 4.5 a ↑Zone 10 - Other Centres - - - - ** ** - - ** **
Calgary CMA 0.0 a 0.0 a - 1.4 a 5.8 a ↑ 1.9 a 5.3 a ↑ 2.4 a 3.4 a ↑ 2.1 a 4.5 a ↑
3 Bedroom + TotalZone
Bachelor 1 Bedroom 2 BedroomOct-14 Oct-15 Oct-14 Oct-15 Oct-14 Oct-15Oct-14 Oct-15 Oct-14 Oct-15
The following letter codes are used to indicate the reliability of the estimates:a - Excellent, b- Very good, c - Good, d - Fair (Use with Caution)
** Data suppressed to protect confidentiality or data not statistically reliable.n/u: No units exist in the universe for this category n/s: No units exist in the sample for this category n/a: Not applicable
indicates the year-over-year change is a statistically significant increase indicates the change is a statistically significant decrease- indicates that the change is not statistically significant
Please click Methodology or Data Reliability Tables Appendix link for more details
Rental Market Report - Calgary CMA - Date Released - Fall 2015
Canada Mortgage and Housing Corporation
19
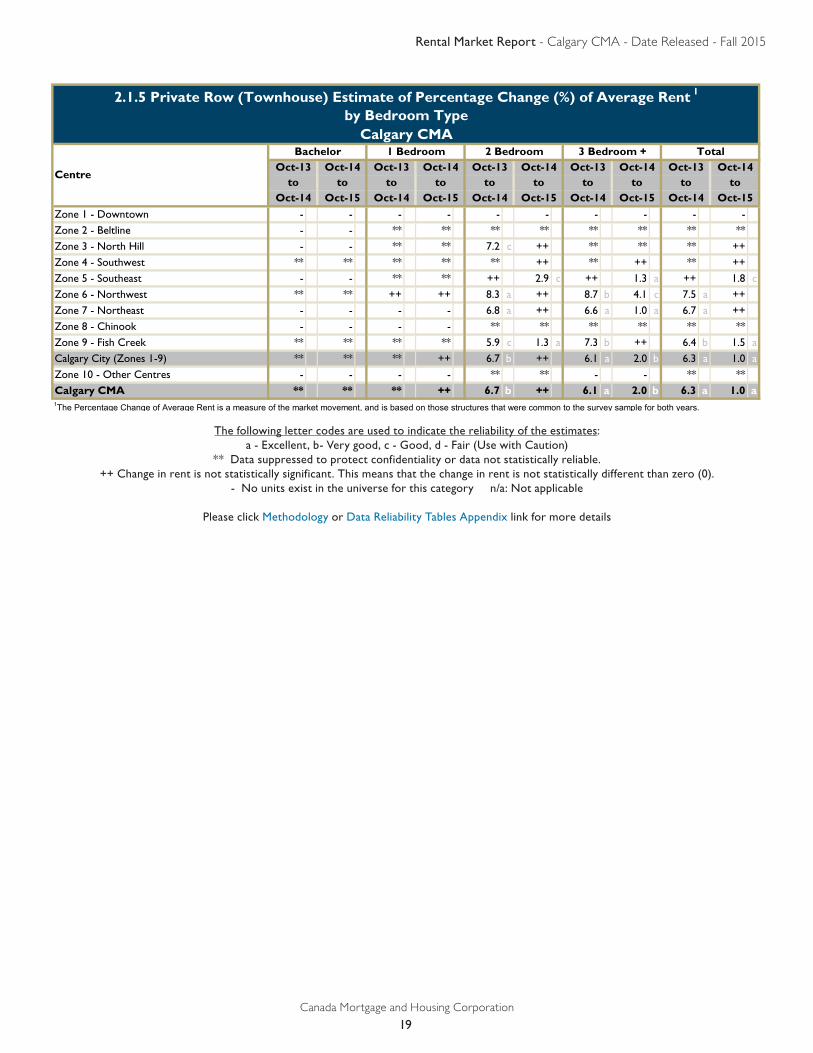
2.1.5 Private Row (Townhouse) Estimate of Percentage Change (%) of Average Rent 1
by Bedroom TypeCalgary CMA
Zone 1 - Downtown - - - - - - - - - -Zone 2 - Beltline - - ** ** ** ** ** ** ** **Zone 3 - North Hill - - ** ** 7.2 c ++ ** ** ** ++Zone 4 - Southwest ** ** ** ** ** ++ ** ++ ** ++Zone 5 - Southeast - - ** ** ++ 2.9 c ++ 1.3 a ++ 1.8 cZone 6 - Northwest ** ** ++ ++ 8.3 a ++ 8.7 b 4.1 c 7.5 a ++Zone 7 - Northeast - - - - 6.8 a ++ 6.6 a 1.0 a 6.7 a ++Zone 8 - Chinook - - - - ** ** ** ** ** **Zone 9 - Fish Creek ** ** ** ** 5.9 c 1.3 a 7.3 b ++ 6.4 b 1.5 aCalgary City (Zones 1-9) ** ** ** ++ 6.7 b ++ 6.1 a 2.0 b 6.3 a 1.0 aZone 10 - Other Centres - - - - ** ** - - ** **Calgary CMA ** ** ** ++ 6.7 b ++ 6.1 a 2.0 b 6.3 a 1.0 a
Oct-14 Oct-15to to
Oct-14 Oct-15to to
Oct-13 Oct-14 Oct-133 Bedroom + Total
Oct-13 Oct-14 Oct-13 Oct-14to to
2 Bedroom
Centre
Bachelor 1 Bedroom
to to to to
1The Percentage Change of Average Rent is a measure of the market movement, and is based on those structures that were common to the survey sample for both years.
Oct-14 Oct-15
Oct-14
Oct-14 Oct-15 Oct-14
Oct-13
Oct-15
Oct-14
The following letter codes are used to indicate the reliability of the estimates:a - Excellent, b- Very good, c - Good, d - Fair (Use with Caution)
** Data suppressed to protect confidentiality or data not statistically reliable.++ Change in rent is not statistically significant. This means that the change in rent is not statistically different than zero (0).
- No units exist in the universe for this category n/a: Not applicable
Please click Methodology or Data Reliability Tables Appendix link for more details
Rental Market Report - Calgary CMA - Date Released - Fall 2015
Canada Mortgage and Housing Corporation
20
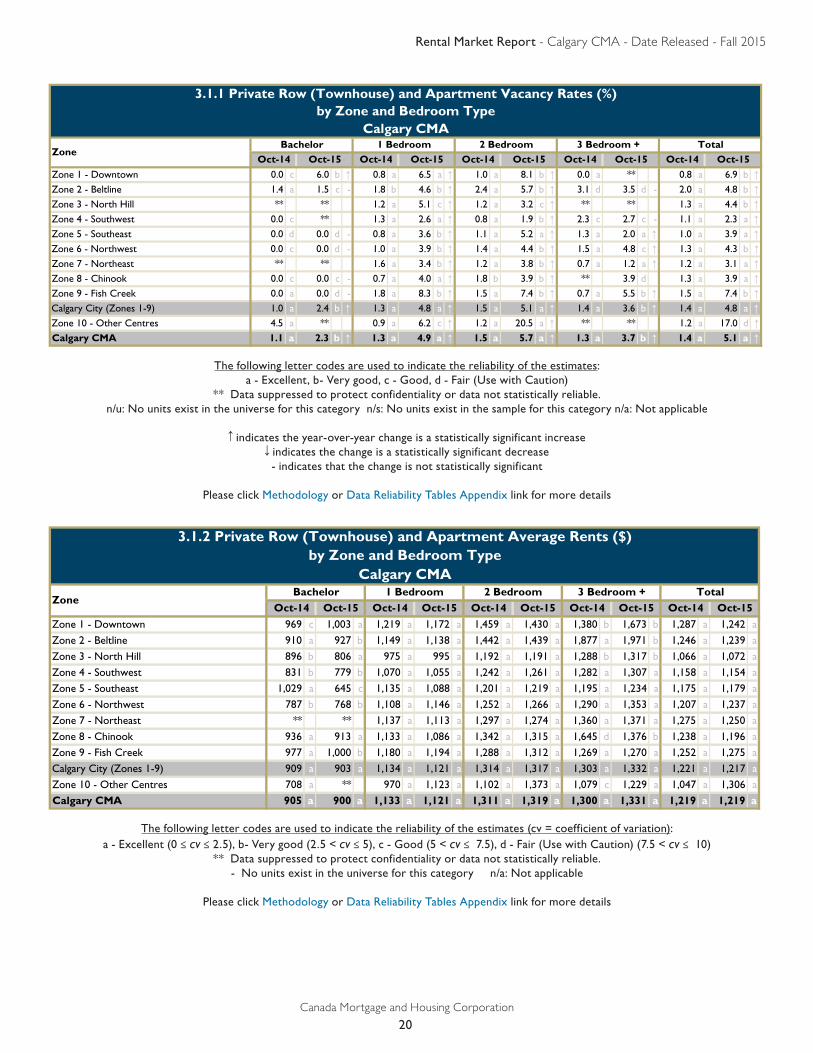
3.1.1 Private Row (Townhouse) and Apartment Vacancy Rates (%)by Zone and Bedroom Type
Calgary CMA
Zone 1 - Downtown 0.0 c 6.0 b ↑ 0.8 a 6.5 a ↑ 1.0 a 8.1 b ↑ 0.0 a ** 0.8 a 6.9 b ↑Zone 2 - Beltline 1.4 a 1.5 c - 1.8 b 4.6 b ↑ 2.4 a 5.7 b ↑ 3.1 d 3.5 d - 2.0 a 4.8 b ↑Zone 3 - North Hill ** ** 1.2 a 5.1 c ↑ 1.2 a 3.2 c ↑ ** ** 1.3 a 4.4 b ↑Zone 4 - Southwest 0.0 c ** 1.3 a 2.6 a ↑ 0.8 a 1.9 b ↑ 2.3 c 2.7 c - 1.1 a 2.3 a ↑Zone 5 - Southeast 0.0 d 0.0 d - 0.8 a 3.6 b ↑ 1.1 a 5.2 a ↑ 1.3 a 2.0 a ↑ 1.0 a 3.9 a ↑Zone 6 - Northwest 0.0 c 0.0 d - 1.0 a 3.9 b ↑ 1.4 a 4.4 b ↑ 1.5 a 4.8 c ↑ 1.3 a 4.3 b ↑Zone 7 - Northeast ** ** 1.6 a 3.4 b ↑ 1.2 a 3.8 b ↑ 0.7 a 1.2 a ↑ 1.2 a 3.1 a ↑Zone 8 - Chinook 0.0 c 0.0 c - 0.7 a 4.0 a ↑ 1.8 b 3.9 b ↑ ** 3.9 d 1.3 a 3.9 a ↑Zone 9 - Fish Creek 0.0 a 0.0 d - 1.8 a 8.3 b ↑ 1.5 a 7.4 b ↑ 0.7 a 5.5 b ↑ 1.5 a 7.4 b ↑Calgary City (Zones 1-9) 1.0 a 2.4 b ↑ 1.3 a 4.8 a ↑ 1.5 a 5.1 a ↑ 1.4 a 3.6 b ↑ 1.4 a 4.8 a ↑Zone 10 - Other Centres 4.5 a ** 0.9 a 6.2 c ↑ 1.2 a 20.5 a ↑ ** ** 1.2 a 17.0 d ↑Calgary CMA 1.1 a 2.3 b ↑ 1.3 a 4.9 a ↑ 1.5 a 5.7 a ↑ 1.3 a 3.7 b ↑ 1.4 a 5.1 a ↑
3 Bedroom + TotalZone
Bachelor 1 Bedroom 2 BedroomOct-14 Oct-15 Oct-14 Oct-15 Oct-14 Oct-15Oct-14 Oct-15 Oct-14 Oct-15
The following letter codes are used to indicate the reliability of the estimates:a - Excellent, b- Very good, c - Good, d - Fair (Use with Caution)
** Data suppressed to protect confidentiality or data not statistically reliable.n/u: No units exist in the universe for this category n/s: No units exist in the sample for this category n/a: Not applicable
indicates the year-over-year change is a statistically significant increase indicates the change is a statistically significant decrease- indicates that the change is not statistically significant
Please click Methodology or Data Reliability Tables Appendix link for more details
Zone 1 - Downtown 969 c 1,003 a 1,219 a 1,172 a 1,459 a 1,430 a 1,380 b 1,673 b 1,287 a 1,242 a
Zone 2 - Beltline 910 a 927 b 1,149 a 1,138 a 1,442 a 1,439 a 1,877 a 1,971 b 1,246 a 1,239 a
Zone 3 - North Hill 896 b 806 a 975 a 995 a 1,192 a 1,191 a 1,288 b 1,317 b 1,066 a 1,072 a
Zone 4 - Southwest 831 b 779 b 1,070 a 1,055 a 1,242 a 1,261 a 1,282 a 1,307 a 1,158 a 1,154 a
Zone 5 - Southeast 1,029 a 645 c 1,135 a 1,088 a 1,201 a 1,219 a 1,195 a 1,234 a 1,175 a 1,179 a
Zone 6 - Northwest 787 b 768 b 1,108 a 1,146 a 1,252 a 1,266 a 1,290 a 1,353 a 1,207 a 1,237 a
Zone 7 - Northeast ** ** 1,137 a 1,113 a 1,297 a 1,274 a 1,360 a 1,371 a 1,275 a 1,250 a
Zone 8 - Chinook 936 a 913 a 1,133 a 1,086 a 1,342 a 1,315 a 1,645 d 1,376 b 1,238 a 1,196 a
Zone 9 - Fish Creek 977 a 1,000 b 1,180 a 1,194 a 1,288 a 1,312 a 1,269 a 1,270 a 1,252 a 1,275 a
Calgary City (Zones 1-9) 909 a 903 a 1,134 a 1,121 a 1,314 a 1,317 a 1,303 a 1,332 a 1,221 a 1,217 a
Zone 10 - Other Centres 708 a ** 970 a 1,123 a 1,102 a 1,373 a 1,079 c 1,229 a 1,047 a 1,306 a
Calgary CMA 905 a 900 a 1,133 a 1,121 a 1,311 a 1,319 a 1,300 a 1,331 a 1,219 a 1,219 a
3.1.2 Private Row (Townhouse) and Apartment Average Rents ($)by Zone and Bedroom Type
Calgary CMA
ZoneBachelor 1 Bedroom 2 Bedroom 3 Bedroom + Total
Oct-14 Oct-15Oct-15 Oct-14 Oct-15 Oct-14Oct-15 Oct-14 Oct-15 Oct-14
The following letter codes are used to indicate the reliability of the estimates (cv = coefficient of variation):a - Excellent (0 ≤ cv ≤ 2.5), b- Very good (2.5 < cv ≤ 5), c - Good (5 < cv ≤ 7.5), d - Fair (Use with Caution) (7.5 < cv ≤ 10)
** Data suppressed to protect confidentiality or data not statistically reliable.- No units exist in the universe for this category n/a: Not applicable
Please click Methodology or Data Reliability Tables Appendix link for more details

Rental Market Report - Calgary CMA - Date Released - Fall 2015
Canada Mortgage and Housing Corporation
21
3.1.3 Number of Private Row (Townhouse) and Apartment Units in the Universeby Zone and Bedroom Type
Calgary CMA
Oct-14 Oct-15 Oct-14 Oct-15 Oct-14 Oct-15 Oct-14 Oct-15 Oct-14 Oct-15Zone 1 - Downtown 205 207 3,204 3,214 1,533 1,537 21 25 4,963 4,983
Zone 2 - Beltline 625 625 4,861 4,927 2,969 3,068 67 69 8,522 8,689
Zone 3 - North Hill 88 84 1,655 1,596 1,115 1,063 81 81 2,939 2,824
Zone 4 - Southwest 147 146 1,631 1,632 1,820 1,792 303 306 3,901 3,876
Zone 5 - Southeast 51 51 651 602 916 964 476 476 2,094 2,093
Zone 6 - Northwest 75 79 1,954 2,056 2,962 3,088 1,095 1,102 6,086 6,325
Zone 7 - Northeast 7 7 665 668 1,476 1,479 578 581 2,726 2,735
Zone 8 - Chinook 31 31 1,231 1,241 1,120 1,094 94 94 2,476 2,460
Zone 9 - Fish Creek 40 41 1,217 1,264 2,465 2,550 420 425 4,142 4,280
Calgary City (Zones 1-9) 1,269 1,271 17,069 17,200 16,376 16,635 3,135 3,159 37,849 38,265
Zone 10 - Other Centres 22 22 117 194 269 670 37 36 445 922
Calgary CMA 1,291 1,293 17,186 17,394 16,645 17,305 3,172 3,195 38,294 39,187
3 Bedroom + TotalZone
Bachelor 1 Bedroom 2 Bedroom
** Data suppressed to protect confidentiality or data not statistically reliable.- No units exist in the universe for this category n/a: Not applicable
Please click Methodology or Data Reliability Tables Appendix link for more details
3.1.4 Private Row (Townhouse) and Apartment Availability Rates (%)by Zone and Bedroom Type
Calgary CMA
Zone 1 - Downtown ** 7.4 b 2.1 a 9.7 a ↑ 2.1 a 10.4 c ↑ 0.0 a ** 2.1 a 9.7 a ↑Zone 2 - Beltline 1.8 c 3.6 d ↑ 3.0 a 7.5 b ↑ 3.5 b 7.8 a ↑ 3.1 d 3.5 d - 3.1 b 7.3 a ↑Zone 3 - North Hill ** ** 2.8 a 6.9 b ↑ 2.3 a 5.2 c ↑ ** ** 2.7 a 6.3 b ↑Zone 4 - Southwest 3.4 d 3.3 d - 2.6 a 4.8 b ↑ 1.8 a 4.5 b ↑ 5.2 d 5.2 d - 2.5 a 4.6 b ↑Zone 5 - Southeast 0.0 d 0.0 d - 2.1 a 6.2 a ↑ 3.1 a 7.0 a ↑ 2.7 a 2.0 a ↓ 2.6 a 5.5 a ↑Zone 6 - Northwest ** 0.0 d 2.6 a 6.1 b ↑ 3.0 b 6.4 a ↑ 3.0 c 6.0 c ↑ 2.9 a 6.2 a ↑Zone 7 - Northeast ** ** 3.4 b 4.6 a ↑ 2.5 a 5.0 a ↑ 1.2 a 1.9 a ↑ 2.4 a 4.2 a ↑Zone 8 - Chinook 3.4 d 0.0 c ↓ 2.2 a 9.7 b ↑ 3.7 b 9.5 b ↑ ** 3.9 d 3.0 a 9.2 a ↑Zone 9 - Fish Creek 0.0 a 0.0 d - 2.8 a 11.7 c ↑ 2.9 a 9.6 b ↑ 1.4 a 6.2 b ↑ 2.6 a 9.8 a ↑Calgary City (Zones 1-9) 2.3 b 4.2 c ↑ 2.6 a 7.7 a ↑ 2.8 a 7.4 a ↑ 2.6 a 4.4 b ↑ 2.7 a 7.2 a ↑Zone 10 - Other Centres 4.5 a ** 0.9 a 7.3 c ↑ 1.2 a 20.7 a ↑ ** ** 1.2 a 17.6 d ↑Calgary CMA 2.3 b 4.3 c ↑ 2.6 a 7.7 a ↑ 2.8 a 7.9 a ↑ 2.6 a 4.6 b ↑ 2.7 a 7.4 a ↑
3 Bedroom + TotalZone
Bachelor 1 Bedroom 2 BedroomOct-14 Oct-15 Oct-14 Oct-15 Oct-14 Oct-15Oct-14 Oct-15 Oct-14 Oct-15
The following letter codes are used to indicate the reliability of the estimates:a - Excellent, b- Very good, c - Good, d - Fair (Use with Caution)
** Data suppressed to protect confidentiality or data not statistically reliable.n/u: No units exist in the universe for this category n/s: No units exist in the sample for this category n/a: Not applicable
indicates the year-over-year change is a statistically significant increase indicates the change is a statistically significant decrease- indicates that the change is not statistically significant
Please click Methodology or Data Reliability Tables Appendix link for more details
Rental Market Report - Calgary CMA - Date Released - Fall 2015
Canada Mortgage and Housing Corporation
22
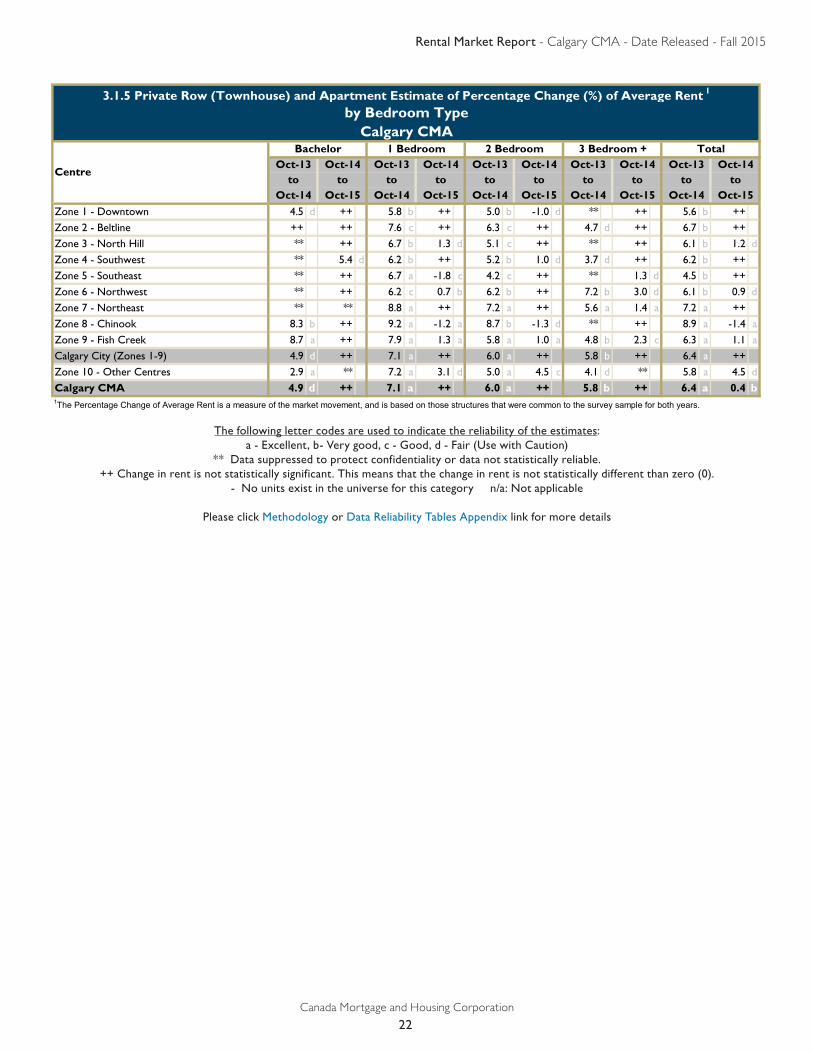
3.1.5 Private Row (Townhouse) and Apartment Estimate of Percentage Change (%) of Average Rent 1
by Bedroom TypeCalgary CMA
Zone 1 - Downtown 4.5 d ++ 5.8 b ++ 5.0 b -1.0 d ** ++ 5.6 b ++Zone 2 - Beltline ++ ++ 7.6 c ++ 6.3 c ++ 4.7 d ++ 6.7 b ++Zone 3 - North Hill ** ++ 6.7 b 1.3 d 5.1 c ++ ** ++ 6.1 b 1.2 dZone 4 - Southwest ** 5.4 d 6.2 b ++ 5.2 b 1.0 d 3.7 d ++ 6.2 b ++Zone 5 - Southeast ** ++ 6.7 a -1.8 c 4.2 c ++ ** 1.3 d 4.5 b ++Zone 6 - Northwest ** ++ 6.2 c 0.7 b 6.2 b ++ 7.2 b 3.0 d 6.1 b 0.9 dZone 7 - Northeast ** ** 8.8 a ++ 7.2 a ++ 5.6 a 1.4 a 7.2 a ++Zone 8 - Chinook 8.3 b ++ 9.2 a -1.2 a 8.7 b -1.3 d ** ++ 8.9 a -1.4 aZone 9 - Fish Creek 8.7 a ++ 7.9 a 1.3 a 5.8 a 1.0 a 4.8 b 2.3 c 6.3 a 1.1 aCalgary City (Zones 1-9) 4.9 d ++ 7.1 a ++ 6.0 a ++ 5.8 b ++ 6.4 a ++Zone 10 - Other Centres 2.9 a ** 7.2 a 3.1 d 5.0 a 4.5 c 4.1 d ** 5.8 a 4.5 dCalgary CMA 4.9 d ++ 7.1 a ++ 6.0 a ++ 5.8 b ++ 6.4 a 0.4 b
Oct-14 Oct-15to to
Oct-14 Oct-15to to
Oct-13 Oct-14 Oct-133 Bedroom + Total
Oct-13 Oct-14 Oct-13 Oct-14to to
2 Bedroom
Centre
Bachelor 1 Bedroom
to to to to
1The Percentage Change of Average Rent is a measure of the market movement, and is based on those structures that were common to the survey sample for both years.
Oct-14 Oct-15
Oct-14
Oct-14 Oct-15 Oct-14
Oct-13
Oct-15
Oct-14
The following letter codes are used to indicate the reliability of the estimates:a - Excellent, b- Very good, c - Good, d - Fair (Use with Caution)
** Data suppressed to protect confidentiality or data not statistically reliable.++ Change in rent is not statistically significant. This means that the change in rent is not statistically different than zero (0).
- No units exist in the universe for this category n/a: Not applicable
Please click Methodology or Data Reliability Tables Appendix link for more details
Rental Market Report - Calgary CMA - Date Released - Fall 2015
Canada Mortgage and Housing Corporation
23
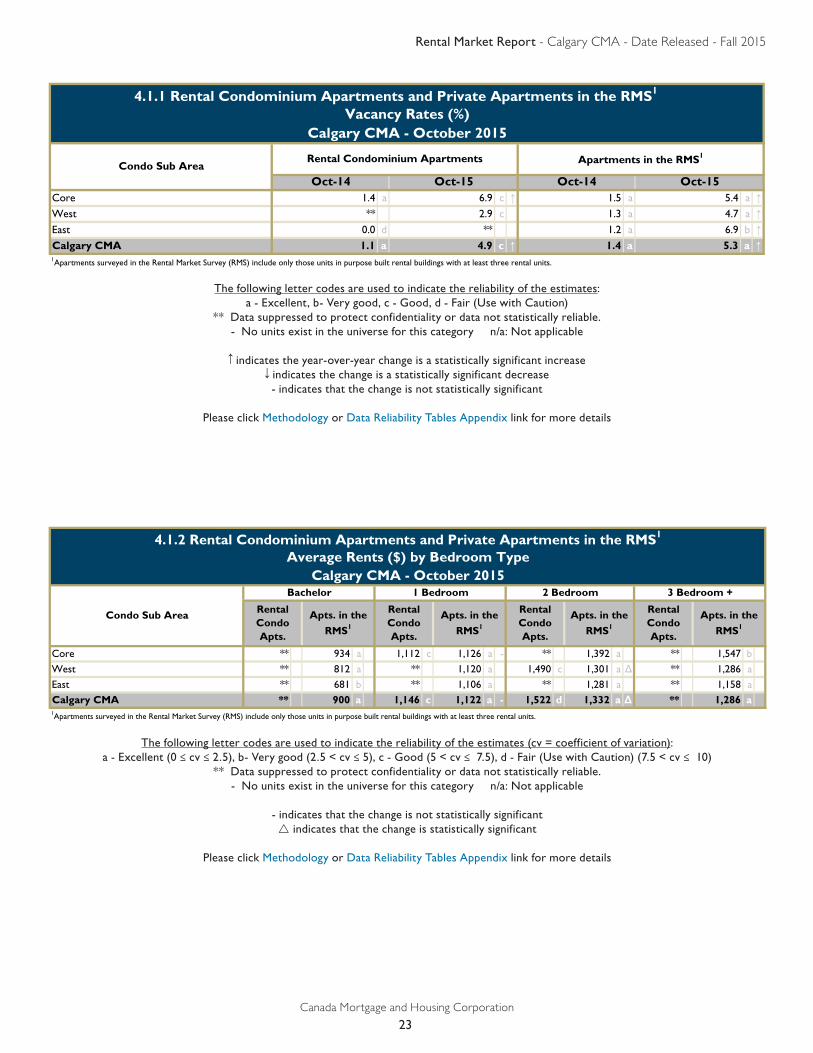
Core 1.4 a 6.9 c ↑ 1.5 a 5.4 a ↑West ** 2.9 c 1.3 a 4.7 a ↑East 0.0 d ** 1.2 a 6.9 b ↑Calgary CMA 1.1 a 4.9 c ↑ 1.4 a 5.3 a ↑
Oct-15
1Apartments surveyed in the Rental Market Survey (RMS) include only those units in purpose built rental buildings with at least three rental units.
Rental Condominium Apartments Apartments in the RMS1
4.1.1 Rental Condominium Apartments and Private Apartments in the RMS1
Vacancy Rates (%)Calgary CMA - October 2015
Condo Sub AreaOct-14 Oct-15 Oct-14
Core ** 934 a 1,112 c 1,126 a - ** 1,392 a ** 1,547 b
West ** 812 a ** 1,120 a 1,490 c 1,301 a Δ ** 1,286 a
East ** 681 b ** 1,106 a ** 1,281 a ** 1,158 a
Calgary CMA ** 900 a 1,146 c 1,122 a - 1,522 d 1,332 a Δ ** 1,286 a
4.1.2 Rental Condominium Apartments and Private Apartments in the RMS1
Average Rents ($) by Bedroom TypeCalgary CMA - October 2015
Condo Sub Area
Bachelor 1 Bedroom 2 Bedroom 3 Bedroom +
Apts. in the
RMS1
Apts. in the
RMS1
1Apartments surveyed in the Rental Market Survey (RMS) include only those units in purpose built rental buildings with at least three rental units.
Rental Condo Apts.
Apts. in the
RMS1
Rental Condo Apts.
Rental Condo Apts.
Apts. in the
RMS1
Rental Condo Apts.
The following letter codes are used to indicate the reliability of the estimates:a - Excellent, b- Very good, c - Good, d - Fair (Use with Caution)
** Data suppressed to protect confidentiality or data not statistically reliable.- No units exist in the universe for this category n/a: Not applicable
indicates the year-over-year change is a statistically significant increase indicates the change is a statistically significant decrease- indicates that the change is not statistically significant
Please click Methodology or Data Reliability Tables Appendix link for more details
The following letter codes are used to indicate the reliability of the estimates (cv = coefficient of variation):a - Excellent (0 ≤ cv ≤ 2.5), b- Very good (2.5 < cv ≤ 5), c - Good (5 < cv ≤ 7.5), d - Fair (Use with Caution) (7.5 < cv ≤ 10)
** Data suppressed to protect confidentiality or data not statistically reliable.- No units exist in the universe for this category n/a: Not applicable
- indicates that the change is not statistically significantr indicates that the change is statistically significant
Please click Methodology or Data Reliability Tables Appendix link for more details
Rental Market Report - Calgary CMA - Date Released - Fall 2015
Canada Mortgage and Housing Corporation
24
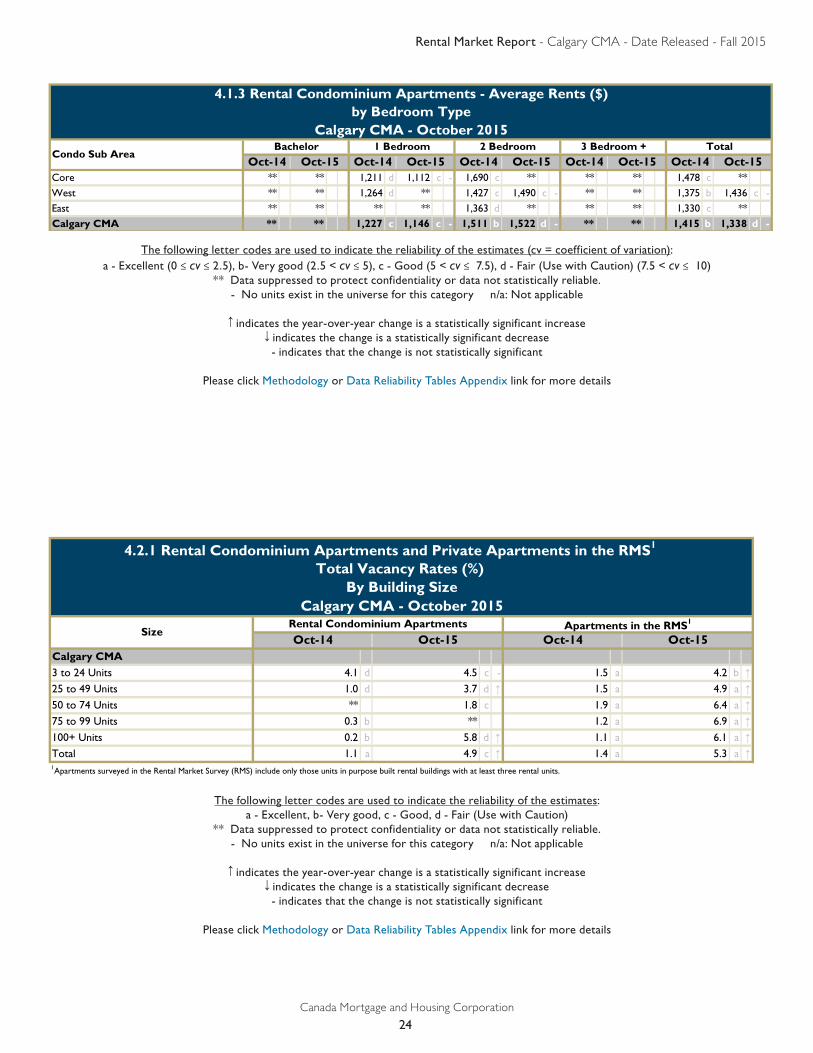
4.1.3 Rental Condominium Apartments - Average Rents ($)by Bedroom Type
Calgary CMA - October 2015
Core ** ** 1,211 d 1,112 c - 1,690 c ** ** ** 1,478 c ** West ** ** 1,264 d ** 1,427 c 1,490 c - ** ** 1,375 b 1,436 c -East ** ** ** ** 1,363 d ** ** ** 1,330 c ** Calgary CMA ** ** 1,227 c 1,146 c - 1,511 b 1,522 d - ** ** 1,415 b 1,338 d -
Oct-14 Oct-153 Bedroom + Total
Oct-14 Oct-15Condo Sub Area
Bachelor 1 Bedroom 2 Bedroom
Oct-14 Oct-15Oct-14 Oct-15 Oct-14 Oct-15
The following letter codes are used to indicate the reliability of the estimates (cv = coefficient of variation):a - Excellent (0 ≤ cv ≤ 2.5), b- Very good (2.5 < cv ≤ 5), c - Good (5 < cv ≤ 7.5), d - Fair (Use with Caution) (7.5 < cv ≤ 10)
** Data suppressed to protect confidentiality or data not statistically reliable.- No units exist in the universe for this category n/a: Not applicable
indicates the year-over-year change is a statistically significant increase indicates the change is a statistically significant decrease- indicates that the change is not statistically significant
Please click Methodology or Data Reliability Tables Appendix link for more details
Calgary CMA3 to 24 Units 4.1 d 4.5 c - 1.5 a 4.2 b ↑25 to 49 Units 1.0 d 3.7 d ↑ 1.5 a 4.9 a ↑50 to 74 Units ** 1.8 c 1.9 a 6.4 a ↑75 to 99 Units 0.3 b ** 1.2 a 6.9 a ↑100+ Units 0.2 b 5.8 d ↑ 1.1 a 6.1 a ↑Total 1.1 a 4.9 c ↑ 1.4 a 5.3 a ↑
Rental Condominium Apartments Apartments in the RMS1
Oct-14
1Apartments surveyed in the Rental Market Survey (RMS) include only those units in purpose built rental buildings with at least three rental units.
Oct-15
4.2.1 Rental Condominium Apartments and Private Apartments in the RMS1
By Building SizeTotal Vacancy Rates (%)
Calgary CMA - October 2015
Oct-14 Oct-15Size
The following letter codes are used to indicate the reliability of the estimates:a - Excellent, b- Very good, c - Good, d - Fair (Use with Caution)
** Data suppressed to protect confidentiality or data not statistically reliable.- No units exist in the universe for this category n/a: Not applicable
indicates the year-over-year change is a statistically significant increase indicates the change is a statistically significant decrease- indicates that the change is not statistically significant
Please click Methodology or Data Reliability Tables Appendix link for more details
Rental Market Report - Calgary CMA - Date Released - Fall 2015
Canada Mortgage and Housing Corporation
25
Oct-14 Oct-15Core 20,855 20,691 7,157 a 7,056 a 34.3 a 34.1 a - 1.4 a 6.9 c ↑West 23,909 24,464 6,555 a 7,157 a 27.4 a 29.3 a - ** 2.9 c
East 8,217 9,253 2,376 d 2,572 d 28.9 d 27.8 d - 0.0 d **
Calgary CMA 52,981 54,408 16,236 a 16,810 a 30.6 a 30.9 a - 1.1 a 4.9 c ↑
4.3.1 Condominium Universe, Rental Units, Percentage of Units in Rental and Vacancy RateCondominium Apartments
Calgary CMA - October 2015
Rental Units 1Percentage of Units in
RentalVacancy Rate
Condominium Universe
1Columns may not add in the estimated number of Rental Units due to a) rounding or b) variability due to sampling.
Oct-14 Oct-15Condo Sub Area
Oct-14 Oct-15 Oct-14 Oct-15
Oct-14 Oct-15Calgary CMA3 to 24 Units 4,231 4,242 1,561 a 1,450 a 36.9 a 34.2 a - 4.1 d 4.5 c -
25 to 49 Units 6,638 6,695 1,977 a 1,869 a 29.8 a 27.9 a - 1.0 d 3.7 d ↑50 to 74 Units 4,759 5,157 1,399 d 1,254 d 29.4 d 24.3 d ↓ ** 1.8 c
75 to 99 Units 3,410 3,272 ** ** ** ** 0.3 b **
100+ Units 33,943 35,042 10,114 a 11,222 a 29.8 a 32.0 a - 0.2 b 5.8 d ↑Total 52,981 54,408 16,236 a 16,810 a 30.6 a 30.9 a - 1.1 a 4.9 c ↑
4.3.2 Condominium Universe, Rental Units, Percentage of Units in Rental and Vacancy RateCondominium Apartments By Project Size
Calgary CMA - October 2015
Rental Units 1Percentage of Units in
RentalVacancy Rate
Condominium Universe
1Columns may not add in the estimated number of Rental Units due to a) rounding or b) variability due to sampling.
Oct-14 Oct-15
Condo Sub Area
Oct-14 Oct-15 Oct-14 Oct-15
The following letter codes are used to indicate the reliability of the estimates:a - Excellent, b- Very good, c - Good, d - Fair (Use with Caution)
** Data suppressed to protect confidentiality or data not statistically reliable.- No units exist in the universe for this category n/a: Not applicable
indicates the year-over-year change is a statistically significant increase indicates the change is a statistically significant decrease- indicates that the change is not statistically significant
Please click Methodology or Data Reliability Tables Appendix link for more details
Rental Market Report - Calgary CMA - Date Released - Fall 2015
Canada Mortgage and Housing Corporation
26
Calgary CMASingle Detached ** ** ** ** ** ** ** 1,635 b ** 1,598 b
Semi detached, Row and Duplex ** ** ** ** ** 1,202 b 1,334 b 1,393 b - 1,287 b 1,343 b -
Other-Primarily Accessory Suites ** ** ** 788 c 1,122 c 1,025 c - ** ** 1,025 c **
Total ** ** 802 d ** ** 1,214 c 1,584 b 1,534 b - 1,449 b 1,398 b -
Oct-14
5.1 Other Secondary Rented Unit1 Average Rents ($)by Dwelling Type
Calgary CMA - October 2015Bachelor 1 Bedroom 2 Bedroom 3 Bedroom + Total
Oct-15
1Statistics for secondary rented units exclude apartments in purpose built rental structures with three rental units or more, condominium apartments, units in institutions, and any dwelling whose type could not be identified in the survey.
Oct-14 Oct-15 Oct-14 Oct-15Oct-14 Oct-15 Oct-14 Oct-15
The following letter codes are used to indicate the reliability of the estimates (cv = coefficient of variation):a - Excellent (0 ≤ cv ≤ 2.5), b- Very good (2.5 < cv ≤ 5), c - Good (5 < cv ≤ 7.5), d - Fair (Use with Caution) (7.5 < cv ≤ 10)
** Data suppressed to protect confidentiality or data not statistically reliable.- No units exist in the universe for this category n/a: Not applicable
indicates the year-over-year change is a statistically significant increase indicates the change is a statistically significant decrease- indicates that the change is not statistically significant
Please click Methodology or Data Reliability Tables Appendix link for more details
Calgary CMASingle Detached 32,327 c 31,156 c ↓Semi detached, Row and Duplex 26,164 c 28,688 d ↑Other-Primarily Accessory Suites ** **
Total 66,607 68,045 1Statistics for secondary rented units exclude apartments in purpose built rental structures with three rental units or more, condominium apartments, units in institutions, and any dwelling whose type could not be identified in the survey.
5.2 Estimated Number of Households in Other Secondary Rented Units 1
by Dwelling TypeCalgary CMA - October 2015
Oct-14 Oct-15
Estimated Number of Households in Other
Secondary Rented Units1
The following letter codes are used to indicate the reliability of the estimates:a - Excellent, b- Very good, c - Good, d - Fair (Use with Caution)
** Data suppressed to protect confidentiality or data not statistically reliable.- No units exist in the universe for this category n/a: Not applicable
indicates the year-over-year change is a statistically significant increase indicates the change is a statistically significant decrease- indicates that the change is not statistically significant
Please click Methodology or Data Reliability Tables Appendix link for more details
Rental Market Report - Calgary CMA - Date Released - Fall 2015
Canada Mortgage and Housing Corporation
27
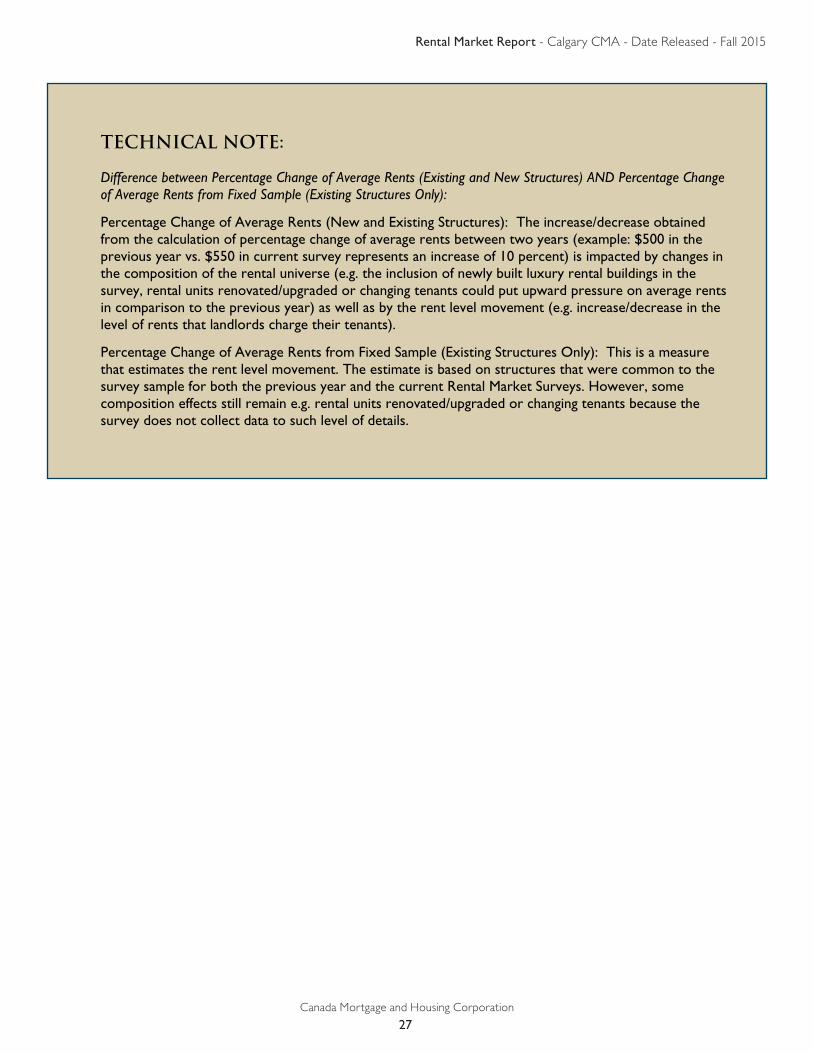
Technical note: Difference between Percentage Change of Average Rents (Existing and New Structures) AND Percentage Change of Average Rents from Fixed Sample (Existing Structures Only):
Percentage Change of Average Rents (New and Existing Structures): The increase/decrease obtained from the calculation of percentage change of average rents between two years (example: $500 in the previous year vs. $550 in current survey represents an increase of 10 percent) is impacted by changes in the composition of the rental universe (e.g. the inclusion of newly built luxury rental buildings in the survey, rental units renovated/upgraded or changing tenants could put upward pressure on average rents in comparison to the previous year) as well as by the rent level movement (e.g. increase/decrease in the level of rents that landlords charge their tenants).
Percentage Change of Average Rents from Fixed Sample (Existing Structures Only): This is a measure that estimates the rent level movement. The estimate is based on structures that were common to the survey sample for both the previous year and the current Rental Market Surveys. However, some composition effects still remain e.g. rental units renovated/upgraded or changing tenants because the survey does not collect data to such level of details.
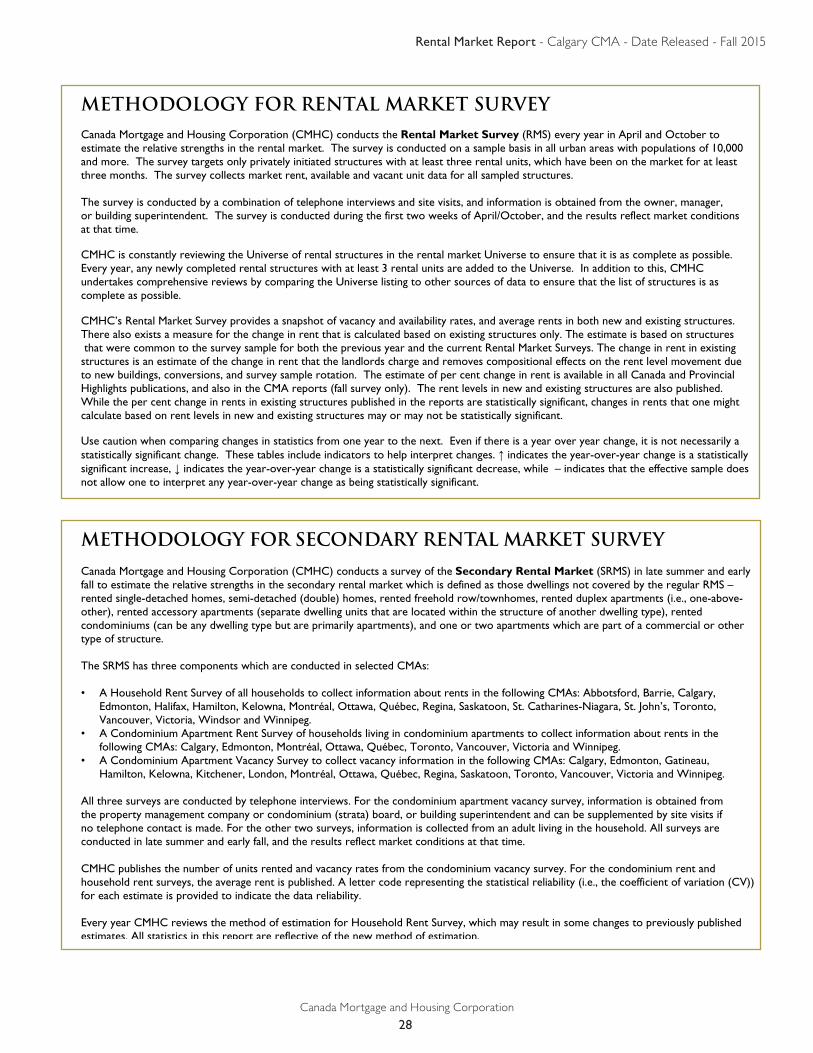
Rental Market Report - Calgary CMA - Date Released - Fall 2015
Canada Mortgage and Housing Corporation
28
METHODOLOGY FOR RENTAL MARKET SURVEY Canada Mortgage and Housing Corporation (CMHC) conducts the Rental Market Survey (RMS) every year in April and October to estimate the relative strengths in the rental market. The survey is conducted on a sample basis in all urban areas with populations of 10,000 and more. The survey targets only privately initiated structures with at least three rental units, which have been on the market for at least three months. The survey collects market rent, available and vacant unit data for all sampled structures. The survey is conducted by a combination of telephone interviews and site visits, and information is obtained from the owner, manager, or building superintendent. The survey is conducted during the first two weeks of April/October, and the results reflect market conditions at that time. CMHC is constantly reviewing the Universe of rental structures in the rental market Universe to ensure that it is as complete as possible. Every year, any newly completed rental structures with at least 3 rental units are added to the Universe. In addition to this, CMHC undertakes comprehensive reviews by comparing the Universe listing to other sources of data to ensure that the list of structures is as complete as possible. CMHC’s Rental Market Survey provides a snapshot of vacancy and availability rates, and average rents in both new and existing structures. There also exists a measure for the change in rent that is calculated based on existing structures only. The estimate is based on structures that were common to the survey sample for both the previous year and the current Rental Market Surveys. The change in rent in existing structures is an estimate of the change in rent that the landlords charge and removes compositional effects on the rent level movement due to new buildings, conversions, and survey sample rotation. The estimate of per cent change in rent is available in all Canada and Provincial Highlights publications, and also in the CMA reports (fall survey only). The rent levels in new and existing structures are also published. While the per cent change in rents in existing structures published in the reports are statistically significant, changes in rents that one might calculate based on rent levels in new and existing structures may or may not be statistically significant. Use caution when comparing changes in statistics from one year to the next. Even if there is a year over year change, it is not necessarily a statistically significant change. These tables include indicators to help interpret changes. ↑ indicates the year-over-year change is a statistically significant increase, ↓ indicates the year-over-year change is a statistically significant decrease, while – indicates that the effective sample does not allow one to interpret any year-over-year change as being statistically significant.
METHODOLOGY FOR SECONDARY RENTAL MARKET SURVEY Canada Mortgage and Housing Corporation (CMHC) conducts a survey of the Secondary Rental Market (SRMS) in late summer and early fall to estimate the relative strengths in the secondary rental market which is defined as those dwellings not covered by the regular RMS – rented single-detached homes, semi-detached (double) homes, rented freehold row/townhomes, rented duplex apartments (i.e., one-above-other), rented accessory apartments (separate dwelling units that are located within the structure of another dwelling type), rented condominiums (can be any dwelling type but are primarily apartments), and one or two apartments which are part of a commercial or other type of structure. The SRMS has three components which are conducted in selected CMAs: • A Household Rent Survey of all households to collect information about rents in the following CMAs: Abbotsford, Barrie, Calgary,
Edmonton, Halifax, Hamilton, Kelowna, Montréal, Ottawa, Québec, Regina, Saskatoon, St. Catharines-Niagara, St. John’s, Toronto, Vancouver, Victoria, Windsor and Winnipeg.
• A Condominium Apartment Rent Survey of households living in condominium apartments to collect information about rents in the following CMAs: Calgary, Edmonton, Montréal, Ottawa, Québec, Toronto, Vancouver, Victoria and Winnipeg.
• A Condominium Apartment Vacancy Survey to collect vacancy information in the following CMAs: Calgary, Edmonton, Gatineau, Hamilton, Kelowna, Kitchener, London, Montréal, Ottawa, Québec, Regina, Saskatoon, Toronto, Vancouver, Victoria and Winnipeg.
All three surveys are conducted by telephone interviews. For the condominium apartment vacancy survey, information is obtained from the property management company or condominium (strata) board, or building superintendent and can be supplemented by site visits if no telephone contact is made. For the other two surveys, information is collected from an adult living in the household. All surveys are conducted in late summer and early fall, and the results reflect market conditions at that time. CMHC publishes the number of units rented and vacancy rates from the condominium vacancy survey. For the condominium rent and household rent surveys, the average rent is published. A letter code representing the statistical reliability (i.e., the coefficient of variation (CV)) for each estimate is provided to indicate the data reliability. Every year CMHC reviews the method of estimation for Household Rent Survey, which may result in some changes to previously published estimates. All statistics in this report are reflective of the new method of estimation.
Rental Market Report - Calgary CMA - Date Released - Fall 2015
Canada Mortgage and Housing Corporation
29
Definitions Availability: A rental unit is considered available if the existing tenant has given, or has received, notice to move, and a new tenant has not signed a lease; or the unit is vacant (see definition of vacancy below). Rent: The rent refers to the actual amount tenants pay for their unit. No adjustments are made for the inclusion or exclusion of amenities and services such as heat, hydro, parking, and hot water. For available and vacant units, the rent is the amount the owner is asking for the unit. It should be noted that the average rents reported in this publication provide a sound indication of the amounts paid by unit size and geographical sector. Utilities such as heating, electricity and hot water may or may not be included in the rent. Rental Apartment Structure: Any building containing three or more rental units, of which at least one unit is not ground oriented. Owner-occupied units are not included in the rental building unit count. Rental Row (Townhouse) Structure: Any building containing three or more rental units, all of which are ground oriented with vertical divisions. Owner-occupied units are not included in the rental building unit count. These row units in some centres are commonly referred to as townhouses. Vacancy: A unit is considered vacant if, at the time of the survey, it is physically unoccupied and available for immediate rental. Definitions of Census Areas referred to in this publication are as follows: A census metropolitan area (CMA) or a census agglomeration (CA) is formed by one or more adjacent municipalities centred on a large urban area (known as the urban core). The census population count of the urban core is at least 10,000 to form a census agglomeration and at least 100,000 to form a census metropolitan area. To be included in the CMA or CA, other adjacent municipalities must have a high degree of integration with the central urban area, as measured by commuting flows derived from census place of work data. CMAs and CAs contain whole municipalities or Census Subdivisions. Data presented is based on Statistics Canada’s 2011 Census area definitions. Acknowledgement The Rental Market Survey and the Secondary Rental Market Survey could not have been conducted without the cooperation of the rental property owners, managers, building superintendents and household members throughout Canada. CMHC acknowledges their hard work and assistance in providing timely and accurate information. As a result of their contribution, CMHC is able to provide information that benefits the entire housing industry.
Rental Market Report - Calgary CMA - Date Released - Fall 2015
Canada Mortgage and Housing Corporation
30
CMHC—Home to Canadians
Canada Mortgage and Housing Corporation (CMHC) has been Canada's national housing agency for almost 70 years.
CMHC helps Canadians meet their housing needs. As Canada’s authority on housing, we contribute to the stability of the housing market and financial system, provide support for Canadians in housing need, and offer objective housing research and information to Canadian governments, consumers and the housing industry. Prudent risk management, strong corporate governance and transparency are cornerstones of our operations.
For more information, visit our website at www.cmhc.ca or follow us on Twitter, YouTube, LinkedIn and Facebook.
You can also reach us by phone at 1-800-668-2642 or by fax at 1-800-245-9274.
Outside Canada call 613-748-2003 or fax to 613-748-2016.
Canada Mortgage and Housing Corporation supports the Government of Canada policy on access to information for people with disabilities. If you wish to obtain this publication in alternative formats, call 1-800-668-2642.
The Market Analysis Centre’s (MAC) electronic suite of national standardized products is available for free on CMHC’s website. You can view, print, download or subscribe to future editions and get market information e-mailed automatically to you the same day it is released. It’s quick and convenient! Go to www.cmhc.ca/en/hoficlincl/homain
For more information on MAC and the wealth of housing market information available to you, visit us today at www.cmhc.ca/housingmarketinformation
To subscribe to printed editions of MAC publications, call 1-800-668-2642.
©2015 Canada Mortgage and Housing Corporation. All rights reserved. CMHC grants reasonable rights of use of this publication’s content solely for personal, corporate or public policy research, and educational purposes. This permission consists of the right to use the content for general reference purposes in written analyses and in the reporting of results, conclusions, and forecasts including the citation of limited amounts of supporting data extracted from this publication. Reasonable and limited rights of use are also permitted in commercial publications subject to the above criteria, and CMHC’s right to request that such use be discontinued for any reason.
Any use of the publication’s content must include the source of the information, including statistical data, acknowledged as follows:
Source: CMHC (or “Adapted from CMHC,” if appropriate), name of product, year and date of publication issue.
Other than as outlined above, the content of the publication cannot be reproduced or transmitted to any person or, if acquired by an organization, to users outside the organization. Placing the publication, in whole or part, on a website accessible to the public or on any website accessible to persons not directly employed by the organization is not permitted. To use the content of any CMHC Market Analysis publication for any purpose other than the general reference purposes set out above or to request permission to reproduce large portions of, or entire CMHC Market Analysis publications, please complete the CMHC Copyright request form and email it to CMHC’s Canadian Housing Information Centre at [email protected]. For permission, please provide CHIC with the following information: Publication’s name, year and date of issue.
Without limiting the generality of the foregoing, no portion of the content may be translated from English or French into any other language without the prior written permission of Canada Mortgage and Housing Corporation.
The information, analyses and opinions contained in this publication are based on various sources believed to be reliable, but their accuracy cannot be guaranteed. The information, analyses and opinions shall not be taken as representations for which Canada Mortgage and Housing Corporation or any of its employees shall incur responsibility.
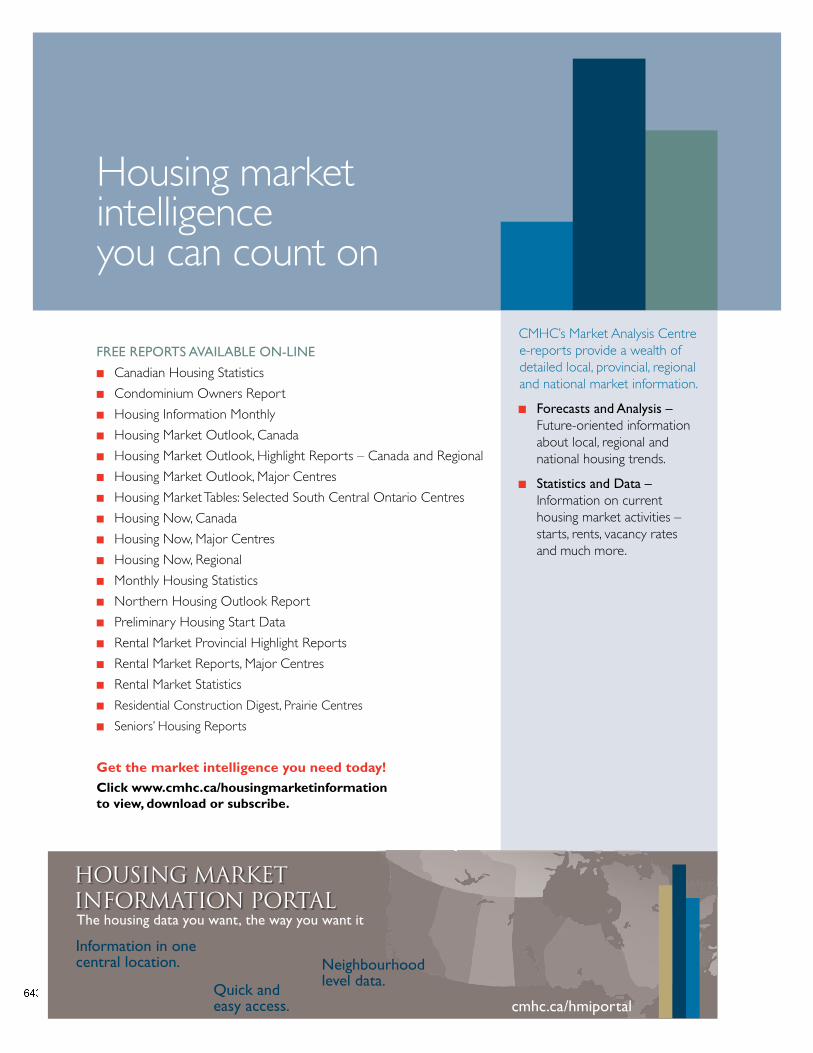
CMHC’s Market Analysis Centre e-reports provide a wealth of detailed local, provincial, regional and national market information.
Forecasts and Analysis – Future-oriented information about local, regional and national housing trends.
Statistics and Data – Information on current housing market activities – starts, rents, vacancy rates and much more.
FREE REPORTS AVAILABLE ON-LINE
n Canadian Housing Statistics
n Condominium Owners Report
n Housing Information Monthly
n Housing Market Outlook, Canada
n Housing Market Outlook, Highlight Reports – Canada and Regional
n Housing Market Outlook, Major Centres
n Housing Market Tables: Selected South Central Ontario Centres
n Housing Now, Canada
n Housing Now, Major Centres
n Housing Now, Regional
n Monthly Housing Statistics
n Northern Housing Outlook Report
n Preliminary Housing Start Data
n Rental Market Provincial Highlight Reports
n Rental Market Reports, Major Centres
n Rental Market Statistics
n Residential Construction Digest, Prairie Centres
n Seniors’ Housing Reports
Get the market intelligence you need today!Click www.cmhc.ca/housingmarketinformation to view, download or subscribe.
Housing market intelligence you can count on
Quick and easy access.
Information in one central location.
The housing data you want, the way you want it
HOUSING MARKET INFORMATION PORTAL
Neighbourhood level data.
cmhc.ca/hmiportal