December 2015 - CREB Stats for the Calgary Real Estate Market
28
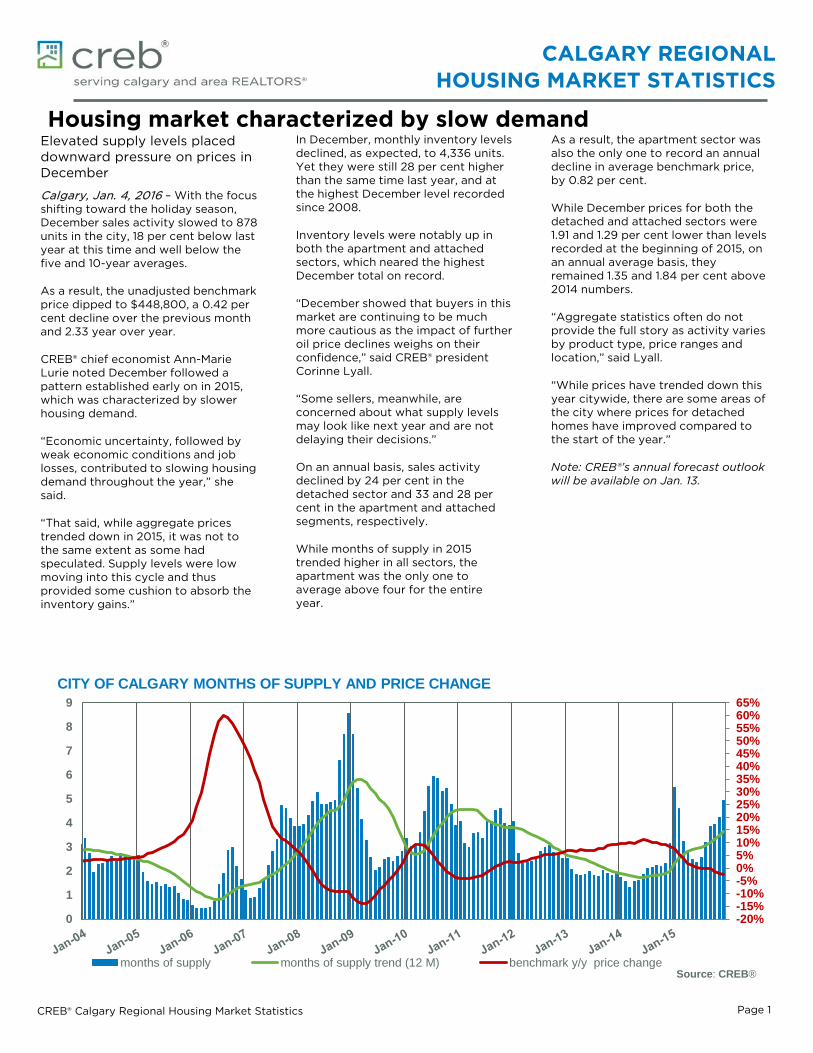
CALGARY REGIONAL HOUSING MARKET STATISTICS CREB® Calgary Regional Housing Market Statistics Page 1 Housing market characterized by slow demand CITY OF CALGARY MONTHS OF SUPPLY AND PRICE CHANGE Elevated supply levels placed downward pressure on prices in December Calgary, Jan. 4, 2016 – With the focus shifting toward the holiday season, December sales activity slowed to 878 units in the city, 18 per cent below last year at this time and well below the five and 10-year averages. As a result, the unadjusted benchmark price dipped to $448,800, a 0.42 per cent decline over the previous month and 2.33 year over year. CREB® chief economist Ann-Marie Lurie noted December followed a pattern established early on in 2015, which was characterized by slower housing demand. “Economic uncertainty, followed by weak economic conditions and job losses, contributed to slowing housing demand throughout the year,” she said. “That said, while aggregate prices trended down in 2015, it was not to the same extent as some had speculated. Supply levels were low moving into this cycle and thus provided some cushion to absorb the inventory gains.” In December, monthly inventory levels declined, as expected, to 4,336 units. Yet they were still 28 per cent higher than the same time last year, and at the highest December level recorded since 2008. Inventory levels were notably up in both the apartment and attached sectors, which neared the highest December total on record. “December showed that buyers in this market are continuing to be much more cautious as the impact of further oil price declines weighs on their confidence,” said CREB® president Corinne Lyall. “Some sellers, meanwhile, are concerned about what supply levels may look like next year and are not delaying their decisions.” On an annual basis, sales activity declined by 24 per cent in the detached sector and 33 and 28 per cent in the apartment and attached segments, respectively. While months of supply in 2015 trended higher in all sectors, the apartment was the only one to average above four for the entire year. As a result, the apartment sector was also the only one to record an annual decline in average benchmark price, by 0.82 per cent. While December prices for both the detached and attached sectors were 1.91 and 1.29 per cent lower than levels recorded at the beginning of 2015, on an annual average basis, they remained 1.35 and 1.84 per cent above 2014 numbers. “Aggregate statistics often do not provide the full story as activity varies by product type, price ranges and location,” said Lyall. “While prices have trended down this year citywide, there are some areas of the city where prices for detached homes have improved compared to the start of the year.” Note: CREB®’s annual forecast outlook will be available on Jan. 13. -20% -15% -10% -5% 0% 5% 10% 15% 20% 25% 30% 35% 40% 45% 50% 55% 60% 65% 0 1 2 3 4 5 6 7 8 9 months of supply months of supply trend (12 M) benchmark y/y price change Source: CREB®
-
Upload
jerry-charlton -
Category
Real Estate
-
view
207 -
download
2
Transcript of December 2015 - CREB Stats for the Calgary Real Estate Market
CALGARY REGIONALHOUSING MARKET STATISTICS
CREB® Calgary Regional Housing Market Statistics Page 1
Housing market characterized by slow demand
CITY OF CALGARY MONTHS OF SUPPLY AND PRICE CHANGE
Elevated supply levels placed downward pressure on prices in December
Calgary, Jan. 4, 2016 – With the focus shifting toward the holiday season, December sales activity slowed to 878 units in the city, 18 per cent below last year at this time and well below the five and 10-year averages. As a result, the unadjusted benchmark price dipped to $448,800, a 0.42 per cent decline over the previous month and 2.33 year over year. CREB® chief economist Ann-Marie Lurie noted December followed a pattern established early on in 2015, which was characterized by slower housing demand. “Economic uncertainty, followed by weak economic conditions and job losses, contributed to slowing housing demand throughout the year,” she said. “That said, while aggregate prices trended down in 2015, it was not to the same extent as some had speculated. Supply levels were low moving into this cycle and thus provided some cushion to absorb the inventory gains.”
In December, monthly inventory levels declined, as expected, to 4,336 units. Yet they were still 28 per cent higher than the same time last year, and at the highest December level recorded since 2008. Inventory levels were notably up in both the apartment and attached sectors, which neared the highest December total on record. “December showed that buyers in this market are continuing to be much more cautious as the impact of further oil price declines weighs on their confidence,” said CREB® president Corinne Lyall. “Some sellers, meanwhile, are concerned about what supply levels may look like next year and are not delaying their decisions.” On an annual basis, sales activity declined by 24 per cent in the detached sector and 33 and 28 per cent in the apartment and attached segments, respectively. While months of supply in 2015 trended higher in all sectors, the apartment was the only one to average above four for the entire year.
As a result, the apartment sector was also the only one to record an annual decline in average benchmark price, by 0.82 per cent. While December prices for both the detached and attached sectors were 1.91 and 1.29 per cent lower than levels recorded at the beginning of 2015, on an annual average basis, they remained 1.35 and 1.84 per cent above 2014 numbers. “Aggregate statistics often do not provide the full story as activity varies by product type, price ranges and location,” said Lyall. “While prices have trended down this year citywide, there are some areas of the city where prices for detached homes have improved compared to the start of the year.” Note: CREB®’s annual forecast outlook will be available on Jan. 13.
-20%-15%-10%-5%0%5%10%15%20%25%30%35%40%45%50%55%60%65%
0
1
2
3
4
5
6
7
8
9
months of supply months of supply trend (12 M) benchmark y/y price changeSource: CREB®
Summary Stats Economic RegionTotal Residential
C R E B ® C a l g a r y R e g i o n a l H o u s i n g M a r k e t S t a t i s t i c s
Page 2
Dec-14 Dec-15 Y/Y % Change
2014 2015 Y/Y % Change
CITY OF CALGARYm_ YTTotal Sales 1,073 878 -18.17% 25,543 18,830 -26.28%m_ YTTotal Sales Volume $506,456,293 $406,213,194 -19.79% $12,313,571,788 $8,837,612,978 -28.23%m_ YTNew Listings 1,368 1,483 8.41% 36,173 33,860 -6.39%m_ YTInventory 3,384 4,336 28.13% 4,069 5,287 29.96%
Months of Supply 3.15 4.94 56.59% 1.91 3.37 76.29%Sales to New Listings Ratio 0.78 0.59 -19.23% 0.71 0.56 -15.00%
m_YTSales to List Price Ratio 97.54% 96.36% -1.18% 98.31% 97.35% -0.95%m_YTDays on Market 43 49 15.81% 33 41 24.24%m_YTBenchmark Price $459,500 $448,800 -2.33% $449,267 $454,267 1.11%m_YTMedian Price $415,000 $407,750 -1.75% $425,600 $424,000 -0.38%m_YTAverage Price $472,000 $462,657 -1.98% $482,072 $469,337 -2.64%m_YTIndex 214 209 -2.33% 210 212 1.11%
SURROUNDING AREAm_ YTTotal Sales 220 210 -4.55% 5,830 4,562 -21.75%m_ YTTotal Sales Volume $103,832,261 $104,369,205 0.52% $2,794,172,310 $2,176,608,350 -22.10%m_ YTNew Listings 303 380 25.41% 8,759 8,728 -0.35%m_ YTInventory 1,203 1,536 27.68% 1,562 1,918 22.82%
Months of Supply 5.47 7.31 33.76% 3.21 5.05 56.96%Sales to New Listings Ratio 0.73 0.55 -17.34% 0.67 0.52 -14.29%
m_YTSales to List Price Ratio 96.75% 96.21% -0.54% 97.44% 96.42% -1.02%m_YTDays on Market 62 71 15.20% 51 59 15.69%m_YTBenchmark Price $430,000 $422,300 -1.79% $416,692 $431,392 3.53%m_YTMedian Price $400,250 $420,500 5.06% $407,500 $406,000 -0.37%m_YTAverage Price $471,965 $496,996 5.30% $479,275 $477,117 -0.45%m_YTIndex 190 186 -1.79% 184 190 3.53%
CREB® ECONOMIC REGIONm_ YTTotal Sales 1,293 1,088 -15.85% 31,373 23,392 -25.44%m_ YTTotal Sales Volume $610,288,554 $510,582,399 -16.34% $15,107,744,098 $11,014,221,327 -27.10%m_ YTNew Listings 1,671 1,863 11.49% 44,932 42,588 -5.22%m_ YTInventory 4,587 5,872 28.01% 5,631 7,206 27.96%
Months of Supply 3.55 5.40 52.13% 2.15 3.70 71.62%Sales to New Listings Ratio 0.77 0.58 -18.98% 0.70 0.55 -14.90%
m_YTSales to List Price Ratio 97.40% 96.33% -1.07% 98.15% 97.17% -0.98%m_YTDays on Market 46 54 16.75% 37 45 21.62%m_YTBenchmark Price $454,400 $443,900 -2.31% $444,275 $449,975 1.28%m_YTMedian Price $414,500 $410,000 -1.09% $423,000 $420,000 -0.71%m_YTAverage Price $471,994 $469,285 -0.57% $481,552 $470,854 -2.22%m_YTIndex 211 206 -2.32% 206 209 1.28%
For a list of definitions, see page 28.
Summary Stats City of Calgary
C R E B ® C a l g a r y R e g i o n a l H o u s i n g M a r k e t S t a t i s t i c s
Page 3
Dec-14 Dec-15 Y/Y % Change 2014 2015 Y/Y %
ChangeDETACHED
m_CYTTotal Sales 604 533 -11.75% 15,093 11,517 -23.69%m_CYTTotal Sales Volume $332,787,864 $284,414,465 -14.54% $8,410,927,056 $6,184,512,909 -26.47%m_CYTNew Listings 761 793 4.20% 21,066 19,319 -8.29%m_CYTInventory 1,791 2,138 19.37% 2,294 2,811 22.55%
Months of Supply 2.97 4.01 35.28% 1.82 2.93 60.60%Sales to New Listings Ratio 0.79 0.67 -12.16% 0.72 0.60 -12.03%
m_YTSales to List Price Ratio 97.55% 96.28% -1.27% 98.31% 97.36% -0.95%m_YTDays on Market 41 47 16.72% 31 38 22.58%m_YTBenchmark Price $518,600 $508,700 -1.91% $507,200 $514,050 1.35%m_YTMedian Price $476,000 $455,000 -4.41% $487,500 $479,900 -1.56%m_YTAverage Price $550,973 $533,611 -3.15% $557,273 $536,990 -3.64%m_YTIndex 215 211 -1.91% 210 213 1.35%
ATTACHEDm_CYTTotal Sales 247 194 -21.46% 5,649 4,085 -27.69%m_CYTTotal Sales Volume $102,927,687 $75,860,557 -26.30% $2,346,507,325 $1,654,448,524 -29.49%m_CYTNew Listings 303 349 15.18% 7,722 7,529 -2.50%m_CYTInventory 740 1,078 45.68% 808 1,188 47.13%
Months of Supply 3.00 5.56 85.47% 1.72 3.49 103.46%Sales to New Listings Ratio 0.82 0.56 -25.93% 0.73 0.54 -18.90%
m_YTSales to List Price Ratio 97.73% 96.84% -0.89% 98.54% 97.56% -0.98%m_YTDays on Market 45 49 10.13% 32 42 31.25%m_YTBenchmark Price $356,200 $351,400 -1.35% $348,092 $354,508 1.84%m_YTMedian Price $345,000 $332,430 -3.64% $349,900 $347,000 -0.83%m_YTAverage Price $416,711 $391,034 -6.16% $415,385 $405,006 -2.50%m_YTIndex 209 206 -1.34% 204 208 1.85%
APARTMENTm_CYTTotal Sales 222 151 -31.98% 4,801 3,228 -32.76%m_CYTTotal Sales Volume $70,740,742 $45,938,172 -35.06% $1,556,137,407 $998,651,545 -35.82%m_CYTNew Listings 304 341 12.17% 7,385 7,012 -5.05%m_CYTInventory 853 1,120 31.30% 967 1,289 33.20%
Months of Supply 3.84 7.42 93.04% 2.42 4.79 98.11%Sales to New Listings Ratio 0.73 0.44 -28.74% 0.65 0.46 -18.97%
m_YTSales to List Price Ratio 97.19% 96.07% -1.12% 97.92% 96.92% -0.99%m_YTDays on Market 46 56 23.29% 38 48 26.32%m_YTBenchmark Price $300,400 $285,500 -4.96% $294,617 $292,208 -0.82%m_YTMedian Price $288,900 $286,500 -0.83% $285,000 $274,000 -3.86%m_YTAverage Price $318,652 $304,226 -4.53% $324,128 $309,372 -4.55%m_YTIndex 210 200 -4.95% 206 204 -0.83%
CITY OF CALGARYm_CYTTotal Sales 1,073 878 -18.17% 25,543 18,830 -26.28%m_CYTTotal Sales Volume $506,456,293 $406,213,194 -19.79% $12,313,571,788 $8,837,612,978 -28.23%m_CYTNew Listings 1,368 1,483 8.41% 36,173 33,860 -6.39%m_CYTInventory 3,384 4,336 28.13% 4,069 5,287 29.96%
Months of Supply 3.15 4.94 56.59% 1.91 3.37 76.29%Sales to New Listings Ratio 0.78 0.59 -19.23% 0.71 0.56 -15.00%
m_YTSales to List Price Ratio 97.54% 96.36% -1.18% 98.31% 97.35% -0.95%m_YTDays on Market 43 49 15.81% 33 41 24.24%m_YTBenchmark Price $459,500 $448,800 -2.33% $449,267 $454,267 1.11%m_YTMedian Price $415,000 $407,750 -1.75% $425,600 $424,000 -0.38%m_YTAverage Price $472,000 $462,657 -1.98% $482,072 $469,337 -2.64%m_YTIndex 214 209 -2.33% 210 212 1.11%
For a list of definitions, see page 28.
Summary Stats Census Metropolitan AreaTotal Residential
C R E B ® C a l g a r y R e g i o n a l H o u s i n g M a r k e t S t a t i s t i c s
Page 4
Dec-14 Dec-15 Y/Y % Change 2014 2015 Y/Y %
ChangeCITY OF CALGARY
m_CYTDTotal Sales 1,073 878 -18.17% 25,543 18,830 -26.28%m_CYTDTotal Sales Volume $506,456,293 $406,213,194 -19.79% $12,313,571,788 $8,837,612,978 -28.23%m_CYTDNew Listings 1,368 1,483 8.41% 36,173 33,860 -6.39%m_CYTDInventory 3,384 4,336 28.13% 4,069 5,287 29.96%
Months of Supply 3.15 4.94 56.59% 1.91 3.37 76.29%Sales to New Listings Ratio 0.78 0.59 -19.23% 0.71 0.56 -15.00%
m_cYTDSales to List Price Ratio 97.54% 96.36% -1.18% 98.31% 97.35% -0.95%m_cYTDDays on Market 43 49 15.81% 33 41 24.24%m_cYTDBenchmark Price $459,500 $448,800 -2.33% $449,267 $454,267 1.11%m_cYTDMedian Price $415,000 $407,750 -1.75% $425,600 $424,000 -0.38%m_cYTDAverage Price $472,000 $462,657 -1.98% $482,072 $469,337 -2.64%m_cYTDIndex 214 209 -2.33% 210 212 1.11%
AIRDRIEm_a YTDTotal Sales 64 66 3.13% 1,695 1,424 -15.99%m_a YTDTotal Sales Volume $25,345,175 $24,393,966 -3.75% $656,140,203 $555,659,567 -15.31%m_a YTDNew Listings 80 88 10.00% 2,188 2,289 4.62%m_a YTDInventory 170 289 70.00% 212 347 64.00%
Months of Supply 2.66 4.38 64.85% 1.50 2.93 95.22%Sales to New Listings Ratio 0.80 0.75 -5.00% 0.77 0.62 -15.26%
m_aYTDSales to List Price Ratio 97.97% 97.61% -0.36% 98.63% 98.09% -0.54%m_aYTDDays on Market 45 58 28.00% 33 43 30.30%m_aYTDBenchmark Price $376,600 $368,500 -2.15% $363,017 $373,467 2.88%m_aYTDMedian Price $400,000 $365,450 -8.64% $388,000 $387,625 -0.10%m_aYTDAverage Price $396,018 $369,606 -6.67% $387,103 $390,210 0.80%m_aYTDIndex 199 195 -2.16% 192 197 2.88%
ROCKYVIEWm_MYTDTotal Sales 74 76 2.70% 1,953 1,469 -24.78%m_MYTDTotal Sales Volume $41,263,049 $45,453,640 10.16% $1,181,794,804 $877,320,831 -25.76%m_MYTDNew Listings 128 146 14.06% 3,273 3,221 -1.59%m_MYTDInventory 537 628 16.95% 686 790 15.08%
Months of Supply 7.26 8.26 13.87% 4.22 6.45 53.00%Sales to New Listings Ratio 0.58 0.52 -5.76% 0.60 0.46 -14.06%
m_ YTDSales to List Price Ratio 96.48% 95.59% -0.90% 96.91% 95.85% -1.07%m_ YTDDays on Market 70 77 10.74% 60 64 6.67%m_ YTDBenchmark Price $554,700 $544,500 -1.84% $534,983 $558,183 4.34%m_ YTDMedian Price $475,000 $472,500 -0.53% $490,500 $487,000 -0.71%m_ YTDAverage Price $557,609 $598,074 7.26% $605,118 $597,223 -1.30%m_ YTDIndex 180 176 -1.84% 173 181 4.34%
CALGARY CMAm_CYTDTotal Sales 1,211 1,020 -15.77% 29,191 21,723 -25.58%m_CYTDTotal Sales Volume $573,064,517 $476,060,800 -16.93% $14,151,506,795 $10,270,593,376 -27.42%m_CYTDNew Listings 1,576 1,717 8.95% 41,634 39,370 -5.44%m_CYTDInventory 4,091 5,253 28.40% 4,967 6,425 29.36%
Months of Supply 3.38 5.15 52.45% 2.04 3.55 73.83%Sales to New Listings Ratio 0.77 0.59 -17.43% 0.70 0.55 -14.94%
m_CYTDSales to List Price Ratio 97.48% 96.35% -1.13% 98.20% 97.26% -0.94%m_CYTDDays on Market 44 52 17.04% 34 42 23.53%m_CYTDBenchmark Price $459,200 $448,400 -2.35% $448,650 $454,192 1.24%m_CYTDMedian Price $417,000 $410,000 -1.68% $426,500 $424,000 -0.59%m_CYTDAverage Price $473,216 $466,726 -1.37% $484,790 $472,798 -2.47%m_CYTDIndex 212 207 -2.35% 208 210 1.24%
For a list of definitions, see page 28.
Summary Stats Surrounding AreaTotal Residential
C R E B ® C a l g a r y R e g i o n a l H o u s i n g M a r k e t S t a t i s t i c s
Page 5
Dec-14 Dec-15 Y/Y % Change 2014 2015 Y/Y % Change
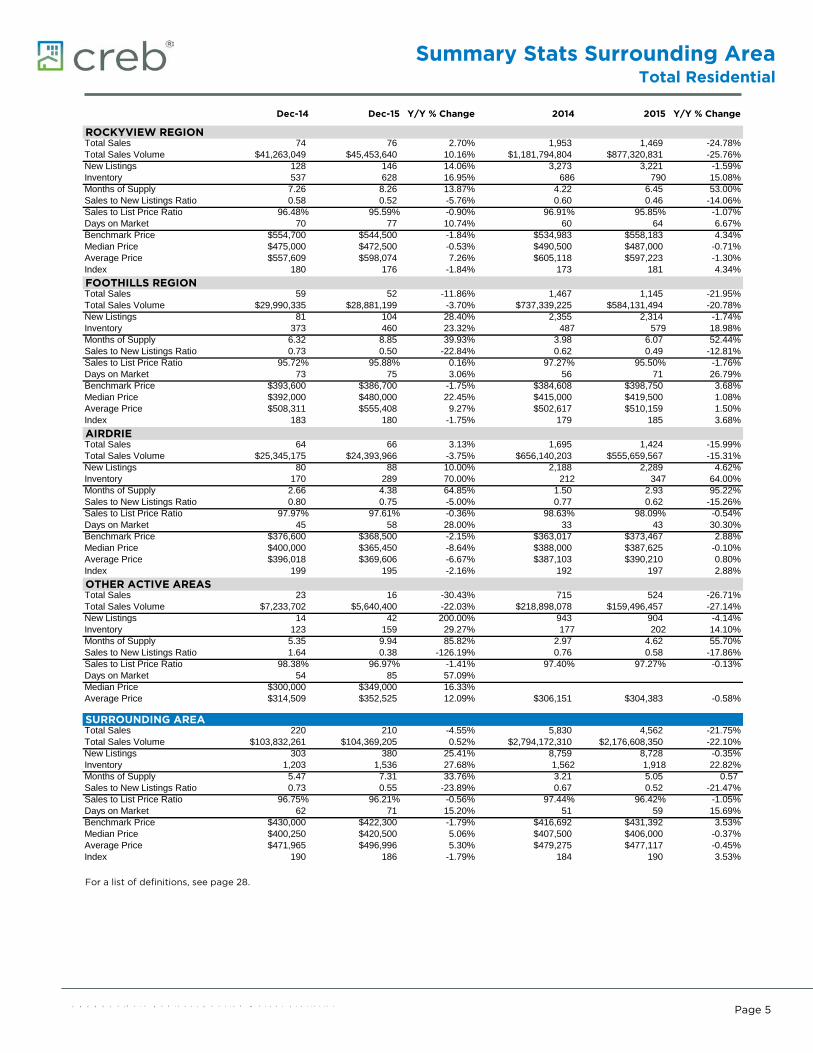
ROCKYVIEW REGIONm_mYTDTotal Sales 74 76 2.70% 1,953 1,469 -24.78%m_mYTDTotal Sales Volume $41,263,049 $45,453,640 10.16% $1,181,794,804 $877,320,831 -25.76%m_mYTDNew Listings 128 146 14.06% 3,273 3,221 -1.59%m_mYTDInventory 537 628 16.95% 686 790 15.08%
Months of Supply 7.26 8.26 13.87% 4.22 6.45 53.00%Sales to New Listings Ratio 0.58 0.52 -5.76% 0.60 0.46 -14.06%
m_ YTDSales to List Price Ratio 96.48% 95.59% -0.90% 96.91% 95.85% -1.07%m_ YTDDays on Market 70 77 10.74% 60 64 6.67%m_ YTDBenchmark Price $554,700 $544,500 -1.84% $534,983 $558,183 4.34%m_ YTDMedian Price $475,000 $472,500 -0.53% $490,500 $487,000 -0.71%m_ YTDAverage Price $557,609 $598,074 7.26% $605,118 $597,223 -1.30%m_ YTDIndex 180 176 -1.84% 173 181 4.34%
FOOTHILLS REGIONm_mYTDTotal Sales 59 52 -11.86% 1,467 1,145 -21.95%m_mYTDTotal Sales Volume $29,990,335 $28,881,199 -3.70% $737,339,225 $584,131,494 -20.78%m_mYTDNew Listings 81 104 28.40% 2,355 2,314 -1.74%m_mYTDInventory 373 460 23.32% 487 579 18.98%
Months of Supply 6.32 8.85 39.93% 3.98 6.07 52.44%Sales to New Listings Ratio 0.73 0.50 -22.84% 0.62 0.49 -12.81%
m_ YTDSales to List Price Ratio 95.72% 95.88% 0.16% 97.27% 95.50% -1.76%m_ YTDDays on Market 73 75 3.06% 56 71 26.79%m_ YTDBenchmark Price $393,600 $386,700 -1.75% $384,608 $398,750 3.68%m_ YTDMedian Price $392,000 $480,000 22.45% $415,000 $419,500 1.08%m_ YTDAverage Price $508,311 $555,408 9.27% $502,617 $510,159 1.50%m_ YTDIndex 183 180 -1.75% 179 185 3.68%
AIRDRIEm_a YTDTotal Sales 64 66 3.13% 1,695 1,424 -15.99%m_a YTDTotal Sales Volume $25,345,175 $24,393,966 -3.75% $656,140,203 $555,659,567 -15.31%m_a YTDNew Listings 80 88 10.00% 2,188 2,289 4.62%m_a YTDInventory 170 289 70.00% 212 347 64.00%
Months of Supply 2.66 4.38 64.85% 1.50 2.93 95.22%Sales to New Listings Ratio 0.80 0.75 -5.00% 0.77 0.62 -15.26%
m_aYTDSales to List Price Ratio 97.97% 97.61% -0.36% 98.63% 98.09% -0.54%m_aYTDDays on Market 45 58 28.00% 33 43 30.30%m_aYTDBenchmark Price $376,600 $368,500 -2.15% $363,017 $373,467 2.88%m_aYTDMedian Price $400,000 $365,450 -8.64% $388,000 $387,625 -0.10%m_aYTDAverage Price $396,018 $369,606 -6.67% $387,103 $390,210 0.80%m_aYTDIndex 199 195 -2.16% 192 197 2.88%
OTHER ACTIVE AREASm_OYTDTotal Sales 23 16 -30.43% 715 524 -26.71%m_OYTDTotal Sales Volume $7,233,702 $5,640,400 -22.03% $218,898,078 $159,496,457 -27.14%m_OYTDNew Listings 14 42 200.00% 943 904 -4.14%m_OYTDInventory 123 159 29.27% 177 202 14.10%
Months of Supply 5.35 9.94 85.82% 2.97 4.62 55.70%Sales to New Listings Ratio 1.64 0.38 -126.19% 0.76 0.58 -17.86%
m_OYTDSales to List Price Ratio 98.38% 96.97% -1.41% 97.40% 97.27% -0.13%m_OYTDDays on Market 54 85 57.09% #DIV/0!m_OYTDMedian Price $300,000 $349,000 16.33% #N/A #N/A #N/Am_OYTDAverage Price $314,509 $352,525 12.09% $306,151 $304,383 -0.58%
SURROUNDING AREAm_SYTDTotal Sales 220 210 -4.55% 5,830 4,562 -21.75%m_SYTDTotal Sales Volume $103,832,261 $104,369,205 0.52% $2,794,172,310 $2,176,608,350 -22.10%m_SYTDNew Listings 303 380 25.41% 8,759 8,728 -0.35%m_SYTDInventory 1,203 1,536 27.68% 1,562 1,918 22.82%
Months of Supply 5.47 7.31 33.76% 3.21 5.05 0.57 Sales to New Listings Ratio 0.73 0.55 -23.89% 0.67 0.52 -21.47%
m_SYTDSales to List Price Ratio 96.75% 96.21% -0.56% 97.44% 96.42% -1.05%m_SYTDDays on Market 62 71 15.20% 51 59 15.69%m_SYTDBenchmark Price $430,000 $422,300 -1.79% $416,692 $431,392 3.53%m_SYTDMedian Price $400,250 $420,500 5.06% $407,500 $406,000 -0.37%m_SYTDAverage Price $471,965 $496,996 5.30% $479,275 $477,117 -0.45%m_SYTDIndex 190 186 -1.79% 184 190 3.53%
For a list of definitions, see page 28.
Price Comparisons
C R E B ® C a l g a r y R e g i o n a l H o u s i n g M a r k e t S t a t i s t i c s
Page 6
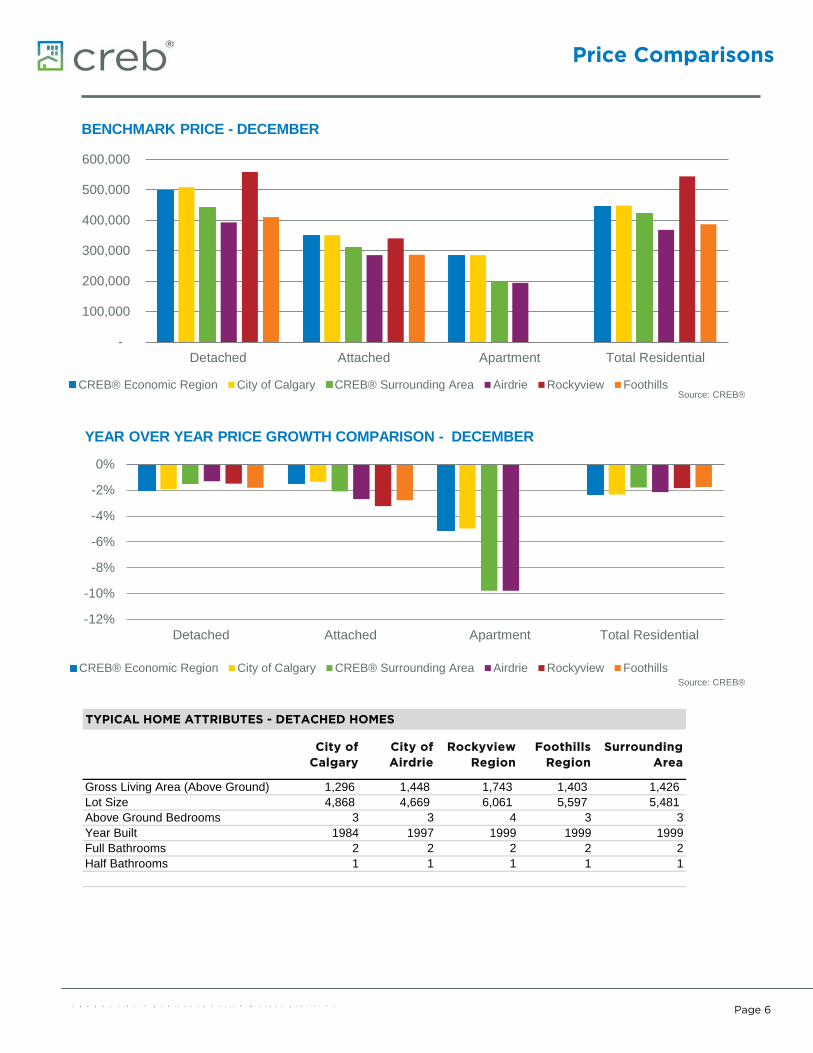
TYPICAL HOME ATTRIBUTES - DETACHED HOMES
City of Calgary
City of Airdrie
Rockyview Region
Foothills Region
Surrounding Area
Gross Living Area (Above Ground) 1,296 1,448 1,743 1,403 1,426 Lot Size 4,868 4,669 6,061 5,597 5,481 Above Ground Bedrooms 3 3 4 3 3Year Built 1984 1997 1999 1999 1999Full Bathrooms 2 2 2 2 2Half Bathrooms 1 1 1 1 1
-
100,000
200,000
300,000
400,000
500,000
600,000
Detached Attached Apartment Total Residential
BENCHMARK PRICE - DECEMBER
CREB® Economic Region City of Calgary CREB® Surrounding Area Airdrie Rockyview FoothillsSource: CREB®
-12%
-10%
-8%
-6%
-4%
-2%
0%
Detached Attached Apartment Total Residential
YEAR OVER YEAR PRICE GROWTH COMPARISON - DECEMBER
CREB® Economic Region City of Calgary CREB® Surrounding Area Airdrie Rockyview FoothillsSource: CREB®
Area Comparisons
C R E B ® C a l g a r y R e g i o n a l H o u s i n g M a r k e t S t a t i s t i c s
Page 7
-
5.0
10.0
15.0
20.0
25.0
30.0
35.0
Detached Attached Apartment
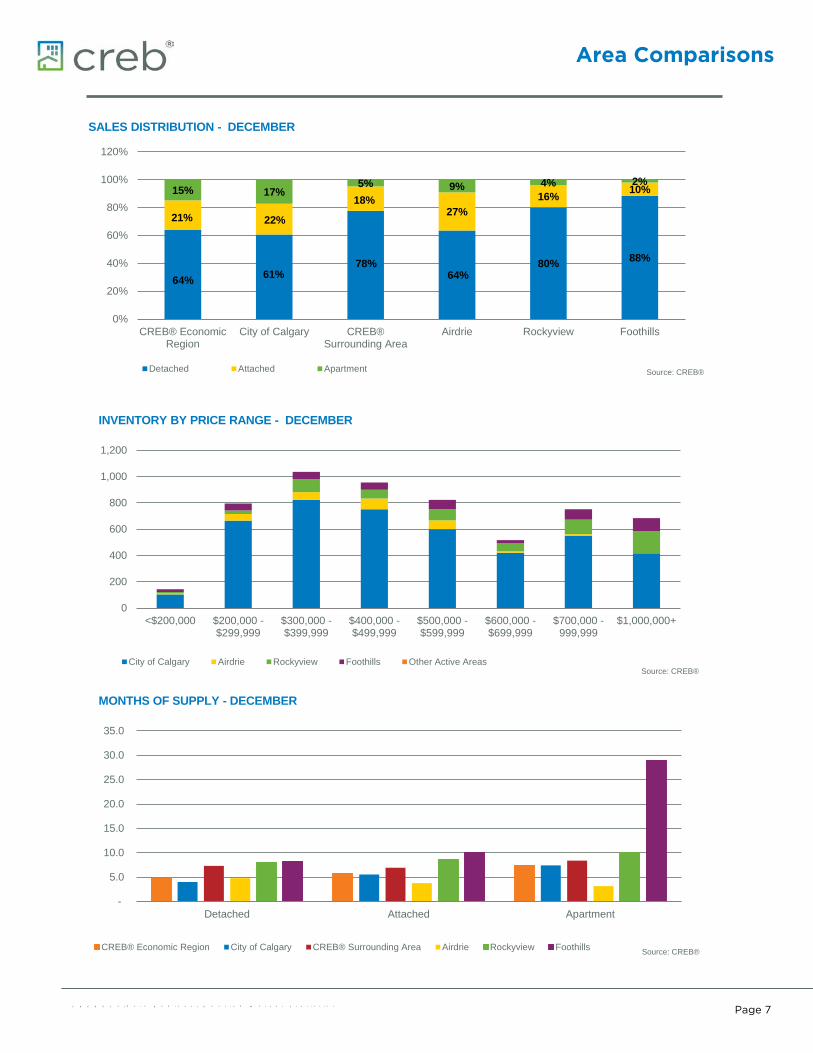
MONTHS OF SUPPLY - DECEMBER
CREB® Economic Region City of Calgary CREB® Surrounding Area Airdrie Rockyview Foothills Source: CREB®
64% 61% 78%
64% 80% 88%
21% 22%
18% 27%
16% 10% 15% 17% 5% 9% 4% 2%
0%
20%
40%
60%
80%
100%
120%
CREB® EconomicRegion
City of Calgary CREB®Surrounding Area
Airdrie Rockyview Foothills
SALES DISTRIBUTION - DECEMBER
Detached Attached Apartment Source: CREB®
0
200
400
600
800
1,000
1,200
<$200,000 $200,000 -$299,999
$300,000 -$399,999
$400,000 -$499,999
$500,000 -$599,999
$600,000 -$699,999
$700,000 -999,999
$1,000,000+
INVENTORY BY PRICE RANGE - DECEMBER
City of Calgary Airdrie Rockyview Foothills Other Active AreasSource: CREB®
City of CalgaryTotal Residential
C R E B ® C a l g a r y R e g i o n a l H o u s i n g M a r k e t S t a t i s t i c s
Page 8
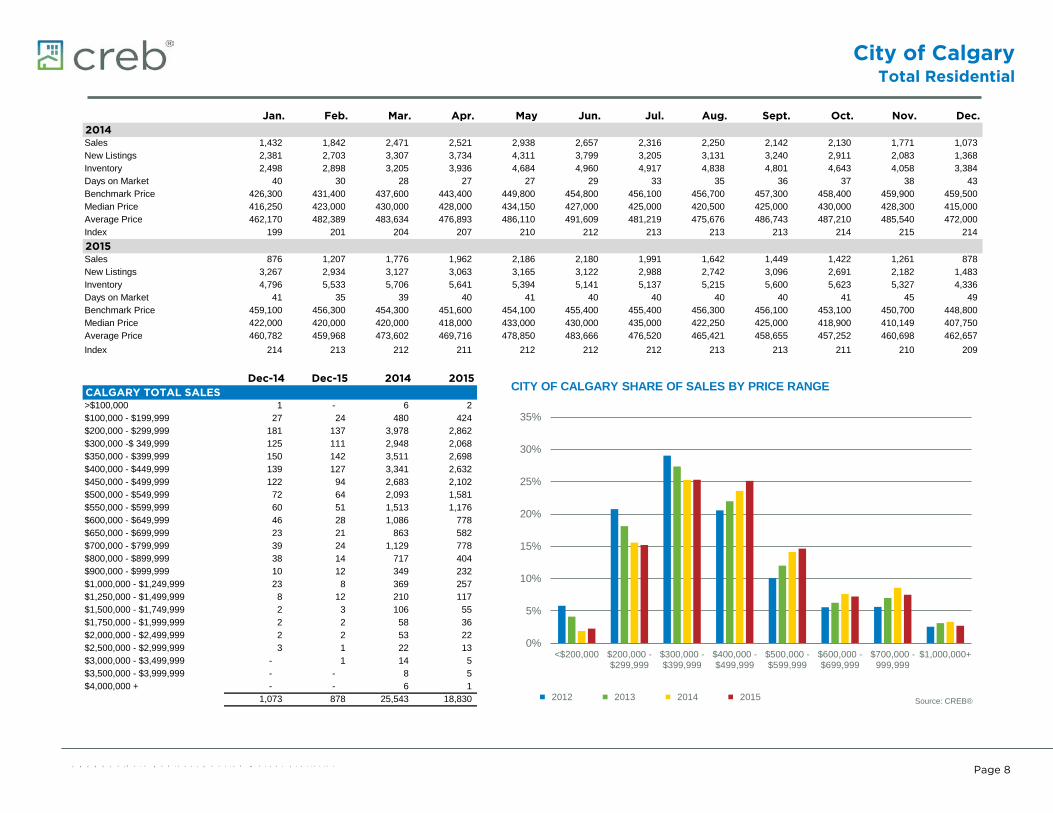
Jan. Feb. Mar. Apr. May Jun. Jul. Aug. Sept. Oct. Nov. Dec.2014 01/01/14 02/01/14 03/01/14 04/01/14 05/01/14 06/01/14 07/01/14 08/01/14 09/01/14 10/01/14 11/01/14 12/01/14
m_CM_RSales 1,432 1,842 2,471 2,521 2,938 2,657 2,316 2,250 2,142 2,130 1,771 1,073 m_CM_RNew Listings 2,381 2,703 3,307 3,734 4,311 3,799 3,205 3,131 3,240 2,911 2,083 1,368 m_CM_RInventory 2,498 2,898 3,205 3,936 4,684 4,960 4,917 4,838 4,801 4,643 4,058 3,384 m_cm_Days on Market 40 30 28 27 27 29 33 35 36 37 38 43 m_cm_Benchmark Price 426,300 431,400 437,600 443,400 449,800 454,800 456,100 456,700 457,300 458,400 459,900 459,500 m_cm_Median Price 416,250 423,000 430,000 428,000 434,150 427,000 425,000 420,500 425,000 430,000 428,300 415,000 m_cm_Average Price 462,170 482,389 483,634 476,893 486,110 491,609 481,219 475,676 486,743 487,210 485,540 472,000 m_cm_Index 199 201 204 207 210 212 213 213 213 214 215 214
2015 01/01/15 02/01/15 03/01/15 04/01/15 05/01/15 06/01/15 07/01/15 08/01/15 09/01/15 10/01/15 11/01/15 12/01/15m_CM_RSales 876 1,207 1,776 1,962 2,186 2,180 1,991 1,642 1,449 1,422 1,261 878 m_CM_RNew Listings 3,267 2,934 3,127 3,063 3,165 3,122 2,988 2,742 3,096 2,691 2,182 1,483 m_CM_RInventory 4,796 5,533 5,706 5,641 5,394 5,141 5,137 5,215 5,600 5,623 5,327 4,336 m_cm_Days on Market 41 35 39 40 41 40 40 40 40 41 45 49 m_cm_Benchmark Price 459,100 456,300 454,300 451,600 454,100 455,400 455,400 456,300 456,100 453,100 450,700 448,800 m_cm_Median Price 422,000 420,000 420,000 418,000 433,000 430,000 435,000 422,250 425,000 418,900 410,149 407,750 m_cm_Average Price 460,782 459,968 473,602 469,716 478,850 483,666 476,520 465,421 458,655 457,252 460,698 462,657 m_cm_Index 214 213 212 211 212 212 212 213 213 211 210 209
Dec-14 Dec-15 2014 2015CALGARY TOTAL SALES 12/01/14 12/01/15 12/01/14 12/01/15
m_Cytd_ >$100,000 1 - 6 2 m_Cytd_ $100,000 - $199,999 27 24 480 424 m_Cytd_ $200,000 - $299,999 181 137 3,978 2,862 m_Cytd_ $300,000 -$ 349,999 125 111 2,948 2,068 m_Cytd_ $350,000 - $399,999 150 142 3,511 2,698 m_Cytd_ $400,000 - $449,999 139 127 3,341 2,632 m_Cytd_ $450,000 - $499,999 122 94 2,683 2,102 m_Cytd_ $500,000 - $549,999 72 64 2,093 1,581 m_Cytd_ $550,000 - $599,999 60 51 1,513 1,176 m_Cytd_ $600,000 - $649,999 46 28 1,086 778 m_Cytd_ $650,000 - $699,999 23 21 863 582 m_Cytd_ $700,000 - $799,999 39 24 1,129 778 m_Cytd_ $800,000 - $899,999 38 14 717 404 m_Cytd_ $900,000 - $999,999 10 12 349 232 m_Cytd_ $1,000,000 - $1,249,999 23 8 369 257 m_Cytd_ $1,250,000 - $1,499,999 8 12 210 117 m_Cytd_ $1,500,000 - $1,749,999 2 3 106 55 m_Cytd_ $1,750,000 - $1,999,999 2 2 58 36 m_Cytd_ $2,000,000 - $2,499,999 2 2 53 22 m_Cytd_ $2,500,000 - $2,999,999 3 1 22 13 m_Cytd_ $3,000,000 - $3,499,999 - 1 14 5 m_Cytd_ $3,500,000 - $3,999,999 - - 8 5 m_Cytd_ $4,000,000 + - - 6 1
1,073 878 25,543 18,830
0%
5%
10%
15%
20%
25%
30%
35%
<$200,000 $200,000 -$299,999
$300,000 -$399,999
$400,000 -$499,999
$500,000 -$599,999
$600,000 -$699,999
$700,000 -999,999
$1,000,000+
CITY OF CALGARY SHARE OF SALES BY PRICE RANGE
2012 2013 2014 2015 Source: CREB®
City of CalgaryTotal Residential
C R E B ® C a l g a r y R e g i o n a l H o u s i n g M a r k e t S t a t i s t i c s
Page 9
0
5,000
10,000
15,000
20,000
25,000
30,000
2005 2006 2007 2008 2009 2010 2011 2012 2013 2014 2015
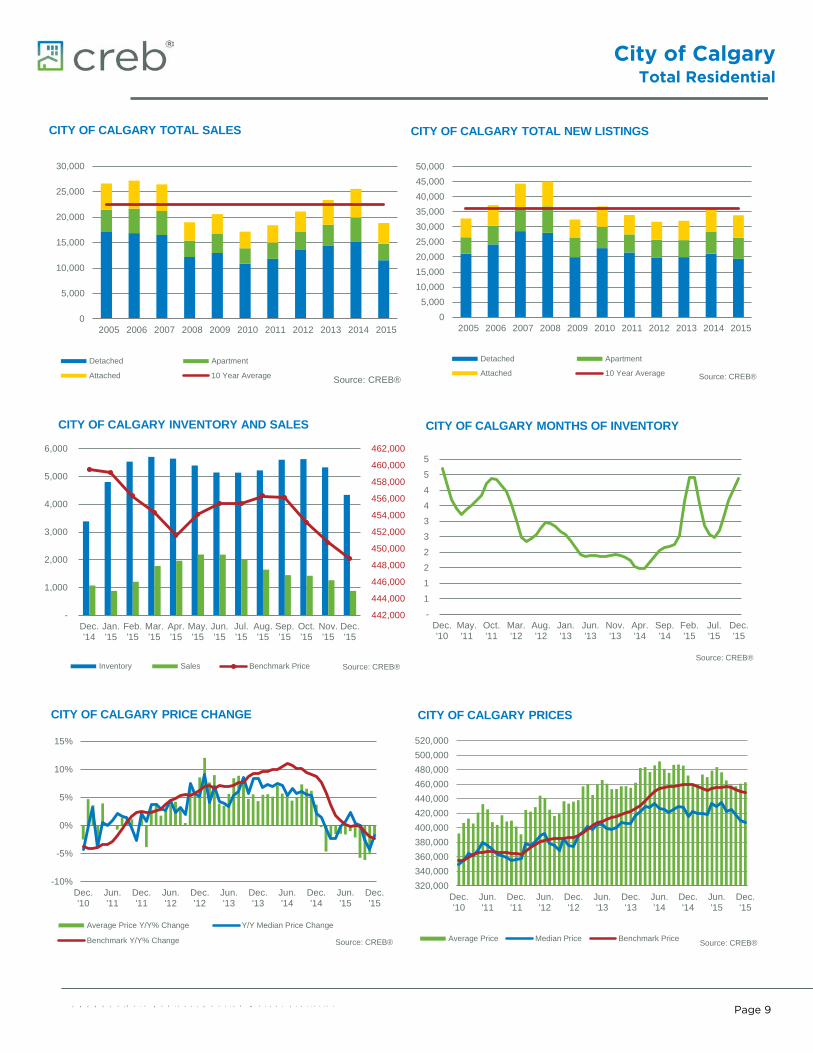
CITY OF CALGARY TOTAL SALES
Detached Apartment
Attached 10 Year Average Source: CREB®
05,000
10,00015,00020,00025,00030,00035,00040,00045,00050,000
2005 2006 2007 2008 2009 2010 2011 2012 2013 2014 2015
CITY OF CALGARY TOTAL NEW LISTINGS
Detached Apartment
Attached 10 Year Average Source: CREB®
442,000
444,000
446,000
448,000
450,000
452,000
454,000
456,000
458,000
460,000
462,000
-
1,000
2,000
3,000
4,000
5,000
6,000
Dec.'14
Jan.'15
Feb.'15
Mar.'15
Apr.'15
May.'15
Jun.'15
Jul.'15
Aug.'15
Sep.'15
Oct.'15
Nov.'15
Dec.'15
CITY OF CALGARY INVENTORY AND SALES
Inventory Sales Benchmark Price Source: CREB®
-
1
1
2
2
3
3
4
4
5
5
Dec.'10
May.'11
Oct.'11
Mar.'12
Aug.'12
Jan.'13
Jun.'13
Nov.'13
Apr.'14
Sep.'14
Feb.'15
Jul.'15
Dec.'15
CITY OF CALGARY MONTHS OF INVENTORY
Source: CREB®
-10%
-5%
0%
5%
10%
15%
Dec.'10
Jun.'11
Dec.'11
Jun.'12
Dec.'12
Jun.'13
Dec.'13
Jun.'14
Dec.'14
Jun.'15
Dec.'15
CITY OF CALGARY PRICE CHANGE
Average Price Y/Y% Change Y/Y Median Price Change
Benchmark Y/Y% Change Source: CREB®
320,000340,000360,000380,000400,000420,000440,000460,000480,000500,000520,000
Dec.'10
Jun.'11
Dec.'11
Jun.'12
Dec.'12
Jun.'13
Dec.'13
Jun.'14
Dec.'14
Jun.'15
Dec.'15
CITY OF CALGARY PRICES
Average Price Median Price Benchmark Price Source: CREB®
City of CalgaryDetached
C R E B ® C a l g a r y R e g i o n a l H o u s i n g M a r k e t S t a t i s t i c s
Page 10
Jan. Feb. Mar. Apr. May Jun. Jul. Aug. Sept. Oct. Nov. Dec.2014 01/01/14 02/01/14 03/01/14 04/01/14 05/01/14 06/01/14 07/01/14 08/01/14 09/01/14 10/01/14 11/01/14 12/01/14
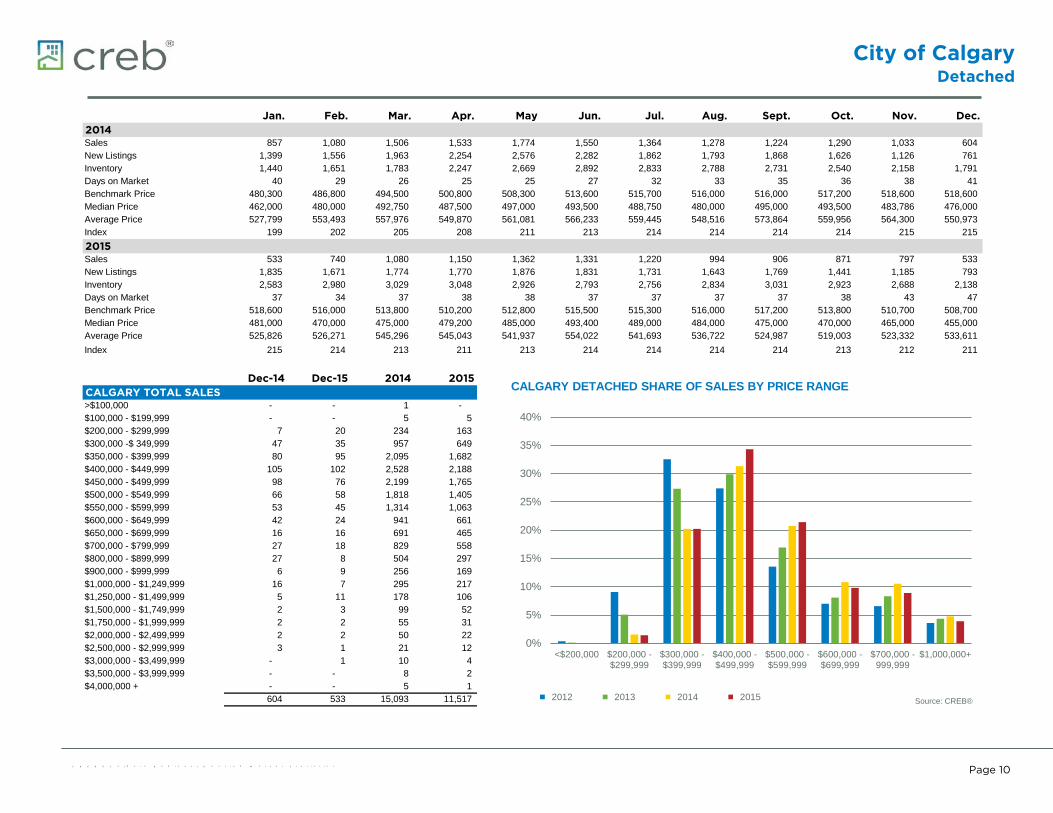
m_CM_d Sales 857 1,080 1,506 1,533 1,774 1,550 1,364 1,278 1,224 1,290 1,033 604 m_CM_d New Listings 1,399 1,556 1,963 2,254 2,576 2,282 1,862 1,793 1,868 1,626 1,126 761 m_CM_d Inventory 1,440 1,651 1,783 2,247 2,669 2,892 2,833 2,788 2,731 2,540 2,158 1,791 m_cm_Days on Market 40 29 26 25 25 27 32 33 35 36 38 41 m_cm_Benchmark Price 480,300 486,800 494,500 500,800 508,300 513,600 515,700 516,000 516,000 517,200 518,600 518,600 m_cm_Median Price 462,000 480,000 492,750 487,500 497,000 493,500 488,750 480,000 495,000 493,500 483,786 476,000 m_cm_Average Price 527,799 553,493 557,976 549,870 561,081 566,233 559,445 548,516 573,864 559,956 564,300 550,973 m_cm_Index 199 202 205 208 211 213 214 214 214 214 215 215
2015 01/01/15 02/01/15 03/01/15 04/01/15 05/01/15 06/01/15 07/01/15 08/01/15 09/01/15 10/01/15 11/01/15 12/01/15m_CM_d Sales 533 740 1,080 1,150 1,362 1,331 1,220 994 906 871 797 533 m_CM_d New Listings 1,835 1,671 1,774 1,770 1,876 1,831 1,731 1,643 1,769 1,441 1,185 793 m_CM_d Inventory 2,583 2,980 3,029 3,048 2,926 2,793 2,756 2,834 3,031 2,923 2,688 2,138 m_cm_Days on Market 37 34 37 38 38 37 37 37 37 38 43 47 m_cm_Benchmark Price 518,600 516,000 513,800 510,200 512,800 515,500 515,300 516,000 517,200 513,800 510,700 508,700 m_cm_Median Price 481,000 470,000 475,000 479,200 485,000 493,400 489,000 484,000 475,000 470,000 465,000 455,000 m_cm_Average Price 525,826 526,271 545,296 545,043 541,937 554,022 541,693 536,722 524,987 519,003 523,332 533,611 m_cm_Index 215 214 213 211 213 214 214 214 214 213 212 211
Dec-14 Dec-15 2014 2015CALGARY TOTAL SALES 12/01/14 12/01/15 12/01/14 12/01/15
m_Cytd_ >$100,000 - - 1 - m_Cytd_ $100,000 - $199,999 - - 5 5 m_Cytd_ $200,000 - $299,999 7 20 234 163 m_Cytd_ $300,000 -$ 349,999 47 35 957 649 m_Cytd_ $350,000 - $399,999 80 95 2,095 1,682 m_Cytd_ $400,000 - $449,999 105 102 2,528 2,188 m_Cytd_ $450,000 - $499,999 98 76 2,199 1,765 m_Cytd_ $500,000 - $549,999 66 58 1,818 1,405 m_Cytd_ $550,000 - $599,999 53 45 1,314 1,063 m_Cytd_ $600,000 - $649,999 42 24 941 661 m_Cytd_ $650,000 - $699,999 16 16 691 465 m_Cytd_ $700,000 - $799,999 27 18 829 558 m_Cytd_ $800,000 - $899,999 27 8 504 297 m_Cytd_ $900,000 - $999,999 6 9 256 169 m_Cytd_ $1,000,000 - $1,249,999 16 7 295 217 m_Cytd_ $1,250,000 - $1,499,999 5 11 178 106 m_Cytd_ $1,500,000 - $1,749,999 2 3 99 52 m_Cytd_ $1,750,000 - $1,999,999 2 2 55 31 m_Cytd_ $2,000,000 - $2,499,999 2 2 50 22 m_Cytd_ $2,500,000 - $2,999,999 3 1 21 12 m_Cytd_ $3,000,000 - $3,499,999 - 1 10 4 m_Cytd_ $3,500,000 - $3,999,999 - - 8 2 m_Cytd_ $4,000,000 + - - 5 1
604 533 15,093 11,517
0%
5%
10%
15%
20%
25%
30%
35%
40%
<$200,000 $200,000 -$299,999
$300,000 -$399,999
$400,000 -$499,999
$500,000 -$599,999
$600,000 -$699,999
$700,000 -999,999
$1,000,000+
CALGARY DETACHED SHARE OF SALES BY PRICE RANGE
2012 2013 2014 2015 Source: CREB®
City of CalgaryDetached
C R E B ® C a l g a r y R e g i o n a l H o u s i n g M a r k e t S t a t i s t i c s
Page 11
0
2,000
4,000
6,000
8,000
10,000
12,000
14,000
16,000
18,000
2005 2006 2007 2008 2009 2010 2011 2012 2013 2014 2015
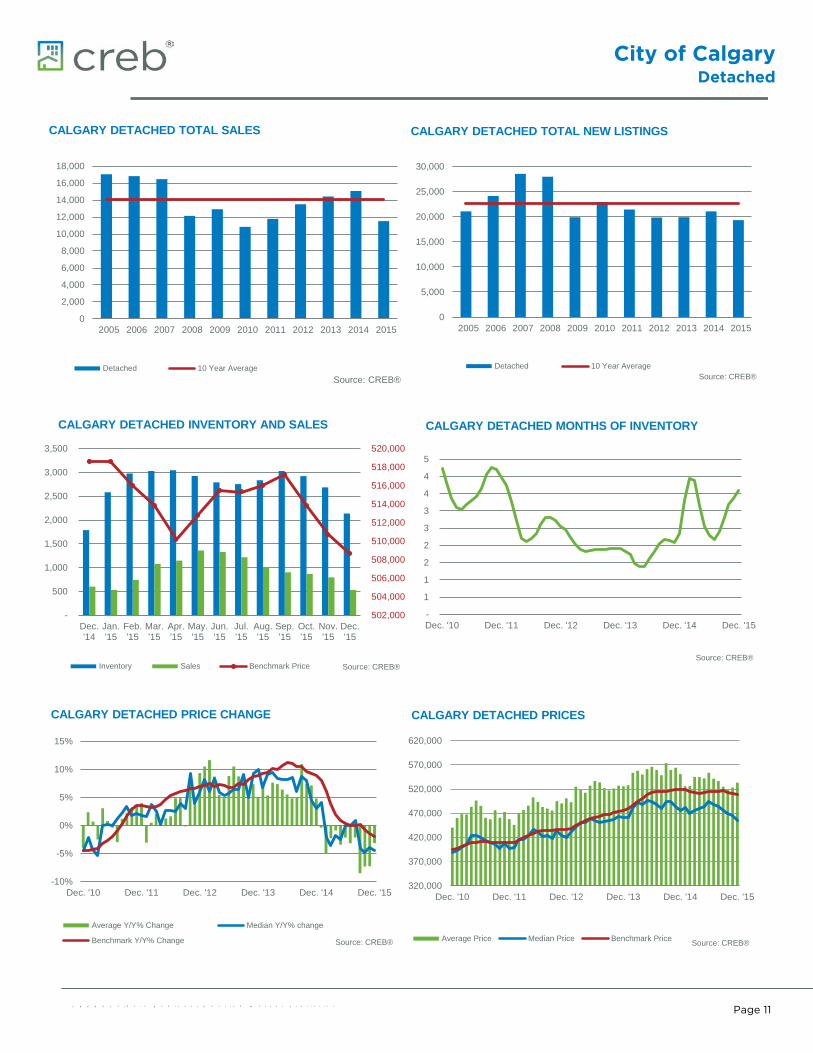
CALGARY DETACHED TOTAL SALES
Detached 10 Year AverageSource: CREB®
0
5,000
10,000
15,000
20,000
25,000
30,000
2005 2006 2007 2008 2009 2010 2011 2012 2013 2014 2015
CALGARY DETACHED TOTAL NEW LISTINGS
Detached 10 Year AverageSource: CREB®
502,000
504,000
506,000
508,000
510,000
512,000
514,000
516,000
518,000
520,000
-
500
1,000
1,500
2,000
2,500
3,000
3,500
Dec.'14
Jan.'15
Feb.'15
Mar.'15
Apr.'15
May.'15
Jun.'15
Jul.'15
Aug.'15
Sep.'15
Oct.'15
Nov.'15
Dec.'15
CALGARY DETACHED INVENTORY AND SALES
Inventory Sales Benchmark Price Source: CREB®
-
1
1
2
2
3
3
4
4
5
Dec. '10 Dec. '11 Dec. '12 Dec. '13 Dec. '14 Dec. '15
CALGARY DETACHED MONTHS OF INVENTORY
Source: CREB®
-10%
-5%
0%
5%
10%
15%
Dec. '10 Dec. '11 Dec. '12 Dec. '13 Dec. '14 Dec. '15
CALGARY DETACHED PRICE CHANGE
Average Y/Y% Change Median Y/Y% change
Benchmark Y/Y% Change Source: CREB®
320,000
370,000
420,000
470,000
520,000
570,000
620,000
Dec. '10 Dec. '11 Dec. '12 Dec. '13 Dec. '14 Dec. '15
CALGARY DETACHED PRICES
Average Price Median Price Benchmark Price Source: CREB®
City of CalgaryAttached
C R E B ® C a l g a r y R e g i o n a l H o u s i n g M a r k e t S t a t i s t i c s
Page 12
Jan. Feb. Mar. Apr. May Jun. Jul. Aug. Sept. Oct. Nov. Dec.2014 01/01/14 02/01/14 03/01/14 04/01/14 05/01/14 06/01/14 07/01/14 08/01/14 09/01/14 10/01/14 11/01/14 12/01/14
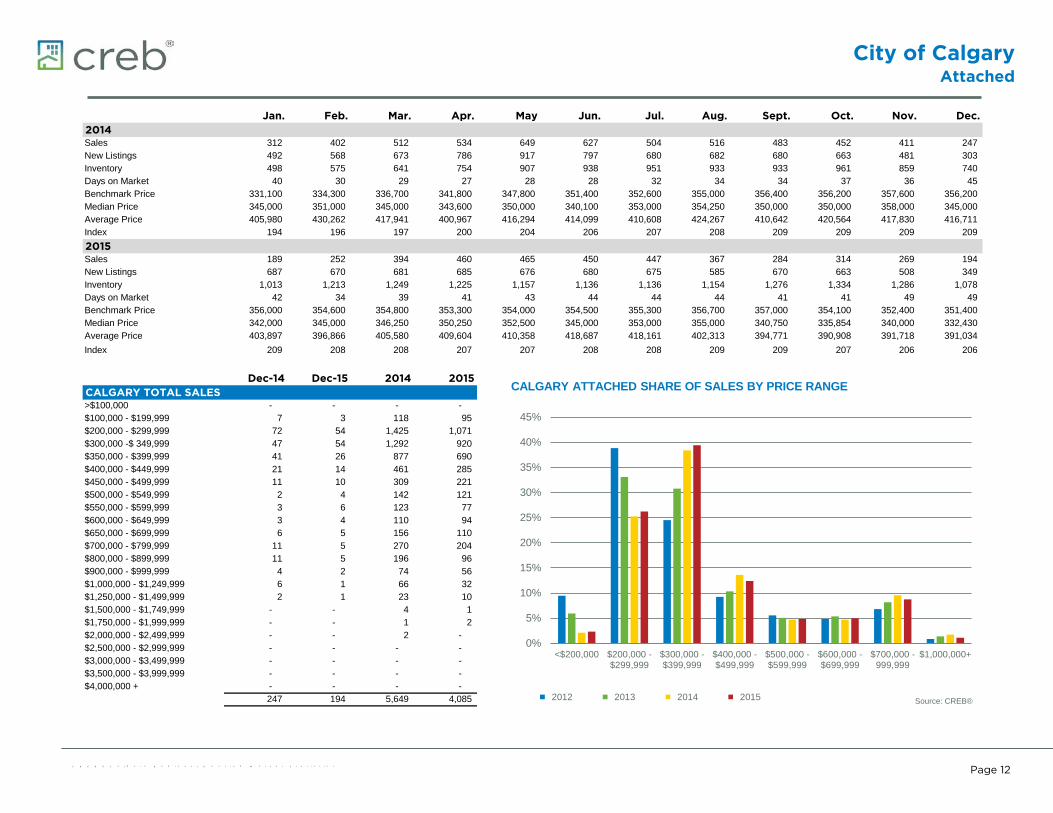
m_CM_ASales 312 402 512 534 649 627 504 516 483 452 411 247 m_CM_ANew Listings 492 568 673 786 917 797 680 682 680 663 481 303 m_CM_AInventory 498 575 641 754 907 938 951 933 933 961 859 740 m_cm_Days on Market 40 30 29 27 28 28 32 34 34 37 36 45 m_cm_Benchmark Price 331,100 334,300 336,700 341,800 347,800 351,400 352,600 355,000 356,400 356,200 357,600 356,200 m_cm_Median Price 345,000 351,000 345,000 343,600 350,000 340,100 353,000 354,250 350,000 350,000 358,000 345,000 m_cm_Average Price 405,980 430,262 417,941 400,967 416,294 414,099 410,608 424,267 410,642 420,564 417,830 416,711 m_cm_Index 194 196 197 200 204 206 207 208 209 209 209 209
2015 01/01/15 02/01/15 03/01/15 04/01/15 05/01/15 06/01/15 07/01/15 08/01/15 09/01/15 10/01/15 11/01/15 12/01/15m_CM_ASales 189 252 394 460 465 450 447 367 284 314 269 194 m_CM_ANew Listings 687 670 681 685 676 680 675 585 670 663 508 349 m_CM_AInventory 1,013 1,213 1,249 1,225 1,157 1,136 1,136 1,154 1,276 1,334 1,286 1,078 m_cm_Days on Market 42 34 39 41 43 44 44 44 41 41 49 49 m_cm_Benchmark Price 356,000 354,600 354,800 353,300 354,000 354,500 355,300 356,700 357,000 354,100 352,400 351,400 m_cm_Median Price 342,000 345,000 346,250 350,250 352,500 345,000 353,000 355,000 340,750 335,854 340,000 332,430 m_cm_Average Price 403,897 396,866 405,580 409,604 410,358 418,687 418,161 402,313 394,771 390,908 391,718 391,034 m_cm_Index 209 208 208 207 207 208 208 209 209 207 206 206
Dec-14 Dec-15 2014 2015CALGARY TOTAL SALES 12/01/14 12/01/15 12/01/14 12/01/15
m_Cytd_ >$100,000 - - - - m_Cytd_ $100,000 - $199,999 7 3 118 95 m_Cytd_ $200,000 - $299,999 72 54 1,425 1,071 m_Cytd_ $300,000 -$ 349,999 47 54 1,292 920 m_Cytd_ $350,000 - $399,999 41 26 877 690 m_Cytd_ $400,000 - $449,999 21 14 461 285 m_Cytd_ $450,000 - $499,999 11 10 309 221 m_Cytd_ $500,000 - $549,999 2 4 142 121 m_Cytd_ $550,000 - $599,999 3 6 123 77 m_Cytd_ $600,000 - $649,999 3 4 110 94 m_Cytd_ $650,000 - $699,999 6 5 156 110 m_Cytd_ $700,000 - $799,999 11 5 270 204 m_Cytd_ $800,000 - $899,999 11 5 196 96 m_Cytd_ $900,000 - $999,999 4 2 74 56 m_Cytd_ $1,000,000 - $1,249,999 6 1 66 32 m_Cytd_ $1,250,000 - $1,499,999 2 1 23 10 m_Cytd_ $1,500,000 - $1,749,999 - - 4 1 m_Cytd_ $1,750,000 - $1,999,999 - - 1 2 m_Cytd_ $2,000,000 - $2,499,999 - - 2 - m_Cytd_ $2,500,000 - $2,999,999 - - - - m_Cytd_ $3,000,000 - $3,499,999 - - - - m_Cytd_ $3,500,000 - $3,999,999 - - - - m_Cytd_ $4,000,000 + - - - -
247 194 5,649 4,085
0%
5%
10%
15%
20%
25%
30%
35%
40%
45%
<$200,000 $200,000 -$299,999
$300,000 -$399,999
$400,000 -$499,999
$500,000 -$599,999
$600,000 -$699,999
$700,000 -999,999
$1,000,000+
CALGARY ATTACHED SHARE OF SALES BY PRICE RANGE
2012 2013 2014 2015 Source: CREB®
City of CalgaryAttached
C R E B ® C a l g a r y R e g i o n a l H o u s i n g M a r k e t S t a t i s t i c s
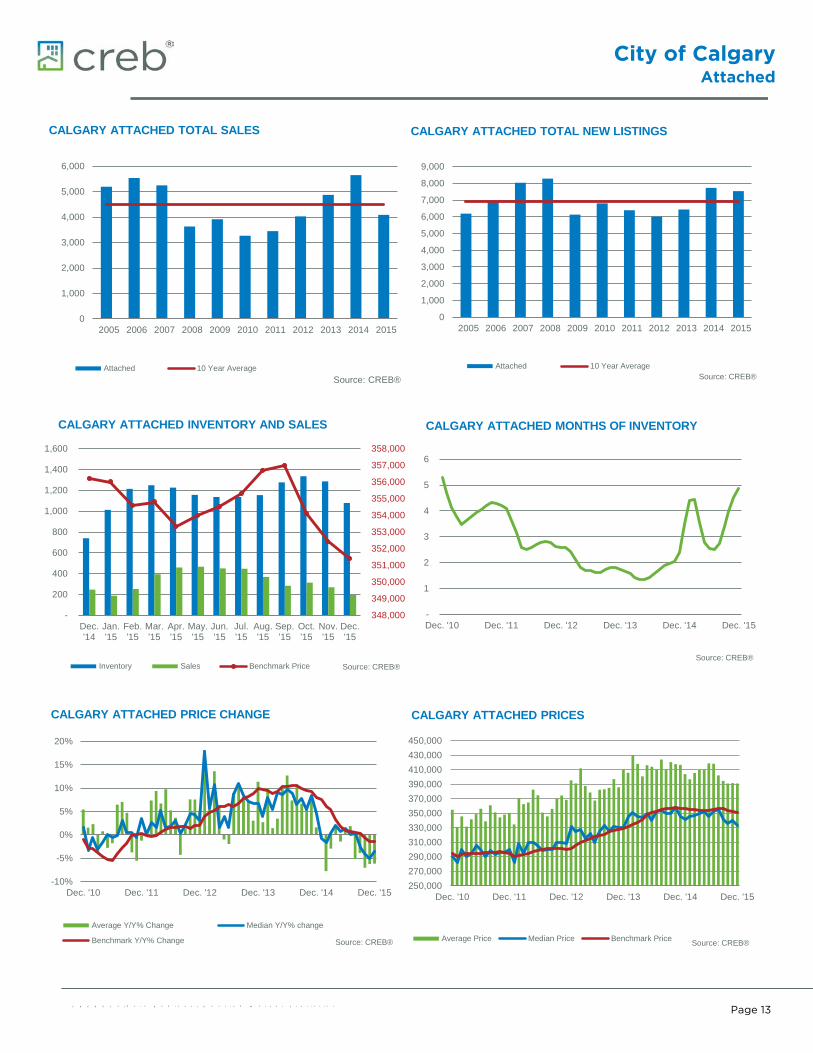
Page 13
0
1,000
2,000
3,000
4,000
5,000
6,000
2005 2006 2007 2008 2009 2010 2011 2012 2013 2014 2015
CALGARY ATTACHED TOTAL SALES
Attached 10 Year AverageSource: CREB®
0
1,000
2,000
3,000
4,000
5,000
6,000
7,000
8,000
9,000
2005 2006 2007 2008 2009 2010 2011 2012 2013 2014 2015
CALGARY ATTACHED TOTAL NEW LISTINGS
Attached 10 Year AverageSource: CREB®
348,000
349,000
350,000
351,000
352,000
353,000
354,000
355,000
356,000
357,000
358,000
-
200
400
600
800
1,000
1,200
1,400
1,600
Dec.'14
Jan.'15
Feb.'15
Mar.'15
Apr.'15
May.'15
Jun.'15
Jul.'15
Aug.'15
Sep.'15
Oct.'15
Nov.'15
Dec.'15
CALGARY ATTACHED INVENTORY AND SALES
Inventory Sales Benchmark Price Source: CREB®
-
1
2
3
4
5
6
Dec. '10 Dec. '11 Dec. '12 Dec. '13 Dec. '14 Dec. '15
CALGARY ATTACHED MONTHS OF INVENTORY
Source: CREB®
-10%
-5%
0%
5%
10%
15%
20%
Dec. '10 Dec. '11 Dec. '12 Dec. '13 Dec. '14 Dec. '15
CALGARY ATTACHED PRICE CHANGE
Average Y/Y% Change Median Y/Y% change
Benchmark Y/Y% Change Source: CREB®
250,000270,000290,000310,000330,000350,000370,000390,000410,000430,000450,000
Dec. '10 Dec. '11 Dec. '12 Dec. '13 Dec. '14 Dec. '15
CALGARY ATTACHED PRICES
Average Price Median Price Benchmark Price Source: CREB®
City of CalgaryApartment
C R E B ® C a l g a r y R e g i o n a l H o u s i n g M a r k e t S t a t i s t i c s
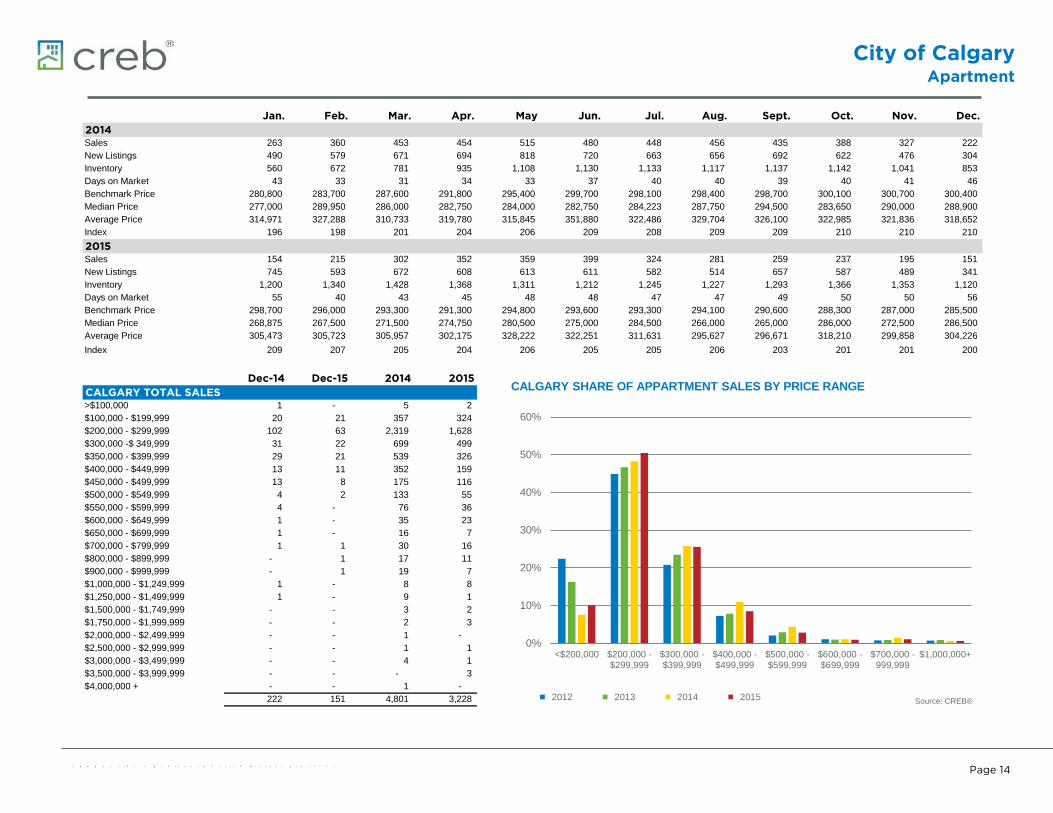
Page 14
Jan. Feb. Mar. Apr. May Jun. Jul. Aug. Sept. Oct. Nov. Dec.2014 01/01/14 02/01/14 03/01/14 04/01/14 05/01/14 06/01/14 07/01/14 08/01/14 09/01/14 10/01/14 11/01/14 12/01/14
m_CM_a Sales 263 360 453 454 515 480 448 456 435 388 327 222 m_CM_a New Listings 490 579 671 694 818 720 663 656 692 622 476 304 m_CM_a Inventory 560 672 781 935 1,108 1,130 1,133 1,117 1,137 1,142 1,041 853 m_cm_Days on Market 43 33 31 34 33 37 40 40 39 40 41 46 m_cm_Benchmark Price 280,800 283,700 287,600 291,800 295,400 299,700 298,100 298,400 298,700 300,100 300,700 300,400 m_cm_Median Price 277,000 289,950 286,000 282,750 284,000 282,750 284,223 287,750 294,500 283,650 290,000 288,900 m_cm_Average Price 314,971 327,288 310,733 319,780 315,845 351,880 322,486 329,704 326,100 322,985 321,836 318,652 m_cm_Index 196 198 201 204 206 209 208 209 209 210 210 210
2015 01/01/15 02/01/15 03/01/15 04/01/15 05/01/15 06/01/15 07/01/15 08/01/15 09/01/15 10/01/15 11/01/15 12/01/15m_CM_a Sales 154 215 302 352 359 399 324 281 259 237 195 151 m_CM_a New Listings 745 593 672 608 613 611 582 514 657 587 489 341 m_CM_a Inventory 1,200 1,340 1,428 1,368 1,311 1,212 1,245 1,227 1,293 1,366 1,353 1,120 m_cm_Days on Market 55 40 43 45 48 48 47 47 49 50 50 56 m_cm_Benchmark Price 298,700 296,000 293,300 291,300 294,800 293,600 293,300 294,100 290,600 288,300 287,000 285,500 m_cm_Median Price 268,875 267,500 271,500 274,750 280,500 275,000 284,500 266,000 265,000 286,000 272,500 286,500 m_cm_Average Price 305,473 305,723 305,957 302,175 328,222 322,251 311,631 295,627 296,671 318,210 299,858 304,226 m_cm_Index 209 207 205 204 206 205 205 206 203 201 201 200
Dec-14 Dec-15 2014 2015CALGARY TOTAL SALES 12/01/14 12/01/15 12/01/14 12/01/15
m_Cytd_ >$100,000 1 - 5 2 m_Cytd_ $100,000 - $199,999 20 21 357 324 m_Cytd_ $200,000 - $299,999 102 63 2,319 1,628 m_Cytd_ $300,000 -$ 349,999 31 22 699 499 m_Cytd_ $350,000 - $399,999 29 21 539 326 m_Cytd_ $400,000 - $449,999 13 11 352 159 m_Cytd_ $450,000 - $499,999 13 8 175 116 m_Cytd_ $500,000 - $549,999 4 2 133 55 m_Cytd_ $550,000 - $599,999 4 - 76 36 m_Cytd_ $600,000 - $649,999 1 - 35 23 m_Cytd_ $650,000 - $699,999 1 - 16 7 m_Cytd_ $700,000 - $799,999 1 1 30 16 m_Cytd_ $800,000 - $899,999 - 1 17 11 m_Cytd_ $900,000 - $999,999 - 1 19 7 m_Cytd_ $1,000,000 - $1,249,999 1 - 8 8 m_Cytd_ $1,250,000 - $1,499,999 1 - 9 1 m_Cytd_ $1,500,000 - $1,749,999 - - 3 2 m_Cytd_ $1,750,000 - $1,999,999 - - 2 3 m_Cytd_ $2,000,000 - $2,499,999 - - 1 - m_Cytd_ $2,500,000 - $2,999,999 - - 1 1 m_Cytd_ $3,000,000 - $3,499,999 - - 4 1 m_Cytd_ $3,500,000 - $3,999,999 - - - 3 m_Cytd_ $4,000,000 + - - 1 -
222 151 4,801 3,228
0%
10%
20%
30%
40%
50%
60%
<$200,000 $200,000 -$299,999
$300,000 -$399,999
$400,000 -$499,999
$500,000 -$599,999
$600,000 -$699,999
$700,000 -999,999
$1,000,000+
CALGARY SHARE OF APPARTMENT SALES BY PRICE RANGE
2012 2013 2014 2015 Source: CREB®
City of CalgaryApartment
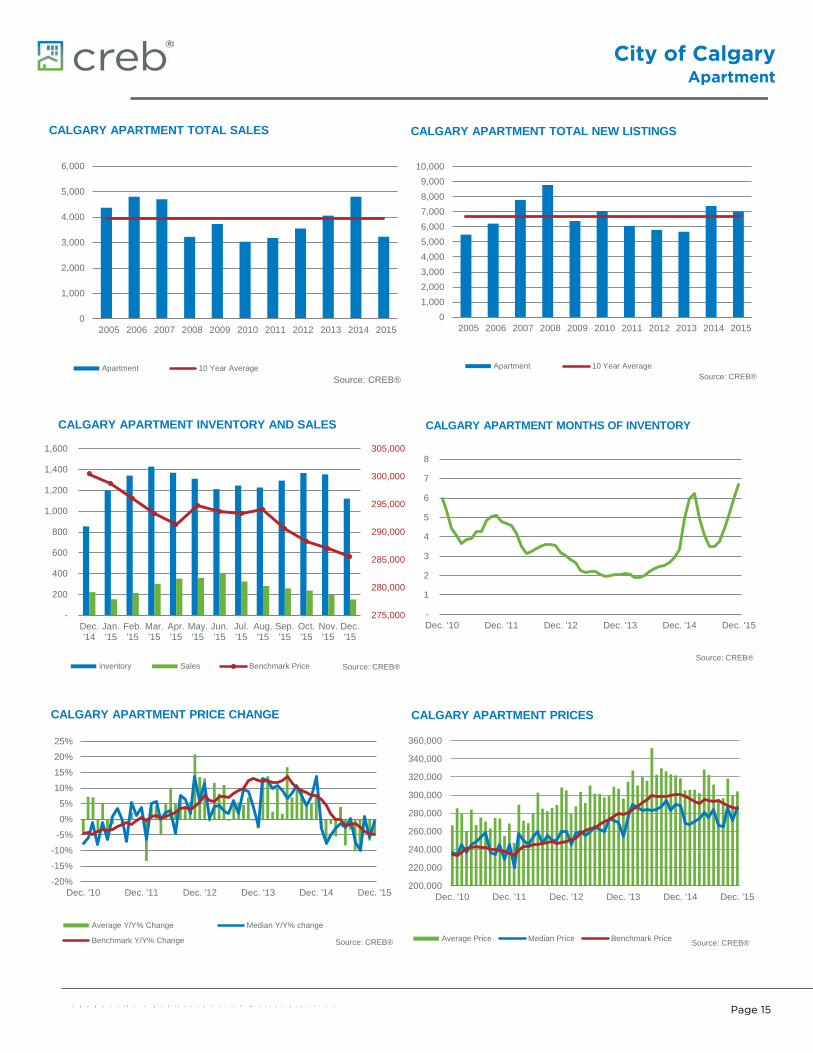
C R E B ® C a l g a r y R e g i o n a l H o u s i n g M a r k e t S t a t i s t i c s
Page 15
0
1,000
2,000
3,000
4,000
5,000
6,000
2005 2006 2007 2008 2009 2010 2011 2012 2013 2014 2015
CALGARY APARTMENT TOTAL SALES
Apartment 10 Year AverageSource: CREB®
01,0002,0003,0004,0005,0006,0007,0008,0009,000
10,000
2005 2006 2007 2008 2009 2010 2011 2012 2013 2014 2015
CALGARY APARTMENT TOTAL NEW LISTINGS
Apartment 10 Year AverageSource: CREB®
275,000
280,000
285,000
290,000
295,000
300,000
305,000
-
200
400
600
800
1,000
1,200
1,400
1,600
Dec.'14
Jan.'15
Feb.'15
Mar.'15
Apr.'15
May.'15
Jun.'15
Jul.'15
Aug.'15
Sep.'15
Oct.'15
Nov.'15
Dec.'15
CALGARY APARTMENT INVENTORY AND SALES
inventory Sales Benchmark Price Source: CREB®
-
1
2
3
4
5
6
7
8
Dec. '10 Dec. '11 Dec. '12 Dec. '13 Dec. '14 Dec. '15
CALGARY APARTMENT MONTHS OF INVENTORY
Source: CREB®
-20%
-15%
-10%
-5%
0%
5%
10%
15%
20%
25%
Dec. '10 Dec. '11 Dec. '12 Dec. '13 Dec. '14 Dec. '15
CALGARY APARTMENT PRICE CHANGE
Average Y/Y% Change Median Y/Y% change
Benchmark Y/Y% Change Source: CREB®
200,000
220,000
240,000
260,000
280,000
300,000
320,000
340,000
360,000
Dec. '10 Dec. '11 Dec. '12 Dec. '13 Dec. '14 Dec. '15
CALGARY APARTMENT PRICES
Average Price Median Price Benchmark Price Source: CREB®
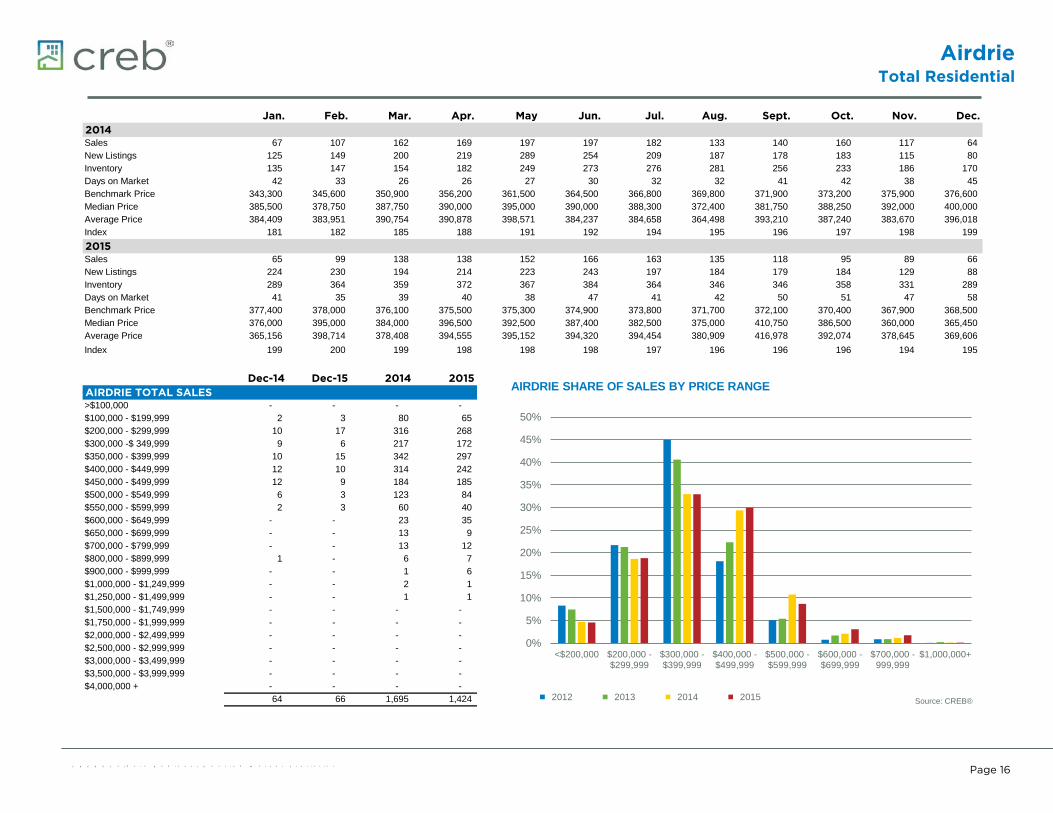
AirdrieTotal Residential
C R E B ® C a l g a r y R e g i o n a l H o u s i n g M a r k e t S t a t i s t i c s
Page 16
Jan. Feb. Mar. Apr. May Jun. Jul. Aug. Sept. Oct. Nov. Dec.2014 01/01/14 02/01/14 03/01/14 04/01/14 05/01/14 06/01/14 07/01/14 08/01/14 09/01/14 10/01/14 11/01/14 12/01/14
m_AIR_RSales 67 107 162 169 197 197 182 133 140 160 117 64 m_AIR_RNew Listings 125 149 200 219 289 254 209 187 178 183 115 80 m_AIR_RInventory 135 147 154 182 249 273 276 281 256 233 186 170 m_AIR_Days on Market 42 33 26 26 27 30 32 32 41 42 38 45 m_AIR_Benchmark Price 343,300 345,600 350,900 356,200 361,500 364,500 366,800 369,800 371,900 373,200 375,900 376,600 m_AIR_Median Price 385,500 378,750 387,750 390,000 395,000 390,000 388,300 372,400 381,750 388,250 392,000 400,000 m_AIR_Average Price 384,409 383,951 390,754 390,878 398,571 384,237 384,658 364,498 393,210 387,240 383,670 396,018 m_AIR_Index 181 182 185 188 191 192 194 195 196 197 198 199
2015 01/01/15 02/01/15 03/01/15 04/01/15 05/01/15 06/01/15 07/01/15 08/01/15 09/01/15 10/01/15 11/01/15 12/01/15m_AIR_RSales 65 99 138 138 152 166 163 135 118 95 89 66 m_AIR_RNew Listings 224 230 194 214 223 243 197 184 179 184 129 88 m_AIR_RInventory 289 364 359 372 367 384 364 346 346 358 331 289 m_AIR_Days on Market 41 35 39 40 38 47 41 42 50 51 47 58 m_AIR_Benchmark Price 377,400 378,000 376,100 375,500 375,300 374,900 373,800 371,700 372,100 370,400 367,900 368,500 m_AIR_Median Price 376,000 395,000 384,000 396,500 392,500 387,400 382,500 375,000 410,750 386,500 360,000 365,450 m_AIR_Average Price 365,156 398,714 378,408 394,555 395,152 394,320 394,454 380,909 416,978 392,074 378,645 369,606 m_AIR_Index 199 200 199 198 198 198 197 196 196 196 194 195
Dec-14 Dec-15 2014 2015AIRDRIE TOTAL SALES 12/01/14 12/01/15 12/01/14 12/01/15
m_Aytd_ >$100,000 - - - - m_Aytd_ $100,000 - $199,999 2 3 80 65 m_Aytd_ $200,000 - $299,999 10 17 316 268 m_Aytd_ $300,000 -$ 349,999 9 6 217 172 m_Aytd_ $350,000 - $399,999 10 15 342 297 m_Aytd_ $400,000 - $449,999 12 10 314 242 m_Aytd_ $450,000 - $499,999 12 9 184 185 m_Aytd_ $500,000 - $549,999 6 3 123 84 m_Aytd_ $550,000 - $599,999 2 3 60 40 m_Aytd_ $600,000 - $649,999 - - 23 35 m_Aytd_ $650,000 - $699,999 - - 13 9 m_Aytd_ $700,000 - $799,999 - - 13 12 m_Aytd_ $800,000 - $899,999 1 - 6 7 m_Aytd_ $900,000 - $999,999 - - 1 6 m_Aytd_ $1,000,000 - $1,249,999 - - 2 1 m_Aytd_ $1,250,000 - $1,499,999 - - 1 1 m_Aytd_ $1,500,000 - $1,749,999 - - - - m_Aytd_ $1,750,000 - $1,999,999 - - - - m_Aytd_ $2,000,000 - $2,499,999 - - - - m_Aytd_ $2,500,000 - $2,999,999 - - - - m_Aytd_ $3,000,000 - $3,499,999 - - - - m_Aytd_ $3,500,000 - $3,999,999 - - - - m_Aytd_ $4,000,000 + - - - -
64 66 1,695 1,424
0%
5%
10%
15%
20%
25%
30%
35%
40%
45%
50%
<$200,000 $200,000 -$299,999
$300,000 -$399,999
$400,000 -$499,999
$500,000 -$599,999
$600,000 -$699,999
$700,000 -999,999
$1,000,000+
AIRDRIE SHARE OF SALES BY PRICE RANGE
2012 2013 2014 2015 Source: CREB®
AirdrieTotal Residential
C R E B ® C a l g a r y R e g i o n a l H o u s i n g M a r k e t S t a t i s t i c s
Page 17
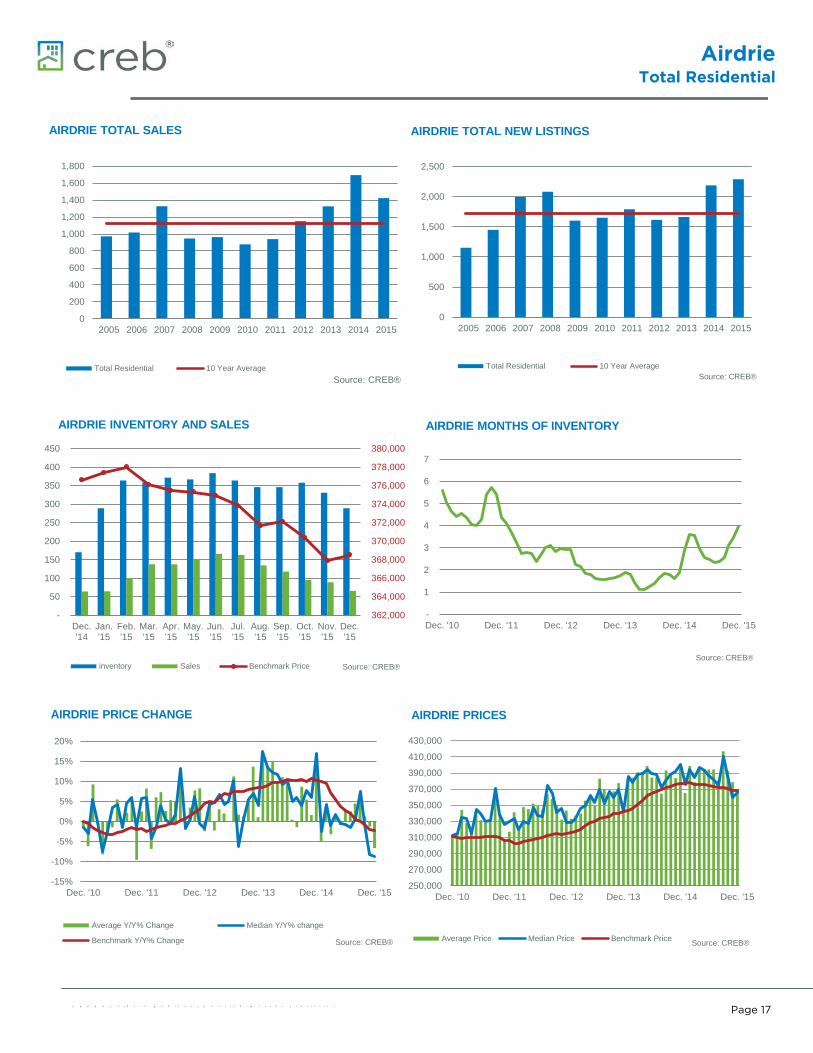
0
200
400
600
800
1,000
1,200
1,400
1,600
1,800
2005 2006 2007 2008 2009 2010 2011 2012 2013 2014 2015
AIRDRIE TOTAL SALES
Total Residential 10 Year AverageSource: CREB®
0
500
1,000
1,500
2,000
2,500
2005 2006 2007 2008 2009 2010 2011 2012 2013 2014 2015
AIRDRIE TOTAL NEW LISTINGS
Total Residential 10 Year AverageSource: CREB®
362,000
364,000
366,000
368,000
370,000
372,000
374,000
376,000
378,000
380,000
-
50
100
150
200
250
300
350
400
450
Dec.'14
Jan.'15
Feb.'15
Mar.'15
Apr.'15
May.'15
Jun.'15
Jul.'15
Aug.'15
Sep.'15
Oct.'15
Nov.'15
Dec.'15
AIRDRIE INVENTORY AND SALES
inventory Sales Benchmark Price Source: CREB®
-
1
2
3
4
5
6
7
Dec. '10 Dec. '11 Dec. '12 Dec. '13 Dec. '14 Dec. '15
AIRDRIE MONTHS OF INVENTORY
Source: CREB®
-15%
-10%
-5%
0%
5%
10%
15%
20%
Dec. '10 Dec. '11 Dec. '12 Dec. '13 Dec. '14 Dec. '15
AIRDRIE PRICE CHANGE
Average Y/Y% Change Median Y/Y% change
Benchmark Y/Y% Change Source: CREB®
250,000
270,000
290,000
310,000
330,000
350,000
370,000
390,000
410,000
430,000
Dec. '10 Dec. '11 Dec. '12 Dec. '13 Dec. '14 Dec. '15
AIRDRIE PRICES
Average Price Median Price Benchmark Price Source: CREB®
Region of RockyviewTotal Residential
C R E B ® C a l g a r y R e g i o n a l H o u s i n g M a r k e t S t a t i s t i c s
Page 18
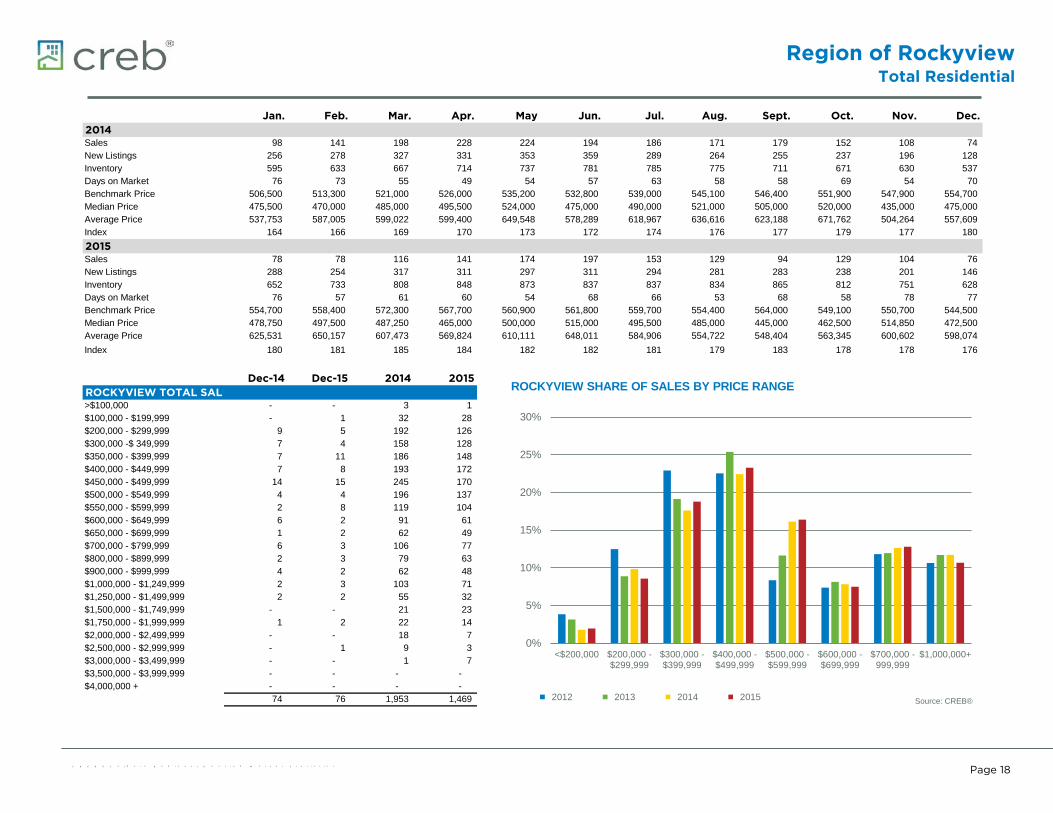
Jan. Feb. Mar. Apr. May Jun. Jul. Aug. Sept. Oct. Nov. Dec.2014 01/01/14 02/01/14 03/01/14 04/01/14 05/01/14 06/01/14 07/01/14 08/01/14 09/01/14 10/01/14 11/01/14 12/01/14
m_mdrv_Sales 98 141 198 228 224 194 186 171 179 152 108 74 m_mdrv_New Listings 256 278 327 331 353 359 289 264 255 237 196 128 m_mdrv_Inventory 595 633 667 714 737 781 785 775 711 671 630 537 m_mdrvDays on Market 76 73 55 49 54 57 63 58 58 69 54 70 m_mdrvBenchmark Price 506,500 513,300 521,000 526,000 535,200 532,800 539,000 545,100 546,400 551,900 547,900 554,700 m_mdrvMedian Price 475,500 470,000 485,000 495,500 524,000 475,000 490,000 521,000 505,000 520,000 435,000 475,000 m_mdrvAverage Price 537,753 587,005 599,022 599,400 649,548 578,289 618,967 636,616 623,188 671,762 504,264 557,609 m_mdrvIndex 164 166 169 170 173 172 174 176 177 179 177 180
2015 01/01/15 02/01/15 03/01/15 04/01/15 05/01/15 06/01/15 07/01/15 08/01/15 09/01/15 10/01/15 11/01/15 12/01/15m_mdrv_Sales 78 78 116 141 174 197 153 129 94 129 104 76 m_mdrv_New Listings 288 254 317 311 297 311 294 281 283 238 201 146 m_mdrv_Inventory 652 733 808 848 873 837 837 834 865 812 751 628 m_mdrvDays on Market 76 57 61 60 54 68 66 53 68 58 78 77 m_mdrvBenchmark Price 554,700 558,400 572,300 567,700 560,900 561,800 559,700 554,400 564,000 549,100 550,700 544,500 m_mdrvMedian Price 478,750 497,500 487,250 465,000 500,000 515,000 495,500 485,000 445,000 462,500 514,850 472,500 m_mdrvAverage Price 625,531 650,157 607,473 569,824 610,111 648,011 584,906 554,722 548,404 563,345 600,602 598,074 m_mdrvIndex 180 181 185 184 182 182 181 179 183 178 178 176
Dec-14 Dec-15 2014 2015ROCKYVIEW TOTAL SALE 12/01/14 12/01/15 12/01/14 12/01/15
m_mytd_ >$100,000 - - 3 1 m_mytd_ $100,000 - $199,999 - 1 32 28 m_mytd_ $200,000 - $299,999 9 5 192 126 m_mytd_ $300,000 -$ 349,999 7 4 158 128 m_mytd_ $350,000 - $399,999 7 11 186 148 m_mytd_ $400,000 - $449,999 7 8 193 172 m_mytd_ $450,000 - $499,999 14 15 245 170 m_mytd_ $500,000 - $549,999 4 4 196 137 m_mytd_ $550,000 - $599,999 2 8 119 104 m_mytd_ $600,000 - $649,999 6 2 91 61 m_mytd_ $650,000 - $699,999 1 2 62 49 m_mytd_ $700,000 - $799,999 6 3 106 77 m_mytd_ $800,000 - $899,999 2 3 79 63 m_mytd_ $900,000 - $999,999 4 2 62 48 m_mytd_ $1,000,000 - $1,249,999 2 3 103 71 m_mytd_ $1,250,000 - $1,499,999 2 2 55 32 m_mytd_ $1,500,000 - $1,749,999 - - 21 23 m_mytd_ $1,750,000 - $1,999,999 1 2 22 14 m_mytd_ $2,000,000 - $2,499,999 - - 18 7 m_mytd_ $2,500,000 - $2,999,999 - 1 9 3 m_mytd_ $3,000,000 - $3,499,999 - - 1 7 m_mytd_ $3,500,000 - $3,999,999 - - - - m_mytd_ $4,000,000 + - - - -
74 76 1,953 1,469
0%
5%
10%
15%
20%
25%
30%
<$200,000 $200,000 -$299,999
$300,000 -$399,999
$400,000 -$499,999
$500,000 -$599,999
$600,000 -$699,999
$700,000 -999,999
$1,000,000+
ROCKYVIEW SHARE OF SALES BY PRICE RANGE
2012 2013 2014 2015 Source: CREB®
Region of RockyviewTotal Residential
C R E B ® C a l g a r y R e g i o n a l H o u s i n g M a r k e t S t a t i s t i c s
Page 19
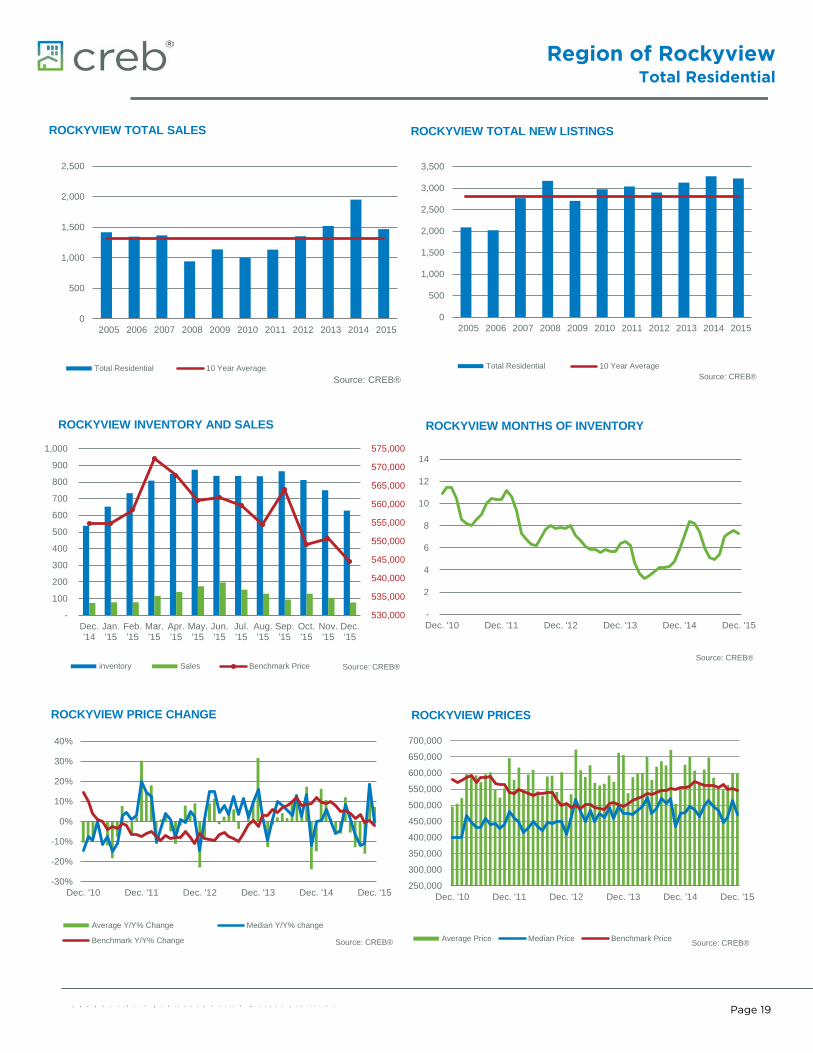
0
500
1,000
1,500
2,000
2,500
2005 2006 2007 2008 2009 2010 2011 2012 2013 2014 2015
ROCKYVIEW TOTAL SALES
Total Residential 10 Year AverageSource: CREB®
0
500
1,000
1,500
2,000
2,500
3,000
3,500
2005 2006 2007 2008 2009 2010 2011 2012 2013 2014 2015
ROCKYVIEW TOTAL NEW LISTINGS
Total Residential 10 Year AverageSource: CREB®
530,000
535,000
540,000
545,000
550,000
555,000
560,000
565,000
570,000
575,000
-
100
200
300
400
500
600
700
800
900
1,000
Dec.'14
Jan.'15
Feb.'15
Mar.'15
Apr.'15
May.'15
Jun.'15
Jul.'15
Aug.'15
Sep.'15
Oct.'15
Nov.'15
Dec.'15
ROCKYVIEW INVENTORY AND SALES
inventory Sales Benchmark Price Source: CREB®
-
2
4
6
8
10
12
14
Dec. '10 Dec. '11 Dec. '12 Dec. '13 Dec. '14 Dec. '15
ROCKYVIEW MONTHS OF INVENTORY
Source: CREB®
-30%
-20%
-10%
0%
10%
20%
30%
40%
Dec. '10 Dec. '11 Dec. '12 Dec. '13 Dec. '14 Dec. '15
ROCKYVIEW PRICE CHANGE
Average Y/Y% Change Median Y/Y% change
Benchmark Y/Y% Change Source: CREB®
250,000
300,000
350,000
400,000
450,000
500,000
550,000
600,000
650,000
700,000
Dec. '10 Dec. '11 Dec. '12 Dec. '13 Dec. '14 Dec. '15
ROCKYVIEW PRICES
Average Price Median Price Benchmark Price Source: CREB®
Region of FoothillsTotal Residential
C R E B ® C a l g a r y R e g i o n a l H o u s i n g M a r k e t S t a t i s t i c s
Page 20
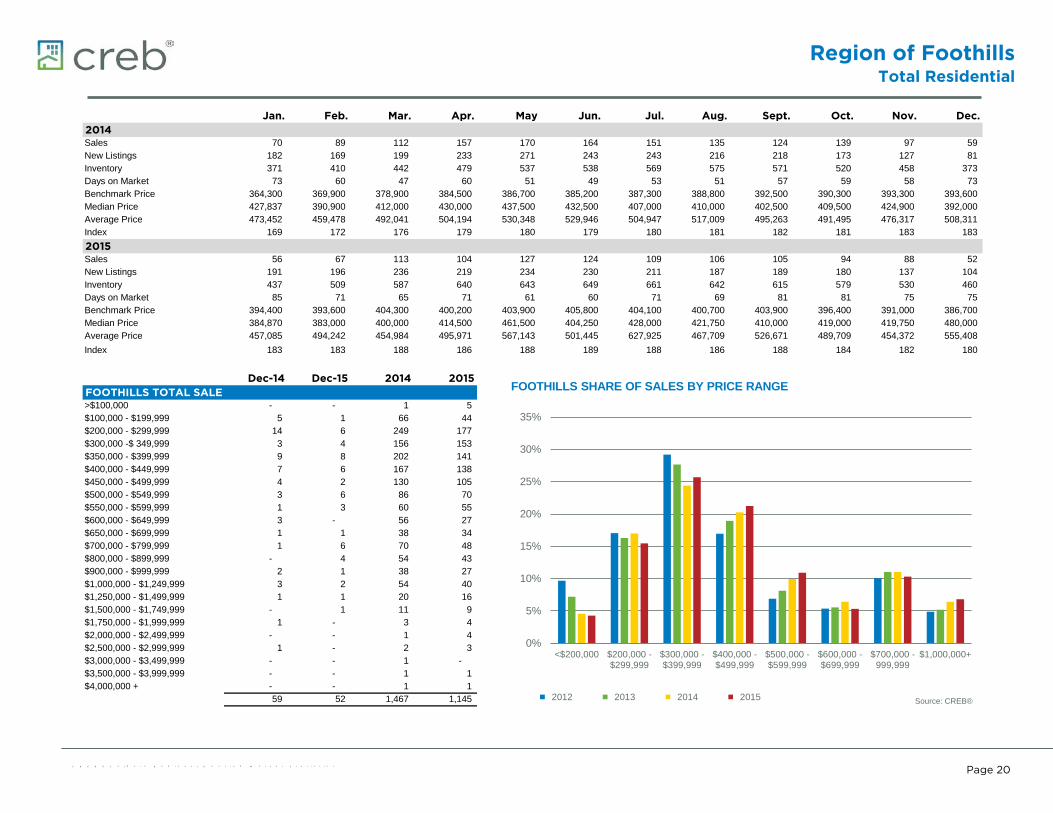
Jan. Feb. Mar. Apr. May Jun. Jul. Aug. Sept. Oct. Nov. Dec.2014 01/01/14 02/01/14 03/01/14 04/01/14 05/01/14 06/01/14 07/01/14 08/01/14 09/01/14 10/01/14 11/01/14 12/01/14
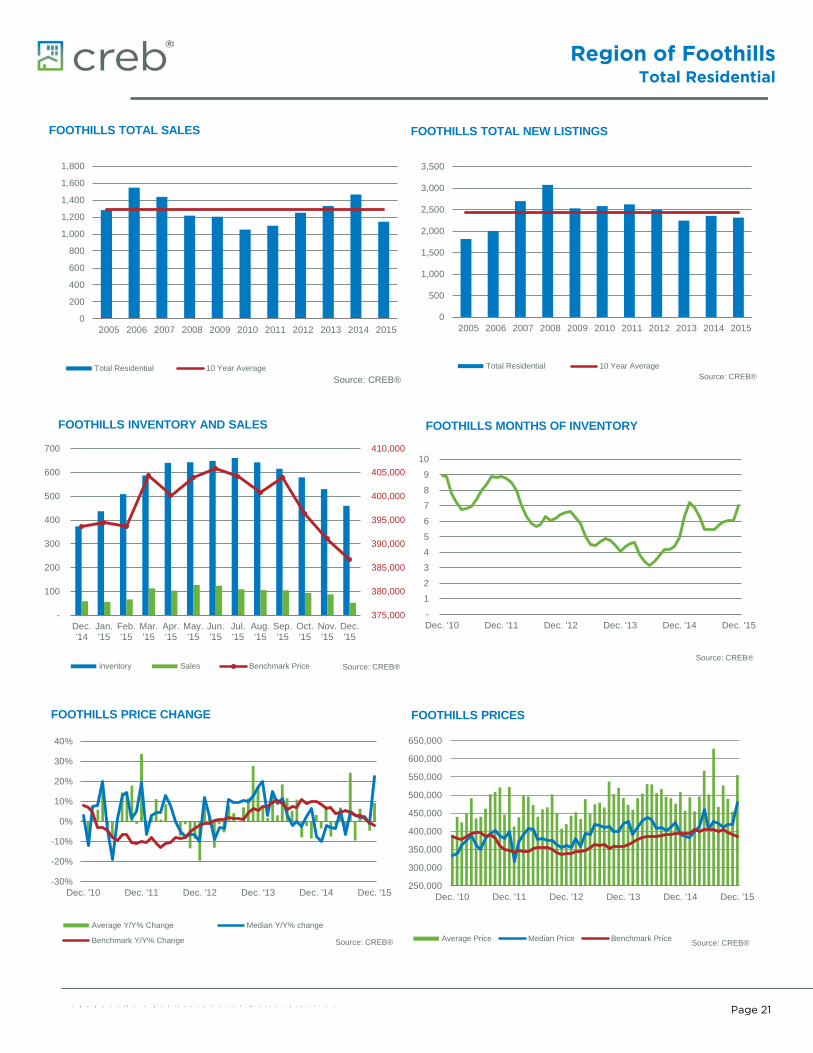
m_mdFHSales 70 89 112 157 170 164 151 135 124 139 97 59 m_mdFHNew Listings 182 169 199 233 271 243 243 216 218 173 127 81 m_mdFHInventory 371 410 442 479 537 538 569 575 571 520 458 373 m_mdFDays on Market 73 60 47 60 51 49 53 51 57 59 58 73 m_mdFBenchmark Price 364,300 369,900 378,900 384,500 386,700 385,200 387,300 388,800 392,500 390,300 393,300 393,600 m_mdFMedian Price 427,837 390,900 412,000 430,000 437,500 432,500 407,000 410,000 402,500 409,500 424,900 392,000 m_mdFAverage Price 473,452 459,478 492,041 504,194 530,348 529,946 504,947 517,009 495,263 491,495 476,317 508,311 m_mdFIndex 169 172 176 179 180 179 180 181 182 181 183 183
2015 01/01/15 02/01/15 03/01/15 04/01/15 05/01/15 06/01/15 07/01/15 08/01/15 09/01/15 10/01/15 11/01/15 12/01/15m_mdFHSales 56 67 113 104 127 124 109 106 105 94 88 52 m_mdFHNew Listings 191 196 236 219 234 230 211 187 189 180 137 104 m_mdFHInventory 437 509 587 640 643 649 661 642 615 579 530 460 m_mdFDays on Market 85 71 65 71 61 60 71 69 81 81 75 75 m_mdFBenchmark Price 394,400 393,600 404,300 400,200 403,900 405,800 404,100 400,700 403,900 396,400 391,000 386,700 m_mdFMedian Price 384,870 383,000 400,000 414,500 461,500 404,250 428,000 421,750 410,000 419,000 419,750 480,000 m_mdFAverage Price 457,085 494,242 454,984 495,971 567,143 501,445 627,925 467,709 526,671 489,709 454,372 555,408 m_mdFIndex 183 183 188 186 188 189 188 186 188 184 182 180
Dec-14 Dec-15 2014 2015FOOTHILLS TOTAL SALES 12/01/14 12/01/15 12/01/14 12/01/15
m_mytd_ >$100,000 - - 1 5 m_mytd_ $100,000 - $199,999 5 1 66 44 m_mytd_ $200,000 - $299,999 14 6 249 177 m_mytd_ $300,000 -$ 349,999 3 4 156 153 m_mytd_ $350,000 - $399,999 9 8 202 141 m_mytd_ $400,000 - $449,999 7 6 167 138 m_mytd_ $450,000 - $499,999 4 2 130 105 m_mytd_ $500,000 - $549,999 3 6 86 70 m_mytd_ $550,000 - $599,999 1 3 60 55 m_mytd_ $600,000 - $649,999 3 - 56 27 m_mytd_ $650,000 - $699,999 1 1 38 34 m_mytd_ $700,000 - $799,999 1 6 70 48 m_mytd_ $800,000 - $899,999 - 4 54 43 m_mytd_ $900,000 - $999,999 2 1 38 27 m_mytd_ $1,000,000 - $1,249,999 3 2 54 40 m_mytd_ $1,250,000 - $1,499,999 1 1 20 16 m_mytd_ $1,500,000 - $1,749,999 - 1 11 9 m_mytd_ $1,750,000 - $1,999,999 1 - 3 4 m_mytd_ $2,000,000 - $2,499,999 - - 1 4 m_mytd_ $2,500,000 - $2,999,999 1 - 2 3 m_mytd_ $3,000,000 - $3,499,999 - - 1 - m_mytd_ $3,500,000 - $3,999,999 - - 1 1 m_mytd_ $4,000,000 + - - 1 1
59 52 1,467 1,145
0%
5%
10%
15%
20%
25%
30%
35%
<$200,000 $200,000 -$299,999
$300,000 -$399,999
$400,000 -$499,999
$500,000 -$599,999
$600,000 -$699,999
$700,000 -999,999
$1,000,000+
FOOTHILLS SHARE OF SALES BY PRICE RANGE
2012 2013 2014 2015 Source: CREB®
Region of FoothillsTotal Residential
C R E B ® C a l g a r y R e g i o n a l H o u s i n g M a r k e t S t a t i s t i c s
Page 21
0
200
400
600
800
1,000
1,200
1,400
1,600
1,800
2005 2006 2007 2008 2009 2010 2011 2012 2013 2014 2015
FOOTHILLS TOTAL SALES
Total Residential 10 Year AverageSource: CREB®
0
500
1,000
1,500
2,000
2,500
3,000
3,500
2005 2006 2007 2008 2009 2010 2011 2012 2013 2014 2015
FOOTHILLS TOTAL NEW LISTINGS
Total Residential 10 Year AverageSource: CREB®
375,000
380,000
385,000
390,000
395,000
400,000
405,000
410,000
-
100
200
300
400
500
600
700
Dec.'14
Jan.'15
Feb.'15
Mar.'15
Apr.'15
May.'15
Jun.'15
Jul.'15
Aug.'15
Sep.'15
Oct.'15
Nov.'15
Dec.'15
FOOTHILLS INVENTORY AND SALES
inventory Sales Benchmark Price Source: CREB®
-
1
2
3
4
5
6
7
8
9
10
Dec. '10 Dec. '11 Dec. '12 Dec. '13 Dec. '14 Dec. '15
FOOTHILLS MONTHS OF INVENTORY
Source: CREB®
-30%
-20%
-10%
0%
10%
20%
30%
40%
Dec. '10 Dec. '11 Dec. '12 Dec. '13 Dec. '14 Dec. '15
FOOTHILLS PRICE CHANGE
Average Y/Y% Change Median Y/Y% change
Benchmark Y/Y% Change Source: CREB®
250,000
300,000
350,000
400,000
450,000
500,000
550,000
600,000
650,000
Dec. '10 Dec. '11 Dec. '12 Dec. '13 Dec. '14 Dec. '15
FOOTHILLS PRICES
Average Price Median Price Benchmark Price Source: CREB®
Surrounding AreaTotal Residential
C R E B ® C a l g a r y R e g i o n a l H o u s i n g M a r k e t S t a t i s t i c s
Page 22
Jan. Feb. Mar. Apr. May Jun. Jul. Aug. Sept. Oct. Nov. Dec.2014 01/01/14 02/01/14 03/01/14 04/01/14 05/01/14 06/01/14 07/01/14 08/01/14 09/01/14 10/01/14 11/01/14 12/01/14
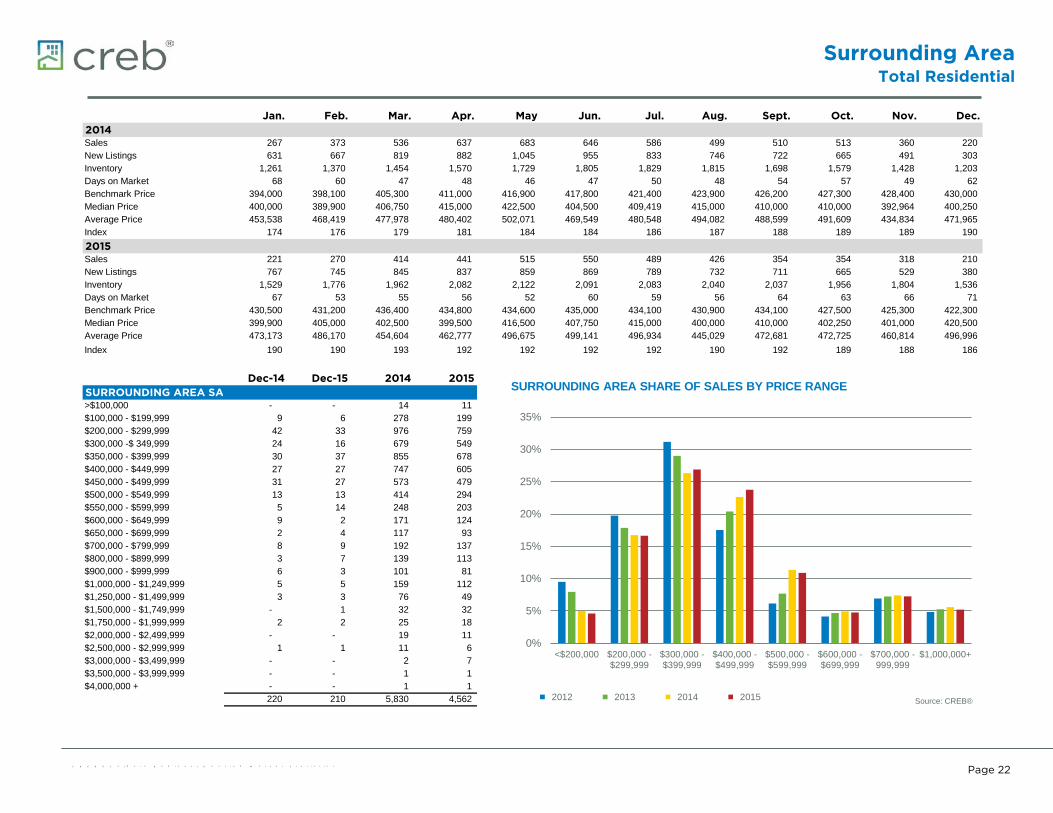
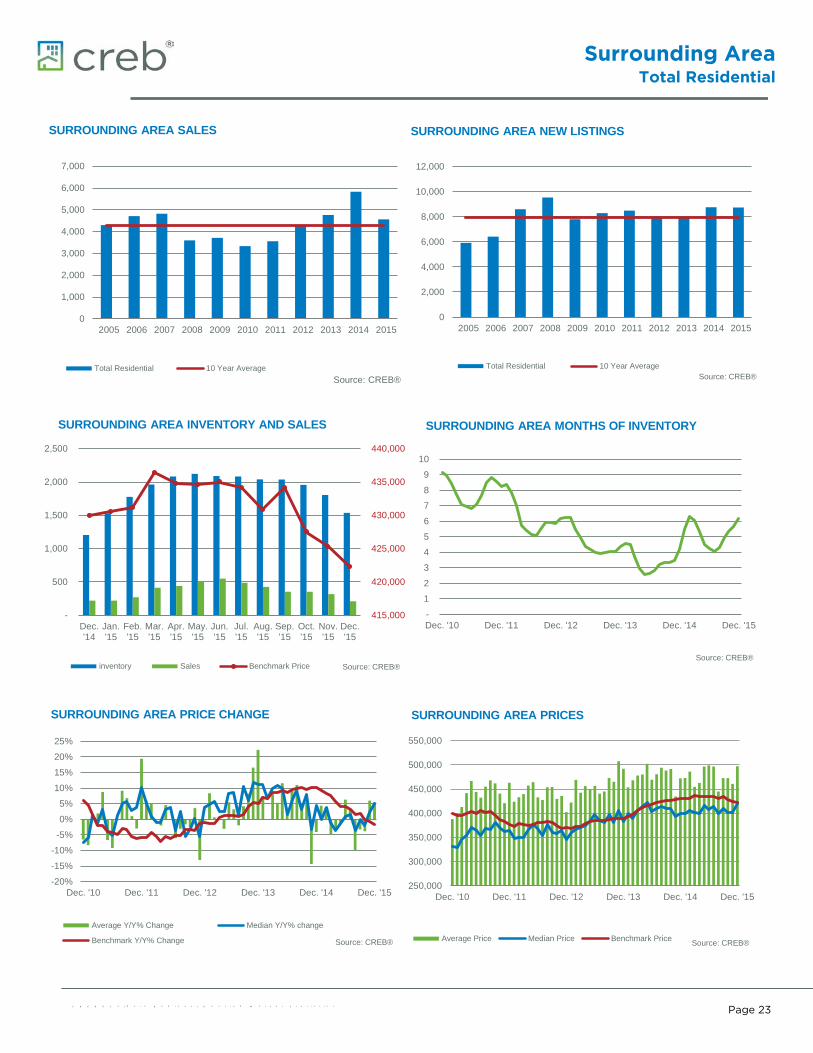
m_SA_R Sales 267 373 536 637 683 646 586 499 510 513 360 220 m_SA_R New Listings 631 667 819 882 1,045 955 833 746 722 665 491 303 m_SA_R Inventory 1,261 1,370 1,454 1,570 1,729 1,805 1,829 1,815 1,698 1,579 1,428 1,203 m_SA_Days on Market 68 60 47 48 46 47 50 48 54 57 49 62 m_SA_Benchmark Price 394,000 398,100 405,300 411,000 416,900 417,800 421,400 423,900 426,200 427,300 428,400 430,000 m_SA_Median Price 400,000 389,900 406,750 415,000 422,500 404,500 409,419 415,000 410,000 410,000 392,964 400,250 m_SA_Average Price 453,538 468,419 477,978 480,402 502,071 469,549 480,548 494,082 488,599 491,609 434,834 471,965 m_SA_Index 174 176 179 181 184 184 186 187 188 189 189 190
2015 01/01/15 02/01/15 03/01/15 04/01/15 05/01/15 06/01/15 07/01/15 08/01/15 09/01/15 10/01/15 11/01/15 12/01/15m_SA_R Sales 221 270 414 441 515 550 489 426 354 354 318 210 m_SA_R New Listings 767 745 845 837 859 869 789 732 711 665 529 380 m_SA_R Inventory 1,529 1,776 1,962 2,082 2,122 2,091 2,083 2,040 2,037 1,956 1,804 1,536 m_SA_Days on Market 67 53 55 56 52 60 59 56 64 63 66 71 m_SA_Benchmark Price 430,500 431,200 436,400 434,800 434,600 435,000 434,100 430,900 434,100 427,500 425,300 422,300 m_SA_Median Price 399,900 405,000 402,500 399,500 416,500 407,750 415,000 400,000 410,000 402,250 401,000 420,500 m_SA_Average Price 473,173 486,170 454,604 462,777 496,675 499,141 496,934 445,029 472,681 472,725 460,814 496,996 m_SA_Index 190 190 193 192 192 192 192 190 192 189 188 186
Dec-14 Dec-15 2014 2015SURROUNDING AREA SA 12/01/14 12/01/15 12/01/14 12/01/15
m_Sytd_ >$100,000 - - 14 11 m_Sytd_ $100,000 - $199,999 9 6 278 199 m_Sytd_ $200,000 - $299,999 42 33 976 759 m_Sytd_ $300,000 -$ 349,999 24 16 679 549 m_Sytd_ $350,000 - $399,999 30 37 855 678 m_Sytd_ $400,000 - $449,999 27 27 747 605 m_Sytd_ $450,000 - $499,999 31 27 573 479 m_Sytd_ $500,000 - $549,999 13 13 414 294 m_Sytd_ $550,000 - $599,999 5 14 248 203 m_Sytd_ $600,000 - $649,999 9 2 171 124 m_Sytd_ $650,000 - $699,999 2 4 117 93 m_Sytd_ $700,000 - $799,999 8 9 192 137 m_Sytd_ $800,000 - $899,999 3 7 139 113 m_Sytd_ $900,000 - $999,999 6 3 101 81 m_Sytd_ $1,000,000 - $1,249,999 5 5 159 112 m_Sytd_ $1,250,000 - $1,499,999 3 3 76 49 m_Sytd_ $1,500,000 - $1,749,999 - 1 32 32 m_Sytd_ $1,750,000 - $1,999,999 2 2 25 18 m_Sytd_ $2,000,000 - $2,499,999 - - 19 11 m_Sytd_ $2,500,000 - $2,999,999 1 1 11 6 m_Sytd_ $3,000,000 - $3,499,999 - - 2 7 m_Sytd_ $3,500,000 - $3,999,999 - - 1 1 m_Sytd_ $4,000,000 + - - 1 1
220 210 5,830 4,562
0%
5%
10%
15%
20%
25%
30%
35%
<$200,000 $200,000 -$299,999
$300,000 -$399,999
$400,000 -$499,999
$500,000 -$599,999
$600,000 -$699,999
$700,000 -999,999
$1,000,000+
SURROUNDING AREA SHARE OF SALES BY PRICE RANGE
2012 2013 2014 2015 Source: CREB®
Surrounding AreaTotal Residential
C R E B ® C a l g a r y R e g i o n a l H o u s i n g M a r k e t S t a t i s t i c s
Page 23
0
1,000
2,000
3,000
4,000
5,000
6,000
7,000
2005 2006 2007 2008 2009 2010 2011 2012 2013 2014 2015
SURROUNDING AREA SALES
Total Residential 10 Year AverageSource: CREB®
0
2,000
4,000
6,000
8,000
10,000
12,000
2005 2006 2007 2008 2009 2010 2011 2012 2013 2014 2015
SURROUNDING AREA NEW LISTINGS
Total Residential 10 Year AverageSource: CREB®
415,000
420,000
425,000
430,000
435,000
440,000
-
500
1,000
1,500
2,000
2,500
Dec.'14
Jan.'15
Feb.'15
Mar.'15
Apr.'15
May.'15
Jun.'15
Jul.'15
Aug.'15
Sep.'15
Oct.'15
Nov.'15
Dec.'15
SURROUNDING AREA INVENTORY AND SALES
inventory Sales Benchmark Price Source: CREB®
-
1
2
3
4
5
6
7
8
9
10
Dec. '10 Dec. '11 Dec. '12 Dec. '13 Dec. '14 Dec. '15
SURROUNDING AREA MONTHS OF INVENTORY
Source: CREB®
-20%
-15%
-10%
-5%
0%
5%
10%
15%
20%
25%
Dec. '10 Dec. '11 Dec. '12 Dec. '13 Dec. '14 Dec. '15
SURROUNDING AREA PRICE CHANGE
Average Y/Y% Change Median Y/Y% change
Benchmark Y/Y% Change Source: CREB®
250,000
300,000
350,000
400,000
450,000
500,000
550,000
Dec. '10 Dec. '11 Dec. '12 Dec. '13 Dec. '14 Dec. '15
SURROUNDING AREA PRICES
Average Price Median Price Benchmark Price Source: CREB®
Economic RegionTotal Residential
C R E B ® C a l g a r y R e g i o n a l H o u s i n g M a r k e t S t a t i s t i c s
Page 24
Jan. Feb. Mar. Apr. May Jun. Jul. Aug. Sept. Oct. Nov. Dec.2014 01/01/14 02/01/14 03/01/14 04/01/14 05/01/14 06/01/14 07/01/14 08/01/14 09/01/14 10/01/14 11/01/14 12/01/14
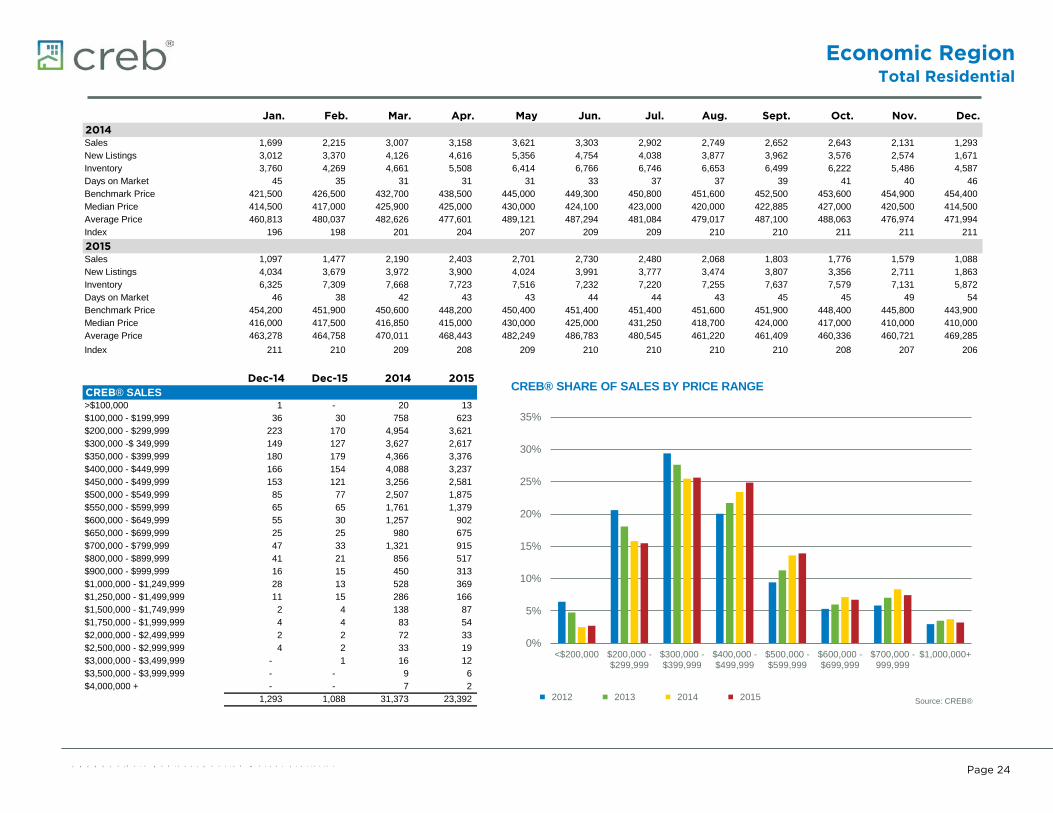
m_CREBSales 1,699 2,215 3,007 3,158 3,621 3,303 2,902 2,749 2,652 2,643 2,131 1,293 m_CREBNew Listings 3,012 3,370 4,126 4,616 5,356 4,754 4,038 3,877 3,962 3,576 2,574 1,671 m_CREBInventory 3,760 4,269 4,661 5,508 6,414 6,766 6,746 6,653 6,499 6,222 5,486 4,587 m_CREDays on Market 45 35 31 31 31 33 37 37 39 41 40 46 m_CREBenchmark Price 421,500 426,500 432,700 438,500 445,000 449,300 450,800 451,600 452,500 453,600 454,900 454,400 m_CREMedian Price 414,500 417,000 425,900 425,000 430,000 424,100 423,000 420,000 422,885 427,000 420,500 414,500 m_CREAverage Price 460,813 480,037 482,626 477,601 489,121 487,294 481,084 479,017 487,100 488,063 476,974 471,994 m_CREIndex 196 198 201 204 207 209 209 210 210 211 211 211
2015 01/01/15 02/01/15 03/01/15 04/01/15 05/01/15 06/01/15 07/01/15 08/01/15 09/01/15 10/01/15 11/01/15 12/01/15m_CREBSales 1,097 1,477 2,190 2,403 2,701 2,730 2,480 2,068 1,803 1,776 1,579 1,088 m_CREBNew Listings 4,034 3,679 3,972 3,900 4,024 3,991 3,777 3,474 3,807 3,356 2,711 1,863 m_CREBInventory 6,325 7,309 7,668 7,723 7,516 7,232 7,220 7,255 7,637 7,579 7,131 5,872 m_CREDays on Market 46 38 42 43 43 44 44 43 45 45 49 54 m_CREBenchmark Price 454,200 451,900 450,600 448,200 450,400 451,400 451,400 451,600 451,900 448,400 445,800 443,900 m_CREMedian Price 416,000 417,500 416,850 415,000 430,000 425,000 431,250 418,700 424,000 417,000 410,000 410,000 m_CREAverage Price 463,278 464,758 470,011 468,443 482,249 486,783 480,545 461,220 461,409 460,336 460,721 469,285 m_CREIndex 211 210 209 208 209 210 210 210 210 208 207 206
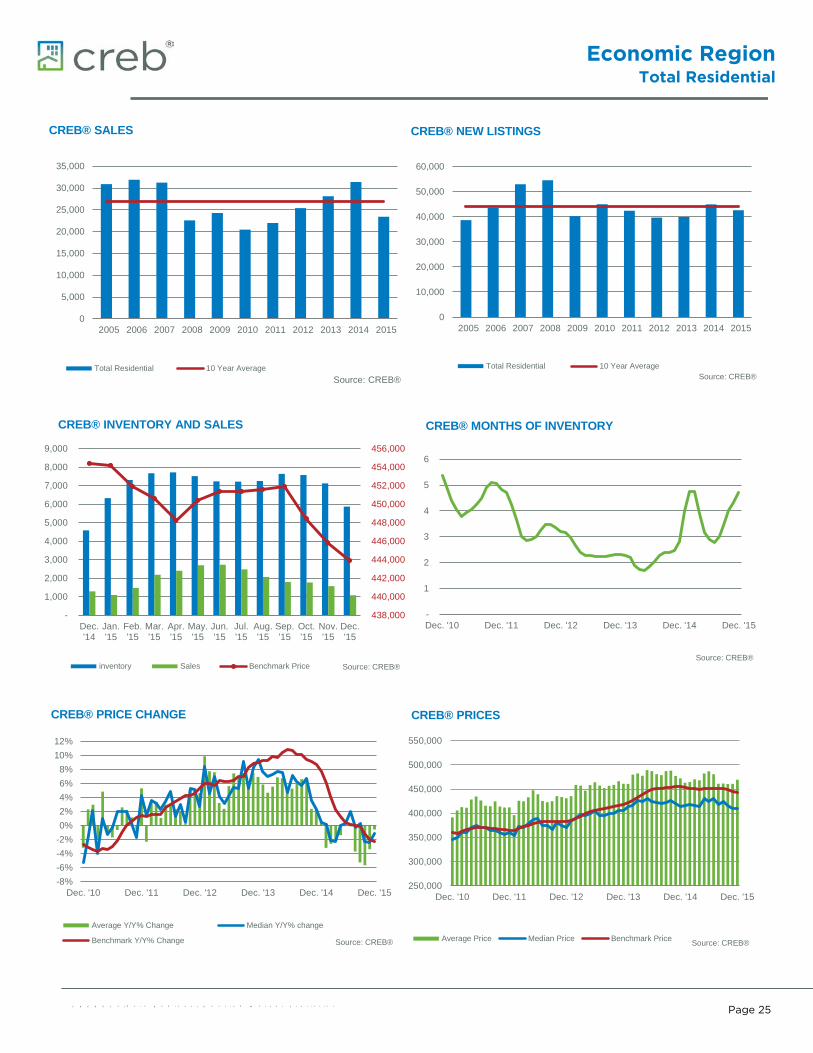
Dec-14 Dec-15 2014 2015CREB® SALES 12/01/14 12/01/15 12/01/14 12/01/15
m_Cytd_ >$100,000 1 - 20 13 m_Cytd_ $100,000 - $199,999 36 30 758 623 m_Cytd_ $200,000 - $299,999 223 170 4,954 3,621 m_Cytd_ $300,000 -$ 349,999 149 127 3,627 2,617 m_Cytd_ $350,000 - $399,999 180 179 4,366 3,376 m_Cytd_ $400,000 - $449,999 166 154 4,088 3,237 m_Cytd_ $450,000 - $499,999 153 121 3,256 2,581 m_Cytd_ $500,000 - $549,999 85 77 2,507 1,875 m_Cytd_ $550,000 - $599,999 65 65 1,761 1,379 m_Cytd_ $600,000 - $649,999 55 30 1,257 902 m_Cytd_ $650,000 - $699,999 25 25 980 675 m_Cytd_ $700,000 - $799,999 47 33 1,321 915 m_Cytd_ $800,000 - $899,999 41 21 856 517 m_Cytd_ $900,000 - $999,999 16 15 450 313 m_Cytd_ $1,000,000 - $1,249,999 28 13 528 369 m_Cytd_ $1,250,000 - $1,499,999 11 15 286 166 m_Cytd_ $1,500,000 - $1,749,999 2 4 138 87 m_Cytd_ $1,750,000 - $1,999,999 4 4 83 54 m_Cytd_ $2,000,000 - $2,499,999 2 2 72 33 m_Cytd_ $2,500,000 - $2,999,999 4 2 33 19 m_Cytd_ $3,000,000 - $3,499,999 - 1 16 12 m_Cytd_ $3,500,000 - $3,999,999 - - 9 6 m_Cytd_ $4,000,000 + - - 7 2
1,293 1,088 31,373 23,392
0%
5%
10%
15%
20%
25%
30%
35%
<$200,000 $200,000 -$299,999
$300,000 -$399,999
$400,000 -$499,999
$500,000 -$599,999
$600,000 -$699,999
$700,000 -999,999
$1,000,000+
CREB® SHARE OF SALES BY PRICE RANGE
2012 2013 2014 2015 Source: CREB®
Economic RegionTotal Residential
C R E B ® C a l g a r y R e g i o n a l H o u s i n g M a r k e t S t a t i s t i c s
Page 25
0
5,000
10,000
15,000
20,000
25,000
30,000
35,000
2005 2006 2007 2008 2009 2010 2011 2012 2013 2014 2015
CREB® SALES
Total Residential 10 Year AverageSource: CREB®
0
10,000
20,000
30,000
40,000
50,000
60,000
2005 2006 2007 2008 2009 2010 2011 2012 2013 2014 2015
CREB® NEW LISTINGS
Total Residential 10 Year AverageSource: CREB®
438,000
440,000
442,000
444,000
446,000
448,000
450,000
452,000
454,000
456,000
-
1,000
2,000
3,000
4,000
5,000
6,000
7,000
8,000
9,000
Dec.'14
Jan.'15
Feb.'15
Mar.'15
Apr.'15
May.'15
Jun.'15
Jul.'15
Aug.'15
Sep.'15
Oct.'15
Nov.'15
Dec.'15
CREB® INVENTORY AND SALES
inventory Sales Benchmark Price Source: CREB®
-
1
2
3
4
5
6
Dec. '10 Dec. '11 Dec. '12 Dec. '13 Dec. '14 Dec. '15
CREB® MONTHS OF INVENTORY
Source: CREB®
-8%-6%-4%-2%0%2%4%6%8%
10%12%
Dec. '10 Dec. '11 Dec. '12 Dec. '13 Dec. '14 Dec. '15
CREB® PRICE CHANGE
Average Y/Y% Change Median Y/Y% change
Benchmark Y/Y% Change Source: CREB®
250,000
300,000
350,000
400,000
450,000
500,000
550,000
Dec. '10 Dec. '11 Dec. '12 Dec. '13 Dec. '14 Dec. '15
CREB® PRICES
Average Price Median Price Benchmark Price Source: CREB®
Caglary CMATotal Residential
C R E B ® C a l g a r y R e g i o n a l H o u s i n g M a r k e t S t a t i s t i c s
Page 26
Jan. Feb. Mar. Apr. May Jun. Jul. Aug. Sept. Oct. Nov. Dec.2014 01/01/14 02/01/14 03/01/14 04/01/14 05/01/14 06/01/14 07/01/14 08/01/14 09/01/14 10/01/14 11/01/14 12/01/14
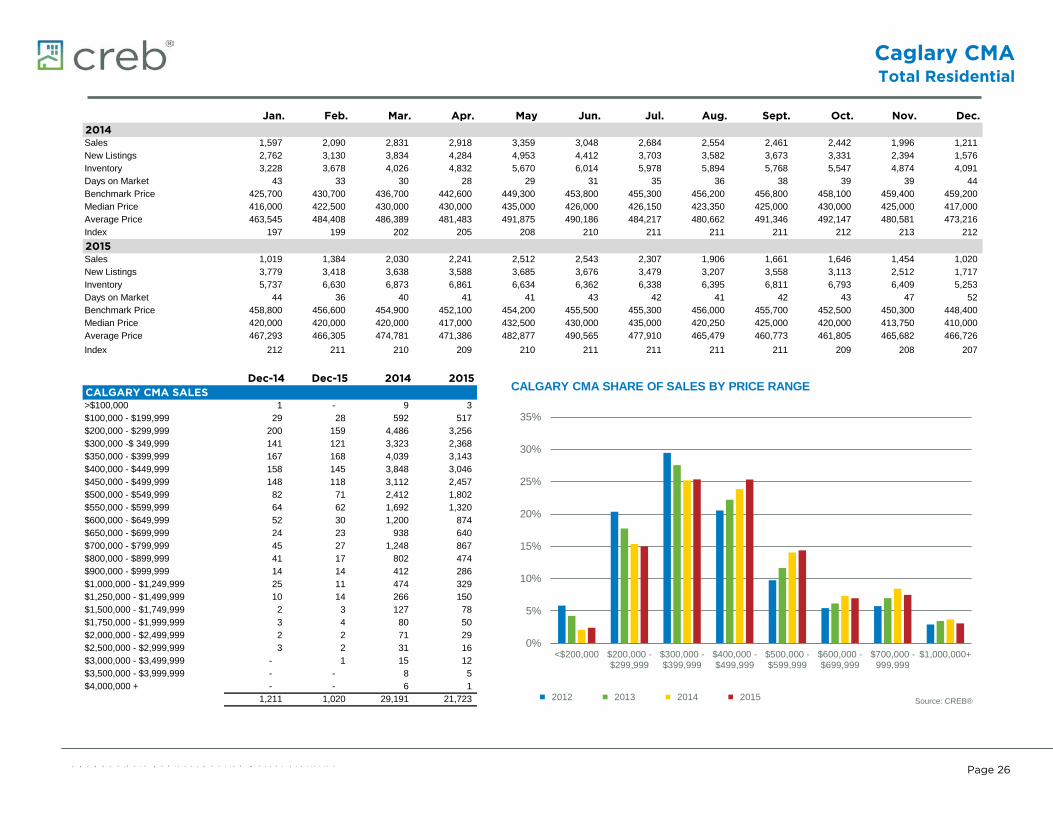
m_Cma_Sales 1,597 2,090 2,831 2,918 3,359 3,048 2,684 2,554 2,461 2,442 1,996 1,211 m_Cma_New Listings 2,762 3,130 3,834 4,284 4,953 4,412 3,703 3,582 3,673 3,331 2,394 1,576 m_Cma_Inventory 3,228 3,678 4,026 4,832 5,670 6,014 5,978 5,894 5,768 5,547 4,874 4,091 m_CmaDays on Market 43 33 30 28 29 31 35 36 38 39 39 44 m_CmaBenchmark Price 425,700 430,700 436,700 442,600 449,300 453,800 455,300 456,200 456,800 458,100 459,400 459,200 m_CmaMedian Price 416,000 422,500 430,000 430,000 435,000 426,000 426,150 423,350 425,000 430,000 425,000 417,000 m_CmaAverage Price 463,545 484,408 486,389 481,483 491,875 490,186 484,217 480,662 491,346 492,147 480,581 473,216 m_CmaIndex 197 199 202 205 208 210 211 211 211 212 213 212
2015 01/01/15 02/01/15 03/01/15 04/01/15 05/01/15 06/01/15 07/01/15 08/01/15 09/01/15 10/01/15 11/01/15 12/01/15m_Cma_Sales 1,019 1,384 2,030 2,241 2,512 2,543 2,307 1,906 1,661 1,646 1,454 1,020 m_Cma_New Listings 3,779 3,418 3,638 3,588 3,685 3,676 3,479 3,207 3,558 3,113 2,512 1,717 m_Cma_Inventory 5,737 6,630 6,873 6,861 6,634 6,362 6,338 6,395 6,811 6,793 6,409 5,253 m_CmaDays on Market 44 36 40 41 41 43 42 41 42 43 47 52 m_CmaBenchmark Price 458,800 456,600 454,900 452,100 454,200 455,500 455,300 456,000 455,700 452,500 450,300 448,400 m_CmaMedian Price 420,000 420,000 420,000 417,000 432,500 430,000 435,000 420,250 425,000 420,000 413,750 410,000 m_CmaAverage Price 467,293 466,305 474,781 471,386 482,877 490,565 477,910 465,479 460,773 461,805 465,682 466,726 m_CmaIndex 212 211 210 209 210 211 211 211 211 209 208 207
Dec-14 Dec-15 2014 2015CALGARY CMA SALES 12/01/14 12/01/15 12/01/14 12/01/15
m_Cytd_ >$100,000 1 - 9 3 m_Cytd_ $100,000 - $199,999 29 28 592 517 m_Cytd_ $200,000 - $299,999 200 159 4,486 3,256 m_Cytd_ $300,000 -$ 349,999 141 121 3,323 2,368 m_Cytd_ $350,000 - $399,999 167 168 4,039 3,143 m_Cytd_ $400,000 - $449,999 158 145 3,848 3,046 m_Cytd_ $450,000 - $499,999 148 118 3,112 2,457 m_Cytd_ $500,000 - $549,999 82 71 2,412 1,802 m_Cytd_ $550,000 - $599,999 64 62 1,692 1,320 m_Cytd_ $600,000 - $649,999 52 30 1,200 874 m_Cytd_ $650,000 - $699,999 24 23 938 640 m_Cytd_ $700,000 - $799,999 45 27 1,248 867 m_Cytd_ $800,000 - $899,999 41 17 802 474 m_Cytd_ $900,000 - $999,999 14 14 412 286 m_Cytd_ $1,000,000 - $1,249,999 25 11 474 329 m_Cytd_ $1,250,000 - $1,499,999 10 14 266 150 m_Cytd_ $1,500,000 - $1,749,999 2 3 127 78 m_Cytd_ $1,750,000 - $1,999,999 3 4 80 50 m_Cytd_ $2,000,000 - $2,499,999 2 2 71 29 m_Cytd_ $2,500,000 - $2,999,999 3 2 31 16 m_Cytd_ $3,000,000 - $3,499,999 - 1 15 12 m_Cytd_ $3,500,000 - $3,999,999 - - 8 5 m_Cytd_ $4,000,000 + - - 6 1
1,211 1,020 29,191 21,723
0%
5%
10%
15%
20%
25%
30%
35%
<$200,000 $200,000 -$299,999
$300,000 -$399,999
$400,000 -$499,999
$500,000 -$599,999
$600,000 -$699,999
$700,000 -999,999
$1,000,000+
CALGARY CMA SHARE OF SALES BY PRICE RANGE
2012 2013 2014 2015 Source: CREB®
Calgary CMATotal Residential
C R E B ® C a l g a r y R e g i o n a l H o u s i n g M a r k e t S t a t i s t i c s
Page 27
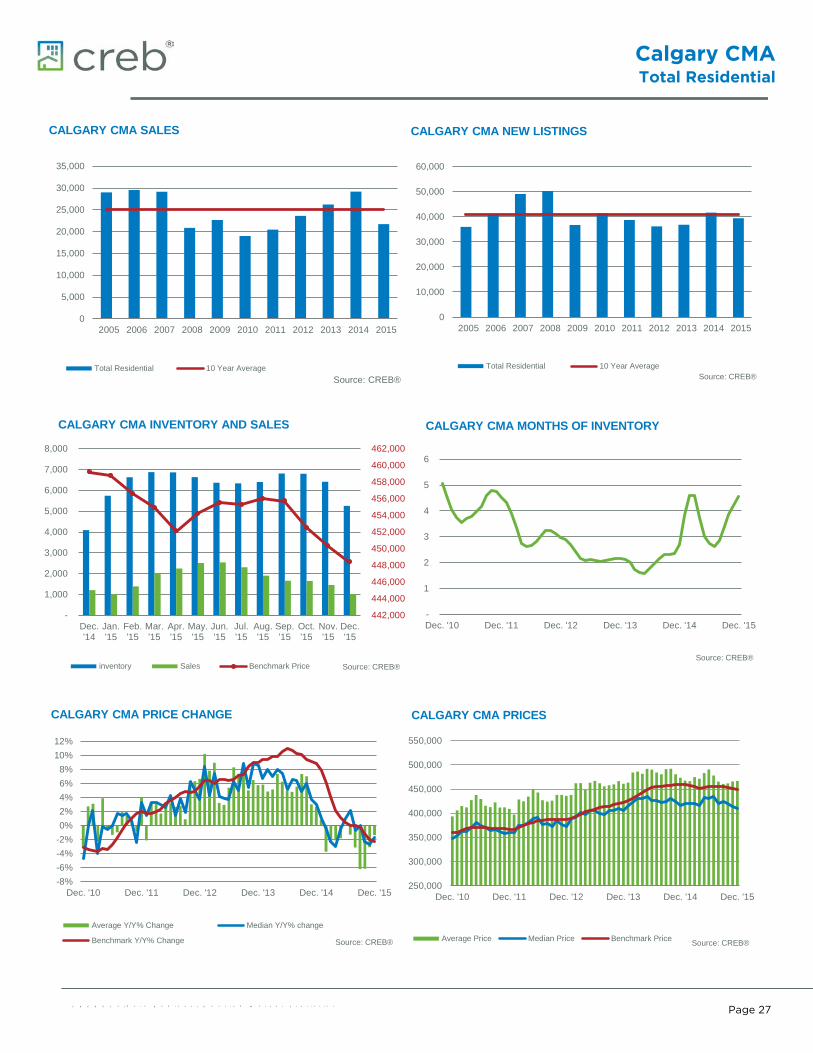
0
5,000
10,000
15,000
20,000
25,000
30,000
35,000
2005 2006 2007 2008 2009 2010 2011 2012 2013 2014 2015
CALGARY CMA SALES
Total Residential 10 Year AverageSource: CREB®
0
10,000
20,000
30,000
40,000
50,000
60,000
2005 2006 2007 2008 2009 2010 2011 2012 2013 2014 2015
CALGARY CMA NEW LISTINGS
Total Residential 10 Year AverageSource: CREB®
442,000
444,000
446,000
448,000
450,000
452,000
454,000
456,000
458,000
460,000
462,000
-
1,000
2,000
3,000
4,000
5,000
6,000
7,000
8,000
Dec.'14
Jan.'15
Feb.'15
Mar.'15
Apr.'15
May.'15
Jun.'15
Jul.'15
Aug.'15
Sep.'15
Oct.'15
Nov.'15
Dec.'15
CALGARY CMA INVENTORY AND SALES
inventory Sales Benchmark Price Source: CREB®
-
1
2
3
4
5
6
Dec. '10 Dec. '11 Dec. '12 Dec. '13 Dec. '14 Dec. '15
CALGARY CMA MONTHS OF INVENTORY
Source: CREB®
-8%-6%-4%-2%0%2%4%6%8%
10%12%
Dec. '10 Dec. '11 Dec. '12 Dec. '13 Dec. '14 Dec. '15
CALGARY CMA PRICE CHANGE
Average Y/Y% Change Median Y/Y% change
Benchmark Y/Y% Change Source: CREB®
250,000
300,000
350,000
400,000
450,000
500,000
550,000
Dec. '10 Dec. '11 Dec. '12 Dec. '13 Dec. '14 Dec. '15
CALGARY CMA PRICES
Average Price Median Price Benchmark Price Source: CREB®
C R E B ® C a l g a r y R e g i o n a l H o u s i n g M a r k e t S t a t i s t i c s
Page 28
DEFINITIONS
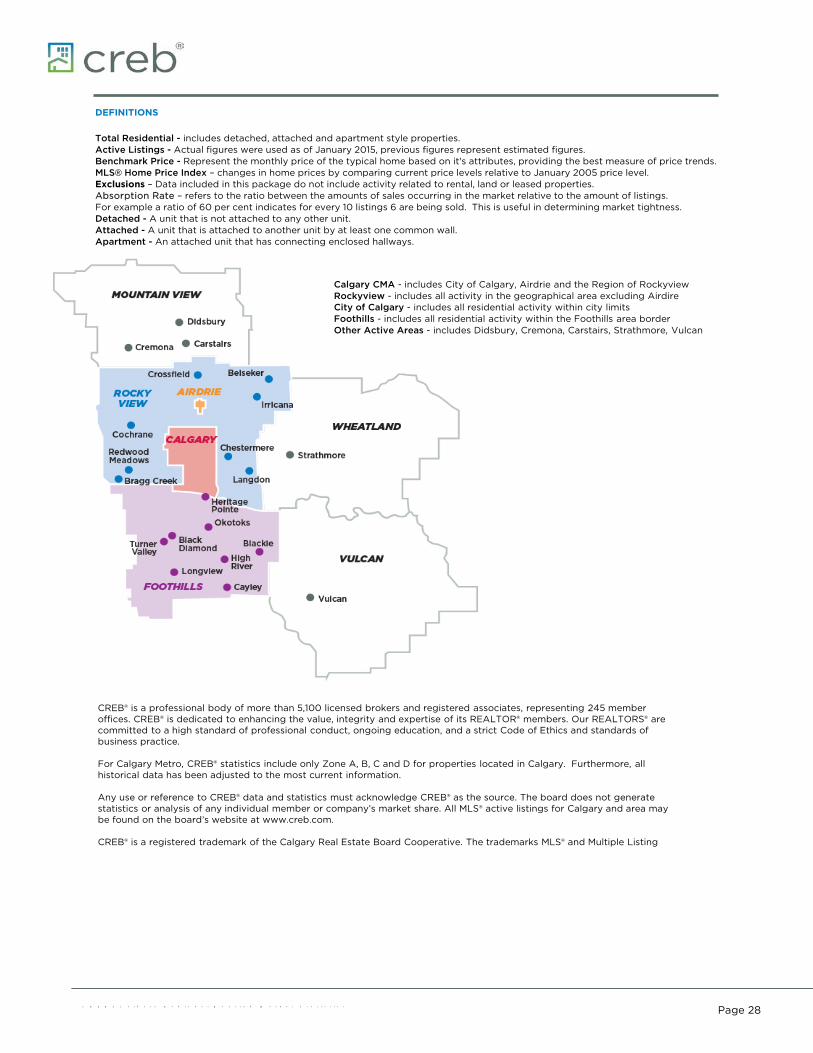
Total Residential - includes detached, attached and apartment style properties.Active Listings - Actual figures were used as of January 2015, previous figures represent estimated figures.Benchmark Price - Represent the monthly price of the typical home based on it's attributes, providing the best measure of price trends.MLS® Home Price Index – changes in home prices by comparing current price levels relative to January 2005 price level. Exclusions – Data included in this package do not include activity related to rental, land or leased properties.Absorption Rate – refers to the ratio between the amounts of sales occurring in the market relative to the amount of listings. For example a ratio of 60 per cent indicates for every 10 listings 6 are being sold. This is useful in determining market tightness.Detached - A unit that is not attached to any other unit.Attached - A unit that is attached to another unit by at least one common wall.Apartment - An attached unit that has connecting enclosed hallways.
ABOUT CREB®
CREB® is a professional body of more than 5,100 licensed brokers and registered associates, representing 245 member offices. CREB® is dedicated to enhancing the value, integrity and expertise of its REALTOR® members. Our REALTORS® are committed to a high standard of professional conduct, ongoing education, and a strict Code of Ethics and standards of business practice. For Calgary Metro, CREB® statistics include only Zone A, B, C and D for properties located in Calgary. Furthermore, all historical data has been adjusted to the most current information. Any use or reference to CREB® data and statistics must acknowledge CREB® as the source. The board does not generate statistics or analysis of any individual member or company’s market share. All MLS® active listings for Calgary and area may be found on the board’s website at www.creb.com. CREB® is a registered trademark of the Calgary Real Estate Board Cooperative. The trademarks MLS® and Multiple Listing
Calgary CMA - includes City of Calgary, Airdrie and the Region of Rockyview Rockyview - includes all activity in the geographical area excluding Airdire City of Calgary - includes all residential activity within city limits Foothills - includes all residential activity within the Foothills area border Other Active Areas - includes Didsbury, Cremona, Carstairs, Strathmore, Vulcan