Calculating emission inventories for vehicles in California · PDF fileCalculating emission...
78
EMFAC2007 version 2.30 Calculating emission inventories for vehicles in California User’s Guide The purpose of this document is to familiarize new users with the Emfac model - EMFAC2007 version 2.3. It provides: • An overview of what pollutants and emission processes are modeled • Introduces Burden, Emfac and Calimfac emission modes • Sample output files • Information on editing fundamental data 1
-
Upload
nguyendiep -
Category
Documents
-
view
222 -
download
0
Transcript of Calculating emission inventories for vehicles in California · PDF fileCalculating emission...
EMFAC2007 version 2.30
Calculating emission inventories for vehicles in California
User’s Guide The purpose of this document is to familiarize new users with the Emfac model - EMFAC2007 version 2.3. It provides: • An overview of what pollutants and emission processes are modeled • Introduces Burden, Emfac and Calimfac emission modes • Sample output files • Information on editing fundamental data
1

Table of Contents Page # 1.0 Introduction................................................................................................. 3
What is Emfac2007.................................................................................................. 3 About this document ................................................................................................ 4
2.0 What Pollutants and Processes are Modeled............................................ 4 Pollutants ................................................................................................................ 4 Emission processes.................................................................................................. 5
3.0 Overview of Basic Terminology................................................................. 6 Vehicle fleet ............................................................................................................. 6 Vehicle class ............................................................................................................ 7 Fuel.......................................................................................................................... 7 Technology group.................................................................................................... 7 Model year............................................................................................................... 8 Activity..................................................................................................................... 8 Population ............................................................................................................... 8 Vehicle Miles Traveled ........................................................................................... 8 Trips ........................................................................................................................ 9
4.0 Basic Data for a Scenario ........................................................................... 9 Geographic area...................................................................................................... 9 Method – “Simple average” or “Do each sub-area” option................................ 10 Calendar year........................................................................................................ 10 Month or season .................................................................................................... 10 Model year range and model year specific options............................................... 11 Inspection and maintenance options ..................................................................... 11
5.0 System Requirements and Installation ................................................... 12 System requirements.............................................................................................. 12 Installation ............................................................................................................ 13 Removal ................................................................................................................ 13
6.0 Running Emfac2007.................................................................................. 14 Starting the program ......................................................................................... 14
File menu .......................................................................................................... 14 Run menu............................................................................................................... 15 Help menu ............................................................................................................. 15 The main screen..................................................................................................... 16 Adding or editing scenarios ................................................................................. 17
7.0 Introduction to the Three Modeling Modes ........................................... 26 Burden mode ......................................................................................................... 27 Emfac mode ........................................................................................................... 36 Calimfac mode....................................................................................................... 43
8.0 Editing Fundamental Data....................................................................... 51 Editing technology fractions and I/M options ....................................................... 52 Interim I/M ............................................................................................................ 54 Changing activity data .......................................................................................... 45 Editing profiles/speed............................................................................................ 60
Appendices ..............................................................................................66 Appendix 1 – Exhaust Technology Groups ........................................................... 66 Appendix 2 – Evaporative Technology Groups..................................................... 74
Appendix 2 – Ceidars/CEFS output Format--------------------------------------------76
2
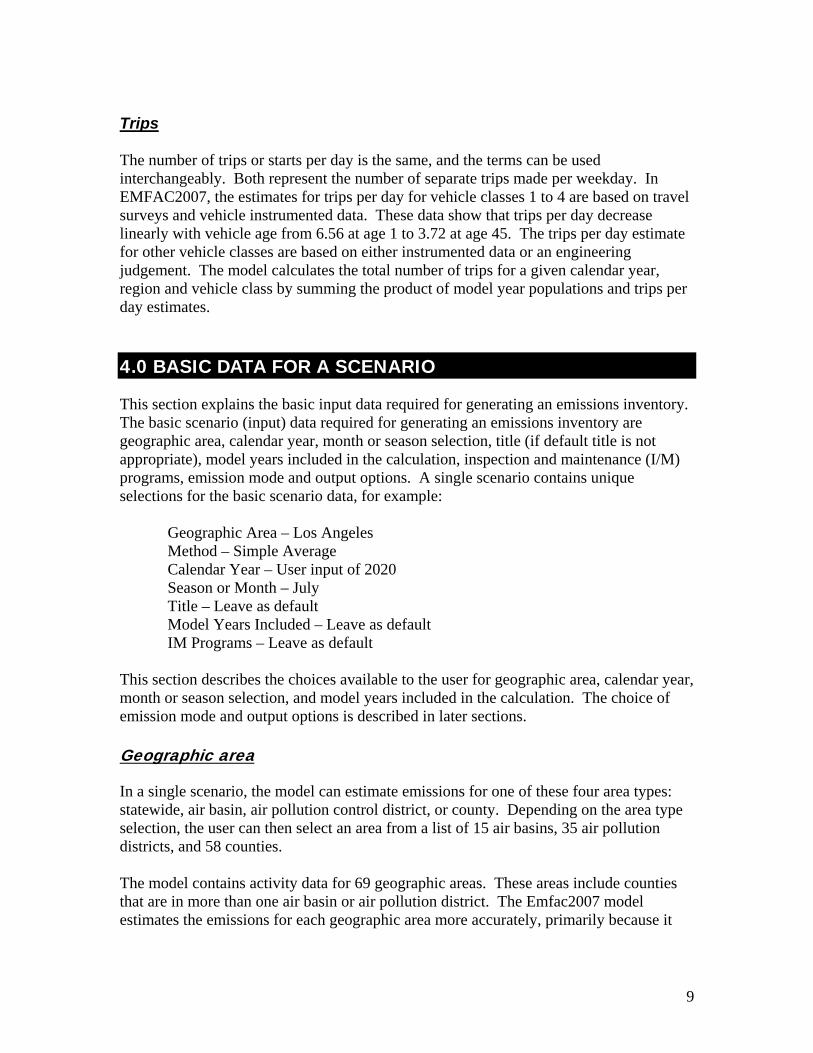
1.0 INTRODUCING EMFAC2007 VERSION 2.30 The Air Resources Board (ARB) promotes and protects public health, welfare and ecological resources by identifying ecological concerns, determining methods for efficient reduction of air pollutants, and making informed decisions based on the data at hand. To help in this effort, ARB developed an EMission FACtors (EMFAC) model to calculate emission rates from all motor vehicles, such as Passenger cars to heavy-duty trucks, operating on highways, freeways and local roads in California. In the EMFAC model, the emission rates are multiplied with vehicle activity data provided by the regional transportation agencies to calculate the statewide or regional emission inventories. An emission inventory can be summarized as the ‘product of an emission rate (e.g. grams per pollutant emitted over a mile) and vehicle activity (e.g. miles driven per day)’. Hint: the following basic statement determines how emissions are calculated: Emission Factor X Correction factor X travel activity = Emissions in tons per day Over the years, tougher emissions standards have been met with technological solutions of increasing complexity. As a result, the emission estimation models have also grown in size and complexity. The need for emission data to be accurate has not changed. However, these data can impact proposed regulations in California, and in some instances, the entire nation. What Is Emfac2007?
Emfac2007 version 2.30 is the latest emission inventory model that calculates emission inventories for motor vehicles operating on roads in California. This model reflects the ARB’s current understanding of how vehicles travel and how much they pollute. The Emfac2007 model can be used to show how California motor vehicle emissions have changed over time and are projected to change in the future. This information helps ARB weigh prospective control programs and determine the most effective, science-based proposals for protecting the environment. The Emfac2007 model supercedes Emfac2002, which was released in November 2002. The Emfac2007 model, like previous versions Emfac2000 and Emfac 2002, is an integrated model in that it combines emission rate data with vehicle activity to calculate an emission inventory.
3

About this document
The purpose of this draft document is to familiarize new users to the Emfac2007 version 2.30 model. It introduces new users of motor vehicle emissions models to concepts and basic terminology that will teach users how to run the model and make use of all the new features. However, this guide does not provide information on the data sources and details of the modeling equations used in generating the emission estimates. Further, this is a draft user’s guide that will be handed out to the attendees of Emfac2007 workshops. This document will complement a real-time presentation given at these workshops. Section 2 provides an overview of the pollutants and emission processes currently modeled in Emfac2007. Section 3 introduces new users to basic terminology necessary for understanding the outputs from the model. Section 4 details the basic input data required for generating an emission inventory. Section 5 reviews the system requirements necessary for running the model. The remaining sections show the user how to start the model, and explain the three basic emission modes: Burden, Emfac and Calimfac. These sections also provide sample outputs for each of the emission modes. Section 8 shows users how to edit some of the fundamental data, such as vehicle population and vehicle miles traveled, and generate an emissions inventory using the edited data. 2.0 WHAT POLLUTANTS AND PROCESSES ARE MODELED
This section details the pollutants currently modeled in Emfac2007, and gives an overview of the emission processes. An emission process is tied to vehicle activity, for example when a vehicle is traveling down the freeway it emits emissions from the vehicle tailpipe. This process is labeled “running exhaust.” For each pollutant the model calculates emissions from each emissions process. All the output reports show these emissions by emissions process. Pollutants
The model calculates emission factors and emission inventories for the following primary pollutants:
Hydrocarbons (HC). HC can be expressed as TOG (total organic gases), ROG (reactive organic gases), THC (total hydrocarbon), or CH4 (methane). The THC class includes compounds with H and C atoms only, carbonyls and halogens are not included in the class. The TOG class includes all organic gases emitted into the atmosphere. The ROG class is same as EPA’s VOC (volatile organic compounds) definition and does not contain compounds exempt from regulation.
•
•
•
•
Carbon monoxide (CO).
Nitrogen oxides (NOx).
Carbon dioxide (CO2).
4

Particulate matter (PM). PM estimates are provided for total suspended particulate, particulate matter 10 microns or less in diameter (PM10), and particulate matter 2.5 microns or less in diameter (PM2.5).
•
•
•
•
Fuel consumption. Although, this is not a pollutant, fuel consumption is calculated based on the emissions of CO, CO2 and THC using the carbon balance equation.
Oxides of sulfur (SOx). Emissions of oxides of sulfur are a function of the sulfur content of fuel. The model calculates these emissions by multiplying the fuel consumption by the weight fraction of sulfur in a gallon of fuel.
Lead (Pb). Lead emissions are also a function of the lead content in fuel. Hence, the model calculates lead by multiplying the fuel consumption by the number of grams of lead per gallon.
Note: Lead was phased out in 1992 and lead results will be zero for 1992 and newer calendar years.
Emission processes
Emissions (especially HC) emanate from a vehicle during all hours of the day. The magnitude of these emissions varies with what is happening to the vehicle. Was the vehicle just started, is it running on the road, is it idling at a loading zone or just sitting outside in the sun? An emissions process is tied to the vehicle diurnal activity such that all emissions are accounted for during normal daily activity. The types of emission processes are:
Running Exhaust⎯Emissions that come out of the vehicle tailpipe while it is traveling on the road.
•
•
•
•
Idle exhaust⎯emissions that come out of the vehicle tailpipe while it is operating but not traveling any significant distance. This process captures emissions from heavy-duty vehicles that idle for extended periods of time while loading or unloading goods. Idle exhaust is calculated only for heavy-duty trucks.
Starting exhaust⎯tailpipe emissions that occur as a result of starting a vehicle. These emissions are independent of running exhaust emissions and can be thought of as a slug of emissions associated with starting a vehicle. The magnitude of these emissions is dependent on how long the vehicle has been sitting prior to starting. (Starting emissions are only estimated for gasoline fueled vehicles).
Diurnal⎯HC emissions that occur when rising ambient temperatures cause fuel evaporation from vehicles sitting throughout the day. These losses are from leaks in the fuel system, fuel hoses, connectors, and as a result of breakthrough of vapors from the carbon canister. If a vehicle is sitting for a period of time, emissions from the first 35 minutes are counted as hot soak and emissions from the remaining period are counted as
5

diurnal emissions, provided that the ambient temperature is increasing during the remaining period of time.
Resting loss⎯these losses occur while the vehicle is sitting and are caused by fuel permeation through rubber and plastic components. Emissions are counted as resting loss emissions if the vehicle has not been operated for 35 minutes and vehicle is still stationary, but the ambient temperature is either constant or decreasing.
•
•
•
•
•
Hot soak⎯evaporative HC emissions that occur immediately after a trip end due to fuel heating and the fact that the engine remains hot for a short time after being switched off. In older, carbureted vehicles these emissions are attributed to vapor losses from the carburetor float bowl. In newer, fuel-injected vehicles, these vapor losses come from leaky fuel injectors or from fuel hoses.
Running losses⎯evaporative HC emissions that occur when hot fuel vapors escape from the fuel system or overwhelm the carbon canister while the vehicle is operating.
Tire wear⎯particulate matter emissions from tires as a result of wear.
Brake wear⎯particulate matter emissions from brake use.
3.0 OVERVIEW OF BASIC TERMINOLOGY
This section briefly introduces terminology and concepts that most users will need to understand such as vehicle class, fuel type, and vehicle activity. This is important since the output reports provide a breakdown of emissions by vehicle class and fuel type. Vehicle fleet “Vehicle fleet” refers to all the motor vehicles operating on roads in California. This fleet as currently modeled is broken into 13 categories called classes (for example, class 1, passenger cars). These classes are based on the type of vehicle, but they also take weight class and fuel type (i.e. gas, diesel, or electric) into account. The number of vehicles in each class is based on an analysis of Department of Motor Vehicles (DMV) registration data. These vary by calendar year and geographic area, so the make-up of the vehicle fleet is dependent on the calendar year and geographic area.
6

Vehicle class The model performs separate calculations for each of the thirteen classes of vehicles, by fuel usage and each technology group. Each vehicle class contains numerous technology groups, which represent common emissions characteristics such as emission standards, technologies, or in-use emissions. The vehicle classes currently modeled are shown in Table 1, along with abbreviations used in the model.
Table 1 Vehicle Classes Modeled In Emfac2007
Vehicle Class
Fuel Type Code Description Weight Class (lbs)
Abbr.
1 All* PC Passenger Cars All LDA 2 All* T1 Light-Duty Trucks 0-3750 LDT1 3 Gas, Diesel T2 Light-Duty Trucks 3751-5750 LDT2 4 Gas, Diesel T3 Medium-Duty Trucks 5751-8500 MDV 5 Gas, Diesel T4 Light-Heavy-Duty 8501-10000 LHDT1 6 Gas, Diesel T5 Light-Heavy-Duty 10001-14000 LHDT2 7 Gas, Diesel T6 Medium-Heavy-Duty 14001-33000 MHDT 8 Gas, Diesel T7 Heavy-Heavy-Duty 33001-60000 HHDT 9 Gas, Diesel OB Other Buses All OB 10 Diesel UB Urban Buses All UB 11 Gas MC Motorcycles All MCY 12 Gas, Diesel SB School Buses All SBUS 13 Gas, Diesel MH Motor Homes All MH
* gas, diesel, and electric Fuel Emfac2007 currently estimates emissions from gasoline, diesel and electrically powered vehicles. Table 1 shows the fuels modeled by vehicle class. Technology group The underlying assumption in Emfac2007 is that each vehicle class can be modeled by the individual behavior of unique technology groups. Each technology group represents vehicles from the same class but has distinct emission control technologies, have similar in-use deterioration rates, and respond the same to repair. A technology group can represent vehicles whose emissions standards are the same or those that have specific equipment installed on them (e.g., multi-port fuel injection, three-way catalyst, adaptive fuel controls, etc.) which makes them behave the same.
7

Appendices A-1 and A-2 list the technology groups used in modeling exhaust and evaporative emissions, respectively. Some report formats group vehicles into broader technology categories (catalyst, non-catalyst, and diesel). This is a remnant from older EMFAC models, which used to characterize vehicles into these broader technologies, and now is only used for reporting purposes. Gasoline vehicles are placed in the catalyst or non-catalyst categories based on technology group details. Electric vehicles are included in the catalyst category. Model year Emfac2007 contains emission factors and vehicle activity data for model years 1965 through 2040. Within each vehicle class, the model year is represented by a combination of technology groups. For example, a non-catalyst gasoline-fueled technology group (TG-1) and a diesel-fueled technology group (TG-170) represent the 1965 model year for passenger cars. Activity An emission inventory is simply a product of the emission rate (in grams per mile or grams per trip or grams per vehicle) and vehicle activity (miles per vehicle or number of trips or total number of vehicles). This requires estimates of vehicle population, vehicle miles traveled and trips for each vehicle class, by fuel type and geographic area. These terms are commonly referred to as vehicle activity. Population Vehicle population is determined through an analysis of DMV data. These data are used in developing vehicle age matrices for base years 2000 to 2005 for vehicle class, fuel type, geographic area, and vehicle ages 1 to 45 years. These matrices contain actual population estimates, which are used to back-cast from 2000 and forecast from 2005 vehicle populations for calendar years 1970 to 2040. Vehicle miles traveled Vehicle miles traveled (VMT) represents the total distance traveled on a weekday. Local planning agencies have developed regional transportation models, which output regional VMT for certain planning years. In the Emfac2007 model, VMT is calculated based on vehicle population and vehicle accrual. Vehicle accrual is the total number of miles a vehicle accumulates in a year, and varies by vehicle age. The regional estimates of VMT are matched by modifying either or both the vehicle population and accrual estimates. The model also contains hourly distributions of VMT by vehicle class. These distributions are based on instrumented vehicle activity data.
8
Trips The number of trips or starts per day is the same, and the terms can be used interchangeably. Both represent the number of separate trips made per weekday. In EMFAC2007, the estimates for trips per day for vehicle classes 1 to 4 are based on travel surveys and vehicle instrumented data. These data show that trips per day decrease linearly with vehicle age from 6.56 at age 1 to 3.72 at age 45. The trips per day estimate for other vehicle classes are based on either instrumented data or an engineering judgement. The model calculates the total number of trips for a given calendar year, region and vehicle class by summing the product of model year populations and trips per day estimates. 4.0 BASIC DATA FOR A SCENARIO
This section explains the basic input data required for generating an emissions inventory. The basic scenario (input) data required for generating an emissions inventory are geographic area, calendar year, month or season selection, title (if default title is not appropriate), model years included in the calculation, inspection and maintenance (I/M) programs, emission mode and output options. A single scenario contains unique selections for the basic scenario data, for example:
Geographic Area – Los Angeles Method – Simple Average Calendar Year – User input of 2020 Season or Month – July Title – Leave as default Model Years Included – Leave as default IM Programs – Leave as default
This section describes the choices available to the user for geographic area, calendar year, month or season selection, and model years included in the calculation. The choice of emission mode and output options is described in later sections. Geographic area
In a single scenario, the model can estimate emissions for one of these four area types: statewide, air basin, air pollution control district, or county. Depending on the area type selection, the user can then select an area from a list of 15 air basins, 35 air pollution districts, and 58 counties. The model contains activity data for 69 geographic areas. These areas include counties that are in more than one air basin or air pollution district. The Emfac2007 model estimates the emissions for each geographic area more accurately, primarily because it
9

uses area specific activity data such as vehicle population, mileage accrual, temperature, relative humidity, fuel RVP, and I/M programs. Method—“simple average” or “do-each-sub-area” option In Emfac2000, the use of area-specific data increased accuracy of modeled inventories but also resulted in longer execution times. For example, in a statewide run, the model would calculate inventories for each area and then total the individual inventories. In Emfac2000, this process, depending on the computer and calendar year, could take up to 20 hours for a single calendar year. To compensate for this, Emfac2007( as before in Emfac2001/2002), gives the user the option of calculating emissions using either the “Simple-Average” or “Do-Each-Sub-Area” option. The “Simple-Average” option uses area averaging to calculate averaged parameters for temperature, speed, relative humidity, and I/M. The “Simple-Average” option provides faster emission estimates. However, the “Do-Each-Sub-Area” option provides the most accurate emission estimates since it calculates inventories using area-specific parameters. Further, the “Do-Each-Sub-Area” option generates emission factors or inventories for each sub-area for the area selected. For example, if the area type selection is air basin, the air basin selection is Lake Tahoe, and the method is “Do-Each-Sub-Area.” The model will output emission factors or inventories for the portions of El Dorado and Placer Counties that are in the Lake Tahoe air basin. In addition, the model will output the total inventory for the Lake Tahoe air basin.
Note: New users should select area averaging until they are familiar with the model. Sub-area runs provide more accurate results, but they require much longer execution times, and write much larger output files. New users should try the “Do-Each-Sub-Area” option after they become familiar with the output file formats.
Calendar year
The model can estimate emissions for any calendar year between 1970 and 2040. In Emfac2001/2002, user can only specify one calendar year per scenario. But in Emfac2007, user can input many years in a single scenario – in other words, this new model can be called a multi-scenario model. For example, in Emfac2001/2002, a user seeking emission inventories for the Los Angeles County for 2000 to 2005 should create a file in which only basic scenario data are edited, and the file should have six scenarios. These six scenarios correspond to the calendar years 2000, 2001, 2002, 2003, 2004, and 2005. But with the new Emfac2007, a user can input all years from 2000 to 2005 into a SINGLE SCEANRIO. Month or season
The model includes data for temperature, relative humidity, and characteristics for gasoline fuel sold (fuel RVP) that vary by geographic area, calendar year, and month and season. Season is defined as summer, winter, or annual average. The summer season
10

represents an ozone-planning inventory. The summer temperatures and relative humidity have been determined using ambient data for days that have resulted in the worst ozone levels. The fuel RVP is based on an average of the June, July and August months. Similarly, the winter season represents a CO-planning inventory. The winter temperature and relative humidity have been determined using ambient data for days that have resulted in high CO emission levels. The winter RVP is based on average of December, January, and February months. Annual average represents an average of all the monthly inventories. This inventory takes into account appropriate factors introduced by the monthly variation in temperature, relative humidity, and fuel RVP. Model year range and model year specific options
When a user requests an emission inventory or emission factors for a given calendar year (e.g., 2010), Emfac2007 generates emission factors and vehicle activity for vehicles from 45 model years, from the current model year back 44 years. Emfac2007 uses this entire model year range in calculating a complete emission inventory or emission factor for a given calendar year. If the calendar year is 2010, the starting and final model years are 1965 and 2010, respectively. If the scenario year is 2010 (e.g., earlier than 2000), the starting model year is 1965, because Emfac2007’s emission factor data only goes back to the 1965 model year. Emfac2007 assumes that vehicles older than 1965 have the same emission rates as 1965 models. The model year range also gives users the ability to estimate the emission contribution of either a specific model year or a range of model years to the total inventory for a given calendar year.
Hint: For example, say the user is charged with estimating the contribution of older vehicles (1980 and older) to the total inventory in calendar year 2010. This can be achieved by selecting the model years from the input file for CY2010. This is a big departure from the previous Emfac2001/2002 – wherein the user was forced to run two different scenarios – one from 1965 to 1980 and the other from 1981 to 2010.
Inspection and maintenance options
This button gives users the ability to change the I/M options for a given area. However, as with model year options, new users should not change the default I/M options until they have reviewed the advance modeling concepts. The model contains a data file, which describes the different types of I/M programs implemented during various calendar years and in various regions of the State. Emfac2007 uses these data in calculating regional emission inventories.
Hint: As vehicles age, their emissions increase as a result of vehicle defects, mal-maintenance, or tampering. One way to reduce in-use emissions is to have I/M programs that identify and repair defective vehicles. In California, the first I/M
11

program was implemented in 1984. It was revised in 1990, 1996, 1998, and 2001. In the model, these I/M programs are modeled sequentially. As a result, emission deterioration rates from some vehicles may have been modified by I/M effects of up to five different programs.
If the user presses the I/M Options button a secondary screen is displayed, titled “I/M Programs.” This screen displays the available I/M programs specific to the area being modeled, sub-programs for the currently active I/M program, the start date for the currently active I/M program and the type of I/M programs that have been implemented in the area that was selected. 5.0 SYSTEM REQUIREMENTS AND INSTALLATION
System requirements
The program will run on any Intel-based PC running Windows 95 or later, or Windows NT 4.0 or later. The installation will require 5 MB of disk space for the installation program and 50 MB of disk space for the installed files. At least 64 MB of RAM is required. Calculations may run extremely slowly on systems with less than 128 MB of RAM. Typical input files will require less than 1 MB. Depending on output options, the program may generate very large output files. During a run, the model may increase total virtual memory use by nearly 300 MB; the Windows virtual memory settings must allow for this. Your virtual memory setting should be defaulted to “Let Windows manage my virtual memory settings.” For example, to check this setting with Windows 98, click on My Computer, Control Panel, System Properties, and then the Performance Tab. (See figure 1)
12
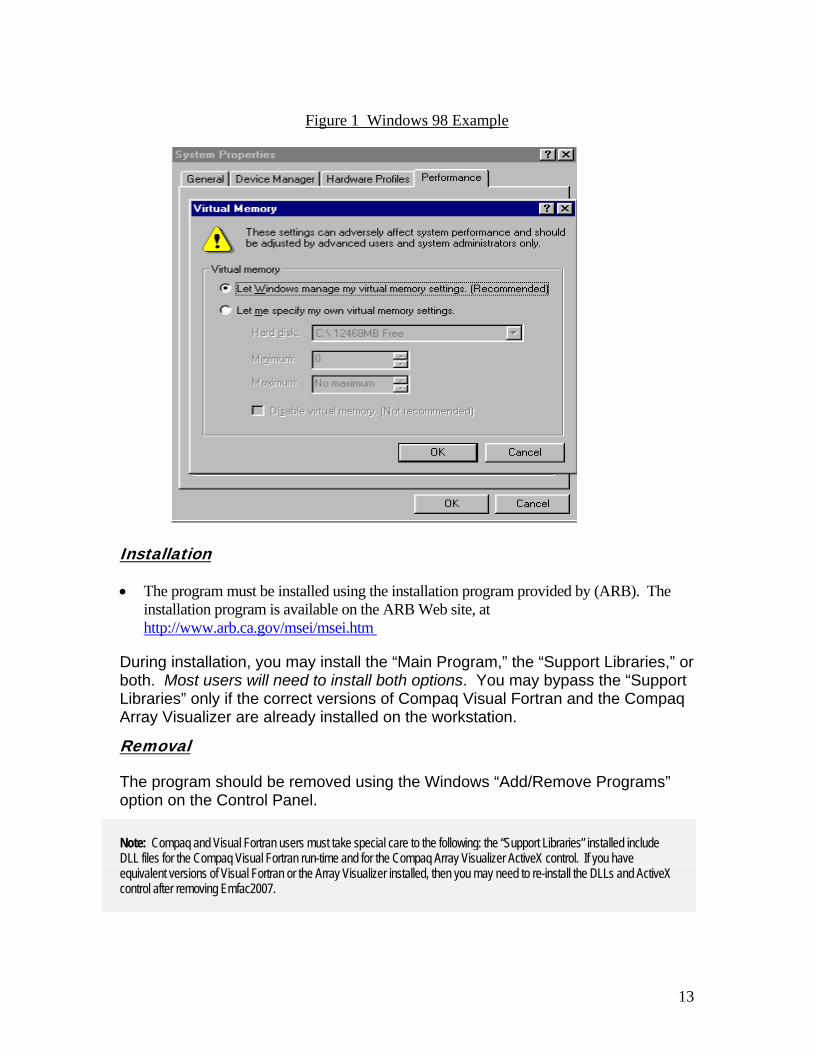
Figure 1 Windows 98 Example
Installation
The program must be installed using the installation program provided by (ARB). The installation program is available on the ARB Web site, at http://www.arb.ca.gov/msei/msei.htm
•
During installation, you may install the “Main Program,” the “Support Libraries,” or both. Most users will need to install both options. You may bypass the “Support Libraries” only if the correct versions of Compaq Visual Fortran and the Compaq Array Visualizer are already installed on the workstation.
Removal
The program should be removed using the Windows “Add/Remove Programs” option on the Control Panel.
Note: Compaq and Visual Fortran users must take special care to the following: the “Support Libraries” installed include DLL files for the Compaq Visual Fortran run-time and for the Compaq Array Visualizer ActiveX control. If you have equivalent versions of Visual Fortran or the Array Visualizer installed, then you may need to re-install the DLLs and ActiveX control after removing Emfac2007.
13

6.0 RUNNING EMFAC2007
Starting the program
To begin, start the program by selecting the “Emfac2007” item on the Start/Programs menu, or by double-clicking the “Emfac2007” icon on the desktop. When the program starts, it opens up two windows, titled “Emfac2007” and “Emfac2007 Console.” The window labeled “Emfac2007 Console” accommodates older code in the model. This window will rarely contain any output. It should be minimized using the standard Windows minimize button. Depending on your computer, this window may automatically minimize on startup and require no action by the user. Figure 2 shows the first window.
Figure 2 Opening Dialog Window
The main menu bar offers three main selections: File, Run, and Help. This interface will be new to current users who are familiar with earlier versions of the Emfac application.
File menu The new/open/save file menu items manipulate scenario files, such as any input files.
14

New: Clears some scenario default values and starts the input dialogs with no scenarios defined. Open: Opens a file-open dialog. If the user selects a file, it is read in and the input dialogs are started. Open filename: When enabled, this menu item re-opens the last file edited and start the input dialogs. Save: Saves any pending changes to a file open for editing. Scenario file names must be valid Windows file names, using Windows 95 “long file name” syntax. Spaces are allowed; certain punctuation characters are not. Windows limits the length of the complete file name with path to about 255 characters. Save as: Prompts for an alternate file name and saves the current data to the new name. Exit: Exits the program. Prompts for confirmation if any edited data have not been saved. (The standard Windows “X” close button behaves the same way.) Run Menu Run: This menu item, when enabled, runs the file name displayed. (This will be the last file opened.) This item is disabled if there are unsaved editing changes, or if no file has been opened. Run file: This menu item, when enabled, brings up a file dialog. If a file name is selected, the program reads the file and begins calculations. Stop Run on Next Progress Report: This menu item is enabled while a run is executing. If it is selected, a flag is set, and the calculations quit the next time the flag is checked. Depending on when the Stop item is selected, it could be several seconds before the flag is examined and execution stops. The stop action closes all output files immediately. This means that all of the output files may be incomplete, even output data from scenarios that completed.
Warning: Users can’t resume once Stop is initiated.
Help Menu About Emfac2007: Starts the About window, which displays version information.
15
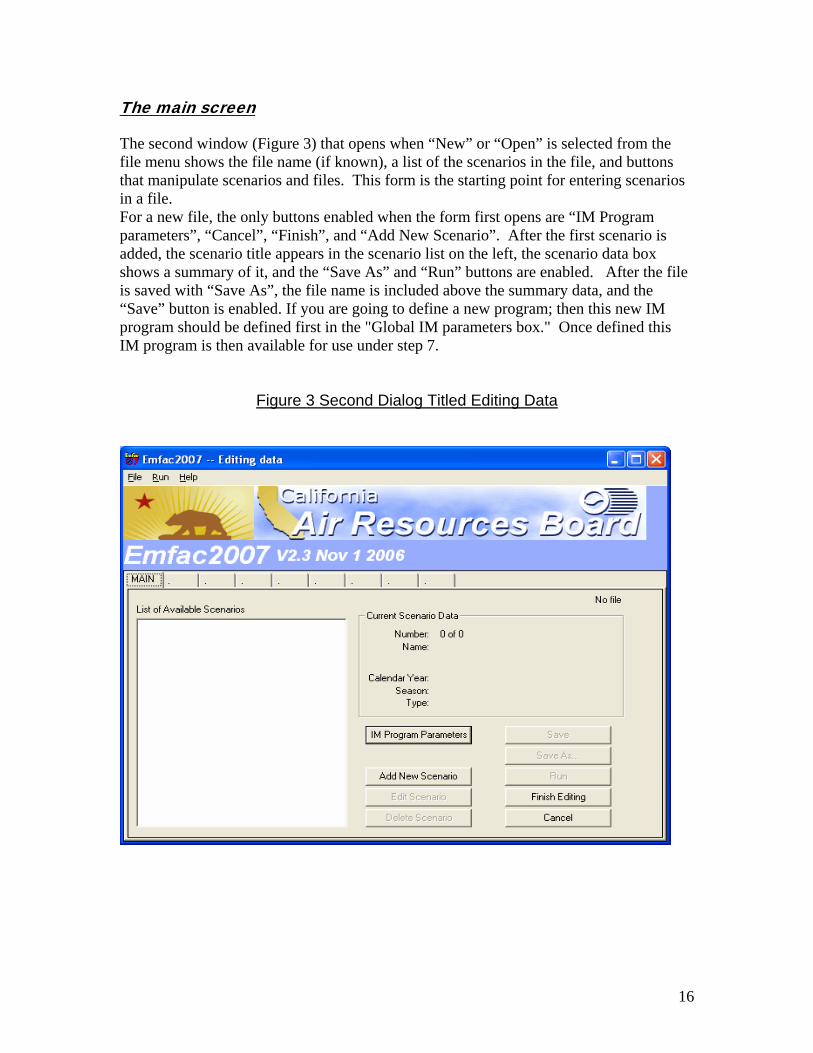
The main screen
The second window (Figure 3) that opens when “New” or “Open” is selected from the file menu shows the file name (if known), a list of the scenarios in the file, and buttons that manipulate scenarios and files. This form is the starting point for entering scenarios in a file. For a new file, the only buttons enabled when the form first opens are “IM Program parameters”, “Cancel”, “Finish”, and “Add New Scenario”. After the first scenario is added, the scenario title appears in the scenario list on the left, the scenario data box shows a summary of it, and the “Save As” and “Run” buttons are enabled. After the file is saved with “Save As”, the file name is included above the summary data, and the “Save” button is enabled. If you are going to define a new program; then this new IM program should be defined first in the "Global IM parameters box." Once defined this IM program is then available for use under step 7.
Figure 3 Second Dialog Titled Editing Data
16

Adding or editing scenarios
When “New” is selected, the only actions enabled on the form are “Finish”, “Cancel”, “IM Program parameters” and “Add New Scenario”. The scenario list on the left is empty (Fig.3). In this case, “Add New Scenario” brings up the Scenario 1 tab; users see input dialogs with some data set to program default values and some data flagged as “missing” set to invalid values. Figure 4 shows the next window that opens after “Add New Scenario” is depressed. In this Screen, the user is asked to select Geographic area, Calendar year and Season or month.
Figure 4 Scenario 1 Dialog
17

When the Geographic area button is selected, a secondary set of buttons called ‘Calculation Method’ pop-up (Fig. 5) which shows two options – By Sub-area or Use Average. ‘Use Average’ uses a set of Average temperature, Humidity etc in order to calculate a rough estimate of the emissions. If ‘By sub-area’ is selected, the model will use site-specific data – like Temperature, Humidity, speed etc and the calculations are more accurate than the ‘use average’ choice.
Figure 5 Geographic Area Options
18
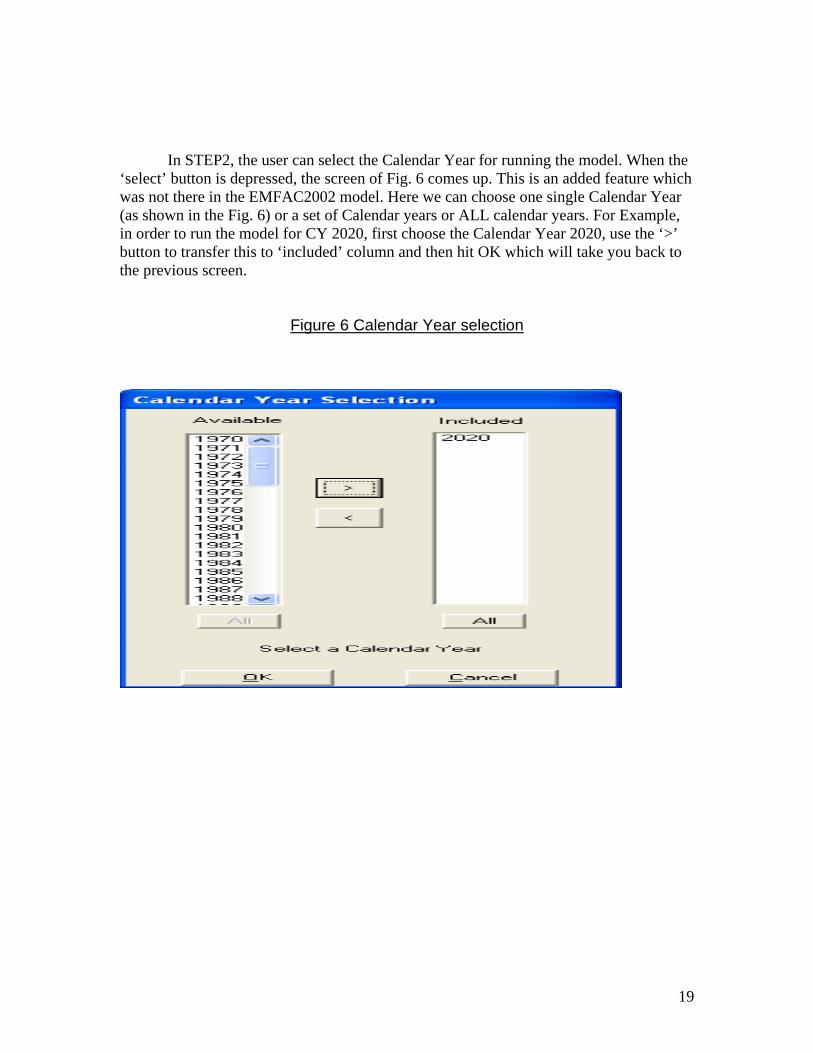
In STEP2, the user can select the Calendar Year for running the model. When the ‘select’ button is depressed, the screen of Fig. 6 comes up. This is an added feature which was not there in the EMFAC2002 model. Here we can choose one single Calendar Year (as shown in the Fig. 6) or a set of Calendar years or ALL calendar years. For Example, in order to run the model for CY 2020, first choose the Calendar Year 2020, use the ‘>’ button to transfer this to ‘included’ column and then hit OK which will take you back to the previous screen.
Figure 6 Calendar Year selection
19

STEP 3 (Fig 7.) is for the selection of the ‘season or month’ to run the model. Here one can choose to run the model for any month from January to December, as well as for seasons – summer, winter and Annual Average.
Figure 7 SEASON or MONTH Selection
20

If we click ‘Next’ in Fig 7, we get the next screen which shows the default scenario name generated (FIG.8) from data selected in Fig 7. Users can change this default title to something more relevant to their analysis. There are three steps in this screen – Model Years (Step 5), Vehicle classes (Step 6) and I/M program (Step 7) schedule. If the user hits the button ‘next’, the model is assuming that the user is accepting the default conditions for Model Years (i.e. ALL), Vehicle classes (i.e. ALL) and I/M default for the region selected before.
Figure 8 Scenario Details
21
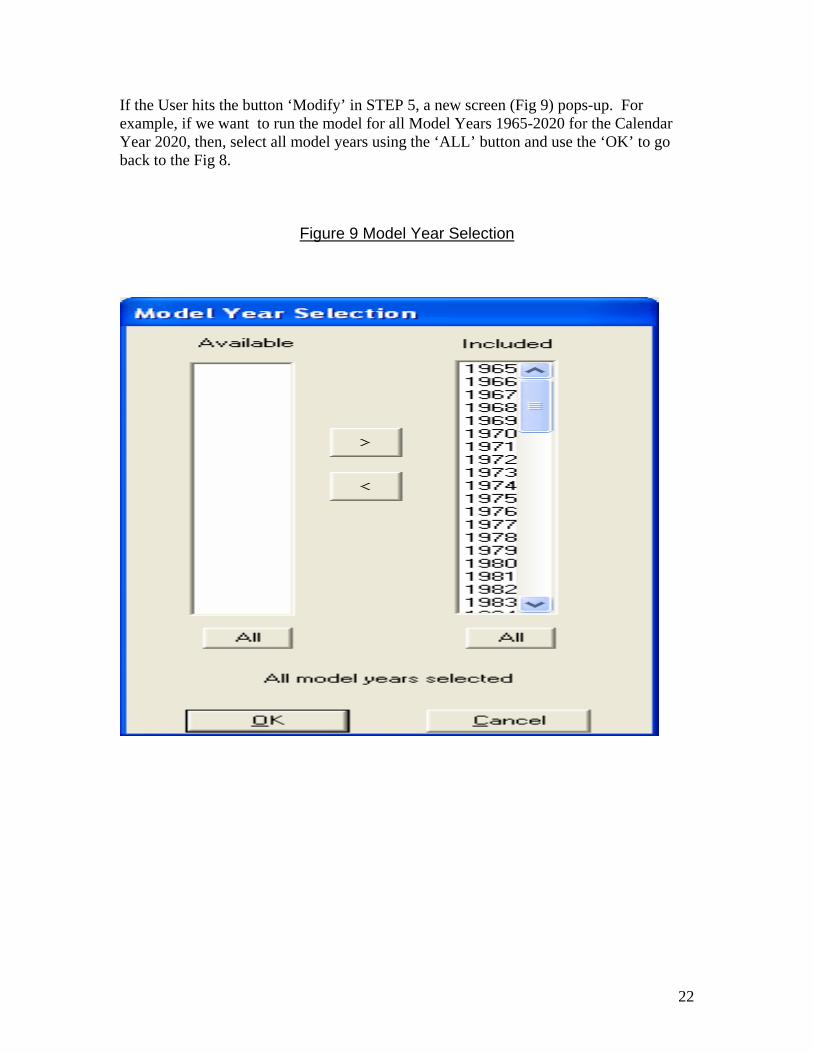
If the User hits the button ‘Modify’ in STEP 5, a new screen (Fig 9) pops-up. For example, if we want to run the model for all Model Years 1965-2020 for the Calendar Year 2020, then, select all model years using the ‘ALL’ button and use the ‘OK’ to go back to the Fig 8.
Figure 9 Model Year Selection
22

Suppose we want to run the model for CY 2020 and MYs 2000-2005, then use ‘<’ to transfer all the MYs to ‘available column’. Then, select the MYs 2000-2005 on the ‘available’ column and use the ‘>’ to transfer the model years to the ‘included’ column. The result will be as shown in Fig. 10. Then click OK.
Figure 10 Selecting a set of Model Years (2000-2005)
23

Going back to Fig 8, our next step is STEP 6 – vehicle class selection. The default case is the model will run for all vehicle classes – PCs to Motor Homes. If we click on ‘Modify’ under ‘vehicle classes’ in Fig. 8, we will get the screen as shown in Fig 11. Here we have the option of selecting one or more vehicle types for which the model need to be run. If we click OK, it will take us back to Fig.8.
Figure 11 Vehicle CLASS selection
24

In STEP 7 of Fig. 8,The button labeled ‘I/M Program Schedules’ displays two options for I/M - the default I/M options for the geographic area selected and also possibility of changing the I/M to run the model. These will be discussed in more detail at a later time. However, new users should not change the default IM options. If the button ‘done’ is depressed, it will take us back to fig. 8.
Figure 12 I/M Selection
25

7.0 INTRODUCTION TO THE THREE MODELING MODES
The Emfac2007 model supports calculation of emissions/emission factors for the Burden, Emfac and Calimfac modes. These mode selections are made in the “Mode and Output” form shown below. Figure 13 shows the mode and output selections when the next button is depressed.
Figure 13 Mode and Output Selections
Key distinctions between model modes: Burden: Total emissions in tons/day. Emfac: Emission factors in grams/activity, for input to DTIM and URBEMIS. Calimfac: Basic emission rates.
Each mode selection triggers a corresponding list of output options. In the example above the user has selected Burden mode to output emissions in tons per day. In this mode the user choose to output emission inventories in up to four file formats.
26
The next three sub-sections describe the Burden, Emfac and Calimfac mode selections and provide example outputs from each of the mode/output selections. Burden mode
The Burden mode is used for calculating regional (area-specific) emission inventories. In this mode, the model reports total emissions as tons per weekday for each pollutant, by vehicle class and the total vehicle fleet. The burden mode uses emission factors that have been corrected for ambient conditions and speeds combined with vehicle activity to calculate emissions in tons per day. Vehicle activity includes the number of vehicles, how many miles are driven per day and the number of daily trips. In the burden mode, the user may select either an hourly or daily total output. The hourly output does not add substantially to calculation time, but it increases total output by a factor of 25. Burden output
The burden output formats are: 1. Planning Inventory - This generates an output file with a “bur” extension. This file has
the same format as the “bur” file generated by the MVEI7G and Emfac2000 models. To support formatting and printing on 8.5 x 11 page this older format combined vehicle categories into groups rather than report emissions for each vehicle class. For example, the heavy-duty vehicle group consists of light-heavy, medium-heavy and heavy-heavy duty vehicles.
2. Heavy-Duty Detail - This also generates an output file with a “bur” extension. This
output format was created in MVEI7G to provide users with more detailed inventories for trucks. However, in order to support formatting and printing on a legal size paper this format omitted emissions from passenger cars. Note if the user requests both (1) and (2) then a single “bur” file is created containing both outputs.
3. Detailed Planning Inventory (CSV) - This is a comma-separated file (with a “csv”
extension) which can be read by any spreadsheet program. It contains emission inventories for all 13-vehicle classes by fuel type. It is recommended that new users select this as an output option to get an idea of the entire inventory.
4. MVEI7G (CSV) File - This is also a comma-separated file but it has a “bcd”
extension. This file is in the same format as that produced by the MVEI7G model. This file has the same information as (3.) but in columnar format, which makes it suitable for sorting using spreadsheets.
Table 2 provides a summary of the Burden mode output extensions.
27

Table 2 Burden Report Extensions
Option on Input Form (Report Type) Filename Extension Used
Planning Inventory BUR Heavy-Duty Detail (Planning Inventory Detail) BUR
Detailed Planning Inventory (CSV) (Spreadsheet) CSV
MVEI7G CSV File (Planning Inventory Database) BCD
Burden output reports
This section provides some sample outputs from the Burden mode.
BUR extension If both “Planning Inventory” and “Heavy-Duty Detail” are selected then the “Planning Inventory” report always written first. Both reports duplicate older report formats generated by the MVEI7G and Emfac2000 models. The older reports were also written to a BUR file extension. Planning Inventory Report Format: This report format includes results for the entire fleet. To support formatting and printing on letter size (8.5 x 11) paper, this format combines vehicle classes into categories rather than report emissions for each class. For example, the medium-duty truck category combines medium-duty trucks (MDV) and two light-heavy-duty truck (LHDT1 and LHDT2) classes. Heavy Duty Detail Report Format: This report format provides users with more detailed inventories for trucks. However, in order to support formatting and printing on legal size (8.5 x 14) paper this format omits emissions from passenger cars. Viewing the File: The file can be opened in most text editors and word processors. The file will often be too large for Windows Notepad, but WordPad or Word can be used instead. Using WordPad is a quick way to view the file, but it will be difficult to print or to zoom out to see the entire file at once.
Hint: In Word , select the Courier New font (or another fixed-width font), a Regular font style, and 6-point size. You may need to type size “6” if it is not in the list. Change the page orientation to “Landscape” and adjust the page width until lines don’t wrap in the report. Note, use a 5-point size if the file includes any heavy-duty detail reports.
Figure 14 shows a screen grab of the planning inventory format (*.BUR) where the season selection was annual average.
28

Figure14. Format of the Annual Average Inventory with *.BUR Extension
Each report has an eight-line header followed by the report body. In figure 14, note that the header echoes all of the basic scenario data: geographic area, season, calendar year, model year range, and title. The header also echoes a long program version string, and a timestamp for when the scenario was read in. Data Rows: The report body contains rows of data in the following order: summary vehicle activity data, followed by pollutant and process emission rates, followed by fuel consumption estimates. Each type of emission rate is given in subtotals by the emissions process (running exhaust, hot soak, tire wear, etc.) and then totaled. Figure 14 shows the first few data rows that are visible. They include the summary vehicle activity data for vehicle population, VMT, and trips. The remaining rows show the tons per day ROG emissions from each exhaust and evaporative emissions process. Data Columns: In the report body, the columns of data are organized by vehicle categories. Within most categories, results are listed for the three Burden technology classifications, followed by a subtotal for the category (NCAT, CAT, DSL, and Total). Some vehicle categories only include total. The columns of data in the standard report show results for six general vehicle categories and a fleet total. The six categories include two “specific” categories
29

(cars and motorcycles), and four aggregated categories (light, medium, and heavy-duty trucks, and buses). The columns of data in the heavy-duty detail report show results for the light, medium, and heavy-duty trucks, and buses. The heavy-duty truck classes are not aggregated.
CSV extension This report is written to a file with a CSV extension. This file is very similar to the Planning Inventory Report in the BUR file, but with much more. It is a text file in comma-separated-value (CSV) format. It may contain multiple reports if the run included sub-areas and/or multiple scenarios. The report includes all of the data in the BUR report, but none of the vehicle classes are aggregated, and all vehicle/technology combinations are included. Viewing the File: The file should be simple to open in spreadsheet programs such as Excel, and also in database programs such as Access or Sybase. Figure 15 shows a portion of the Burden text file report as viewed in a spreadsheet.
30

Figure 15 Format of the Text File with *.CSV Extension
This report also has an eight-line header followed by the report body. This header is essentially identical to the one in the BUR file. All of the observations about the BUR header also apply to this report’s header. Data Rows: The report body contains rows of data in the following order: summary vehicle activity data, followed by pollutant and process emission rates, followed by fuel consumption estimates. Each type of emission rate is given in subtotals by the emissions process (running exhaust, hot soak, tire wear, etc.) and then totaled. Figure 15 shows the first few data rows that are visible. They include the summary vehicle activity data for vehicle population, VMT, and trips. The remaining rows show the tons per day ROG emissions from each exhaust and evaporative emissions process. The remaining rows show the CO emissions from exhaust emission processes.
31

Data Columns: In the report body, the columns of data are grouped by thirteen vehicle classes. Within each class, results are listed for the three Burden technology classifications, followed by a subtotal for the vehicle class (NCAT, CAT, DSL, and Total). Since not all vehicle classes use every technology (there are no diesel motorcycles), some output columns are only placeholders.
BCD extension This report is written to a file with a BCD extension. Although it uses a BCD extension, this is a text file in comma-separated-value (CSV) format. It duplicates the BCD reports produced by the MVEI7G model. This file contains the same data as the Planning Inventory spreadsheet “Text File (CSV)” report, but in record format rather than tabular format, which makes it suitable for database selections and spreadsheet sorting. Viewing the File: The file should be simple to open in database programs such as Access or Sybase, and also in spreadsheet programs such as Excel. Since the file does not have a CSV extension, you may need to specify the format as “delimited” with a comma for the delimiter. Figure 16 shows a portion of the Burden report, as viewed in a spreadsheet, with a BCD extension.
Figure 16 Format of the MVEI7G CSV file with *.BCD
32

There is one header row that contains names for the 14 fields. Data Rows: Each row (record) in the file contains a single emission rate for a combination of one pollutant and one process or process total. The record includes several types of fields:
Five “header” fields that echo scenario data (calendar year, model year range, and geographic area);
•
•
•
•
•
•
•
•
•
Three fields that echo activity summary data (starts, population, and VMT);
Five index fields (vehicle class, technology category, pollutant, process, and time basis); and
One value field (emissions) with emission rate.
There are a few items to note about the records: The combination of the five index fields uniquely identifies each record. (If there is no hourly output, the time basis field is not needed as an index.)
There is a record for every combination of indexes, including those with no population and those that are never calculated. This yields 4095 data records (13 vehicle classes, 3 technology categories, 7 pollutants, and 15 processes and process totals).
Unlike the other Burden reports, there are no totals across technology categories, no subtotaled vehicle categories, and no fleet grand totals across all vehicle classes. The user is expected to construct these values with database queries or spreadsheet calculations.
The header fields are duplicated on every record.
The activity data is unique by vehicle class and technology category, so it is duplicated for pollutant and process combinations.
33

Weighted Model Year Activity Output
This output gives the Activity components like POP, VMT, Trips, Accrual rate and ODOMETER by Model year.
Figure 17 WEIGHT output
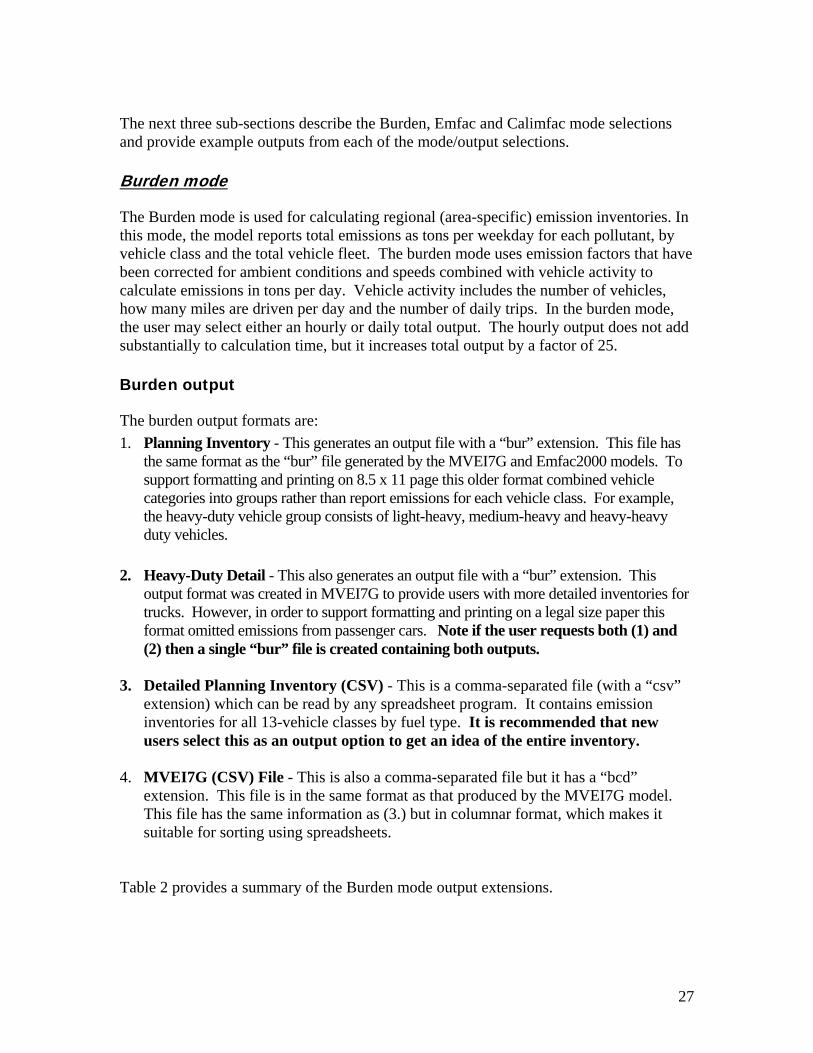
CEIDARS/CEFS Transaction Format CEIDARS and CEFS are two different databases maintained by the Emissions Inventory Systems Section (EISS) at the Air Resources Board. These databases store on-road, off-road, stationary, and area source emission inventories. The on-road inventories contain PM, SOx, NOx, TOG and CO emissions, for summer, winter, and annual season selections for each area/sub-area in the state. Historically, the on-road emissions from EMFAC have been imported into CEIDARS and CEFS databases by processing three individual Burden BCD output files (one each for summer, winter and annual) through other programs. The purpose of this output is to create a new output file (in CTF format) that will communicate effectively with CEIDARS or CEFS databases. The EISS will be responsible for converting the single CTF formatted file into either CEIDARS or CEFS databases (FIG 18). More information is provided in the Appendix 3.
34
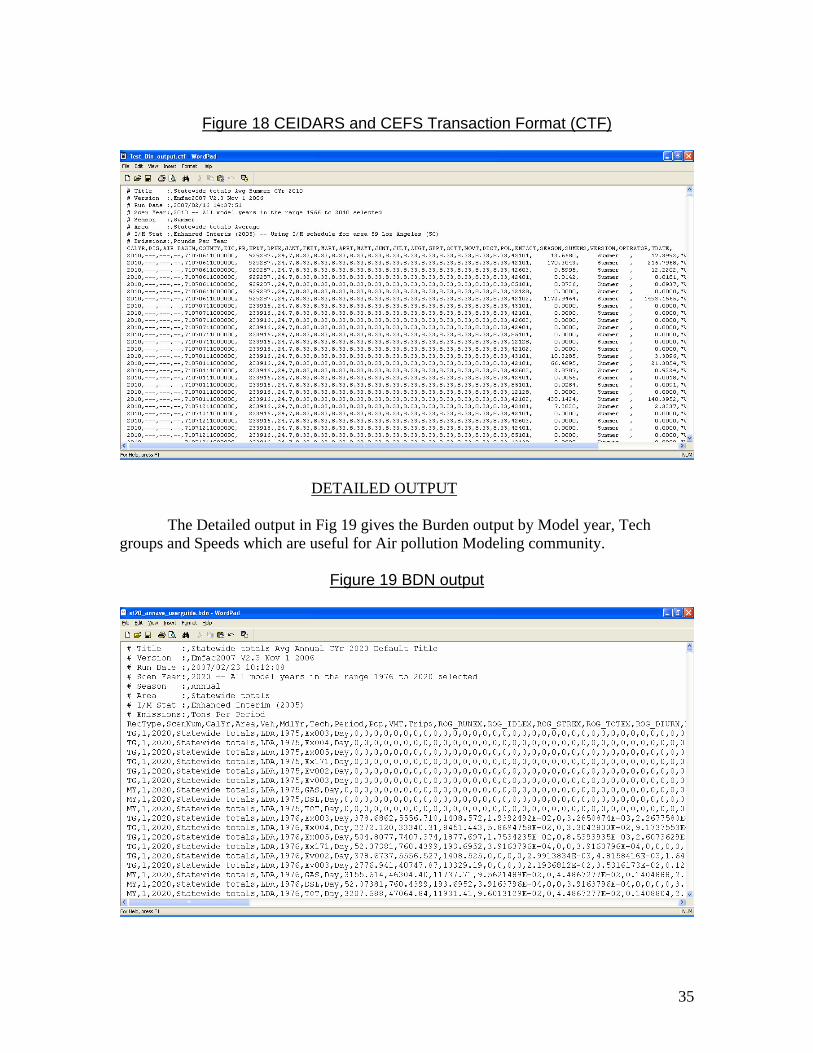
Figure 18 CEIDARS and CEFS Transaction Format (CTF)
DETAILED OUTPUT The Detailed output in Fig 19 gives the Burden output by Model year, Tech groups and Speeds which are useful for Air pollution Modeling community.
Figure 19 BDN output
35

Emfac mode
The Emfac mode generates emission factors in terms of grams of pollutant emitted per vehicle activity. Vehicle activity can be in terms of grams per mile or grams per hour, or grams per start, and depends on the emissions process. The emission factors depend on basic scenario data options for geographic area, calendar year and month or season. In the Emfac mode the model calculates a matrix of emission factors at specific values of temperature (-20oF to 120oF), relative humidity (0% to 100%), and vehicle speed (idle and 1 mph to 65 mph) for each vehicle class/technology combination. In the Emfac mode, an additional input form allows users to customize their output and select specific temperature, relative humidity and speed values. One important use for the Emfac mode is to generate files for use with the DTIM model. The output files are also used in other air quality models such as AIRSHED, CALINE and URBEMIS. Figure 20 shows the output options available in the Emfac mode.
Figure 20 EMFAC Mode Output Selections
36

Emfac output
The Emfac mode output files are: 1. Binary Impacts (BIN). This is a binary file with a “bin” extension. This format was created to
provide outputs compatible with other computer platforms, and now is almost redundant given the other output format.
2. ASCII Impacts (ERP). This is an ascii text file with a “erp” extension. This file is used in gridded
inventory models such as DTIM. 3. Rate Summary (RTS) . This file (also known as “reports format”) has an “rts” extension. This is a
summary file in that vehicle classes are grouped for reporting purposes. This output format is similar to that generated by the MVEI7G model.
4. Impact Rate Detail (RTL). This file as the name implies generates detailed information for each
vehicle class and technology group combination. This file has an “rtl” extension but is in a CSV format. Hence, any spreadsheet program can read this file. It is recommended that new users output this file to get a feel for the type of information generated in Emfac mode.
In Emfac mode, the model calculates a matrix of corrected emission factors. The emission factor units are suitable for input to other models such as DTIM, AIRSHED, CALINE and URBEMIS. The primary Emfac reports are formatted for this purpose. Table 3 provides a summary of the Emfac mode output extensions.
Table 3 File Output Extensions
Option on Input Form Filename Extension Used
Binary Impacts BIN ASCII Impacts ERP Rate Summary RTS Impact Rate Detail RTL
The Emfac mode calculates a matrix of emission factors at specific values of temperature, relative humidity, and vehicle speed. For each of these, the user can provide from 1 to 24 values. The default Emfac scenario data includes 24 temperatures, 11 humidity values, and 13 speeds, for 3432 total Temperature/Relative Humidity/speed
37
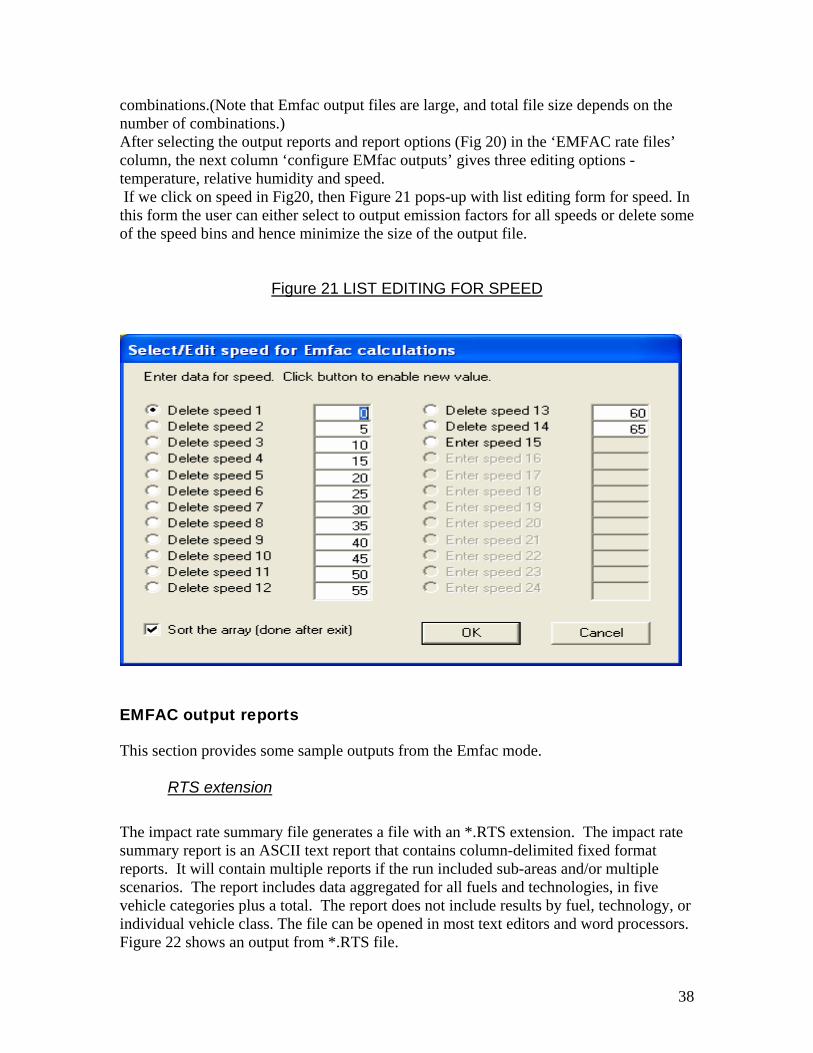
combinations.(Note that Emfac output files are large, and total file size depends on the number of combinations.) After selecting the output reports and report options (Fig 20) in the ‘EMFAC rate files’ column, the next column ‘configure EMfac outputs’ gives three editing options - temperature, relative humidity and speed. If we click on speed in Fig20, then Figure 21 pops-up with list editing form for speed. In this form the user can either select to output emission factors for all speeds or delete some of the speed bins and hence minimize the size of the output file.
Figure 21 LIST EDITING FOR SPEED
EMFAC output reports
This section provides some sample outputs from the Emfac mode.
RTS extension The impact rate summary file generates a file with an *.RTS extension. The impact rate summary report is an ASCII text report that contains column-delimited fixed format reports. It will contain multiple reports if the run included sub-areas and/or multiple scenarios. The report includes data aggregated for all fuels and technologies, in five vehicle categories plus a total. The report does not include results by fuel, technology, or individual vehicle class. The file can be opened in most text editors and word processors. Figure 22 shows an output from *.RTS file.
38

Figure 22 Example of Impact Rate Summary Format (RTS)
Each report consists of a series of report tables, with each table containing data for a different emissions process. The titles for each table are: Table 1: Running Exhaust Emissions (grams/mile; grams/hr for idle) Table 2: Starting Emissions (grams/trip) Table 4: Hot Soak Emissions (grams/trip) Table 5a: Partial Day Diurnal Loss Emissions (grams/hour) Table 5b: Multi-Day Diurnal Loss Emissions (grams/hour) Table 6a: Partial Day Resting Loss Emissions (grams/hour) Table 6b: Multi-Day Resting Loss Emissions (grams/hour) Table 7: Estimated Travel Fractions Table 8: Evaporative Running Loss Table 1 is repeated for each combination of temperature and relative humidity. Tables 2, 4, and 8 are repeated for each temperature. Tables 5a through 7 are only included once. The lines of results in each table vary by the number of speeds and temperatures. Header and Data Rows: Each table in the report has a 13-line header, followed by the table title, followed by a series of sub-tables. Each sub-table has a one-line identifier followed by columns headings and data.
39

Data Columns: In each table body, the columns of data are grouped by five aggregated vehicle categories plus a total for all vehicles. This format is similar to that available in MVEI7G model.
RTL extension The Impact Rate Detail file has an *.RTL extension. This file provides more detailed information than the RTS file. It is a text report in comma-separated-value (CSV) format. It will contain multiple reports if the run included sub-areas and/or multiple scenarios. The size of each report is variable, depending on the number of combinations of temperature, relative humidity, and speed in the Emfac matrix. The file should be simple to open in spreadsheet programs such as Excel. The report includes all of the data in the Impact Rate Summary report, but results are included for each of the 13 vehicle classes and for the three Burden technology categories (CAT, NCAT, and DSL). The column layout is very similar to the Burden CSV report. Figure 23 shows an output from the RTL file. This file is typically used as an input file to URBEMIS and CALINE Models.
40

Figure 23 Example of Impact Rate Detail Format (RTL)
This report includes exactly the same series of tables and sub-tables as the Impact Rate Summary report. In each table body, there are 56 columns of data, for 13 vehicle classes plus a fleet total, and 3 technology categories pus a total.
ERP extension The ASCII Impacts report file has an *.ERP file extension. This report format is used as an input to the (Direct Travel Impact Model) DTIM. This is an inventory model that requires emission estimates (primarily) in grams per hour. These estimates are then multiplied by time spent on each freeway link to generate emission estimates in each grid. Figure 24 shows a sample output from the impact rate file. The ASCII Impacts ERP file is an ASCII column-delimited fixed format report, with records using a format specific to the DTIM model. For most purposes, this report can only be used by programs written for the DTIM record format.
41

Figure 24 Example of the ASCII Impact Rate File (ERP)
BIN extension The Binary Impacts file has the same information as the ASCII impacts file except that it is in binary file. The file has a *.BIN extension. This file cannot be viewed/read as ASCII text. It was originally used for supporting earlier versions of DTIM. It’s use is now limited.
42

Calimfac mode
The Calimfac mode is used to calculate very detailed emission rates (basic emission rates or BER) for each vehicle class and model years from 1965 to the scenario calendar year. As a vehicle ages its emissions increase with vehicle mileage. In the Calimfac mode a linear fit is made to the emissions increase with vehicle mileage. This linear fit results in a zero mile rate (emissions when the vehicle is new) and deterioration rate (emissions increase every 10,000 miles) with a flex point where the deterioration rate changes for higher odometer values. These BER are based on standardized driving tests (FTP and UC) and the user can select outputs based on either bag 1, bag 2, bag 3 of the FTP or bag 1, bag 2 of the UC driving cycle. In addition, the user can elect to have the emission factors calculated with or without correction factors, which account for factors not encountered during standardized tests. The types of data that the Calimfac mode can report include:
Emission rates •
•
•
•
•
•
•
•
•
•
I/M credit factors (difference in emission factors with and without I/M)
I/M program description
Constants for calculating emission rates; and
Regime fractions (fraction of fleet vehicles in each emission regime).
These types of data are available for a number of combinations of options, such as:
With and without I/M programs
Using basic emission rates based on FTP composite data or based on either (1) bag 1, bag 2, or bag 3 of the FTP or (2) bag 1 or bag 2 of the UC driving cycle
With and without correction factors. With correction factors implies that the basic emission rates are corrected for ambient and driving conditions not encountered during standardized testing.
The data can be reported at different levels of aggregation:
By calendar year with model year and technology group aggregated
By calendar year and model year with technology group and fuel aggregated
43

Regime fractions are reported in disaggregated form only, by calendar year, model year, and technology group. In the Calimfac mode, emission factors are calculated using the same data and methodology as in Burden or Emfac mode. When “constants for calculating emission factors” (zero-mile and deterioration constants) are reported these are based on linear regressions on the modeled results. Figure 25 shows the Calimfac mode and output options.
Figure 25 Calimfac Mode and Output Options
The user can select to output emission rates by bag (FTP or UC) or select FTP composite rates. Further, the user can select corrected or uncorrected rates. Corrected implies that the emission rates have been adjusted with respect to temperature, relative humidity, air conditioning, speed and other factors not encountered during standardized FTP testing.
44

Calimfac output
The Calimfac mode output files are: • Emission Factors (OUT) – without IM & with IM & IM credits & Technology
group detail. When any of these options, an output file with “out” extension is created. Depending on the options selected the output file can contain emission factors for vehicles that do not undergo the biennial inspection and maintenance program, emission factors of vehicles that undergo a biennial IM program, calendar year specific benefits for the IM program, and detailed emission factors for each technology group. The emission factors are in a form of a zero mile emission rate and a deterioration rate, which shows the decay in emissions every 10,000 miles.
• Emission Factors (CYW) – This selection will also generate an output file with a “cyw” extension. This file contains calendar year specific emission rates for each emissions process and vehicle class. These rates are given for both with and without IM cases.
Model Year Emission Rate (MY) – This selection can generate two files with the extensions “my1” and “my2.” The “my1” file contains emissions rates assuming no IM program, whereas the “my2” file contains emissions rates assuming that vehicles have undergone an IM program. Both files have the same format. These files have vehicle class and model year specific emission rates for beginning with when the vehicles are first sold up to their age for the scenario year. For example, if the scenario year is 1970 then the model will output 1965 model year emissions for ages 1 through 7.
• Regime Growth Rates – This selection generates six files with extensions “rg1 rg2 rg3
rg4 rg5 rg6.” These are regime growth rate files. Table 4 shows what these files mean.
Table 4 Regime Growth Rate files Regime Growth Rates RG1 HC regime growth rates with no IM RG2 CO regime growth rates with no IM RG3 NOx regime growth rates with no IM RG4 HC regime growth rates with IM RG5 CO regime growth rates with IM RG6 NOx regime growth rates with IM
These files contain the size of normal, moderate, high, very high and super emitting vehicles as a function of vehicle class, model year, technology group, and vehicle age.
45

Table 5 shows the Calimfac mode output file extensions.
Table 5 Calimfac File Output Extensions
Option on Input Form Filename Extension Used
Emission Factors without I/M Emission Factors with I/M I/M Credits Technology Group Detail
OUT & CYW
Regime Growth Rates RG1, RG2, RG3, RG4, RG5, RG6
Model Year Em. Rates MY1 & MY2 Calimfac output reports
This section provides some sample outputs from the Calimfac mode.
OUT extension When any one of the following output options is selected, an output file with extension “OUT” is created: Emission Factors without IM; Emission Factors with IM; or Technology Group Detail.
The *.OUT file contains reports with emission factors, by vehicle class and pollutant/process. The reports include data for:
ZML, DET1, FLEX PT, DET2 – Constants for evaluating emission factors with deterioration based on odometer mileage.
•
• 0K, 50K, 100K – Emission factors evaluated at odometer mileage of 0, 50,000, and 100,000 miles.
The first two options (Emission Factors without I/M and Emission Factors with I/M) generate reports with emission factors by vehicle class, pollutant/process, and model year for the scenario calendar year. The Technology Group Detail option generates a report of emission factors without I/M effects, by vehicle class, pollutant/process, model year, and technology group for the scenario calendar year. The Emission Factors with I/M option also generates a report that lists the I/M programs defined. Note, this is the only report that lists I/M program details.
46

The file will contain multiple reports. There are four reports types possible in the OUT file, using three different formats. These reports are all column-delimited fixed format ASCII reports: The two model-year reports (without tech groups) are tables with eight columns. The tech group detail reports are tables with nine columns. The I/M program listings are tables with two columns.
Figure 26 shows a sample output from the *.OUT file. This file contains zero mile emissions and a deterioration rate with odometer.
Figure 26 Model Year Specific Emission Rates from the *.OUT file
CYW extension Figure 27 shows an example of calendar year specific output contained in the *.CYW file. This file contains calendar year specific emission rates. These rates when multiplied by the appropriate activity should get the tons per day estimates by calendar year. Each report consists of a series of report tables. The tables for factors without I/M, with I/M, and I/M credit all have the same format. The tables are ordered by vehicle class. To keep track of which report you are dealing with, note the report type in the table title, and the vehicle class in the first column of data. In the example above, the table title is “CALENDAR YEAR EMISSION FACTORS I/M,” and the vehicle class is 1 (LDA or personal cars). All of the tables for a vehicle class are written together. Within a vehicle class, the tables are written in this order: factors without I/M, factors with I/M, then I/M credit factors.
47

Figure 27 Example of the CYW Output File
RG1 to RG6 extensions Selecting the “Regime Growth Rates” option generates six file outputs with the file extensions RG1, RG2, RG3, RG4, RG5, and RG6. These files contain the size of normal, moderate, high, very high and super emitting regimes as a function of vehicle class, model year, technology group, and vehicle age. Figure 28 shows an example of the regime growth rate file (Refer to table 4 for RG1 to RG6). This figure shows how fraction of normal emitting vehicles decrease and the fraction of super emitting vehicles increase with vehicle age.
48

Figure 28 Example of Regime Growth Rate file (RG1)
MY1 and MY2 extension
The “Model Year Emission. Rate” option selection generates two files, with the extensions “MY1” and “MY2.” Each file contains a single report with emission factors by vehicle class, model year, and age. The MY1 file contains data for the without-I/M case, and the MY2 file contains data for the with-I/M case.
•
The “MY1” file contains emission rates for vehicles that have not undergone an I/M program, whereas the “MY2” file contains emissions rates assuming vehicles have undergone an I/M program. Both files have the same format. These files contain emission rates, by vehicle class and model year, beginning with when the vehicles were first sold up to their age in the scenario year. For example, if the scenario year is 1970, the model will output 1965 model year emissions for ages 1 through 7. Figure 29 shows a sample output from the *MY1 file.
49

Figure 29 Emission Rates by Model Year from the *MY1 file
50

8.0 EDITING FUNDAMENTAL DATA This section contains screen prints of dialogs where the user can edit fundamental data. These screen prints complement the real-time presentation given at the workshops. First of all, when we click on ‘Edit Scenario’ or ‘Add Scenario’, we see the ‘INPUT1’ and INPUT2’ and “Mode and Outputs’ at the top which are used already for the basic scenario inputs like Calendar Year, Scenario title and whether we like EMFAC or BURDEN outputs etc. The model can estimate emissions for any calendar year between 1970 and 2040. In Emfac2001/2002, user can only specify one calendar year per scenario. But in Emfac2007, user can input many years in a single scenario – in other words, this new model can be called a multi-scenario model. For example, in Emfac2001/2002, a user seeking emission inventories for the Los Angeles County for 2000 to 2005 should create a file in which only basic scenario data are edited, and the file should have six scenarios. These six scenarios correspond to the calendar years 2000, 2001, 2002, 2003, 2004, and 2005. But with the new Emfac2007, a user can input all years from 2000 to 2005 into a SINGLE SCEANRIO. If a scenario is already open, then if we click on adding a scenario, it will give two options – 1) copy of the existing scenario or 2) A new blank scenario (Fig 30)
Figure 30 Adding or Editing Scenarios
51
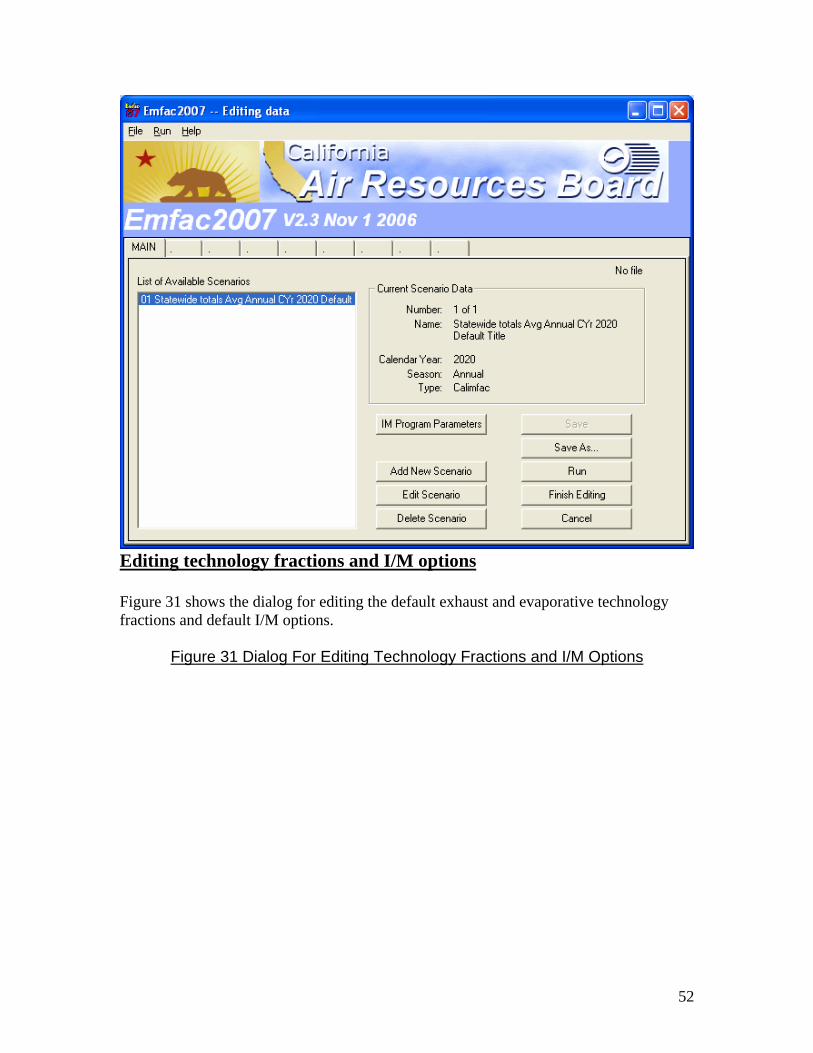
Editing technology fractions and I/M options Figure 31 shows the dialog for editing the default exhaust and evaporative technology fractions and default I/M options.
Figure 31 Dialog For Editing Technology Fractions and I/M Options
52
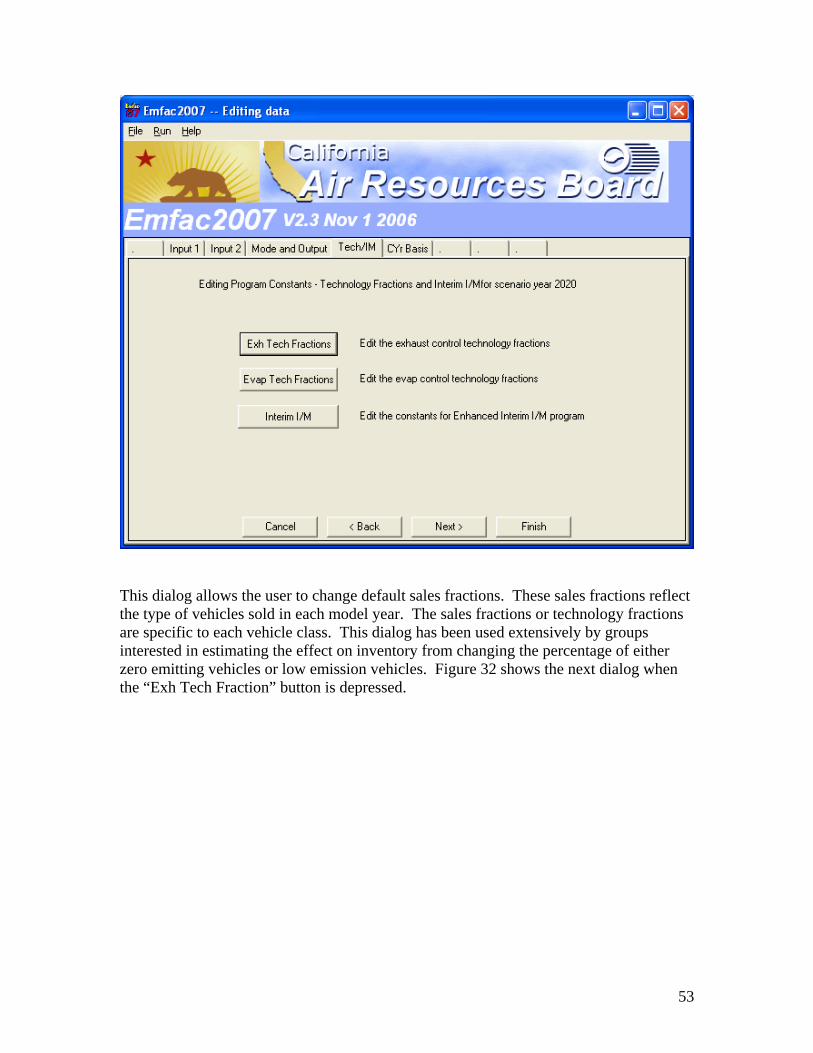
This dialog allows the user to change default sales fractions. These sales fractions reflect the type of vehicles sold in each model year. The sales fractions or technology fractions are specific to each vehicle class. This dialog has been used extensively by groups interested in estimating the effect on inventory from changing the percentage of either zero emitting vehicles or low emission vehicles. Figure 32 shows the next dialog when the “Exh Tech Fraction” button is depressed.
53
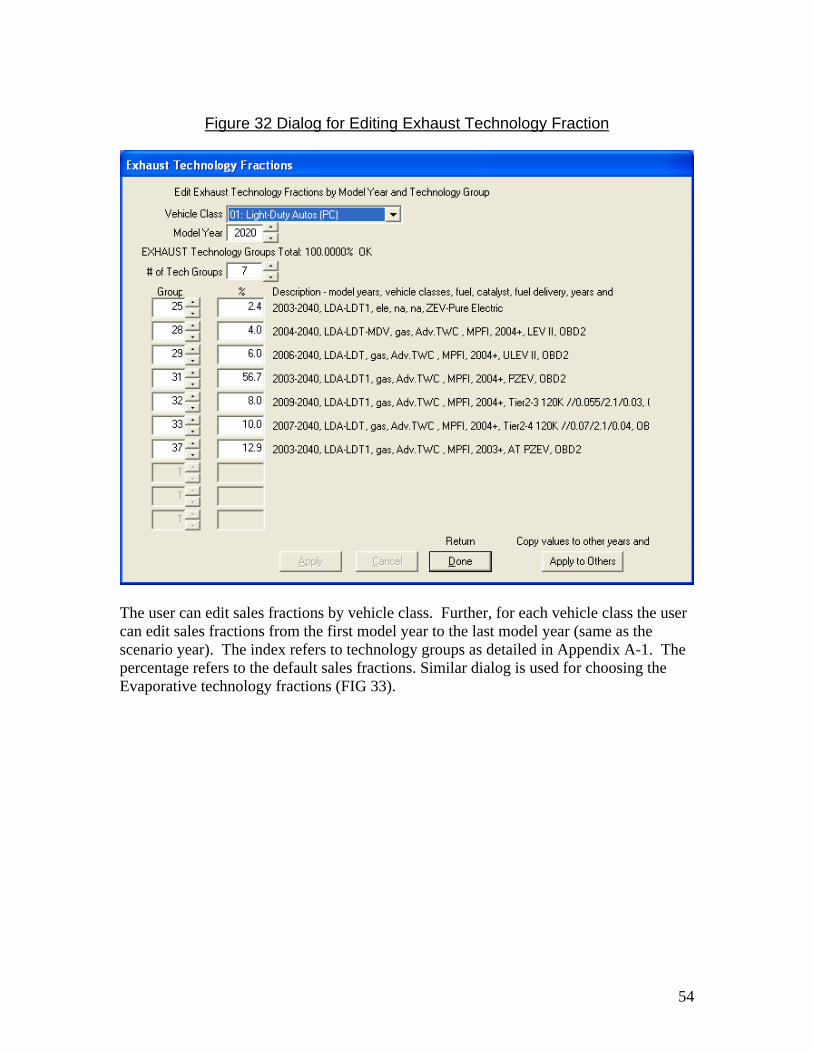
Figure 32 Dialog for Editing Exhaust Technology Fraction
The user can edit sales fractions by vehicle class. Further, for each vehicle class the user can edit sales fractions from the first model year to the last model year (same as the scenario year). The index refers to technology groups as detailed in Appendix A-1. The percentage refers to the default sales fractions. Similar dialog is used for choosing the Evaporative technology fractions (FIG 33).
54

Figure 33 Dialog for Editing EVAP. Technology Fraction
Interim I/M This button is a special feature that allows staff to vary the effectiveness of the current ASM I/M program. In Emfac2000 it was assumed that the Bureau of Automotive Repair would implement ASM cut-points that would achieve their SIP reductions. However, BAR has elected to gradually increase the stringency of the ASM cut-points. When these cut-points are revised, staff can edit these constants and determine the increased benefits from the new cut-points. Figure 34 shows the default interim constants for the current ASM I/M program.
55

Figure 34 Default Interim Constants for the Current ASM I/M Program
As with all I/M options new users should not change the default I/M options or the interim I/M constants without a through understanding how these options work. Changing activity data
The following dialogs show how the user can edit fundamental activity data such as population, accrual rates, trips and vehicle miles traveled. This ability is of great use to regional planners who may be interested in estimating the impact on emissions by changing the default VMT and trip estimates. For example, when a regional transportation plan (RTP) is revised planners usually have new estimates of VMT for forecast years. The planners are then asked to estimate the impact on emissions as a result of the new RTP. The following activity dialogs give users the ability to change the default population, VMT and trip estimates for a given scenario year. Users should be aware that all the dialogs are sequenced noting the inter-dependencies among the data.
56

For example, editing population will affect the default VMT and trip estimates. Hence this dialog precedes the VMT dialog. Figure 35 shows the main dialog for editing population estimates and changing vehicle accrual rates.
Figure 35 Population and Accrual Edits
57

When we click on ‘info’ in Fig. 35, we get the explanation of how accrual rates do not vary by Calendar Year.
Fig36. Info on the Accrual rates
Figures 37and 38 show how the user can change the total population estimate or change population estimates by vehicle class and fuel type. Similarly, Figures 39 and 40 show how the user can edit the default VMT and trip estimates.
58

Figure 37 Editing Total Population
Figure 38 Editing Population By Vehicle Class and Fuel Type
59
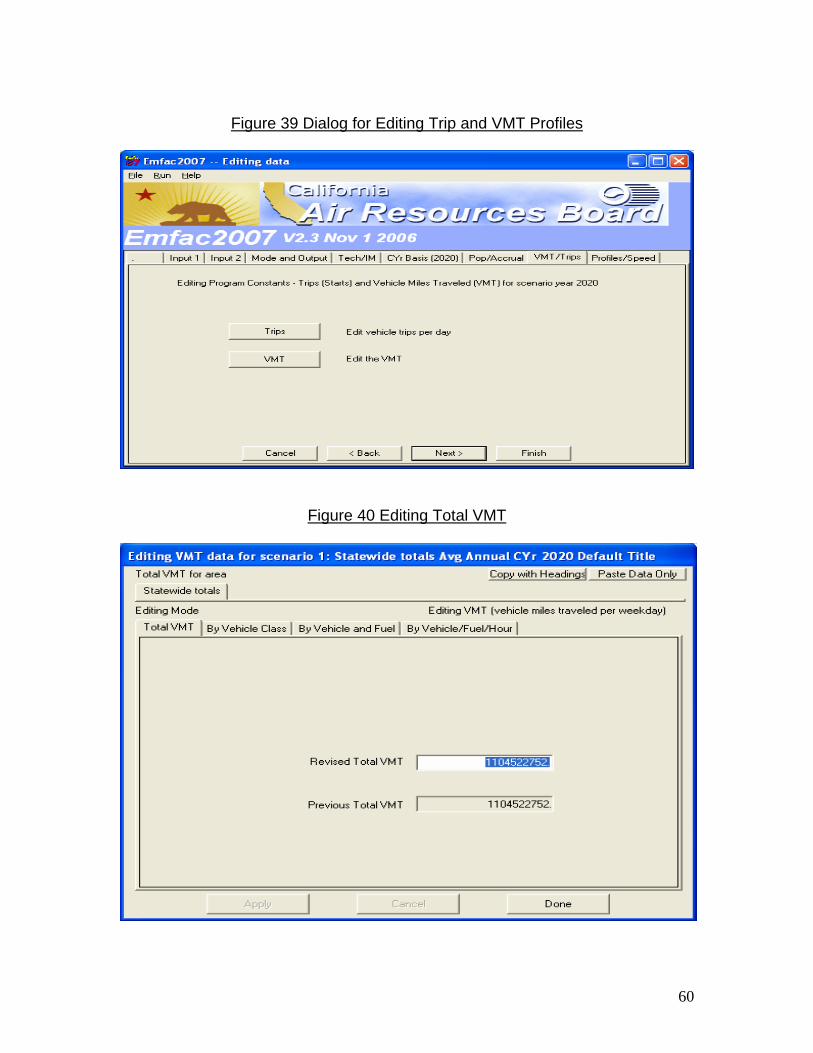
Figure 39 Dialog for Editing Trip and VMT Profiles
Figure 40 Editing Total VMT
60
Editing profiles/speed
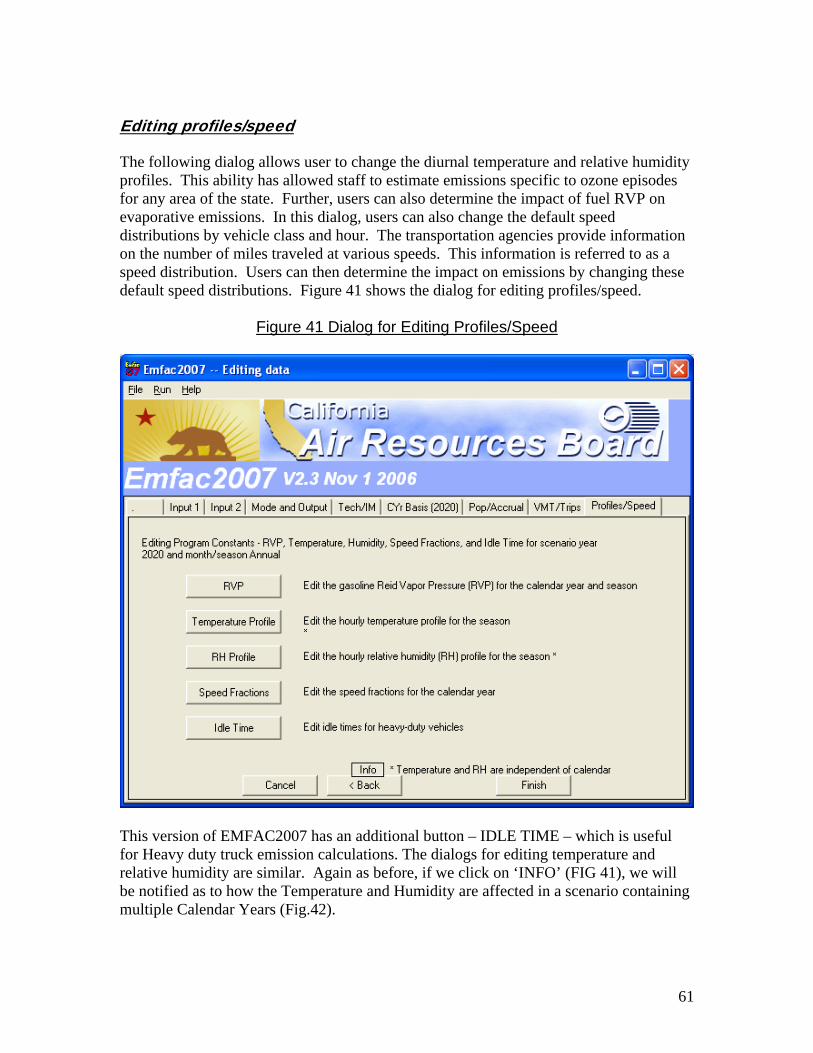
The following dialog allows user to change the diurnal temperature and relative humidity profiles. This ability has allowed staff to estimate emissions specific to ozone episodes for any area of the state. Further, users can also determine the impact of fuel RVP on evaporative emissions. In this dialog, users can also change the default speed distributions by vehicle class and hour. The transportation agencies provide information on the number of miles traveled at various speeds. This information is referred to as a speed distribution. Users can then determine the impact on emissions by changing these default speed distributions. Figure 41 shows the dialog for editing profiles/speed.
Figure 41 Dialog for Editing Profiles/Speed
This version of EMFAC2007 has an additional button – IDLE TIME – which is useful for Heavy duty truck emission calculations. The dialogs for editing temperature and relative humidity are similar. Again as before, if we click on ‘INFO’ (FIG 41), we will be notified as to how the Temperature and Humidity are affected in a scenario containing multiple Calendar Years (Fig.42).
61

Figure 42 Info for ‘Profiles/speed’ option
They both allow the user to change either the temperature or relative humidity for any hour of the day. The user can also edit the values for a range of hours and apply a constant temperature or relative humidity. Figure 43 shows the dialog for editing fundamental temperatures.
62
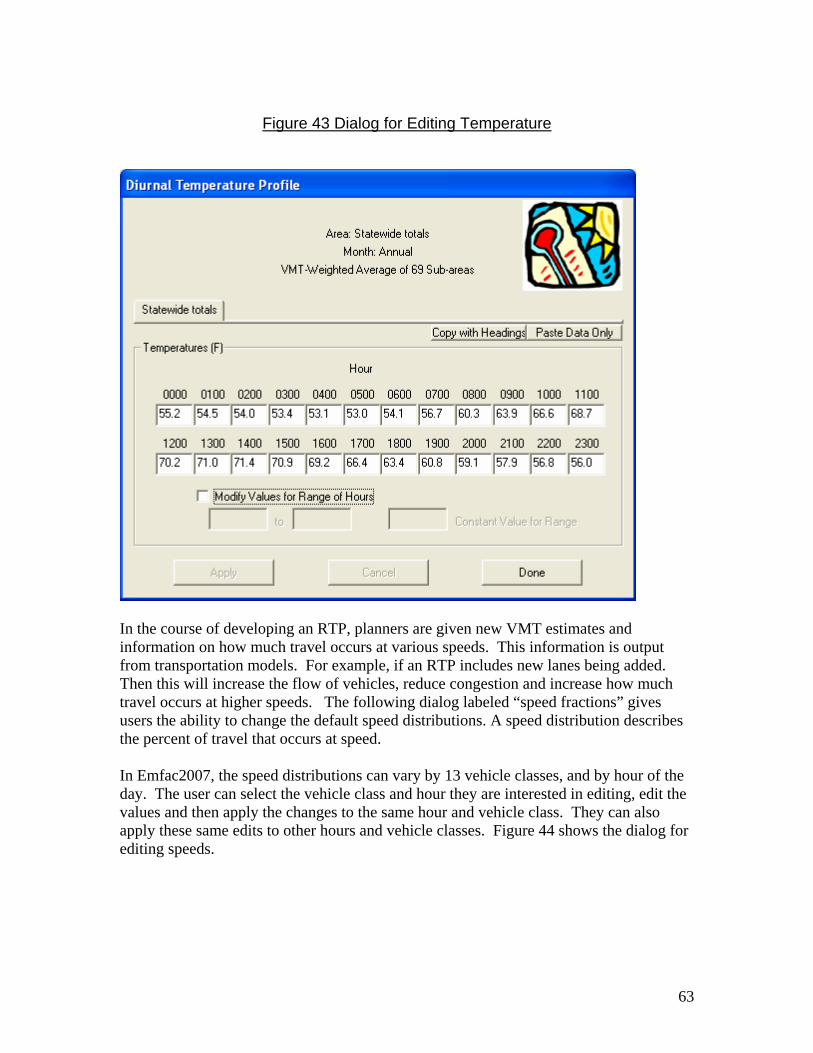
Figure 43 Dialog for Editing Temperature
In the course of developing an RTP, planners are given new VMT estimates and information on how much travel occurs at various speeds. This information is output from transportation models. For example, if an RTP includes new lanes being added. Then this will increase the flow of vehicles, reduce congestion and increase how much travel occurs at higher speeds. The following dialog labeled “speed fractions” gives users the ability to change the default speed distributions. A speed distribution describes the percent of travel that occurs at speed. In Emfac2007, the speed distributions can vary by 13 vehicle classes, and by hour of the day. The user can select the vehicle class and hour they are interested in editing, edit the values and then apply the changes to the same hour and vehicle class. They can also apply these same edits to other hours and vehicle classes. Figure 44 shows the dialog for editing speeds.
63

Figure 44 Dialog for Editing Speeds
The differences between EMFAC2007 and EMFAC2001/2002 in this screen (FIG 44) are evident. Now the speeds are in Fractions (not in percentages), also the there are 3 bins – 1, 5 and 10 MPH. Also the output can be exported to EXCEL for further analysis.
64

Having edited fundamental data the user should press “Finish” and then select the “Save As” button to name the output file. Note, in naming the file the user should not attach an extension to the filename. The model will create an input file with “ *.INP” extension. This input file will contain all data necessary for duplicating the results at a later time. Finally, Figure 45 shows the progress screen when “RUN” has been initiated. This progress screen shows the location of the input/output files. It also shows the scenario number currently being processed.
Figure 45 Final Run or Progress Screen
65

66

APPENDICES
Appendix 1 – Exhaust Technology Groups
Tech. Group
MYrs using TG in FRAC arrays.
Vehs using TG in FRAC arrays.
Fuel Type Catalyst
Fuel Delivery Description
1 1965-1977 LDA-LDT-MDV gas NonCat Carb Pre-1975 no secondary air
2 1966-1977 LDA-LDT-MDV gas NonCat Carb Pre-1975 with secondary air
3 1975-1982 LDA-LDT-MDV gas NonCat Carb 1975+
4 1975-1980 LDA-LDT-MDV gas OxCat Carb 1975-76 with secondary air
5 1975-1979 LDA-LDT-MDV gas OxCat Carb 1975-79 no secondary air
6 1980-1989 LDA-LDT-MDV gas OxCat Carb 1980+ no secondary air
7 1977-1987 LDA-LDT-MDV gas OxCat Carb 1977+ with secondary air
8 1978-1982 LDA-LDT-MDV gas TWC TBI / Carb 1977-79
9 1981-1984 LDA gas TWC TBI / Carb 1981-84 0.7 NOx std.
10 1985-1995 LDA-LDT-MDV gas TWC TBI / Carb 1985+ 0.7 NOx std.
11 1977-1980 LDA gas TWC MPFI 1977-80
12 1981-1985 LDA-LDT-MDV gas TWC MPFI 1981-85 0.7 NOx std.
13 1986-1995 LDA-LDT-MDV gas TWC MPFI 1986+ 0.7 NOx std.
14 1983-1994 LDA-LDT-MDV gas TWC TBI / Carb 1981+ 0.4 NOx std.
15 1983-1994 LDA-LDT gas TWC MPFI 1981+ 0.4 NOx std.
16 1980-1984 LDA-LDT-MDV gas TWC TBI / Carb 1980
17 1993-1995 LDA-LDT gas TWC TBI / Carb 1993+ 0.25 HC std.
18 1993-1995 LDA-LDT gas TWC MPFI 1993+ 0.25 HC std.
19 1996-1999 LDA-LDT gas TWC TBI / Carb 1996+ 0.25 HC std OBD2
20 1996-1999 LDA-LDT gas TWC MPFI 1996+ 0.25 HC std OBD2
21 1994-1995 LDA-LDT gas Adv.TWC MPFI 1994-95 TLEV AFC
22 1996-1996 LDA-LDT gas Adv.TWC MPFI 1996+ TLEV OBD2 AFC
23 1997-2005 LDA-LDT-MDV gas Adv.TWC MPFI 1996+ LEV OBD2 GCL CBC AFC
24 1997-2005 LDA-LDT-MDV gas Adv.TWC MPFI 1996+ ULEV OBD2 GCL CBC AFC
25 2003-2040 LDA-LDT1 ele na na ZEV-Pure Electric
26 1996-2000 LDT-MDV gas TWC MPFI 1996+ 0.7 NOx std. OBD2
27 1996-2000 LDT-MDV gas TWC TBI / Carb 1996+ OBD2
28 2004-2040 LDA-LDT-MDV gas Adv.TWC MPFI 2004+ LEV II OBD2
29 2006-2040 LDA-LDT gas Adv.TWC MPFI 2004+ ULEV II OBD2
30 gas Adv.TWC MPFI 2004+ SULEV II OBD2
31 2003-2040 LDA-LDT1 gas Adv.TWC MPFI 2004+ PZEV OBD2
67
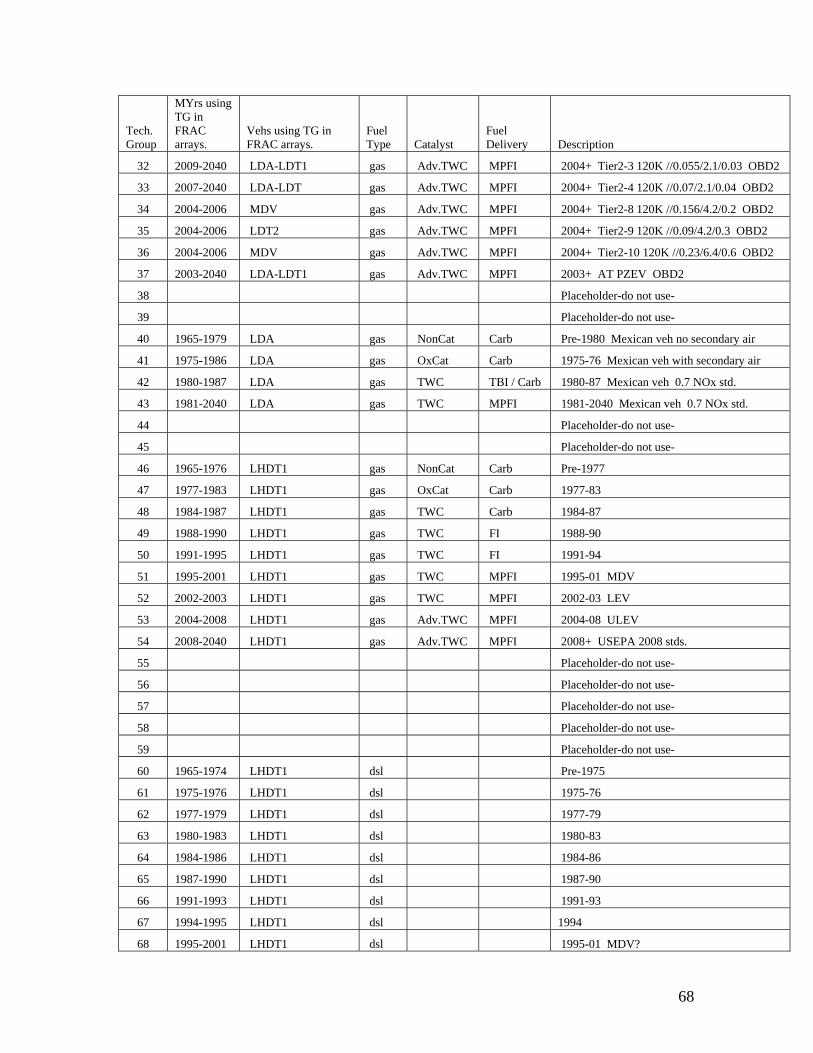
Tech. Group
MYrs using TG in FRAC arrays.
Vehs using TG in FRAC arrays.
Fuel Type Catalyst
Fuel Delivery Description
32 2009-2040 LDA-LDT1 gas Adv.TWC MPFI 2004+ Tier2-3 120K //0.055/2.1/0.03 OBD2
33 2007-2040 LDA-LDT gas Adv.TWC MPFI 2004+ Tier2-4 120K //0.07/2.1/0.04 OBD2
34 2004-2006 MDV gas Adv.TWC MPFI 2004+ Tier2-8 120K //0.156/4.2/0.2 OBD2
35 2004-2006 LDT2 gas Adv.TWC MPFI 2004+ Tier2-9 120K //0.09/4.2/0.3 OBD2
36 2004-2006 MDV gas Adv.TWC MPFI 2004+ Tier2-10 120K //0.23/6.4/0.6 OBD2
37 2003-2040 LDA-LDT1 gas Adv.TWC MPFI 2003+ AT PZEV OBD2
38 Placeholder-do not use-
39 Placeholder-do not use-
40 1965-1979 LDA gas NonCat Carb Pre-1980 Mexican veh no secondary air
41 1975-1986 LDA gas OxCat Carb 1975-76 Mexican veh with secondary air
42 1980-1987 LDA gas TWC TBI / Carb 1980-87 Mexican veh 0.7 NOx std.
43 1981-2040 LDA gas TWC MPFI 1981-2040 Mexican veh 0.7 NOx std.
44 Placeholder-do not use-
45 Placeholder-do not use-
46 1965-1976 LHDT1 gas NonCat Carb Pre-1977
47 1977-1983 LHDT1 gas OxCat Carb 1977-83
48 1984-1987 LHDT1 gas TWC Carb 1984-87
49 1988-1990 LHDT1 gas TWC FI 1988-90
50 1991-1995 LHDT1 gas TWC FI 1991-94
51 1995-2001 LHDT1 gas TWC MPFI 1995-01 MDV
52 2002-2003 LHDT1 gas TWC MPFI 2002-03 LEV
53 2004-2008 LHDT1 gas Adv.TWC MPFI 2004-08 ULEV
54 2008-2040 LHDT1 gas Adv.TWC MPFI 2008+ USEPA 2008 stds.
55 Placeholder-do not use-
56 Placeholder-do not use-
57 Placeholder-do not use-
58 Placeholder-do not use-
59 Placeholder-do not use-
60 1965-1974 LHDT1 dsl Pre-1975
61 1975-1976 LHDT1 dsl 1975-76
62 1977-1979 LHDT1 dsl 1977-79
63 1980-1983 LHDT1 dsl 1980-83
64 1984-1986 LHDT1 dsl 1984-86
65 1987-1990 LHDT1 dsl 1987-90
66 1991-1993 LHDT1 dsl 1991-93
67 1994-1995 LHDT1 dsl 1994
68 1995-2001 LHDT1 dsl 1995-01 MDV?
68

Tech. Group
MYrs using TG in FRAC arrays.
Vehs using TG in FRAC arrays.
Fuel Type Catalyst
Fuel Delivery Description
69 2002-2003 LHDT1 dsl 2002-03 LEV
70 2004-2009 LHDT1 dsl 2004-09 ULEV
71 2007-2040 LHDT1 dsl 2007+ USEPA 2007 stds.
72 Placeholder-do not use-
73 Placeholder-do not use-
74 Placeholder-do not use-
75 Placeholder-do not use-
76 1965-1976 LHDT2 gas NonCat Carb Pre-1977
77 1977-1983 LHDT2 gas OxCat Carb 1977-83
78 1984-1987 LHDT2 gas TWC Carb 1984-87
79 1988-1990 LHDT2 gas TWC FI 1988-90
80 1991-1995 LHDT2 gas TWC FI 1991-94
81 1995-2001 LHDT2 gas TWC MPFI 1995-01 MDV
82 2002-2003 LHDT2 gas TWC MPFI 2002-03 LEV
83 2004-2008 LHDT2 gas Adv.TWC MPFI 2004-08 ULEV
84 2008-2040 LHDT2 gas Adv.TWC MPFI 2008+ USEPA 2008 stds.
85 gas Adv.TWC MPFI Placeholder-do not use-
86 gas Adv.TWC MPFI Placeholder-do not use-
87 gas Adv.TWC MPFI Placeholder-do not use-
88 Placeholder-do not use-
89 Placeholder-do not use-
90 1965-1974 LHDT2 dsl Pre-1975
91 1975-1976 LHDT2 dsl 1975-76
92 1977-1979 LHDT2 dsl 1977-79
93 1980-1983 LHDT2 dsl 1980-83
94 1984-1986 LHDT2 dsl 1984-86
95 1987-1990 LHDT2 dsl 1987-90
96 1991-1993 LHDT2 dsl 1991-93
97 1994-1995 LHDT2 dsl 1994
98 1995-2001 LHDT2 dsl 1995-01 MDV
99 2002-2003 LHDT2 dsl 2002-03 LEV
100 2004-2009 LHDT2 dsl 2004-09 ULEV
101 2007-2040 LHDT2 dsl 2007+ USEPA 2007 stds.
102 Placeholder - do not use -
103 Placeholder - do not use -
104 Placeholder - do not use -
105 Placeholder - do not use -
69
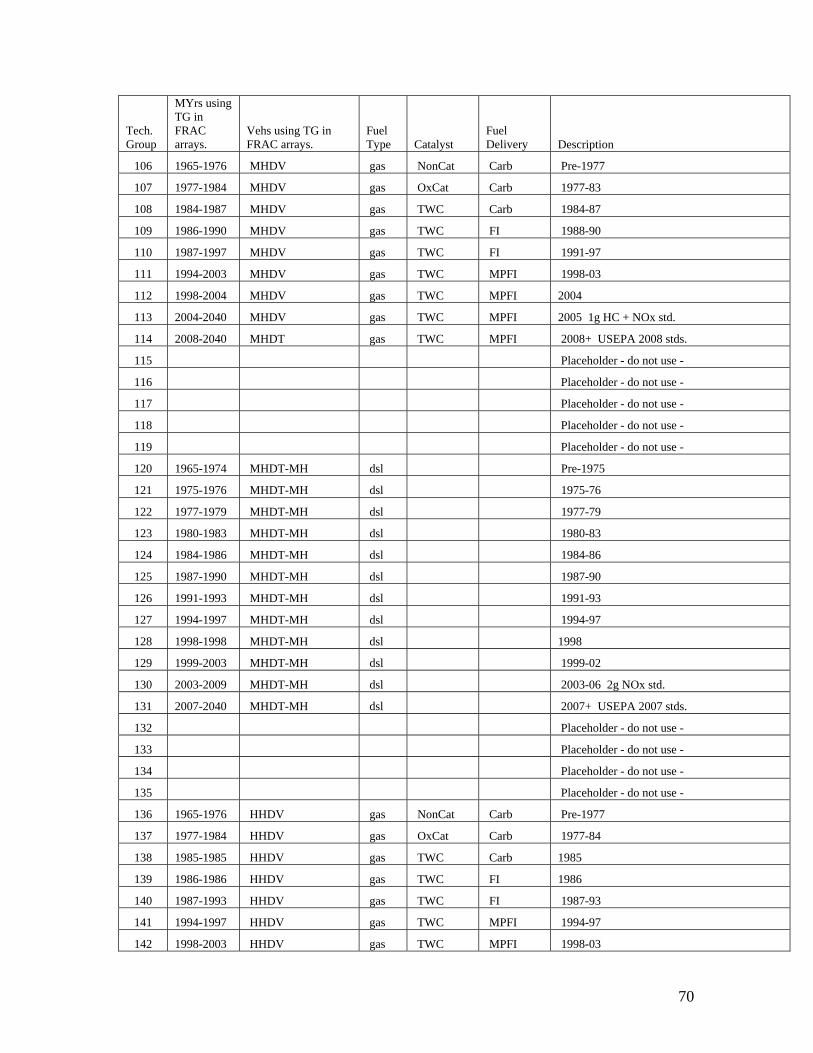
Tech. Group
MYrs using TG in FRAC arrays.
Vehs using TG in FRAC arrays.
Fuel Type Catalyst
Fuel Delivery Description
106 1965-1976 MHDV gas NonCat Carb Pre-1977
107 1977-1984 MHDV gas OxCat Carb 1977-83
108 1984-1987 MHDV gas TWC Carb 1984-87
109 1986-1990 MHDV gas TWC FI 1988-90
110 1987-1997 MHDV gas TWC FI 1991-97
111 1994-2003 MHDV gas TWC MPFI 1998-03
112 1998-2004 MHDV gas TWC MPFI 2004
113 2004-2040 MHDV gas TWC MPFI 2005 1g HC + NOx std.
114 2008-2040 MHDT gas TWC MPFI 2008+ USEPA 2008 stds.
115 Placeholder - do not use -
116 Placeholder - do not use -
117 Placeholder - do not use -
118 Placeholder - do not use -
119 Placeholder - do not use -
120 1965-1974 MHDT-MH dsl Pre-1975
121 1975-1976 MHDT-MH dsl 1975-76
122 1977-1979 MHDT-MH dsl 1977-79
123 1980-1983 MHDT-MH dsl 1980-83
124 1984-1986 MHDT-MH dsl 1984-86
125 1987-1990 MHDT-MH dsl 1987-90
126 1991-1993 MHDT-MH dsl 1991-93
127 1994-1997 MHDT-MH dsl 1994-97
128 1998-1998 MHDT-MH dsl 1998
129 1999-2003 MHDT-MH dsl 1999-02
130 2003-2009 MHDT-MH dsl 2003-06 2g NOx std.
131 2007-2040 MHDT-MH dsl 2007+ USEPA 2007 stds.
132 Placeholder - do not use -
133 Placeholder - do not use -
134 Placeholder - do not use -
135 Placeholder - do not use -
136 1965-1976 HHDV gas NonCat Carb Pre-1977
137 1977-1984 HHDV gas OxCat Carb 1977-84
138 1985-1985 HHDV gas TWC Carb 1985
139 1986-1986 HHDV gas TWC FI 1986
140 1987-1993 HHDV gas TWC FI 1987-93
141 1994-1997 HHDV gas TWC MPFI 1994-97
142 1998-2003 HHDV gas TWC MPFI 1998-03
70

Tech. Group
MYrs using TG in FRAC arrays.
Vehs using TG in FRAC arrays.
Fuel Type Catalyst
Fuel Delivery Description
143 2004-2040 HHDV gas TWC MPFI 2004-06
144 gas TWC MPFI 2007+ USEPAs std Placeholder-do not use-
145 Placeholder - do not use -
146 Placeholder - do not use -
147 Placeholder - do not use -
148 Placeholder - do not use -
149 Placeholder - do not use -
150 1965-1974 HHDV dsl Pre-1975 CA stds.
151 1975-1976 HHDV dsl 1975-76 CA Stds.
152 1977-1979 HHDV dsl 1977-79 CA Stds.
153 1980-1983 HHDV dsl 1980-83 CA Stds.
154 1984-1986 HHDV dsl 1984-86 CA Stds.
155 1987-1990 HHDV dsl 1987-90 CA Stds.
156 1991-1993 HHDV dsl 1991-93 CA Stds.
157 1994-1997 HHDV dsl 1994-97 CA Stds.
158 1998-1998 HHDV dsl 1998 CA Stds.
159 1999-2002 HHDV dsl 1999-02 CA Stds.
160 2003-2006 HHDV dsl 2003-06 CA 2g NOx Stds.
161 2007-2009 HHDV dsl 2007+ USEPA2007 stds 50% NOx phased-in.
162 2010+ HHDV dsl 2007+USEPA2007 stds 100% NOx phased-in.
163 2010+ HHDV dsl 2007+ USEPA 2007 stds W/OBD2.
164 Placeholder - do not use -
165 Placeholder - do not use -
166 Placeholder - do not use -
167 Placeholder - do not use -
168 Placeholder - do not use -
169 Placeholder - do not use -
170 1965-1974 LDA-LDT-MDV dsl Pre-1975
171 1975-1979 LDA-LDT-MDV dsl 1975-79
172 1980-1980 LDA-LDT-MDV dsl 1980
173 1981-1981 LDA-LDT-MDV dsl 1981
174 1982-1982 LDA-LDT-MDV dsl 1982
175 1983-1983 LDA-LDT-MDV dsl 1983
176 1984-1992 LDA-LDT-MDV dsl 1984-92
177 1993-2003 LDA-LDT-MDV dsl 1993+
178 Placeholder - do not use -
179 Placeholder - do not use -
71
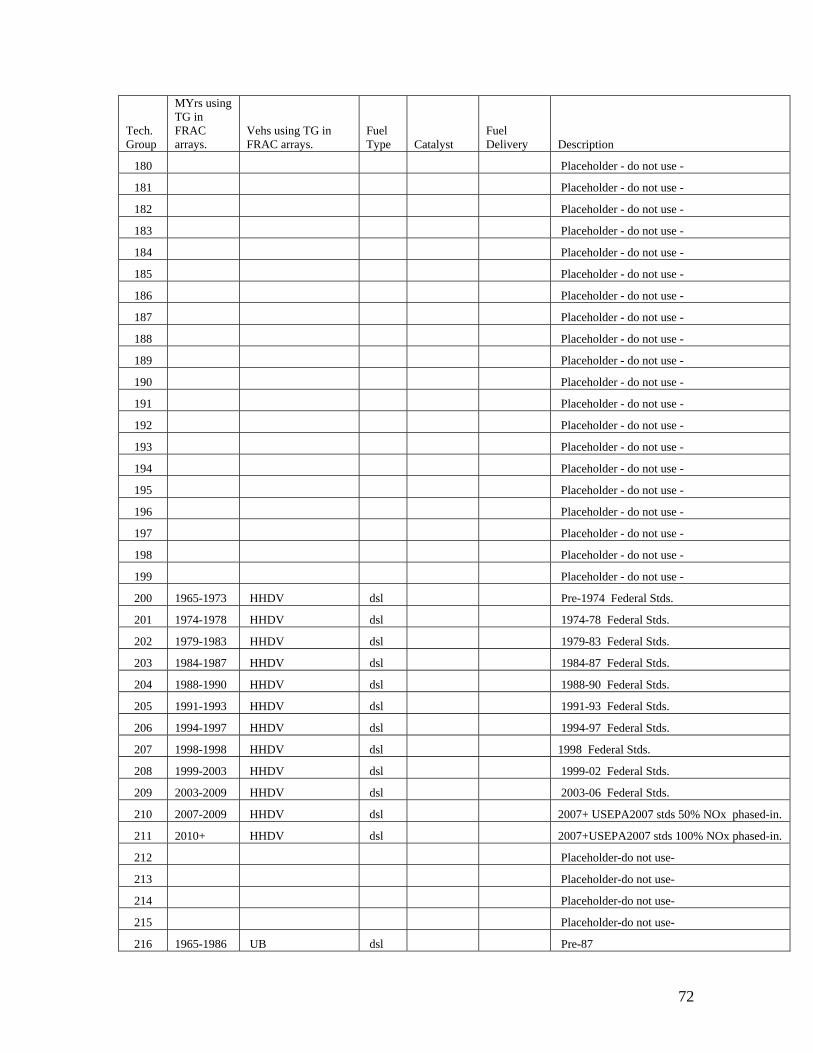
Tech. Group
MYrs using TG in FRAC arrays.
Vehs using TG in FRAC arrays.
Fuel Type Catalyst
Fuel Delivery Description
180 Placeholder - do not use -
181 Placeholder - do not use -
182 Placeholder - do not use -
183 Placeholder - do not use -
184 Placeholder - do not use -
185 Placeholder - do not use -
186 Placeholder - do not use -
187 Placeholder - do not use -
188 Placeholder - do not use -
189 Placeholder - do not use -
190 Placeholder - do not use -
191 Placeholder - do not use -
192 Placeholder - do not use -
193 Placeholder - do not use -
194 Placeholder - do not use -
195 Placeholder - do not use -
196 Placeholder - do not use -
197 Placeholder - do not use -
198 Placeholder - do not use -
199 Placeholder - do not use -
200 1965-1973 HHDV dsl Pre-1974 Federal Stds.
201 1974-1978 HHDV dsl 1974-78 Federal Stds.
202 1979-1983 HHDV dsl 1979-83 Federal Stds.
203 1984-1987 HHDV dsl 1984-87 Federal Stds.
204 1988-1990 HHDV dsl 1988-90 Federal Stds.
205 1991-1993 HHDV dsl 1991-93 Federal Stds.
206 1994-1997 HHDV dsl 1994-97 Federal Stds.
207 1998-1998 HHDV dsl 1998 Federal Stds.
208 1999-2003 HHDV dsl 1999-02 Federal Stds.
209 2003-2009 HHDV dsl 2003-06 Federal Stds.
210 2007-2009 HHDV dsl 2007+ USEPA2007 stds 50% NOx phased-in.
211 2010+ HHDV dsl 2007+USEPA2007 stds 100% NOx phased-in.
212 Placeholder-do not use-
213 Placeholder-do not use-
214 Placeholder-do not use-
215 Placeholder-do not use-
216 1965-1986 UB dsl Pre-87
72
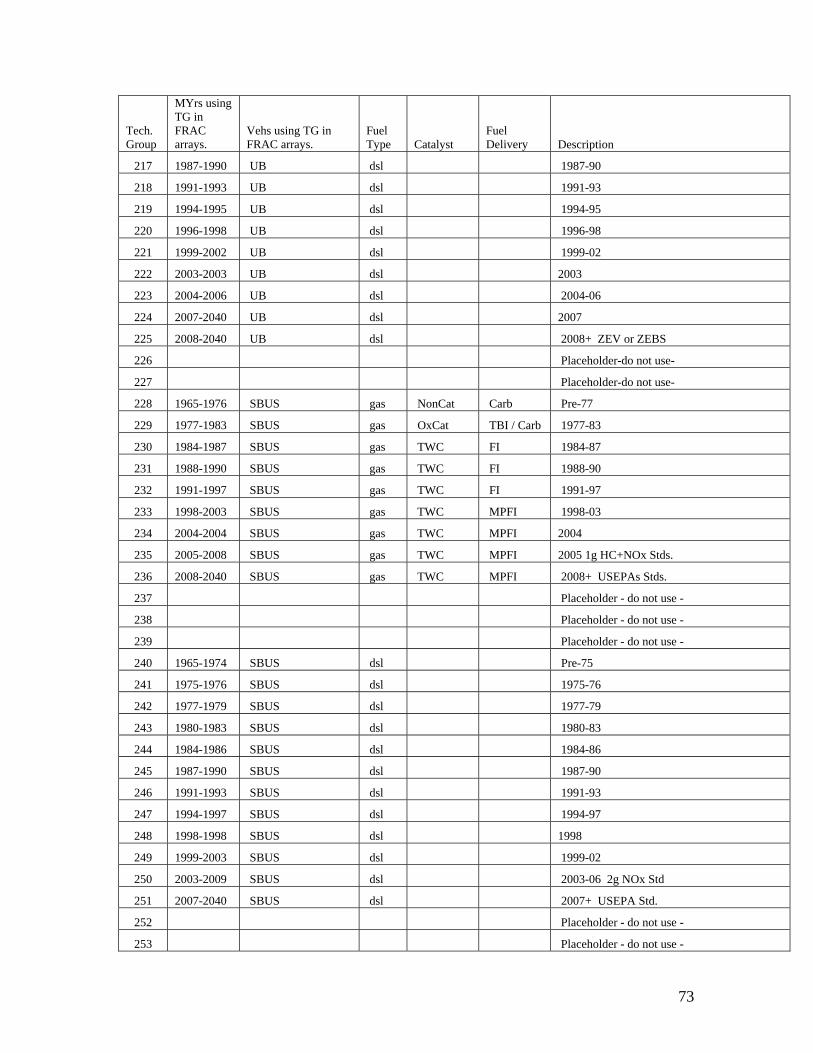
Tech. Group
MYrs using TG in FRAC arrays.
Vehs using TG in FRAC arrays.
Fuel Type Catalyst
Fuel Delivery Description
217 1987-1990 UB dsl 1987-90
218 1991-1993 UB dsl 1991-93
219 1994-1995 UB dsl 1994-95
220 1996-1998 UB dsl 1996-98
221 1999-2002 UB dsl 1999-02
222 2003-2003 UB dsl 2003
223 2004-2006 UB dsl 2004-06
224 2007-2040 UB dsl 2007
225 2008-2040 UB dsl 2008+ ZEV or ZEBS
226 Placeholder-do not use-
227 Placeholder-do not use-
228 1965-1976 SBUS gas NonCat Carb Pre-77
229 1977-1983 SBUS gas OxCat TBI / Carb 1977-83
230 1984-1987 SBUS gas TWC FI 1984-87
231 1988-1990 SBUS gas TWC FI 1988-90
232 1991-1997 SBUS gas TWC FI 1991-97
233 1998-2003 SBUS gas TWC MPFI 1998-03
234 2004-2004 SBUS gas TWC MPFI 2004
235 2005-2008 SBUS gas TWC MPFI 2005 1g HC+NOx Stds.
236 2008-2040 SBUS gas TWC MPFI 2008+ USEPAs Stds.
237 Placeholder - do not use -
238 Placeholder - do not use -
239 Placeholder - do not use -
240 1965-1974 SBUS dsl Pre-75
241 1975-1976 SBUS dsl 1975-76
242 1977-1979 SBUS dsl 1977-79
243 1980-1983 SBUS dsl 1980-83
244 1984-1986 SBUS dsl 1984-86
245 1987-1990 SBUS dsl 1987-90
246 1991-1993 SBUS dsl 1991-93
247 1994-1997 SBUS dsl 1994-97
248 1998-1998 SBUS dsl 1998
249 1999-2003 SBUS dsl 1999-02
250 2003-2009 SBUS dsl 2003-06 2g NOx Std
251 2007-2040 SBUS dsl 2007+ USEPA Std.
252 Placeholder - do not use -
253 Placeholder - do not use -
73

Tech. Group
MYrs using TG in FRAC arrays.
Vehs using TG in FRAC arrays.
Fuel Type Catalyst
Fuel Delivery Description
254 Placeholder - do not use -
255 Placeholder - do not use -
256 Placeholder - do not use -
257 Placeholder - do not use -
258 Placeholder - do not use -
259 Placeholder - do not use -
260 1965-1977 MCY gas NonCat 2-Stroke All 6g evap Std.
261 1965-1977 MCY gas NonCat Carb Pre-1978 6g evap Std.
262 1978-1979 MCY gas NonCat Carb 1978-79 6g evap Std.
263 1980-1981 MCY gas NonCat Carb 1980-81 6g evap Std.
264 1982-1984 MCY gas NonCat Carb 1982-84 6g evap Std.
265 1985-1987 MCY gas NonCat Carb 1985-87 2g evap Std.
266 1988-2003 MCY gas NonCat Carb 1988-03 2g evap Std.
267 1994-2003 MCY gas NonCat FI 1988-03 2g evap Std.
268 1995-2003 MCY gas OxCat Carb 1988-03 2g evap Std.
269 1994-2003 MCY gas TWC FI 1988-03 2g evap Std.
270 2004-2007 MCY gas NonCat Carb 2003-08 2g evap Std.
271 2004-2007 MCY gas NonCat FI 2003-08 2g evap Std.
272 2004-2007 MCY gas OxCat Carb 2003-08 2g evap Std.
273 2004-2007 MCY gas TWC FI 03-08 MCY FI/cat/2g evap
274 2008-2040 MCY gas NonCat Carb 2008+ 2 evap Std.
275 2008-2040 MCY gas NonCat FI 2008+ 2 evap Std.
276 2008-2040 MCY gas OxCat Carb 2008+ 2 evap Std.
277 2008-2040 MCY gas TWC FI 2008+ 2 evap Std.
74

Appendix 2 – Evaporative Technology Groups
Tech. Group
MYrs using TG in FRAC arrays.
Vehs using TG in FRAC arrays.
Fuel Type Catalyst
Fuel Delivery Description
1 1965-1983 MCY-LDA gas NonCat Carb Pre-1970 uncontrolled
2 1970-1985 MCY-LDA gas NonCat Carb 1970-76
3 1975-1977 LDA gas Cat Carb 1975-76
4 1977-1993 MCY-LDA gas NonCat Carb 1977+
5 1977-1988 LDA gas Cat Carb 1977+
6 1978-1978 LDA gas Cat TBI 1970-78
7 1977-1978 LDA gas Cat FI 1970-78
8 1979-1985 LDA gas Cat TBI 1979-85
9 1979-2040 MCY-LDA gas Cat FI 1979-85
10 1986-2040 MCY-LDA gas Cat TBI 1986-94
11 1986-2040 LDA gas Cat FI 1986-94
12 1995-1997 LDA gas Cat TBI 1995+
13 1995-1997 LDA gas Cat MPFI 1995+
14 1995-2005 LDA gas Cat MPFI Enhanced evap OBD2
15 2005-2040 LDA gas Cat MPFI Near zero evap OBD2
16 2003-2040 LDA ele ZEV
17 2003-2040 LDA gas Cat MPFI PZEV
18 NO DATA -- DO NOT USE
19 NO DATA -- DO NOT USE
20 NO DATA -- DO NOT USE
21 1965-1969 LDT-MDV-HDV gas NonCat Carb Pre-1970 uncontrolled
22 1970-1979 LDT-MDV-HDV gas NonCat Carb 1970-79
23 1975-1979 LDT-MDV-HDV gas Cat Carb 1975-79
24 1980-1980 LDT gas NonCat Carb 1980+
25 1980-1990 LDT-MDV-HDV gas Cat Carb 1980+
26 1979-1979 LDT gas Cat TBI 1970-79
27 gas Cat FI 1970-79
28 1980-1985 LDT-MDV gas Cat TBI 1980-85
29 1981-1985 LDT-MDV gas Cat FI 1980-85
30 1986-1994 LDT-MDV-HDV gas Cat TBI 1986-94
31 1986-1994 LDT-MDV-HDV gas Cat FI 1986-94
32 1995-1997 LDT-MDV-HDV gas Cat TBI 1995+
33 1995-1997 LDT-MDV-HDV gas Cat FI 1995+
75

Tech. Group
MYrs using TG in FRAC arrays.
Vehs using TG in FRAC arrays.
Fuel Type Catalyst
Fuel Delivery Description
34 1995-2037 LDT-MDV-HDV gas Cat MPFI Enhanced evap OBD2
35 2004-2040 LDT-MDV-HDV gas Cat MPFI Near zero evap OBD2
36 2003-2040 LDT1 ele ZEV
37 2003-2040 LDT1 gas Cat MPFI PZEV
76
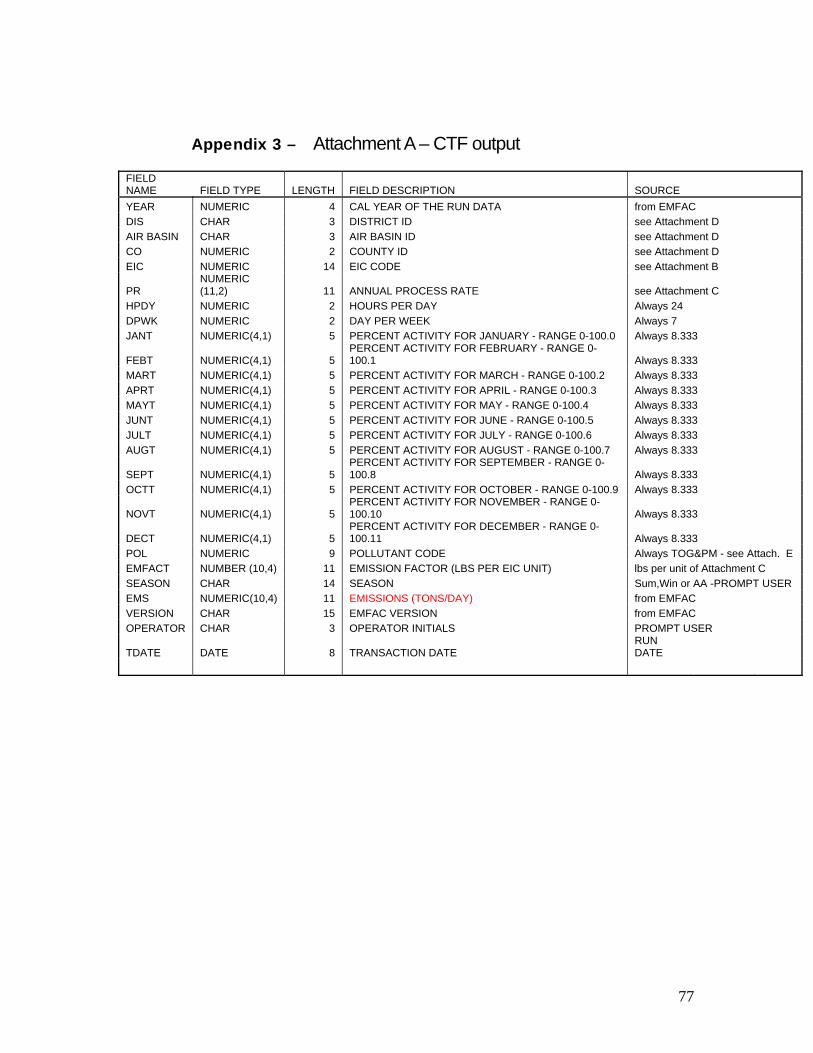
Appendix 3 – Attachment A – CTF output
FIELD NAME FIELD TYPE LENGTH FIELD DESCRIPTION SOURCE YEAR NUMERIC 4 CAL YEAR OF THE RUN DATA from EMFAC DIS CHAR 3 DISTRICT ID see Attachment D AIR BASIN CHAR 3 AIR BASIN ID see Attachment D CO NUMERIC 2 COUNTY ID see Attachment D EIC NUMERIC 14 EIC CODE see Attachment B
PR NUMERIC (11,2) 11 ANNUAL PROCESS RATE see Attachment C
HPDY NUMERIC 2 HOURS PER DAY Always 24 DPWK NUMERIC 2 DAY PER WEEK Always 7 JANT NUMERIC(4,1) 5 PERCENT ACTIVITY FOR JANUARY - RANGE 0-100.0 Always 8.333
FEBT NUMERIC(4,1) 5 PERCENT ACTIVITY FOR FEBRUARY - RANGE 0-100.1 Always 8.333
MART NUMERIC(4,1) 5 PERCENT ACTIVITY FOR MARCH - RANGE 0-100.2 Always 8.333 APRT NUMERIC(4,1) 5 PERCENT ACTIVITY FOR APRIL - RANGE 0-100.3 Always 8.333 MAYT NUMERIC(4,1) 5 PERCENT ACTIVITY FOR MAY - RANGE 0-100.4 Always 8.333 JUNT NUMERIC(4,1) 5 PERCENT ACTIVITY FOR JUNE - RANGE 0-100.5 Always 8.333 JULT NUMERIC(4,1) 5 PERCENT ACTIVITY FOR JULY - RANGE 0-100.6 Always 8.333 AUGT NUMERIC(4,1) 5 PERCENT ACTIVITY FOR AUGUST - RANGE 0-100.7 Always 8.333
SEPT NUMERIC(4,1) 5 PERCENT ACTIVITY FOR SEPTEMBER - RANGE 0-100.8 Always 8.333
OCTT NUMERIC(4,1) 5 PERCENT ACTIVITY FOR OCTOBER - RANGE 0-100.9 Always 8.333
NOVT NUMERIC(4,1) 5 PERCENT ACTIVITY FOR NOVEMBER - RANGE 0-100.10 Always 8.333
DECT NUMERIC(4,1) 5 PERCENT ACTIVITY FOR DECEMBER - RANGE 0-100.11 Always 8.333
POL NUMERIC 9 POLLUTANT CODE Always TOG&PM - see Attach. E EMFACT NUMBER (10,4) 11 EMISSION FACTOR (LBS PER EIC UNIT) lbs per unit of Attachment C SEASON CHAR 14 SEASON Sum,Win or AA -PROMPT USER EMS NUMERIC(10,4) 11 EMISSIONS (TONS/DAY) from EMFAC VERSION CHAR 15 EMFAC VERSION from EMFAC OPERATOR CHAR 3 OPERATOR INITIALS PROMPT USER
TDATE DATE 8 TRANSACTION DATE RUN DATE
77

78