Cagny 2009 v10print - IIS Windows...
25
1 2009 CAGNY February 19, 2009 Jon Moeller Chief Financial Officer Growth thru Recessions Sales 9 24 39 84 0 10 20 30 40 50 60 70 80 90 1979 1990 2001 2008 Sales, $Billions
Transcript of Cagny 2009 v10print - IIS Windows...

1
2009 CAGNYFebruary 19, 2009
Jon Moeller
Chief Financial Officer
Growth thru Recessions Sales
9
24
39
84
0102030405060708090
1979 1990 2001 2008
Sal
es, $
Bill
ion
s

2
Sales Growth
9x CAGR 8%
ProfitGrowth
Productivity
21xCAGR 11%
+350%
Growth thru 3 Recessions 1979 - Today
P&G Share Price Since 1979
$0
$10
$20
$30
$40
$50
$60
$70
$80
1979
1981
1982
1984
1986
1988
1989
1991
1993
1995
1996
1998
2000
2002
2003
2005
2007
P&
G S
hare
Pri
ce
Increasing Dividends
Dividends per Share$1.55
1956 1969 1982 1995 2008

3
Base Tide Liquid Laundry Retail Pricing
$0.18
$0.19
$0.20
$0.21
$0.22
FY 00/01 FY01/02 FY 02/03 FY 03/04 FY 04/05 FY 05/06 FY 06/07 FY 07/08 OND '08
Ret
ail P
rice
/use
5 Year Corporate Credit SpreadsVS U.S. Treasuries
0
50
100
150
200
250
300
350
400
JFM'07 AMJ'07 JAS'07 OND'07 JFM'08 AMJ'08 JAS'08 OND'08
Spr
ead
(bps
)
GDP Growth Slowing Worldwide
2008 Q4 GDP Growth
US -3.8
UK -1.8
China 6.8
Japan -3.3
Source: Global Insight & Government statistics
Note - US figures are annualized
Germany -1.7

4
U.S. Dollar vs G-7 Currency Basket(CAD-GBP-EUR Equal Weighting)
1.10
1.15
1.20
1.25
1.30
1.35
1.40
1.45
1.50
1.55
1.60
JFM'07 AMJ'07 JAS'07 OND'07 JFM'08 AMJ'08 JAS'08 OND'08
Pri
ce (U
.S. D
olla
rs /
Fore
ign
Cur
renc
y)
22% Depreciation
The Magnitude of FX Moves in OND’08(10/1/08 to 12/31/08)
30.30.3%CNY20.1-0.3%EUR
201.6-4.6%INR1602.5-13.7%CAD1602.5-18.8%BRL
17 thousand3.9-20.2%PLN350 thousand4.5-19.3%GBP
20 million5.3-13.3%RUB> 1 trillion7.6-22.3%MXN
Likelihood (1 in x)
Number of Std Deviations% MoveCCY
Foreign Exchange12
• Transaction
• Balance Sheet Revaluation
• Translation

5
FY ’09 Q2 Results
EPS
Global Value Share
All Six Business Segments Flat or Up^
+2%Organic Sales
�
�
�
(^) – Refers to Organic Sales.
Looking Forward
Inventory Impacts
Commodities
Pricing
Cost Savings, Productivity
& Simplification
Market Growth
Foreign Exchange
Key Materials Price EvolutionSpot Price VS Year Ago
Index
0 50 100 150 200 250
Material 1Material 2Material 3Material 4Material 5Material 6Material 7Material 8Material 9Material 10Material 11Material 12Material 13Material 14Material 15Material 16Material 17Material 18Material 19Total Total
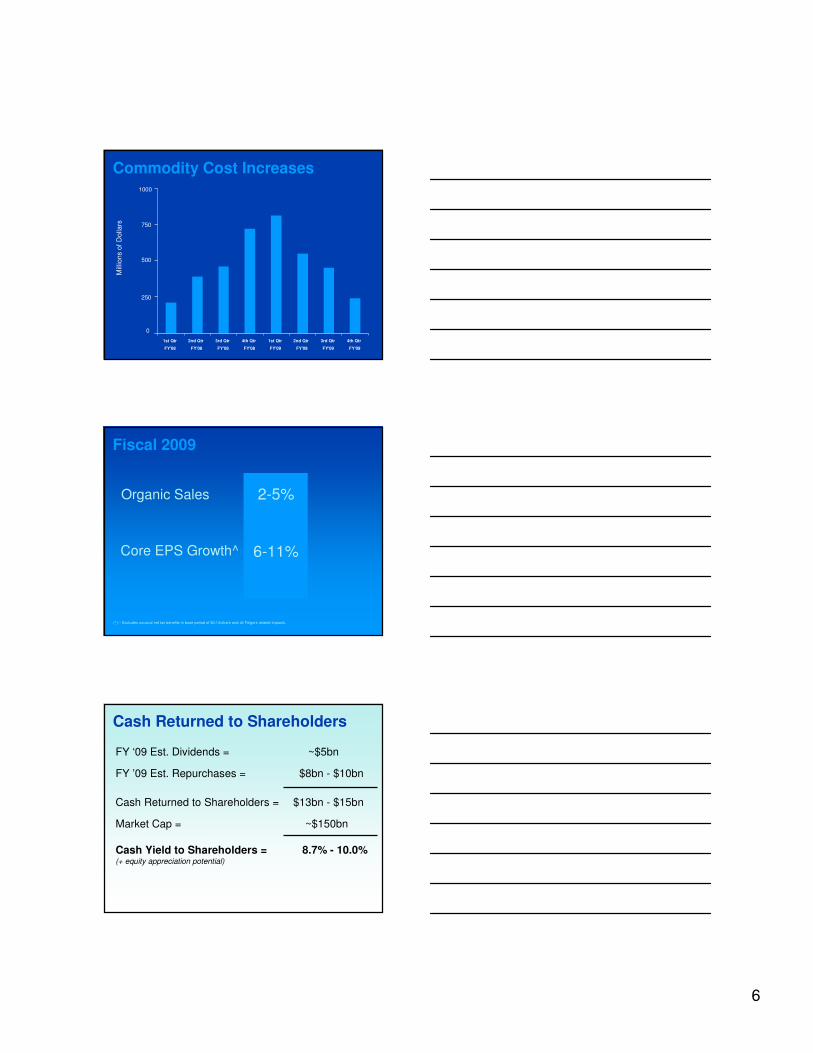
6
Mill
ions
of D
olla
rs
0
250
500
750
1000
1st Qtr
FY'08
2nd Qtr
FY'08
3rd Qtr
FY'08
4th Qtr
FY'08
1st Qtr
FY'09
2nd Qtr
FY'09
3rd Qtr
FY'09
4th Qtr
FY'09
Commodity Cost Increases
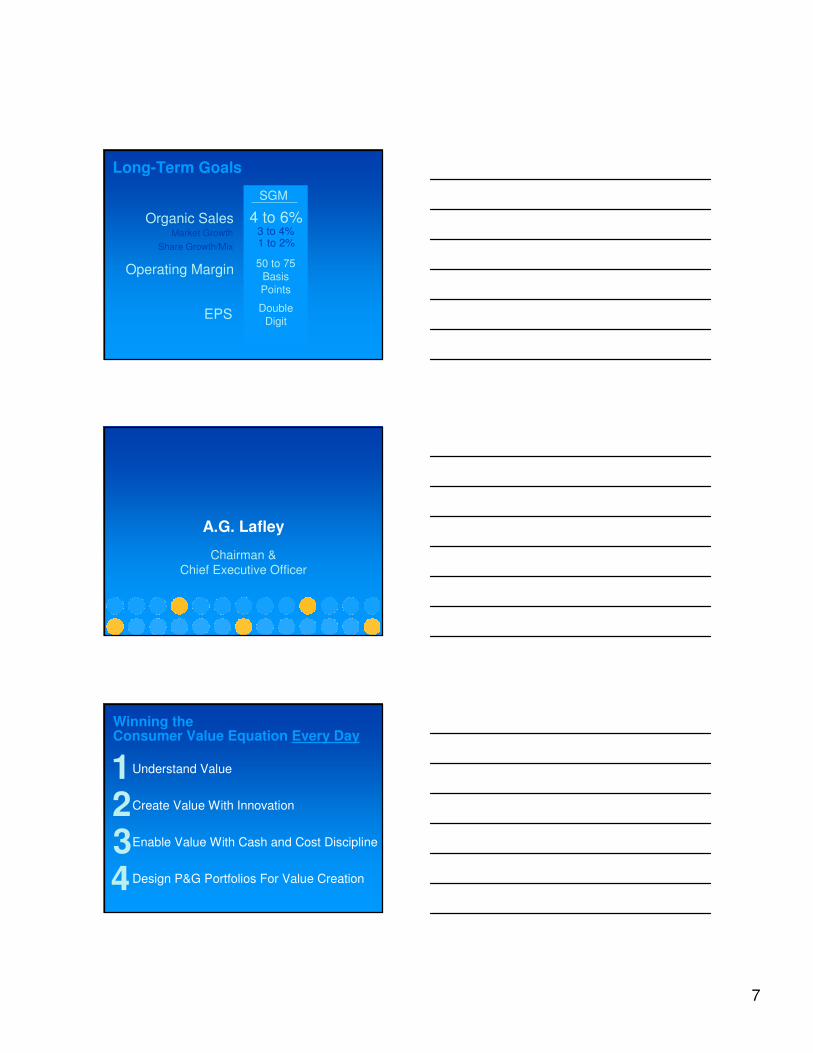
Fiscal 2009
(^) – Excludes unusual net tax benefits in base period of $0.14/share and all Folgers related impacts.
2-5%Organic Sales
Core EPS Growth^ 6-11%
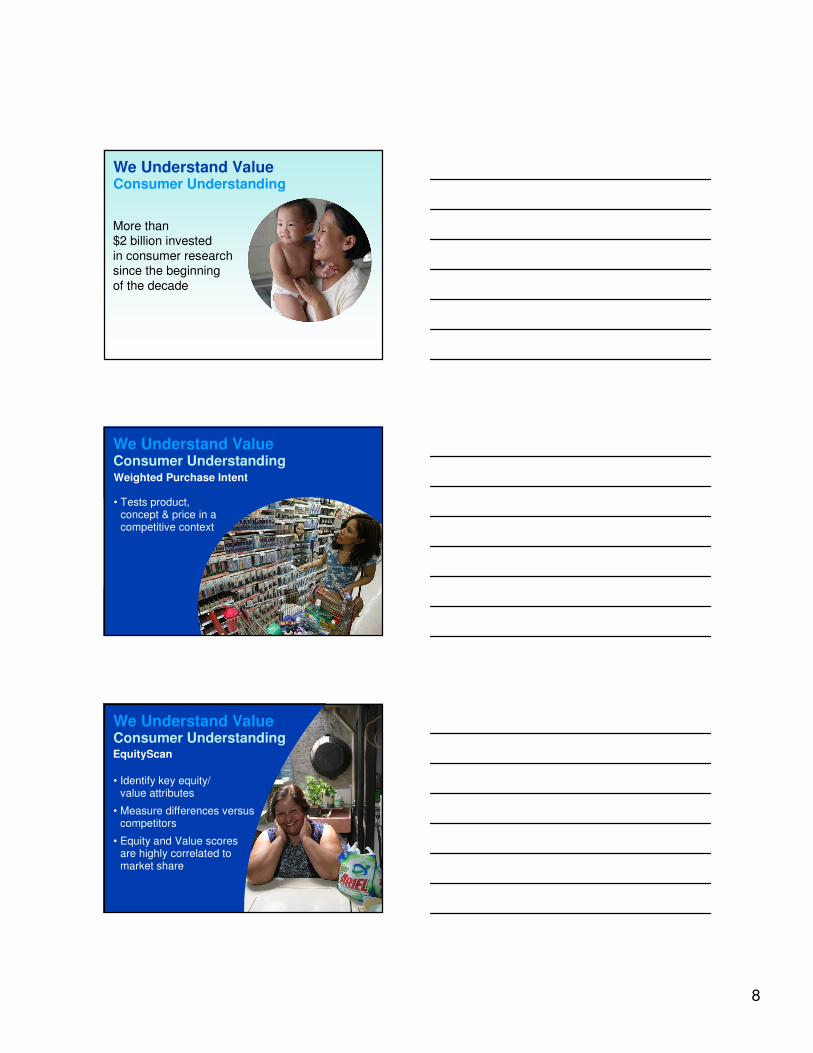
FY ‘09 Est. Dividends = ~$5bn
FY ’09 Est. Repurchases = $8bn - $10bn
Cash Returned to Shareholders = $13bn - $15bn
Market Cap = ~$150bn
Cash Yield to Shareholders = 8.7% - 10.0%(+ equity appreciation potential)
Cash Returned to Shareholders
7
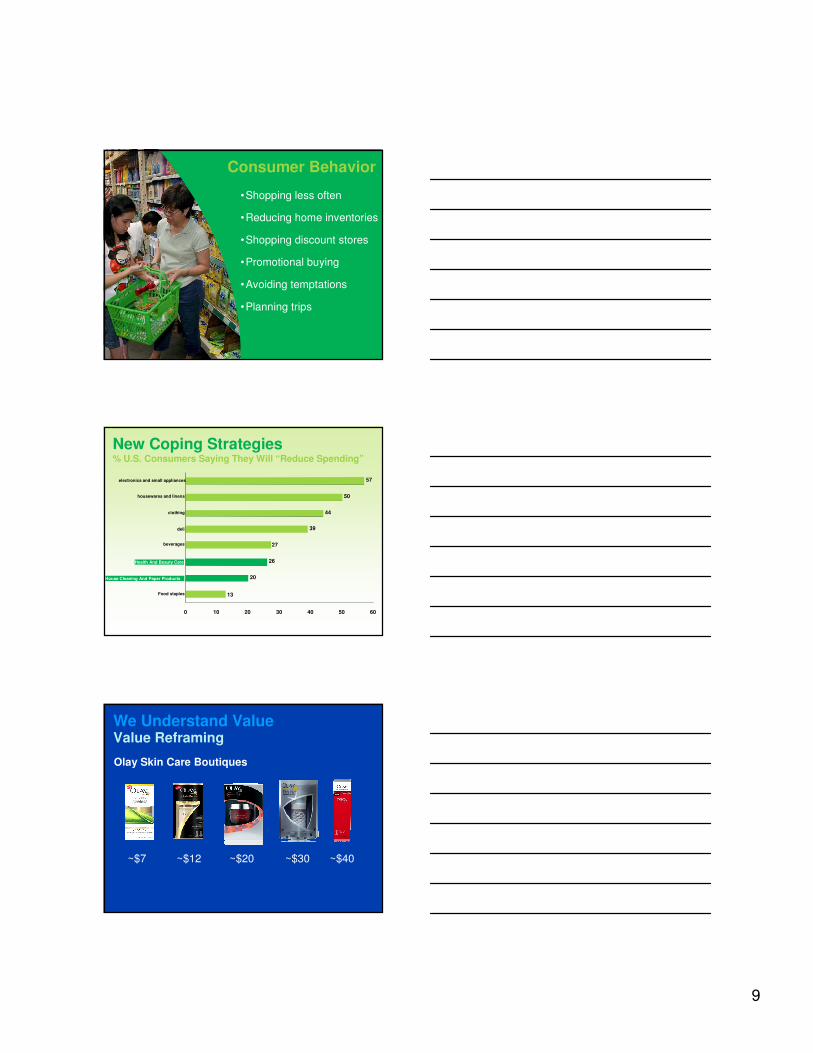
Long-Term Goals
4 to 6%Organic Sales
EPS DoubleDigit
Market GrowthShare Growth/Mix
3 to 4%1 to 2%
SGM
Operating Margin 50 to 75BasisPoints
A.G. Lafley
Chairman &Chief Executive Officer
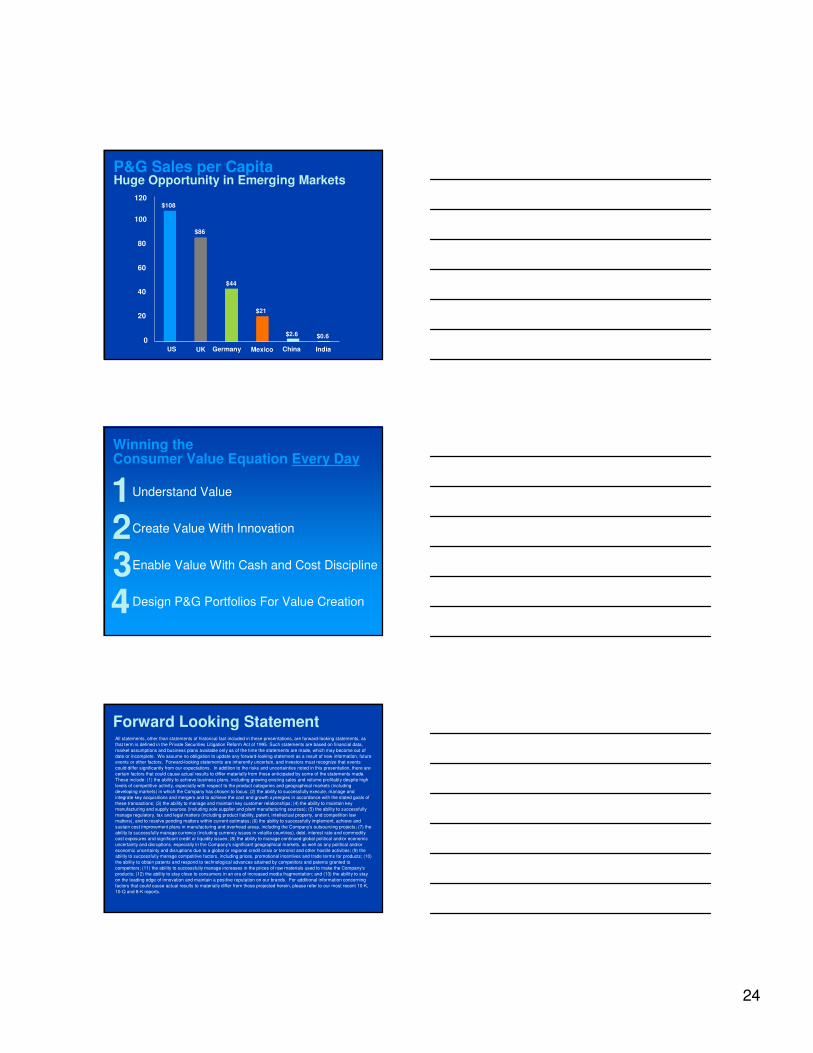
Winning the Consumer Value Equation Every Day
Understand Value
Create Value With Innovation
Enable Value With Cash and Cost Discipline
Design P&G Portfolios For Value Creation
1234
8
We Understand ValueConsumer Understanding
More than $2 billion invested in consumer research since the beginning of the decade
Weighted Purchase Intent
• Tests product,concept & price in acompetitive context
We Understand ValueConsumer Understanding
EquityScan
• Identify key equity/value attributes
• Measure differences versus competitors
• Equity and Value scoresare highly correlated tomarket share
We Understand ValueConsumer Understanding
9
Consumer Behavior
•Shopping less often
•Reducing home inventories
•Shopping discount stores
•Promotional buying
•Avoiding temptations
•Planning trips
New Coping Strategies% U.S. Consumers Saying They Will “Reduce Spending”
13
20
26
27
39
44
50
57
0 10 20 30 40 50 60
Food staples
House Cleaning And Paper Products
Health And Beauty Care
beverages
deli
clothing
housewares and linens
electronics and small appliances
Olay Skin Care Boutiques
~$40~$12 ~$20 ~$30~$7
We Understand ValueValue Reframing

10
• Stimulates growth and prevents commoditization
• Reduces costs, increases productivity and enables sharp pricing
• Differentiates our brands
We Create Value With Innovation
We Create Value With InnovationInnovation Investment
0
500
1000
1500
2000
2500 Spending versus competition
P&G Unilever L'Oreal Henkel KC CP RB Clorox Avon Energizer
Mill
ions

11
Median Scores for Consumer Products in the US from 1980 - 2008
1980-1
1982-3
1984-5
1986-7
1988-9
1990 1991 1992 1993 1994 1995 1996 1997 1998 1999 2000 2001 2002 2003 2004 2005 2006 2007 2008
Purchase Intent
Value Perceptions
Med
ian
Val
ue���������������� �������������������
We Create Value With InnovationPurchase Interest and Value Perceptions of Innovations
We Create Value With Innovation New Products Success Rate
�
�
�
�
�
��
��
��
��
���� ���� ���� ���� ���� ���� ���� ���� ���� ���� ���� ���� ���� ����
���
�
!��"���#������ ����$%����
BASES Success RateMisery Index the sum of the inflation rate and unemployment rate
Denotes Period of Recession in the U.S.
•••••••
• • • • • • •
• • • • • • •• • • • • • •
•••••••
••••••• •••
••••
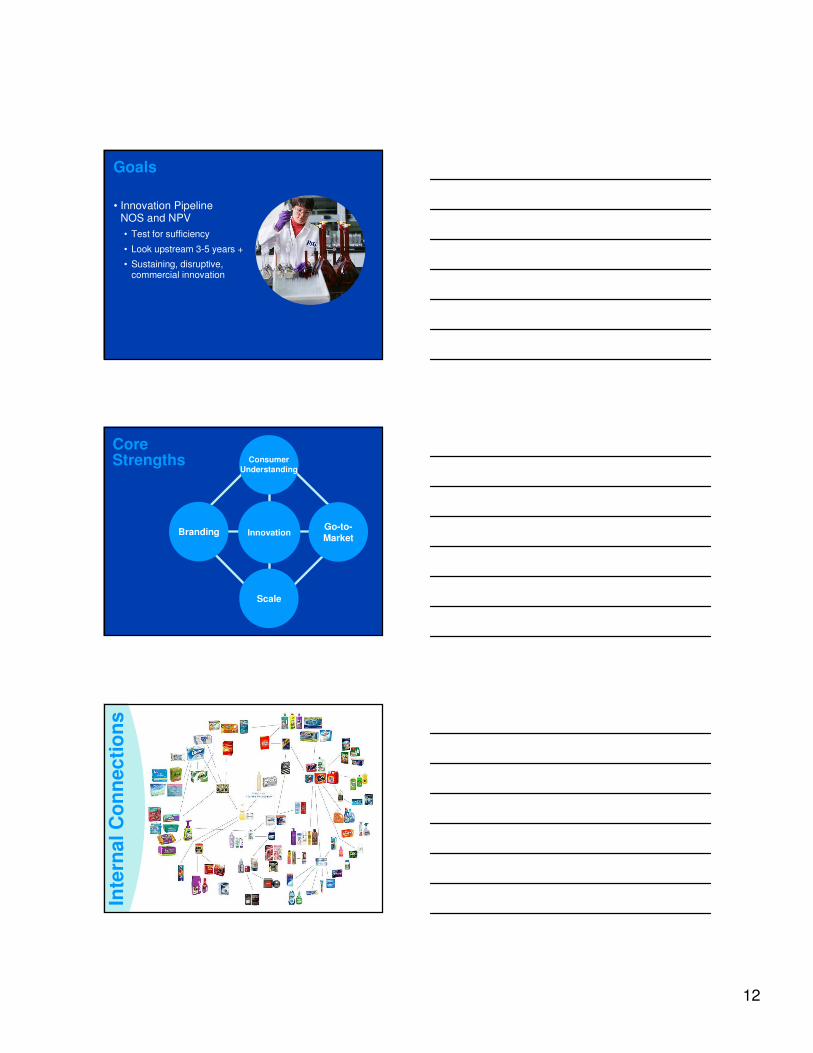
Goals
Strategies
Structure/Systems
Purpose
Strengths
Culture
Leadership
P&
G In
nova
tion
Mod
el
12
Goals
• Innovation Pipeline NOS and NPV• Test for sufficiency
• Look upstream 3-5 years +
• Sustaining, disruptive, commercial innovation
Branding Go-to-Market
ConsumerUnderstanding
Innovation
Scale
Core Strengths
Inte
rnal
Con
nect
ions

13
We Create Value With InnovationTide Total Care
• 60% price premium
• $150MM year 1 sales
• Good Housekeeping Very Innovative Product (VIP) award
• 30% price premium
• 3+% value share• 50% bigger than Green Works
• 33% incremental
We Create Value With Innovation Dawn Hand Renewal
We Create Value With Innovation Always Infinity
• 60% price premium
• 6% value share
• Absorbs 10x its weight
14
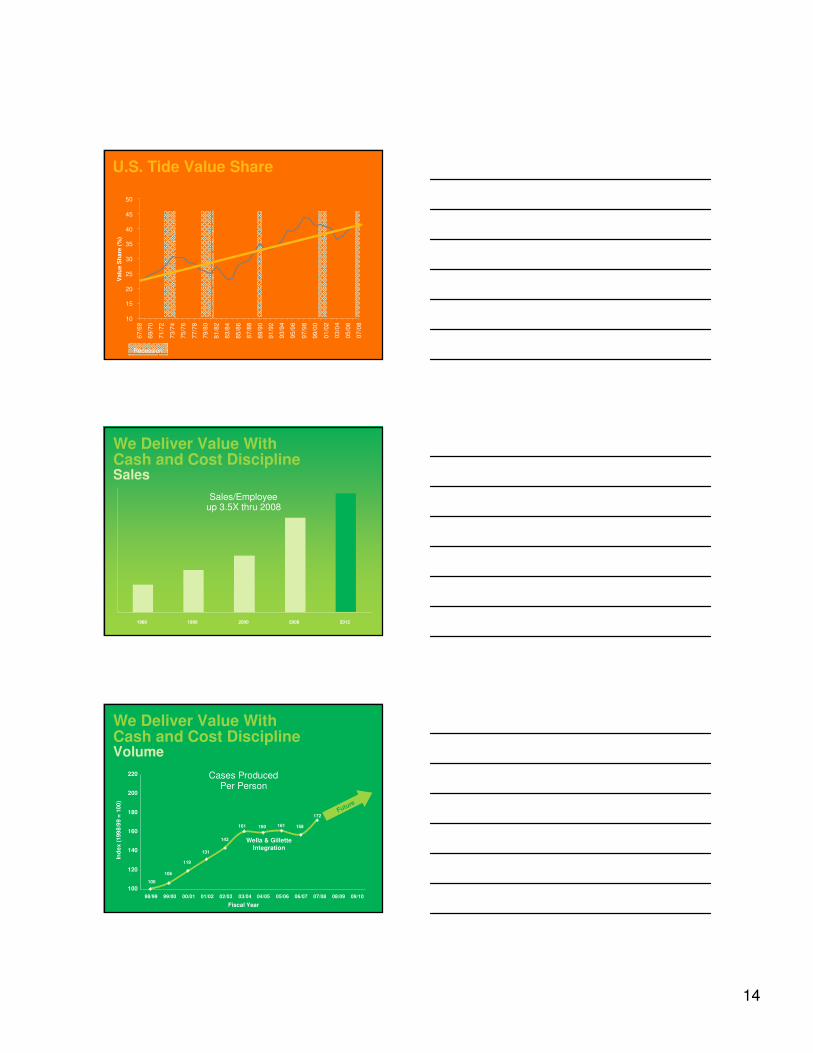
U.S. Tide Value Share
Recession
10
15
20
25
30
35
40
45
50
67/6
8
69/7
0
71/7
2
73/7
4
75/7
6
77/7
8
79/8
0
81/8
2
83/8
4
85/8
6
87/8
8
89/9
0
91/9
2
93/9
4
95/9
6
97/9
8
99/0
0
01/0
2
03/0
4
05/0
6
07/0
8
Val
ue S
hare
(%)
Sales/Employee up 3.5X thru 2008
1980 1990 2000 2008 2012
We Deliver Value With Cash and Cost DisciplineSales
Wella & Gillette Integration
Future
119
160 161 158
100
131
161
172
106
143
100
120
140
160
180
200
220
98/99 99/00 00/01 01/02 02/03 03/04 04/05 05/06 06/07 07/08 08/09 09/10
Fiscal Year
Inde
x (1
998/
99 =
100
)
Cases Produced Per Person
We Deliver Value With Cash and Cost DisciplineVolume

15
Net Earnings/Employee up 8X thru 2008
1980 1990 2000 2008 2012
We Deliver Value With Cash and Cost DisciplineProfit
10.0%
12.0%
14.0%
16.0%
18.0%
20.0%
22.0%
FY '02 FY '03 FY '04 FY '05 FY '06 FY '07 FY '08
We Deliver Value With Cash and Cost DisciplineOperating Margin Trends
Free
Cas
h Fl
ow, $
Bn
$0
$2
$4
$6
$8
$10
$12
$14
FY '03 FY '04 FY '05 FY '06 FY '07 FY '08 FY '09E
We Deliver Value With Cash and Cost DisciplineFree Cash Flow

16
Ongoing Productivity
Simplifying our work, decision-
making and structure
Frees up investment for growth
Frees up capacity for innovation
Connect& Develop
HOG
TravelReduction
Small BrandPortfolio
ExpatReduction
NOG
ReducedHierarchy
Productivity& Cost
Discipline
Modeling &Simulation
AcquisitionSynergies
Multi-CategoryPlants
DistributionCenter
Redesign
Low CostCapital
Locations
ZOG
ModularDesign
End to End Network Planning
Shop in Shop
Plant FacilitySite Services
TransportationTransformation
Partnerships
Productivity Improvement& Cost Discipline
Global Business ServicesCost Savings
•Reduced costs as a % of sales by 1/3rd since 2003•Additional 1/3rd in the next 5 years
$600 Million in Savings
$1 Billion in Savings
17
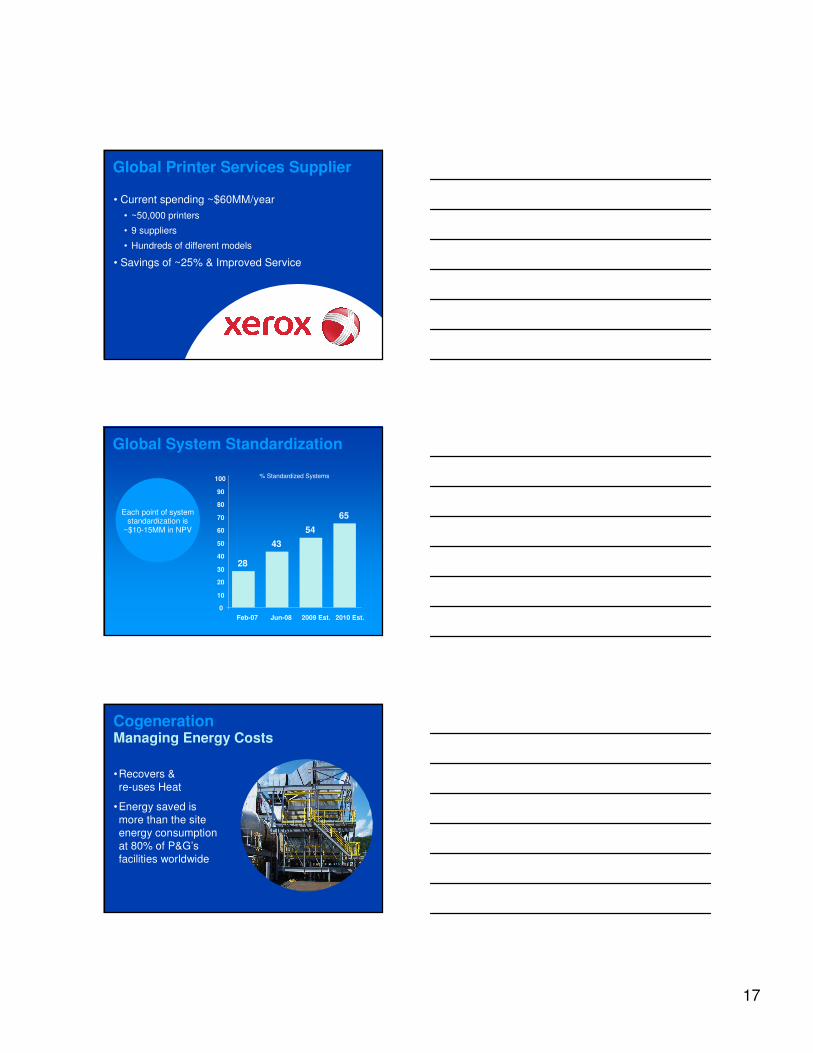
Global Printer Services Supplier
• Current spending ~$60MM/year• ~50,000 printers
• 9 suppliers
• Hundreds of different models
• Savings of ~25% & Improved Service
Each point of systemstandardization is
~$10-15MM in NPV
Global System Standardization
28
43
54
65
0
10
20
30
40
50
60
70
80
90
100
Feb-07 Jun-08 2009 Est. 2010 Est.
% Standardized Systems
•Recovers & re-uses Heat
•Energy saved is more than the site energy consumption at 80% of P&G’s facilities worldwide
CogenerationManaging Energy Costs

18
•Reduce the number of color options by up to 50%
•Potential to save as much as $50MM/year
Color Cost Reduction
Outsourcing• Outsourced talent & music negotiations
• Leverages talent & music across medias
• Direct access to industry experts
• $20MM / year savings
• Broad re-application
Purchasing
Base Tide
We Design P&G Portfolios For Value CreationTiering
65
Tide Total Care
Tide Value Adds
Gain
Cheer
Era
80
90
100
120
160
Pric
e In
dex
19
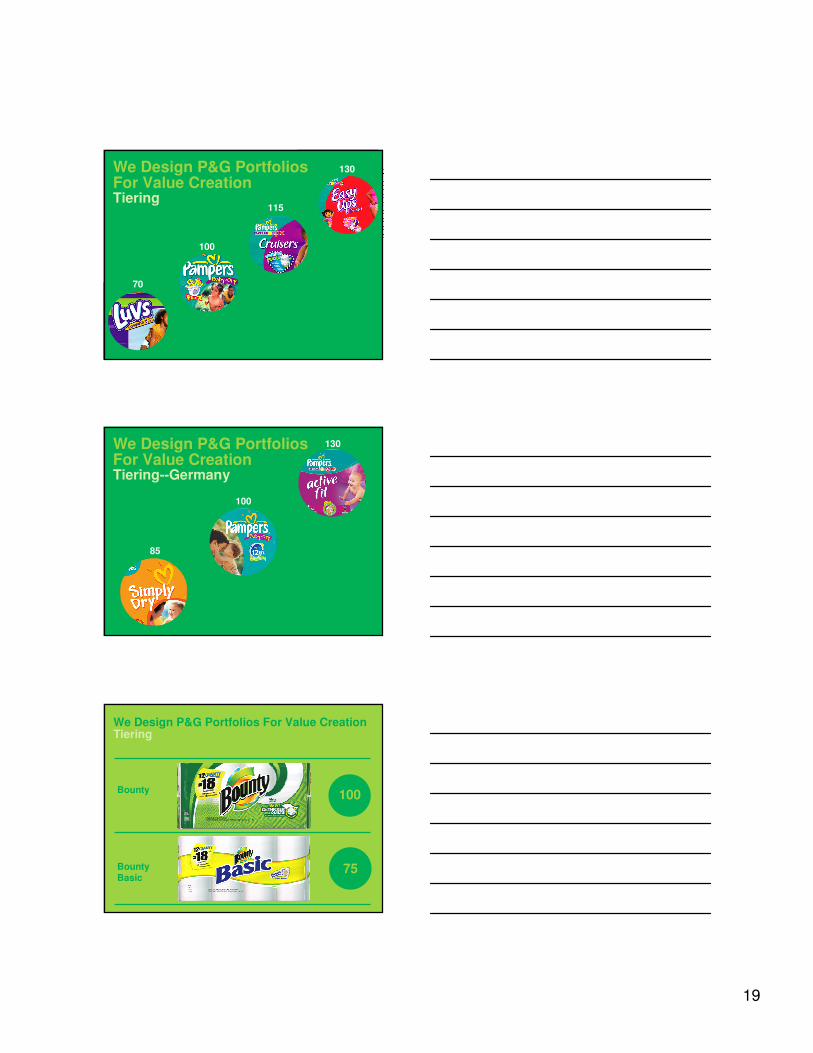
100
70
115
130We Design P&G Portfolios For Value CreationTiering
100
85
130We Design P&G Portfolios For Value CreationTiering--Germany
Bounty Basic
Bounty
75
100
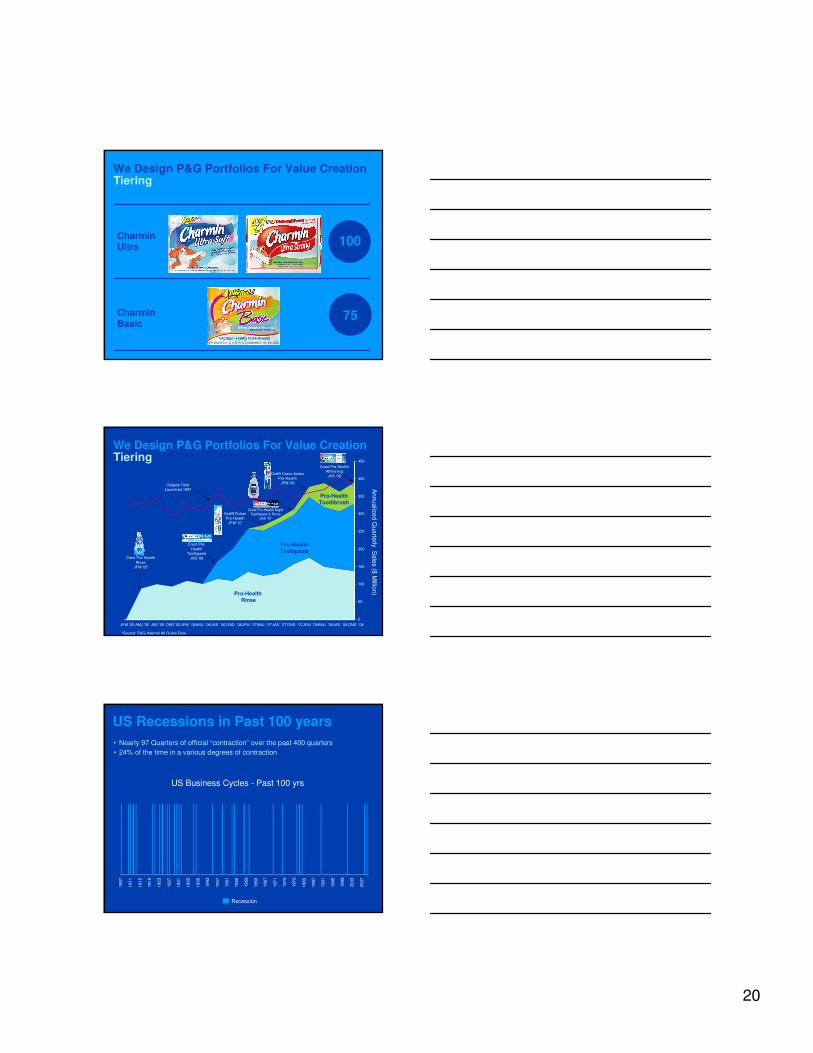
We Design P&G Portfolios For Value CreationTiering
20
CharminBasic
CharminUltra
75
100
We Design P&G Portfolios For Value CreationTiering
JFM '05 AMJ '05 JAS '05 OND '05 JFM '06AMJ '06JAS '06 OND '06JFM '07AMJ '07JAS '07 OND '07JFM '08AMJ '08JAS '08 OND '080
50
100
150
200
250
300
350
400
450
Crest Pro-Health Rinse
JFM ‘05
Crest Pro-Health
ToothpasteJAS ‘06
OralB Pulsar Pro-Health
JFM ’07
Crest Pro-HealthWhiteningJAS ‘08
*Source: P&G Internal All Outlet Data
Annualized Q
uarterly Sales ($ M
illion)
OralB Cross Action Pro-Health
JFM ‘08Colgate TotalLaunched 1997
Crest Pro-Health NightToothpaste & Rinse
JAS ‘07
Pro-HealthRinse
Pro-Health Toothpaste
Pro-Health Toothbrush
We Design P&G Portfolios For Value CreationTiering
US Recessions in Past 100 years• Nearly 97 Quarters of official “contraction” over the past 400 quarters• 24% of the time in a various degrees of contraction
US Business Cycles - Past 100 yrs
1907
1911
1915
1919
1923
1927
1931
1935
1939
1943
1947
1951
1955
1959
1963
1967
1971
1975
1979
1983
1987
1991
1995
1999
2003
2007
Recession

21
P&G Total Shareholder Return: Since Periods Of Contraction
P&G CAGR10.6%
Pre-Depression to today1929 => 2009
P&GCAGR14.4%
P&GCAGR6.8%
Early 80’s Contraction to todayJan 1980 => 2009Vs. S&P 500 return of +7%
Technology Bubble to todayJan 2001 => 2009Vs. S&P 500 decline of -6%
Includes Share appreciation and Dividends thru Feb 13, 2009
P&G Strategies
Growing From The Core: Big Categories, Big Brands, Big Countries
Accelerating Growth in Faster-Growing, Higher Margin Businesses: Beauty, Health and Personal Care
Winning With Low Income Consumers/Winning In Emerging Markets
123
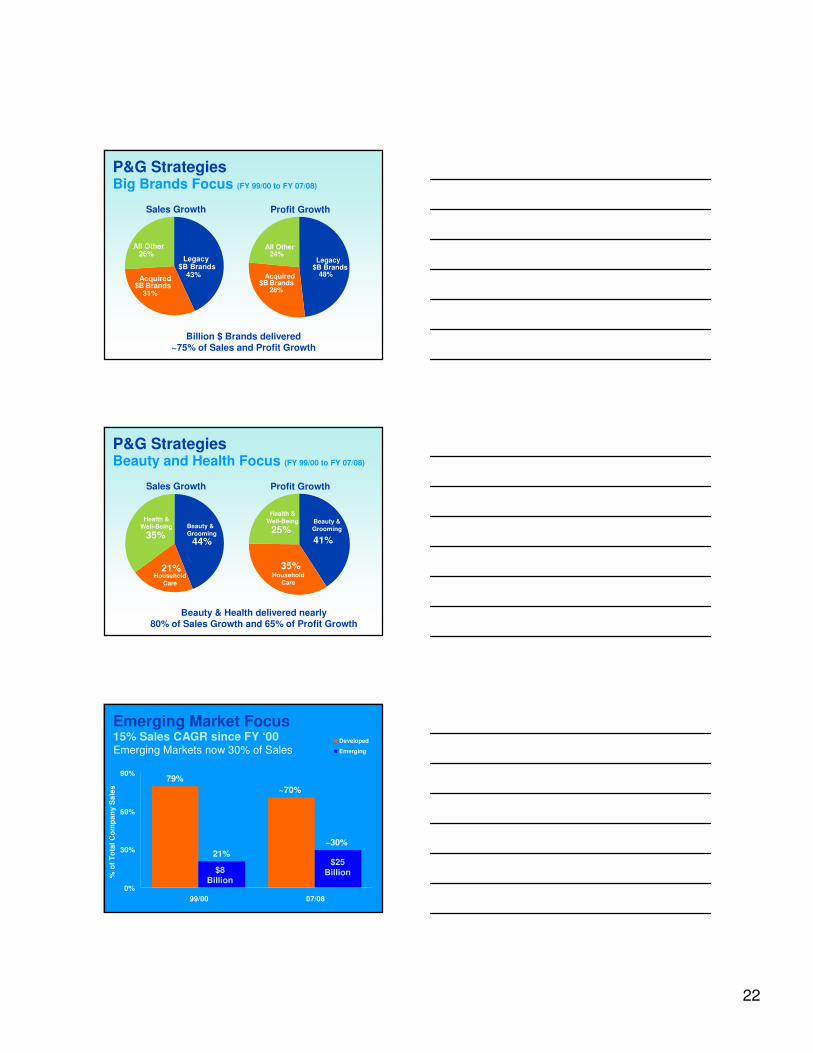
Sales Growth Profit Growth
Largest 6 core P&G Categories: Baby Care, Fabric Care, Family Care, Fem Care, Hair Care, and Home Care
6 Largest businesses delivered ~50% of Sales and Profit Growth
Gillette29%
Other22%
49%
Gillette27%
Other24%
49%
P&G Strategies Core Category Focus (FY 99/00 to FY 07/08)
22
Legacy $B Brands
48%Acquired $B Brands
28%
All Other24%
Billion $ Brands delivered ~75% of Sales and Profit Growth
Acquired Billion $ Brands: Gillette, Mach 3, Fusion , Oral B, Wella, Duracell, and Braun
Legacy $B Brands
43%Acquired $B Brands
31%
All Other26%
P&G Strategies Big Brands Focus (FY 99/00 to FY 07/08)
Sales Growth Profit Growth
Health &Well-Being
HouseholdCare
Beauty & Grooming
Health &Well-Being
HouseholdCare
Beauty & Grooming
41%
35%
25%44%
21%
35%
Beauty & Health delivered nearly 80% of Sales Growth and 65% of Profit Growth
P&G Strategies Beauty and Health Focus (FY 99/00 to FY 07/08)
Sales Growth Profit Growth
Emerging Markets now 30% of Sales
79%~70%
21%~30%
0%
30%
60%
90%
99/00 07/08
% o
f Tot
al C
om
pan
y S
ales
Developed
Emerging
$25Billion$8
Billion
Emerging Markets now 30% of Sales
Emerging Market Focus15% Sales CAGR since FY ‘00

23
Household Care Market Attractiveness• $200 billion global market
• P&G’s global share is 19%• 29% in the countries where we compete
• Huge opportunities for growth
Beauty & GroomingMarket Attractiveness• $250 billion global market
• Highly fragmented market• P&G leading with approximately 12%• L’Oreal just below 12%
• $240 billion global market • Growing 5% to 6% annually• Healthy margin structure• Highly fragmented market
Consumer Health CareMarket Attractiveness
24
P&G Sales per Capita
0
20
40
60
80
100
120
US Germany ChinaUK IndiaMexico
$108
$86
$44
$21
$2.6 $0.6
Huge Opportunity in Emerging Markets
Winning the Consumer Value Equation Every Day
Understand Value
Create Value With Innovation
Enable Value With Cash and Cost Discipline
Design P&G Portfolios For Value Creation
1234
Forward Looking StatementAll statements, other than statements of historical fact included in these presentations, are forward-looking statements, as that term is defined in the Private Securities Litigation Reform Act of 1995. Such statements are based on financial data, market assumptions and business plans available only as of the time the statements are made, which may become out of date or incomplete. We assume no obligation to update any forward-looking statement as a result of new information, future events or other factors. Forward-looking statements are inherently uncertain, and investors must recognize that events could differ significantly from our expectations. In addition to the risks and uncertainties noted in this presentation, there are certain factors that could cause actual results to differ materially from those anticipated by some of the statements made. These include: (1) the ability to achieve business plans, including growing existing sales and volume profitably despite high levels of competitive activity, especially with respect to the product categories and geographical markets (including developing markets) in which the Company has chosen to focus; (2) the ability to successfully execute, manage and integrate key acquisitions and mergers and to achieve the cost and growth synergies in accordance with the stated goals of these transactions; (3) the ability to manage and maintain key customer relationships; (4) the ability to maintain key manufacturing and supply sources (including sole supplier and plant manufacturing sources); (5) the ability to successfully manage regulatory, tax and legal matters (including product liability, patent, intellectual property, and competition law matters), and to resolve pending matters within current estimates; (6) the ability to successfully implement, achieve and sustain cost improvement plans in manufacturing and overhead areas, including the Company's outsourcing projects; (7) the ability to successfully manage currency (including currency issues in volatile countries), debt, interest rate and commodity cost exposures and significant credit or liquidity issues; (8) the ability to manage continued global political and/or economic uncertainty and disruptions, especially in the Company's significant geographical markets, as well as any political and/or economic uncertainty and disruptions due to a global or regional credit crisis or terrorist and other hostile activities; (9) the ability to successfully manage competitive factors, including prices, promotional incentives and trade terms for products; (10) the ability to obtain patents and respond to technological advances attained by competitors and patents granted to competitors; (11) the ability to successfully manage increases in the prices of raw materials used to make the Company's products; (12) the ability to stay close to consumers in an era of increased media fragmentation; and (13) the ability to stay on the leading edge of innovation and maintain a positive reputation on our brands. For additional information concerning factors that could cause actual results to materially differ from those projected herein, please refer to our most recent 10-K, 10-Q and 8-K reports.

25
Regulation G Disclosure
For full reconciliation, visit:www.pg.com/investors