C2 CS Appendix C2 Rail Analysis DSEIR - Port of … · Draft Supplemental EIR C2-4 SCH #2014101050...
67
Appendix C2 Rail Grade Crossing Analysis
Transcript of C2 CS Appendix C2 Rail Analysis DSEIR - Port of … · Draft Supplemental EIR C2-4 SCH #2014101050...

Appendix C2
Rail Grade Crossing Analysis

Berths 97–109 (China Shipping) Container Terminal Draft Supplemental EIR C2-1
SCH #2014101050 June 2017
C2.1 Rail Transportation Setting The Ports of Los Angeles and Long Beach are served by two Class I railroads: Union Pacific Railroad (UP) and the Burlington Northern Santa Fe Railway (BNSF). Pacific Harbor Line, Inc. (PHL) is a rail switching company that is responsible for building the trains that the mainline rail companies will transport outside the Port Complex, and provides rail switching, maintenance, and dispatching services within the harbor area. Rail traffic between the Ports and the railroads’ main lines uses the Alameda Corridor, which was completed in 2002 and eliminated all at-grade road-rail crossings. Those mainlines begin near downtown Los Angeles and head east out of the region through the Inland Empire (San Bernardino and Riverside counties and inland portions of Orange and Los Angeles counties (Figure C2-1).
Between downtown Los Angeles and Colton (near San Bernardino), trains hauling marine containers use the BNSF San Bernardino Subdivision, the UP Los Angeles Subdivision, or the UP Alhambra Subdivision. The UP Los Angeles Subdivision terminates at West Riverside Junction where it joins the BNSF San Bernardino Subdivision. The BNSF San Bernardino Subdivision continues north of Colton Crossing and transitions to the BNSF Cajon Subdivision. The Cajon line continues north to Barstow and Daggett, and then east toward Needles and beyond. UP trains exercise trackage rights over the BNSF Subdivision from West Riverside Junction to San Bernardino and over the Cajon Subdivision from San Bernardino to Daggett, which is a short distance east of Barstow. The BNSF main lines are mostly double-tracked but there are substantial triple-track segments. The UP main lines include both single-track and double-track segments.
The Class I railroads operate several intermodal railyards in the region to handle containers (both marine and domestic) and trailers. BNSF’s facilities are Hobart and Commerce Yards (in the City of Commerce, near downtown Los Angeles), and San Bernardino Yard. The UP’s facilities are East Los Angeles Yard (near downtown Los Angeles), Los Angeles Transportation Center (LATC), City of Industry, and the Intermodal Container Transfer Facility (ICTF) near the south end of the Alameda Corridor.

BD
Berths 97–109 (ChinaDraft Supplemental E
Figure C2-1:
a Shipping) ContainerIR
Southern Ca
r Terminal
alifornia Freight Railroad Line
C2-2
es
SCHH #2014101050June 2017

Berths 97–109 (China Shipping) Container Terminal Draft Supplemental EIR C2-3
SCH #2014101050 June 2017
In March 2013, the Los Angeles Harbor Commission certified the Final EIR and approved the Southern California International Gateway (SCIG) intermodal yard, a near-dock facility that was designed to increase the efficiency and competitiveness of moving containerized cargo through the Ports of Los Angeles and Long Beach. SCIG would initially handle approximately 570,800 TEUs per year, and reach its maximum capacity of 2,800,000 TEUs per year by 2023. The facility would be built and operated by the BNSF on a 185-acre site approximately four miles north of the San Pedro Bay Port Complex. The SCIG project would divert intermodal cargo from BNSF’s Hobart Yard near downtown Los Angeles, thereby eliminating approximately 1,300,000 truck trips annually along a 24-mile stretch of the Long Beach (I-710) Freeway . The project has been the subject of legal challenge since its approval, and it is not clear when, if ever, it will be built.
In December 2007, Union Pacific submitted to the ICTF Joint Powers Authority (ICTF-JPA) an Application for Development Project (ADP) to modernize the ICTF intermodal yard. The proposed modernization would include the construction of additional working rail tracks, the construction of a new gate facility, the improvement of existing gate facilities, and additional parking. The proposed Project would more than double the throughput capacity of the ICTF from 725,000 to 1.5 million containers per year. The project has been delayed indefinitely, and at this point does not have an expected completion date.
Because of the uncertainty concerning the SCIG project and the ICTF expansion project, the rail analysis in this Draft SEIR, considered the rail transportation setting in the future both with and without SCIG intermodal yard and ICTF intermodal yard modernization. These future scenarios would have the same total on-dock and total off-dock direct intermodal demand in TEUs (intact marine containers from/to ports that are not transloaded). However, in the scenario without SCIG project and ICTF modernization project, the off-dock direct intermodal demand would be higher at off-dock intermodal yards in Los Angeles downtown area than in the scenario with SCIG project and ICTF modernization project.
Geographic Study Rail Lines and At-Grade Crossings
The geographic study area for the rail analysis includes those at-grade crossings that could be affected by the Revised Project. The existing and projected increase in rail traffic from the China Shipping Terminal would access all of the railroads’ mainlines; therefore, the geographic study area includes the following five rail mainlines:
BNSF San Bernardino Subdivision from Hobart and Commerce Yards to San Bernardino,
BNSF Cajon Subdivision from San Bernardino to Barstow,
UP Alhambra Subdivision from LATC to Colton Crossing,
UP Los Angeles Subdivision from ELA to West Riverside Junction, and
UP Yuma Subdivision from Colton Crossing to Indio.
BNSF at-grade crossings between Barstow and the Nevada border and UP at-grade crossings between Indio and Arizona border are in rural areas with low traffic volumes (typically less than 5,000 average daily trips) and therefore are not included in the geographic study. Additionally, the Alameda Corridor is used to transport cargo to downtown railyards, which eliminates 200 rail/street crossings within the San Pedro,

Berths 97–109 (China Shipping) Container Terminal Draft Supplemental EIR C2-4
SCH #2014101050 June 2017
Wilmington, Long Beach, and other communities between the Port Complex and downtown Los Angeles.
There are no at-grade crossings on UP Mojave Subdivision between West Colton and Silverwood. The Alameda Corridor eliminated all of the at-grade crossings between the Ports and the intermodal yards on Washington Boulevard in the Cities of Vernon and Commerce (BNSF’s Hobart and Commerce Yards and UP’s ELA). On the UP and BNSF rail lines east of these yards, many railway-roadway grade separations have been constructed, but in 2013 about 170 at-grade crossings remain in the geographic study area: 56 of them are along the BNSF San Bernardino Subdivision, 13 along BNSF Cajon Subdivision, 38 along UP Alhambra Subdivision, 40 along UP Los Angeles Subdivision, and 20 along UP Yuma Subdivision. In the Pomona/Montclair area, the UP Alhambra and Los Angeles Subdivisions are close parallel lines, at-grade crossings are pairwise separated by a distance of a few hundred feet (all under about 500 feet, and most commonly under about 100 feet); which results in additive delays to vehicular traffic on the crossing streets. Thus, this rail analysis evaluated the two lines in this area as 10 effective at-grade crossings on one railroad corridor.
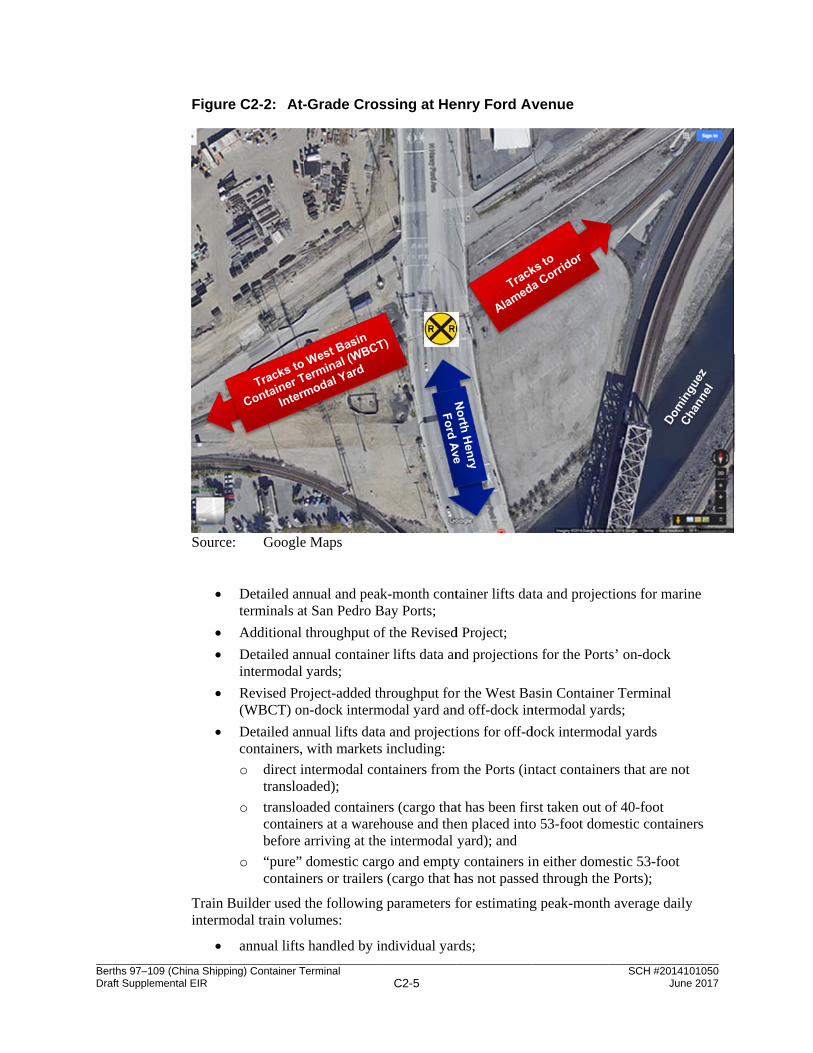
In addition to the at-grade crossings on the five rail mainlines, the rail impacts were also evaluated for an at-grade crossing at Henry Ford Avenue (Figure C2-2). This is a north-south, six-lane roadway extending from Anaheim Street on the north to the Dominguez Channel on the south. The street crosses east-west tracks that provides access to the West Basin of the Port of Los Angeles. The railroad crossing is a single east-west track that provides access to the West Basin Intermodal Container Transfer Facility (WBICTF) intermodal yard of the Port of Los Angeles.
Rail Volumes Estimation Methodology for At-Grade Crossings on Rail Mainlines
Average daily total train volumes under 2014 baseline, 2045 conditions, and those added by the Revised Project were estimated for at-grade crossings on the five rail mainlines. The baseline condition represents the rail transportation demand in 2014. The cumulative condition includes trains added by the Revised Project and growth in all other background trains up to 2045. The rail transportation demand was estimated in three steps as follows:
The number of peak-month average daily intermodal (container) trains by length was estimated for each intermodal yard using a tool called “Train Builder” developed by Cambridge Systematics for the San Pedro Bay Ports.
Train Builder allocated the intermodal trains by intermodal yard to specific segments of track.
The intermodal trains were combined with segment-level volume estimates derived from 2010 data and 2035 projections for average daily non-intermodal freight and passenger trains developed by Dr. Robert Leachman as part of the 2011 Regional Rail Simulation Study for Southern California Association of Governments (SCAG) to estimate average daily total train volumes. These data and projections were also used in the 2013 Port of Los Angeles’ Port Master Plan Update and 2016 SCAG Regional Transportation Plan.
Train Builder used the following data for estimating peak-month average daily intermodal train volumes:
Berths 97–1Draft Supple
09 (China Shippemental EIR
Figur
Source
Train Binterm
ping) Container T
e C2-2: At-
e: Google
Detailed anterminals at
Additional
Detailed anintermodal
Revised Pro(WBCT) on
Detailed ancontainers,
o direct itransloa
o transloacontainbefore
o “pure” contain
Builder used modal train vol
annual lifts
Terminal
-Grade Cros
e Maps
nnual and peakt San Pedro B
throughput o
nnual containeyards;
oject-added thn-dock interm
nnual lifts datawith markets
ntermodal coaded);
aded containeners at a wareharriving at th
domestic carners or trailers
the followinglumes:
handled by i
C2-5
ssing at He
k-month contBay Ports;
f the Revised
er lifts data an
hroughput formodal yard an
a and projectis including:
ontainers from
ers (cargo thahouse and thee intermodal
go and emptys (cargo that h
g parameters f
ndividual yar
enry Ford Av
tainer lifts dat
d Project;
nd projection
r the West Band off-dock in
ions for off-d
m the Ports (in
at has been firen placed intoyard); and
y containers inhas not passed
for estimating
rds;
venue
ta and project
s for the Port
asin Containentermodal yar
dock intermod
ntact containe
rst taken out oo 53-foot dom
n either domed through the
g peak-month
SCH #20141Jun
tions for mari
ts’ on-dock
er Terminal rds;
dal yards
ers that are no
of 40-foot mestic contain
estic 53-foot e Ports);
h average dail
101050ne 2017
ine
ot
ners
ly

Berths 97–109 (China Shipping) Container Terminal Draft Supplemental EIR C2-6
SCH #2014101050 June 2017
marine-terminal-specific lifts-to-TEUs conversion factor;
monthly peaking factor;
average rail car length (depends on the mix of cars that make up the trains);
locomotive length and number per train;
slot utilization (percentage of rail car capacity actually used by containers); for example, since a five-well rail car can carry 10 containers, if only nine containers are loaded onto the car, then the slot utilization is 90 percent;
length distribution of trains both overall and at the intermodal railyard (WBICTF) serving the China Shipping and Yang Ming terminals (percentage of trains, including locomotives, in each of several defined length categories); and
yard-to-rail segment allocation matrix.
For each intermodal yard and each type of market (direct intermodal, transload, pure domestic, and non-intermodal), peak-month average daily trains were estimated. Train volumes were then allocated to specific railroad tracks from downtown Los Angeles to Indio and Barstow. For BNSF, 100 percent of the train volumes were assigned to the BNSF San Bernardino and Cajon Subdivisions. For UP, 50 percent of trains were assigned to the Alhambra Subdivision and 50 percent to the Los Angeles Subdivision. Exceptions to that rule are UP trains loaded at the COI yard, which must use the UP Alhambra Subdivision, and automobile trains loaded at the Mira Loma Yard, which must use the UP Los Angeles Subdivision. UP trains on the Los Angeles Subdivision also use the BNSF San Bernardino Subdivision between West Riverside and Colton Crossing. Beyond the Colton Crossing, it was assumed that 85 percent of the UP trains would use the Yuma Subdivision to the east and 15 percent would use the BNSF Cajon Subdivision to the north between Barstow and Keenbrook. Approximately 10 percent of the UP volumes would use the BNSF Cajon Subdivision between Keenbrook and San Bernardino, and five percent would use the UP Mojave Subdivision between Keenbrook and West Colton.
The increase in the CS Terminal’s direct intermodal trains at intermodal yards between 2014 baseline and 2045 cumulative conditions was used to estimate the Revised Project added trains.
Average daily non-intermodal freight and passenger train volumes under 2014 baseline condition were derived using interpolation between Dr. Leachman’s 2010 data and 2035 projections. Average daily non-intermodal freight and passenger train volumes under 2045 cumulative condition, on the other hand, were assumed to be the same as the 2035 projections.
P.M. peak-hour (4-5 P.M.) rail volumes were required to conduct the rail analysis. The P.M. peak hour passenger train volumes were derived from the average daily Metrolink and Amtrak train volumes using existing actual distribution of Metrolink and Amtrak passenger train schedules over a weekday. The P.M. peak-hour freight train volumes were obtained by uniformly distributing daily total freight trains over 24 hours of the day. To validate the assumption that freight trains are uniformly distributed over 24 hours, actual train volumes by time of day were acquired from the ACTA and the BNSF Railway. Because the actual distributions by time period (Tables C2-1 and C2-2) were reasonably close to the uniform distribution shown in Table C2-3, a uniform distribution of freight train volumes for 2014 baseline condition was considered to be a reasonable assumption. Accordingly, the P.M. peak hourly factor for freight trains was estimated as 16.7 percent divided by 4 (the number of hours in the entire P.M. peak period), that is,

Berths 97–109 (China Shipping) Container Terminal Draft Supplemental EIR C2-7
SCH #2014101050 June 2017
4.2 percent. The hourly factors for passenger and freight trains were kept the same under 2014, 2045 cumulative, and Revised Project conditions.
Table C2-1: Alameda Corridor Train Volume by Time of Day, 2010
Time Period Time of Day Average No. of
Trains per Period* Percent of Total Daily
A.M. Peak Period 6:00 A.M. to 9:00 A.M. 5.0 12.9 percent
Midday 9:00 A.M. to 3:00 P.M. 8.2 21.3 percent
P.M. Peak Period 3:00 P.M. to 7:00 P.M. 5.5 14.4 percent
Night 7:00 P.M. to 6:00 A.M. 19.9 51.5 percent
Total Daily 38.6 100.0 percent
Source: ACTA, 2010 (*Daily average for last week of each quarter in 2010)
Table C2-2: BNSF Train Volume at Highgrove in Riverside County by Time of Day, 2010
Time Period Time of Day Average No. of
Trains per Period* Percent of Total Daily
A.M. Peak Period 6:00 A.M. to 9:00 A.M. 10 14.1 percent
Midday 9:00 A.M. to 3:00 P.M. 16 22.2 percent
P.M. Peak Period 3:00 P.M. to 7:00 P.M. 10 14.3 percent
Night 7:00 P.M. to 6:00 A.M. 35 49.4 percent
Total Daily 71 100.0 percent
Source: BNSF, 2011 (*Measured over 62 days, July 1-31, 2008 and August 1-31, 2010)
Table C2-3: Time Periods of the Day
Time Period Time of Day No. of Hours Percent of 24 Hours
(Uniform Distribution)
A.M. Peak Period 6:00 A.M. to 9:00 A.M. 3 12.5 percent
Midday 9:00 A.M. to 3:00 P.M. 6 25.0 percent
P.M. Peak Period 3:00 P.M. to 7:00 P.M. 4 16.7 percent
Night 7:00 P.M. to 6:00 A.M. 7 45.8 percent
Total Daily 24 100.0 percent
This study includes two separate analyses. In the first, the effects of the Revised Project’s trains on traffic delay is considered by comparing conditions in 2014 without the Revised Project (the 2014 Baseline) to conditions in 2014 with the Revised Project, and then comparing conditions in 2045 with the Revised Project to the 2014 Baseline. This is the analysis required by CEQA.
In the second analysis, the effects of the Revised Project are evaluated by examining the future (2045) condition with and without the Revised Project. In this second analysis, the basis for comparison is the Future Baseline, which consists of the conditions in 2045 with the cumulative effects of forecasted growth in population and vehicular and train traffic, and probable infrastructure improvements (grade separations, additional rail lines, etc.). The Future Baseline is then compared to 2045 conditions with the Revised Project added; i.e., with the additional trains generated by the Revised Project, including its increased throughput relative to the Approved Project.

Berths 97–109 (China Shipping) Container Terminal Draft Supplemental EIR C2-8
SCH #2014101050 June 2017
Rail Volumes Estimation Methodology for Henry Ford Avenue At-Grade Crossing
2014 Baseline: The average total train blockage time in the P.M. peak hour (4-5 P.M.) was estimated as 4.3 minutes using six weeks (May 1-June 17, 2016) of crossing controller data. This information was combined with an average train length assumption of 3,100 feet to estimate P.M. peak-hour train volumes under 2014 baseline conditions.
Future (2045 Cumulative) Baseline: The average total train blockage time in the P.M. peak hour was estimated as 7.7 minutes, based on a simulation projection of the rail system under 2045 conditions. This was combined with an average train length assumption of about 4,400 feet to estimate P.M. peak-hour train volumes under 2045 cumulative conditions.
The trains added by the Revised Project at the Henry Ford Avenue at-grade crossing were estimated using a very similar methodology to that for at-grade crossings on the five rail mainlines. However, there are a few differences. Based on empirical evidence collected by the Port of Los Angeles, UP’s ICTF intermodal yard located near the Port was assumed to “cut” full length (8,831 feet in the 2014 baseline condition, 9,985 feet in the 2045 cumulative condition) on-dock direct intermodal trains moving south into the WBICTF, as well as UP’s westbound on-dock direct intermodal trains, into shorter length (2,000 feet) trains. This activity increases train volumes at the Henry Ford Avenue at-grade crossing above that seen on the five rail mainlines. In addition, there are no off-dock intermodal trains crossing Henry Ford Avenue as all off-dock intermodal yards are located north of this at-grade crossing. Finally, the train numbers added by the Revised Project in the P.M. peak hour were estimated from the daily total rail volume estimate using the crossing controller data, which indicated that the peak hour rail volume formed 5.8 percent of the daily total rail volume. In other words, uniform distribution of rail volumes over a day was not assumed.
Roadway Volumes Estimation Methodology for At-Grade Crossings on Rail Mainlines
San Pedro Bay Ports collected average daily total vehicular traffic volumes for at-grade crossing streets on the five rail mainlines over a wide period of time, 2000 to 2013. To project average daily traffic volumes under 2014 baseline and 2045 cumulative conditions, the ports also identified annualized growth rates.
For traffic data belonging to the period 2000-2008, an average annualized growth rate of 1.0 percent based on California Public Utilities Commission (CPUC) data was applied to estimate at-grade crossing roadway traffic in 2008. For traffic data on or after 2008 and for 2008 traffic estimates, average annualized growth rates by rail subdivision and by county (Table C2-4) were used to project at-grade crossing roadway traffic under 2014 baseline condition and up to 2035. For the period 2035-2045, a nominal average annualized growth rate of 1.0 percent was assumed and applied to 2035 traffic estimates to project at-grade crossing roadway traffic under 2045 cumulative condition.

Berths 97–109 (China Shipping) Container Terminal Draft Supplemental EIR C2-9
SCH #2014101050 June 2017
Table C2-4: Annualized Growth Rates for At-Grade Crossing Roadway Traffic by Rail Subdivision and County, 2008-2035
Rail Subdivision County Annualized Growth Rate for At-Grade Crossing
Roadway Traffic
BNSF Cajon San Bernardino 1.31%
BNSF San Bernardino San Bernardino 1.76%
Riverside 1.38%
Orange 0.41%
Los Angeles 0.32%
UP Los Angeles San Bernardino 1.43%
Riverside 1.48%
Los Angeles 0.53%
UP Alhambra San Bernardino 1.29%
Los Angeles 0.55%
UP Yuma Riverside 1.95%
Source: 2008 SCAG Regional Transportation Plan.
Time-of-day shares of daily total traffic volumes by county were estimated using an average of traffic counts and traffic volume forecasts by county in the 2008 SCAG regional transportation plan (RTP). The time-of-day shares by county were then divided by number of hours in each time period to estimate hourly factors by county (Table C2-5). The hourly factors for roadway volumes were kept the same under 2014 and 2045 cumulative conditions.
Table C2-5: Hourly Factors Applied to Average Daily Traffic (ADT), by County
Time Period Time of Day San
Bernardino County
Riverside County
Orange County
Los Angeles County
A.M. Peak Period 6:00 A.M. to 9:00 A.M. 0.0687 0.0661 0.0693 0.0686
Midday 9:00 A.M. to 3:00 P.M. 0.0450 0.0492 0.0461 0.0462
P.M. Peak Period 3:00 P.M. to 7:00 P.M. 0.1054 0.0873 0.0929 0.0945
Night 7:00 P.M. to 6:00 A.M. 0.0093 0.0143 0.0131 0.0126
Source: 2008 SCAG Regional Transportation Plan.
Roadway Volumes Estimation Methodology for Henry Ford Avenue At-Grade Crossing
For Henry Ford Avenue at-grade crossing, the PortTAM travel demand model assignment outputs were used to collect P.M. period (3-7 P.M.) total traffic volumes under 2014 baseline condition and 2045 cumulative condition. The assignment outputs were converted to P.M. peak hour (4-5 P.M.) total traffic volumes under 2014 baseline condition and 2045 cumulative condition, by distributing the peak period traffic volumes uniformly over the four-hour time period, that is dividing the assignment outputs by four.

Berths 97–109 (China Shipping) Container Terminal Draft Supplemental EIR C2-10
SCH #2014101050 June 2017
Intermodal TEUs and Rail Volumes From the China Shipping Terminal In the 2014 Baseline
Direct intermodal containers to and from the CS Terminal in 2014 amounted to 263,712 TEUs, of which 207,998 TEUs were handled at the on-dock intermodal yard facility and 55,714 TEUs were handled at the off-dock intermodal yard facilities. The peak-month average daily rail volume at this yard from the CS Terminal in 2014 was estimated as 1.8 trains, which includes 0.9 8,831-foot (full-length) trains and 0.8 2,000-foot (cut) trains. North of the ICTF intermodal yard, all on-dock trains were full-length trains, and their peak month average daily rail volume in 2014 was estimated as 1.1 trains.
The off-dock direct intermodal peak month average daily rail volume relating to China Shipping Terminal in 2014 was estimated as 0.35 trains, which includes 0.11 10,000-foot trains, 0.14 8,000-foot trains and 0.11 6,000-foot trains.
Intermodal TEUs and Rail Volumes Added By the Revised Project in 2045
As a result of the Revised Project, direct intermodal containers to and from the CS Terminal would increase by 296,794 TEUs over the 2014 baseline condition to become 560,506 TEUs by 2045. Of that total, 433,016 TEUs would be handled at the on-dock intermodal yard facility and 127,490 TEUs would be handled at the off-dock intermodal yard facilities. The growth in on-dock direct intermodal demand is supported by the expansion and modernization of the WBICTF intermodal yard proposed as part of a separate project (Berths 121-136 [Yang Ming] Container Terminal Improvements Project). The yard expansion would also enable longer trains to be built, so that the length of a full train would increase from 8,831 feet to 9,985 feet.
The peak month average daily rail volume from the Revised Project at the WBICTF in 2045 was estimated as 3.9 trains, which includes 1.6 9,985-foot (full) trains and 2.3 2,000-foot (cut) trains. North of the ICTF intermodal yard, all on-dock trains would be full-length trains, and their peak month average daily rail volume in 2045 was estimated as 2.1 trains.
The off-dock direct intermodal peak month average daily rail volume generated by the China Shipping Terminal in 2045 under without SCIG project and ICTF modernization project scenario was estimated as 0.74 trains, which includes 0.24 10,000-foot trains and 0.50 8,000-foot trains. With the SCIG and ICTF modernization projects, the corresponding rail volume in 2045 was estimated as 0.77 trains, which includes 0.13 10,000-foot trains and 0.64 8,000-foot trains.
At the Henry Ford Avenue at-grade crossing, located south of the ICTF intermodal yard, the Revised Project would add 2.1 trains, which includes increases of 1.57 9,985-foot long trains and 1.50 2,000-foot long trains, and a decrease of 0.92 8,831-foot long trains.
North of the ICTF intermodal yard, the Revised Project under without SCIG project and ICTF modernization project scenario was estimated to add 1.4 trains, which includes increases of 0.14 10,000-foot trains, 2.10 9,985-foot trains and 0.35 8,000-foot trains, and decreases of 1.14 8,831-foot trains and 0.11 6,000-foot trains. The Revised Project under with SCIG project and ICTF modernization project scenario was estimated to add 1.4 trains, which includes increases of 0.02 10,000-foot trains, 2.10 9,985-foot trains and 0.50 8,000-foot trains, and decreases of 1.14 8,831-foot trains and 0.11 6,000-foot trains.
The reason for the differences in train volumes under with and without SCIG project and ICTF modernization project scenarios is that the maximum train length at the SCIG

Berths 97–109 (China Shipping) Container Terminal Draft Supplemental EIR C2-11
SCH #2014101050 June 2017
facility would be 8,000 feet while other off-dock intermodal yards (including ICTF intermodal yard) can handle longer (10,000-foot) trains. To transport a fixed amount of cargo, the number of trains that would be generated/received at the SCIG intermodal yard would be somewhat higher than at other off-dock intermodal yards.
The SCIG and ICTF projects would result in a shift of off-dock direct intermodal container lifts from the downtown railyards to SCIG and ICTF. However, this shift would not result in any changes in train volumes at at-grade crossings, as the majority of the study at-grade crossings are located east of downtown Los Angeles, and the Henry Ford Avenue crossing is located south of the ICTF. Hence, the rail volumes for at-grade crossings on UP rail mainlines and at the Henry Ford Avenue crossing are the same under both scenarios.
Year 2014 Baseline Total Intermodal TEUs and Rail Volume Results
In 2014, total direct intermodal containers to and from the marine terminals in the San Pedro Bay ports amounted to 5,557,738 TEUs, of which 4,085,067 TEUs were handled at the on-dock intermodal yard facilities and 1,472,671 TEUs were handled at the off-dock intermodal yard facilities. The off-dock intermodal yard facilities also handled 2,106,819 TEUs of transloaded intermodal containers and 3,410,929 TEUs of “pure domestic” intermodal containers in 2014.
North of the ICTF, the total on-dock intermodal peak month average daily rail volume in 2014 was estimated as 25.5 trains, which includes 7.0 10,000-foot trains, 2.2 8,831-foot trains, 9.3 8,000-foot trains and 7.0 6,000-foot trains. The total off-dock direct intermodal peak month average daily rail volume in 2014 was estimated as 40.3 trains, which includes 11.2 10,000-foot trains, 20.9 8,000-foot trains and 8.2 6,000-foot trains. The total of 40.3 trains includes 9.3 direct intermodal, 9.9 transloaded intermodal and 21.0 “pure domestic” intermodal trains.
Year 2045 Cumulative Total Intermodal TEUs and Rail Volume Results
In 2045, direct intermodal containers to and from the terminal is forecasted at 11,621,610 TEUs by 2045, of which 9,154,058 TEUs would be handled at the on-dock intermodal yard facilities and 2,467,552 TEUs would be handled at the off-dock intermodal yard facilities. The off-dock intermodal yard facilities would also handle 5,266,179 TEUs of transloaded intermodal containers and 7,541,581 TEUs of “pure domestic” intermodal containers in 2045.
North of the ICTF intermodal yard, the total on-dock intermodal peak month average daily rail volume in 2045 was estimated as 25.5 trains, which includes 7.0 10,000-foot trains, 2.2 8,831-foot trains, 9.3 8,000-foot trains and 7.0 6,000-foot trains. The total off-dock direct intermodal peak month average daily rail volume in 2045 under without SCIG project and ICTF modernization project scenario was estimated as 68.4 trains, which includes 12.6 12,000-foot trains, 22.6 10,000-foot trains and 33.2 8,000-foot trains. The total of 68.4 trains includes 14.3 direct intermodal, 18.7 transloaded intermodal and 35.3 “pure domestic” intermodal trains. With the SCIG and ICTF projects, the total off-dock direct intermodal peak month average daily rail volume in 2045 was estimated as 68.9 trains, which includes 12.6 12,000-foot trains, 20.3 10,000-foot trains and 36.1 8,000-foot trains. The total of 68.9 trains includes 14.9 direct intermodal, 18.7 transloaded intermodal and 35.3 “pure domestic” intermodal trains.

Berths 97–109 (China Shipping) Container Terminal Draft Supplemental EIR C2-12
SCH #2014101050 June 2017
As mentioned above, although the SCIG and ICTF projects would cause off-dock direct intermodal container lifts to shift from the downtown Los Angeles railyards to SCIG and ICTF, that shift would not result in any changes in train volumes at at-grade crossings.
Year 2014 Baseline and Year 2045 Cumulative At-Grade Crossing Rail and Roadway Volumes and Revised Project-Added Rail Volumes China Shipping Terminal related on-dock and off-dock direct intermodal trains along with all of the background intermodal trains were allocated to specific segments of tracks using “Train Builder” and combined with non-intermodal freight and passenger trains. Tables C2-6 through C2-11 show the estimates of average daily train volumes and average daily traffic volumes at study at-grade crossings on the five rail mainlines under 2014 baseline, 2045 cumulative and Revised Project conditions.
Table C2-12 shows P.M. peak-hour train and traffic volumes at the Henry Ford Avenue at-grade crossing under 2014 baseline, 2045 cumulative, and Revised Project conditions.
C2.2 Rail Analysis Methodology Rail impacts of the Revised Project were assessed by quantifying differences in vehicular delays due to at-grade crossings between baseline conditions and baseline conditions plus the Revised Project.
The LAHD has developed a standard methodology for evaluating potential transportation impacts of port development projects on existing at-grade railroad crossings. Specifically, cargo terminal or intermodal yard projects potentially generate additional freight train movements that could result in additional “gate down” time and motorist delays at existing at-grade crossings.
Peak Hour Average Vehicular Delay Calculation Methodology Impacts of the Revised Project were analyzed in terms of average vehicle delay at the study area at-grade crossings in the P.M. peak commute hour of 4-5 P.M. Average vehicle delay is calculated by dividing the total vehicle delay caused by trains passing a crossing during the P.M. peak hour by the number of vehicles passing the at-grade crossing in that hour. This is a universally accepted approach for evaluating vehicle delay at signalized intersections consistent with methodologies contained in the 2010 HCM. At-grade crossings operate similarly to traditional signalized intersections, where some vehicles experience no delay (during a green phase or when the gate is up) and others are stopped for a certain period of time (during a red phase or when a train is crossing). While different approaches could be considered, the LOS procedures for signalized intersections were identified as the most logical and consistent approach for assessing the significance of average vehicle delays at at-grade crossings.
Per the 2010 HCM, LOS D includes delays of up to 55 seconds. LOS D is an acceptable LOS at signalized intersections in most urban areas in the Southern California region. Anything exceeding this threshold is generally considered unacceptable. LOS is measured using P.M. peak hour average vehicle delay (PHAVD). PHAVD is based on the train and vehicular volumes and calculated using the following data:
P.M. peak hour vehicle arrival and departure rates (vehicles per minute per lane);
gate down time (function of speed and length of train, width of intersection, clearance distance, and lead and lag times of gate operation); and
total number of vehicles arriving per period.

Berths 97–109 (China Shipping) Container Terminal Draft Supplemental EIR C2-13
SCH #2014101050 June 2017
Table C2-6: BNSF San Bernardino Subdivision, from Hobart Yard to San Bernardino, Rail and Roadway Average Daily Volumes for Study At-Grade Crossings, 2014 Baseline, 2045 Cumulative, and Revised Project
Boundary/Junction – Street
# of Lanes
2014 Baseline Average Daily
Traffic (Vehicles/Day)
2014 Baseline Average Daily
Trains (Trains/Day)
2045 Cumulative
Average Daily Traffic
(Vehicles/Day)
2045 Cumulative
Average Daily Trains
(Trains/Day) Without SCIG
and ICTF
2045 Cumulative
Average Daily Trains
(Trains/Day) With SCIG and
ICTF
RevisedProject Added Average Daily
Trains (Trains/Day)
Without SCIG and ICTF
RevisedProject Added Average Daily
Trains (Trains/Day)
With SCIG and ICTF
San Bernardino MP 0.0 Laurel Street 2 2,340 60.3 3,730 109.4 110.0 0.6 0.7 Olive Street 2 2,790 60.3 4,440 109.4 110.0 0.6 0.7 E Street 2 730 60.3 1,170 109.4 110.0 0.6 0.7 H Street 2 1,470 60.3 2,330 109.4 110.0 0.6 0.7 Valley Boulevard 2 11,000 60.3 17,510 109.4 110.0 0.6 0.7
Colton Crossing MP 3.2 Highgrove Junction MP 6.1 (Connection to Perris via MetroLink)
Main Street 2 2,680 70.2 4,260 161.0 161.6 1.0 1.0 Riverside-San Bernardino County Line MP 6.41
Center Street 4 6,360 70.2 9,360 161.0 161.6 1.0 1.0 Iowa Avenue 4 23,440 70.2 34,500 161.0 161.6 1.0 1.0 Palmyrita Avenue 2 3,840 70.2 5,650 161.0 161.6 1.0 1.0 Chicago Avenue 4 13,880 70.2 20,430 161.0 161.6 1.0 1.0 Spruce Street 4 7,410 70.2 10,910 161.0 161.6 1.0 1.0 3rd Street 4 11,160 70.2 16,420 161.0 161.6 1.0 1.0 Mission Inn (7th Street) 4 5,460 70.2 8,030 161.0 161.6 1.0 1.0
Riverside Yard and Amtrak Station MP 10.02-10.16
Cridge Street 2 3,850 99.1 5,670 173.0 173.6 1.0 1.0 West Riverside Junction MP 10.6 (Connection to UP Los Angeles Sub)
Jane Street 2 2,210 65.3 3,260 118.9 119.5 0.6 0.6 Mary Street 4 12,220 65.3 17,990 118.9 119.5 0.6 0.6 Washington Street 2 8,490 65.3 12,490 118.9 119.5 0.6 0.6 Madison Street 4 16,090 65.3 23,670 118.9 119.5 0.6 0.6 Jefferson Street 2 8,390 65.3 12,350 118.9 119.5 0.6 0.6 Adams Street 4 17,920 65.3 26,370 118.9 119.5 0.6 0.6 Jackson Street 4 8,000 65.3 11,770 118.9 119.5 0.6 0.6

Berths 97–109 (China Shipping) Container Terminal Draft Supplemental EIR C2-14
SCH #2014101050 June 2017
Boundary/Junction – Street
# of Lanes
2014 Baseline Average Daily
Traffic (Vehicles/Day)
2014 Baseline Average Daily
Trains (Trains/Day)
2045 Cumulative
Average Daily Traffic
(Vehicles/Day)
2045 Cumulative
Average Daily Trains
(Trains/Day) Without SCIG
and ICTF
2045 Cumulative
Average Daily Trains
(Trains/Day) With SCIG and
ICTF
RevisedProject Added Average Daily
Trains (Trains/Day)
Without SCIG and ICTF
RevisedProject Added Average Daily
Trains (Trains/Day)
With SCIG and ICTF
Gibson Street 2 870 65.3 1,280 118.9 119.5 0.6 0.6 Harrison Street 2 6,820 65.3 10,030 118.9 119.5 0.6 0.6 Tyler Street 4 15,990 65.3 23,530 118.9 119.5 0.6 0.6 Pierce Street 2 11,440 65.3 16,840 118.9 119.5 0.6 0.6 Buchanan Street 2 9,790 65.3 14,410 118.9 119.5 0.6 0.6 Magnolia Avenue(eastbound)
2 9,000 65.3 13,240 118.9 119.5 0.6 0.6
Magnolia Avenue(westbound)
2 9,000 65.3 13,240 118.9 119.5 0.6 0.6
Mckinley Street 4 27,270 65.3 40,120 118.9 119.5 0.6 0.6 Radio Road 2 4,410 65.3 6,480 118.9 119.5 0.6 0.6 Joy Street 2 7,450 65.3 10,960 118.9 119.5 0.6 0.6 Sheridan Street 2 2,420 65.3 3,560 118.9 119.5 0.6 0.6 Cota Street 4 6,180 65.3 9,090 118.9 119.5 0.6 0.6 Railroad Street 4 9,900 65.3 14,570 118.9 119.5 0.6 0.6 Smith Street 4 14,010 65.3 20,620 118.9 119.5 0.6 0.6 Auto Center Drive 2 11,840 65.3 17,430 118.9 119.5 0.6 0.6
Riverside-Orange County Line
Kellogg Drive 4 6,900 65.3 8,300 118.9 119.5 0.6 0.6 Lakeview Avenue 3 18,940 65.3 22,780 118.9 119.5 0.6 0.6 Richfield Road 4 9,510 65.3 11,440 118.9 119.5 0.6 0.6
Atwood Junction MP 40.6 (Connection to Old Olive Sub)
Van Buren Street 2 6,790 47.4 8,170 89.9 90.5 0.6 0.6 Jefferson Street 3 6,370 47.4 7,670 89.9 90.5 0.6 0.6 Tustin Avenue (Rose Drive)
4 29,290 47.4 35,230 89.9 90.5 0.6 0.6
Orangethorpe Avenue 4 28,440 47.4 34,210 89.9 90.5 0.6 0.6 Kraemer Boulevard 4 19,860 47.4 23,890 89.9 90.5 0.6 0.6 Placentia Avenue 4 14,550 47.4 17,510 89.9 90.5 0.6 0.6 State College Boulevard 4 23,670 47.4 28,480 89.9 90.5 0.6 0.6 Acacia Avenue 4 6,760 47.4 8,140 89.9 90.5 0.6 0.6 Raymond Avenue 4 21,110 47.4 25,390 89.9 90.5 0.6 0.6

Berths 97–109 (China Shipping) Container Terminal Draft Supplemental EIR C2-15
SCH #2014101050 June 2017
Boundary/Junction – Street
# of Lanes
2014 Baseline Average Daily
Traffic (Vehicles/Day)
2014 Baseline Average Daily
Trains (Trains/Day)
2045 Cumulative
Average Daily Traffic
(Vehicles/Day)
2045 Cumulative
Average Daily Trains
(Trains/Day) Without SCIG
and ICTF
2045 Cumulative
Average Daily Trains
(Trains/Day) With SCIG and
ICTF
RevisedProject Added Average Daily
Trains (Trains/Day)
Without SCIG and ICTF
RevisedProject Added Average Daily
Trains (Trains/Day)
With SCIG and ICTF
Fullerton Junction MP 45.5 = MP 165.5
Orange-LA County Line Valley View Avenue 4 24,230 92.4 28,610 144.9 145.5 0.6 0.6 Rosecrans/Marquardt Avenue
4 22,890 92.4 27,020 144.9 145.5 0.6 0.6
Lakeland Road 2 6,450 92.4 7,610 144.9 145.5 0.6 0.6 Los Nietos Road 4 20,200 92.4 23,840 144.9 145.5 0.6 0.6 Norwalk Boulevard 4 25,890 92.4 30,550 144.9 145.5 0.6 0.6 Pioneer Boulevard 4 15,100 92.4 17,830 144.9 145.5 0.6 0.6 Passons Boulevard 4 12,530 92.4 14,780 144.9 145.5 0.6 0.6 Serapis Avenue 2 6,190 92.4 7,300 144.9 145.5 0.6 0.6
Commerce Yard MP 148.5 Hobart Yard MP 146.0 Source: San Pedro Bay Ports “Train Builder” model for intermodal trains estimation; SCAG’s non-intermodal freight and passenger train data and projections; and San Pedro
Bay Ports compiled vehicular traffic data and projections.
Table C2-7: BNSF Cajon Subdivision from San Bernardino to Barstow, Rail and Roadway Average Daily Volumes for Study At-Grade Crossings, 2014 Baseline, 2045 Cumulative and Revised Project
Boundary/Junction – Street
# of Lanes
2014 Baseline Average Daily
Traffic (Vehicles/Day)
2014 Baseline Average Daily
Trains (Trains/Day)
2045 Cumulative
Average Daily Traffic
(Vehicles/Day)
2045 Cumulative
Average Daily Trains
(Trains/Day) Without SCIG
and ICTF
2045 Cumulative
Average Daily Trains
(Trains/Day) With SCIG and
ICTF
RevisedProject Added Average Daily
Trains (Trains/Day)
Without SCIG and ICTF
RevisedProject Added Average Daily
Trains (Trains/Day)
With SCIG and ICTF
Barstow MP 0 Lenwood Road 2 4,570 65.2 6,640 107.4 108.0 0.7 0.7 Hinkley Road 2 490 65.2 710 107.4 108.0 0.7 0.7 Indian Trail Road 2 550 65.2 800 107.4 108.0 0.7 0.7 Vista Road 2 2,820 65.2 4,100 107.4 108.0 0.7 0.7 Turner Road 2 30 65.2 50 107.4 108.0 0.7 0.7 North Bryman Road 2 160 65.2 240 107.4 108.0 0.7 0.7

Berths 97–109 (China Shipping) Container Terminal Draft Supplemental EIR C2-16
SCH #2014101050 June 2017
Boundary/Junction – Street
# of Lanes
2014 Baseline Average Daily
Traffic (Vehicles/Day)
2014 Baseline Average Daily
Trains (Trains/Day)
2045 Cumulative
Average Daily Traffic
(Vehicles/Day)
2045 Cumulative
Average Daily Trains
(Trains/Day) Without SCIG
and ICTF
2045 Cumulative
Average Daily Trains
(Trains/Day) With SCIG and
ICTF
RevisedProject Added Average Daily
Trains (Trains/Day)
Without SCIG and ICTF
RevisedProject Added Average Daily
Trains (Trains/Day)
With SCIG and ICTF
South Bryman Road 2 1,970 65.2 2,860 107.4 108.0 0.7 0.7 Robinson Ranch Road 2 120 65.2 170 107.4 108.0 0.7 0.7 1st Street 2 700 65.2 1,020 107.4 108.0 0.7 0.7 6th Street 4 3,680 65.2 5,340 107.4 108.0 0.7 0.7
Silverwood Junction MP 56.6
Keenbrook Junction MP 69.4
Swarthout Canyon Road
2 180 77.3 270 113.4 114.0 0.7 0.7
Devore Road/Glen Helen Parkway
4 6,400 77.3 9,300 113.4 114.0 0.7 0.7
Dike Junction Palm Avenue 2 12,100 58.5 17,570 89.8 90.3 0.6 0.7
San Bernardino MP 81.4 Source: San Pedro Bay Ports “Train Builder” model for intermodal trains estimation; SCAG’s non-intermodal freight and passenger train data and projections; and San Pedro
Bay Ports compiled vehicular traffic data and projections.
Table C2-8: UP Alhambra Subdivision from Los Angeles Transportation Center (LATC) to Colton Crossing, Rail and Roadway Average Daily Volumes for Study At-Grade Crossings, 2014 Baseline, 2045 Cumulative and Revised Project (Excluding Segment That is Combined with UP Los Angeles Subdivision)
Boundary/Junction – Street
# of Lanes
2014 Baseline Average Daily
Traffic (Vehicles/Day)
2014 Baseline Average Daily
Trains (Trains/Day)
2045 Cumulative
Average Daily Traffic
(Vehicles/Day)
2045 Cumulative
Average Daily Trains*
(Trains/Day)
RevisedProject Added Average Daily
Trains* (Trains/Day)
LATC MP 482.9
San Pablo Street 4 4,050 19.8 5,020 41.7 0.4
Vineburn Avenue 2 1,350 19.8 1,680 41.7 0.4
Worth/Boca Road 2 7,840 19.8 9,720 41.7 0.4
Valley Boulevard 4 27,500 19.8 34,080 41.7 0.4
Ramona Street 2 12,720 19.8 15,770 41.7 0.4

Berths 97–109 (China Shipping) Container Terminal Draft Supplemental EIR C2-17
SCH #2014101050 June 2017
Boundary/Junction – Street
# of Lanes
2014 Baseline Average Daily
Traffic (Vehicles/Day)
2014 Baseline Average Daily
Trains (Trains/Day)
2045 Cumulative
Average Daily Traffic
(Vehicles/Day)
2045 Cumulative
Average Daily Trains*
(Trains/Day)
RevisedProject Added Average Daily
Trains* (Trains/Day)
Mission Road 3 23,040 19.8 28,550 41.7 0.4
Del Mar Avenue 2 21,060 19.8 26,100 41.7 0.4
San Gabriel Boulevard 4 35,110 19.8 43,510 41.7 0.4
Walnut Grove Avenue 3 15,340 19.8 19,010 41.7 0.4
Encinita Avenue 2 6,390 19.8 7,920 41.7 0.4
Lower Azusa Road 4 17,400 19.8 21,570 41.7 0.4
Temple City Boulevard 4 20,880 19.8 25,870 41.7 0.4
Baldwin Avenue 4 25,900 19.8 32,100 41.7 0.4
Arden Drive 4 11,050 19.8 13,690 41.7 0.4
El Monte Junction MP 494.99
Tyler Avenue 4 11,770 58.1 14,590 84.5 0.4
Cogswell Road 2 10,070 58.1 12,480 84.5 0.4
Temple Avenue 4 27,060 58.1 33,530 84.5 0.4
Bassett Junction MP 498.45
Vineland Avenue 2 12,550 20.6 15,550 42.5 0.4
Puente Avenue 4 31,800 20.6 39,410 42.5 0.4
Orange Avenue 2 5,770 20.6 7,150 42.5 0.4
California Avenue 2 18,770 20.6 23,260 42.5 0.4
City of Industry Junction MP 501.5
Fullerton Road 4 18,280 23.9 22,660 48.5 0.4
Fairway Drive 4 19,830 23.9 24,580 48.5 0.4
Lemon Road 4 17,180 23.9 21,290 48.5 0.4
Brea Canyon Road 2 14,390 23.9 17,830 48.5 0.4
Pomona Junction MP 514.3
HANDLED SEPARATELY DUE TO PROXIMITY TO UP LOS ANGELES SUBDIVISION LA-San Bernardino County Line MP 516.7 Montclair Junction
Bon View Avenue 2 10,230 27.6 14,800 55.9 0.4
Vineyard Avenue 4 31,400 27.6 45,430 55.9 0.4

Berths 97–109 (China Shipping) Container Terminal Draft Supplemental EIR C2-18
SCH #2014101050 June 2017
Boundary/Junction – Street
# of Lanes
2014 Baseline Average Daily
Traffic (Vehicles/Day)
2014 Baseline Average Daily
Trains (Trains/Day)
2045 Cumulative
Average Daily Traffic
(Vehicles/Day)
2045 Cumulative
Average Daily Trains*
(Trains/Day)
RevisedProject Added Average Daily
Trains* (Trains/Day)
Milliken Avenue 6 34,910 27.6 50,510 55.9 0.4
Kaiser Junction MP 527.5
West Colton MP 534.7
Colton Crossing MP 538.70
*The number of trains would not be affected by the presence or absence of SCIG and ICTF modernization projects. Source: San Pedro Bay Ports “Train Builder” model for intermodal trains estimation; SCAG’s non-intermodal freight and passenger train data and projections; and San Pedro
Bay Ports compiled vehicular traffic data and projections.
Table C2-9: UP Los Angeles Subdivision from East Los Angeles Yard to West Riverside Junction, Rail and Roadway Average Daily Volumes for Study At-Grade Crossings, 2014 Baseline, 2045 Cumulative and Revised Project (Excluding Segment That is Combined with UP Alhambra Subdivision)
Boundary/Junction – Street
# of Lanes
2014 Baseline Average Daily
Traffic (Vehicles/Day)
2014 Baseline Average Daily
Trains (Trains/Day)
2045 Cumulative
Average Daily Traffic
(Vehicles/Day)
2045 Cumulative
Average Daily Trains*
(Trains/Day)
RevisedProject Added Average Daily
Trains* (Trains/Day)
East Los Angeles MP 5.85 S. Vail Avenue 2 7,900 29.1 9,750 50.5 0.4 Maple Avenue 2 5,550 29.1 6,860 50.5 0.4 S. Greenwood Avenue 4 7,280 29.1 8,980 50.5 0.4 Montebello Boulevard 4 20,550 29.1 25,370 50.5 0.4 Durfee Avenue 2 13,960 29.1 17,230 50.5 0.4 Rose Hills Road 4 9,450 29.1 11,660 50.5 0.4 Mission Mill Road 2 2,180 29.1 2,690 50.5 0.4 Workman Mill 4 7,650 29.1 9,440 50.5 0.4 Turnbull Canyon Road 4 14,440 29.1 17,830 50.5 0.4 Stimson Avenue& Puente Avenue
4 14,720 29.1 18,170 50.5 0.4
Bixby Drive 2 2,960 29.1 3,660 50.5 0.4 Fullerton Road 4 24,240 29.1 29,920 50.5 0.4 Nogales Street 6 37,730 29.1 46,570 50.5 0.4 Fairway Drive 4 25,350 29.1 31,300 50.5 0.4 Lemon Street 4 15,060 29.1 18,590 50.5 0.4

Berths 97–109 (China Shipping) Container Terminal Draft Supplemental EIR C2-19
SCH #2014101050 June 2017
Boundary/Junction – Street
# of Lanes
2014 Baseline Average Daily
Traffic (Vehicles/Day)
2014 Baseline Average Daily
Trains (Trains/Day)
2045 Cumulative
Average Daily Traffic
(Vehicles/Day)
2045 Cumulative
Average Daily Trains*
(Trains/Day)
RevisedProject Added Average Daily
Trains* (Trains/Day)
Pomona Junction MP 31.9 HANDLED SEPARATELY DUE TO PROXIMITY TO UP ALHAMBRA SUBDIVSION LA-San Bernardino
County Line MP 33.17 E. Montclair Junction MP 35.02
Bonview Avenue 2 3,560 30.5 5,300 49.1 0.4 Grove Avenue 6 40,370 30.5 60,130 49.1 0.4 Vineyard Avenue 4 4,550 30.5 6,780 49.1 0.4 Archibald Avenue 4 5,380 30.5 8,010 49.1 0.4
San Bernardino-Riverside County Line MP 43.36
Milliken Avenue 6 21,520 30.5 32,360 49.1 0.4 Mira Loma Junction MP 45.7
Bellegrave Avenue 2 7,910 30.8 11,890 54.1 0.4 Rutile Street 2 8,490 30.8 12,760 54.1 0.4 Clay Street 2 16,730 30.8 25,160 54.1 0.4 Jurupa Ave 4 14,500 30.8 21,810 54.1 0.4 Mountain View Avenue 2 1,760 30.8 2,640 54.1 0.4 Streeter Avenue 4 14,220 30.8 21,390 54.1 0.4 Palm Avenue 2 7,690 30.8 11,560 54.1 0.4 Brockton Avenue 4 13,710 30.8 20,610 54.1 0.4 Riverside Avenue 2 11,800 30.8 17,740 54.1 0.4 Panorama Road 2 6,550 30.8 9,860 54.1 0.4
West Riverside Junction MP 56.7
*The number of trains would not be affected by the presence or absence of SCIG and ICTF modernization projects. Source: San Pedro Bay Ports “Train Builder” model for intermodal trains estimation; SCAG’s non-intermodal freight and passenger train data and projections; and San Pedro
Bay Ports compiled vehicular traffic data and projections.

Berths 97–109 (China Shipping) Container Terminal Draft Supplemental EIR C2-20
SCH #2014101050 June 2017
Table C2-10: Combined UP Alhambra and Los Angeles Subdivisions in Pomona and Montclair Area, Rail and Roadway Average Daily Volumes for Study At-Grade Crossings, 2014 Baseline, 2045 Cumulative and Revised Project
Boundary/Junction – Street
# of Lanes
2014 Baseline Average Daily
Traffic (Vehicles/Day)
2014 Baseline Average Daily
Trains (Trains/Day)
2045 Cumulative
Average Daily Traffic
(Vehicles/Day)
2045 Cumulative
Average Daily Trains*
(Trains/Day)
RevisedProject Added Average Daily
Trains* (Trains/Day)
Pomona Junction MP 514.3 Hamilton Boulevard 4 8,000 53.9 9,910 105.1 0.8 Park Avenue 2 5,660 53.9 7,020 105.1 0.8 Main Street 2 1,570 53.9 1,950 105.1 0.8 Palomares Street 2 3,870 53.9 4,790 105.1 0.8 San Antonio Avenue 4 6,880 53.9 8,530 105.1 0.8
LA-San Bernardino County Line MP 516.7
Monte Vista Avenue 4 12,440 53.9 16,350 105.1 0.8 San Antonio Avenue 4 10,540 53.9 15,250 105.1 0.8 Vine Avenue 2 7,730 53.9 11,190 105.1 0.8 Sultana Avenue 2 11,530 53.9 12,130 105.1 0.8 Campus Avenue 2 10,820 53.9 15,660 105.1 0.8
Montclair Junction *The number of trains would not be affected by the presence or absence of SCIG and ICTF modernization projects. Source: San Pedro Bay Ports “Train Builder” model for intermodal trains estimation; SCAG’s non-intermodal freight and passenger train data and projections; and San Pedro
Bay Ports compiled vehicular traffic data and projections.

Berths 97–109 (China Shipping) Container Terminal Draft Supplemental EIR C2-21
SCH #2014101050 June 2017
Table C2-11: UP Yuma Subdivision from Colton Crossing to Indio, Rail and Roadway Average Daily Volumes for Study At-Grade Crossings, 2014 Baseline, 2045 Cumulative and Revised Project
Boundary/Junction – Street
# of Lanes
2014 Baseline Average Daily
Traffic (Vehicles/Day)
2014 Baseline Average Daily
Trains (Trains/Day)
2045 Cumulative
Average Daily Traffic
(Vehicles/Day)
2045 Cumulative
Average Daily Trains*
(Trains/Day)
RevisedProject Added Average Daily
Trains* (Trains/Day)
Colton Crossing MP 539.0
Hunts Lane 4 14,110 44.4 23,380 84.0 0.7
Whittier Avenue 2 200 44.4 330 84.0 0.7
Beaumont Avenue 2 480 44.4 800 84.0 0.7
San Timoteo Canyon Road
2 12,160 44.4 20,150 84.0 0.7
Alessandro Road 2 300 44.4 500 84.0 0.7
San Bernardino-Riverside County Line MP 549.25
Live Oak Canyon Road 2 1,150 44.4 1,900 84.0 0.7
San Timoteo Canyon Road
2 1,480 44.4 2,460 84.0 0.7
Viele Avenue 2 110 44.4 190 84.0 0.7
California Avenue 2 6,860 44.4 11,370 84.0 0.7
Pennsylvania Avenue 2 8,500 44.4 14,080 84.0 0.7
North Sunset Avenue 2 3,960 44.4 6,570 84.0 0.7
22nd Street 4 16,080 44.4 26,640 84.0 0.7
San Gorgonio Avenue 2 13,310 44.4 22,040 84.0 0.7
Hargrave Street 2 17,300 44.4 28,670 84.0 0.7
Apache Trail 2 2,630 44.4 4,350 84.0 0.7
Broadway 2 6,930 44.4 11,480 84.0 0.7
Tipton Road 2 120 44.4 200 84.0 0.7
Garnet MP 588.32
West Indio MP 609.63
Indio MP 610.9
Avenue 52 4 11,410 44.4 18,900 84.0 0.7 Avenue 56/Airport 2 4,970 44.4 8,240 84.0 0.7

Berths 97–109 (China Shipping) Container Terminal Draft Supplemental EIR C2-22
SCH #2014101050 June 2017
Boundary/Junction – Street
# of Lanes
2014 Baseline Average Daily
Traffic (Vehicles/Day)
2014 Baseline Average Daily
Trains (Trains/Day)
2045 Cumulative
Average Daily Traffic
(Vehicles/Day)
2045 Cumulative
Average Daily Trains*
(Trains/Day)
RevisedProject Added Average Daily
Trains* (Trains/Day)
Boulevard Avenue 66/4th Street 2 8,150 44.4 13,500 84.0 0.7
*The number of trains would not be affected by the presence or absence of SCIG and ICTF modernization projects. Source: San Pedro Bay Ports “Train Builder” model for intermodal trains estimation; SCAG’s non-intermodal freight and passenger train data and projections; and San Pedro
Bay Ports compiled vehicular traffic data and projections.
Table C2-12: Rail and Roadway P.M. Peak Hour (4-5 P.M.) Volumes for Henry Ford Avenue At-Grade Crossing, 2014 Baseline, 2045 Cumulative and Revised Project
Boundary/Junction – Street
# of Lanes
2014 Baseline P.M. Peak Hour (4-5 P.M.) Traffic
(Vehicles)
2014 Baseline P.M. Peak Hour
(4-5 P.M.) Trains* (Trains)
2045 Cumulative P.M. Peak Hour (4-5
P.M.) Traffic (Vehicles)
2045 Cumulative P.M. Peak Hour
(4-5 P.M.) Trains*(Trains)
Revised Project Added Average
Daily Trains* (Trains/Day)
Henry Ford Avenue 6 1,010 0.92 1,600 1.23 0.13
*The number of trains would not be affected by the presence or absence of SCIG and ICTF modernization projects. Source: Henry Ford Avenue crossing controller data for May/June 2016; POLA 2045 build out rail simulation data; San Pedro Bay Ports “Train Builder” model for intermodal
trains estimation; and PortTAM Travel Demand Model for this EIR.

Berths 97–1Draft Supple
09 (China Shippemental EIR
The mtotal vrepresego dowline reTG (pothe figby the amouneach vcompuat the cmore hwill noThis is
Source
Figure
The eq
where that dedelay pnumbe
The ca
ping) Container T
methodology fovehicle arrivalents vehicles wn (point “O”presents the v
oint “A” in thegure). The tot
yellow line, tnt of delay expvehicle arrivinuting the area crossing overhighway traffot be delayed s the same wa
e: Leachm
e C2-3: T
quation for tot
TG = gate doelay is a functper vehicle iser of vehicles
alculation of h
total vehiclare delayed
total delay
Terminal
for computingls and departuarriving at an
” in the figurevehicles depae figure). Thtal vehicle delthe green lineperienced by
ng at the crossof triangle O
r the course ofic during pea
by a train, buay that averag
man, 1984; an
Total Arrival
tal vehicle de
wn time, q = tion of the squ calculated byarriving at th
hourly averag
les arriving atd by a train or
experienced b
C2-23
g vehicular deures at an isoln at-grade croe). Total gatearting the queue queues are lay is represee, and the “X”the nth vehic
sing and then OAB. This cal
f a day. Delaak hours. Manut they are incge delay is com
nd Powell, 19
ls and Depar
elay for an iso
12
vehicle arrivauare of the gay dividing tothe crossing in
ge vehicle del
t the crossing r not;
by all vehicle
elay is based olated at-gradeossing, beginne down time iue after the gafully dissipat
ented by the ar” axis. The lecle. Calculati
adding thoselculation is pe
ay will vary bny of the vehicluded in the mputed for si
82
rtures for an
olated blockag
1 ⁄
al rate, and d ate down timetal delay over
n that hour.
ay accounts f
in a one-hour
es in that hour
on Figure C2-e crossing. Thning at the tims depicted as ate is lifted stted at time = tarea of trianglength of the liing the value e values up is erformed for
by time of dayicles arrivingcalculation o
ignalized inte
Isolated Blo
ge, V, is:
= vehicle depe. P.M. peak-r the P.M. pea
for the follow
ur period, whe
r; and
SCH #20141Jun
-3, which shohe yellow line
me when the g“TG.” The gr
tarting at timet* (point “B” e OAB boundine representsof this line foequivalent toeach train arr
y, because theg at the crossinf average del
ersections.
ockage
parture rate. N-hour averageak hour by the
wing:
ether the vehic
101050ne 2017
ows e gates reen e = in
ded s the or o riving ere is ng ay.
Note e e
cles

Berths 97–109 (China Shipping) Container Terminal Draft Supplemental EIR C2-24
SCH #2014101050 June 2017
all trains passing through the crossing in that hour.
The equation above relates to the effects of an isolated blockage; that is, it is assumed that the vehicle queues are completely dissipated before the next train arrives at the crossing. However, where the rail corridor has more than one track, it is possible that a second train traveling in the opposite direction could arrive at the crossing before the queues from the first train have fully dissipated. More complex delay equations for these “multiple events” have been derived by Dr. Robert Leachman of U.C. Berkeley (Leachman, 1984). In an effort to compute these effects and how likely they are to occur, Dr. Leachman simulated railroad traffic for both 2010 and 2035 against streets with varying average daily traffic (ADT) per lane and recomputed vehicular delays, including the impacts of multiple events. With higher train volumes, multiple events occur more often, and the level of the impact is greater on streets with more vehicular traffic per lane. Based on a sample of Dr. Leachman’s results for different train volumes and ADT per lane, a curve for the calculation of a “Bias Factor” was created/fitted. This Bias Factor adjustment accounts for additional delay associated with multiple crossings that overlap in time. The fitted equation for the Bias Factor (BF) is as follows:
. . .
The R-squared value for the fitted equation is 0.9322, indicating a very good correlation among the variables. Using this equation, a Bias Factor was computed for each grade crossing that has more than one track crossing the street. The Bias Factor is then multiplied by the unadjusted vehicle hours of delay for an isolated blockage to account for the effects of multiple events. For example, the average Bias Factor for all grade crossings on the BNSF San Bernardino Subdivision for 2013 is approximately 1.025, meaning that the unadjusted delay values were increased by an average of 2.5 percent. In the particular case of the Henry Ford Avenue crossing, which has a single track, the Bias Factor is set to 1.0; in other words, multiple crossings are impossible.
The LOS definitions/ranges for the intersection operational methodology contained in the 2010 HCM were applied to the PHAVD results.
C2.3 Revised Project Analysis This analysis calculated the 2014 Baseline the P.M. peak-hour average vehicular delays for at-grade crossings under 2014 Baseline (January through December) and 2014 Baseline plus Revised Project conditions. To estimate average vehicular delays under the 2014 baseline plus Revised Project condition, at each at-grade crossing, added train volumes resulting from the Revised Project’s additional throughput were added to 2014 baseline train volumes.
Further, two Revised Project scenarios were considered, one without the SCIG and ICTF projects and the other with those two projects. Revised Project-added train volumes with SCIG and ICTF were slightly higher than those without at-grade crossings on BNSF rail mainlines, but there was no difference on the UP rail mainlines and at the Henry Ford Avenue crossing. The roadway volumes for at-grade crossings were kept the same under both 2014 Baseline and 2014 Baseline plus Revised Project conditions.
As Tables C2-13 through C2-21 show, none of the locations, including the Henry Ford Avenue crossing, experienced per-vehicle delay greater than 55 seconds.

Berths 97–109 (China Shipping) Container Terminal Draft Supplemental EIR C2-25
SCH #2014101050 June 2017
Table C2-13: BNSF San Bernardino Subdivision, from Hobart Yard to San Bernardino, P.M. Peak-Hour Average Vehicular Delays for Study At-Grade Crossings, 2014 Baseline and 2014 Baseline plus Revised Project (without SCIG and ICTF)
Boundary/Junction – Street
# of Lanes
Average Daily
Traffic (Vehicles/
Day)
Average Daily Train Volume
(Trains/Day)
Daily Total Gate Down Time
(Minutes/Day)
Daily Total Vehicle Hours of Delay
(Veh-Hrs/Day)
P.M. Peak-Hour Average Delay per Vehicle (Seconds/Vehicle)
Base Base + Proj.
Change Base Base + Proj.
Change Base Base + Proj.
Change Base Base + Proj.
Change
San Bernardino MP 0.0
Laurel Street 2 2,340 60.3 61.0 0.6 119.3 121.3 2.0 3.9 4.0 0.1 6.2 6.4 0.1 Olive Street 2 2,790 60.3 61.0 0.6 119.3 121.3 2.0 4.7 4.8 0.1 6.3 6.5 0.1 E Street 2 730 60.3 61.0 0.6 119.3 121.3 2.0 1.2 1.2 0.0 5.9 6.0 0.1 H Street 2 1,470 60.3 61.0 0.6 119.3 121.3 2.0 2.4 2.4 0.1 6.0 6.2 0.1 Valley Boulevard 2 11,000 60.3 61.0 0.6 119.3 121.3 2.0 24.4 25.0 0.6 9.4 9.7 0.2
Colton Crossing MP 3.2
Highgrove Junction MP 6.1 (Connection to Perris via MetroLink)
Main Street 2 2,680 70.2 71.2 1.0 147.9 150.8 3.0 5.8 5.9 0.2 8.0 8.3 0.2 Riverside-San Bernardino County Line MP 6.41
Center Street 4 6,360 70.2 71.2 1.0 148.3 151.2 3.0 13.7 14.1 0.4 8.1 8.3 0.2 Iowa Avenue 4 23,440 70.2 71.2 1.0 148.3 151.2 3.0 64.0 65.7 1.7 11.3 11.6 0.3 Palmyrita Avenue 2 3,840 70.2 71.2 1.0 147.9 150.8 3.0 8.4 8.6 0.2 8.2 8.4 0.2 Chicago Avenue 4 13,880 70.2 71.2 1.0 148.3 151.2 3.0 32.9 33.8 0.9 9.2 9.5 0.2 Spruce Street 4 7,410 70.2 71.2 1.0 148.3 151.2 3.0 16.2 16.6 0.4 8.2 8.4 0.2 3rd Street 4 11,160 70.2 71.2 1.0 148.3 151.2 3.0 25.5 26.2 0.7 8.8 9.0 0.2 Mission Inn (7th Street)
4 5,460 70.2 71.2 1.0 148.3 151.2 3.0 11.7 12.0 0.3 8.0 8.2 0.2
Riverside Yard and Amtrak Station MP 10.02-10.16
Cridge Street 2 3,850 99.1 100.1 1.0 169.1 172.0 3.0 9.1 9.3 0.2 9.1 9.3 0.2

Berths 97–109 (China Shipping) Container Terminal Draft Supplemental EIR C2-26
SCH #2014101050 June 2017
Boundary/Junction – Street
# of Lanes
Average Daily
Traffic (Vehicles/
Day)
Average Daily Train Volume
(Trains/Day)
Daily Total Gate Down Time
(Minutes/Day)
Daily Total Vehicle Hours of Delay
(Veh-Hrs/Day)
P.M. Peak-Hour Average Delay per Vehicle (Seconds/Vehicle)
Base Base + Proj.
Change Base Base + Proj.
Change Base Base + Proj.
Change Base Base + Proj.
Change
West Riverside Junction MP 10.6 (Connection to UP Los Angeles Sub)
Jane Street 2 2,210 65.3 65.9 0.6 110.0 111.8 1.8 3.2 3.3 0.1 5.5 5.6 0.1 Mary Street 4 12,220 65.3 65.9 0.6 110.4 112.2 1.8 19.7 20.2 0.5 6.3 6.5 0.1 Washington Street 2 8,490 65.3 65.9 0.6 110.0 111.8 1.8 14.5 14.9 0.3 6.9 7.1 0.2 Madison Street 4 16,090 65.3 65.9 0.6 110.4 112.2 1.8 27.3 28.0 0.6 6.8 7.0 0.2 Jefferson Street 2 8,390 65.3 65.9 0.6 110.0 111.8 1.8 14.3 14.7 0.3 6.9 7.1 0.2 Adams Street 4 17,920 65.3 65.9 0.6 110.4 112.2 1.8 31.3 32.0 0.7 7.1 7.3 0.2 Jackson Street 4 8,000 65.3 65.9 0.6 110.4 112.2 1.8 12.2 12.5 0.3 5.9 6.0 0.1 Gibson Street 2 870 65.3 65.9 0.6 110.0 111.8 1.8 1.2 1.3 0.0 5.3 5.4 0.1 Harrison Street 2 6,820 65.3 65.9 0.6 110.0 111.8 1.8 11.1 11.4 0.3 6.5 6.6 0.1 Tyler Street 4 15,990 65.3 65.9 0.6 110.4 112.2 1.8 27.1 27.8 0.6 6.8 7.0 0.2 Pierce Street 2 11,440 65.3 65.9 0.6 110.0 111.8 1.8 21.4 21.9 0.5 7.9 8.0 0.2 Buchanan Street 2 9,790 65.3 65.9 0.6 110.0 111.8 1.8 17.4 17.8 0.4 7.3 7.5 0.2 Magnolia Avenue(eastbound)
2 9,000 65.3 65.9 0.6 110.0 111.8 1.8 15.6 16.0 0.4 7.1 7.2 0.2
Magnolia Avenue(westbound)
2 9,000 65.3 65.9 0.6 110.0 111.8 1.8 15.6 16.0 0.4 7.1 7.2 0.2
Mckinley Street 4 27,270 65.3 65.9 0.6 110.4 112.2 1.8 55.4 56.7 1.3 8.8 9.0 0.2 Radio Road 2 4,410 65.3 65.9 0.6 110.0 111.8 1.8 6.8 6.9 0.2 5.9 6.1 0.1 Joy Street 2 7,450 65.3 65.9 0.6 110.0 111.8 1.8 12.4 12.7 0.3 6.6 6.8 0.2 Sheridan Street 2 2,420 65.3 65.9 0.6 110.0 111.8 1.8 3.5 3.6 0.1 5.6 5.7 0.1 Cota Street 4 6,180 65.3 65.9 0.6 110.4 112.2 1.8 9.2 9.5 0.2 5.7 5.8 0.1 Railroad Street 4 9,900 65.3 65.9 0.6 110.4 112.2 1.8 15.5 15.9 0.4 6.1 6.2 0.1 Smith Street 4 14,010 65.3 65.9 0.6 110.4 112.2 1.8 23.1 23.7 0.5 6.6 6.7 0.2 Auto Center Drive 2 11,840 65.3 65.9 0.6 110.0 111.8 1.8 22.5 23.0 0.5 8.0 8.2 0.2
Riverside-Orange County Line
Kellogg Drive 4 6,900 65.3 65.9 0.6 110.4 112.2 1.8 10.5 10.7 0.2 5.8 6.0 0.1 Lakeview Avenue 3 18,940 65.3 65.9 0.6 110.2 112.0 1.8 38.0 38.9 0.9 8.7 8.9 0.2 Richfield Road 4 9,510 65.3 65.9 0.6 110.4 112.2 1.8 14.9 15.3 0.4 6.1 6.2 0.1

Berths 97–109 (China Shipping) Container Terminal Draft Supplemental EIR C2-27
SCH #2014101050 June 2017
Boundary/Junction – Street
# of Lanes
Average Daily
Traffic (Vehicles/
Day)
Average Daily Train Volume
(Trains/Day)
Daily Total Gate Down Time
(Minutes/Day)
Daily Total Vehicle Hours of Delay
(Veh-Hrs/Day)
P.M. Peak-Hour Average Delay per Vehicle (Seconds/Vehicle)
Base Base + Proj.
Change Base Base + Proj.
Change Base Base + Proj.
Change Base Base + Proj.
Change
Atwood Junction MP 40.6 (Connection to Old Olive Sub)
Van Buren Street 2 6,790 47.4 48.0 0.6 92.9 94.7 1.8 10.1 10.3 0.3 5.8 6.0 0.2 Jefferson Street 3 6,370 47.4 48.0 0.6 93.1 94.9 1.8 8.8 9.1 0.2 5.3 5.4 0.1 Tustin Avenue (Rose Drive)
4 29,290 47.4 48.0 0.6 93.2 95.0 1.8 57.0 58.5 1.5 8.6 8.8 0.2
Orangethorpe Avenue
4 28,440 47.4 48.0 0.6 93.2 95.0 1.8 54.4 55.9 1.4 8.4 8.6 0.2
Kraemer Boulevard 4 19,860 47.4 48.0 0.6 93.2 95.0 1.8 32.6 33.4 0.8 6.7 6.9 0.2 Placentia Avenue 4 14,550 47.4 48.0 0.6 93.2 95.0 1.8 22.0 22.6 0.6 6.0 6.1 0.2 State College Boulevard
4 23,670 47.4 48.0 0.6 93.2 95.0 1.8 41.4 42.5 1.1 7.4 7.6 0.2
Acacia Avenue 4 6,760 47.4 48.0 0.6 93.2 95.0 1.8 9.2 9.4 0.2 5.2 5.3 0.1 Raymond Avenue 4 21,110 47.4 48.0 0.6 93.2 95.0 1.8 35.3 36.2 0.9 6.9 7.1 0.2
Fullerton Junction MP 45.5 = MP 165.5
Orange-LA County Line
Valley View Avenue
4 24,230 92.4 93.0 0.6 129.2 131.0 1.8 52.7 53.8 1.1 9.5 9.7 0.2
Rosecrans/Marquardt Avenue
4 22,890 92.4 93.0 0.6 129.2 131.0 1.8 48.5 49.6 1.1 9.1 9.3 0.2
Lakeland Road 2 6,450 92.4 93.0 0.6 128.7 130.5 1.8 11.5 11.8 0.3 7.2 7.3 0.2 Los Nietos Road 4 20,200 92.4 93.0 0.6 129.2 131.0 1.8 40.8 41.7 0.9 8.5 8.7 0.2 Norwalk Boulevard 4 25,890 92.4 93.0 0.6 129.2 131.0 1.8 58.2 59.5 1.3 9.9 10.1 0.2 Pioneer Boulevard 4 15,100 92.4 93.0 0.6 129.2 131.0 1.8 28.0 28.6 0.6 7.6 7.7 0.2 Passons Boulevard 4 12,530 92.4 93.0 0.6 129.2 131.0 1.8 22.4 22.9 0.5 7.2 7.3 0.2 Serapis Avenue 2 6,190 92.4 93.0 0.6 128.7 130.5 1.8 11.0 11.2 0.2 7.1 7.2 0.1
Commerce Yard MP 148.5
Hobart Yard MP 146.0 OVERALL:

Berths 97–109 (China Shipping) Container Terminal Draft Supplemental EIR C2-28
SCH #2014101050 June 2017
Boundary/Junction – Street
# of Lanes
Average Daily
Traffic (Vehicles/
Day)
Average Daily Train Volume
(Trains/Day)
Daily Total Gate Down Time
(Minutes/Day)
Daily Total Vehicle Hours of Delay
(Veh-Hrs/Day)
P.M. Peak-Hour Average Delay per Vehicle (Seconds/Vehicle)
Base Base + Proj.
Change Base Base + Proj.
Change Base Base + Proj.
Change Base Base + Proj.
Change
Total Daily Vehicle Hours of Delay (Veh-Hrs/Day)
1,211.7 1,241.0 29.3
Maximum P.M. Peak Average Delay per Vehicle (Seconds/Vehicle)
11.3 11.6 0.3
Source: San Pedro Bay Ports “Train Builder” model for intermodal trains estimation; SCAG’s non-intermodal freight and passenger train data and projections; San Pedro Bay Ports compiled vehicular traffic data and projections; and San Pedro Bay Ports Peak Hour Average Vehicular Delay Calculation Methodology.

Berths 97–109 (China Shipping) Container Terminal Draft Supplemental EIR C2-29
SCH #2014101050 June 2017
Table C2-14: BNSF San Bernardino Subdivision, from Hobart Yard to San Bernardino, P.M. Peak-Hour Average Vehicular Delays for Study At-Grade Crossings, 2014 Baseline and 2014 Baseline plus Revised Project (with SCIG and ICTF)
Boundary/Junction – Street
# of Lanes
Average Daily
Traffic (Vehicles/
Day)
Average Daily Train Volume
(Trains/Day)
Daily Total Gate Down Time
(Minutes/Day)
Daily Total Vehicle Hours of Delay
(Veh-Hrs/Day)
P.M. Peak-Hour Average Delay per Vehicle (Seconds/Vehicle)
Base Base + Proj.
Change
Base Base + Proj.
Change Base Base + Proj.
Change Base Base + Proj.
Change
San Bernardino MP 0.0
Laurel Street 2 2,340 60.3 61.0 0.7 119.3 121.3 2.0 3.9 4.0 0.1 6.2 6.4 0.1 Olive Street 2 2,790 60.3 61.0 0.7 119.3 121.3 2.0 4.7 4.8 0.1 6.3 6.5 0.1 E Street 2 730 60.3 61.0 0.7 119.3 121.3 2.0 1.2 1.2 0.0 5.9 6.0 0.1 H Street 2 1,470 60.3 61.0 0.7 119.3 121.3 2.0 2.4 2.4 0.1 6.0 6.1 0.1 Valley Boulevard 2 11,000 60.3 61.0 0.7 119.3 121.3 2.0 24.4 25.0 0.6 9.4 9.7 0.2
Colton Crossing MP 3.2
Highgrove Junction MP 6.1 (Connection to Perris via MetroLink)
Main Street 2 2,680 70.2 71.2 1.0 147.9 150.9 3.0 5.8 5.9 0.2 8.0 8.3 0.2 Riverside-San Bernardino County Line MP 6.41
Center Street 4 6,360 70.2 71.2 1.0 148.3 151.2 3.0 13.7 14.1 0.4 8.1 8.3 0.2 Iowa Avenue 4 23,440 70.2 71.2 1.0 148.3 151.2 3.0 64.0 65.7 1.7 11.3 11.6 0.3 Palmyrita Avenue 2 3,840 70.2 71.2 1.0 147.9 150.9 3.0 8.4 8.6 0.2 8.2 8.4 0.2 Chicago Avenue 4 13,880 70.2 71.2 1.0 148.3 151.2 3.0 32.9 33.8 0.9 9.2 9.5 0.2 Spruce Street 4 7,410 70.2 71.2 1.0 148.3 151.2 3.0 16.2 16.6 0.4 8.2 8.4 0.2 3rd Street 4 11,160 70.2 71.2 1.0 148.3 151.2 3.0 25.5 26.2 0.7 8.8 9.0 0.2 Mission Inn (7th Street)
4 5,460 70.2 71.2 1.0 148.3 151.2 3.0 11.7 12.0 0.3 8.0 8.2 0.2
Riverside Yard and Amtrak Station MP 10.02-10.16
Cridge Street 2 3,850 99.1 100.1 1.0 169.1 172.1 3.0 9.1 9.3 0.2 9.1 9.3 0.2

Berths 97–109 (China Shipping) Container Terminal Draft Supplemental EIR C2-30
SCH #2014101050 June 2017
Boundary/Junction – Street
# of Lanes
Average Daily
Traffic (Vehicles/
Day)
Average Daily Train Volume
(Trains/Day)
Daily Total Gate Down Time
(Minutes/Day)
Daily Total Vehicle Hours of Delay
(Veh-Hrs/Day)
P.M. Peak-Hour Average Delay per Vehicle (Seconds/Vehicle)
Base Base + Proj.
Change
Base Base + Proj.
Change Base Base + Proj.
Change Base Base + Proj.
Change
West Riverside Junction MP 10.6 (Connection to UP Los Angeles Sub)
Jane Street 2 2,210 65.3 65.9 0.6 110.0 111.9 1.8 3.2 3.3 0.1 5.5 5.6 0.1 Mary Street 4 12,220 65.3 65.9 0.6 110.4 112.2 1.8 19.7 20.2 0.5 6.3 6.5 0.1 Washington Street 2 8,490 65.3 65.9 0.6 110.0 111.9 1.8 14.5 14.9 0.3 6.9 7.1 0.2 Madison Street 4 16,090 65.3 65.9 0.6 110.4 112.2 1.8 27.3 28.0 0.6 6.8 7.0 0.2 Jefferson Street 2 8,390 65.3 65.9 0.6 110.0 111.9 1.8 14.3 14.6 0.3 6.9 7.1 0.2 Adams Street 4 17,920 65.3 65.9 0.6 110.4 112.2 1.8 31.3 32.0 0.7 7.1 7.3 0.2 Jackson Street 4 8,000 65.3 65.9 0.6 110.4 112.2 1.8 12.2 12.5 0.3 5.9 6.0 0.1 Gibson Street 2 870 65.3 65.9 0.6 110.0 111.9 1.8 1.2 1.3 0.0 5.3 5.4 0.1 Harrison Street 2 6,820 65.3 65.9 0.6 110.0 111.9 1.8 11.1 11.4 0.3 6.5 6.6 0.1 Tyler Street 4 15,990 65.3 65.9 0.6 110.4 112.2 1.8 27.1 27.8 0.6 6.8 7.0 0.2 Pierce Street 2 11,440 65.3 65.9 0.6 110.0 111.9 1.8 21.4 21.9 0.5 7.9 8.0 0.2 Buchanan Street 2 9,790 65.3 65.9 0.6 110.0 111.9 1.8 17.4 17.8 0.4 7.3 7.5 0.2 Magnolia Avenue(eastbound)
2 9,000 65.3 65.9 0.6 110.0 111.9 1.8 15.6 16.0 0.4 7.1 7.2 0.2
Magnolia Avenue(westbound)
2 9,000 65.3 65.9 0.6 110.0 111.9 1.8 15.6 16.0 0.4 7.1 7.2 0.2
Mckinley Street 4 27,270 65.3 65.9 0.6 110.4 112.2 1.8 55.4 56.6 1.3 8.8 9.0 0.2 Radio Road 2 4,410 65.3 65.9 0.6 110.0 111.9 1.8 6.8 6.9 0.2 5.9 6.1 0.1 Joy Street 2 7,450 65.3 65.9 0.6 110.0 111.9 1.8 12.4 12.7 0.3 6.6 6.8 0.1 Sheridan Street 2 2,420 65.3 65.9 0.6 110.0 111.9 1.8 3.5 3.6 0.1 5.6 5.7 0.1 Cota Street 4 6,180 65.3 65.9 0.6 110.4 112.2 1.8 9.2 9.5 0.2 5.7 5.8 0.1 Railroad Street 4 9,900 65.3 65.9 0.6 110.4 112.2 1.8 15.5 15.8 0.4 6.1 6.2 0.1 Smith Street 4 14,010 65.3 65.9 0.6 110.4 112.2 1.8 23.1 23.7 0.5 6.6 6.7 0.1 Auto Center Drive 2 11,840 65.3 65.9 0.6 110.0 111.9 1.8 22.5 23.0 0.5 8.0 8.2 0.2
Riverside-Orange County Line
Kellogg Drive 4 6,900 65.3 65.9 0.6 110.4 112.2 1.8 10.5 10.7 0.2 5.8 6.0 0.1 Lakeview Avenue 3 18,940 65.3 65.9 0.6 110.2 112.0 1.8 38.0 38.9 0.9 8.7 8.9 0.2 Richfield Road 4 9,510 65.3 65.9 0.6 110.4 112.2 1.8 14.9 15.3 0.3 6.1 6.2 0.1

Berths 97–109 (China Shipping) Container Terminal Draft Supplemental EIR C2-31
SCH #2014101050 June 2017
Boundary/Junction – Street
# of Lanes
Average Daily
Traffic (Vehicles/
Day)
Average Daily Train Volume
(Trains/Day)
Daily Total Gate Down Time
(Minutes/Day)
Daily Total Vehicle Hours of Delay
(Veh-Hrs/Day)
P.M. Peak-Hour Average Delay per Vehicle (Seconds/Vehicle)
Base Base + Proj.
Change
Base Base + Proj.
Change Base Base + Proj.
Change Base Base + Proj.
Change
Atwood Junction MP 40.6 (Connection to Old Olive Sub)
Van Buren Street 2 6,790 47.4 48.0 0.6 92.9 94.8 1.8 10.1 10.3 0.3 5.8 6.0 0.1 Jefferson Street 3 6,370 47.4 48.0 0.6 93.1 94.9 1.8 8.8 9.1 0.2 5.3 5.4 0.1 Tustin Avenue (Rose Drive)
4 29,290 47.4 48.0 0.6 93.2 95.0 1.8 57.0 58.5 1.5 8.6 8.8 0.2
Orangethorpe Avenue
4 28,440 47.4 48.0 0.6 93.2 95.0 1.8 54.4 55.8 1.4 8.4 8.6 0.2
Kraemer Boulevard 4 19,860 47.4 48.0 0.6 93.2 95.0 1.8 32.6 33.4 0.8 6.7 6.9 0.2 Placentia Avenue 4 14,550 47.4 48.0 0.6 93.2 95.0 1.8 22.0 22.6 0.6 6.0 6.1 0.2 State College Boulevard
4 23,670 47.4 48.0 0.6 93.2 95.0 1.8 41.4 42.5 1.1 7.4 7.6 0.2
Acacia Avenue 4 6,760 47.4 48.0 0.6 93.2 95.0 1.8 9.2 9.4 0.2 5.2 5.3 0.1 Raymond Avenue 4 21,110 47.4 48.0 0.6 93.2 95.0 1.8 35.3 36.2 0.9 6.9 7.1 0.2
Fullerton Junction MP 45.5 = MP 165.5
Orange-LA County Line
Valley View Avenue
4 24,230 92.4 93.0 0.6 129.2 131.0 1.8 52.7 53.8 1.1 9.5 9.7 0.2
Rosecrans/Marquardt Avenue
4 22,890 92.4 93.0 0.6 129.2 131.0 1.8 48.5 49.6 1.0 9.1 9.3 0.2
Lakeland Road 2 6,450 92.4 93.0 0.6 128.7 130.5 1.8 11.5 11.7 0.2 7.2 7.3 0.1 Los Nietos Road 4 20,200 92.4 93.0 0.6 129.2 131.0 1.8 40.8 41.7 0.9 8.5 8.7 0.2 Norwalk Boulevard 4 25,890 92.4 93.0 0.6 129.2 131.0 1.8 58.2 59.4 1.2 9.9 10.1 0.2 Pioneer Boulevard 4 15,100 92.4 93.0 0.6 129.2 131.0 1.8 28.0 28.6 0.6 7.6 7.7 0.2 Passons Boulevard 4 12,530 92.4 93.0 0.6 129.2 131.0 1.8 22.4 22.8 0.5 7.2 7.3 0.1 Serapis Avenue 2 6,190 92.4 93.0 0.6 128.7 130.5 1.8 11.0 11.2 0.2 7.1 7.2 0.1
Commerce Yard MP 148.5
Hobart Yard MP 146.0 OVERALL:

Berths 97–109 (China Shipping) Container Terminal Draft Supplemental EIR C2-32
SCH #2014101050 June 2017
Boundary/Junction – Street
# of Lanes
Average Daily
Traffic (Vehicles/
Day)
Average Daily Train Volume
(Trains/Day)
Daily Total Gate Down Time
(Minutes/Day)
Daily Total Vehicle Hours of Delay
(Veh-Hrs/Day)
P.M. Peak-Hour Average Delay per Vehicle (Seconds/Vehicle)
Base Base + Proj.
Change
Base Base + Proj.
Change Base Base + Proj.
Change Base Base + Proj.
Change
Total Daily Vehicle Hours of Delay (Veh-Hrs/Day)
1,211.7
1,240.6 28.9
Maximum P.M. Peak Average Delay per Vehicle (Seconds/Vehicle)
11.3 11.6 0.3
Source: San Pedro Bay Ports “Train Builder” model for intermodal trains estimation; SCAG’s non-intermodal freight and passenger train data and projections; San Pedro Bay Ports compiled vehicular traffic data and projections; and San Pedro Bay Ports Peak Hour Average Vehicular Delay Calculation Methodology.

Berths 97–109 (China Shipping) Container Terminal Draft Supplemental EIR C2-33
SCH #2014101050 June 2017
Table C2-15: BNSF Cajon Subdivision from San Bernardino to Barstow, P.M. Peak-Hour Average Vehicular Delays for Study At-Grade Crossings, 2014 Baseline and 2014 Baseline plus Revised Project (without SCIG and ICTF)
Boundary/Junction – Street
# of Lanes
Average Daily
Traffic (Vehicles/
Day)
Average Daily Train Volume
(Trains/Day)
Daily Total Gate Down Time
(Minutes/Day)
Daily Total Vehicle Hours of Delay
(Veh-Hrs/Day)
P.M. Peak-Hour Average Delay per Vehicle (Seconds/Vehicle)
Base Base
+ Proj.Change Base
Base + Proj.
Change Base Base + Proj.
Change Base Base
+ Proj.Change
Barstow MP 0 Lenwood Road 2 4,570 65.2 65.9 0.7 116.3 118.0 1.7 6.3 6.4 0.1 5.1 5.2 0.1 Hinkley Road 2 490 65.2 65.9 0.7 116.3 118.0 1.7 0.6 0.6 0.0 4.5 4.6 0.1 Indian Trail Road 2 550 65.2 65.9 0.7 116.3 118.0 1.7 0.7 0.7 0.0 4.5 4.6 0.1 Vista Road 2 2,820 65.2 65.9 0.7 116.3 118.0 1.7 3.7 3.8 0.1 4.9 4.9 0.1 Turner Road 2 30 65.2 65.9 0.7 116.3 118.0 1.7 0.0 0.0 0.0 4.5 4.6 0.1 North Bryman Road
2 160 65.2 65.9 0.7 116.3 118.0 1.7 0.2 0.2 0.0 4.5 4.6 0.1
South Bryman Road
2 1,970 65.2 65.9 0.7 116.3 118.0 1.7 2.6 2.6 0.0 4.7 4.8 0.1
Robinson Ranch Road
2 120 65.2 65.9 0.7 116.3 118.0 1.7 0.2 0.2 0.0 4.5 4.6 0.1
1st Street 2 700 65.2 65.9 0.7 137.4 139.4 2.0 1.2 1.3 0.0 6.4 6.5 0.1 6th Street 4 3,680 65.2 65.9 0.7 159.5 161.9 2.4 9.0 9.2 0.2 9.0 9.1 0.2
Silverwood Junction MP 56.6
Keenbrook Junction MP 69.4
Swarthout Canyon Road
2 180 77.3 78.0 0.7 226.2 229.1 2.9 0.7 0.7 0.0 14.5 14.8 0.3
Devore Road/Glen Helen Parkway
4 6,400 77.3 78.0 0.7 226.8 229.7 2.9 27.6 28.1 0.5 15.9 16.2 0.3
Dike Junction Palm Avenue 2 12,100 58.5 59.2 0.6 174.5 177.2 2.7 51.1 52.2 1.1 17.1 17.4 0.4
San Bernardino MP 81.4
OVERALL:

Berths 97–109 (China Shipping) Container Terminal Draft Supplemental EIR C2-34
SCH #2014101050 June 2017
Boundary/Junction – Street
# of Lanes
Average Daily
Traffic (Vehicles/
Day)
Average Daily Train Volume
(Trains/Day)
Daily Total Gate Down Time
(Minutes/Day)
Daily Total Vehicle Hours of Delay
(Veh-Hrs/Day)
P.M. Peak-Hour Average Delay per Vehicle (Seconds/Vehicle)
Base Base
+ Proj.Change Base
Base + Proj.
Change Base Base + Proj.
Change Base Base
+ Proj.Change
Total Daily Vehicle Hours of Delay (Veh-Hrs/Day)
104.1 106.1 2.0
Maximum P.M. Peak Average Delay per Vehicle (Seconds/Vehicle)
17.1 17.4 0.3
Source: San Pedro Bay Ports “Train Builder” model for intermodal trains estimation; SCAG’s non-intermodal freight and passenger train data and projections; San Pedro Bay Ports compiled vehicular traffic data and projections; and San Pedro Bay Ports Peak Hour Average Vehicular Delay Calculation Methodology.

Berths 97–109 (China Shipping) Container Terminal Draft Supplemental EIR C2-35
SCH #2014101050 June 2017
Table C2-16: BNSF Cajon Subdivision from San Bernardino to Barstow, P.M. Peak-Hour Average Vehicular Delays for Study At-Grade Crossings, 2014 Baseline and 2014 Baseline plus Revised Project (with SCIG and ICTF)
Boundary/Junction – Street
# of Lanes
Average Daily
Traffic (Vehicles/
Day)
Average Daily Train Volume
(Trains/Day)
Daily Total Gate Down Time
(Minutes/Day)
Daily Total Vehicle Hours of Delay
(Veh-Hrs/Day)
P.M. Peak Hour Average Delay per Vehicle (Seconds/Vehicle)
Base Base
+ Proj.Change Base
Base + Proj.
Change Base Base + Proj.
Change Base Base
+ Proj.Change
Barstow MP 0 Lenwood Road 2 4,570 65.2 65.9 0.7 116.3 118.0 1.7 6.3 6.4 0.1 5.1 5.2 0.1 Hinkley Road 2 490 65.2 65.9 0.7 116.3 118.0 1.7 0.6 0.6 0.0 4.5 4.6 0.1 Indian Trail Road 2 550 65.2 65.9 0.7 116.3 118.0 1.7 0.7 0.7 0.0 4.5 4.6 0.1 Vista Road 2 2,820 65.2 65.9 0.7 116.3 118.0 1.7 3.7 3.8 0.1 4.9 4.9 0.1 Turner Road 2 30 65.2 65.9 0.7 116.3 118.0 1.7 0.0 0.0 0.0 4.5 4.6 0.1 North Bryman Road
2 160 65.2 65.9 0.7 116.3 118.0 1.7 0.2 0.2 0.0 4.5 4.6 0.1
South Bryman Road
2 1,970 65.2 65.9 0.7 116.3 118.0 1.7 2.6 2.6 0.0 4.7 4.8 0.1
Robinson Ranch Road
2 120 65.2 65.9 0.7 116.3 118.0 1.7 0.2 0.2 0.0 4.5 4.6 0.1
1st Street 2 700 65.2 65.9 0.7 137.4 139.4 2.0 1.2 1.3 0.0 6.4 6.5 0.1 6th Street 4 3,680 65.2 65.9 0.7 159.5 161.9 2.4 9.0 9.2 0.2 9.0 9.1 0.2
Silverwood Junction MP 56.6
Keenbrook Junction MP 69.4
Swarthout Canyon Road
2 180 77.3 78.0 0.7 226.2 229.1 2.9 0.7 0.7 0.0 14.5 14.8 0.3
Devore Road/Glen Helen Parkway
4 6,400 77.3 78.0 0.7 226.8 229.7 2.9 27.6 28.1 0.5 15.9 16.2 0.3
Dike Junction Palm Avenue 2 12,100 58.5 59.2 0.7 174.5 177.2 2.7 51.1 52.2 1.0 17.1 17.4 0.3
San Bernardino MP 81.4
OVERALL:

Berths 97–109 (China Shipping) Container Terminal Draft Supplemental EIR C2-36
SCH #2014101050 June 2017
Boundary/Junction – Street
# of Lanes
Average Daily
Traffic (Vehicles/
Day)
Average Daily Train Volume
(Trains/Day)
Daily Total Gate Down Time
(Minutes/Day)
Daily Total Vehicle Hours of Delay
(Veh-Hrs/Day)
P.M. Peak Hour Average Delay per Vehicle (Seconds/Vehicle)
Base Base
+ Proj.Change Base
Base + Proj.
Change Base Base + Proj.
Change Base Base
+ Proj.Change
Total Daily Vehicle Hours of Delay (Veh-Hrs/Day)
104.1 106.0 1.9
Maximum P.M. Peak Average Delay per Vehicle (Seconds/Vehicle)
17.1 17.4 0.3
Source: San Pedro Bay Ports “Train Builder” model for intermodal trains estimation; SCAG’s non-intermodal freight and passenger train data and projections; San Pedro Bay Ports compiled vehicular traffic data and projections; and San Pedro Bay Ports Peak Hour Average Vehicular Delay Calculation Methodology.

Berths 97–109 (China Shipping) Container Terminal Draft Supplemental EIR C2-37
SCH #2014101050 June 2017
Table C2-17: UP Alhambra Subdivision from Los Angeles Transportation Center (LATC) to Colton Crossing, P.M. Peak-Hour Average Vehicular Delays for Study At-Grade Crossings, 2014 Baseline and 2014 Baseline plus Revised Project (Excluding Segment That is Combined with UP Los Angeles Subdivision)
Boundary/Junction – Street
# of Lanes
Average Daily
Traffic (Vehicles/
Day)
Average Daily Train Volume
(Trains/Day)*
Daily Total Gate Down Time
(Minutes/Day)
Daily Total Vehicle Hours of Delay
(Veh-Hrs/Day)
P.M. Peak-Hour Average Delay per Vehicle (Seconds/Vehicle)
Base Base
+ Proj.Change Base
Base + Proj.
Change Base Base + Proj.
Change Base Base
+ Proj.Change
LATC MP 482.9
San Pablo Street 4 4,050 19.8 20.2 0.4 98.0 100.5 2.5 12.5 12.9 0.4 11.4 11.8 0.4
Vineburn Avenue 2 1,350 19.8 20.2 0.4 69.1 70.9 1.8 2.0 2.1 0.1 5.5 5.7 0.2
Worth/Boca Road 2 7,840 19.8 20.2 0.4 69.1 70.9 1.8 14.6 15.1 0.5 7.6 7.8 0.2
Valley Boulevard 4 27,500 19.8 20.2 0.4 46.4 47.5 1.1 26.4 27.2 0.8 4.2 4.3 0.1
Ramona Street 2 12,720 19.8 20.2 0.4 69.1 70.9 1.8 26.3 27.1 0.9 8.8 9.1 0.3
Mission Road 3 23,040 19.8 20.2 0.4 69.2 71.0 1.8 53.0 54.7 1.7 10.2 10.6 0.3
Del Mar Avenue 2 21,060 19.8 20.2 0.4 69.1 70.9 1.8 65.3 67.4 2.1 15.8 16.4 0.5
San Gabriel Boulevard
4 35,110 19.8 20.2 0.4 69.3 71.1 1.8 89.5 92.4 2.9 11.9 12.3 0.4
Walnut Grove Avenue
3 15,340 19.8 20.2 0.4 40.6 41.6 1.0 9.9 10.2 0.3 2.6 2.7 0.1
Encinita Avenue 2 6,390 19.8 20.2 0.4 40.5 41.5 1.0 3.7 3.8 0.1 2.2 2.3 0.1
Lower Azusa Road
4 17,400 19.8 20.2 0.4 40.6 41.6 1.0 10.8 11.1 0.3 2.5 2.5 0.1
Temple City Boulevard
4 20,880 19.8 20.2 0.4 40.6 41.6 1.0 13.7 14.1 0.4 2.7 2.8 0.1
Baldwin Avenue 4 25,900 19.8 20.2 0.4 40.6 41.6 1.0 18.5 19.1 0.6 3.0 3.1 0.1
Arden Drive 4 11,050 19.8 20.2 0.4 40.6 41.6 1.0 6.3 6.4 0.2 2.2 2.2 0.1
El Monte Junction MP 494.99
Tyler Avenue 4 11,770 58.1 58.5 0.4 68.2 69.1 1.0 9.2 9.4 0.2 3.2 3.3 0.1
Cogswell Road 2 10,070 58.1 58.5 0.4 67.9 68.9 1.0 8.9 9.1 0.2 3.9 3.9 0.1
Temple Avenue 4 27,060 58.1 58.5 0.4 68.2 69.1 1.0 27.3 27.9 0.6 4.7 4.8 0.1
Bassett Junction MP 498.45

Berths 97–109 (China Shipping) Container Terminal Draft Supplemental EIR C2-38
SCH #2014101050 June 2017
Boundary/Junction – Street
# of Lanes
Average Daily
Traffic (Vehicles/
Day)
Average Daily Train Volume
(Trains/Day)*
Daily Total Gate Down Time
(Minutes/Day)
Daily Total Vehicle Hours of Delay
(Veh-Hrs/Day)
P.M. Peak-Hour Average Delay per Vehicle (Seconds/Vehicle)
Base Base
+ Proj.Change Base
Base + Proj.
Change Base Base + Proj.
Change Base Base
+ Proj.Change
Vineland Avenue 2 12,550 20.6 21.0 0.4 41.2 42.2 1.0 8.9 9.2 0.3 3.0 3.1 0.1
Puente Avenue 4 31,800 20.6 21.0 0.4 41.3 42.3 1.0 26.0 26.7 0.8 3.7 3.8 0.1
Orange Avenue 2 5,770 20.6 21.0 0.4 41.2 42.2 1.0 3.3 3.4 0.1 2.2 2.3 0.1
California Avenue 2 18,770 20.6 21.0 0.4 41.2 42.2 1.0 17.6 18.1 0.5 4.5 4.7 0.1
City of Industry Junction MP 501.5
Fullerton Road 4 18,280 23.9 24.3 0.4 47.9 48.9 1.0 13.5 13.8 0.3 3.0 3.0 0.1
Fairway Drive 4 19,830 23.9 24.3 0.4 47.9 48.9 1.0 15.0 15.3 0.4 3.1 3.2 0.1
Lemon Road 4 17,180 23.9 24.3 0.4 47.9 48.9 1.0 12.4 12.8 0.3 2.9 3.0 0.1
Brea Canyon Road
2 14,390 23.9 24.3 0.4 47.8 48.8 1.0 12.7 13.0 0.3 3.9 4.0 0.1
Pomona Junction MP 514.3
HANDLED SEPARATELY DUE TO PROXIMITY TO UP LOS ANGELES SUBDIVISION LA-San Bernardino County Line MP 516.7 Montclair Junction
Bon View Avenue 2 10,230 27.6 28.0 0.4 54.5 55.5 1.0 8.6 8.8 0.2 3.4 3.5 0.1
Vineyard Avenue 4 31,400 27.6 28.0 0.4 54.6 55.6 1.0 32.5 33.2 0.8 4.6 4.7 0.1
Milliken Avenue 6 34,910 27.6 28.0 0.4 54.7 55.7 1.0 31.1 31.9 0.7 3.7 3.8 0.1
Kaiser Junction MP 527.5
West Colton MP 534.7
Colton Crossing MP 538.70
OVERALL:
Total Daily Vehicle Hours of Delay (Veh-Hrs/Day)
579.3 596.4 17.1

Berths 97–109 (China Shipping) Container Terminal Draft Supplemental EIR C2-39
SCH #2014101050 June 2017
Boundary/Junction – Street
# of Lanes
Average Daily
Traffic (Vehicles/
Day)
Average Daily Train Volume
(Trains/Day)*
Daily Total Gate Down Time
(Minutes/Day)
Daily Total Vehicle Hours of Delay
(Veh-Hrs/Day)
P.M. Peak-Hour Average Delay per Vehicle (Seconds/Vehicle)
Base Base
+ Proj.Change Base
Base + Proj.
Change Base Base + Proj.
Change Base Base
+ Proj.Change
Maximum P.M. Peak Average Delay per Vehicle (Seconds/Vehicle)
15.8 16.4 0.6
*The number of trains would not be affected by the presence or absence of SCIG and ICTF modernization projects. Source: San Pedro Bay Ports “Train Builder” model for intermodal trains estimation; SCAG’s non-intermodal freight and passenger train data and projections; San Pedro Bay
Ports compiled vehicular traffic data and projections; and San Pedro Bay Ports Peak Hour Average Vehicular Delay Calculation Methodology.

Berths 97–109 (China Shipping) Container Terminal Draft Supplemental EIR C2-40
SCH #2014101050 June 2017
Table C2-18: UP Los Angeles Subdivision from East Los Angeles Yard to West Riverside Junction, P.M. Peak-Hour Average Vehicular Delays for Study At-Grade Crossings, 2014 Baseline and 2014 Baseline plus Revised Project (Excluding Segment That is Combined with UP Alhambra Subdivision)
Boundary/Junction – Street
# of Lanes
Average Daily
Traffic (Vehicles/
Day)
Average Daily Train Volume*
(Trains/Day)
Daily Total Gate Down Time
(Minutes/Day)
Daily Total Vehicle Hours of Delay
(Veh-Hrs/Day)
P.M. Peak-Hour Average Delay per Vehicle (Seconds/Vehicle)
Base Base
+ Proj.Change Base
Base + Proj.
Change Base Base + Proj.
Change Base Base + Proj.
Change
East Los Angeles MP 5.85
S. Vail Avenue 2 7,900 29.1 29.5 0.4 63.4 65.0 1.6 10.5 10.9 0.4 5.4 5.6 0.2 Maple Avenue 2 5,550 29.1 29.5 0.4 63.4 65.0 1.6 6.9 7.1 0.2 4.9 5.1 0.2 S. Greenwood Avenue
4 7,280 29.1 29.5 0.4 63.6 65.2 1.6 8.7 9.0 0.3 4.6 4.8 0.2
Montebello Boulevard
4 20,550 29.1 29.5 0.4 63.6 65.2 1.6 29.6 30.6 1.0 6.1 6.3 0.2
Durfee Avenue 2 13,960 29.1 29.5 0.4 44.3 45.3 1.0 10.6 10.9 0.3 3.4 3.5 0.1 Rose Hills Road 4 9,450 29.1 29.5 0.4 42.4 43.3 1.0 4.8 5.0 0.1 2.1 2.1 0.1 Mission Mill Road 2 2,180 29.1 29.5 0.4 42.2 43.2 1.0 1.0 1.1 0.0 1.9 1.9 0.1 Workman Mill 4 7,650 29.1 29.5 0.4 42.4 43.3 1.0 3.8 3.9 0.1 2.0 2.0 0.1 Turnbull Canyon Road
4 14,440 29.1 29.5 0.4 42.4 43.3 1.0 7.9 8.1 0.2 2.3 2.3 0.1
Stimson Avenue& Puente Avenue
4 14,720 29.1 29.5 0.4 42.4 43.3 1.0 8.1 8.3 0.2 2.3 2.3 0.1
Bixby Drive 2 2,960 29.1 29.5 0.4 42.2 43.2 1.0 1.4 1.5 0.0 1.9 2.0 0.1 Fullerton Road 4 24,240 29.1 29.5 0.4 42.4 43.3 1.0 15.5 16.0 0.5 2.8 2.9 0.1 Nogales Street 6 37,730 29.1 29.5 0.4 42.5 43.5 1.0 24.7 25.5 0.7 2.9 3.0 0.1 Fairway Drive 4 25,350 29.1 29.5 0.4 42.4 43.3 1.0 16.6 17.1 0.5 2.9 3.0 0.1 Lemon Street 4 15,060 29.1 29.5 0.4 42.4 43.3 1.0 8.3 8.6 0.3 2.3 2.4 0.1
Pomona Junction MP 31.9
HANDLED SEPARATELY DUE TO PROXIMITY TO UP ALHAMBRA SUBDIVSION LA-San Bernardino County Line MP 33.17
E. Montclair Junction MP 35.02
Bonview Avenue 2 3,560 30.5 30.9 0.4 44.7 45.7 1.0 1.9 1.9 0.1 2.1 2.1 0.1 Grove Avenue 6 40,370 30.5 30.9 0.4 45.0 45.9 1.0 29.6 30.4 0.8 3.3 3.4 0.1 Vineyard Avenue 4 4,550 30.5 30.9 0.4 44.8 45.8 1.0 2.3 2.4 0.1 2.0 2.0 0.1 Archibald Avenue 4 5,380 30.5 30.9 0.4 44.8 45.8 1.0 2.8 2.9 0.1 2.0 2.1 0.1

Berths 97–109 (China Shipping) Container Terminal Draft Supplemental EIR C2-41
SCH #2014101050 June 2017
Boundary/Junction – Street
# of Lanes
Average Daily
Traffic (Vehicles/
Day)
Average Daily Train Volume*
(Trains/Day)
Daily Total Gate Down Time
(Minutes/Day)
Daily Total Vehicle Hours of Delay
(Veh-Hrs/Day)
P.M. Peak-Hour Average Delay per Vehicle (Seconds/Vehicle)
Base Base
+ Proj.Change Base
Base + Proj.
Change Base Base + Proj.
Change Base Base + Proj.
Change
San Bernardino-Riverside County Line MP 43.36
Milliken Avenue 6 21,520 30.5 30.9 0.4 45.0 45.9 1.0 12.5 12.8 0.4 2.4 2.5 0.1 Mira Loma Junction MP 45.7
Bellegrave Avenue 2 7,910 30.8 31.2 0.4 45.1 46.1 1.0 4.7 4.8 0.1 2.5 2.5 0.1 Rutile Street 2 8,490 30.8 31.2 0.4 45.1 46.1 1.0 5.1 5.2 0.1 2.5 2.6 0.1 Clay Street 2 16,730 30.8 31.2 0.4 45.2 46.2 1.0 10.1 10.3 0.3 2.5 2.6 0.1 Jurupa Ave 4 14,500 30.8 31.2 0.4 53.1 54.2 1.2 15.2 15.6 0.4 4.8 4.9 0.1 Mountain View Avenue
2 1,760 30.8 31.2 0.4 53.1 54.2 1.2 1.3 1.3 0.0 2.7 2.8 0.1
Streeter Avenue 4 14,220 30.8 31.2 0.4 53.2 54.4 1.2 11.7 12.0 0.3 3.3 3.4 0.1 Palm Avenue 2 7,690 30.8 31.2 0.4 49.9 51.0 1.1 5.6 5.8 0.2 3.0 3.1 0.1 Brockton Avenue 4 13,710 30.8 31.2 0.4 53.2 54.4 1.2 11.2 11.5 0.3 3.3 3.4 0.1 Riverside Avenue 2 11,800 30.8 31.2 0.4 53.1 54.2 1.2 11.2 11.5 0.3 4.1 4.2 0.1 Panorama Road 2 6,550 30.8 31.2 0.4 53.1 54.2 1.2 5.3 5.4 0.2 3.3 3.3 0.1
West Riverside Junction MP 56.7
OVERALL: Total Daily Vehicle Hours of Delay (Veh-Hrs/Day)
288.7 297.4 8.7
Maximum P.M. Peak Average Delay per Vehicle (Seconds/Vehicle)
6.1 6.3 0.2
*The number of trains would not be affected by the presence or absence of SCIG and ICTF modernization projects. Source: San Pedro Bay Ports “Train Builder” model for intermodal trains estimation; SCAG’s non-intermodal freight and passenger train data and projections; San Pedro Bay
Ports compiled vehicular traffic data and projections; and San Pedro Bay Ports Peak Hour Average Vehicular Delay Calculation Methodology.

Berths 97–109 (China Shipping) Container Terminal Draft Supplemental EIR C2-42
SCH #2014101050 June 2017
Table C2-19: Combined UP Alhambra and Los Angeles Subdivisions in Pomona and Montclair Area, P.M. Peak-Hour Average Vehicular Delays for Study At-Grade Crossings, 2014 Baseline and 2014 Baseline plus Revised Project
Boundary/Junction – Street
# of Lanes
Average Daily
Traffic (Vehicles/
Day)
Average Daily Train Volume*
(Trains/Day)
Daily Total Gate Down Time
(Minutes/Day)
Daily Total Vehicle Hours of Delay
(Veh-Hrs/Day)
P.M. Peak-Hour Average Delay per Vehicle (Seconds/Vehicle)
Base Base
+ Proj.Change Base
Base + Proj.
Change Base Base + Proj.
Change Base Base + Proj.
Change
Pomona Junction MP 514.3
Hamilton Boulevard 4 8,000 53.9 54.7 0.8 94.0 96.1 2.0 9.8 10.0 0.3 4.7 4.8 0.1 Park Avenue 2 5,660 53.9 54.7 0.8 93.8 95.8 2.0 7.2 7.4 0.2 5.0 5.1 0.1 Main Street 2 1,570 53.9 54.7 0.8 93.8 95.8 2.0 1.8 1.8 0.0 4.3 4.4 0.1 Palomares Street 2 3,870 53.9 54.7 0.8 93.8 95.8 2.0 4.7 4.8 0.1 4.7 4.8 0.1 San Antonio Avenue 4 6,880 53.9 54.7 0.8 94.0 96.1 2.0 8.3 8.5 0.2 4.6 4.7 0.1
LA-San Bernardino County Line MP 516.7
Monte Vista Avenue 4 12,440 53.9 54.7 0.8 94.0 96.1 2.0 16.0 16.5 0.4 5.1 5.2 0.1 San Antonio Avenue 4 10,540 53.9 54.7 0.8 94.0 96.1 2.0 13.2 13.6 0.4 4.9 5.1 0.1 Vine Avenue 2 7,730 53.9 54.7 0.8 93.8 95.8 2.0 10.3 10.6 0.3 5.4 5.5 0.1 Sultana Avenue 2 11,530 53.9 54.7 0.8 93.8 95.8 2.0 17.4 17.9 0.5 6.4 6.6 0.2 Campus Avenue 2 10,820 53.9 54.7 0.8 93.8 95.8 2.0 15.9 16.4 0.4 6.2 6.4 0.2
Montclair Junction OVERALL: Total Daily Vehicle Hours of Delay (Veh-Hrs/Day)
104.6 107.5 2.9
Maximum P.M. Peak Average Delay per Vehicle (Seconds/Vehicle)
6.4 6.6 0.2
*The number of trains would not be affected by the presence or absence of SCIG and ICTF modernization projects. Source: San Pedro Bay Ports “Train Builder” model for intermodal trains estimation; SCAG’s non-intermodal freight and passenger train data and projections; San Pedro Bay
Ports compiled vehicular traffic data and projections; and San Pedro Bay Ports Peak Hour Average Vehicular Delay Calculation Methodology.

Berths 97–109 (China Shipping) Container Terminal Draft Supplemental EIR C2-43
SCH #2014101050 June 2017
Table C2-20: UP Yuma Subdivision from Colton Crossing to Indio, P.M. Peak-Hour Average Vehicular Delays for Study At-Grade Crossings, 2014 Baseline and 2014 Baseline plus Revised Project
Boundary/Junction – Street
# of Lanes
Average Daily
Traffic (Vehicles/
Day)
Average Daily Train Volume*
(Trains/Day)
Daily Total Gate Down Time
(Minutes/Day)
Daily Total Vehicle Hours of Delay
(Veh-Hrs/Day)
P.M. Peak-Hour Average Delay per Vehicle (Seconds/Vehicle)
Base Base
+ Proj.Change Base
Base + Proj.
Change Base Base + Proj.
Change Base Base + Proj.
Change
Colton Crossing MP 539.0
Hunts Lane 4 14,110 44.4 45.1 0.7 101.3 103.3 2.0 23.6 24.1 0.6 6.5 6.7 0.2
Whittier Avenue 2 200 44.4 45.1 0.7 119.6 122.0 2.4 0.4 0.4 0.0 7.0 7.2 0.2
Beaumont Avenue 2 480 44.4 45.1 0.7 119.6 122.0 2.4 0.9 1.0 0.0 7.1 7.3 0.2
San Timoteo Canyon Road
2 12,160 44.4 45.1 0.7 119.6 122.0 2.4 33.8 34.6 0.9 11.8 12.1 0.3
Alessandro Road 2 300 44.4 45.1 0.7 119.6 122.0 2.4 0.6 0.6 0.0 7.1 7.2 0.2
San Bernardino-Riverside County Line MP 549.25
Live Oak Canyon Road
2 1,150 44.4 45.1 0.7 119.6 122.0 2.4 2.3 2.3 0.1 7.2 7.4 0.2
San Timoteo Canyon Road
2 1,480 44.4 45.1 0.7 119.6 122.0 2.4 3.0 3.0 0.1 7.3 7.5 0.2
Viele Avenue 2 110 44.4 45.1 0.7 101.0 103.0 2.0 0.2 0.2 0.0 5.0 5.1 0.1
California Avenue 2 6,860 44.4 45.1 0.7 101.0 103.0 2.0 11.0 11.3 0.3 6.2 6.3 0.2
Pennsylvania Avenue
2 8,500 44.4 45.1 0.7 101.0 103.0 2.0 14.2 14.6 0.4 6.6 6.7 0.2
North Sunset Avenue
2 3,960 44.4 45.1 0.7 101.0 103.0 2.0 5.9 6.1 0.1 5.6 5.7 0.1
22nd Street 4 16,080 44.4 45.1 0.7 101.3 103.3 2.0 26.7 27.3 0.7 6.5 6.6 0.2
San Gorgonio Avenue
2 13,310 44.4 45.1 0.7 101.0 103.0 2.0 25.5 26.1 0.6 8.0 8.2 0.2
Hargrave Street 2 17,300 44.4 45.1 0.7 101.0 103.0 2.0 38.0 39.0 1.0 9.7 10.0 0.2
Apache Trail 2 2,630 44.4 45.1 0.7 101.0 103.0 2.0 3.8 3.9 0.1 5.4 5.5 0.1
Broadway 2 6,930 44.4 45.1 0.7 101.0 103.0 2.0 11.1 11.4 0.3 6.2 6.3 0.2
Tipton Road 2 120 44.4 45.1 0.7 101.0 103.0 2.0 0.2 0.2 0.0 5.0 5.1 0.1
Garnet MP 588.32
West Indio MP 609.63

Berths 97–109 (China Shipping) Container Terminal Draft Supplemental EIR C2-44
SCH #2014101050 June 2017
Boundary/Junction – Street
# of Lanes
Average Daily
Traffic (Vehicles/
Day)
Average Daily Train Volume*
(Trains/Day)
Daily Total Gate Down Time
(Minutes/Day)
Daily Total Vehicle Hours of Delay
(Veh-Hrs/Day)
P.M. Peak-Hour Average Delay per Vehicle (Seconds/Vehicle)
Base Base
+ Proj.Change Base
Base + Proj.
Change Base Base + Proj.
Change Base Base + Proj.
Change
Indio MP 610.9
Avenue 52 4 11,410 44.4 45.1 0.7 101.3 103.3 2.0 17.9 18.3 0.4 6.0 6.1 0.1 Avenue 56/Airport Boulevard
2 4,970 44.4 45.1 0.7 101.0 103.0 2.0 7.6 7.8 0.2 5.8 5.9 0.1
Avenue 66/4th Street
2 8,150 44.4 45.1 0.7 101.0 103.0 2.0 13.5 13.8 0.3 6.5 6.6 0.2
OVERALL: Total Daily Vehicle Hours of Delay (Veh-Hrs/Day)
240.0 246.1 6.1
Maximum P.M. Peak Average Delay per Vehicle (Seconds/Vehicle)
11.8 12.1 0.3
*The number of trains would not be affected by the presence or absence of SCIG and ICTF modernization projects. Source: San Pedro Bay Ports “Train Builder” model for intermodal trains estimation; SCAG’s non-intermodal freight and passenger train data and projections; San Pedro Bay
Ports compiled vehicular traffic data and projections; and San Pedro Bay Ports Peak Hour Average Vehicular Delay Calculation Methodology.

Berths 97–109 (China Shipping) Container Terminal Draft Supplemental EIR C2-45
SCH #2014101050 June 2017
Table C2-21: P.M. Peak-Hour Average Vehicular Delays for Henry Ford Avenue At-Grade Crossing, 2014 Baseline and 2014 Baseline plus Revised Project
Boundary/Junction – Street
# of Lanes
P.M. Peak Hour
Traffic (Vehicles)
P.M. Peak Hour Train Volume* (Trains)
P.M. Peak Hour Total Gate Down Time
(Minutes)
P.M. Peak Hour Total Vehicle Hours of Delay
(Veh-Hrs)
P.M. Peak Hour Average Delay per Vehicle (Seconds/Vehicle)
Base Base
+ Proj.Change Base
Base + Proj.
Change Base Base + Proj.
Change Base Base + Proj.
Change
Henry Ford Avenue 6 1,010 0.92 1.05 0.13 4.3 5.2 0.9 4.8 6.4 1.6 17.1 22.9 5.8
*The number of trains would not be affected by the presence or absence of SCIG and ICTF modernization projects. Source: Henry Ford Avenue crossing controller data for May/June 2016; POLA 2045 build out rail simulation data; PortTAM Travel Demand Model for this EIR; and San Pedro
Bay Ports Peak Hour Average Vehicular Delay Calculation Methodology.
Table C2-22: P.M. Peak-Hour Average Vehicular Delays at the Henry Ford Avenue At-Grade Crossing, Future Baseline and Revised Project Cumulative Scenarios
Boundary/Junction – Street
# of Lanes
P.M. Peak Hour
Traffic (Vehicles)
P.M. Peak Hour Train Volume* (Trains)
P.M. Peak Hour Total Gate Down Time
(Minutes)
P.M. Peak Hour Total Vehicle Hours of Delay
(Veh-Hrs)
P.M. Peak-Hour Average Delay per Vehicle (Seconds/Vehicle)
Future Base
Cum. ChangeFuture Base
Cum. Change Future Base.
Cum. ChangeFuture Base
Cum. Change
Henry Ford Avenue 6 1,600 1.10 1.23 0.13 6.8 7.7 0.9 18.3 21.3 3.0 41.3 47.9 6.6
*The number of trains would not be affected by the presence or absence of SCIG and ICTF modernization projects. Source: Henry Ford Avenue crossing controller data for May/June 2016; POLA 2045 build out rail simulation data; San Pedro Bay Ports “Train Builder” model for intermodal
trains estimation; PortTAM Travel Demand Model for this EIR; and San Pedro Bay Ports Peak Hour Average Vehicular Delay Calculation Methodology.

Berths 97–109 (China Shipping) Container Terminal Draft Supplemental EIR C2-46
SCH #2014101050 June 2017
C2.4 Cumulative Analysis – Henry Ford Avenue Crossing This analysis calculated the P.M. peak-hour average vehicular delays for the Henry Ford Avenue at-grade crossing under the Future Baseline (2045 conditions with background growth and all related projects) and Revised Project Cumulative (Future Baseline plus the Revised Project) conditions. The Revised Project Cumulative scenario includes Revised Project-added trains resulting from the increased throughput of the Revised Project compared to the Approved Project. There was no difference in Revised Project-added train volumes with or without the SCIG and ICTF projects for the Henry Ford Avenue at-grade crossing. The vehicular traffic volumes at the Henry Ford Avenue crossing were kept the same under both Future Baseline and Revised Project Cumulative conditions.
As Table C2-22 shows, P.M. peak-hour average vehicular delay at that crossing were predicted to be less than 55 seconds under Revised Project Cumulative conditions.
C2.5 Cumulative Analysis – Inland Empire At-Grade Rail Crossings (Information Only) This analysis calculated P.M. peak-hour average vehicular delays for at-grade crossings on rail mainlines east of the downtown railyards (Figure CS-1) for Future Baseline (2045) and Revised Project Cumulative conditions (see previous section for descriptions of these scenarios). This analysis was conducted for informational purposes only because CEQA does not require the Port to evaluate impacts of rail activity outside its vicinity (see Section 3.3.2.3). Revised Project-added train volumes with the SCIG and ICTF projects were slightly higher than those without those projects for at-grade crossings on BNSF rail lines, but there was no difference on the UP rail lines. The roadway volumes at at-grade crossings were kept the same under both Future Baseline and Revised Project Cumulative conditions.
As tables C2-23 to C2-30 show, P.M. peak-hour average vehicular delays at the Del Mar Avenue at-grade crossing on the UP Alhambra line and at the Hargrave Street at-grade crossing on the UP Yuma line would be more than 55 seconds under both Future Baseline and Revised Project Cumulative conditions. The Revised Project’s rail traffic would add 1 second of delay at Del Mar Avenue (Table C2-) and 0.7 second or delay at Hargrave Street (Table C2-). The average vehicular delays at all other at-grade crossings would be less than 55 seconds.
The delays at Del Mar Avenue and Hargrave Street exceed the threshold of 55 seconds per vehicle (equivalent to LOS D) considered acceptable operating conditions. However, both at-grade crossings will be removed. A grade separation project is already underway at the Del Mar Avenue crossing, and the Riverside County Transportation Commission has identified Hargrave Street as one of the topmost priority crossings for grade separation (RCTC 2012). Accordingly, at some point in the future there will be no vehicular delay at either location.
C2.6 References Riverside County Transportation Commission (RCTC). 2012. Grade Separation Priority Update Study for Alameda Corridor East (Riverside County). Final Report. Prepared by InfraConsult. March 2012. http://rctc.org/uploads/media_items/rctc-gradecrossingpriorityreport-final-withappendix-040612.original.pdf

Berths 97–109 (China Shipping) Container Terminal Draft Supplemental EIR C2-47
SCH #2014101050 June 2017
Table CS-23: BNSF San Bernardino Subdivision, from Hobart Yard to San Bernardino, P.M. Peak-Hour Average Vehicular Delays for Study At-Grade Crossings, 2045, Future Baseline and Revised Project Cumulative (without SCIG and ICTF projects)
Boundary/Junction – Street
# of Lanes
Average Daily
Traffic (Vehicles/
Day)
Average Daily Train Volume
(Trains/Day)
Daily Total Gate Down Time
(Minutes/Day)
Daily Total Vehicle Hours of Delay
(Veh-Hrs/Day)
P.M. Peak-Hour Average Delay per Vehicle (Seconds/Vehicle)
Future Base
Rev Proj Cum
ChangeFuture Base
Rev Proj Cum
ChangeFuture Base
Rev Proj Cum
ChangeFuture Base
Rev Proj Cum
Change
San Bernardino MP 0.0 Laurel Street 2 3,730 108.8 109.4 0.6 228.7 230.6 2.0 13.4 13.6 0.2 13.6 13.8 0.2 Olive Street 2 4,440 108.8 109.4 0.6 228.7 230.6 2.0 16.3 16.5 0.2 14.1 14.2 0.2 E Street 2 1,170 108.8 109.4 0.6 228.7 230.6 2.0 3.9 4.0 0.0 12.3 12.4 0.1 H Street 2 2,330 108.8 109.4 0.6 228.7 230.6 2.0 8.1 8.1 0.1 12.9 13.0 0.1 Valley Boulevard 2 17,510 108.8 109.4 0.6 228.7 230.6 2.0 115.9 117.3 1.3 32.5 32.9 0.4
Colton Crossing MP 3.2
Highgrove Junction MP 6.1 (Connection to Perris via MetroLink)
Main Street 2 4,260 160.0 161.0 1.0 323.0 326.0 3.0 22.1 22.3 0.3 19.8 20.0 0.2 Riverside-San Bernardino County Line MP 6.41
Center Street 4 9,360 160.0 161.0 1.0 323.9 326.9 3.0 48.7 49.3 0.6 19.7 20.0 0.2 Iowa Avenue 4 34,500 160.0 161.0 1.0 323.9 326.9 3.0 283.4 287.1 3.7 37.2 37.7 0.5 Palmyrita Avenue 2 5,650 160.0 161.0 1.0 323.0 326.0 3.0 30.0 30.4 0.4 20.4 20.6 0.2 Chicago Avenue 4 20,430 160.0 161.0 1.0 323.9 326.9 3.0 125.7 127.2 1.6 24.9 25.2 0.3 Spruce Street 4 10,910 160.0 161.0 1.0 323.9 326.9 3.0 58.0 58.7 0.7 20.3 20.6 0.2 3rd Street 4 16,420 160.0 161.0 1.0 323.9 326.9 3.0 94.6 95.8 1.2 22.8 23.0 0.3 Mission Inn (7th Street)
4 8,030 160.0 161.0 1.0 323.9 326.9 3.0 41.0 41.5 0.5 19.3 19.5 0.2
Riverside Yard and Amtrak Station MP 10.02-10.16
Cridge Street 2 5,670 172.0 173.0 1.0 331.8 334.8 3.0 30.9 31.2 0.4 21.1 21.4 0.3

Berths 97–109 (China Shipping) Container Terminal Draft Supplemental EIR C2-48
SCH #2014101050 June 2017
Boundary/Junction – Street
# of Lanes
Average Daily
Traffic (Vehicles/
Day)
Average Daily Train Volume
(Trains/Day)
Daily Total Gate Down Time
(Minutes/Day)
Daily Total Vehicle Hours of Delay
(Veh-Hrs/Day)
P.M. Peak-Hour Average Delay per Vehicle (Seconds/Vehicle)
Future Base
Rev Proj Cum
ChangeFuture Base
Rev Proj Cum
ChangeFuture Base
Rev Proj Cum
ChangeFuture Base
Rev Proj Cum
Change
West Riverside Junction MP 10.6 (Connection to UP Los Angeles Sub)
Jane Street 2 3,260 118.3 118.9 0.6 220.1 221.9 1.8 10.7 10.8 0.1 12.4 12.5 0.1 Mary Street 4 17,990 118.3 118.9 0.6 220.7 222.6 1.8 69.2 69.9 0.8 15.5 15.7 0.2 Washington Street 2 12,490 118.3 118.9 0.6 220.1 221.9 1.8 53.7 54.3 0.6 18.1 18.3 0.2 Madison Street 4 23,670 118.3 118.9 0.6 220.7 222.6 1.8 99.8 101.0 1.1 17.7 17.8 0.2 Jefferson Street 2 12,350 118.3 118.9 0.6 220.1 221.9 1.8 52.8 53.4 0.6 18.0 18.2 0.2 Adams Street 4 26,370 118.3 118.9 0.6 220.7 222.6 1.8 116.8 118.1 1.3 18.9 19.1 0.2 Jackson Street 4 11,770 118.3 118.9 0.6 220.7 222.6 1.8 41.4 41.8 0.5 13.7 13.8 0.1 Gibson Street 2 1,280 118.3 118.9 0.6 220.1 221.9 1.8 4.0 4.0 0.0 11.6 11.7 0.1 Harrison Street 2 10,030 118.3 118.9 0.6 220.1 221.9 1.8 39.6 40.1 0.4 16.1 16.3 0.2 Tyler Street 4 23,530 118.3 118.9 0.6 220.7 222.6 1.8 99.0 100.1 1.1 17.6 17.8 0.2 Pierce Street 2 16,840 118.3 118.9 0.6 220.1 221.9 1.8 86.2 87.2 1.0 23.2 23.5 0.3 Buchanan Street 2 14,410 118.3 118.9 0.6 220.1 221.9 1.8 66.6 67.3 0.7 20.1 20.3 0.2 Magnolia Avenue(eastbound)
2 13,240 118.3 118.9 0.6 220.1 221.9 1.8 58.5 59.1 0.7 18.9 19.1 0.2
Magnolia Avenue(westbound)
2 13,240 118.3 118.9 0.6 220.1 221.9 1.8 58.5 59.1 0.7 18.9 19.1 0.2
Mckinley Street 4 40,120 118.3 118.9 0.6 220.7 222.6 1.8 242.8 245.6 2.8 29.3 29.7 0.3 Radio Road 2 6,480 118.3 118.9 0.6 220.1 221.9 1.8 23.0 23.3 0.3 13.9 14.1 0.2 Joy Street 2 10,960 118.3 118.9 0.6 220.1 221.9 1.8 44.6 45.1 0.5 16.8 17.0 0.2 Sheridan Street 2 3,560 118.3 118.9 0.6 220.1 221.9 1.8 11.7 11.9 0.1 12.5 12.6 0.1 Cota Street 4 9,090 118.3 118.9 0.6 220.7 222.6 1.8 30.8 31.2 0.3 13.0 13.1 0.1 Railroad Street 4 14,570 118.3 118.9 0.6 220.7 222.6 1.8 53.2 53.8 0.6 14.4 14.6 0.2 Smith Street 4 20,620 118.3 118.9 0.6 220.7 222.6 1.8 82.6 83.5 0.9 16.4 16.6 0.2 Auto Center Drive 2 17,430 118.3 118.9 0.6 220.1 221.9 1.8 91.7 92.8 1.0 24.1 24.4 0.3
Riverside-Orange County Line
Kellogg Drive 4 8,300 118.3 118.9 0.6 220.7 222.6 1.8 28.1 28.4 0.3 12.9 13.1 0.1 Lakeview Avenue 3 22,780 118.3 118.9 0.6 220.4 222.2 1.8 112.8 114.0 1.3 22.2 22.4 0.2 Richfield Road 4 11,440 118.3 118.9 0.6 220.7 222.6 1.8 40.4 40.9 0.4 13.8 13.9 0.1

Berths 97–109 (China Shipping) Container Terminal Draft Supplemental EIR C2-49
SCH #2014101050 June 2017
Boundary/Junction – Street
# of Lanes
Average Daily
Traffic (Vehicles/
Day)
Average Daily Train Volume
(Trains/Day)
Daily Total Gate Down Time
(Minutes/Day)
Daily Total Vehicle Hours of Delay
(Veh-Hrs/Day)
P.M. Peak-Hour Average Delay per Vehicle (Seconds/Vehicle)
Future Base
Rev Proj Cum
ChangeFuture Base
Rev Proj Cum
ChangeFuture Base
Rev Proj Cum
ChangeFuture Base
Rev Proj Cum
Change
Atwood Junction MP 40.6 (Connection to Old Olive Sub)
Van Buren Street 2 8,170 89.3 89.9 0.6 187.9 189.7 1.8 27.7 28.0 0.3 13.5 13.7 0.2 Jefferson Street 3 7,670 89.3 89.9 0.6 188.2 190.0 1.8 23.8 24.1 0.3 11.9 12.1 0.1 Tustin Avenue (Rose Drive)
4 35,230 89.3 89.9 0.6 188.4 190.2 1.8 174.0 176.1 2.1 23.1 23.4 0.3
Orangethorpe Avenue
4 34,210 89.3 89.9 0.6 188.4 190.2 1.8 164.6 166.7 2.0 22.3 22.6 0.3
Kraemer Boulevard 4 23,890 89.3 89.9 0.6 188.4 190.2 1.8 92.2 93.4 1.1 16.3 16.5 0.2 Placentia Avenue 4 17,510 89.3 89.9 0.6 188.4 190.2 1.8 60.6 61.4 0.7 13.9 14.1 0.2 State College Boulevard
4 28,480 89.3 89.9 0.6 188.4 190.2 1.8 120.3 121.8 1.5 18.5 18.7 0.2
Acacia Avenue 4 8,140 89.3 89.9 0.6 188.4 190.2 1.8 24.6 24.9 0.3 11.5 11.6 0.1 Raymond Avenue 4 25,390 89.3 89.9 0.6 188.4 190.2 1.8 100.8 102.0 1.2 16.9 17.1 0.2
Fullerton Junction MP 45.5 = MP 165.5
Orange-LA County Line
Valley View Avenue 4 28,610 144.3 144.9 0.6 231.8 233.6 1.8 140.7 142.3 1.6 21.9 22.1 0.2 Rosecrans/Marquardt Avenue
4 27,020 144.3 144.9 0.6 231.8 233.6 1.8 128.2 129.6 1.4 20.8 21.1 0.2
Lakeland Road 2 7,610 144.3 144.9 0.6 231.0 232.8 1.8 28.7 29.0 0.3 15.2 15.3 0.2 Los Nietos Road 4 23,840 144.3 144.9 0.6 231.8 233.6 1.8 105.8 106.9 1.2 19.0 19.2 0.2 Norwalk Boulevard 4 30,550 144.3 144.9 0.6 231.8 233.6 1.8 157.3 159.1 1.8 23.4 23.6 0.3 Pioneer Boulevard 4 17,830 144.3 144.9 0.6 231.8 233.6 1.8 70.7 71.5 0.8 16.2 16.4 0.2 Passons Boulevard 4 14,780 144.3 144.9 0.6 231.8 233.6 1.8 55.7 56.3 0.6 15.1 15.3 0.2 Serapis Avenue 2 7,300 144.3 144.9 0.6 231.0 232.8 1.8 27.3 27.6 0.3 15.0 15.1 0.2
Commerce Yard MP 148.5
Hobart Yard MP 146.0 OVERALL:

Berths 97–109 (China Shipping) Container Terminal Draft Supplemental EIR C2-50
SCH #2014101050 June 2017
Boundary/Junction – Street
# of Lanes
Average Daily
Traffic (Vehicles/
Day)
Average Daily Train Volume
(Trains/Day)
Daily Total Gate Down Time
(Minutes/Day)
Daily Total Vehicle Hours of Delay
(Veh-Hrs/Day)
P.M. Peak-Hour Average Delay per Vehicle (Seconds/Vehicle)
Future Base
Rev Proj Cum
ChangeFuture Base
Rev Proj Cum
ChangeFuture Base
Rev Proj Cum
ChangeFuture Base
Rev Proj Cum
Change
Total Daily Vehicle Hours of Delay (Veh-Hrs/Day)
4,013.5 4,060.4 46.8
Maximum P.M. Peak Average Delay per Vehicle (Seconds/Vehicle)
37.2 37.7 0.5
Source: San Pedro Bay Ports “Train Builder” model for intermodal trains estimation; SCAG’s non-intermodal freight and passenger train data and projections; San Pedro Bay Ports compiled vehicular traffic data and projections; and San Pedro Bay Ports Peak Hour Average Vehicular Delay Calculation Methodology.

Berths 97–109 (China Shipping) Container Terminal Draft Supplemental EIR C2-51
SCH #2014101050 June 2017
Table C2-24: BNSF San Bernardino Subdivision, from Hobart Yard to San Bernardino, P.M. Peak-Hour Average Vehicular Delays for Study At-Grade Crossings, 2045, Future Baseline and Revised Project Cumulative (with SCIG and ICTF projects)
Boundary/Junction – Street
# of Lanes
Average Daily
Traffic (Vehicles/
Day)
Average Daily Train Volume
(Trains/Day)
Daily Total Gate Down Time
(Minutes/Day)
Daily Total Vehicle Hours of Delay
(Veh-Hrs/Day)
P.M. Peak-Hour Average Delay per Vehicle (Seconds/Vehicle)
Future Base
Rev Proj Cum
Change
Future Base
Rev Proj Cum
Change
Future Base
Rev Proj Cum
Change
Future Base
Rev Proj Cum
Change
San Bernardino MP 0.0
Laurel Street 2 3,730 109.3 110.0 0.7 229.0 231.0 2.0 13.4 13.5 0.1 13.6 13.7 0.1 Olive Street 2 4,440 109.3 110.0 0.7 229.0 231.0 2.0 16.3 16.4 0.2 14.0 14.2 0.2 E Street 2 1,170 109.3 110.0 0.7 229.0 231.0 2.0 3.9 3.9 0.0 12.3 12.4 0.1 H Street 2 2,330 109.3 110.0 0.7 229.0 231.0 2.0 8.0 8.1 0.1 12.8 13.0 0.1 Valley Boulevard 2 17,510 109.3 110.0 0.7 229.0 231.0 2.0 115.6 116.9 1.3 32.4 32.8 0.4
Colton Crossing MP 3.2
Highgrove Junction MP 6.1 (Connection to Perris via MetroLink)
Main Street 2 4,260 160.6 161.6 1.0 323.4 326.4 3.0 22.0 22.3 0.3 19.7 20.0 0.2 Riverside-San Bernardino County Line MP 6.41
Center Street 4 9,360 160.6 161.6 1.0 324.3 327.3 3.0 48.6 49.2 0.6 19.7 19.9 0.2 Iowa Avenue 4 34,500 160.6 161.6 1.0 324.3 327.3 3.0 283.0 286.6 3.6 37.2 37.7 0.5 Palmyrita Avenue 2 5,650 160.6 161.6 1.0 323.4 326.4 3.0 30.0 30.3 0.4 20.4 20.6 0.2 Chicago Avenue 4 20,430 160.6 161.6 1.0 324.3 327.3 3.0 125.4 127.0 1.5 24.9 25.2 0.3 Spruce Street 4 10,910 160.6 161.6 1.0 324.3 327.3 3.0 57.8 58.5 0.7 20.3 20.5 0.2 3rd Street 4 16,420 160.6 161.6 1.0 324.3 327.3 3.0 94.4 95.6 1.2 22.7 23.0 0.3 Mission Inn (7th Street)
4 8,030 160.6 161.6 1.0 324.3 327.3 3.0 40.9 41.4 0.5 19.2 19.5 0.2
Riverside Yard and Amtrak Station MP 10.02-10.16
Cridge Street 2 5,670 172.6 173.6 1.0 332.2 335.2 3.0 30.8 31.2 0.4 21.1 21.3 0.2

Berths 97–109 (China Shipping) Container Terminal Draft Supplemental EIR C2-52
SCH #2014101050 June 2017
Boundary/Junction – Street
# of Lanes
Average Daily
Traffic (Vehicles/
Day)
Average Daily Train Volume
(Trains/Day)
Daily Total Gate Down Time
(Minutes/Day)
Daily Total Vehicle Hours of Delay
(Veh-Hrs/Day)
P.M. Peak-Hour Average Delay per Vehicle (Seconds/Vehicle)
Future Base
Rev Proj Cum
Change
Future Base
Rev Proj Cum
Change
Future Base
Rev Proj Cum
Change
Future Base
Rev Proj Cum
Change
West Riverside Junction MP 10.6 (Connection to UP Los Angeles Sub)
Jane Street 2 3,260 118.8 119.5 0.6 220.5 222.3 1.8 10.6 10.7 0.1 12.3 12.5 0.1 Mary Street 4 17,990 118.8 119.5 0.6 221.1 223.0 1.8 68.9 69.7 0.8 15.4 15.6 0.2 Washington Street 2 12,490 118.8 119.5 0.6 220.5 222.3 1.8 53.5 54.1 0.6 18.1 18.3 0.2 Madison Street 4 23,670 118.8 119.5 0.6 221.1 223.0 1.8 99.5 100.6 1.1 17.6 17.8 0.2 Jefferson Street 2 12,350 118.8 119.5 0.6 220.5 222.3 1.8 52.6 53.2 0.6 18.0 18.2 0.2 Adams Street 4 26,370 118.8 119.5 0.6 221.1 223.0 1.8 116.4 117.7 1.3 18.8 19.0 0.2 Jackson Street 4 11,770 118.8 119.5 0.6 221.1 223.0 1.8 41.2 41.7 0.4 13.6 13.8 0.1 Gibson Street 2 1,280 118.8 119.5 0.6 220.5 222.3 1.8 4.0 4.0 0.0 11.5 11.7 0.1 Harrison Street 2 10,030 118.8 119.5 0.6 220.5 222.3 1.8 39.5 39.9 0.4 16.1 16.3 0.2 Tyler Street 4 23,530 118.8 119.5 0.6 221.1 223.0 1.8 98.7 99.8 1.1 17.5 17.7 0.2 Pierce Street 2 16,840 118.8 119.5 0.6 220.5 222.3 1.8 85.9 86.9 1.0 23.2 23.4 0.3 Buchanan Street 2 14,410 118.8 119.5 0.6 220.5 222.3 1.8 66.3 67.1 0.7 20.0 20.2 0.2 Magnolia Avenue(eastbound)
2 13,240 118.8 119.5 0.6 220.5 222.3 1.8 58.3 58.9 0.6 18.8 19.0 0.2
Magnolia Avenue(westbound)
2 13,240 118.8 119.5 0.6 220.5 222.3 1.8 58.3 58.9 0.6 18.8 19.0 0.2
Mckinley Street 4 40,120 118.8 119.5 0.6 221.1 223.0 1.8 242.1 244.8 2.7 29.3 29.6 0.3 Radio Road 2 6,480 118.8 119.5 0.6 220.5 222.3 1.8 23.0 23.2 0.3 13.9 14.0 0.1 Joy Street 2 10,960 118.8 119.5 0.6 220.5 222.3 1.8 44.5 45.0 0.5 16.8 17.0 0.2 Sheridan Street 2 3,560 118.8 119.5 0.6 220.5 222.3 1.8 11.7 11.8 0.1 12.5 12.6 0.1 Cota Street 4 9,090 118.8 119.5 0.6 221.1 223.0 1.8 30.7 31.1 0.3 13.0 13.1 0.1 Railroad Street 4 14,570 118.8 119.5 0.6 221.1 223.0 1.8 53.1 53.6 0.6 14.4 14.5 0.2 Smith Street 4 20,620 118.8 119.5 0.6 221.1 223.0 1.8 82.4 83.3 0.9 16.4 16.5 0.2 Auto Center Drive 2 17,430 118.8 119.5 0.6 220.5 222.3 1.8 91.4 92.4 1.0 24.1 24.3 0.3
Riverside-Orange County Line
Kellogg Drive 4 8,300 118.8 119.5 0.6 221.1 223.0 1.8 28.0 28.3 0.3 12.9 13.0 0.1 Lakeview Avenue 3 22,780 118.8 119.5 0.6 220.8 222.6 1.8 112.4 113.7 1.2 22.1 22.4 0.2 Richfield Road 4 11,440 118.8 119.5 0.6 221.1 223.0 1.8 40.3 40.7 0.4 13.7 13.9 0.1

Berths 97–109 (China Shipping) Container Terminal Draft Supplemental EIR C2-53
SCH #2014101050 June 2017
Boundary/Junction – Street
# of Lanes
Average Daily
Traffic (Vehicles/
Day)
Average Daily Train Volume
(Trains/Day)
Daily Total Gate Down Time
(Minutes/Day)
Daily Total Vehicle Hours of Delay
(Veh-Hrs/Day)
P.M. Peak-Hour Average Delay per Vehicle (Seconds/Vehicle)
Future Base
Rev Proj Cum
Change
Future Base
Rev Proj Cum
Change
Future Base
Rev Proj Cum
Change
Future Base
Rev Proj Cum
Change
Atwood Junction MP 40.6 (Connection to Old Olive Sub)
Van Buren Street 2 8,170 89.8 90.5 0.6 188.3 190.1 1.8 27.5 27.9 0.3 13.4 13.6 0.2 Jefferson Street 3 7,670 89.8 90.5 0.6 188.5 190.4 1.8 23.7 24.0 0.3 11.9 12.0 0.1 Tustin Avenue (Rose Drive)
4 35,230 89.8 90.5 0.6 188.8 190.6 1.8 173.4 175.5 2.1 23.0 23.3 0.3
Orangethorpe Avenue
4 34,210 89.8 90.5 0.6 188.8 190.6 1.8 164.0 166.0 2.0 22.2 22.5 0.3
Kraemer Boulevard 4 23,890 89.8 90.5 0.6 188.8 190.6 1.8 91.9 93.0 1.1 16.2 16.4 0.2 Placentia Avenue 4 17,510 89.8 90.5 0.6 188.8 190.6 1.8 60.4 61.1 0.7 13.9 14.0 0.2 State College Boulevard
4 28,480 89.8 90.5 0.6 188.8 190.6 1.8 119.8 121.3 1.4 18.4 18.6 0.2
Acacia Avenue 4 8,140 89.8 90.5 0.6 188.8 190.6 1.8 24.6 24.8 0.3 11.4 11.6 0.1 Raymond Avenue 4 25,390 89.8 90.5 0.6 188.8 190.6 1.8 100.4 101.7 1.2 16.9 17.1 0.2
Fullerton Junction MP 45.5 = MP 165.5
Orange-LA County Line
Valley View Avenue
4 28,610 144.8 145.5 0.6 232.2 234.0 1.8 140.2 141.8 1.6 21.8 22.1 0.2
Rosecrans/Marquardt Avenue
4 27,020 144.8 145.5 0.6 232.2 234.0 1.8 127.8 129.2 1.4 20.8 21.0 0.2
Lakeland Road 2 7,610 144.8 145.5 0.6 231.4 233.2 1.8 28.6 28.9 0.3 15.1 15.3 0.2 Los Nietos Road 4 23,840 144.8 145.5 0.6 232.2 234.0 1.8 105.4 106.6 1.2 18.9 19.1 0.2 Norwalk Boulevard 4 30,550 144.8 145.5 0.6 232.2 234.0 1.8 156.8 158.6 1.8 23.3 23.6 0.3 Pioneer Boulevard 4 17,830 144.8 145.5 0.6 232.2 234.0 1.8 70.5 71.2 0.8 16.2 16.3 0.2 Passons Boulevard 4 14,780 144.8 145.5 0.6 232.2 234.0 1.8 55.5 56.1 0.6 15.1 15.2 0.2 Serapis Avenue 2 7,300 144.8 145.5 0.6 231.4 233.2 1.8 27.2 27.5 0.3 14.9 15.1 0.2
Commerce Yard MP 148.5
Hobart Yard MP 146.0 OVERALL:
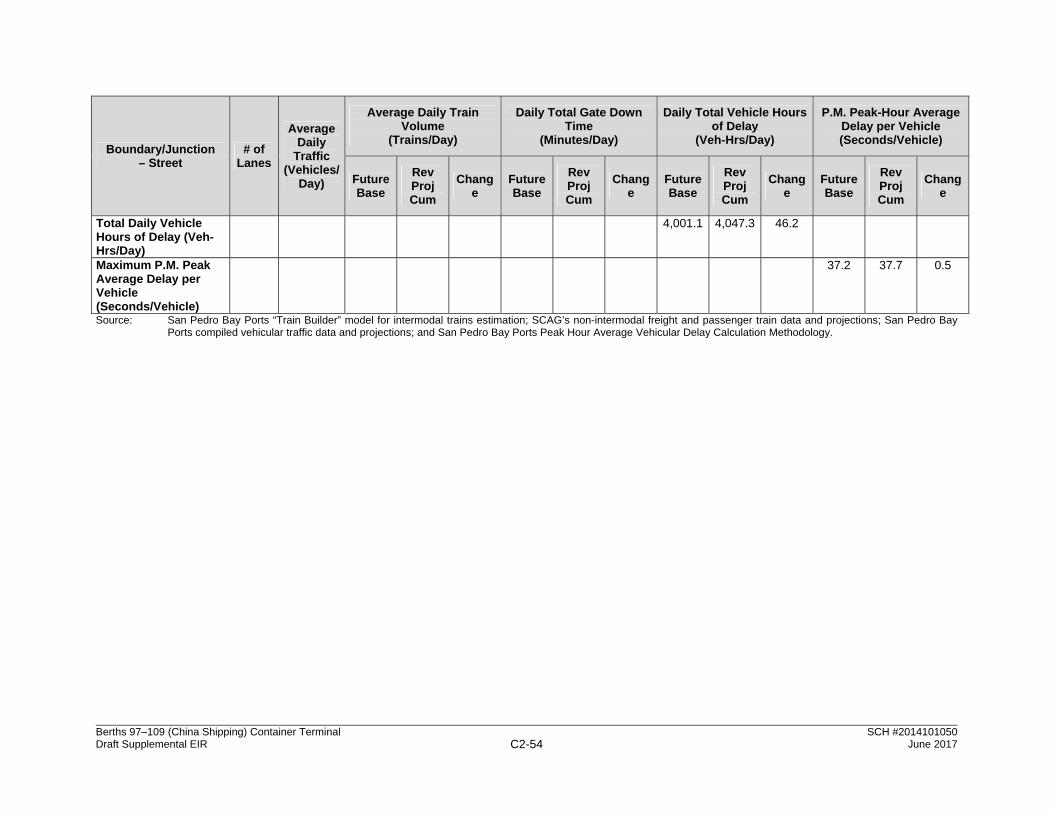
Berths 97–109 (China Shipping) Container Terminal Draft Supplemental EIR C2-54
SCH #2014101050 June 2017
Boundary/Junction – Street
# of Lanes
Average Daily
Traffic (Vehicles/
Day)
Average Daily Train Volume
(Trains/Day)
Daily Total Gate Down Time
(Minutes/Day)
Daily Total Vehicle Hours of Delay
(Veh-Hrs/Day)
P.M. Peak-Hour Average Delay per Vehicle (Seconds/Vehicle)
Future Base
Rev Proj Cum
Change
Future Base
Rev Proj Cum
Change
Future Base
Rev Proj Cum
Change
Future Base
Rev Proj Cum
Change
Total Daily Vehicle Hours of Delay (Veh-Hrs/Day)
4,001.1 4,047.3 46.2
Maximum P.M. Peak Average Delay per Vehicle (Seconds/Vehicle)
37.2 37.7 0.5
Source: San Pedro Bay Ports “Train Builder” model for intermodal trains estimation; SCAG’s non-intermodal freight and passenger train data and projections; San Pedro Bay Ports compiled vehicular traffic data and projections; and San Pedro Bay Ports Peak Hour Average Vehicular Delay Calculation Methodology.

Berths 97–109 (China Shipping) Container Terminal Draft Supplemental EIR C2-55
SCH #2014101050 June 2017
Table C2-25: BNSF Cajon Subdivision from San Bernardino to Barstow, P.M. Peak-Hour Average Vehicular Delays for Study At-Grade Crossings, 2045, Future Baseline and Revised Project Cumulative (without SCIG and ICTF projects)
Boundary/Junction – Street
# of Lanes
Average Daily
Traffic (Vehicles/
Day)
Average Daily Train Volume
(Trains/Day)
Daily Total Gate Down Time
(Minutes/Day)
Daily Total Vehicle Hours of Delay
(Veh-Hrs/Day)
P.M. Peak-Hour Average Delay per Vehicle (Seconds/Vehicle)
Future Base
Rev Proj Cum
ChangeFuture Base
Rev Proj Cum
Change Future Base
Rev Proj Cum
ChangeFuture Base
Rev Proj Cum
Change
Barstow MP 0 Lenwood Road 2 6,640 106.7 107.4 0.7 170.0 171.7 1.7 15.7 15.9 0.2 9.0 9.1 0.1 Hinkley Road 2 710 106.7 107.4 0.7 170.0 171.7 1.7 1.5 1.5 0.0 7.5 7.5 0.1 Indian Trail Road 2 800 106.7 107.4 0.7 170.0 171.7 1.7 1.7 1.7 0.0 7.5 7.6 0.1 Vista Road 2 4,100 106.7 107.4 0.7 170.0 171.7 1.7 9.1 9.2 0.1 8.3 8.4 0.1 Turner Road 2 50 106.7 107.4 0.7 170.0 171.7 1.7 0.1 0.1 0.0 7.3 7.4 0.1 North Bryman Road
2 240 106.7 107.4 0.7 170.0 171.7 1.7 0.5 0.5 0.0 7.4 7.4 0.1
South Bryman Road
2 2,860 106.7 107.4 0.7 170.0 171.7 1.7 6.2 6.3 0.1 8.0 8.0 0.1
Robinson Ranch Road
2 170 106.7 107.4 0.7 170.0 171.7 1.7 0.3 0.4 0.0 7.3 7.4 0.1
1st Street 2 1,020 106.7 107.4 0.7 202.3 204.3 2.0 3.0 3.0 0.0 10.7 10.8 0.1 6th Street 4 5,340 106.7 107.4 0.7 236.3 238.6 2.4 22.4 22.6 0.3 15.4 15.6 0.2
Silverwood Junction MP 56.6
Keenbrook Junction MP 69.4
Swarthout Canyon Road
2 270 112.7 113.4 0.7 288.3 291.2 2.9 1.6 1.6 0.0 21.5 21.7 0.3
Devore Road/Glen Helen Parkway
4 9,300 112.7 113.4 0.7 289.0 291.9 2.9 61.2 62.0 0.7 24.6 24.9 0.3
Dike Junction Palm Avenue 2 17,570 89.1 89.8 0.6 261.1 263.8 2.7 153.2 155.1 1.9 38.0 38.5 0.5
San Bernardino MP 81.4
OVERALL:

Berths 97–109 (China Shipping) Container Terminal Draft Supplemental EIR C2-56
SCH #2014101050 June 2017
Boundary/Junction – Street
# of Lanes
Average Daily
Traffic (Vehicles/
Day)
Average Daily Train Volume
(Trains/Day)
Daily Total Gate Down Time
(Minutes/Day)
Daily Total Vehicle Hours of Delay
(Veh-Hrs/Day)
P.M. Peak-Hour Average Delay per Vehicle (Seconds/Vehicle)
Future Base
Rev Proj Cum
ChangeFuture Base
Rev Proj Cum
Change Future Base
Rev Proj Cum
ChangeFuture Base
Rev Proj Cum
Change
Total Daily Vehicle Hours of Delay (Veh-Hrs/Day)
276.8 279.8 3.4
Maximum P.M. Peak Average Delay per Vehicle (Seconds/Vehicle)
38.0 38.5 0.5
Source: San Pedro Bay Ports “Train Builder” model for intermodal trains estimation; SCAG’s non-intermodal freight and passenger train data and projections; San Pedro Bay Ports compiled vehicular traffic data and projections; and San Pedro Bay Ports Peak Hour Average Vehicular Delay Calculation Methodology.

Berths 97–109 (China Shipping) Container Terminal Draft Supplemental EIR C2-57
SCH #2014101050 June 2017
Table C2-26: BNSF Cajon Subdivision from San Bernardino to Barstow, P.M. Peak Hour Average Vehicular Delays for Study At-Grade Crossings, 2045, Future Baseline and Revised Project Cumulative (with SCIG and ICTF projects)
Boundary/Junction – Street
# of Lanes
Average Daily
Traffic (Vehicles/
Day)
Average Daily Train Volume
(Trains/Day)
Daily Total Gate Down Time
(Minutes/Day)
Daily Total Vehicle Hours of Delay
(Veh-Hrs/Day)
P.M. Peak-Hour Average Delay per Vehicle (Seconds/Vehicle)
Future Base
Rev Proj Cum
ChangeFuture Base
Rev Proj Cum
Change Future Base
Rev Proj Cum
ChangeFuture Base
Rev Proj Cum
Change
Barstow MP 0 Lenwood Road 2 6,640 107.3 108.0 0.7 170.4 172.1 1.7 15.6 15.8 0.2 9.0 9.1 0.1 Hinkley Road 2 710 107.3 108.0 0.7 170.4 172.1 1.7 1.5 1.5 0.0 7.4 7.5 0.1 Indian Trail Road 2 800 107.3 108.0 0.7 170.4 172.1 1.7 1.7 1.7 0.0 7.5 7.5 0.1 Vista Road 2 4,100 107.3 108.0 0.7 170.4 172.1 1.7 9.1 9.2 0.1 8.2 8.3 0.1 Turner Road 2 50 107.3 108.0 0.7 170.4 172.1 1.7 0.1 0.1 0.0 7.3 7.4 0.1 North Bryman Road
2 240 107.3 108.0 0.7 170.4 172.1 1.7 0.5 0.5 0.0 7.3 7.4 0.1
South Bryman Road
2 2,860 107.3 108.0 0.7 170.4 172.1 1.7 6.2 6.2 0.1 7.9 8.0 0.1
Robinson Ranch Road
2 170 107.3 108.0 0.7 170.4 172.1 1.7 0.3 0.4 0.0 7.3 7.4 0.1
1st Street 2 1,020 107.3 108.0 0.7 202.7 204.7 2.0 3.0 3.0 0.0 10.7 10.8 0.1 6th Street 4 5,340 107.3 108.0 0.7 236.7 239.0 2.4 22.3 22.5 0.3 15.3 15.5 0.2
Silverwood Junction MP 56.6
Keenbrook Junction MP 69.4
Swarthout Canyon Road
2 270 113.3 114.0 0.7 288.7 291.7 2.9 1.6 1.6 0.0 21.4 21.6 0.3
Devore Road/Glen Helen Parkway
4 9,300 113.3 114.0 0.7 289.4 292.3 2.9 61.0 61.7 0.7 24.5 24.8 0.3
Dike Junction Palm Avenue 2 17,570 89.7 90.3 0.7 261.5 264.2 2.7 152.6 154.4 1.9 37.9 38.4 0.5
San Bernardino MP 81.4
OVERALL:

Berths 97–109 (China Shipping) Container Terminal Draft Supplemental EIR C2-58
SCH #2014101050 June 2017
Boundary/Junction – Street
# of Lanes
Average Daily
Traffic (Vehicles/
Day)
Average Daily Train Volume
(Trains/Day)
Daily Total Gate Down Time
(Minutes/Day)
Daily Total Vehicle Hours of Delay
(Veh-Hrs/Day)
P.M. Peak-Hour Average Delay per Vehicle (Seconds/Vehicle)
Future Base
Rev Proj Cum
ChangeFuture Base
Rev Proj Cum
Change Future Base
Rev Proj Cum
ChangeFuture Base
Rev Proj Cum
Change
Total Daily Vehicle Hours of Delay (Veh-Hrs/Day)
275.4 278.7 3.3
Maximum P.M. Peak Average Delay per Vehicle (Seconds/Vehicle)
37.9 38.4 0.5
Source: San Pedro Bay Ports “Train Builder” model for intermodal trains estimation; SCAG’s non-intermodal freight and passenger train data and projections; San Pedro Bay Ports compiled vehicular traffic data and projections; and San Pedro Bay Ports Peak Hour Average Vehicular Delay Calculation Methodology.

Berths 97–109 (China Shipping) Container Terminal Draft Supplemental EIR C2-59
SCH #2014101050 June 2017
Table C2-27: UP Alhambra Subdivision from Los Angeles Transportation Center (LATC) to Colton Crossing, P.M. Peak-Hour Average Vehicular Delays for Study At-Grade Crossings, 2045, Future Baseline and Revised Project Cumulative (Excluding Segment That is Combined with UP Los Angeles Subdivision)
Boundary/Junction – Street
# of Lanes
Average Daily
Traffic (Vehicles/
Day)
Average Daily Train Volume
(Trains/Day)*
Daily Total Gate Down Time
(Minutes/Day)
Daily Total Vehicle Hours of Delay
(Veh-Hrs/Day)
P.M. Peak-Hour Average Delay per Vehicle (Seconds/Vehicle)
Future Base
Rev Proj Cum
ChangeFuture Base
Rev Proj Cum
Change Future Base
Rev Proj Cum
ChangeFuture Base
Rev Proj Cum
Change
LATC MP 482.9
San Pablo Street 4 5,020 41.3 41.7 0.4 217.8 220.3 2.5 37.6 38.1 0.5 27.9 28.3 0.4
Vineburn Avenue 2 1,680 41.3 41.7 0.4 153.1 154.9 1.8 6.0 6.1 0.1 13.2 13.4 0.2
Worth/Boca Road 2 9,720 41.3 41.7 0.4 153.1 154.9 1.8 46.7 47.3 0.6 20.2 20.5 0.3
Valley Boulevard 4 34,080 41.3 41.7 0.4 102.1 103.2 1.1 89.0 90.2 1.2 12.0 12.2 0.2
Ramona Street 2 15,770 41.3 41.7 0.4 153.1 154.9 1.8 87.9 89.1 1.2 25.1 25.4 0.3
Mission Road 3 28,550 41.3 41.7 0.4 153.3 155.0 1.8 187.8 190.4 2.6 31.8 32.3 0.4
Del Mar Avenue 2 26,100 41.3 41.7 0.4 153.1 154.9 1.8 308.2 312.5 4.3 72.9 73.9 1.0
San Gabriel Boulevard
4 43,510 41.3 41.7 0.4 153.5 155.2 1.8 340.9 345.6 4.7 40.9 41.5 0.6
Walnut Grove Avenue
3 19,010 41.3 41.7 0.4 89.1 90.1 1.0 31.4 31.8 0.4 7.0 7.1 0.1
Encinita Avenue 2 7,920 41.3 41.7 0.4 89.0 90.0 1.0 11.1 11.3 0.1 5.6 5.6 0.1
Lower Azusa Road
4 21,570 41.3 41.7 0.4 89.2 90.2 1.0 33.4 33.8 0.4 6.4 6.4 0.1
Temple City Boulevard
4 25,870 41.3 41.7 0.4 89.2 90.2 1.0 43.2 43.8 0.6 7.1 7.2 0.1
Baldwin Avenue 4 32,100 41.3 41.7 0.4 89.2 90.2 1.0 61.0 61.8 0.8 8.6 8.7 0.1
Arden Drive 4 13,690 41.3 41.7 0.4 89.2 90.2 1.0 18.7 19.0 0.2 5.3 5.4 0.1
El Monte Junction MP 494.99
Tyler Avenue 4 14,590 84.1 84.5 0.4 119.9 120.9 1.0 24.0 24.2 0.3 6.7 6.8 0.1
Cogswell Road 2 12,480 84.1 84.5 0.4 119.5 120.5 1.0 24.3 24.6 0.3 8.6 8.7 0.1
Temple Avenue 4 33,530 84.1 84.5 0.4 119.9 120.9 1.0 79.4 80.3 0.9 11.3 11.4 0.1
Bassett Junction MP 498.45

Berths 97–109 (China Shipping) Container Terminal Draft Supplemental EIR C2-60
SCH #2014101050 June 2017
Boundary/Junction – Street
# of Lanes
Average Daily
Traffic (Vehicles/
Day)
Average Daily Train Volume
(Trains/Day)*
Daily Total Gate Down Time
(Minutes/Day)
Daily Total Vehicle Hours of Delay
(Veh-Hrs/Day)
P.M. Peak-Hour Average Delay per Vehicle (Seconds/Vehicle)
Future Base
Rev Proj Cum
ChangeFuture Base
Rev Proj Cum
Change Future Base
Rev Proj Cum
ChangeFuture Base
Rev Proj Cum
Change
Vineland Avenue 2 15,550 42.1 42.5 0.4 89.7 90.6 1.0 28.9 29.3 0.4 8.3 8.4 0.1
Puente Avenue 4 39,410 42.1 42.5 0.4 89.8 90.8 1.0 91.0 92.2 1.2 11.4 11.5 0.1
Orange Avenue 2 7,150 42.1 42.5 0.4 89.7 90.6 1.0 9.9 10.0 0.1 5.4 5.5 0.1
California Avenue 2 23,260 42.1 42.5 0.4 89.7 90.6 1.0 68.8 69.7 0.9 16.3 16.5 0.2
City of Industry Junction MP 501.5
Fullerton Road 4 22,660 48.2 48.5 0.4 103.4 104.4 1.0 41.6 42.1 0.5 7.6 7.7 0.1
Fairway Drive 4 24,580 48.2 48.5 0.4 103.4 104.4 1.0 46.7 47.3 0.5 8.0 8.1 0.1
Lemon Road 4 21,290 48.2 48.5 0.4 103.4 104.4 1.0 38.2 38.6 0.4 7.4 7.5 0.1
Brea Canyon Road
2 17,830 48.2 48.5 0.4 103.2 104.2 1.0 42.9 43.4 0.5 11.3 11.5 0.1
Pomona Junction MP 514.3
HANDLED SEPARATELY DUE TO PROXIMITY TO UP LOS ANGELES SUBDIVISION LA-San Bernardino County Line MP 516.7 Montclair Junction
Bon View Avenue 2 14,800 55.6 55.9 0.4 115.3 116.3 1.0 33.0 33.3 0.4 9.8 9.9 0.1
Vineyard Avenue 4 45,430 55.6 55.9 0.4 115.5 116.6 1.0 155.5 157.2 1.7 18.2 18.4 0.2
Milliken Avenue 6 50,510 55.6 55.9 0.4 115.8 116.8 1.0 123.9 125.2 1.3 11.2 11.3 0.1
Kaiser Junction MP 527.5
West Colton MP 534.7
Colton Crossing MP 538.70
OVERALL:
Total Daily Vehicle Hours of Delay (Veh-Hrs/Day)
2,111.0 2,138.2 27.3

Berths 97–109 (China Shipping) Container Terminal Draft Supplemental EIR C2-61
SCH #2014101050 June 2017
Boundary/Junction – Street
# of Lanes
Average Daily
Traffic (Vehicles/
Day)
Average Daily Train Volume
(Trains/Day)*
Daily Total Gate Down Time
(Minutes/Day)
Daily Total Vehicle Hours of Delay
(Veh-Hrs/Day)
P.M. Peak-Hour Average Delay per Vehicle (Seconds/Vehicle)
Future Base
Rev Proj Cum
ChangeFuture Base
Rev Proj Cum
Change Future Base
Rev Proj Cum
ChangeFuture Base
Rev Proj Cum
Change
Maximum P.M. Peak Average Delay per Vehicle (Seconds/Vehicle)
72.9 73.9 1.0
*The number of trains would not be affected by the presence or absence of SCIG and ICTF modernization projects. Source: San Pedro Bay Ports “Train Builder” model for intermodal trains estimation; SCAG’s non-intermodal freight and passenger train data and projections; San Pedro Bay
Ports compiled vehicular traffic data and projections; and San Pedro Bay Ports Peak Hour Average Vehicular Delay Calculation Methodology.

Berths 97–109 (China Shipping) Container Terminal Draft Supplemental EIR C2-62
SCH #2014101050 June 2017
Table C2-28: UP Los Angeles Subdivision from East Los Angeles Yard to West Riverside Junction, P.M. Peak-Hour Average Vehicular Delays for Study At-Grade Crossings, 2045, Future Baseline and Revised Project Cumulative (Excluding Segment That is Combined with UP Alhambra Subdivision)
Boundary/Junction – Street
# of Lanes
Average Daily
Traffic (Vehicles/
Day)
Average Daily Train Volume*
(Trains/Day)
Daily Total Gate Down Time
(Minutes/Day)
Daily Total Vehicle Hours of Delay
(Veh-Hrs/Day)
P.M. Peak-Hour Average Delay per Vehicle (Seconds/Vehicle)
Future Base
Rev Proj Cum
ChangeFuture Base
Rev Proj Cum
Change Future Base
Rev Proj Cum
ChangeFuture Base
Rev Proj Cum
Change
East Los Angeles MP 5.85
S. Vail Avenue 2 9,750 50.1 50.5 0.4 134.2 135.8 1.6 32.0 32.5 0.5 13.4 13.6 0.2 Maple Avenue 2 6,860 50.1 50.5 0.4 134.2 135.8 1.6 20.6 20.9 0.3 11.9 12.0 0.2 S. Greenwood Avenue
4 8,980 50.1 50.5 0.4 134.6 136.2 1.6 25.5 25.9 0.4 10.9 11.0 0.2
Montebello Boulevard
4 25,370 50.1 50.5 0.4 134.6 136.2 1.6 92.5 93.8 1.4 15.6 15.9 0.2
Durfee Avenue 2 17,230 50.1 50.5 0.4 90.9 91.9 1.0 33.6 34.1 0.5 9.2 9.3 0.1 Rose Hills Road 4 11,660 50.1 50.5 0.4 86.4 87.4 1.0 13.6 13.8 0.2 4.6 4.7 0.1 Mission Mill Road 2 2,690 50.1 50.5 0.4 86.2 87.2 1.0 2.9 2.9 0.0 4.1 4.1 0.1 Workman Mill 4 9,440 50.1 50.5 0.4 86.4 87.4 1.0 10.7 10.8 0.1 4.4 4.5 0.1 Turnbull Canyon Road
4 17,830 50.1 50.5 0.4 86.4 87.4 1.0 22.8 23.1 0.3 5.2 5.3 0.1
Stimson Avenue& Puente Avenue
4 18,170 50.1 50.5 0.4 86.4 87.4 1.0 23.3 23.6 0.3 5.3 5.4 0.1
Bixby Drive 2 3,660 50.1 50.5 0.4 86.2 87.2 1.0 4.0 4.1 0.1 4.2 4.3 0.1 Fullerton Road 4 29,920 50.1 50.5 0.4 86.4 87.4 1.0 47.4 48.1 0.7 7.2 7.3 0.1 Nogales Street 6 46,570 50.1 50.5 0.4 86.7 87.6 1.0 76.0 77.0 1.0 7.5 7.6 0.1 Fairway Drive 4 31,300 50.1 50.5 0.4 86.4 87.4 1.0 51.1 51.8 0.7 7.5 7.6 0.1 Lemon Street 4 18,590 50.1 50.5 0.4 86.4 87.4 1.0 24.0 24.3 0.3 5.3 5.4 0.1
Pomona Junction MP 31.9
HANDLED SEPARATELY DUE TO PROXIMITY TO UP ALHAMBRA SUBDIVSION LA-San Bernardino County Line MP 33.17
E. Montclair Junction MP 35.02
Bonview Avenue 2 5,300 48.8 49.1 0.4 85.3 86.2 1.0 6.2 6.3 0.1 4.6 4.6 0.1 Grove Avenue 6 60,130 48.8 49.1 0.4 85.7 86.6 1.0 131.2 132.9 1.8 11.2 11.3 0.1 Vineyard Avenue 4 6,780 48.8 49.1 0.4 85.5 86.4 1.0 7.5 7.6 0.1 4.3 4.3 0.1 Archibald Avenue 4 8,010 48.8 49.1 0.4 85.5 86.4 1.0 9.1 9.2 0.1 4.4 4.4 0.1

Berths 97–109 (China Shipping) Container Terminal Draft Supplemental EIR C2-63
SCH #2014101050 June 2017
Boundary/Junction – Street
# of Lanes
Average Daily
Traffic (Vehicles/
Day)
Average Daily Train Volume*
(Trains/Day)
Daily Total Gate Down Time
(Minutes/Day)
Daily Total Vehicle Hours of Delay
(Veh-Hrs/Day)
P.M. Peak-Hour Average Delay per Vehicle (Seconds/Vehicle)
Future Base
Rev Proj Cum
ChangeFuture Base
Rev Proj Cum
Change Future Base
Rev Proj Cum
ChangeFuture Base
Rev Proj Cum
Change
San Bernardino-Riverside County Line MP 43.36
Milliken Avenue 6 32,360 48.8 49.1 0.4 85.7 86.6 1.0 44.5 45.1 0.6 5.8 5.9 0.1 Mira Loma Junction MP 45.7
Bellegrave Avenue 2 11,890 53.8 54.1 0.4 93.4 94.4 1.0 18.1 18.4 0.2 6.5 6.6 0.1 Rutile Street 2 12,760 53.8 54.1 0.4 93.4 94.4 1.0 20.1 20.3 0.2 6.8 6.9 0.1 Clay Street 2 25,160 53.8 54.1 0.4 93.6 94.6 1.0 39.5 40.0 0.5 6.8 6.9 0.1 Jurupa Ave 4 21,810 53.8 54.1 0.4 111.7 112.9 1.2 78.3 79.3 1.0 18.9 19.1 0.2 Mountain View Avenue
2 2,640 53.8 54.1 0.4 111.7 112.9 1.2 4.5 4.5 0.1 6.4 6.5 0.1
Streeter Avenue 4 21,390 53.8 54.1 0.4 112.0 113.2 1.2 45.6 46.2 0.6 8.9 9.0 0.1 Palm Avenue 2 11,560 53.8 54.1 0.4 104.5 105.6 1.1 22.0 22.3 0.3 8.1 8.2 0.1 Brockton Avenue 4 20,610 53.8 54.1 0.4 112.0 113.2 1.2 43.4 44.0 0.6 8.7 8.9 0.1 Riverside Avenue 2 17,740 53.8 54.1 0.4 111.7 112.9 1.2 50.1 50.8 0.6 13.4 13.6 0.2 Panorama Road 2 9,860 53.8 54.1 0.4 111.7 112.9 1.2 20.4 20.6 0.3 8.5 8.6 0.1
West Riverside Junction MP 56.7
OVERALL: Total Daily Vehicle Hours of Delay (Veh-Hrs/Day)
1,020.5 1,034.3 13.8
Maximum P.M. Peak Average Delay per Vehicle (Seconds/Vehicle)
18.9 19.1 0.2
*The number of trains would not be affected by the presence or absence of SCIG and ICTF modernization projects. Source: San Pedro Bay Ports “Train Builder” model for intermodal trains estimation; SCAG’s non-intermodal freight and passenger train data and projections; San Pedro Bay
Ports compiled vehicular traffic data and projections; and San Pedro Bay Ports Peak Hour Average Vehicular Delay Calculation Methodology.

Berths 97–109 (China Shipping) Container Terminal Draft Supplemental EIR C2-64
SCH #2014101050 June 2017
Table C2-29: Combined UP Alhambra and Los Angeles Subdivisions in Pomona and Montclair Area, P.M. Peak-Hour Average Vehicular Delays for Study At-Grade Crossings, 2045, Future Baseline and Revised Project Cumulative
Boundary/Junction – Street
# of Lanes
Average Daily
Traffic (Vehicles/
Day)
Average Daily Train Volume*
(Trains/Day)
Daily Total Gate Down Time
(Minutes/Day)
Daily Total Vehicle Hours of Delay
(Veh-Hrs/Day)
P.M. Peak-Hour Average Delay per Vehicle (Seconds/Vehicle)
Future Base
Rev Proj Cum
ChangeFuture Base
Rev Proj Cum
Change Future Base
Rev Proj Cum
ChangeFuture Base
Rev Proj Cum
Change
Pomona Junction MP 514.3
Hamilton Boulevard 4 9,910 104.3 105.1 0.8 205.7 207.7 2.0 29.3 29.7 0.4 11.4 11.5 0.1 Park Avenue 2 7,020 104.3 105.1 0.8 205.2 207.2 2.0 22.0 22.2 0.3 12.3 12.5 0.1 Main Street 2 1,950 104.3 105.1 0.8 205.2 207.2 2.0 5.3 5.4 0.1 10.1 10.3 0.1 Palomares Street 2 4,790 104.3 105.1 0.8 205.2 207.2 2.0 14.1 14.2 0.2 11.3 11.4 0.1 San Antonio Avenue 4 8,530 104.3 105.1 0.8 205.7 207.7 2.0 24.8 25.1 0.3 11.1 11.2 0.1
LA-San Bernardino County Line MP 516.7
Monte Vista Avenue 4 16,350 104.3 105.1 0.8 205.7 207.7 2.0 52.9 53.5 0.6 12.9 13.1 0.2 San Antonio Avenue 4 15,250 104.3 105.1 0.8 205.7 207.7 2.0 48.5 49.1 0.6 12.6 12.8 0.2 Vine Avenue 2 11,190 104.3 105.1 0.8 205.2 207.2 2.0 39.8 40.2 0.5 14.8 15.0 0.2 Sultana Avenue 2 12,130 104.3 105.1 0.8 205.2 207.2 2.0 44.6 45.1 0.5 15.5 15.7 0.2 Campus Avenue 2 15,660 104.3 105.1 0.8 205.2 207.2 2.0 66.4 67.2 0.8 19.1 19.3 0.2
Montclair Junction OVERALL: Total Daily Vehicle Hours of Delay (Veh-Hrs/Day)
347.6 351.8 4.2
Maximum P.M. Peak Average Delay per Vehicle (Seconds/Vehicle)
19.1 19.3 0.2
*The number of trains would not be affected by the presence or absence of SCIG and ICTF modernization projects. Source: San Pedro Bay Ports “Train Builder” model for intermodal trains estimation; SCAG’s non-intermodal freight and passenger train data and projections; San Pedro Bay
Ports compiled vehicular traffic data and projections; and San Pedro Bay Ports Peak Hour Average Vehicular Delay Calculation Methodology.

Berths 97–109 (China Shipping) Container Terminal Draft Supplemental EIR C2-65
SCH #2014101050 June 2017
Table C2-30: UP Yuma Subdivision from Colton Crossing to Indio, P.M. Peak-Hour Average Vehicular Delays for Study At-Grade Crossings, 2045, Future Baseline and Revised Project Cumulative
Boundary/Junction – Street
# of Lanes
Average Daily
Traffic (Vehicles/
Day)
Average Daily Train Volume*
(Trains/Day)
Daily Total Gate Down Time
(Minutes/Day)
Daily Total Vehicle Hours of Delay
(Veh-Hrs/Day)
P.M. Peak-Hour Average Delay per Vehicle (Seconds/Vehicle)
Future Base
Rev Proj Cum
ChangeFuture Base
Rev Proj Cum
Change Future Base
Rev Proj Cum
ChangeFuture Base
Rev Proj Cum
Change
Colton Crossing MP 539.0
Hunts Lane 4 23,380 83.4 84.0 0.7 203.3 205.2 2.0 99.2 100.4 1.2 17.8 18.1 0.2
Whittier Avenue 2 330 83.4 84.0 0.7 240.9 243.3 2.4 1.4 1.4 0.0 15.4 15.6 0.2
Beaumont Avenue 2 800 83.4 84.0 0.7 240.9 243.3 2.4 3.4 3.5 0.0 15.6 15.8 0.2
San Timoteo Canyon Road
2 20,150 83.4 84.0 0.7 240.9 243.3 2.4 187.3 189.6 2.3 47.0 47.6 0.6
Alessandro Road 2 500 83.4 84.0 0.7 240.9 243.3 2.4 2.1 2.2 0.0 15.5 15.7 0.2
San Bernardino-Riverside County Line MP 549.25
Live Oak Canyon Road
2 1,900 83.4 84.0 0.7 240.9 243.3 2.4 8.3 8.4 0.1 16.1 16.3 0.2
San Timoteo Canyon Road
2 2,460 83.4 84.0 0.7 240.9 243.3 2.4 10.9 11.1 0.1 16.4 16.6 0.2
Viele Avenue 2 190 83.4 84.0 0.7 202.8 204.8 2.0 0.6 0.6 0.0 10.8 10.9 0.1
California Avenue 2 11,370 83.4 84.0 0.7 202.8 204.8 2.0 44.7 45.2 0.5 15.9 16.1 0.2
Pennsylvania Avenue
2 14,080 83.4 84.0 0.7 202.8 204.8 2.0 60.3 61.0 0.7 18.0 18.2 0.2
North Sunset Avenue
2 6,570 83.4 84.0 0.7 202.8 204.8 2.0 22.7 22.9 0.3 13.2 13.4 0.2
22nd Street 4 26,640 83.4 84.0 0.7 203.3 205.2 2.0 111.7 113.1 1.3 17.5 17.7 0.2
San Gorgonio Avenue
2 22,040 83.4 84.0 0.7 202.8 204.8 2.0 131.8 133.4 1.6 29.0 29.4 0.4
Hargrave Street 2 28,670 83.4 84.0 0.7 202.8 204.8 2.0 274.6 278.1 3.5 56.5 57.2 0.7
Apache Trail 2 4,350 83.4 84.0 0.7 202.8 204.8 2.0 14.2 14.4 0.2 12.3 12.4 0.1
Broadway 2 11,480 83.4 84.0 0.7 202.8 204.8 2.0 45.3 45.8 0.5 16.0 16.2 0.2
Tipton Road 2 200 83.4 84.0 0.7 202.8 204.8 2.0 0.6 0.6 0.0 10.8 10.9 0.1
Garnet MP 588.32

Berths 97–109 (China Shipping) Container Terminal Draft Supplemental EIR C2-66
SCH #2014101050 June 2017
Boundary/Junction – Street
# of Lanes
Average Daily
Traffic (Vehicles/
Day)
Average Daily Train Volume*
(Trains/Day)
Daily Total Gate Down Time
(Minutes/Day)
Daily Total Vehicle Hours of Delay
(Veh-Hrs/Day)
P.M. Peak-Hour Average Delay per Vehicle (Seconds/Vehicle)
Future Base
Rev Proj Cum
ChangeFuture Base
Rev Proj Cum
Change Future Base
Rev Proj Cum
ChangeFuture Base
Rev Proj Cum
Change
West Indio MP 609.63
Indio MP 610.9
Avenue 52 4 18,900 83.4 84.0 0.7 203.3 205.2 2.0 70.6 71.5 0.8 14.8 15.0 0.2 Avenue 56/Airport Boulevard
2 8,240 83.4 84.0 0.7 202.8 204.8 2.0 29.7 30.0 0.4 14.1 14.2 0.2
Avenue 66/4th Street
2 13,500 83.4 84.0 0.7 202.8 204.8 2.0 56.7 57.4 0.7 17.5 17.7 0.2
OVERALL: Total Daily Vehicle Hours of Delay (Veh-Hrs/Day)
1,176.1 1,190.5 14.3
Maximum P.M. Peak Average Delay per Vehicle (Seconds/Vehicle)
56.5 57.2 0.7
*The number of trains would not be affected by the presence or absence of SCIG and ICTF modernization projects. Source: San Pedro Bay Ports “Train Builder” model for intermodal trains estimation; SCAG’s non-intermodal freight and passenger train data and projections; San Pedro Bay
Ports compiled vehicular traffic data and projections; and San Pedro Bay Ports Peak Hour Average Vehicular Delay Calculation Methodology


![Jan Beutel, ETH Zurich - Welcome - TIK...[B. Jelk] High‐resolution TimelapsePhotography 2009 C2 2010 C2 2011 C2 2012 C2 2013 C2 2014 C2 18.05.2015 C2 19.05.2015 C2 29.05.2015 C2](https://static.fdocuments.in/doc/165x107/60110b99540db573571546c3/jan-beutel-eth-zurich-welcome-tik-b-jelk-higharesolution-timelapsephotography.jpg)