Byker Community Trust L imitedSTRATEGIC REPORT Legal status of Byker Community Trust (BCT) BCT is...
54
Byker Community Trust Limited (A Co-operative and Community Benefit Society) Strategic Report and Financial Statements For the Year Ended 31 March 2018
Transcript of Byker Community Trust L imitedSTRATEGIC REPORT Legal status of Byker Community Trust (BCT) BCT is...
Byker Community Trust Limited
(A Co-operative and Community Benefit Society)
Strategic Report and Financial Statements For the Year Ended 31 March 2018

Contents
Corporate Information 1
Strategic Report incorporating the Value for Money Summary 2-21
Directors Responsibilities 22
Report of the Independent Auditors 23-26
Statement of Comprehensive Income 27
Statement of Financial Position 28
Statement of Changes in Reserves 29
Statement of Cash Flows 29
Notes to the Financial Statements 30-50
BYKER COMMUNITY TRUST
Corporate Information
Board of Management (Non-Executive Directors)
Jim Coulter Gordon Bell Nigel Emmerson Nick Kemp Amanda Senior Alison Smith Christine Stobbs William Howe Anthony Itiat Annette Patten Martin Greenfield Catherine Walsh Janice Logan Paul Callaghan
Independent Independent Independent Local Authority Nominee Local Authority Nominee Independent Independent Tenant Tenant Tenant Tenant Tenant Tenant Tenant
Chair Appointed 1 November 2018 Appointed 1 November 2018 Appointed 1 November 2018 Resigned 19 July 2018 Resigned 1 November 2018 Resigned 19 July 2018 Resigned19 July 2018
Executive Officers (Executive Directors)
Jill Haley Philip Pollard Michelle Bell James Clifford
Chief Executive Director of Operations Director of Property and Development Director of Finance and Resources
Bankers Lloyds Bank 102 Grey Street Newcastle upon Tyne NE1 6AG
Funders Yorkshire Building Society Yorkshire House Yorkshire Drive Bradford BD5 8LJ
Auditors Tait Walker Chartered Accountants
Bulman House Regent Centre, Gosforth Newcastle upon Tyne NE3 3LS Registered office 17 Raby Cross Byker Newcastle upon Tyne NE6 2FF
Registration Numbers 4714 – Regulator of Social Housing. 31376R – Financial Conduct Authority.
Page 1 of 50

BYKER COMMUNITY TRUST
STRATEGIC REPORT
Legal status of Byker Community Trust (BCT) BCT is incorporated under the Co-operative and Community Benefit Societies Act 2014, it has charitable status and is registered with the Homes and Communities Agency as a Registered Provider of Social Housing as defined by the Housing Act 1996. Principal activities BCT was formed due to a large scale voluntary transfer, where 1,803 homes were transferred from Newcastle City Council on 5 July 2012. BCT exists for the benefit of the community. BCT’s principal activity is to provide social housing. Directors’ share interests All Board members are non-executive directors of BCT. Each tenant and independent non-executive director has a shareholding in BCT of one share. Newcastle City Council holds one share and may nominate two members to the Board. The executive directors hold no interest in BCT’s shares and act as executives within the authority delegated by the Board. Insurance policies indemnify directors and officers against liability when acting for BCT. Political and charitable gifts
None.
Governance and regulatory compliance
BCT governance arrangements comply with governance good practice and regulatory standards. BCT complies with the HCAs Regulatory Framework and Standards. BCT complies with the Regulator of Social Housing (RSH) Governance and Financial Viability Code of Practice. BCT has adopted and complies fully with the National Housing Federation (NHF) Code of Governance (2015). Compliance with which is evidenced by an annual self-assessment carried out by the Board. Internal Controls Having made enquiries, the Board is satisfied that BCT’s system of internal controls and scheme of delegations are adequate and give sufficient assurance to the Board. Public Benefit Entity As a public benefit entity, Byker Community Trust Limited has applied the public benefit entity ‘PBE’ prefixed paragraphs of FRS102.
Page 2 of 50
BYKER COMMUNITY TRUST
STRATEGIC REPORT
(continued) Responsibilities of the Board The Board is responsible for directing the affairs of BCT in accordance with its
objects and rules and ensure that its functions are properly performed. Its main
responsibilities are:
• Set and ensure compliance with the values, vision, mission and strategic objectives of BCT, ensuring its long term success.
• Appoint, and if necessary, dismiss the chief executive and approve his or her salary, benefits and terms of employment.
• Satisfy itself as to the integrity of financial information, approving each year’s budget and business plan and annual accounts prior to publication.
• Establish, oversee and review annually a framework of delegation and systems of internal control.
• Establish and oversee a risk management framework in order to safeguard the assets of BCT.
• Take appropriate advice.
• Ensure at all times that BCT takes account of any obligation imposed upon it by the regulator in exercise of its powers.
• Satisfy itself that BCT’s affairs are conducted in accordance with generally accepted standards of performance and propriety.
• Establish and operate a performance appraisal system for the Board, the Chair and individual Board Members.
Our vision, mission, values and key objectives Vision BCT’s vision for 2015 to 2020 is an independent BCT where:
• We have delivered on the major stock transfer promises.
• We ensure tenants have a key voice and role in decision making.
• We maximise access for local people into employment, training, health and educational opportunities.
Mission “We work for people who have a voice and influence in our business; we celebrate our diverse neighbourhood; we provide quality homes, environment and services.”
Page 3 of 50

BYKER COMMUNITY TRUST
STRATEGIC REPORT
(continued) Our vision, mission, values and key objectives (continued) Values
• Ambitious for people and the community.
• Energetic in our work with and for our diverse neighbourhoods.
• Innovative in providing excellent services.
• Open and transparent in the conduct of our business.
• Unrelenting in our focus on positive change. Key objectives BCT’s mission is achieved by working towards our strategic objectives:
Fulfilling the stock transfer
promises.
Completing and developing the Investment
Plan.
Engaging, empowering and supporting
residents.
Contributing to economic health of the
neighbourhood.
Completing the journey to
independence.
Being a first class strategic partner.
Growing our commissioning skills.
Underpinning Value for Money
and the financial security of the
BCT.
Securing outcomes which balance
efficiency, economy and effectiveness in
all we do.
Maintaining a clear approach to risk
identification and management.
Ensuring we continue to have a
sustainable business plan.
Delivering excellence. Focusing on excellent customer service.
Continuing to aim for first class governance.
Ensuring staff are proud of their work for Byker through support for training, development and remuneration policies.
Page 4 of 50

BYKER COMMUNITY TRUST
STRATEGIC REPORT
(continued) Operating and Financial Review Policy and Regulatory Environment The Board continues to monitor what lessons may be learned from the Grenfell Tower tragedy and the resulting Hackitt Review and Public Inquiry. Board has listened to the views of residents and is retrofitting a sprinkler system in our Sheltered Housing Scheme tower block. The safety of tenants is paramount. There has been some easing of financial pressures following Government decisions to permit CPI+1% rent increases for five years from 2020 and not to apply the Local Housing Allowance cap to social housing tenants. The Board’s ability to plan for the long term is hampered by uncertainty regarding future policies on rent and welfare reform. Full roll out of Universal Credit (UC) in Newcastle began from 7 February 2017. 16% of BCT tenants now receive the UC benefit. In that time we have seen some small improvements to the administration of the benefit, but the welfare of our tenants remains a great concern. BCT takes advantage of reduced VAT charges by participation in a Cost Sharing Group (CSG). The Board has followed judgements by the European Court of Justice (CJEU) which, when applied in the UK, restrict the use of CSGs to public benefit organisations. The Board believes that BCT’s arrangements are entirely within the spirit of the CSG exemption. BCT has engaged with the National Housing Federation and brought our position to the attention of HM Revenue and Customs (HMRC). HMRC has since issued guidance on how the CJEU judgements will be applied to UK VAT policy and included a specific statement that housing associations may continue to apply the VAT exemption until further guidance is issued. BCT Review of the year 2017-18 represents the first full year of BCT’s new service delivery arrangements which has yielded recurring savings of over £700k per year. These savings are a result of approximately £250k of VAT savings as well as a more efficient and effective management model that is responsive to our tenant’s needs. All service level agreements with the Cost Sharing Group were reviewed in 2017 to consolidate these savings. Included in the savings is a £97k efficiency achieved by removing the subsidy of the furniture rental service. BCT ended the furniture rental service across the estate in May 2018 and gifted all furniture to our tenants. This benefitted our tenants by easing the burden of additional weekly service charges and removing a barrier to finding affordable employment.
Page 5 of 50

BYKER COMMUNITY TRUST
STRATEGIC REPORT (continued) Operating and Financial Review (continued) In summer 2017, the BCT Board commissioned a governance review following discussion at the annual Board Awayday. The purpose was to ensure that the Board’s structure and operations were adequate to oversee the new service arrangements introduced in 2016-17 and the increasingly challenging economic environment BCT faced. As the review progressed, the Regulator of Social Housing (RSH) undertook an In-Depth Assessment (IDA) of BCT’s compliance with their Governance and Viability code. The RSH downgraded BCT’s governance assessment to G2 and maintained the viability assessment at V2. While the governance grade G2 is compliant with RSH’s requirements, the Board recognised that a number of improvements were required. Work was done to review and restructure the Strategic Risk Register (and the accompanying Risk Management Framework). A new risk profile and scoring system was agreed as was a new set of mitigations to the identified risks. Internal controls and assurance systems were overhauled leading to a new approach to Internal Audit. These changes were helped to strengthen the stress testing of BCT’s Business Plan and were incorporated into a Governance Improvement Action Plan agreed with RSH. At the conclusion of the governance review, the Board agreed to introduce a new Committee structure aiming to secure more focus on the organisation’s business outcomes but also to strengthen tenant and community engagement opportunities and structures. The Board also agreed to propose new Rules to change the Board’s constituency composition, with the same objectives, and to put these proposals to a Special General Meeting of shareholders for approval. The SGM took place after the end of the financial year covered by this report. The actions BCT has taken will be reviewed by the RSH later in 2018 and the Board believes that the new frameworks introduced should lead to the reinstatement of the G1 governance grade. BCT has continued to deliver its Investment Programme including the Stock Transfer Promises. During 2017-18:
• We completed conversion of nine Hobby Rooms into affordable homes for rent, with a tenth nearly ready to let. BCT secured grant from Homes England of £0.25m to deliver these new homes;
• We began the upgrade of the communal and external areas of our two Sheltered Housing Schemes, Tom Collins House and Mount Pleasant;
• We got underway with a £3.5m scheme to improve water storage, radiators and provide a thermostat to control the heat in every resident’s home.. It is anticipated that new heat controls will reduce fuel usage within the Byker District Heating System; and
• We brought 17 properties up to the Decent Homes Standard that were omitted from the original improvement scheme.
Page 6 of 50
BYKER COMMUNITY TRUST
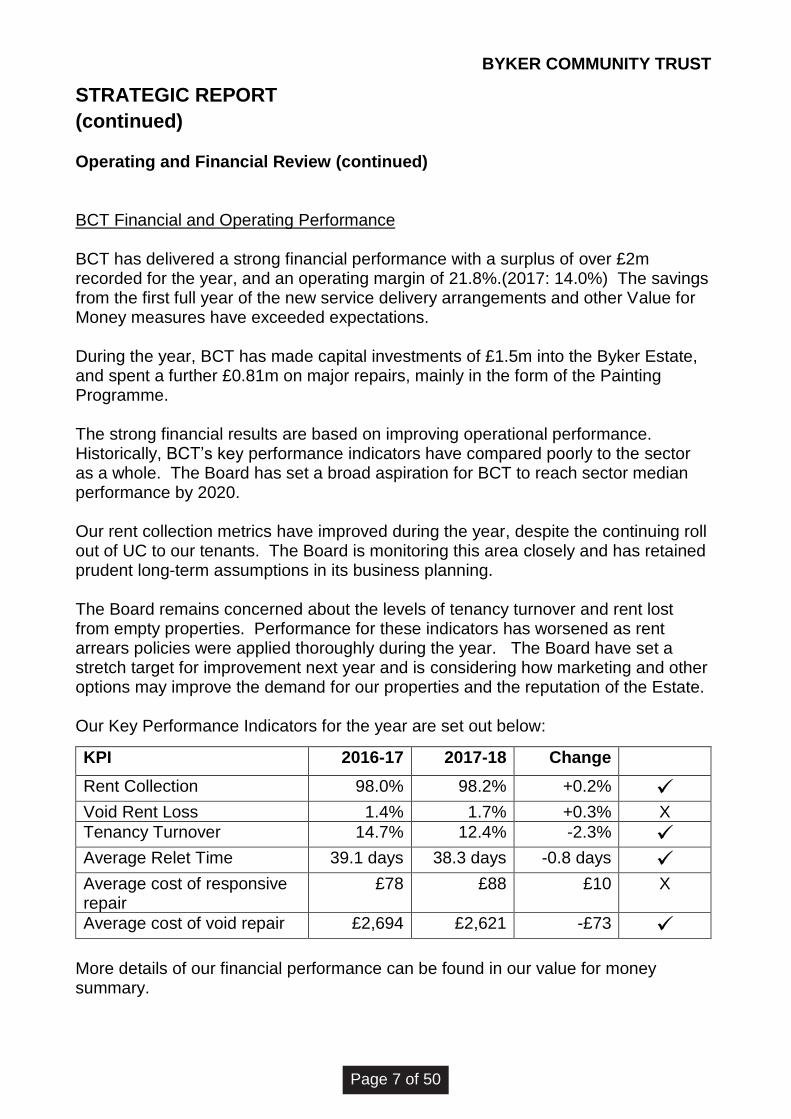
STRATEGIC REPORT
(continued) Operating and Financial Review (continued) BCT Financial and Operating Performance BCT has delivered a strong financial performance with a surplus of over £2m recorded for the year, and an operating margin of 21.8%.(2017: 14.0%) The savings from the first full year of the new service delivery arrangements and other Value for Money measures have exceeded expectations. During the year, BCT has made capital investments of £1.5m into the Byker Estate, and spent a further £0.81m on major repairs, mainly in the form of the Painting Programme. The strong financial results are based on improving operational performance. Historically, BCT’s key performance indicators have compared poorly to the sector as a whole. The Board has set a broad aspiration for BCT to reach sector median performance by 2020. Our rent collection metrics have improved during the year, despite the continuing roll out of UC to our tenants. The Board is monitoring this area closely and has retained prudent long-term assumptions in its business planning. The Board remains concerned about the levels of tenancy turnover and rent lost from empty properties. Performance for these indicators has worsened as rent arrears policies were applied thoroughly during the year. The Board have set a stretch target for improvement next year and is considering how marketing and other options may improve the demand for our properties and the reputation of the Estate. Our Key Performance Indicators for the year are set out below:
KPI 2016-17 2017-18 Change
Rent Collection 98.0% 98.2% +0.2% ✓
Void Rent Loss 1.4% 1.7% +0.3% X
Tenancy Turnover 14.7% 12.4% -2.3% ✓
Average Relet Time 39.1 days 38.3 days -0.8 days ✓
Average cost of responsive repair
£78 £88 £10 X
Average cost of void repair £2,694 £2,621 -£73 ✓
More details of our financial performance can be found in our value for money summary.
Page 7 of 50

BYKER COMMUNITY TRUST
STRATEGIC REPORT
(continued) Operating and Financial Review (continued) BCT Principal Risks and uncertainties As set out in the BCT Strategic Risk Register, the principal risks that BCT faces are as follows:
Risk No
Description Risk Score
SR1 BCT does not collect enough income HIGH
SR2 BCT expenditure is too high HIGH
SR3 VAT savings from Cost Sharing Exemption lost HIGH
SR4 Serious Health and Safety Incident MEDIUM
SR5 Business Disruption MEDIUM
SR6 Data Breach HIGH
SR7 District Heating Failure MEDIUM
SR11 Failure of Governance controls MEDIUM
SR13 Anti-Social behaviour MEDIUM
BCT Board receives updates on the Strategic Risks quarterly, and the Audit and Risk Committee oversees the control actions that management takes to reduce the likelihood and impact of each risk. Outlook Investment will continue during 2018-19:
• A design team will be appointed who will consult tenants on the £4.0m of environmental improvements to the Estate which is the final stock transfer promise to be completed;
• We will begin a programme to replace thirteen passenger Lifts in the Byker Wall;
• The upgrade of internal heating components and fitting of thermostats (“Work Package 3”) will continue;
• Refurbishment of the externals and communal areas of the two sheltered schemes will continue throughout the year;
• Four new homes will be created on the site of Ralph Erskine’s site office; and
• The Board will consider options to purchase houses for sale using receipts from properties sold under the Right to Buy.
BCT will work with the Newcastle City Council to extract the best value from its land development sites and the Byker District Heating System.
Page 8 of 50

BYKER COMMUNITY TRUST
STRATEGIC REPORT
(continued) Operating and Financial Review (continued) BCT Board will adopt a new Committee structure to improve governance and ensure that tenants can monitor organisational performance and influence service provision directly. The Board will review and update its key governance policies and focus on achieving G1 rating for governance at the next RSH review. A Corporate Plan Action Plan has been agreed which sets out clear and transparent objectives to be achieved in the year against the BCT Vision, Mission and Strategic Objectives. This Action Plan is reported quarterly to Board and the Customer Scrutiny Committee and is published on the BCT website. The Board will review its procurement strategy to ensure it remains aligned to the Corporate Plan and VfM objectives. BCT will continue to review its supplier contracts during 2018-19 to maximise value for money. More details on future VfM plans are set out in the next section.
Page 9 of 50

BYKER COMMUNITY TRUST
STRATEGIC REPORT
(continued) Value for Money Summary
Introduction
This is a summary of the BCT Value for Money (VfM) Self-Assessment. The full Self-
Assessment for 2017-18 can be viewed on the BCT website, using the following link:
http://bykercommunitytrust.org/resource-category/bct-reports/
This document includes further detailed information on the following:
• BCT’s arrangements to meet the VfM standard
• Return on assets
• Cost comparisons
• VfM gains achieved
• VfM gains to be made
• VfM strategy – VfM development action plan
BCT’s Strategic Approach
BCT is committed to delivering VfM in the interests of its tenants and the wider
community because we want to minimise the financial pressures on households
adversely affected by the economic pressures, and to improve service quality and
customer satisfaction. The Board have set an aspiration for BCT to achieve sector
median financial and operational performance by 2020 where possible.
We believe it is important to establish a culture of continuous improvement and use
feedback from our tenants to focus on areas where we could do better. The ‘Byker
Approach’ housing management model is based around a customer relationship and
engagement programme.
Page 10 of 50

BYKER COMMUNITY TRUST
STRATEGIC REPORT
(continued)
Value for Money Summary (continued)
BCT Assets
The approximately 1,800 properties of the Byker Estate are the foundation of our Business Plan. They are our greatest financial asset. Since 2012, BCT has been investing in the Estate to address the historic under-investment and make sure our accommodation represents a place of choice for tenants to call home. BCT has invested over £15m on the Estate, with another £6.8m invested in the Byker District Heating System currently owned by Newcastle City Council (NCC). BCT Board seeks to maximise the value from the assets, and during the year we have converted 10 hobby rooms on the Estate into affordable homes for rent. Nine of these are now ready to be let. We have also bought back a property previously sold as a right to buy. The Board aims to optimise the investment that goes into BCT’s assets. We compare our performance to others using the Reinvestment metric.
Reinvestment – The total capitalised repairs and development for the year
shown as a percentage of the total value of assets.
BCT has had high reinvestment percentages, as the value of the assets started from
zero when the Estate was transferred from Newcastle City Council (NCC).
BCT will seek to maintain leading reinvestment levels higher than the Sector average
as it delivers the final stock transfer promises in the coming years. In 2018-19 we
plan to invest £4.02m and achieve and reinvestment rate of 22%.
0.0%
5.0%
10.0%
15.0%
20.0%
25.0%
30.0%
35.0%
40.0%
2015-16 2016-17 2017-18 2018-19(PLAN)
BCT
Sector Median(2017)
Page 11 of 50
BYKER COMMUNITY TRUST
STRATEGIC REPORT
(continued)
Value for Money Summary (continued)
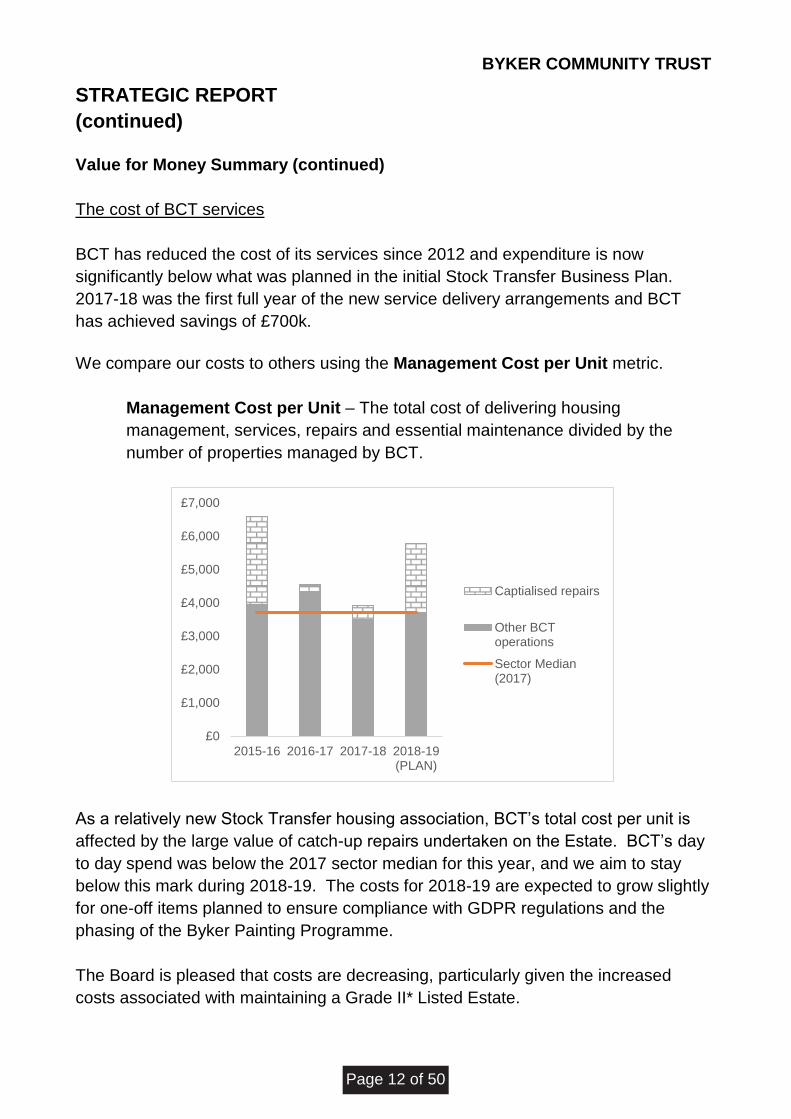
The cost of BCT services
BCT has reduced the cost of its services since 2012 and expenditure is now
significantly below what was planned in the initial Stock Transfer Business Plan.
2017-18 was the first full year of the new service delivery arrangements and BCT
has achieved savings of £700k.
We compare our costs to others using the Management Cost per Unit metric.
Management Cost per Unit – The total cost of delivering housing
management, services, repairs and essential maintenance divided by the
number of properties managed by BCT.
As a relatively new Stock Transfer housing association, BCT’s total cost per unit is
affected by the large value of catch-up repairs undertaken on the Estate. BCT’s day
to day spend was below the 2017 sector median for this year, and we aim to stay
below this mark during 2018-19. The costs for 2018-19 are expected to grow slightly
for one-off items planned to ensure compliance with GDPR regulations and the
phasing of the Byker Painting Programme.
The Board is pleased that costs are decreasing, particularly given the increased
costs associated with maintaining a Grade II* Listed Estate.
£0
£1,000
£2,000
£3,000
£4,000
£5,000
£6,000
£7,000
2015-16 2016-17 2017-18 2018-19(PLAN)
Captialised repairs
Other BCToperations
Sector Median(2017)
Page 12 of 50
BYKER COMMUNITY TRUST
STRATEGIC REPORT
(continued)
Value for Money Summary (continued)
Value for Money gains
In the 2016-17 VfM self-assessment, BCT set out the following VFM gains to be
achieved in the current year. Both items have been achieved.
Activity VfM Gain
Ceasing of the furniture service
from end April 2017
£97k annual cost saving
through reduced
irrecoverable VAT,
administration and
income collection costs.
✓
Completion of a conversion of
non-residential buildings into
10 new housing units
£49k additional annual
income from rent and
service charges. ✓
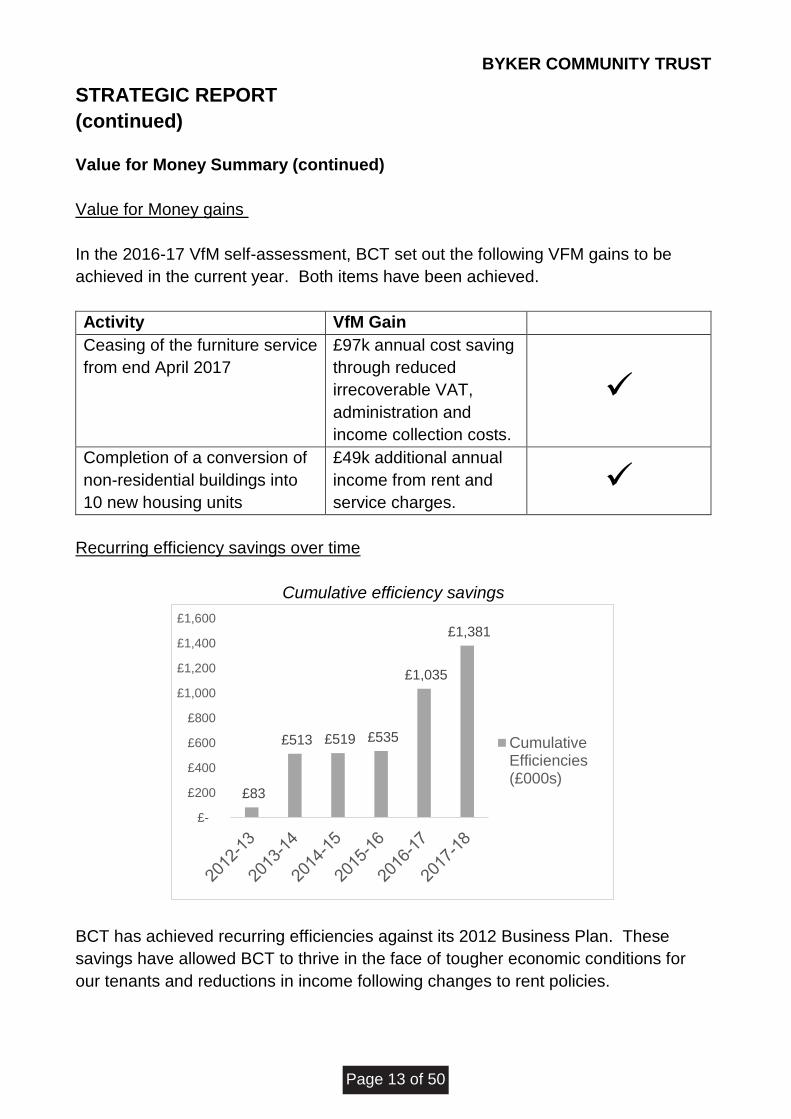
Recurring efficiency savings over time
Cumulative efficiency savings
BCT has achieved recurring efficiencies against its 2012 Business Plan. These
savings have allowed BCT to thrive in the face of tougher economic conditions for
our tenants and reductions in income following changes to rent policies.
£83
£513 £519 £535
£1,035
£1,381
£-
£200
£400
£600
£800
£1,000
£1,200
£1,400
£1,600
CumulativeEfficiencies(£000s)
Page 13 of 50

BYKER COMMUNITY TRUST
STRATEGIC REPORT
(continued)
Value for Money Summary (continued)
VfM Activity planned for 2018-19
The following VfM actions are planned for 2018-19, the full list of actions is set out in the VfM self-assessment.
Involve and consult tenantsand leaseholders in the review of the current Byker Wall.Concierge and Cleaning contract.
Improvement to void rent loss KPI from 1.8% to 1.3%
Grant-funded conversion of Ralph Erskine’s site office into four new homes
Review BCT’s Value for Money Strategy
Protect BCT income levels by considering opportunities to develop and purchase properties within the Byker Estate.
Page 14 of 50
BYKER COMMUNITY TRUST
STRATEGIC REPORT
(continued)
Value for Money Summary (continued)
New Value for Money Standard A new Value for Money Standard has come into force on 1 April 2018. The new Standard requires registered providers to
“publish evidence in the statutory accounts to enable stakeholders to understand the provider’s:
a) performance against its own value for money targets and any metrics set out by the regulator, and how that performance compares to peers
b) measurable plans to address any areas of underperformance, including clearly stating any areas where improvements would not be appropriate and the rationale for this.
The metrics set out by the Regulator are calculated using figures in the financial statements. The results of the calculations should be read in the following context:
• BCT began as a stock transfer in 2012 to enable much-needed major repairs
to the Byker Estate. These repairs have been the investment priority for the
Board, to ensure the core assets of the organisation are safe, financially
viable and comfortable for tenants.
• The assets of the Estate transferred at nil cost from Newcastle City Council.
BCT assets are recorded at historical cost, so the asset values reflect only the
capital expenditure since 2012. Gross asset values are increasing and will
continue to increase until BCT completes a full cycle of component
replacements.
• For these reasons, asset values are lower than they would be for a traditional
housing association. Consequently, BCT’s values for the metrics linked to
asset value (Reinvestment %, ROCE) are high. It will be difficult to maintain
this high performance in future years as asset values increase to normal
levels.
Page 15 of 50

BYKER COMMUNITY TRUST
STRATEGIC REPORT
(continued)
Value for Money Summary (continued)
BCT’s performance against the VFM metrics set out by the regulator is as follows. The median for BCT’s peer group data is included for comparison.
Metric Purpose Name BCT Peer Median
1 Efficiency Reinvestment %
9.7% 5.6% (9 peers)
2 Effectiveness New supply delivered A – Social Housing Units
0.6% 1.0% (8 peers)
New supply delivered B – Non-Social Housing Units
0.0% 0.0% (7 peers)
3 Efficiency Gearing
10.7% 35.4% (9 peers)
4 Efficiency EBITDA-MR Interest Cover
706.9% 264.5% (10 peers)
5 Economy
Headline Social Housing Cost per Unit
£3,929 £3,541 (10 peers)
6 Efficiency A – Operating Margin (social housing lettings only)
21.8% 22.0% (10 peers)
B – Operating Margin (overall)
21.8% 22.9% (10 peers)
7 Efficiency ROCE %
9.6% 4.5%
Peer Group: Arches Housing, Connect Housing, Leeds and Yorkshire Housing, North Star Housing, Pioneer Group, SLH Group, South Yorkshire Housing, Tower Hamlets Community Housing, Trafford Housing.
Page 16 of 50

BYKER COMMUNITY TRUST
STRATEGIC REPORT
(continued)
Value for Money Summary (continued)
Metric 1 - Reinvestment %
Definition: The investment in property as a percentage of the value of total properties held.
This is an important metric for BCT, as investment in housing stock is a strategic objective for BCT. BCT’s reinvestment % dropped significantly from 2015-16 to 2016-17 when the large scheme to refurbish the Byker Wall came to an end. Reinvestment has increased in 2017-18 and it is expected to increase again for 2018-19 as important schemes get underway. There have been some delays getting investment schemes on site over the previous two years. The upgrade of the communal areas of our sheltered schemes was redesigned to include sprinkler systems which will provide greater reassurance and safety to residents. The £4.0m investment in the Environment will begin once a comprehensive design brief has been prepared following wide consultation with tenants. Investment will continue from 2019-20 onwards as component replacement schemes get underway, and the Board will consider other development options.
Metric 2A - New supply delivered – Social Housing Units
Definition: The number of new social housing units that have been acquired or developed in the year shown as a percentage of the total social housing units owned at period end.
BCT has added ten new social housing units during the year. One was a purchase of a property (not grant aided) previously sold under the Right to Buy, and the other nine were converted into homes to rent by BCT from unused Hobby Rooms on the Estate. BCT’s new supply value is low compared to peers. New housing supply is not currently a strategic objective for BCT. The Board’s investment priority for the 2015-20 Corporate Plan is the completion of the “Stock Transfer Promises” which are composed mainly of major catch up repairs on existing housing. The development of properties has been only been undertaken where derelict or unused buildings on the Estate could be brought back into use. BCT holds options to acquire three sites for development. During 2018-19 the Board will be assessing whether options for new housing on these sites would improve the Business Plan and fit with BCT’s Vision.
Page 17 of 50

BYKER COMMUNITY TRUST
STRATEGIC REPORT
(continued)
Value for Money Summary (continued)
Metric 2B - New supply delivered – Non-Social Housing Units
Definition: The number of new non-social housing units that have been acquired or developed in the year as a proportion of total housing units owned at period end.
BCT does not currently have any plans to deliver non-social units, but the Board will consider options that can improve the Business Plan and fit with the wider strategy.
Metric 3 - Gearing
Definition: The value of net debt and other financial obligations shown as a percentage of the value of assets.
BCT’s level of gearing is low compared to peers and the sector as a whole. BCT’s assets were acquired debt-free in 2012, which allowed for financing of the catch-up investments required. BCT’s low gearing level is the result of greater than expected efficiency savings since 2012 and slower than expected capital spend in the last two years. BCT has made significant one-off and recurring efficiencies since its inception meaning that a greater proportion of catch up repairs were funded from operational cash generation. In addition, some large schemes have been delayed to the end of the Corporate Plan period as described under Metric 1. The current low level of gearing does not reflect the Board’s risk appetite. During 2018-19 the Board will be considering how it might use the current borrowing capacity to bring forward planned schemes or add development projects to the programme.
Metric 4 - EBITDA-MR Interest Cover
Definition: Adjusted profit shown as a % of the interest payments made in the year. Profits are adjusted by removing tax, interest, depreciation and amortisation of grants, and adding the cost of capitalised major repairs.
This value is high compared to peers and the sector.
This value reflects BCT’s low level of debt as described under Metric 3. It shows that BCT has ample capacity to deliver investment in the short term.
Page 18 of 50

BYKER COMMUNITY TRUST
STRATEGIC REPORT
(continued)
Value for Money Summary (continued)
Metric 5 - Headline Social Housing Cost per Unit
Definition: The running costs for the year divided by the number of social housing properties owned and/or managed.
BCT’s figure is above the median for the sector and its peer group. The figure is broken down as follows:
Category
BCT Cost Per unit
Peer Median Cost Per unit
Management Costs £700 £879
Service Costs £1,413 £367
Routine Maintenance Costs £855 £1,093
Major repairs expenditure £961 £645
Other social housing costs £0 £82
Total £3,929 £3,540
The breakdown shows significant variations to BCT’s peers in the cost categories. BCT’s Service Costs per unit are very high in comparison to other housing associations. The figure reflects the cost of the Byker District Heating System which provides heat and hot water to all residents of the Estate. The cost of this system alone is approximately £950 per unit. BCT is seeking to get best value from its service charges and pass savings on to tenants where it can. District Heating service charges to tenants have been frozen since 2012, and BCT is investing in domestic thermostats to help tenants to manage heat and reduce costs. In 2018-19 BCT will re-procure its Concierge and Cleaning services to the Byker Wall to drive more savings. Major repairs costs are also comparatively high. These figures reflect both the level of catch up repairs that BCT is undertaking, and the inherent costs of maintaining the Byker Estate. For instance, major repairs expenditure includes a cost of approximately £393 per unit to maintain the distinctive painted timber of the Estate. Otherwise, BCT’s costs are better than median. The Board believes this is a strong performance given BCT’s small size, the economic deprivation of the area, and the additional costs of routine repairs caused by the non-traditional housing stock on the Estate. BCT’s cost profile for management and repairs is improved by its partnership with Karbon Solutions Ltd and the VAT savings associated with being part of a Cost Sharing Group. The Board will continue to review BCT’s cost performance to ensure that the best value is being provided to tenants.
Page 19 of 50

BYKER COMMUNITY TRUST
STRATEGIC REPORT
(continued)
Value for Money Summary (continued)
Metric 6A - Operating Margin (social housing lettings only)
Definition: The operating surplus shown as a percentage of turnover (for social housing lettings activity only).
BCT is performing at median levels for this metric compared to the peer group. This result has come despite the cost pressures set out under Metric 5. BCT’s results for this metric is currently boosted by not having a full depreciation charge, since the value in use of BCT’s assets not yet represented on balance sheet. BCT’s operating margin benefits from savings and reduced VAT charges from its membership of a Cost Sharing Group.
Metric 6B - Operating Margin (overall)
Definition: The operating surplus shown as a percentage of turnover overall.
As BCT does not carry out any activities other than Social Housing Letting, the value and comments for this metric is the same as above.
Metric 7 Return on Capital Employed
Definition: The operating surplus shown as a percentage of the total assets less current liabilities.
During 2018-19, BCT will undertake a full asset appraisal to understand its portfolio better and to help determine how increased management or investment could improve particular property types or areas. The overwhelming majority of BCT’s assets are Grade II* Listed, and this limits the options for improving asset performance. BCT cannot demolish or remodel poorly performing assets.
Page 20 of 50
BYKER COMMUNITY TRUST
STRATEGIC REPORT
(continued) Information for Auditors The Board Members who held office at the date of approval of this board report confirm that, so far as they are each aware, there is no relevant audit information of which BCT’s auditors are unaware; and each Board Member has taken all the steps that they ought to have taken as a Board Member to make themselves aware of any relevant audit information and to establish that BCT’s auditors are aware of that information. Post balance sheet events The Board considers that there have been events after the balance sheet date that would require an adjustment to the financial statements. Statement of Compliance The board confirms that this Strategic Report has been prepared in accordance with the principles set out in Para 4.7 of the 2014 Statement of Recommended Practice (SORP) for Registered Social Housing Providers. By Order of the Board:
Signed: Date:
Page 21 of 50

BYKER COMMUNITY TRUST
STATEMENT OF THE BOARD’S RESPONSIBILITIES IN RESPECT OF THE ACCOUNTS
The Co-operative and Community Benefit Societies Act 2014 and registered social housing legislation require the Board to prepare financial statements for each financial year which give a true and fair view of the state of affairs of BCT and of the Income and Expenditure for the period of account.
In preparing these financial statements, the Board is required to: • Select suitable accounting policies and then apply them consistently, • Make judgements and estimates that are reasonable and prudent, • State whether applicable accounting standards have been followed, subject to
any material departures disclosed and explained in the financial statements, and
• Prepare the financial statements on the going concern basis unless it is inappropriate to presume that BCT will continue in business.
The Board is responsible for keeping proper accounting records which disclose with reasonable accuracy at any time the financial position of BCT and enable it to ensure that the financial statements comply with the Co-operative and Community Benefit Society Act 2014, the Housing and Regeneration Act 2008 and the Accounting Direction for Private Registered Providers of Social Housing 2015. It has general responsibility for taking reasonable steps to safeguard the assets of BCT and to prevent and detect fraud and other irregularities. By Order of the Board:
Signed: Date:
Page 22 of 50

BYKER COMMUNITY TRUST
INDEPENDENT AUDITOR’S REPORT TO THE MEMBERS OF BYKER COMMUNITY TRUST LIMITED Opinion
We have audited the financial statements of Byker Community Trust for the year ended 31 March 2018 which comprise the Statement of Comprehensive Income, Statement of Financial Position, the Statement of Changes in Reserves, the Statement of Cash Flows and the related notes. The financial reporting framework that has been applied in their preparation is applicable law and United Kingdom Accounting Standards, including Financial Reporting Standard 102 The Financial Reporting Standard applicable in the UK and Republic of Ireland (United Kingdom Generally Accepted Accounting Practice).
In our opinion, the financial statements:
• give a true and fair view of the state of the association’s affairs as at 31
March 2018 and of its surplus for the year then ended;
• have been properly prepared in accordance with United Kingdom Generally
Accepted Accounting Practice; and
• have been prepared in accordance with the requirements of the Co-
operative and Community Benefit Societies Act 2014, the Housing and
Regeneration Act 2008 and the Accounting Direction for Private Registered
Providers of Social Housing 2015.
Basis for opinion
We conducted our audit in accordance with International Standards on Auditing (UK) (ISAs (UK)) and applicable law. Our responsibilities under those standards are further described in the Auditor’s responsibilities for the audit of the financial statements section of our report. We are independent of the association in accordance with the ethical requirements that are relevant to our audit of the financial statements in the UK, including the FRC’s Ethical standard, and we have fulfilled our other ethical responsibilities in accordance with these requirements. We believe that the audit evidence we have obtained is sufficient and appropriate to provide a basis for our opinion.
Page 23 of 50

BYKER COMMUNITY TRUST
INDEPENDENT AUDITOR’S REPORT TO THE MEMBERS OF BYKER COMMUNITY TRUST LIMITED
Conclusions relating to going concern
We have nothing to report in respect of the following matters in relation to which the ISAs (UK) require us to report to you where:
• the board’s use of the going concern basis of accounting in the preparation of
the financial statements is not appropriate; or
• the board has not disclosed in the financial statements any identified material
uncertainties that may cast significant doubt about the association’s ability to
continue to adopt the going concern basis of accounting for a period of at least
twelve months from the date when the financial statements are authorised for
issue.
Other information
The other information comprises the information included in the Report of the Board other than the financial statements and our auditor’s report thereon. The board is responsible for the other information. Our opinion on the financial statements does not cover the other information and, except to the extent otherwise explicitly stated in our report, we do not express any form of assurance conclusion thereon.
In connection with our audit of the financial statements, our responsibility is to read the other information and, in doing so, consider whether the other information is materially inconsistent with the financial statements or our knowledge obtained in the audit or otherwise appears to be materially misstated. If we identify such material inconsistencies or apparent material misstatements, we are required to determine whether there is a material misstatement in the financial statements or a material misstatement of the other information. If, based on the work we have performed, we conclude that there is a material misstatement of this other information, we are required to report that fact.
We have nothing to report in this regard.
Matters on which we are required to report by exception
In the light of the knowledge and understanding of the society and its environment obtained in the course of the audit, we have not identified material misstatements in the Report of the Board.
We have nothing to report in respect of the following matters where we are required to report to you if, in our opinion:
• adequate accounting records have not been kept by the association;
• a satisfactory system of control has not been maintained over transactions; or
• the association’s financial statements are not in agreement with the
accounting records and returns; or
• we have not received all the information and explanations we require for our
audit.
Page 24 of 50

BYKER COMMUNITY TRUST
INDEPENDENT AUDITOR’S REPORT TO THE MEMBERS OF BYKER COMMUNITY TRUST LIMITED
Responsibilities of the board
As explained more fully in the Board’s responsibilities statement, the Committee is responsible for the preparation of the financial statements and for being satisfied that they give a true and fair view, and for such internal control as the board determines is necessary to enable the preparation of financial statements that are free from material misstatement, whether due to fraud or error.
In preparing the financial statements, the Committee is responsible for assessing the association’s ability to continue as a going concern, disclosing, as applicable, matters related to going concern and using the going concern basis of accounting unless the Committee either intends to liquidate the association or to cease operations, or has no realistic alternative but to do so.
Auditor’s responsibilities for the audit of the financial statements
Our objectives are to obtain reasonable assurance about whether the financial statements as a whole are free from material misstatement, whether due to fraud or error, and to issue an auditor’s report that includes our opinion. Reasonable assurance is a high level of assurance, but is not a guarantee that an audit conducted in accordance with ISAs (UK) will always detect a material misstatement when it exists.
Misstatements can arise from fraud or error and are considered material if, individually or in the aggregate, they could reasonably be expected to influence the economic decisions of users taken on the basis of these financial statements.
As part of an audit in accordance with ISAs (UK), we exercise professional judgment and maintain professional scepticism throughout the audit. We also:
• Identify and assess the risks of material misstatement of the financial
statements, whether due to fraud or error, design and perform audit
procedures responsive to those risks, and obtain audit evidence that is
sufficient and appropriate to provide a basis for our opinion. The risk of not
detecting a material misstatement resulting from fraud is higher than for one
resulting from error, as fraud may involve collusion, forgery, intentional
omissions, misrepresentations, or the override of internal control.
• Obtain an understanding of internal control relevant to the audit in order to
design audit procedures that are appropriate in the circumstances, but not for
the purpose of expressing an opinion on the effectiveness of the internal
control.
• Evaluate the appropriateness of accounting policies used and the
reasonableness of accounting estimates and related disclosures made by the
board.
Page 25 of 50

BYKER COMMUNITY TRUST
INDEPENDENT AUDITOR’S REPORT TO THE MEMBERS OF BYKER COMMUNITY TRUST LIMITED
Auditor’s responsibilities for the audit of the financial statements (continued)
• Conclude on the appropriateness of the Board’s use of the going concern
basis of accounting and, based on the audit evidence obtained, whether a
material uncertainty exists related to events or conditions that may cast
significant doubt on the society's ability to continue as a going concern. If we
conclude that a material uncertainty exists, we are required to draw attention
in our auditor’s report to the related disclosures in the financial statements or,
if such disclosures are inadequate, to modify our opinion. Our conclusions are
based on the audit evidence obtained up to the date of our auditor’s report.
However, future events or conditions may cause the entity to cease to
continue as a going concern.
• Evaluate the overall presentation, structure and content of the financial
statements, including the disclosures, and whether the financial statements
represent the underlying transactions and events in a manner that achieves
fair presentation.
We communicate with those charged with governance regarding, among other matters, the planned scope and timing of the audit and significant audit findings, including any significant deficiencies in internal control that we identify during our audit.
Use of our Report
This report is made solely to the association’s members, as a body, in accordance with the Housing and Regeneration Act 2008 and the Co-operative and Community Benefit Societies Act 2014, s. 87. Our audit work has been undertaken so that we might state to the association’s members those matters we are required to state to them in an auditor’s report and for no other purpose. To the fullest extent permitted by law, we do not accept or assume responsibility to anyone other than the association and the association’s members as a body, for our audit work, for this report, or for the opinions we have formed.
Simon Brown ACA (Senior Statutory Auditor)
For and on behalf of:
Tait Walker LLP Chartered Accountants and Statutory Auditor Bulman House Regent Centre Gosforth Newcastle upon Tyne NE3 3LS
Page 26 of 50

Financial Statements
Statement of Comprehensive Income
For the year ended 31 March 2018
2018 2017
£ £
Turnover 2 9,026,099 9,801,611
Operating expenditure 3 (7,059,361) (8,434,082)
Operating Surplus 8 1,966,738 1,367,529
Interest receivable 6 12,762 41,608
Interest payable and financing costs 7 (258,622) (286,022)Surplus for the year 8 1,999,021 1,205,805
2,034,021 1,009,805
The financial statements were approved and authorised for issue by Board on 1 August
2018 and were signed on its behalf by:
Board Member: Board Member: Secretary:
…………………………… …………………………. ……..….…………………
2017-18Byker Community Trust Annual Reports and Financial Statements
Gain on disposal of property, plant and
equipment (fixed assets)
Actuarial gain/(loss) in respect of pension
schemes
The results relate wholly to continuing activites. The notes on pages 24 to 44 form an
integral part of these accounts.
Note
(196,000)35,000
82,690278,143
13
5
Total comprehensive income for the year
Page 27 of 50

Financial Statements
Statement of Financial Position
31 March 2018
2018 2017
*Restated
£ £
Fixed Assets
Tangible Fixed Assets 14 15,102,512 14,209,967
Debtors due after more than one year 15 179,200 94,500
Total fixed assets 15,281,712 14,304,467
Current Assets
Trade and other debtors 15 949,545 628,581
Investments 16 153,187 152,466
Cash and cash equivalents 17 8,400,860 4,135,316Total current assets 9,503,592 4,916,363
Less Creditors: amounts falling due within one
year 18 (1,327,492) (2,026,534)
Net current assets (liabilities) 8,176,100 2,889,829Total assets less current liabilities 23,457,812 17,194,296
Creditors: amounts falling due after more
than one year 19 (10,820,000) (6,592,500)
Provisions for liabilities
Pension provision 13, 20 (366,000) (364,000)
Total Net Assets 12,271,812 10,237,796
Reserves
Non-equity share capital 21 26 32
Income and Expenditure reserve 12,271,786 10,237,764
12,271,812 10,237,796
Board Member: Board Member: Secretary:
…………………………… …………………………. ……..….…………………
Byker Community Trust Annual Reports and Financial Statements 2017-18
The financial statements were approved and authorised for issue by Board on 1 August
2018 and were signed on its behalf by:
Note
Total reserves
Page 28 of 50

Financial Statements
Statement of Changes in Reserves
For the year ended 31 March 2018
£ £ £
Balance at 31 March 2016 9,227,959 29 9,227,988
1,009,805 - 1,009,805
Non-equity share capital issued 3 3
Balance at 31 March 2017 10,237,764 32 10,237,796
2,034,021 - 2,034,021
Non-equity share capital issued - 5 5
Non-equity share capital redeemed - (11) (11)
Balance at 31 March 2018 12,271,785 26 12,271,812
Statement of Cash Flows
For the year ended 31 March 2018
2018 2017
£ £
1,348,869 (396,399)
(1,359,538) (625,039)
227,500 312,500
278,143 82,690
12,762 41,608
(721) (817)
4,000,000 2,000,000
- -
(241,471) (286,022)
4,265,544 1,128,521
4,135,316 3,006,795
8,400,860 4,135,316
Interest paid
Net change in cash and cash equivalents
Cash and cash equivalents at beginning of the year
Cash and cash equivalents at the end of the year
Interest received
Investments at valuation
Cash flow from financing activities
New secured loans
Repayments of borrowings
Net cash generated from operating activities (see
Note 17b)
Cash flow from investing activities
Purchase of tangible fixed assets
Grants received
Proceeds from sale of tangible fixed assets
Surplus from Statement of
Comprehensive Income
Surplus from Statement of
Comprehensive Income
Byker Community Trust Annual Reports and Financial Statements 2017-18
Total
Non-equity share
capital
Income and
expenditure
reserve
Page 29 of 50

Notes to the Financial Statements Note 1 - Principal Accounting Policies Critical Accounting judgements and key sources of estimation uncertainty The preparation of the financial statements requires management to make judgements, estimates and assumptions that affect the amounts reported for assets and liabilities as at the balance sheet date and the amounts reported for revenues and expenses during the year. However, the nature of estimation means that actual outcomes could differ from those estimates. The following judgements (apart from those involving estimates) have had the most significant effect on amounts recognised in the financial statements. Categorisation of housing properties
The Trust has undertaken a detailed review of the intended use of all housing properties. In determining the intended use, the Trust has considered if the asset is held for social benefit or to earn commercial rentals. The Trust has determined that all assets are held for social benefit. Other key sources of estimation and assumptions: Tangible fixed assets These are depreciated over their useful lives taking into account residual values, where appropriate. The actual lives of the assets and residual values are assessed annually and may vary depending on a number of factors. In re-assessing asset lives, factors such as technological innovation, product life cycles and maintenance programmes are taken into account. Residual value assessments consider issues such as future market conditions, the remaining life of the asset and projected disposal values.
Pension benefits The cost of defined benefit pension plans are determined using actuarial valuations. The actuarial valuation involves making assumptions about discount rates, future salary increases, mortality rates and future pension increases. Due to the complexity of the valuation, the underlying assumptions and the long term nature of these plans, such estimates are subject to significant uncertainty. In determining the appropriate discount rate, management considers the interest rates of corporate bonds in the respective currency with at least AA rating, with extrapolated maturities corresponding to the expected duration of the defined benefit obligation. The underlying bonds are further reviewed for quality, and those having excessive credit spreads are removed from the population bonds on which the discount rate is based, on the basis that they do not represent high quality bonds. The mortality rate is based on publicly available mortality tables for the specific sector. Future salary increases and pension increases are based on expected future inflation rates for the respective sector. The valuations are carried out by the pension fund actuary. Further details are given in note 11.
Impairment of non-financial assets Reviews for impairment of housing properties are carried out when a trigger has occurred and any impairment loss in a cash generating unit is recognised by a charge to the Statement of Comprehensive Income. Impairment is recognised where the carrying value of a cash generating unit exceeds the higher of its net realisable value or its value in use. A cash generating unit is normally a group of properties whose cash income can be separately identified. Following a trigger for impairment, the Trust performs impairment tests based on fair value less costs to sell or a value in use calculation. There has been no impairment trigger during the year ended 31 March 2017, and therefore no impairment review has been undertaken.
Page 30 of 50
Notes to the Financial Statements (continued) Note 1. Principal Accounting Policies (continued) Turnover and revenue recognition Turnover represents rental income receivable, amortised capital grant, revenue grant from local authorities and the Homes and Communities Agency and other income. Turnover is recognised in relation to the period when the goods or services have been supplied.
Rental income is recognised when the property is available for let, net of voids. Income from property sales is recognised on legal completion. Service charges Service charge income and costs are recognised on an accruals basis. The Trust operates both fixed and variable service charges in full consultation with residents. The variable service charges are only in respect of leaseholders. Loan interest costs Loan interest costs are calculated using the effective interest method of the difference between the loan amount at initial recognition and amount of maturity of the related loan. All loan interest costs are expensed. Loan finance issue costs Loan finance issue costs are expensed.
Taxation No corporation tax is payable in the surpluses of charitable activities of the Trust as it has charitable status recognition from Her Majesty’s Revenue and Customs (HMRC). The Trust has not carried out any non-charitable activities which may attract taxation charges.
Value Added Tax The Trust charges VAT on some of its income and is able to recover part of the VAT it incurs on expenditure. All amounts disclosed in the accounts are inclusive of VAT to the extent that it is suffered by the Trust and not recoverable. Tangible fixed assets and depreciation Tangible fixed assets are stated at cost, less accumulated depreciation. Housing property Housing properties under construction are stated at cost and are not depreciated. These are reclassified as housing properties on practical completion of construction. Freehold land is not depreciated. Where a housing property comprises two or more major components with substantially different useful economic lives (UELs), each component is accounted for separately and depreciated over its individual UEL. Expenditure relating to subsequent replacement or renewal of components is capitalised as incurred. The Trust depreciates freehold housing properties by component on a straight-line basis over the estimated UELs of the component categories.
Page 31 of 50
Notes to the Financial Statements (continued) Note 1. Principal Accounting Policies (continued) Housing property (continued) UELs for identified components are as follows:
Other fixed assets Depreciation is charged on other tangible fixed assets on a straight-line basis over the expected economic useful lives which are as follows:
Property managed by agents Where the Trust carries the majority of the financial risk on property managed by agents, income arising from the property is included in the Statement of Comprehensive Income. Where the agency carries the majority of the financial risk, income includes only that which relates solely to the Trust. In both cases, the assets and associated liabilities are included in the Trust’s Statement of Financial Position.
Current asset investments Current asset investments include cash and cash equivalents invested for periods of more than 24 hours. They are recognised initially at cost and subsequently at fair value at the reporting date. Any change in valuation between reporting dates is recognised in the Statement of Comprehensive Income. Short term debtors and creditors Debtors and creditors with no stated interest rate and receivable or payable within one year are recorded at transaction price. Any losses arising from impairment are recognised in the income statement in other operating expenses. Non-government grants Grants received from non-government sources are recognised under the performance model. If there are no specific performance requirements the grants are recognised when received or receivable. Where grant is received with specific performance requirements it is recognised as a liability until the conditions are met and then it is recognised as Turnover.
Component Years Component Years
Bathroom 25 Kitchen 20
Central heating & boilers 20 Mechanicals 30
Disabled adaptations: stairlifts & showers
10 Passenger lift & door entry / alarms 20
Electricals 25 Roof 30-40
Fabric 30 Solar panels & environmental 20-25
Fencing – timber 10 Windows & external doors 10-30
Flooring 10
Years
Leasehold improvements 5
IT infrastructure 5
Page 32 of 50


Notes to the Financial Statements(continued)
2. Turnover, operating costs and operating surplus for the Year
TurnoverOperating
expenditure
Operating
surplus
£ £ £
2018
Income and expenditure from lettings 6,901,258 (4,541,698) 2,359,560
Service charge income 2,124,841 (2,517,663) (392,822)
Grant income 0 0 0
Total 9,026,099 (7,059,361) 1,966,738
TurnoverOperating
expenditure
Operating
surplus
£ £ £
2017
Income and expenditure from lettings 6,944,617 (5,785,955) 1,158,662
Service charge income 2,656,994 (2,648,127) 8,867
Grant income 200,000 - 200,000
Total 9,801,611 (8,434,082) 1,367,529
Income and expenditure from lettings includes amortised government grants of
£nil.
0
2017-18Byker Community Trust Annual Reports and Financial Statements
Page 33 of 50

Notes to the Financial Statements(continued)
2018 2018 2018 2017
General
NeedsSupported Total Total
£ £ £ £
Turnover
Rent receivable net of identifiable
service charges and net of voids 6,656,832 244,160 6,900,992 6,934,886
Service charge income 1,965,536 159,305 2,124,841 2,656,994
Other grants - - - 200,000
Other income from Social Housing
Lettings 11 255 266 9,731
Total turnover from Social Housing
Lettings 8,622,379 403,720 9,026,099 9,801,611
Operating Expenditure
Management (1,203,120) (44,145) (1,247,265) (2,208,828)
Service Charge Costs (2,279,747) (237,916) (2,517,663) (2,648,127)
Routine Maintenance (1,516,842) (6,583) (1,523,425) (1,483,899)
Planned Maintenance (112,973) (1,318) (114,291) (99,893)
Major repairs (807,230) (29,619) (836,849) (787,537)
Bad debts (249,713) (9,162) (258,875) (540,210)
Depreciation of Housing Properties (560,994) - (560,994) (180,998)
Other costs - - - (81,140)
Set Up costs - - - (247,317)
Settlement fee* - - - (156,133)
Total operating expenditure on
Social Housing Lettings (6,730,619) (328,743) (7,059,361) (8,434,082)
(165,831) (5,499)
3. Turnover and operating costs
Void Losses (being rental income lost
as a result of property not being let,
although it is available for letting)
Overhead costs have been apportioned across activities in 2018, but allocated to management
in 2017.
Byker Community Trust Annual Reports and Financial Statements 2017-18
*The settlement fee was a settlement with the furniture pack provider to terminate provision of
this service.
(156,187)(171,913)
Page 34 of 50
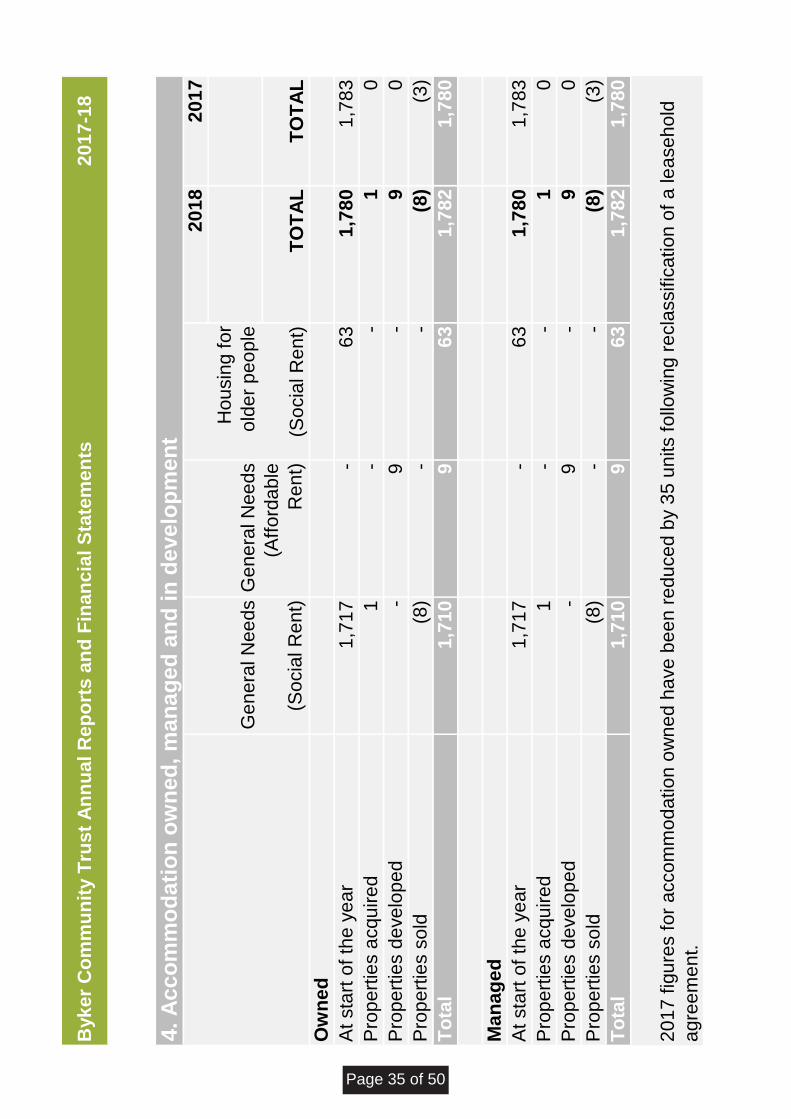
20
18
20
17
Ge
ne
ral N
ee
ds
Ge
ne
ral N
ee
ds
Ho
usin
g f
or
old
er
pe
op
le
(So
cia
l R
en
t)
(Aff
ord
ab
le
Re
nt)
(So
cia
l R
en
t)T
OT
AL
TO
TA
L
Ow
ne
d
At
sta
rt o
f th
e y
ea
r1
,71
7-
63
1,7
80
1,7
83
Pro
pe
rtie
s a
cqu
ire
d1
--
10
Pro
pe
rtie
s d
eve
lop
ed
-9
-9
0
Pro
pe
rtie
s s
old
(8)
--
(8)
(3)
To
tal
1,7
10
96
31
,78
21
,78
0
Ma
na
ge
d
At
sta
rt o
f th
e y
ea
r1
,71
7-
63
1,7
80
1,7
83
Pro
pe
rtie
s a
cqu
ire
d1
--
10
Pro
pe
rtie
s d
eve
lop
ed
-9
-9
0
Pro
pe
rtie
s s
old
(8)
--
(8)
(3)
To
tal
1,7
10
96
31
,78
21
,78
0
Byk
er
Co
mm
un
ity T
rus
t A
nn
ua
l R
ep
ort
s a
nd
Fin
an
cia
l S
tate
me
nts
20
17
-18
4.
Ac
co
mm
od
ati
on
ow
ne
d,
ma
na
ge
d a
nd
in
de
ve
lop
me
nt
20
17
fig
ure
s f
or
acco
mm
od
atio
n o
wn
ed
ha
ve
be
en
re
du
ce
d b
y 3
5 u
nits f
ollo
win
g r
ecla
ssific
atio
n o
f a
le
ase
ho
ld
agre
em
en
t.
Page 35 of 50

Notes to the Financial Statements(continued)
2018 2017
£ £
Proceeds of sales 278,143 82,690
Less: costs of sales - -
Surplus 278,143 82,690
2018 2017
£ £
Interest receivable and similar income on financial
assets measured at amortised cost:
Interest receivable from short term deposits 12,762 40,791
Interest on fixed asset investments - 817
Total 12,762 41,608
2018 2017
£ £
Interest paid on net pension liability 8,000 4,000
On loans payable within five years - -
On loans wholly or partly repayable in more than five
years 250,622 282,022
Total 258,622 286,022
Byker Community Trust Annual Reports and Financial Statements 2017-18
6. Interest receivable
7. Interest payable and financing costs
5. Gain on disposal or property, plant and equipment (fixed assets)
7b. Interest payable and financing costs on financial
liabilities measured at amortised cost:
Page 36 of 50
Notes to the Financial Statements(continued)
8. Surplus on ordinary activies2018 2017
£ £
The operating surplus is stated after
charging/(crediting):-
Auditors remuneration (excluding VAT) - audit of the
financial statements 9,350 16,885
Depreciation of housing properties 560,994 180,998
Depreciation of other fixed assets 51,591 -
Operating lease rentals - leasehold building 2,000 2,000
Total 623,935 199,883
9. Operating lease commitments2018 2017
£ £
BCT holds property under a non-cancellable operating
lease. At the end of the year BCT had commitments of
future minimum lease payments as follows:
Leasehold buildings:
Within one year 2,000 2,000
In second to fifth years inclusive 8,000 5,000
At the end of the year 10,000 7,000
Byker Community Trust Annual Reports and Financial Statements 2017-18
Page 37 of 50
Notes to the Financial Statements(continued)
2018 2017
£ £
5,000 5,000
319,651 314,430
85,156 81,248
47,868 40,726
Related party balances are not secured.
● The Board has Tenant Members who hold tenancy agreements on normal terms and
cannot use their position to their advantage. Rent charged to current and former Tenant
Board Members was £37,349 (2017: £21,041). At the reporting period end BCT is owed
£827.96 (2017: £662) from current Tenant Members.
The following related party transactions took place during the year:
11. Related parties
2017-18
10. Key management personnel remuneration
The Chief Executive is an ordinary member of the LGPS pension scheme. The LGPS
pension scheme is a final salary scheme funded by annual contributions by the employer and
employee. No enhancements or special terms apply. There are no additonal pension
arrangements. A contribution by BCT of £16,674 (2017: £12,094) was paid in addition to the
personal contributions of the Chief Executive.
* The aggregate emoluments paid to or receiveable by non-Executive Directors is composed
solely of the Chair's salary. In addition aggregate expenses paid to or receivable by non-
executive Directors of £nil (2017: £42) were paid to or receivable by other Board members.
Key Management Personnel are defined as members of the Board, the Chief Executive and
Executive Directors. The Chief Executive and Executive Directors are employees of BCT and
not members of the Board or directors under law.
Byker Community Trust Annual Report and Financial Statements
The aggregate amount of Directors' or past Directors'
pensions, excluding amounts payable under a properly
funded pension scheme
The emoluments paid to the highest paid Director excluding
pension contributions
The aggregate emoluments paid to or receivable by
executive Directors and former executive Directors
The aggregate emoluments paid to or receivable by non-
executive Directors and former non-executive Directors*
Page 38 of 50
Notes to the Financial Statements(continued)
2018 2017
No. No.
19.30 15.43
£ £
670,607 530,191
62,935 55,168
135,311 93,111
868,853 678,470
2018 2017
No. No.
- 1
£70,000-£80,000 1 -
- 1
£100,000-£110,000 1 -
2017-18
12. Employee Information
£90,000-£100,000
£60,000-£70,000
Wages and salaries
Social Security costs
Total staff costs
Aggregate number of full time staff whose
remuneration exceeded £60,000
Staff Costs
Other pension costs
Byker Community Trust Annual Report and Financial Statements
Office Staff
The average number of persons employed during the
year expressed in full time equivalents (37 hours per
week)
Page 39 of 50

Notes to the Financial Statements(continued)
As at 31
March 2018
As at 31
March 2017
3.5% 3.50%
2.0% 2.00%
2.6% 2.50%
2.0% 2.00%
The current mortality assumptions include sufficient allowance for future improvements
in mortality rates. The assumed life expectations on retirement age at 65 are:
2017-18
13. Pension obligations
Local Government Pension Scheme
The LGPS is a multi-employer funded defined benefit scheme, with the assets held in
seperate funds administered by South Tyneside Metropolitan Borough Council. The
total contributions made for the year ended 31 March 2018 were £71,903 (2017:
£71,805), of which employer's contributions totalled £49,518 (2017: £45,439) and
employees' contribution totalled £22,385 (2017: £26,366). The agreed employer
contribution rate for future years beginning from April 1 2018 is 19.6%. Employee
contributions rates range from 6.5% to 9.9%, depending on salary.
Byker Community Trust Annual Report and Financial Statements
Byker Commmunity Trust operates two pension schemes. The majority of employees
participate in a defined contribution scheme. Four employees (2017: six) are members
of a defined benefit scheme. The defined benefit scheme is closed to new members.
Principal Actuarial Assumptions
BCT is an associate member of the scheme. In the event of BCT becoming unable to
meet its obligations, they will be met by Newcastle City Council (NCC) . As part of this
arrangement, BCT has made payment of a pension bond to NCC. The value of this
bond is independently reviewed from time to time by the scheme actuary. The value of
the bond is shown as a non-current debtor.
Byker Community Trust is a member of The Tyne & Wear Pension Fund (TWPF) which
is part of the Local Government Pension Scheme (LGPS).
Inflation assumption (CPI)
Rate of increase in salaries
Rate of increase for pensions in payment / inflation
Discount rate for scheme liabilites
The following information is based upon a full actuarial valuation of the fund at 31 March
2017 updated to 31 March 2018 by a qualified independent actuary.
Page 40 of 50

Notes to the Financial Statements(continued)
As at 31
March 2018
As at 31
March 2017
Years Years
22.9 22.8
26.4 26.3
25.1 25.0
28.7 28.6
2018 2017
£ £
79,000 67,000
- -
79,000 67,000
8,000 4,000
8,000 4,000
(13,000) 146,000
48,000 (342,000)
35,000 (196,000)
364,000 142,000
79,000 67,000
(50,000) (45,000)
- -
8,000 4,000
(35,000) 196,000
366,000 364,000
2017-18
Amounts of gains and losses recognised in the Statement of Comprehensive
Income
Analysis of othe amount charged to operating costs in the Statement of
Comprehensive Income for the year ended 31 March 2018
Movement in deficit during year
Deficit in scheme at 31 March 2018
Remeasurements
Net interest/return on assets
Past service cost
Employer contributions
Employer service cost (net of employee contributions)
Movement in year:
Deficit in scheme at 1 April 2017
Retiring Today
Interest on pensions liabilities
Total amounts charged to financing costs
Total actuarial gain/(loss) recognised
Actuarial gains/(losses) on pension scheme assets
Actuarial (losses)/gains on pension scheme assets
Males
Females
Retiring in 20 years
Females
Males
Total operating charge
Past service cost
Employer service cost (net of employee contributions)
Analysis of pension finance costs
Principal Actuarial Assumptions (continued)
Byker Community Trust Annual Report and Financial Statements
Page 41 of 50

Notes to the Financial Statements(continued)
2018 2017
£ £
1,480,000 817,000
79,000 67,000
37,000 32,000
22,000 26,000
(48,000) 342,000
(3,000) 196,000
1,567,000 1,480,000
1,116,000 675,000
29,000 28,000
(13,000) 146,000
50,000 45,000
22,000 26,000
(3,000) 196,000
1,201,000 1,116,000
2017-18
Assets at start of period
Liabilities at end of period
Benefits paid
Remeasurements
Employee contributions
Reconciliation of assets
Assets at end of period
Interest cost
Service cost
Asset and liability reconcilliation
Byker Community Trust Annual Report and Financial Statements
Benefits paid
Employee contributions
Employer contributions
Remeasurements
Return on plan assets
Liabilities at start of period
Reconciliation of liabilites
Page 42 of 50

Notes to the Financial Statements(continued)
£ £ £
Cost:
14,351,146 135,962 14,487,108
Purchases of property 54,403 54,403
(6,362) 1,457,088 1,450,726
1,131,997 (1,131,997) -
15,531,184 461,053 15,992,237
(535,097) - (535,097)
(560,994) - (560,994)
(1,096,091) - (1,096,091)
14,435,094 461,053 14,896,147
13,816,049 135,962 13,952,011
2018 2017
£ £
Housing Properties comprise:
Freeholds 14,896,147 13,952,011
2018 2017
£ £
319,769 367,083
1,130,957 -
1,450,726 367,083
2017-18
14a. Fixed Assets - Housing properties
Total
Social Housing
Properties for
letting under
construction
Social housing
properties held
for letting
completed
Byker Community Trust Annual Reports and Financial Statements
Works to existing properties
Additions:
At 1 April 2017
Depreciation and impairment:
Schemes completed
Improvements works capitalised
Components capitalised
Expenditure on works to existing properties
Total
As at 31 March 2018
Net Book Value
As at 1 April 2017
At at 31 March 2018
As at 31 March 2018
Depreciation charged in year
At 1 April 2017
Page 43 of 50

Notes to the Financial Statements(continued)
£ £ £
98,871 159,085 257,956
- - -
98,871 159,085 257,956
- - -
(19,774) (31,817) (51,591)
(19,774) (31,817) (51,591)
79,097 127,268 206,365
98,871 159,085 257,956
2018 2017
£ £
1,153,491 952,321
(671,179) (566,183)
126,180 183,190
341,054 59,253
Debtors due within one year 949,545 628,581
179,200 94,500
179,200 94,500
2017-18
14b. Fixed Assets - Other Fixed Assets
Byker Community Trust Annual Reports and Financial Statements
Amounts falling due after more than one year
Pension guarantee bond
Prepayment and accrued income
Other debtors
Debtors due after more than one year
Total
Office
improvements
IT
infrastructure
At at 31 March 2018
As at 1 April 2017
As at 31 March 2018
Depreciation and impairment:
At 1 April 2017
Depreciation charged in year
As at 31 March 2018
At 1 April 2017
Additions:
Cost:
Net Book Value
Less provision for bad debt
Rent arrears
Amounts falling due within one year
15. Trade and other debtors
Page 44 of 50

Notes to the Financial Statements(continued)
2018 2017
£ £
153,187 152,466
153,187 152,466
2018 2017
£ £
8,400,860 4,135,316
8,400,860 4,135,316
2018 2017
£ £
Surplus for the year 1,999,021 1,205,805
Adjustments for non-cash items:
Depreciation of housing properties 560,994 180,998
Depreciation of other fixed assets 51,591 -
Grants recognised in income - (200,000)
Pension costs less contributions payable 37,000 26,000
Non-equity shares cancelled (11) -
Movements in working capital
(Increase)/Decrease in trade and other debtors (320,964) 463,154
Increase / (decrease) in trade and other creditors (938,484) (2,234,083)
Adjustments for investing or financing activities:
Net gain/loss on sale of fixed assets (278,143) (82,690)
Interest payable 250,622 286,022
Interest received (12,762) (41,608)
Non-equity shares issued 5 3
1,348,869 (396,399)
Investment at valuation comprise cash and cash equivalents invested for periods of
more than 24 hours.
2017-18Byker Community Trust Annual Reports and Financial
Statements
16. Investments
Investments at valuation
Investments
Cash flows from operations
17b. Cash flow from operating activities
Cash at bank and in hand
Total cash and cash equivalents
17a. Cash and cash equivalents
Page 45 of 50
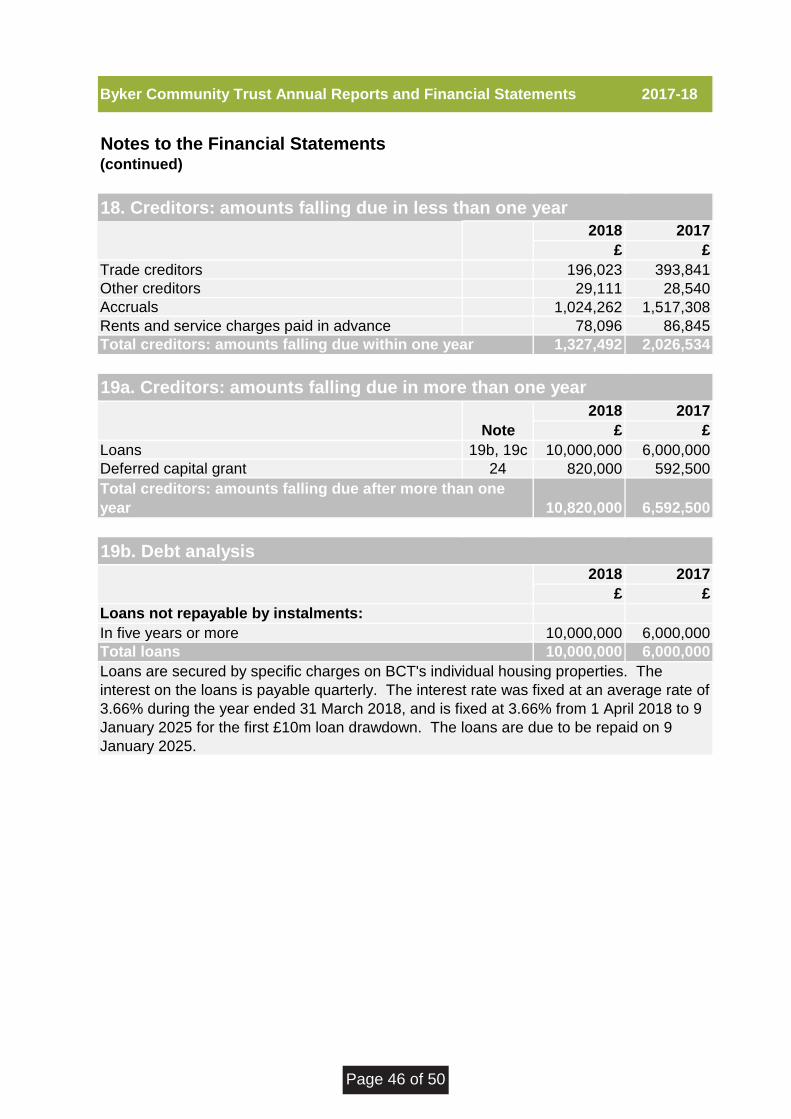
Notes to the Financial Statements(continued)
18. Creditors: amounts falling due in less than one year
2018 2017
£ £
Trade creditors 196,023 393,841
Other creditors 29,111 28,540
Accruals 1,024,262 1,517,308
Rents and service charges paid in advance 78,096 86,845
1,327,492 2,026,534
2018 2017
£ £
Loans 19b, 19c 10,000,000 6,000,000
Deferred capital grant 24 820,000 592,500
10,820,000 6,592,500
19b. Debt analysis
2018 2017
£ £
10,000,000 6,000,000
10,000,000 6,000,000
Byker Community Trust Annual Reports and Financial Statements 2017-18
Total creditors: amounts falling due within one year
Loans are secured by specific charges on BCT's individual housing properties. The
interest on the loans is payable quarterly. The interest rate was fixed at an average rate of
3.66% during the year ended 31 March 2018, and is fixed at 3.66% from 1 April 2018 to 9
January 2025 for the first £10m loan drawdown. The loans are due to be repaid on 9
January 2025.
Total creditors: amounts falling due after more than one
year
Total loans
In five years or more
Loans not repayable by instalments:
19a. Creditors: amounts falling due in more than one year
Note
Page 46 of 50

Notes to the Financial Statements(continued)
£ £ £ Years
The interest rate profile of the
Trust at 31 March 2018 was:
Non-installment loans 10,000,000 10,000,000 3.66 6.78The interest rate profile of the
Trust at 31 March 2017 was:
Non-installment loans 6,000,000 6,000,000 3.90 7.78
£
26,000,000
16,000,000
10,000,000
26,000,000
14,000,000
6,000,000
2017-18
19c. Interest rate profile
Weighted
average
term
Byker Community Trust Annual Reports and Financial Statements
Total Fixed rate
Weighted
average
rate
As at 31 March 2017 the Trust has the following borrowing facilities:
Facilities available
Drawn facilities
As at 31 March 2018 the Trust has the following borrowing facilities:
Drawn facilities
Facilities available
Total agreed facilities
Total agreed facilities
Page 47 of 50

(continued)
Pension
£
(364,000)
35,000
(37,000)
(366,000)
2018 2017
No. No.
32 29
Issued during the year 5 3
Redeemed during the year (11) -
At the end of the year 26 32
2018 2017
£ £
4,824,420 1,108,186
4,865,242 2,225,299
At the end of the year 9,689,662 3,333,485
30,000 144,513
9,659,662 3,188,972
9,689,662 3,333,485
Byker Community Trust Annual Reports and Financial Statements 2017-18
Notes to the Financial Statements
The par value of each share is £1. The shares do not have a right to any dividend or
distribution in a winding-up, and are not redeemable. Each share has full voting rights.
All shares are fully paid.
21. Non-equity share capital
Allotted Issued and Fully Paid
20. Provision for liabilities and charges
Re-measurement changes
At 1 April 2017
Difference between contributions payable and pensions costs
At the end of the year
Total
Committed loan facilities and cash balances
Capital grants and contributions
22. Capital commitments
Capital expenditure that has been contracted for but has not
been provided for in the financial statements
Capital expenditure that has been authorised by the Board but
has not yet been contracted for
BCT expects these commitments to be contracted within the
Page 48 of 50
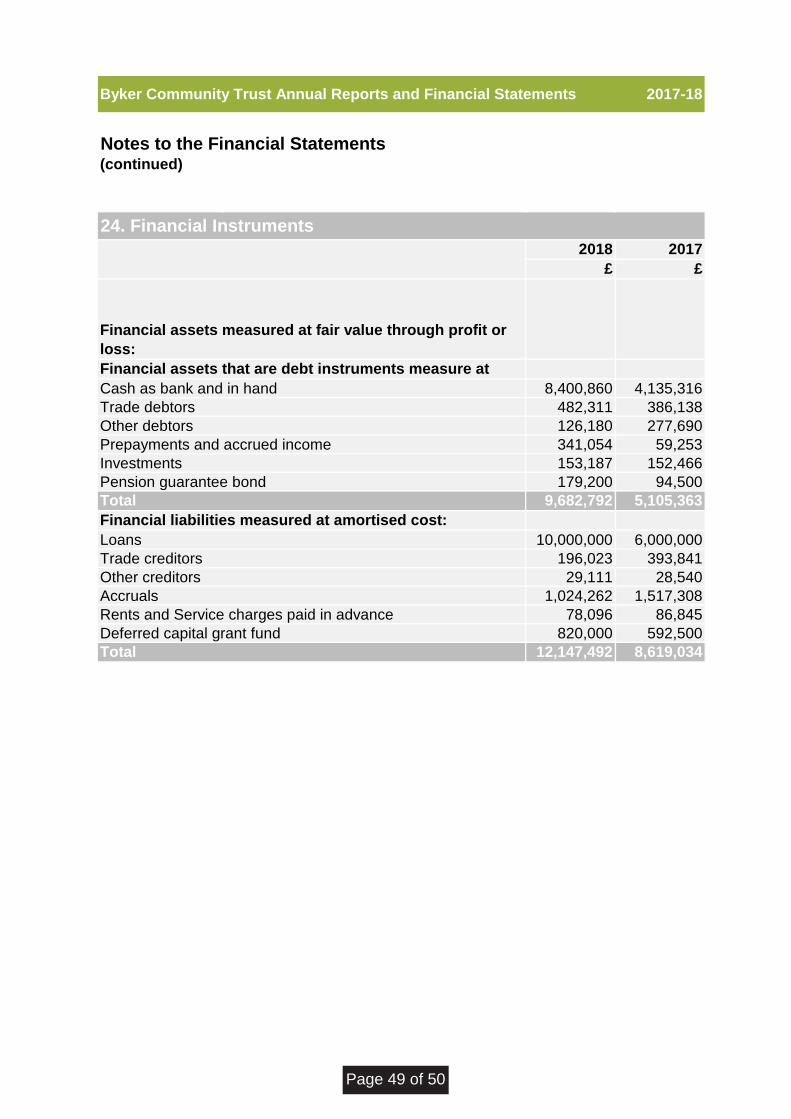
(continued)
2018 2017
£ £
8,400,860 4,135,316
482,311 386,138
126,180 277,690
341,054 59,253
153,187 152,466
Pension guarantee bond 179,200 94,500
9,682,792 5,105,363
10,000,000 6,000,000
196,023 393,841
29,111 28,540
1,024,262 1,517,308
Rents and Service charges paid in advance 78,096 86,845
820,000 592,500
12,147,492 8,619,034
Byker Community Trust Annual Reports and Financial Statements 2017-18
Notes to the Financial Statements
Other debtors
Prepayments and accrued income
Trade debtors
24. Financial Instruments
Cash as bank and in hand
Financial assets that are debt instruments measure at
Financial assets measured at fair value through profit or
loss:
Total
Deferred capital grant fund
Accruals
Other creditors
Investments
Trade creditors
Financial liabilities measured at amortised cost:
Loans
Total
Page 49 of 50

(continued)
£ £ £
Total accumulated grants received
137,700 730,000 867,700
227,500 - -
365,200 730,000 1,095,200
(25,200) (250,000) (275,200)
- - -
(25,200) (250,000) (275,200)
340,000 480,000 820,000
112,500 480,000 592,500
2017
£
(65,291,891)
(4,000,181)
4,000,181
65,291,891
-
The 2017 accounts have been adjusted for this change of accounting policy as follows:
25. Deferred Grant Income
Social
Housing
Grant
Other Captial
Grants Total
Accumulated amortisation
At 1 April 2017
Released to Income statement in the year
As at 31 March 2018
Grants received in year
Current liabilities
Non current liabilities
Impact on reserves
2017-18
Notes to the Financial Statements
Non current assets
Current assets
Net Book Value
At at 31 March 2018
As at 1 April 2017
Byker Community Trust Annual Reports and Financial Statements
As at 31 March 2018
At 1 April 2017
26. Restatement of prior year
BCT has reviewed its accounting treatment in respect of the 2012 Transfer Agreement
and has concluded that there is no financial liabilities or assets arising.
Page 50 of 50