By TYLER MICHAEL LOVELLY - University of Florida
84
COMPARATIVE ANALYSIS OF SPACE-GRADE PROCESSORS By TYLER MICHAEL LOVELLY A DISSERTATION PRESENTED TO THE GRADUATE SCHOOL OF THE UNIVERSITY OF FLORIDA IN PARTIAL FULFILLMENT OF THE REQUIREMENTS FOR THE DEGREE OF DOCTOR OF PHILOSOPHY UNIVERSITY OF FLORIDA 2017
Transcript of By TYLER MICHAEL LOVELLY - University of Florida

COMPARATIVE ANALYSIS OF SPACE-GRADE PROCESSORS
By
TYLER MICHAEL LOVELLY
A DISSERTATION PRESENTED TO THE GRADUATE SCHOOL OF THE UNIVERSITY OF FLORIDA IN PARTIAL FULFILLMENT
OF THE REQUIREMENTS FOR THE DEGREE OF DOCTOR OF PHILOSOPHY
UNIVERSITY OF FLORIDA
2017

© 2017 Tyler Michael Lovelly

To my country

4
ACKNOWLEDGMENTS
This work was supported in part by the Industry/University Cooperative Research
Center Program of the National Science Foundation under grant nos. IIP-1161022 and
CNS-1738783, by the industry and government members of the NSF Center for High-
Performance Reconfigurable Computing and the NSF Center for Space, High-
Performance, and Resilient Computing, by the University of Southern California
Information Sciences Institute for remote access to their systems, and by Xilinx and
Microsemi for provided hardware and software.

5
TABLE OF CONTENTS page
ACKNOWLEDGMENTS .................................................................................................. 4
LIST OF TABLES ............................................................................................................ 7
LIST OF FIGURES .......................................................................................................... 8
ABSTRACT ..................................................................................................................... 9
CHAPTER
1 INTRODUCTION .................................................................................................... 11
2 BACKGROUND AND RELATED RESEARCH ....................................................... 14
Metrics and Benchmarking Analysis ....................................................................... 15
Computational Dwarfs and Taxonomies ................................................................. 18
3 METRICS AND BENCHMARKING METHODOLOGIES ........................................ 20
Metrics Calculations for Fixed-Logic and Reconfigurable-Logic Processors........... 20
Benchmark Development, Optimization, and Testing for CPUs and FPGAs .......... 24
4 METRICS EXPERIMENTS, RESULTS, AND ANALYSIS ....................................... 27
Metrics Comparisons of Space-Grade CPUs, DSPs, and FPGAs .......................... 27 Performance Variations in Space-Grade CPUs, DSPs, and FPGAs ...................... 29
Overheads Incurred from Radiation Hardening of CPUs, DSPs, and FPGAs ......... 36 Projected Future Space-Grade CPUs, DSPs, FPGAs, and GPUs .......................... 39
5 BENCHMARKING EXPERIMENTS, RESULTS, AND ANALYSIS ......................... 44
Space-Computing Taxonomy and Benchmarks ...................................................... 44 Performance Analysis of Space-Grade CPUs ........................................................ 48 Performance Analysis of Space-Grade FPGAs ...................................................... 51 Benchmarking Comparisons of Space-Grade CPUs and FPGAs ........................... 53 Expanded Analysis of Space-Grade CPUs ............................................................. 55
6 CONCLUSIONS ..................................................................................................... 58
APPENDIX
A METRICS DATA ..................................................................................................... 62
B BENCHMARKING DATA ........................................................................................ 65

6
LIST OF REFERENCES ............................................................................................... 68
BIOGRAPHICAL SKETCH ............................................................................................ 84

7
LIST OF TABLES
Table page 2-1 UCB computational dwarfs. ................................................................................ 18
5-1 Space-computing taxonomy. .............................................................................. 45
5-2 Space-computing benchmarks. .......................................................................... 47
A-1 Metrics data for space-grade CPUs, DSPs, and FPGAs. ................................... 62
A-2 Performance variations in space-grade CPUs, DSPs, and FPGAs. ................... 62
A-3 Metrics data for closest COTS counterparts to space-grade CPUs, DSPs, and FPGAs. ........................................................................................................ 62
A-4 Radiation-hardening outcomes for space-grade CPUs, DSPs, and FPGAs. ...... 63
A-5 Percentages achieved by space-grade CPUs, DSPs, and FPGAs after radiation hardening. ............................................................................................ 63
A-6 Metrics data for low-power COTS CPUs, DSPs, FPGAs, and GPUs. ................ 64
A-7 Metrics data for projected future space-grade CPUs, DSPs, FPGAs, and GPUs (worst case). ............................................................................................ 64
A-8 Metrics data for projected future space-grade CPUs, DSPs, FPGAs, and GPUs (best case). .............................................................................................. 64
B-1 Parallelization data for space-grade CPUs. ........................................................ 65
B-2 Resource usage data for space-grade FPGAs. .................................................. 66
B-3 Benchmarking data for matrix multiplication on space-grade CPUs and FPGAs. ............................................................................................................... 66
B-4 Benchmarking data for Kepler’s equation on space-grade CPUs and FPGAs. .. 66
B-5 Performance data for additional benchmarks on space-grade CPUs. ................ 67

8
LIST OF FIGURES
Figure page 4-1 Metrics data for space-grade CPUs, DSPs, and FPGAs. ................................... 28
4-2 Operations mixes of intensive computations. ..................................................... 30
4-3 Performance variations in space-grade CPUs, DSPs, and FPGAs. ................... 31
4-4 Metrics data for closest COTS counterparts to space-grade CPUs, DSPs, and FPGAs. ........................................................................................................ 37
4-5 Percentages achieved by space-grade CPUs, DSPs, and FPGAs after radiation hardening. ............................................................................................ 38
4-6 Metrics data for low-power COTS CPUs, DSPs, FPGAs, and GPUs. ................ 40
4-7 Metrics data for current and projected future space-grade CPUs, DSPs, FPGAs, and GPUs. ............................................................................................ 42
5-1 Parallelization data for matrix multiplication on space-grade CPUs. ................... 49
5-2 Parallelization data for Kepler’s equation on space-grade CPUs. ...................... 50
5-3 Resource usage data for matrix multiplication on space-grade FPGAs. ............. 51
5-4 Resource usage data for Kepler’s equation on space-grade FPGAs. ................ 52
5-5 Benchmarking data for matrix multiplication on space-grade CPUs and FPGAs. ............................................................................................................... 54
5-6 Benchmarking data for Kepler’s equation on space-grade CPUs and FPGAs. .. 54
5-7 Performance data for additional benchmarks on space-grade CPUs. ................ 56

9
Abstract of Dissertation Presented to the Graduate School of the University of Florida in Partial Fulfillment of the Requirements for the Degree of Doctor of Philosophy
COMPARATIVE ANALYSIS OF SPACE-GRADE PROCESSORS
By
Tyler Michael Lovelly
December 2017
Chair: Alan Dale George Major: Electrical and Computer Engineering
Onboard computing demands for space missions are continually increasing due
to the need for real-time sensor and autonomous processing combined with limited
communication bandwidth to ground stations. However, creating space-grade
processors that can operate reliably in environments that are highly susceptible to
radiation hazards is a lengthy, complex, and costly process, resulting in limited
processor options for space missions. Therefore, research is conducted into current,
upcoming, and potential future space-grade processors to provide critical insights for
progressively more advanced architectures that can better meet the increasing
demands for onboard computing. Metrics and benchmarking data are generated and
analyzed for various processors in terms of performance, power efficiency, memory
bandwidth, and input/output bandwidth.
Metrics are used to measure and compare the theoretical capabilities of a broad
range of processors. Results demonstrate how onboard computing capabilities are
increasing due to processors with architectures that support high levels of parallelism in
terms of computational units, internal memories, and input/output resources; and how
performance varies between applications, depending on the intensive computations

10
used. Furthermore, the overheads incurred by radiation hardening are quantified and
used to analyze low-power commercial processors for potential use as future space-
grade processors.
Once the top-performing processors are identified using metrics, benchmarking
is used to measure and compare their realizable capabilities. Computational dwarfs are
established and a taxonomy is formulated to characterize the space-computing domain
and identify computations for benchmark development, optimization, and testing.
Results demonstrate how to optimize for the architectures of space-grade processors
and how they compare to one another for a variety of integer and floating-point
computations.
Metrics and benchmarking results and analysis thus provide critical insights for
progressively more advanced architectures for space-grade processors that can better
meet the increasing onboard computing demands of space missions. Trade-offs
between architectures are determined that can be considered when deciding which
space-grade processors are best suited for specific space missions or which
characteristics and features are most desirable for future space-grade processors.

11
CHAPTER 1 INTRODUCTION
Currently available processor options for space missions are limited due to the
lengthy, complex, and costly process of creating space-grade processors, and because
space mission design typically requires lengthy development cycles, resulting in a large
and potentially increasing technological gap between space-grade and commercial-off-
the-shelf (COTS) processors [1–5]. However, computing requirements for space
missions are becoming more demanding due to the increasing need for real-time sensor
and autonomous processing with more advanced sensor technologies and increasing
mission data rates, data precisions, and problem sizes [5–7]. Furthermore,
communication bandwidth to ground stations remains limited and suffers from long
transmission latencies, making remote transmission of sensor data and real-time
operating decisions impractical. High-performance space-grade processors can
alleviate these challenges by processing data before transmission to ground stations
and making decisions autonomously, but careful consideration is required to ensure that
they can meet the unique needs of onboard computing [7,8].
To address the continually increasing demand for high-performance onboard
computing, architectures must be carefully analyzed for their potential as future space-
grade processors. Current space-grade processors are typically based upon COTS
processors with architectures that were not explicitly designed for the unique needs of
onboard computing. To ensure that future space-grade processors are based upon
architectures that are most suitable for space missions, trade-offs between various
architectures should be determined and considered when designing, optimizing, or
comparing space-grade processors, or when selecting COTS architectures for radiation

12
hardening and use in space missions [9–11]. However, the range of available
processors is large and diverse, with many possible architectures to evaluate.
To analyze the broad range of current, upcoming, and potential future processors
for onboard computing, a set of metrics is used that provides a theoretical basis for the
study of their architectures [12–16]. Facilitated by these metrics, quantitative analysis
and objective comparisons are conducted for many diverse space-grade and low-power
COTS processors, from categories such as multicore and many-core central processing
units (CPUs), digital signal processors (DSPs), field-programmable gate arrays
(FPGAs), graphics processing units (GPUs), and hybrid configurations of these
architectures. Metrics analysis provides insights into the performance, power efficiency,
memory bandwidth, and input/output bandwidth of specific implementations of these
processors to track the current and future progress of their development and to
determine which can better meet the computing needs of space missions [1].
Once the top-performing space-grade processors have been identified, a
benchmarking analysis is conducted to study the realizable capabilities of their
architectures. To characterize the broad space-computing domain, a comprehensive
study is performed to determine common and critical computing requirements for space
missions based upon application requirements. Using this information, computational
dwarfs are established, and an expansive taxonomy is formulated that broadly defines
and classifies the computationally intensive applications required by space missions.
From this taxonomy, a set of benchmarks is identified that is largely representative of
onboard computing requirements, and thus simplifies the space-computing domain into
a manageable set of computations. Then, a variety of these space-computing

13
benchmarks are developed, optimized, and tested on top-performing processors to
analyze and compare the realizable capabilities of each architecture in terms of
performance and power efficiency. Benchmarking analysis provide insights into which
architectures and optimizations are most effective and which factors are limiting
additional performance from being achieved [9].
The remainder of this dissertation is structured as follows. Chapter 2 describes
background and related research for space-grade processors, metrics and
benchmarking analysis, and computational dwarfs and taxonomies. Chapter 3 describes
methodologies for metrics calculations and benchmark development, optimization, and
testing for space-grade processors. Chapter 4 provides a metrics analysis of current,
upcoming, and projected future space-grade processors, including comparisons of
space-grade processors to one another, detailed analysis of how the performance of
space-grade processors varies between applications and computations based upon
operations mix, comparisons of space-grade processors to the closest COTS
counterparts upon which they were based to determine overheads incurred from
radiation hardening, and comparisons of top-performing space-grade and COTS
processors to determine the potential for future space-grade processors. Chapter 5
provides a benchmarking analysis of top-performing space-grade processors, including
the formulation of a taxonomy that is used characterize the space-computing domain
and identify benchmarks, direct comparisons of space-grade processors to one another
in terms of performance and power efficiency, and an expanded performance analysis
using a variety of additional benchmarks. Finally, Chapter 6 provides conclusions. Data
for all results are tabulated and included in the Appendix.

14
CHAPTER 2 BACKGROUND AND RELATED RESEARCH
Many radiation hazards exist in the harsh space environment such as galactic
cosmic rays, solar particle events, and trapped radiation in the Van Allen belts, which
threaten the operation of onboard processors [17,18]. Space-grade processors must be
radiation hardened to withstand cumulative radiation effects such as charge buildup
within the gate oxide that causes damage to the silicon lattice over time, and they must
provide immunity to single-event effects that occur when single particles pass through
the silicon lattice and cause errors that can lead to data corruption or disrupt the
functionality of the processor [19–21]. Several techniques exist for the fabrication of
space-grade processors [22–24], including radiation hardening by process, which
involves the use of an insulating oxide layer, and radiation hardening by design, which
involves specialized transistor-layout techniques.
Although COTS processors can be used in space, they cannot always satisfy
reliability and accessibility requirements for missions with long planned lifetimes within
harsh orbits and locations that are highly susceptible to radiation hazards. However,
creating a space-grade implementation of a COTS processor often comes with
associated costs [25], including slower operating frequencies, decreased numbers of
processor cores or computational units, increased power dissipation, and decreased
input/output resources.
Traditionally, space-grade processors have come in the form of single-core
CPUs [26]. However, in recent years, development has occurred on space-grade
processors with more advanced architectures such as multicore and many-core CPUs,
DSPs, and FPGAs. For example, a space-grade CPU based upon a multicore ARM

15
Cortex-A53 architecture is currently being developed through a joint investment of the
National Aeronautics and Space Administration (NASA) and the Air Force Research
Laboratory (AFRL) under the High Performance Spaceflight Comping (HPSC) program
[6–8,27,28]. This processor is referred to as the Boeing HPSC, although it may be
renamed upon completion of the program.
Metrics and Benchmarking Analysis
To analyze and compare processors for use in space missions, an established
set of metrics is used for the quantitative analysis of diverse processors in terms of
performance, power efficiency, memory bandwidth, and input/output bandwidth [12–16].
These metrics provide a basis for the analysis of a the theoretical capabilities of
processors and enable the objective comparison of diverse architectures, from
categories such as multicore and many-core CPUs, DSPs, FPGAs, GPUs, and hybrid
configurations of these architectures.
Computational density (CD), reported in gigaoperations per second (GOPS), is a
metric for the steady-state performance of the computational units of a processor for a
stream of independent operations. By default, calculations are based upon an
operations mix of half additions and half multiplications. However, the default can be
varied to analyze how performance differs between applications that contain
computations that require other operations mixes. Multiply-accumulate functions are
only considered to be one operation each because they require data dependency
between each addition and multiplication. CD is calculated separately for each data type
considered, including 8-bit, 16-bit, and 32-bit integers, as well as both single-precision
and double-precision floating-point (hereafter referred to as Int8, Int16, Int32, SPFP,
and DPFP, respectively). CD per watt (CD/W), reported in GOPS per watt (GOPS/W), is

16
a metric for the performance achieved for each watt of power dissipated by the
processor. Internal Memory Bandwidth (IMB), reported in gigabytes per second, is a
metric for the throughput between a processor and onchip memories. External Memory
Bandwidth (EMB), reported in gigabytes per second, is a metric for the throughput
between a processor and offchip memories through dedicated memory controllers.
Input/Output Bandwidth (IOB), reported in gigabytes per second, is a metric for the total
throughput between a processor and offchip resources through both dedicated memory
controllers and all other available forms of input/output. Although no single metric can
completely characterize the performance of any given processor, each metric provides
unique insights into specific features that can be related to applications and
computations as needed. The most relevant metric for performance is CD when bound
computationally, CD/W when bound by power efficiency, IMB or EMB when bound by
memory, IOB when bound by input/output resources, or some combination of multiple
metrics depending on specific application requirements. Although other metrics are also
of interest, such as the cost and reliability of each processor, this information is not
standardized between vendors and is often unavailable or highly dependent on mission-
specific factors.
Metrics can be calculated solely based upon information from vendor-provided
documentation and software, without the hardware costs and software development
efforts required for benchmarking, thus providing a practical methodology for the
comparison and analysis of a broad range of processors. However, metrics describe
only the theoretical capabilities of each architecture without complete consideration of
software requirements and implementation details that result in additional costs to

17
performance. Therefore, once the top-performing processors have been identified using
metrics, more thorough performance analysis can then be conducted using
benchmarking to determine realizable capabilities through hardware and software
experimentation.
To analyze the realizable capabilities of space-grade processors, benchmarks
are identified for the space-computing domain, then developed, optimized, and tested
directly on each processor. Typically, vendor-provided libraries achieve the highest
performance for any given processor because they are carefully and specifically
optimized for its architecture [14]. However, these libraries are often very limited and are
unlikely to be optimized for the more esoteric computations used for autonomous
processing. Furthermore, most highly optimized numerical libraries are developed
specifically for the high-performance computing domain, which is primarily concerned
with floating-point data types, and thus do not support integer data types that are often
used for sensor processing. Therefore, the development of custom benchmarks
becomes necessary when existing libraries do not support all computations, data types,
and optimizations being considered.
Although benchmarking analysis of space-grade processors requires greater
hardware costs and development efforts than metrics analysis, the resulting insights are
specific to the computations required by the space-computing domain. Thorough
analysis becomes possible as processors approach theoretical capabilities and the
effects of their architectures on performance can be carefully studied. Therefore,
benchmarking provides an accurate and insightful methodology for comparing
performance trade-offs for various architectures, computations, and optimizations.

18
Benchmarking of onboard processors has been conducted previously [11,29,30], but
there has been no research focused on analyzing and comparing the performance of
the advanced architectures used in current and upcoming space-grade processors.
Computational Dwarfs and Taxonomies
Before benchmarking analysis can be conducted, the computing domain being
considered must first be studied and characterized to identify computations that are
largely representative of its critical applications [31,32]. Thus, the University of California
at Berkeley (UCB) introduced the concept of computational dwarfs for designing and
analyzing computing models and architectures. A dwarf is defined as “an algorithmic
method that captures a pattern of computation and communication” [33, pp. 1]. Table 2-
1 lists the UCB dwarfs, which were defined at high levels of abstraction to encompass
all computational methods used in modern computing.
Table 2-1. UCB computational dwarfs.
Dwarf
Dense linear algebra Sparse linear algebra Spectral methods N-body methods Structured grids Unstructured grids MapReduce Combinational logic Graph traversal Dynamic programming Backtrack and branch-and-bound Graphical models Finite state machines
The UCB dwarfs are used to characterize applications by determining their
intensive computations and classifying them under the appropriate dwarf. For example,
computations such as matrix multiplication and matrix addition are both classified under
the dense and sparse linear algebra dwarfs, while fast Fourier transform and discrete

19
wavelet transform are both classified under the spectral methods dwarf. Abstracting
applications as dwarfs enables analysis of computational patterns across a broad range
of applications, independent of the actual hardware and software implementation
details. For any computing domain, dwarfs can be identified and used to create
taxonomies that broadly define and classify the computational patterns within that
domain. This concept has been demonstrated in various computing domains, including
high-performance computing [34], cloud computing [35], and symbolic computation [36].
These concepts are used to establish dwarfs and a taxonomy for the space-computing
domain that is then used to identify a set of computations for benchmarking.

20
CHAPTER 3 METRICS AND BENCHMARKING METHODOLOGIES
Established concepts in the analysis of processors are used and applied to
space-grade processors. These concepts include metrics analysis as an initial
comparison of a broad range of architectures and benchmarking analysis for further
insights into the top-performing architectures based upon performance and power
efficiency for various computations.
Metrics Calculations for Fixed-Logic and Reconfigurable-Logic Processors
To calculate metrics for a fixed-logic processor such as a CPU, DSP, or GPU,
several pieces of information are required about the architecture that are obtained from
vendor-provided documentation [12–14]. For example, Equations 3-1 to 3-15
demonstrate the process of calculating metrics for the Freescale QorIQ P5040, which is
a quadcore CPU [37–39]. CD calculations require information about the operating
frequency reported in megahertz (MHz), the number of each type of computational unit,
and the number of operations per cycle that can be achieved by each type of
computational unit for all operations mixes and data types considered. As shown in
Equations 3-1 and 3-2, there is one-integer addition unit and one-integer multiplication
unit on each processor core, allowing for one addition and one multiplication to be
issued simultaneously per cycle for all integer data types. There is only one floating-
point unit on each processor core, which handles both additions and multiplications,
allowing for only one operation to be issued per cycle for all floating-point data types.
CD/W calculations require the same information as CD calculations, in addition to the
maximum power dissipation. As shown in Equations 3-3 and 3-4, CD/W is calculated
using the corresponding CD calculations and the maximum power dissipation. IMB

21
calculations require information about the number of each type of onchip memory unit,
such as caches and register files, and associated operating frequencies, bus widths,
access latencies, and data rates. As shown in Equations 3-5 to 3-7, IMB is calculated
for all types of caches available on each processor core. Assuming cache hits, both
types of L1 cache can supply data in each clock cycle. Although the L2 cache has a
higher bus width, it also requires a substantial access latency that limits the overall
bandwidth. IMB values are combined to obtain the total IMB. EMB calculations require
information about the number of each type of dedicated controller for offchip memories
and associated operating frequencies, bus widths, and data rates. As shown in
Equation 3-8, EMB is calculated for the dedicated controllers available for external
memories on the QorIQ P5040. IOB calculations require the same information as EMB
calculations, in addition to the number of each type of available input/output resource
and associated operating frequencies, bus widths, and data rates. As shown in
Equations 3-9 to 3-15, IOB is calculated for each type of input/output resource available
using optimal configurations for signal multiplexing. IOB values are combined to obtain
the total IOB.
𝐶𝐷𝐼𝑛𝑡8/𝐼𝑛𝑡16/𝐼𝑛𝑡32 = 2200 𝑀𝐻𝑧 × 4 𝑐𝑜𝑟𝑒𝑠 × 2 𝑢𝑛𝑖𝑡𝑠 × 1 𝑜𝑝𝑒𝑟𝑎𝑡𝑖𝑜𝑛/𝑐𝑦𝑐𝑙𝑒 = 17.60 𝐺𝑂𝑃𝑆 (3-1)
𝐶𝐷𝑆𝑃𝐹𝑃/𝐷𝑃𝐹𝑃 = 2200 𝑀𝐻𝑧 × 4 𝑐𝑜𝑟𝑒𝑠 × 1 𝑢𝑛𝑖𝑡 × 1 𝑜𝑝𝑒𝑟𝑎𝑡𝑖𝑜𝑛/𝑐𝑦𝑐𝑙𝑒 = 8.80 𝐺𝑂𝑃𝑆 (3-2)
𝐶𝐷/𝑊𝐼𝑛𝑡8/𝐼𝑛𝑡16/𝐼𝑛𝑡32 = 𝐶𝐷𝐼𝑛𝑡8/𝐼𝑛𝑡16/𝐼𝑛𝑡32 / 49 𝑊 = 0.36 𝐺𝑂𝑃𝑆/𝑊 (3-3)
𝐶𝐷/𝑊𝑆𝑃𝐹𝑃/𝐷𝑃𝐹𝑃 = 𝐶𝐷𝑆𝑃𝐹𝑃/𝐷𝑃𝐹𝑃 / 49 𝑊 = 0.18 𝐺𝑂𝑃𝑆/𝑊 (3-4)
𝐼𝑀𝐵𝐿1 𝑑𝑎𝑡𝑎 𝑐𝑎𝑐ℎ𝑒 = 2200 𝑀𝐻𝑧 × 4 𝑐𝑜𝑟𝑒𝑠 × 8 𝑏𝑦𝑡𝑒 𝑏𝑢𝑠 = 70.40 𝐺𝐵/𝑠 (3-5)
𝐼𝑀𝐵𝐿1 𝑖𝑛𝑠𝑡𝑟𝑢𝑐𝑡𝑖𝑜𝑛 𝑐𝑎𝑐ℎ𝑒 = 2200 𝑀𝐻𝑧 × 4 𝑐𝑜𝑟𝑒𝑠 × 16 𝑏𝑦𝑡𝑒 𝑏𝑢𝑠 = 140.80 𝐺𝐵/𝑠 (3-6)
𝐼𝑀𝐵𝐿2 𝑐𝑎𝑐ℎ𝑒 = 2200 𝑀𝐻𝑧 × 4 𝑐𝑜𝑟𝑒𝑠 × 64 𝑏𝑦𝑡𝑒 𝑏𝑢𝑠 / 11 𝑐𝑦𝑐𝑙𝑒 𝑙𝑎𝑡𝑒𝑛𝑐𝑦 = 51.20 𝐺𝐵/𝑠 (3-7)

22
𝐸𝑀𝐵𝐷𝐷𝑅3 = 2 𝑐𝑜𝑛𝑡𝑟𝑜𝑙𝑙𝑒𝑟𝑠 × 8 𝑏𝑦𝑡𝑒 𝑏𝑢𝑠 × 1600 𝑀𝑇/𝑠 = 25.60 𝐺𝐵/𝑠 (3-8)
𝐼𝑂𝐵𝐷𝐷𝑅3 = 𝐸𝑀𝐵𝐷𝐷𝑅3 = 25.60 𝐺𝐵/𝑠 (3-9)
𝐼𝑂𝐵𝐺𝑃𝐼𝑂 = 1100 𝐺𝐻𝑧 × 32 𝑝𝑜𝑟𝑡𝑠 = 4.40 𝐺𝐵/𝑠 (3-10)
𝐼𝑂𝐵𝑃𝐶𝐼𝑒2.0 = 8 𝑙𝑎𝑛𝑒𝑠 × 4 𝐺𝑏/𝑠 × 2 𝑓𝑢𝑙𝑙 𝑑𝑢𝑝𝑙𝑒𝑥 = 8.00 𝐺𝐵/𝑠 (3-11)
𝐼𝑂𝐵10𝐺𝑖𝑔𝐸 = 8 𝑙𝑎𝑛𝑒𝑠 × 2.5 𝐺𝑏/𝑠 × 2 𝑓𝑢𝑙𝑙 𝑑𝑢𝑝𝑙𝑒𝑥 = 5.00 𝐺𝐵/𝑠 (3-12)
𝐼𝑂𝐵1𝐺𝑖𝑔𝐸 = 2 𝑙𝑎𝑛𝑒𝑠 × 1 𝐺𝑏/𝑠 × 2 𝑓𝑢𝑙𝑙 𝑑𝑢𝑝𝑙𝑒𝑥 = 0.50 𝐺𝐵/𝑠 (3-13)
𝐼𝑂𝐵𝑆𝐴𝑇𝐴2.0 = 2 𝑙𝑎𝑛𝑒𝑠 × 2.4 𝐺𝑏/𝑠 = 0.60 𝐺𝐵/𝑠 (3-14)
𝐼𝑂𝐵𝑆𝑃𝐼 = 0.49 𝐺𝑏/𝑠 × 2 𝑓𝑢𝑙𝑙 𝑑𝑢𝑝𝑙𝑒𝑥 = 0.12 𝐺𝐵/𝑠 (3-15)
To calculate metrics for a reconfigurable-logic processor such as an FPGA, the
process is more complex as compared to fixed-logic processors, and it requires several
pieces of information about the architecture that are obtained from vendor-provided
documentation, software, and test cores [12–16]. For example, Equations 3-16 to 3-30
demonstrate the process of calculating metrics for the Xilinx Virtex-5 FX130T, which is
an FPGA [40–43]. CD calculations require information about the total available logic
resources of the architecture in terms of multiply-accumulate units (MACs), lookup
tables (LUTs), and flip flops (FFs). Additionally, the use of software and test cores is
required to generate information about the operating frequencies and logic resources
used for all operations mixes and data types considered. A linear-programming
algorithm is used for optimization, based upon operating frequencies and the
configuration of computational units on the reconfigurable architecture [15,16]. As
shown in Equations 3-16 to 3-20, CD is calculated separately for each integer and
floating-point data type, based upon the operating frequencies and logic resources used
for additions and multiplications, where each computational unit can compute one

23
operation per cycle and multiple implementations of each computational unit are
considered that make use of different types of logic resources. CD/W calculations
require the use software to generate information about power dissipation given the
configuration of computational units for each data type. As shown in Equations 3-21 to
3-25, CD/W is calculated separately for each integer and floating-point data type using
estimates for maximum power dissipation generated using vendor-provided software.
IMB calculations require information about the number of onchip memory units such as
block random-access-memory units and the associated operating frequencies, number
of ports, bus widths, and data rates. As shown in Equation 3-26, IMB is calculated for
the internal block random-access-memory units on the Virtex-5. EMB calculations
require the operating frequency, logic and input/output resource usage, bus widths, and
data rates for dedicated controllers for offchip memories. As shown in Equation 3-27,
EMB is calculated for dedicated controllers for external memories, where the maximum
number of controllers is limited by the number of input/output ports available. IOB
calculations require the same type of information that is required for fixed-logic
processors. As shown in Equations 3-28 to 3-30, IOB is calculated for each type of
input/output resource available. IOB values are combined to obtain the total IOB.
𝐶𝐷𝐼𝑛𝑡8 = 353.35 𝑀𝐻𝑧 × 2358 𝑐𝑜𝑟𝑒𝑠 × 1 𝑜𝑝𝑒𝑟𝑎𝑡𝑖𝑜𝑛/𝑐𝑦𝑐𝑙𝑒 = 833.20 𝐺𝑂𝑃𝑆 (3-16)
𝐶𝐷𝐼𝑛𝑡16 = 380.95 𝑀𝐻𝑧 × 1092 𝑐𝑜𝑟𝑒𝑠 × 1 𝑜𝑝𝑒𝑟𝑎𝑡𝑖𝑜𝑛/𝑐𝑦𝑐𝑙𝑒 = 416.00 𝐺𝑂𝑃𝑆 (3-17)
𝐶𝐷𝐼𝑛𝑡32 = 301.93 𝑀𝐻𝑧 × 298 𝑐𝑜𝑟𝑒𝑠 × 1 𝑜𝑝𝑒𝑟𝑎𝑡𝑖𝑜𝑛/𝑐𝑦𝑐𝑙𝑒 = 89.97 𝐺𝑂𝑃𝑆 (3-18)
𝐶𝐷𝑆𝑃𝐹𝑃 = 327.33 𝑀𝐻𝑧 × 246 𝑐𝑜𝑟𝑒𝑠 × 1 𝑜𝑝𝑒𝑟𝑎𝑡𝑖𝑜𝑛/𝑐𝑦𝑐𝑙𝑒 = 80.52 𝐺𝑂𝑃𝑆 (3-19)
𝐶𝐷𝐷𝑃𝐹𝑃 = 161.39 𝑀𝐻𝑧 × 108 𝑐𝑜𝑟𝑒𝑠 × 1 𝑜𝑝𝑒𝑟𝑎𝑡𝑖𝑜𝑛/𝑐𝑦𝑐𝑙𝑒 = 17.43 𝐺𝑂𝑃𝑆 (3-20)
𝐶𝐷/𝑊𝐼𝑛𝑡8 = 𝐶𝐷𝐼𝑛𝑡8 / 15.87 𝑊 = 52.50 𝐺𝑂𝑃𝑆/𝑊 (3-21)

24
𝐶𝐷/𝑊𝐼𝑛𝑡16 = 𝐶𝐷𝐼𝑛𝑡16 / 16.83 𝑊 = 24.72 𝐺𝑂𝑃𝑆/𝑊 (3-22)
𝐶𝐷/𝑊𝐼𝑛𝑡32 = 𝐶𝐷𝐼𝑛𝑡32 / 14.07 𝑊 = 6.39 𝐺𝑂𝑃𝑆/𝑊 (3-23)
𝐶𝐷/𝑊𝑆𝑃𝐹𝑃 = 𝐶𝐷𝑆𝑃𝐹𝑃 / 13.28 𝑊 = 6.06 𝐺𝑂𝑃𝑆/𝑊 (3-24)
𝐶𝐷/𝑊𝐷𝑃𝐹𝑃 = 𝐶𝐷𝐷𝑃𝐹𝑃 / 8.00 𝑊 = 2.18 𝐺𝑂𝑃𝑆/𝑊 (3-25)
𝐼𝑀𝐵𝐵𝑅𝐴𝑀 = 450 𝑀𝐻𝑧 × 298 𝑢𝑛𝑖𝑡𝑠 × 2 𝑝𝑜𝑟𝑡𝑠 × 9 𝑏𝑦𝑡𝑒 𝑏𝑢𝑠 = 2413.80 𝐺𝐵/𝑠 (3-26)
𝐸𝑀𝐵𝐷𝐷𝑅2 = 266.67 𝑀𝐻𝑧 × 5 𝑐𝑜𝑛𝑡𝑟𝑜𝑙𝑙𝑒𝑟𝑠 × 8 𝑏𝑦𝑡𝑒 𝑏𝑢𝑠 × 2 𝑑𝑎𝑡𝑎 𝑟𝑎𝑡𝑒 = 21.33 𝐺𝐵/𝑠 (3-27)
𝐼𝑂𝐵𝐷𝐷𝑅2 = 𝐸𝑀𝐵𝐷𝐷𝑅2 = 21.33 𝐺𝐵/𝑠 (3-28)
𝐼𝑂𝐵𝐺𝑇𝑋 = 20 𝑡𝑟𝑎𝑛𝑠𝑐𝑒𝑖𝑣𝑒𝑟𝑠 × 6.5 𝐺𝑏/𝑠 = 16.25 𝐺𝐵/𝑠 (3-29)
𝐼𝑂𝐵𝐺𝑃𝐼𝑂 = 840 𝑝𝑜𝑟𝑡𝑠 × 0.8 𝐺𝑏/𝑠 = 84.00 𝐺𝐵/𝑠 (3-30)
To calculate metrics for a hybrid processor that contains some combination of
CPU, DSP, GPU, and FPGA architectures, the calculations must first be completed for
each constituent architecture. CD values are then combined to obtain the hybrid CD,
which is then divided by the combined maximum power dissipation to obtain the hybrid
CD/W. IMB, EMB, and IOB values are also combined to obtain the hybrid IMB, EMB,
and IOB, but they must account for any overlap of memory and input/output resources
that are shared between the constituent architectures.
Benchmark Development, Optimization, and Testing for CPUs and FPGAs
Benchmarks are developed for various data types, including 8-bit, 16-bit, and 32-
bit integers, as well as both single-precision and double-precision floating-point
(hereafter referred to as Int8, Int16, Int32, SPFP, and DPFP, respectively). Correct
functionality is verified using known test patterns, then execution times are measured
using randomized data. The total number of arithmetic operations, solved equations, or
memory transfers per second are calculated for each benchmark and reported in either

25
megaoperations per second (MOPS), megasolutions per second (MSOLS), or
megatransfers per second (MT/s).
Data are generated using various development boards, including the Cobham
GR-CPCI-LEON4-N2X [44] for the Cobham GR740 [45–47], the Freescale P5040DS
[48] for the BAE Systems RAD5545 [49], the LeMaker HiKey [50] for the Boeing HPSC,
the Boeing Maestro Development Board [51] for the Boeing Maestro [52–54], the Xilinx
ML510 [55] for the Xilinx Virtex-5QV FX130 [56], and the Microsemi RTG4-DEV-KIT
[57] for the Microsemi RTG4 [58]. In some cases, the development boards used contain
close COTS counterparts because the space-grade processors are inaccessible.
Therefore, results for the GR740, RAD5545, and HPSC are adjusted to determine the
space-grade performance based upon differences in operating frequencies, where the
HPSC is estimated to operate at 500 MHz. Additionally, floating-point results for the
GR740 are adjusted to account for an estimated 30% performance reduction due to
differences in the number of floating-point units. Because the Virtex-5QV is
inaccessible, results are generated using vendor-provided software, and thus the COTS
counterpart is only used for functional verification. Although there are also two DSPs of
interest, they are not included due to lack of suitable resources for benchmarking
analysis.
For each of the CPUs being considered, benchmarks are developed in C, then
compiled and executed using a GNU/Linux operating system. Wherever possible,
benchmarks use optimized floating-point libraries [59,60]. For the GR740, RAD5545,
and HPSC, which are multicore architectures, computations are parallelized across
processor cores with a shared-memory strategy using the OpenMP interface [61].

26
Additionally, benchmarks that have results reported in MOPS or MT/s are further
parallelized for the HPSC within each processor core using its single instruction,
multiple data (SIMD) units [62]. For the Maestro, which is a many-core architecture with
nonuniform memory accesses, computations are parallelized across processor cores
with a hybrid shared-memory and message-passing strategy using both the OpenMP
interface and the Tilera User Dynamic Network interface to preserve data locality and
control cache usage by manually scattering and gathering data between cores [63,64].
Results for parallel efficiency are based upon speedup calculated by dividing parallel
performance by serial baselines. Because power dissipation cannot be measured
directly, results for power efficiency are based upon estimated maximum power
dissipation as described in vendor-provided documentation.
For each of the FPGAs being considered, benchmarks are developed in VHDL,
then simulated, synthesized, and implemented using vendor-provided software.
Wherever possible, benchmarks use vendor-provided and open-source libraries
[42,43,65–68], and are further optimized by inserting pipeline stages into the design,
which reduces the propagation delay incurred per clock cycle, thus increasing
achievable operating frequencies. Based upon the resource usage of each benchmark
in terms of available MACs, LUTs, FFs, and block random-access-memories (BRAMs),
computations are parallelized across the architectures wherever possible by
instantiating and operating multiple benchmarks simultaneously. Because power
dissipation cannot be measured directly, results for power efficiency are based upon
data generated from vendor-provided software that provides the estimated power
dissipation for each design.

27
CHAPTER 4 METRICS EXPERIMENTS, RESULTS, AND ANALYSIS
To enable quantitative analysis and objective comparisons of space-grade
processors, metrics are calculated for many diverse space-grade and low-power COTS
processors. First, space-grade processors are compared to one another. Next, top-
performing space-grade processors are further analyzed to determine how performance
varies between applications and computations based upon operations mix. Then,
space-grade processors are compared to the closest COTS counterparts upon which
they were based to determine the overheads incurred from radiation hardening. Finally,
top-performing space-grade and low-power COTS processors are compared to
determine the potential for future space-grade processors.
Metrics Comparisons of Space-Grade CPUs, DSPs, and FPGAs
Using the methods described in Chapter 3, Figure 4-1 provides CD, CD/W, IMB,
EMB, and IOB for various current and upcoming space-grade processors in logarithmic
scale, including the Honeywell HXRHPPC [69] and BAE Systems RAD750 [70], which
are single-core CPUs; the Cobham GR712RC [71,72], Cobham GR740 [45–47], and
BAE Systems RAD5545 [49], which are multicore CPUs; the Boeing Maestro [52–54],
which is a many-core CPU; the Ramon Chips RC64 [73–77] and BAE Systems
RADSPEED [78,79], which are multicore DSPs; and the Xilinx Virtex-5QV [41–43,56]
and Microsemi RTG4 [58,80–82], which are FPGAs. Data from Figure 4-1 are provided
within Table A-1.

28
A B
C Figure 4-1. Metrics data for space-grade CPUs, DSPs, and FPGAs.
A) CD. B) CD/W. C) IMB, EMB, and IOB.
The HXRHPPC, RAD750, and GR712RC achieve lower CD and CD/W due to
slower operating frequencies and older single-core or dual-core CPU architectures with
limited computational units. Additionally, they achieve low IMB due to limited internal
caches, low EMB due to limited or no dedicated external-memory controllers, and low
IOB due to limited and slow input/output resources. CPUs such as the GR740,
RAD5545, and Maestro achieve a much higher CD than older CPUs due to their higher
operating frequencies, newer multicore and many-core architectures, and (in the case of
both the RAD5545 and Maestro), multiple integer units within each processor core. Of
all the CPUs compared, the Maestro achieves the highest CD and IMB due to its large

29
number of processor cores and caches, whereas the GR740 achieves the highest
CD/W due to its low power dissipation.
Although the theoretical capabilities of space-grade processors are greatly
increasing due to newer CPUs, even further gains are made with DSPs and FPGAs.
The RC64 achieves a high integer CD, and the RADSPEED achieves a high floating-
point CD due to large levels of parallelism for these types of computational units; and
both achieve a high IMB due to large numbers of internal caches and register files. The
Virtex-5QV achieves high CD and CD/W, and the RTG4 achieves high integer CD and
CD/W because they support large numbers of computational units at a relatively low
power dissipation; and both achieve high IMB due to large numbers of internal BRAM
units, high EMB because they support multiple dedicated controllers for external
memories, and high IOB due to the large number of general-purpose input/output ports
available.
By comparing space-grade processors using metrics, the changes in theoretical
capabilities of space-grade processors are analyzed. The performance achieved by
space-grade processors has increased by several orders of magnitude due to newer
processors with more advanced architectures that support higher levels of parallelism in
terms of computational units, internal memories, and input/output resources.
Performance Variations in Space-Grade CPUs, DSPs, and FPGAs
CD calculations for each processor are based upon an operations mix of half
additions and half multiplications by default because this is a common and critical
operations mix for many intensive computations that are used in space applications.
However, further analysis is conducted for other important operations mixes. Figure 4-2
displays several examples of computations used in space applications and their

30
corresponding operations mixes of additions and multiplications [83–88], where
subtractions are considered logically equivalent to additions. Although overheads are
required during implementation, these operations mixes characterize the work
operations involved, and thus provide a foundation for the performance of each
computation and the applications in which they are used.
Figure 4-2. Operations mixes of intensive computations.
Figure 4-3 provides CD for top-performing space-grade CPUs, DSPs, and
FPGAs using all possible operations mixes consisting of additions and multiplications to
demonstrate how the performance varies between different computations. Data from
Figure 4-3 are provided within Table A-2. Further experimentation would be conducted
for additional operations mixes that relate to other computations consisting of operations
such as divisions, shifts, square roots, and trigonometric functions, but is not possible
because information about the performance of these operations is often not included in
vendor-provided documentation or they are accomplished using software emulation.

31
A B
C
D E
F G
Figure 4-3. Performance variations in space-grade CPUs, DSPs, and FPGAs.
A) GR740. B) RAD5545. C) Maestro. D) RC64. E) RADSPEED. F) Virtex-5QV. G) RTG4.

32
The GR740 contains an integer unit for each processor core that can compute
one Int8, Int16, or Int32 addition or multiplication per cycle. The GR740 also contains a
floating-point unit for each processor core that can compute one SPFP or DPFP
addition or multiplication per cycle. Therefore, both integer and floating-point CD remain
constant for all operations mixes because additions and multiplications are computed in
the same number of cycles.
The RAD5545 contains several integer units for each processor core, including
two units that can each compute one Int8, Int16, or Int32 addition per cycle and one unit
that can compute one Int8, Int16, or Int32 multiplication per cycle. Operations can be
issued to two of these units in the same cycle, resulting in the ability to compute both an
addition and a multiplication per cycle, two additions per cycle, or one multiplication per
cycle. Therefore, integer CD remains constant for operations mixes with a majority of
additions, but it decreases up to 50% as the percentage of multiplications surpasses the
percentage of additions due to more multiplications that cannot be computed
simultaneously with additions. The RAD5545 also contains a floating-point unit for each
processor that can compute one SPFP or DPFP addition or multiplication per cycle.
Therefore, floating-point CD remains constant for all operations mixes because
additions and multiplications are computed in the same number of cycles.
The Maestro contains several integer units for each processor core, including two
units that can each compute four Int8 additions, two Int16 additions, or one Int32
addition per cycle, and one unit that can compute one Int8, Int16, or Int32 multiplication
in two cycles. Therefore, integer CD decreases up to 94% as the percentage of
multiplications increases because multiplications take more cycles to compute than

33
additions and have less computational units for each processor core. The Maestro also
contains a floating-point unit for each processor core that can compute one SPFP or
DPFP addition per cycle and one SPFP or DPFP multiplication in two cycles, with the
ability to interleave additions with multiplications. Therefore, floating-point CD remains
constant for operations mixes with a majority of additions but decreases up to 50% as
the percentage of multiplications surpasses the percentage of additions because
multiplications take more cycles to compute and this results in more multiplications that
cannot be interleaved with additions.
The RC64 contains several computational units for each processor core that can
compute eight Int8 or Int16 additions per cycle, four Int32 additions per cycle, four Int8
or Int16 multiplications per cycle, one Int32 multiplication per cycle, or one SPFP
addition or multiplication per cycle. DPFP operations are not supported. Therefore,
integer CD decreases up to 75% as the percentage of multiplications increases
because multiplications take more cycles to compute than additions. Floating-point CD
remains constant for all operations mixes because additions and multiplications are
computed in the same number of cycles.
The RADSPEED contains an integer unit for each processor core that can
compute one Int8 addition per cycle, one Int16 addition in two cycles, one Int32 addition
in four cycles, one Int8 or Int16 multiplication in four cycles, or one Int32 multiplication in
seven cycles. Therefore, integer CD decreases up to 75% as the percentage of
multiplications increases because multiplications take more cycles to compute than
additions. The RADSPEED also contains several floating-point units for each processor
core, including one unit that can compute one SPFP or DPFP addition per cycle and

34
one unit that can compute one SPFP or DPFP multiplication per cycle. Operations can
be issued to both of these units in the same cycle, resulting in the ability to compute
both an addition and a multiplication per cycle but not two additions or two
multiplications per cycle. However, the ability to compute two operations per cycle only
applies to SPFP operations because DPFP operations are limited by bus widths.
Therefore, single-precision floating-point CD peaks when the percentages of additions
and multiplications are equal and decreases up to 50% as the percentages of additions
and multiplications become more unbalanced. Double-precision floating-point CD
remains constant for all operations mixes because additions and multiplications are
computed in the same number of cycles.
The Virtex-5QV and RTG4 contain reconfigurable architectures that support
computational units that compute one Int8, Int16, Int32, SPFP, or DPFP addition or
multiplication per cycle. As data types and precisions increase, slower operating
frequencies can typically be achieved and more logic resources are required. For Int8,
Int16, and Int32 operations, multiplications typically achieve slower operating
frequencies than additions and require more logic resources. Therefore, integer CD
decreases up to ∼92% for the Virtex-5QV and up to ∼99% for the RTG4 as the
percentage of multiplications increases. For SPFP and DPFP operations, multiplications
typically achieve slower operating frequencies than additions and require less logic
resources when multiply-accumulate units are used, but they require more logic
resources when these units are not used. Therefore, floating-point CD either increases
or decreases as the percentage of multiplications increases, depending on the use of
multiply-accumulate units. However, floating-point CD does not vary as much as the

35
integer CD because the differences between logic resources used for additions and
multiplications are not as significant.
By matching the operations mixes from Figure 4-2 with the results from Figure 4-
3, the variations in performance between different computations are analyzed for each
top-performing space-grade processor. For all operations on the GR740, the floating-
point operations on the RAD5545 and RC64, and the double-precision floating-point
operations on the RADSPEED, CD does not vary between computations. For integer
operations on the RAD5545 and floating-point operations on the Maestro, CD is highest
for computations that use at least half-additions (such as matrix addition, fast Fourier
transform, matrix multiplication, and matrix convolution), becomes worse for
computations that use more than half-multiplications (such as Jacobi transformation),
and is lowest for computations that use all multiplications (such as the Kronecker
product). For integer operations on the Maestro, RC64, RADSPEED, Virtex-5QV, and
RTG4, CD is highest for computations that use all additions such as matrix addition and
becomes worse for all other computations where more multiplications are used. For
single-precision floating-point operations on the RADSPEED, CD is highest for
computations that use half-additions and half-multiplications (such as matrix
multiplication and matrix convolution), becomes worse for all other computations as
either more additions or more multiplications are used, and is lowest for computations
that use either all additions or all multiplications (such as matrix addition or the
Kronecker product). For floating-point operations on the Virtex-5QV and RTG4, CD
varies moderately between computations. Variations in CD demonstrate how the

36
performance of space-grade processors is affected by the operations mixes of the
intensive computations used in space applications.
Overheads Incurred from Radiation Hardening of CPUs, DSPs, and FPGAs
Figure 4-4 provides CD, CD/W, IMB, EMB, and IOB for the closest COTS
counterparts to the space-grade CPUs, DSPs, and FPGAs from Figure 4-1 in
logarithmic scale, where the HXRHPPC was based upon the Freescale PowerPC603e
[89], the RAD750 was based upon the IBM PowerPC750 [90–92], the RAD5545 was
based upon the QorIQ P5040 [37–39], the Maestro was based upon the Tilera TILE64
[93,94], the RADSPEED was based upon the ClearSpeed CSX700 [95,96], and the
Virtex-5QV was based upon the Virtex-5 FX130T [40–43]. The GR712RC, GR740,
RC64, and RTG4 are not included because they were not based upon any specific
COTS processors. Data from Figure 4-4 are provided within Table A-3.
By comparing the results from Figures 4-1 and 4-4, the overheads incurred from
radiation hardening of COTS processors are calculated. Figure 4-5 provides the
percentages of operating frequencies, the number of processor cores for CPUs and
DSPs or computational units for FPGAs, power dissipation, CD, CD/W, IMB, EMB, and
IOB achieved by each space-grade processor as compared to its closest COTS
counterpart. Data from Figure 4-5 are provided within Tables A-4 and A-5.
The largest decreases in operating frequencies are for the multicore and many-
core CPUs because their closest COTS counterparts benefited from high operating
frequencies that were significantly decreased to be sustainable on space-grade
processors, whereas the closest COTS counterparts to the RADSPEED and Virtex-5QV
only required moderate operating frequencies to begin with, and therefore did not need
to be decreased as significantly.

37
A B
C Figure 4-4. Metrics data for closest COTS counterparts to space-grade CPUs, DSPs,
and FPGAs. A) CD. B) CD/W. C) IMB, EMB, and IOB.
The largest decreases in the number of processor cores or computational units
are for the Maestro, RADSPEED, and Virtex-5QV because their closest COTS
counterparts contained large levels of parallelism that could not be sustained after
radiation hardening, whereas the closest COTS counterparts of the multicore CPUs did
not contain enough parallelism to require any decreases to the number of processor
cores during radiation hardening. The Maestro achieves a larger floating-point CD and
CD/W than its closest COTS counterpart due to the addition of floating-point units to
each processor core, resulting in the only occurrence of increases in metrics after
radiation hardening.

38
A B
C D
E F Figure 4-5. Percentages achieved by space-grade CPUs, DSPs, and FPGAs after
radiation hardening. A) Operating frequency. B) Processor cores or computational units. C) Power dissipation. D) CD. E) CD/W. F) IMB, EMB, and IOB.
Increases and decreases in power dissipation are more unpredictable because
they are dependent on many factors, including decreases in operating frequencies and

39
the number of processor cores or computational units and changes to input/output
peripherals
By comparing space-grade processors to their closest COTS counterparts using
metrics, the overheads incurred from radiation hardening are analyzed. The largest
decreases in CD and IMB occurred for the multicore and many-core CPUs rather than
the DSP and FPGA, demonstrating that large decreases in operating frequencies had a
more significant impact on the resulting CD and IMB than decreases in the number of
processor cores or computational units. The smallest decreases in CD/W occurred for
the Virtex-5QV due to relatively small decreases in CD and only minor variations in
power dissipation. The largest decreases in EMB and IOB occurred for the older single-
core CPUs because their input/output resources are highly dependent on operating
frequencies that were significantly decreased. These overheads can be considered
when analyzing processors for potential radiation hardening and use in space missions.
Projected Future Space-Grade CPUs, DSPs, FPGAs, and GPUs
Figure 4-6 provides CD, CD/W, IMB, EMB, and IOB for a variety of low-power
COTS processors in logarithmic scale, including the Intel Quark X1000 [97,98], which is
a single-core CPU; the Intel Atom Z3770 [99,100], Intel Core i7-4610Y [101–104], and
Samsung Exynos 5433 [105–107], which are multicore CPUs; the Tilera TILE-Gx8036
[108–110], which is a many-core CPU; the Freescale MSC8256 [111–113], which is a
multicore DSP; the Texas Instruments KeyStone-II 66AK2H12 [114–116], which is a
multicore DSP paired with a multicore CPU; the Xilinx Spartan-6Q LX150T
[42,43,117,118], Xilinx Artix-7Q 350T [42,43,119,120], and Xilinx Kintex-7Q K410T
[42,43,119,120], which are FPGAs; and the NVIDIA Tegra 3 [121,122], NVIDIA Tegra
K1 [115,116,123], and Tegra X1 [106,107,124], which are GPUs paired with multicore

40
CPUs. Several modern processors are considered from each category with power
dissipation no larger than 30 W. Data from Figure 4-6 are provided within Table A-6.
A
B
C Figure 4-6. Metrics data for low-power COTS CPUs, DSPs, FPGAs, and GPUs.
A) CD. B) CD/W. C) IMB, EMB, and IOB.
By comparing many low-power COTS processors, the top-performing
architectures are selected and considered for potential radiation hardening and use in
future space missions. Although the Core i7-4610Y is the top-performing CPU in most

41
cases, the Exynos 5433 achieves the largest CD/W of the CPUs due to its low power
dissipation. The top-performing DSP, FPGA, and GPU are the KeyStone-II, Kintex-7Q,
and Tegra X1, respectively. However, if the architectures from these COTS processors
were to be used in potential future space-grade processors, several overheads would
likely be incurred during the radiation-hardening process that must be considered.
Therefore, the results for top-performing COTS processors from Figure 4-6 are
decreased based upon the worst-case and best-case radiation-hardening overheads
from Figure 4-5 to project metrics for potential future space-grade processors. Figure 4-
7 provides worst-case and best-case projections in logarithmic scale for potential future
space-grade processors based upon the Core i7-4610Y, Exynos 5433, KeyStone-II,
Kintex-7Q, and Tegra X1 alongside the top-performing space-grade processors from
Figure 4-1 to determine how additional radiation hardening of top-performing COTS
processors could impact the theoretical capabilities of space-grade processors. Data
from Figure 4-7 are provided within Tables A-7 and A-8.
By comparing top-performing and projected future space-grade processors using
metrics, the potential benefits of radiation hardening additional COTS architectures are
analyzed. Although the results from Figure 4-5 suggest that the radiation hardening of
CPUs typically results in large overheads, the Core i7-4610Y and Exynos 5433 achieve
the largest CD and CD/W for each data type considered, as well as the largest IMB, out
of all space-grade CPUs even when using worst-case projections. However, the results
from Figure 4-5 also suggest that the radiation hardening of DSPs and FPGAs typically
results in smaller overheads. When using best-case projections, the KeyStone-II and
Kintex-7Q achieve the largest CD and CD/W for each data type considered, as well as

42
the largest EMB, as well as the largest IMB and IOB in most cases, out of all space-
grade processors. Finally, although there are no past results for the radiation hardening
of GPUs, the Tegra X1 achieves a large CD and CD/Wand a moderate IMB, EMB, and
IOB within the range of projections used.
A
B
C Figure 4-7. Metrics data for current and projected future space-grade CPUs, DSPs,
FPGAs, and GPUs. A) CD. B) CD/W. C) IMB, EMB, and IOB.

43
Based upon the projections and comparisons from Figure 4-7, COTS processors
from each category have a high potential to increase the theoretical capabilities of
space-grade processors, even with the overheads incurred from radiation hardening.
Therefore, as expected, radiation hardening of modern COTS processors could benefit
onboard computing in terms of performance, power efficiency, memory bandwidth, and
input/output bandwidth; and these results help to quantify potential outcomes.

44
CHAPTER 5 BENCHMARKING EXPERIMENTS, RESULTS, AND ANALYSIS
To analyze and compare the top-performing processors, benchmarking is
conducted to determine their realizable capabilities through hardware and software
experimentation. First, a taxonomy is presented that characterizes and classifies the
space-computing domain and is used to identify computations for benchmarking
analysis. Next, the performance of space-grade processors is analyzed to determine
how to optimize and parallelize computations for their architectures for both a sensor
processing benchmark and an autonomous processing benchmark. Then, space-grade
processors are directly compared to one another to provide insights into which
architectures perform best in terms of performance and power efficiency. Finally, an
expanded analysis is presented using a variety of additional benchmarks.
Space-Computing Taxonomy and Benchmarks
A comprehensive study of common and critical applications is presented based
upon space mission needs and is used to establish computational dwarfs and formulate
a corresponding taxonomy for the space-computing domain. Because thorough
consideration of every possible application is impractical, the space-computing
taxonomy provides a broad and expansive representation of the computing
requirements required for space missions. Table 5-1 presents the space-computing
taxonomy, which is composed of high-level dwarfs and their corresponding applications,
and is followed by discussion.
45
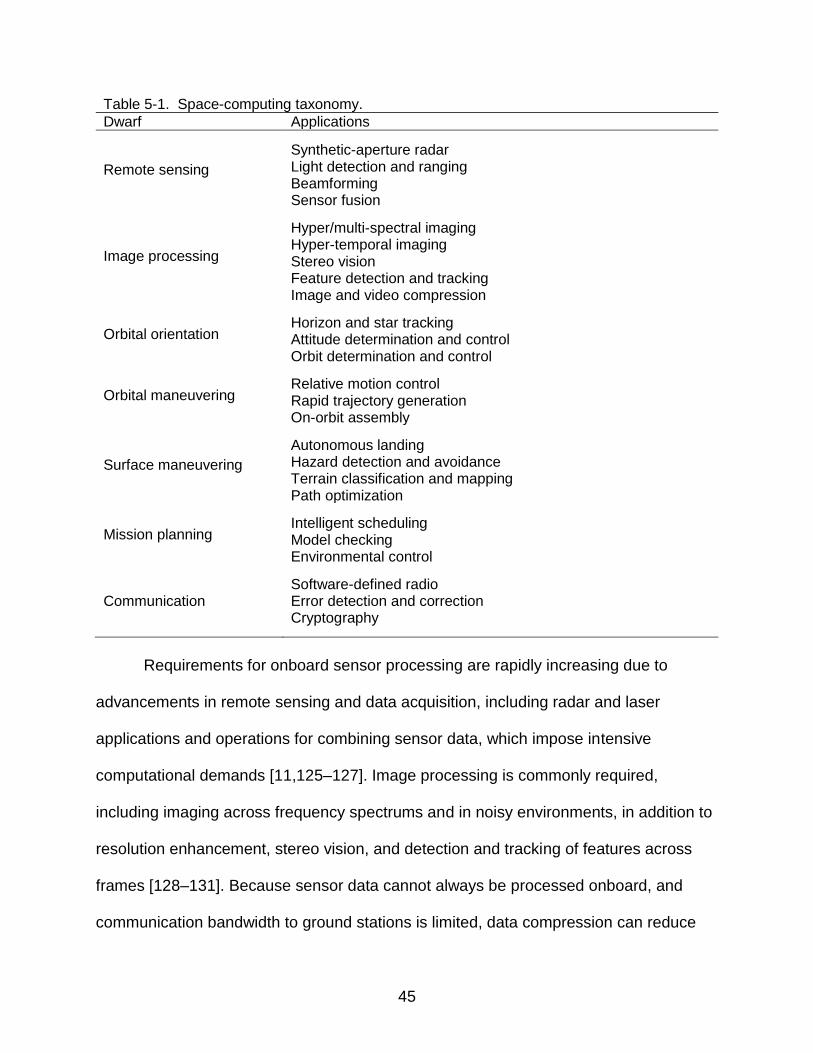
Table 5-1. Space-computing taxonomy.
Dwarf Applications
Remote sensing
Synthetic-aperture radar Light detection and ranging Beamforming Sensor fusion
Image processing
Hyper/multi-spectral imaging Hyper-temporal imaging Stereo vision Feature detection and tracking Image and video compression
Orbital orientation
Horizon and star tracking Attitude determination and control Orbit determination and control
Orbital maneuvering
Relative motion control Rapid trajectory generation On-orbit assembly
Surface maneuvering
Autonomous landing Hazard detection and avoidance Terrain classification and mapping Path optimization
Mission planning
Intelligent scheduling Model checking Environmental control
Communication
Software-defined radio Error detection and correction Cryptography
Requirements for onboard sensor processing are rapidly increasing due to
advancements in remote sensing and data acquisition, including radar and laser
applications and operations for combining sensor data, which impose intensive
computational demands [11,125–127]. Image processing is commonly required,
including imaging across frequency spectrums and in noisy environments, in addition to
resolution enhancement, stereo vision, and detection and tracking of features across
frames [128–131]. Because sensor data cannot always be processed onboard, and
communication bandwidth to ground stations is limited, data compression can reduce

46
communication requirements to ensure that critical sensor data are retrieved and
analyzed [132–134].
Guidance, navigation, and control applications are critical to space missions, and
require intensive computing for real-time autonomous operations, including horizon and
star tracking, and determination and control algorithms for spacecraft attitude and orbit
[135–137]. Autonomous maneuvering is required in orbital missions for proximity
operations, including relative motion control for formation flying, rendezvous and
docking, and on-orbit assembly [138–142]. Surface missions require autonomous
maneuvering to study foreign environments and to safely and precisely land on and
navigate unfamiliar terrain [143–147]. Autonomous mission planning consists of
profiling, intelligent scheduling, and abstract modeling of onboard science experiments,
environmental control systems, and spacecraft maneuvering operations [127,148–151].
Communication capabilities to ground stations or other remote systems are also
critical for space missions, increasingly based upon software-defined radio due to
higher flexibility and ease of adaptation [152]. Due to the unreliability of remote
communication systems and the hazards posed by the harsh space environment, fault
tolerance is critical for space missions, and data reliability can be strengthened by
periodically scrubbing memories and applying error detection and correction codes to
data transmissions [153,154]. Cryptographic techniques are often required to protect
sensitive and valuable data during transmission [155]. While mission security can
require specific, classified cryptographic algorithms, computationally similar unclassified
algorithms are also of significance for less sensitive or shorter duration missions
[156,157].

47
To determine which computations to prioritize for benchmark development,
optimization, and testing, the taxonomy is decomposed to identify its most
computationally intensive parts, where most can be characterized by several of the
more abstracted UBC dwarfs such as dense and sparse linear algebra, spectral
methods, and combinational logic. Table 5-2 presents the set of space-computing
benchmarks, which largely represents the computations required by the dwarfs and
applications of the taxonomy.
Table 5-2. Space-computing benchmarks.
Benchmark
Matrix multiplication Matrix addition Matrix convolution Matrix transpose Kronecker product Fast Fourier transform Haar wavelet transform Discrete wavelet transform Kepler’s equation Lambert’s problem Clohessy-Wiltshire equations Artificial potential functions Reed-Solomon codes Advanced Encryption Standard
From this set of computations, space-computing benchmarks are developed,
optimized, and tested on space-grade processors using the methods described in
Chapter 3. First, space-grade CPUs and FPGAs are analyzed and compared using a
matrix multiplication benchmark with size 1024 × 1024 matrices, which largely
represents sensor processing, and a Kepler’s equation benchmark with size 1024
vectors, which largely represents autonomous processing. Then, an expanded analysis
is conducted on space-grade CPUs using a variety of additional benchmarks to
determine how their architectures perform across a broad range of computations used
within the space-computing taxonomy. The expanded analysis uses a matrix addition

48
benchmark with size 2048 × 2048 matrices, a matrix convolution benchmark with size
2048 × 2048 matrices and a size 3 × 3 Sobel filter, a matrix transpose benchmark with
size 2048 × 2048 matrices, and a Clohessy-Wiltshire equations benchmark with size
2048 vectors. By generating benchmarking data on space-grade processors, their
realizable capabilities are analyzed for computations that are used either within specific
applications or broadly across the space-computing domain.
Performance Analysis of Space-Grade CPUs
Figures 5-1 and 5-2 provide parallelization data for the matrix multiplication and
Kepler’s equation benchmarks on space-grade CPUs, including the Cobham GR740,
BAE Systems RAD5545, Boeing HPSC, and Boeing Maestro. For each architecture,
speedup is achieved as computations are distributed across processor cores.
Performance is analyzed using increasing numbers of threads to quantify and compare
the parallel efficiency of each architecture. Data from Figures 5-1 and 5-2 are provided
within Table B-1.
For matrix multiplication, speedup is achieved on the GR740, RAD5545, and
HPSC, with minor increases once the number of threads exceeds the number of
processor cores. The GR740 achieves minor speedup, the RAD5545 achieves near-
linear speedup in most cases, and the Maestro achieves significant speedup. The
HPSC achieves moderate speedup for most data types but only minor speedup for the
Int32 data type that requires large data precisions for its results to prevent overflow.

49
A B
C D Figure 5-1. Parallelization data for matrix multiplication on space-grade CPUs.
A) GR740. B) RAD5545. C) HPSC. D) Maestro.
For Kepler’s equation, parallel speedup is achieved on the GR740, RAD5545,
and HPSC, but decreases once the number of threads exceeds the number of
processor cores. The GR740 achieves minor to moderate speedup, the RAD5545
achieves near-linear speedup in most cases, and the HPSC achieves near-linear
speedup in all cases other than the less computationally intensive Int8 and Int16 data
types. The Maestro achieves the lowest speedup, where integer performance
decreases once more than only few threads are used, and floating-point performance
decreases once the number of threads approaches half the number of processor cores.

50
A B
C D Figure 5-2. Parallelization data for Kepler’s equation on space-grade CPUs.
A) GR740. B) RAD5545. C) HPSC. D) Maestro.
By analyzing the parallel speedup achieved by space-grade CPUs, the efficiency
of their multicore and many-core architectures is quantified and compared. In particular,
the GR740 achieves minor to moderate levels of parallel efficiency with more speedup
for Kepler’s equation than for matrix multiplication. The RAD5545 achieves the highest
levels of parallel efficiency with near-linear speedup in most cases, demonstrating that
the performance of its architecture does not suffer significantly from communication
overheads between processor cores. The HPSC achieves moderate speedup for matrix
multiplication, but benefits from the SIMD units within each processor core, and
achieves near-linear speedup for Kepler’s equation with the more computationally

51
intensive data types. The Maestro achieves the lowest levels of parallel efficiency
considering its large number of processor cores, demonstrating that some computations
cannot be efficiently parallelized even using a hybrid strategy. Results demonstrate the
realizable capabilities and limitations of space-grade CPUs and that future architectures
must be designed to minimize communication overheads between processor cores to
achieve progressively higher levels of performance.
Performance Analysis of Space-Grade FPGAs
Figures 5-3 and 5-4 provide resource usage for the matrix multiplication and
Kepler’s equation benchmarks on space-grade FPGAs, including the Xilinx Virtex-5QV
and Microsemi RTG4. For each architecture, speedup is achieved wherever possible as
computations are distributed across the architecture by instantiating and operating
multiple benchmarks simultaneously. Resource efficiency is analyzed in terms of MACs,
LUTs, FFs, and BRAMs, to quantify and compare the resource efficiency of each
architecture. Data from Figures 5-3 and 5-4 are provided within Table B-2.
A B Figure 5-3. Resource usage data for matrix multiplication on space-grade FPGAs.
A) Virtex-5QV. B) RTG4.

52
A B Figure 5-4. Resource usage data for Kepler’s equation on space-grade FPGAs.
A) Virtex-5QV. B) RTG4.
For matrix multiplication, the resources required by the designs are significant
enough that only one benchmark can be instantiated and operated. In most cases, the
limiting factors that prevent parallel speedup from being achieved on these architectures
are the availability of additional MACs for the Virtex-5QV and of additional BRAMs for
the RTG4. Thus, matrix multiplication is typically bound computationally on Virtex-5QV
and typically bound by memory on RTG4.
For Kepler’s equation, the resources required by the designs are not nearly as
significant, which allows for many benchmarks to be instantiated and operated
simultaneously, where the number of benchmarks that can operate in parallel is highest
for Int8 data types and typically decreases as the level of data precision increases. In
most cases, the limiting factors that prevent additional parallel speedup from being
achieved on these architectures are the availability of additional LUTs and FFs because
the trigonometric functions used within Kepler’s equation cannot be efficiently
synthesized and implemented using MACs. Thus, Kepler’s equation is typically bound
computationally on the Virtex-5QV and RTG4.

53
By analyzing the resource usage of space-grade FPGAs, the efficiency of their
reconfigurable architectures is quantified and compared. In particular, the Virtex-5QV
and RTG4 achieve much higher levels of parallel efficiency for Kepler’s equation than
for matrix multiplication, due to significantly less resource usage that allows multiple
benchmarks to be instantiated and operated simultaneously. In most cases, the Virtex-
5QV is bound computationally, while the RTG4 is bound computationally for Kepler’s
equation and bound by memory for matrix multiplication. In some cases, floating-point
results are bound by the inability to route additional designs across the reconfigurable
architectures. Results demonstrate the realizable capabilities and limitations of space-
grade FPGAs and that future architectures must be designed to minimize resource
usage for arithmetic operations and trigonometric functions to achieve progressively
higher levels of performance.
Benchmarking Comparisons of Space-Grade CPUs and FPGAs
Figures 5-5 and 5-6 provide performance and power efficiency for the matrix
multiplication and Kepler’s equation benchmarks on space-grade CPUs and FPGAs in
logarithmic scale, including the GR740, RAD5545, HPSC, Maestro, Virtex-5QV and
RTG4. The realizable capabilities of their architectures are analyzed and directly
compared to one another. Data from Figures 5-5 and 5-6 are provided within Tables B-3
and B-4.
For matrix multiplication, the floating-point performance of the RAD5545 and
HPSC benefit significantly from the use of optimized libraries. Although integer
performance is also of importance for sensor processing, there is no equivalent library
available for integer data types. The HPSC also benefits significantly from the use of
SIMD units. The Virtex-5QV and RTG4 typically achieve higher performance for integer

54
data types than for floating-point data types due to more efficient libraries that require
fewer cycles to compute each result and support higher operating frequencies.
A B Figure 5-5. Benchmarking data for matrix multiplication on space-grade CPUs and
FPGAs. A) Performance. B) Power efficiency.
A B Figure 5-6. Benchmarking data for Kepler’s equation on space-grade CPUs and
FPGAs. A) Performance. B) Power efficiency.
For Kepler’s equation, floating-point data types are typically required, but integer
data types can also be advantageous if potential increases in performance are worth
the loss in data precision. Although integer performance on space-grade CPUs is not
significantly higher than floating-point performance, the space-grade FPGAs achieve
much higher integer performance than floating-point performance due to the lower

55
resource usage of the designs, which results in higher achievable operating frequencies
and the ability to instantiate and operate many more benchmarks in parallel. Therefore,
a trade-off between performance and data precision is likely not worthwhile on the
space-grade CPUs, but could be worthwhile on the space-grade FPGAs.
By analyzing the performance and power efficiency of space-grade CPUs and
FPGAs and directly comparing them to one another, the realizable capabilities of their
architectures are quantified and examined. Of the space-grade CPUs, the GR740
achieves high levels of power efficiency due to its low power dissipation, the RAD5545
and HPSC achieve high levels of floating-point performance due to the use of optimized
libraries, and the Maestro achieves high levels of integer performance in some cases
due to its multiple integer execution pipelines. However, the HPSC achieves the highest
performance in most cases largely due to its SIMD units. The space-grade FPGAs
achieve much higher performance and power efficiency than any of the space-grade
CPUs due to their ability to reconfigure their architectures specifically for each
benchmark, their ability to support high levels of parallelism in many cases, and their
low power dissipation. In particular, the Virtex-5QV typically achieves the highest
performance largely due to its relatively high operating frequencies and the RTG4
typically achieves the highest power efficiency due to its very low power dissipation.
Results demonstrate that the most desirable architectures for future space-grade
processors are multicore CPUs, FPGAs, and hybrid combinations of both, particularly
those that include SIMD units and better support for trigonometric functions.
Expanded Analysis of Space-Grade CPUs
Figure 5-7 provides performance for the matrix addition, matrix convolution,
matrix transpose, and Clohessy-Wiltshire equations benchmarks on space-grade CPUs

56
in logarithmic scale, including the GR740, RAD5545, HPSC, and Maestro. The
architectures of these processors are analyzed and compared to provide additional
insights into their realizable capabilities for onboard computing using a variety of
benchmarks. Data from Figure 5-7 are provided within Table B-5.
A B
C D Figure 5-7. Performance data for additional benchmarks on space-grade CPUs.
A) Matrix addition. B) Matrix convolution. C) Matrix transpose. D) Clohessy-Wiltshire equations.
The HPSC achieves the highest performance in almost all cases, demonstrating
its advantages for arithmetic operations, trigonometric functions, and memory transfers.
The RAD5545 typically achieves the next highest performance, followed by the GR740,
and then by the Maestro. Results further demonstrate that multicore architectures are

57
more desirable than many-core architectures for future space-grade CPUs due to better
parallel efficiency between processor cores and that the SIMD units of the HPSC are
highly beneficial for a variety of computations. By expanding the performance analysis
of space-grade CPUs using a variety of benchmarks, the realizable capabilities of their
architectures are quantified and compared across a broad range of computations used
within the space-computing taxonomy.

58
CHAPTER 6 CONCLUSIONS
To address the continually increasing demands for onboard computing, research
is conducted into a broad range of processors using metrics and benchmarking to
provide critical insights for progressively more advanced architectures that can better
meet the computing needs of future space missions. Trade-offs between architectures
are determined that can be considered when deciding which space-grade processors
are best suited for specific space missions or which characteristics and features are
most desirable for future space-grade processors.
A metrics analysis is presented as a methodology to quantitatively and
objectively analyze a broad range of space-grade and low-power COTS processors in
terms of performance, power efficiency, memory bandwidth, and input/output
bandwidth. Results are generated to enable comparisons of space-grade processors to
one another, comparisons of space-grade processors to their closest COTS
counterparts to determine overheads incurred from radiation hardening, and
comparisons of top-performing space-grade and COTS processors to determine the
potential for future space-grade processors.
Metrics results demonstrate and quantify how space-grade processors with
multicore and many-core CPU, DSP, and FPGA architectures are continually increasing
the theoretical capabilities of space missions by supporting high levels of parallelism in
terms of computational units, internal memories, and input/output resources. In
particular, the best results are provided by the RC64, Virtex-5QV, and RTG4 for integer
CD and CD/W; the RADSPEED and Virtex-5QV for floating-point CD and CD/W; the
RC64 and Virtex-5QV for IMB; the RAD5545 and Virtex-5QV for EMB; and the

59
RAD5545, Virtex-5QV, and RTG4 for IOB. Additionally, CD results for each top-
performing space-grade processor are further analyzed to demonstrate and evaluate
how the performance can vary significantly between applications, depending on the
operations mixes used within the intensive computations, with the largest variations
occurring for integer operations on the Maestro, Virtex-5QV, and RTG4.
The overheads incurred from radiation hardening are quantified using metrics
and analyzed, where the overheads incurred by the space-grade CPUs are typically
much larger than those incurred by the DSP and FPGA because they required more
significant decreases in operating frequencies. Overheads from past cases of radiation
hardening are used to project metrics for potential future space-grade processors,
demonstrating and quantifying how the radiation hardening of modern COTS
processors from each category could result in significant increases in the theoretical
capabilities of future space missions. In particular, the Core i7-4610Y and Exynos 5433
could provide the largest CD, CD/W, and IMB out of all space-grade CPUs; the
KeyStone-II and Kintex-7Q could provide the largest CD, CD/W, and EMB out of all
space-grade processors, as well as the largest IMB and IOB in most cases; and the
Tegra X1 could provide the largest CD and CD/W out of all space-grade processors.
Once the top-performing processors are identified using metrics, a benchmarking
analysis is demonstrated as a methodology to measure and compare their realizable
capabilities. The space-computing domain is broadly characterized to establish
computational dwarfs, including remote sensing, image processing, orbital orientation,
orbital maneuvering, surface maneuvering, mission planning, and communication, and a
corresponding taxonomy is formulated and used to identify a set of computations for

60
benchmark development, optimization, and testing. Results are generated on space-
grade CPUs and FPGAs for matrix multiplication, a sensor processing benchmark, and
Kepler’s equation, an autonomous processing benchmark, and for a variety of additional
benchmarks on space-grade CPUs for an expanded analysis.
Of the CPUs analyzed using benchmarking, the GR740 achieves high levels of
power efficiency due to its low power dissipation, the RAD5545 achieves high levels of
parallel efficiency due to its low communication overheads, and the HPSC achieves
high levels of performance and power efficiency for a variety of computations due to its
SIMD units. Results demonstrate that multicore architectures are more desirable than
many-core architectures for future space-grade CPUs due to better parallel efficiency
between processor cores.
The space-grade FPGAs analyzed using benchmarking achieve much higher
performance and power efficiency than any of the space-grade CPUs due to their ability
to reconfigure their architectures specifically for each benchmark, their ability to support
high levels of parallelism in many cases, and their low power dissipation. In particular,
the Virtex-5QV typically achieves the highest performance largely due to its relatively
high operating frequencies and the RTG4 typically achieves the highest power
efficiency due to its very low power dissipation. Results demonstrate that lower resource
usage for arithmetic operations and trigonometric functions is desirable for future space-
grade FPGAs to increase the parallel efficiency of their reconfigurable architectures.
In conclusion, metrics results demonstrate that multicore and many-core CPU,
DSP, and FPGA architectures are continually increasing the capabilities of space
missions, and that radiation hardening of modern COTS processors from each category

61
could result in significant increases in future capabilities. Benchmarking results
demonstrate that FPGAs achieve the highest levels of realizable performance and
power efficiency, and that the most desirable architectures for future space-grade
processors are multicore CPUs, FPGAs, and hybrid combinations of both, particularly
those that include SIMD units and better support for trigonometric functions. Future
research directions involve expanding these experiments using additional processors,
metrics, benchmarks, and optimizations.

62
APPENDIX A METRICS DATA
Table A-1. Metrics data for space-grade CPUs, DSPs, and FPGAs.
Processor CD (GOPS) Power
(W) CD/W (GOPS/W) IMB
(GB/s) EMB (GB/s)
IOB (GB/s) Int8 Int16 Int32 SPFP DPFP Int8 Int16 Int32 SPFP DPFP
HXRHPPC 0.08 0.08 0.08 0.08 0.04 7.60 0.01 0.01 0.01 0.01 0.01 1.92 0.00 0.16 RAD750 0.27 0.27 0.27 0.13 0.13 5.00 0.05 0.05 0.05 0.03 0.03 3.19 1.06 1.59 GR712RC 0.08 0.08 0.08 0.03 0.03 1.50 0.05 0.05 0.05 0.02 0.02 4.80 0.40 1.21 GR740 1.00 1.00 1.00 1.00 1.00 1.50 0.67 0.67 0.67 0.67 0.67 32.80 1.06 1.90 RAD5545 3.73 3.73 3.73 1.86 1.86 20.00 0.19 0.19 0.19 0.09 0.09 55.58 12.80 32.48 Maestro 11.99 11.32 10.19 12.74 12.74 22.20 0.54 0.51 0.46 0.57 0.57 152.88 8.32 15.07 RC64 102.40 102.40 30.72 19.20 0.00 8.00 12.80 12.80 3.84 2.40 0.00 3840.00 4.80 24.80 RADSPEED 14.17 11.81 6.44 70.83 35.42 15.00 0.94 0.79 0.43 4.72 2.36 589.04 7.46 15.16 Virtex-5QV 503.72 214.57 59.67 51.93 14.96 9.97a 44.30 22.62 5.91 5.14 1.70 1931.04 16.00 109.16 RTG4 418.32 252.18 18.36 3.12 0.83 3.91b 55.60 41.71 5.68 1.96 0.74 707.40 5.33 68.70 a Averaged between data types (Int8: 11.37 W; Int16: 9.49 W; Int32: 10.09 W; SPFP: 10.10 W; DPFP: 8.78 W). b Averaged between data types (Int8: 7.52 W; Int16: 6.05 W; Int32: 3.23 W; SPFP: 1.60 W; DPFP: 1.14 W).
Table A-2. Performance variations in space-grade CPUs, DSPs, and FPGAs.
Processor CD (GOPS) for 100% additions CD (GOPS) for 50% each CD (GOPS) for 100% multiplications Int8 Int16 Int32 SPFP DPFP Int8 Int16 Int32 SPFP DPFP Int8 Int16 Int32 SPFP DPFP
GR740 1.00 1.00 1.00 1.00 1.00 1.00 1.00 1.00 1.00 1.00 1.00 1.00 1.00 1.00 1.00 RAD5545 3.73 3.73 3.73 1.86 1.86 3.73 3.73 3.73 1.86 1.86 1.86 1.86 1.86 1.86 1.86 Maestro 101.92 50.96 25.48 12.74 12.74 11.99 11.32 10.19 12.74 12.74 6.37 6.37 6.37 6.37 6.37 RC64 153.60 153.60 76.80 19.20 0.00 102.40 102.40 30.72 19.20 0.00 76.80 76.80 19.20 19.20 0.00 RADSPEED 35.42 17.71 8.85 35.42 35.42 14.17 11.81 6.44 70.83 35.42 8.85 8.85 5.06 35.42 35.42 Virtex-5QV 2722.86 988.42 413.12 47.65 18.72 503.72 214.57 59.67 51.93 14.96 293.83 117.01 33.15 52.47 10.66 RTG4 3766.97 2180.88 1169.23 2.64 1.32 418.32 252.18 18.36 3.12 0.83 238.66 126.09 9.42 3.12 0.42
Table A-3. Metrics data for closest COTS counterparts to space-grade CPUs, DSPs, and FPGAs.
Processor CD (GOPS) Power
(W) CD/W (GOPS/W) IMB
(GB/s) EMB (GB/s)
IOB (GB/s) Int8 Int16 Int32 SPFP DPFP Int8 Int16 Int32 SPFP DPFP
PowerPC603e 0.27 0.27 0.27 0.27 0.13 3.50 0.08 0.08 0.08 0.08 0.04 6.38 0.00 2.13 PowerPC750 0.80 0.80 0.80 0.40 0.40 4.70 0.17 0.17 0.17 0.09 0.09 9.60 3.20 4.00 P5040 17.60 17.60 17.60 8.80 8.80 49.00 0.36 0.36 0.36 0.18 0.18 262.40 25.60 44.22 TILE64 42.16 39.82 35.84 0.00 0.00 23.00 1.83 1.73 1.56 0.00 0.00 537.60 12.80 19.55 CSX700 19.20 16.00 8.73 96.00 48.00 10.00 1.92 1.60 0.87 9.60 4.80 792.00 8.00 20.72 Virtex-5 833.20 416.00 89.97 80.52 17.43 13.61a 52.50 24.72 6.39 6.06 2.18 2413.80 21.33 121.58 a Averaged between data types (Int8: 15.87 W; Int16: 16.83 W; Int32: 14.07 W; SPFP: 13.28 W; DPFP: 8.00 W).

63
Table A-4. Radiation-hardening outcomes for space-grade CPUs, DSPs, and FPGAs.
Processor Space-grade Closest COTS counterpart Percentages achieved by space-grade Operating frequency (MHz)
Cores/units Power (W)
Operating frequency (MHz)
Cores/units Power (W)
Operating frequency (%)
Cores/units (%)
Power (%)
HXRHPPC 80.00 1 7.60 266.00 1 3.50 30.08 100.00 217.14 RAD750 133.00 1 5.00 400.00 1 4.70 33.25 100.00 106.38 RAD5545 466.00 4 20.00 2200.00 4 49.00 21.18 100.00 40.82 Maestro 260.00 49 22.20 700.00 64 23.00 37.14 76.56 96.52 RADSPEED 233.00 76 15.00 250.00 96 10.00 93.20 79.17 150.00 Virtex-5QV 226.47a 695a 9.97a 304.99b 820b 13.61b 74.25 84.79 73.22 a Averaged between data types (Int8: 301.30 MHz, 1672 cores, 11.37 W; Int16: 205.80 MHz, 1043 cores, 9.49 W; Int32: 215.47 MHz, 276 cores, 10.09 W; SPFP: 222.57 MHz, 233 cores, 10.10 W; DPFP: 187.20 MHz, 79 cores, 8.78 W). b Averaged between data types (Int8: 353.35 MHz, 2358 cores, 15.87 W; Int16: 380.95 MHz, 1092 cores, 16.83 W; Int32: 301.93 MHz, 298 cores, 14.07 W; SPFP: 327.33 MHz, 246 cores, 13.28 W; DPFP: 161.39 MHz, 108 cores, 8.00 W).
Table A-5. Percentages achieved by space-grade CPUs, DSPs, and FPGAs after radiation hardening.
Processor CD (%) CD/W (%)
IMB (%) EMB (%) IOB (%) Int8 Int16 Int32 SPFP DPFP Int8 Int16 Int32 SPFP DPFP
HXRHPPC 30.08 30.08 30.08 30.08 30.08 13.85 13.85 13.85 13.85 13.16 30.08 a 7.52 RAD750 33.25 33.25 33.25 33.25 33.25 31.26 31.26 31.26 31.26 31.26 33.25 33.25 39.80 RAD5545 21.18 21.18 21.18 21.18 21.18 51.90 51.90 51.90 51.90 51.90 21.18 50.00 73.46 Maestro 28.44 28.44 28.44 a a 29.46 29.46 29.46 a a 28.44 65.00 77.08 RADSPEED 73.80 73.81 73.77 73.78 73.78 48.96 49.38 49.43 49.19 49.19 74.37 93.25 73.17 Virtex-5QV 60.46 51.58 66.32 64.49 85.83 84.39 91.50 92.55 84.85 78.17 80.00 75.00 89.78 a Not applicable because original value was zero.

64
Table A-6. Metrics data for low-power COTS CPUs, DSPs, FPGAs, and GPUs.
Processor CD (GOPS) Power
(W) CD/W (GOPS/W) IMB
(GB/s) EMB (GB/s)
IOB (GB/s) Int8 Int16 Int32 SPFP DPFP Int8 Int16 Int32 SPFP DPFP
Quark X1000 0.40 0.80 0.80 0.40 0.40 2.22 0.18 0.36 0.36 0.18 0.18 3.20 1.60 5.41 Atom Z3770 198.56 105.12 58.40 46.72 23.36 4.00 49.64 26.28 14.60 11.68 5.84 280.32 17.36 18.79 Core i7-4610Y 626.60 348.20 177.00 124.80 62.40 11.50 54.49 30.28 15.39 10.85 5.43 835.20 25.60 64.10 Exynos 5433 461.60 251.90 147.20 121.60 52.40 4.00 115.40 62.98 36.80 30.40 13.10 696.00 13.20 15.02 TILE-Gx8036 388.80 216.00 129.60 43.20 43.20 30.00 12.96 7.20 4.32 1.44 1.44 1728.00 12.80 33.86 MSC8256 24.00 24.00 12.00 12.00 6.00 6.04 3.97 3.97 1.99 1.99 0.99 288.00 12.80 17.94 KeyStone-II 1459.20 729.60 364.80 198.40 99.20 21.69 67.28 33.64 16.82 9.15 4.57 1270.40 28.80 48.22 Spartan-6Q 590.40 185.10 37.96 21.22 7.86 7.04a 60.58 22.46 5.95 3.89 1.47 675.36 24.00 57.80 Artix-7Q 1245.00 939.10 163.30 134.20 45.52 14.70b 75.49 52.65 13.73 8.93 3.72 3598.61 16.00 75.60 Kintex-7Q 2295.00 1696.00 380.60 224.30 91.95 27.41c 74.28 51.36 18.03 8.72 3.50 6555.27 42.67 184.29 Tegra 3 265.98 137.98 73.98 73.98 25.60 2.00 132.99 68.99 36.99 36.99 12.80 265.60 10.68 16.33 Tegra K1 697.60 440.00 311.20 256.00 44.40 5.00 139.50 88.00 62.20 51.20 19.52 625.60 6.40 33.58 Tegra X1 1152.00 704.00 480.00 384.00 72.00 5.00 230.40 140.80 96.00 76.80 14.40 544.00 25.60 32.16 a Averaged between data types (Int8: 9.75 W; Int16: 8.24 W; Int32: 6.38 W; SPFP: 5.46 W; DPFP: 5.36 W). b Averaged between data types (Int8: 16.49 W; Int16: 17.84 W; Int32: 11.89 W; SPFP: 15.03 W; DPFP: 12.23 W). c Averaged between data types (Int8: 30.90 W; Int16: 33.02 W; Int32: 21.11 W; SPFP: 25.74 W; DPFP: 26.27 W).
Table A-7. Metrics data for projected future space-grade CPUs, DSPs, FPGAs, and GPUs (worst case).
Processor CD (GOPS) CD/W (GOPS/W) IMB
(GB/s) EMB (GB/s)
IOB (GB/s) Int8 Int16 Int32 SPFP DPFP Int8 Int16 Int32 SPFP DPFP
Core i7-4610Y 132.73 73.76 37.49 26.43 13.22 7.55 4.19 2.13 1.50 0.71 176.91 8.51 4.82 Exynos 5433 97.78 53.36 31.18 25.76 11.10 15.98 8.72 5.10 4.21 1.72 147.43 4.39 1.13 KeyStone-II 309.09 154.54 77.27 42.02 21.01 9.32 4.66 2.33 1.27 0.60 269.09 9.58 3.63 Kintex-7Q 486.12 359.24 80.62 47.51 19.48 10.29 7.11 2.50 1.21 0.46 1388.52 14.19 13.86 Tegra X1 244.01 149.12 101.67 81.34 15.25 31.91 19.50 13.30 10.64 1.89 115.23 8.51 2.42
Table A-8. Metrics data for projected future space-grade CPUs, DSPs, FPGAs, and GPUs (best case).
Processor CD (GOPS) CD/W (GOPS/W) IMB
(GB/s) EMB (GB/s)
IOB (GB/s) Int8 Int16 Int32 SPFP DPFP Int8 Int16 Int32 SPFP DPFP
Core i7-4610Y 462.44 257.02 130.57 92.08 53.56 45.98 27.71 14.24 9.21 4.24 668.16 23.87 57.55 Exynos 5433 340.67 185.93 108.59 89.72 44.97 97.38 57.63 34.06 25.79 10.24 556.80 12.31 13.49 KeyStone-II 1076.92 538.54 269.11 146.39 85.14 56.78 30.78 15.57 7.76 3.57 1016.32 26.86 43.29 Kintex-7Q 1693.76 1251.86 280.76 165.50 78.92 62.68 47.00 16.69 7.39 2.74 5244.21 39.79 165.46 Tegra X1 850.20 519.64 354.09 283.33 61.80 194.43 128.84 88.85 65.17 11.26 435.20 23.87 28.87

65
APPENDIX B BENCHMARKING DATA
Table B-1. Parallelization data for space-grade CPUs.
Processor Threads Matrix multiplication speedup (×) Kepler’s equation speedup (×) Int8 Int16 Int32 SPFP DPFP Int8 Int16 Int32 SPFP DPFP
GR740 1 1.00 1.00 1.00 1.00 1.00 1.00 1.00 1.00 1.00 1.00 GR740 2 1.42 1.38 1.39 1.51 1.50 1.55 1.73 1.71 1.87 1.90 GR740 4 1.58 1.51 1.53 1.67 1.67 2.45 2.81 2.65 3.38 3.26 RAD5545 1 1.00 1.00 1.00 1.00 1.00 1.00 1.00 1.00 1.00 1.00 RAD5545 2 1.81 1.06 1.99 1.98 1.99 1.93 1.94 1.96 1.79 1.99 RAD5545 4 3.62 2.22 3.98 3.98 3.95 3.71 3.60 3.70 2.95 3.87 RAD5545 8 3.99 2.03 3.89 3.91 3.90 3.32 3.46 3.73 2.84 3.51 RAD5545 16 3.45 2.03 3.90 3.89 3.90 2.83 3.31 3.56 2.68 3.25 HPSC 1 1.00 1.00 1.00 1.00 1.00 1.00 1.00 1.00 1.00 1.00 HPSC 2 1.35 1.30 0.20 1.43 1.43 1.62 1.60 1.95 1.93 1.92 HPSC 4 2.63 2.58 0.28 2.86 2.75 2.23 2.53 3.67 3.81 3.81 HPSC 8 5.20 5.01 0.32 5.52 5.47 2.80 2.33 7.13 7.43 7.34 HPSC 16 5.15 5.06 0.32 5.59 5.57 2.01 1.71 2.85 4.90 4.89 HPSC 32 5.22 5.07 1.73 5.61 5.62 1.73 1.54 2.40 4.48 4.41 Maestro 1 1.00 1.00 1.00 1.00 1.00 1.00 1.00 1.00 1.00 1.00 Maestro 2 1.84 1.91 1.93 1.88 1.79 1.49 1.14 1.65 1.51 1.22 Maestro 4 1.81 2.19 2.75 2.81 3.05 1.74 0.96 1.54 1.48 1.21 Maestro 8 3.07 3.53 3.76 4.18 4.57 1.53 0.67 1.61 1.63 1.19 Maestro 16 4.82 5.06 5.10 5.10 7.89 1.01 0.47 1.77 1.96 1.39 Maestro 32 7.80 8.12 8.01 8.07 9.92 0.07 0.04 0.47 1.06 0.69 Maestro 45 10.63 11.00 10.82 10.84 12.20 <0.01 0.00 0.01 0.02 <0.01
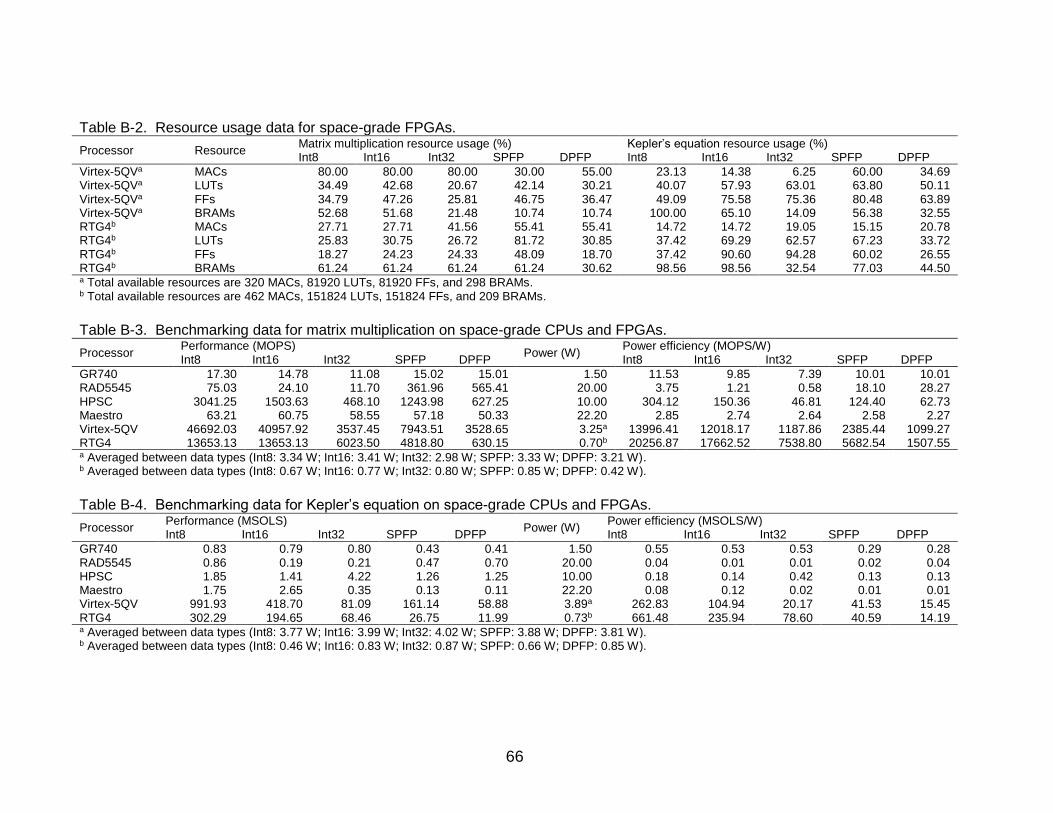
66
Table B-2. Resource usage data for space-grade FPGAs.
Processor Resource Matrix multiplication resource usage (%) Kepler’s equation resource usage (%) Int8 Int16 Int32 SPFP DPFP Int8 Int16 Int32 SPFP DPFP
Virtex-5QVa MACs 80.00 80.00 80.00 30.00 55.00 23.13 14.38 6.25 60.00 34.69 Virtex-5QVa LUTs 34.49 42.68 20.67 42.14 30.21 40.07 57.93 63.01 63.80 50.11 Virtex-5QVa FFs 34.79 47.26 25.81 46.75 36.47 49.09 75.58 75.36 80.48 63.89 Virtex-5QVa BRAMs 52.68 51.68 21.48 10.74 10.74 100.00 65.10 14.09 56.38 32.55 RTG4b MACs 27.71 27.71 41.56 55.41 55.41 14.72 14.72 19.05 15.15 20.78 RTG4b LUTs 25.83 30.75 26.72 81.72 30.85 37.42 69.29 62.57 67.23 33.72 RTG4b FFs 18.27 24.23 24.33 48.09 18.70 37.42 90.60 94.28 60.02 26.55 RTG4b BRAMs 61.24 61.24 61.24 61.24 30.62 98.56 98.56 32.54 77.03 44.50 a Total available resources are 320 MACs, 81920 LUTs, 81920 FFs, and 298 BRAMs. b Total available resources are 462 MACs, 151824 LUTs, 151824 FFs, and 209 BRAMs.
Table B-3. Benchmarking data for matrix multiplication on space-grade CPUs and FPGAs.
Processor Performance (MOPS)
Power (W) Power efficiency (MOPS/W)
Int8 Int16 Int32 SPFP DPFP Int8 Int16 Int32 SPFP DPFP
GR740 17.30 14.78 11.08 15.02 15.01 1.50 11.53 9.85 7.39 10.01 10.01 RAD5545 75.03 24.10 11.70 361.96 565.41 20.00 3.75 1.21 0.58 18.10 28.27 HPSC 3041.25 1503.63 468.10 1243.98 627.25 10.00 304.12 150.36 46.81 124.40 62.73 Maestro 63.21 60.75 58.55 57.18 50.33 22.20 2.85 2.74 2.64 2.58 2.27 Virtex-5QV 46692.03 40957.92 3537.45 7943.51 3528.65 3.25a 13996.41 12018.17 1187.86 2385.44 1099.27 RTG4 13653.13 13653.13 6023.50 4818.80 630.15 0.70b 20256.87 17662.52 7538.80 5682.54 1507.55 a Averaged between data types (Int8: 3.34 W; Int16: 3.41 W; Int32: 2.98 W; SPFP: 3.33 W; DPFP: 3.21 W). b Averaged between data types (Int8: 0.67 W; Int16: 0.77 W; Int32: 0.80 W; SPFP: 0.85 W; DPFP: 0.42 W).
Table B-4. Benchmarking data for Kepler’s equation on space-grade CPUs and FPGAs.
Processor Performance (MSOLS)
Power (W) Power efficiency (MSOLS/W)
Int8 Int16 Int32 SPFP DPFP Int8 Int16 Int32 SPFP DPFP
GR740 0.83 0.79 0.80 0.43 0.41 1.50 0.55 0.53 0.53 0.29 0.28 RAD5545 0.86 0.19 0.21 0.47 0.70 20.00 0.04 0.01 0.01 0.02 0.04 HPSC 1.85 1.41 4.22 1.26 1.25 10.00 0.18 0.14 0.42 0.13 0.13 Maestro 1.75 2.65 0.35 0.13 0.11 22.20 0.08 0.12 0.02 0.01 0.01 Virtex-5QV 991.93 418.70 81.09 161.14 58.88 3.89a 262.83 104.94 20.17 41.53 15.45 RTG4 302.29 194.65 68.46 26.75 11.99 0.73b 661.48 235.94 78.60 40.59 14.19 a Averaged between data types (Int8: 3.77 W; Int16: 3.99 W; Int32: 4.02 W; SPFP: 3.88 W; DPFP: 3.81 W). b Averaged between data types (Int8: 0.46 W; Int16: 0.83 W; Int32: 0.87 W; SPFP: 0.66 W; DPFP: 0.85 W).

67
Table B-5. Performance data for additional benchmarks on space-grade CPUs.
Processor Benchmark Performance (MOPS, MSOLS, or MT/s) Int8 Int16 Int32 SPFP DPFP
GR740 Matrix additiona 52.37 37.43 21.40 30.62 15.96 GR740 Matrix convolutiona 46.17 52.34 48.05 59.04 56.17 GR740 Matrix transposeb 5.98 4.82 4.78 6.74 6.28 GR740 Clohessy-Wiltshire equationsc d d d 10.86 5.40 RAD5545 Matrix additiona 136.53 96.41 48.14 46.13 36.61 RAD5545 Matrix convolutiona 149.11 98.33 126.72 126.10 117.90 RAD5545 Matrix transposeb 9.69 8.66 7.96 8.26 7.81 RAD5545 Clohessy-Wiltshire equationsc d d d 17.07 17.42 HPSC Matrix additiona 1508.90 792.27 411.23 413.79 213.34 HPSC Matrix convolutiona 459.87 456.67 461.30 408.74 1162.32 HPSC Matrix transposeb 143.96 68.40 33.69 33.48 53.09 HPSC Clohessy-Wiltshire equationsc d d d 21.67 14.11 Maestro Matrix additiona 7.85 8.11 4.82 5.07 3.46 Maestro Matrix convolutiona 81.54 67.59 67.91 65.57 44.19 Maestro Matrix transposeb 4.55 4.23 3.62 3.64 2.64 Maestro Clohessy-Wiltshire equationsc d d d 0.76 0.47 a Performance reported in MOPS. b Performance reported in MT/s. c Performance reported in MSOLS. d Integer data types not applicable for this benchmark.

68
LIST OF REFERENCES
[1] Lovelly, T. M., and George, A. D., “Comparative Analysis of Present and Future Space-Grade Processors with Device Metrics,” AIAA Journal of Aerospace Information Systems (JAIS), Vol. 14, No. 3, March 2017, pp. 184–197. doi:10.2514/1.I010472
[2] Lovelly, T. M., and George, A. D., “Comparative Analysis of Present and Future Space Processors,” Proceedings of the Government Microcircuit Applications and Critical Technology Conference (GOMACTech), Defense Technical Information Center, Ft. Belvoir, VA, March 2015, pp. 1–27.
[3] Lovelly, T. M., Cheng, K., Garcia, W., Bryan, D., Wise, T., and George, A. D., “Device Metrics and Benchmarking Analysis of Next-Generation Architectures for Space Computing,” Proceedings of the 7th Workshop on Fault-Tolerant Spaceborne Computing Employing New Technologies, Sandia National Laboratories, Albuquerque, NM, June 2014, pp. 1–27.
[4] Lovelly, T. M., Cheng, K., Garcia, W., and George, A. D., “Comparative Analysis of Present and Future Space Processors with Device Metrics,” Proceedings of the Military and Aerospace Programmable-Logic Devices Conference (MAPLD), SEE Symposium, San Diego, CA, May 2014, pp. 1–24, http://www.chrec.org/chrec-pubs/Lovelly_ MAPLD14.pdf [retrieved Nov. 2017].
[5] Lovelly, T. M., Bryan, D., Cheng, K., Kreynin, R., George, A. D., Gordon-Ross, A., and Mounce, G., “A Framework to Analyze Processor Architectures for Next-Generation On-Board Space Computing,” Proceedings of the IEEE Aerospace Conference (AERO), IEEE, Piscataway, NJ, March 2014, Paper 2440. doi:10.1109/AERO.2014.6836387
[6] Some, R., Doyle, R., Bergman, L., Whitaker, W., Powell, W., Johnson, M., Goforth, M., and Lowry, M., “Human and Robotic Mission Use Cases for High-Performance Spaceflight Computing,” AIAA Infotech@Aerospace Conference (I@A), AIAA Paper 2013-4729, Aug. 2013. doi:10.2514/6.2013-4729
[7] Doyle, R., Some, R., Powell, W., Mounce, G., Goforth, M., Horan, S., and Lowry, M., “High Performance Spaceflight Computing; Next-Generation Space Processor: A Joint Investment of NASA and AFRL,” Proceedings of the International Symposium on Artificial Intelligence, Robotics, and Automation in Space (i-SAIRAS), Canadian Space Agency, Montreal, June 2014, http://robotics.estec.esa.int/i-SAIRAS/isairas2014/Data/ Plenaries/ISAIRAS_FinalPaper_0153.pdf [retrieved Nov. 2017].
[8] Mounce, G., Lyke, J., Horan, S., Powell, W., Doyle, R., and Some, R., “Chiplet Based Approach for Heterogeneous Processing and Packaging Architectures,” Proceedings of the IEEE Aerospace Conference (AERO), IEEE, Piscataway, NJ, March 2016. doi:10.1109/AERO.2016.7500830

69
[9] Lovelly, T. M., Wise, T. W., Holtzman, S. H., and George, A. D., “Benchmarking Analysis of Space-Grade Central Processing Units and Field-Programmable Gate Arrays,” AIAA Journal of Aerospace Information Systems (JAIS), submitted Nov. 2017.
[10] Lovelly, T. M., Wise, T., Voight, F., and George, A. D., “Performance Analysis of Space-Grade Processors with Device Benchmarking,” Proceedings of the 9th Workshop on Fault-Tolerant Spaceborne Computing Employing New Technologies, Sandia National Laboratories, Albuquerque, NM, June 2016, pp. 1–15.
[11] Pineda, A. C., Mee, J. K., Cunio, P. M., and Weber, R. A., “Benchmarking Image Processing for Space: Introducing the SPACER Architecture Laboratory,” Proceedings of the IEEE Aerospace Conference (AERO), IEEE, Piscataway, NJ, March 2016. doi:10.1109/AERO.2016.7500866
[12] Williams, J., Massie, C., George, A. D., Richardson, J., Gosrani, K., and Lam, H., “Characterization of Fixed and Reconfigurable Multicore Devices for Application Acceleration,” ACM Transactions on Reconfigurable Technology and Systems (TRETS), Vol. 3, No. 4, Nov. 2010, pp. 1–29. doi:10.1145/1862648
[13] Richardson, J., Fingulin, S., Raghunathan, D., Massie, C., George, A. D., and Lam, H., “Comparative Analysis of HPC and Accelerator Devices: Computation, Memory, I/O, and Power,” Proceedings of the High-Performance Reconfigurable Computing Technology and Applications Workshop (HPRCTA) at ACM/IEEE Supercomputing Conference (SC), CFP1015F-ART, IEEE, Piscataway, NJ, Nov. 2010. doi:10.1109/HPRCTA.2010.5670797
[14] Richardson, J., George, A., Cheng, K., and Lam, H., “Analysis of Fixed, Reconfigurable, and Hybrid Devices with Computational, Memory, I/O, & Realizable-Utilization Metrics,” ACM Transactions on Reconfigurable Technology and Systems (TRETS), Vol. 10, No. 1, Dec. 2016, pp. 1–21. doi:10.1145/2888401
[15] Wulf, N., George, A. D., and Gordon-Ross, A., “A Framework for Evaluating and Optimizing FPGA-Based SoCs for Aerospace Computing,” ACM Transactions on Reconfigurable Technology and Systems (TRETS), Vol. 10, No. 1, Dec. 2016, pp. 1–29. doi:10.1145/2888400
[16] Wulf, N., Richardson, J., and George, A. D., “Optimizing FPGA Performance, Power, and Dependability with Linear Programming,” Proceedings of the Military and Aerospace Programmable-Logic Devices Conference (MAPLD), SEE Symposium, San Diego, CA, April 2013, pp. 1–13, http://www.chrec.org/chrec-pubs/Wulf_MAPLD13.pdf [retrieved Nov. 2017].
[17] Bourdarie, S., and Xapsos, M., “The Near-Earth Space Radiation Environment,” IEEE Transactions on Nuclear Science (TNS), Vol. 55, No. 4, Aug. 2008, pp. 1810–1832. doi:10.1109/TNS.2008.2001409

70
[18] Barth, J. L., Dyer, C. S., and Stassinopoulos, E. G., “Space, Atmospheric, and Terrestrial Radiation Environments,” IEEE Transactions on Nuclear Science (TNS), Vol. 50, No. 3, June 2003, pp. 466–482. doi:10.1109/TNS.2003.813131
[19] Schwank, J. R., Ferlet-Cavrois, V., Shaneyfelt, M. R., Paillet, P., and Dodd, P. E., “Radiation Effects in SOI Technologies,” IEEE Transactions on Nuclear Science (TNS), Vol. 50, No. 3, June 2003, pp. 522–538. doi:10.1109/TNS.2003.812930
[20] Gaillardin, M., Raine, M., Paillet, P., Martinez, M., Marcandella, C., Girard, S., Duhamel, O., Richard, N., Andrieu, F., Barraud, S., and Faynot, O., “Radiation Effects in Advanced SOI Devices: New Insights into Total Ionizing Dose and Single-Event Effects,” Proceedings of the IEEE SOI-3D-Subthreshold Microelectronics Technology Unified Conference (S3S), CFP13SOI-USB, IEEE, Piscataway, NJ, Oct. 2013. doi:10.1109/S3S.2013.6716530
[21] Baumann, R., “Soft Errors in Advanced Computer Systems,” IEEE Design and Test of Computers (D&T), Vol. 22, No. 3, June 2005, pp. 258–266. doi:10.1109/MDT.2005.69
[22] Ballast, J., Amort, T., Cabanas-Holmen, M., Cannon, E. H., Brees, R., Neathery, C., Fischer, S., and Snapp, W., “A Method for Efficient Radiation Hardening of Multicore Processors,” Proceedings of the IEEE Aerospace Conference (AERO), IEEE, Piscataway, NJ, March 2015. doi:10.1109/AERO.2015.7119216
[23] Makihara, A., Midorikawa, M., Yamaguchi, T., Iide, Y., Yokose, T., Tsuchiya, Y., Arimitsu, T., Asai, H., Shindou, H., Kuboyama, S., and Matsuda, S., “Hardness-By-Design Approach for 0.15 μm Fully Depleted CMOS/SOI Digital Logic Devices with Enhanced SEU/SET Immunity,” IEEE Transactions on Nuclear Science (TNS), Vol. 52, No. 6, Dec. 2005, pp. 2524–2530. doi:10.1109/TNS.2005.860716
[24] Lacoe, R. C., Osborn, J. V., Koga, R., Brown, S., and Mayer, D. C., “Application of Hardness-By-Design Methodology to Radiation-Tolerant ASIC Technologies,” IEEE Transactions on Nuclear Science (TNS), Vol. 47, No. 6, Dec. 2000, pp. 2334–2341. doi:10.1109/23.903774
[25] Glein, R., Rittner, F., Becher, A., Ziener, D., Frickel, J., Teich, J., and Heuberger, A., “Reliability of Space-Grade vs. COTS SRAM-Based FPGA in N-Modular Redundancy,” NASA/ESA Adaptive Hardware and Systems Conference (AHS), CFP1563A-ART, IEEE, Piscataway, NJ, June 2015. doi:10.1109/AHS.2015.7231159
[26] Ginosar, R., “Survey of Processors for Space,” Proceedings of the Data Systems in Aerospace Conference (DASIA), AeroSpace and Defence Industries Association of Europe, ESA SP-701, Dubrovnik, Croatia, May 2012, http://www.ramon-chips.com/ papers/SurveySpaceProcessors-DASIA2012-paper.pdf [retrieved Nov. 2017].

71
[27] O’Carroll, C. M., “NASA Selects High Performance Spaceflight Computing (HPSC) Processor Contractor,” NASA Goddard Space Flight Center, Greenbelt, MD, March 2017, https://www.nasa.gov/press-release/goddard/2017/nasa-selects-high-performance-spaceflight-computing-hpsc-processor-contractor [retrieved Nov. 2017].
[28] “High Performance Spaceflight Computing (HPSC) Processor Chiplet,” Combined Synopsis/Solicitation, Solicitation Number NNG16574410R, NASA Goddard Space Flight Center, Greenbelt, MD, July 2016, https://www.fbo.gov/index?s=opportunity& mode=form&id=eefe806f639ae00527a13da6b73b3001 [retrieved Nov. 2017].
[29] Kraja, F., and Acher, G., “Using Many-Core Processors to Improve the Performance of Space Computing Platforms,” Proceedings of the IEEE Aerospace Conference (AERO), IEEE, Piscataway, NJ, March 2011. doi:10.1109/AERO.2011.5747445
[30] Quinn, H., Robinson, W. H., Rech, P., Aguirre, M., Barnard, A., Desogus, M., Entrena, L., Garcia-Valderas, M., Guertin, S. M., Kaeli, D., Kastensmidt, F. L., Kiddie, B. T., Sanchez-Clemente, A., Reorda, M. S., Sterpone, L., and Wirthlin, M., “Using Benchmarks for Radiation Testing of Microprocessors and FPGAs,” IEEE Transactions on Nuclear Science (TNS), Vol. 62, No. 6, Dec. 2015, pp. 2547–2554. doi:10.1109/TNS.2015.2498313
[31] Marshall, J. R., Stanley, D., and Robertson, J. E., “Matching Processor Performance to Mission Application Needs,” AIAA Infotech@Aerospace Conference (I@A), AIAA Paper 2011-1620, March 2011. doi:10.2514/6.2011-1620
[32] Wang, Z., Wild, T., Rüping, S., and Lippmann, B., “Benchmarking Domain Specific Processors: A Case Study of Evaluating a Smart Card Processor Design,” Proceedings of the IEEE Computer Society Annual Symposium on VLSI (ISVLSI), IEEE, Piscataway, NJ, April 2008. doi:10.1109/ISVLSI.2008.25
[33] Asanovic, K., Bodik, R., Catanzaro, B. C., Gebis, J. J., Husbands, P., Keutzer, K., Patterson, D. A., Plishker, W. L., Shalf, J., Williams, S. W., and Yelick, K. A., “The Landscape of Parallel Computing Research: A View from Berkeley,” Technical Report No. UCB/EECS-2006-183, University of California, Berkeley, Dec. 2006, https://www2. eecs.berkeley.edu/Pubs/TechRpts/2006/EECS-2006-183.pdf [retrieved Nov. 2017].
[34] Manakul, K., Siripongwutikorn, P., See, S., and Achalakul, T., “Modeling Dwarfs for Workload Characterization,” Proceedings of the IEEE 18th International Conference on Parallel and Distributed Systems (ICPADS), IEEE, Piscataway, NJ, Dec. 2012. doi:10.1109/ICPADS.2012.126
[35] Phillips, S. C., Engen, V., and Papay, J., “Snow White Clouds and the Seven Dwarfs,” Proceedings of the IEEE Third International Conference on Cloud Computing Technology and Science (CloudCom), IEEE, Piscataway, NJ, Nov.-Dec. 2011. doi:10.1109/CloudCom.2011.114

72
[36] Kaltofen, E. L., “The ‘Seven Dwarfs’ of Symbolic Computation,” Numerical and Symbolic Scientific Computing, Texts and Monographs in Symbolic Computation (A Series of the Research Institute for Symbolic Computation, Johannes Kepler University, Linz, Austria), Vol. 1, 2012, pp. 95–104. doi:10.1007/978-3-7091-0794-2_5
[37] “P5040 QorIQ Integrated Multicore Communication Processor Reference Manual,” P5040RM, Rev. 3, Freescale Semiconductor, Austin, TX, June 2016, pp. 65–76, 128–138.
[38] “P5040 QorIQ Integrated Processor Data Sheet,” P5040, Rev. 1, Freescale Semiconductor, Austin, TX, May 2014, http://cache.freescale.com/files/32bit/doc/ data_sheet/P5040.pdf [retrieved Nov. 2017].
[39] “e5500 Core Reference Manual,” e5500RM, Rev. 4, Freescale Semiconductor, Austin, TX, March 2013, pp. 36–46, 151–152, 162, 246–250, 274, https://www. nxp.com/webapp/Download?colCode=E5500RM [retrieved Nov. 2017].
[40] “Virtex-5 Family Overview,” Product Specification DS100, Ver. 5.1, Xilinx, Inc., San Jose, CA, Aug. 2015, https://www.xilinx.com/support/documentation/data_sheets/ ds100.pdf [retrieved Nov. 2017].
[41] “Xilinx Power Estimator: Virtex-5, Virtex-6,” XPE Ver. 14.3, Xilinx Inc., San Jose, CA, Oct. 2012, https://www.xilinx.com/products/technology/power/xpe.html [retrieved Nov. 2017].
[42] “LogiCORE IP CORDIC,” Product Specification DS249, Ver. 4.0, Xilinx Inc., San Jose, CA, March 2011, https://www.xilinx.com/support/documentation/ ip_documentation/cordic_ds249.pdf [retrieved Nov. 2017].
[43] “LogiCORE IP Floating-Point Operator,” Product Specification DS335, Ver. 5.0, Xilinx Inc., San Jose, CA, March 2011, https://www.xilinx.com/support/documentation/ ip_documentation/floating_point_ds335.pdf [retrieved Nov. 2017].
[44] “GR-CPCI-LEON4-N2X Development Board User Manual,” Rev. 1.2, Cobham/Gaisler, Göteborg, Sweden, Aug. 2013, pp. 1–57, http://www.gaisler.com/doc/ GR-CPCI-LEON4-N2X_UM.pdf [retrieved Nov. 2017].
[45] “GR740: Quadcore LEON4 SPARCV8 Processor,” GR740-UM-DS, Ver. 1.5, Cobham/Gaisler, Göteborg, Sweden, Nov. 2016, http://www.gaisler.com/doc/gr740/ GR740-UM-DS.pdf [retrieved Nov. 2017].
[46] Hjorth, M., Aberg, M., Wessman, N., Andersson, J., Chevallier, R., Forsyth, R., Weigand, R., and Fossati, L., “GR740: Rad-Hard Quadcore LEON4FT System-on-Chip,” Proceedings of the Data Systems in Aerospace Conference (DASIA), AeroSpace and Defence Industries Association of Europe, ESA SP-732, Barcelona, Spain, May 2015, http://microelectronics.esa.int/gr740/DASIA2015-GR740-Hjorth.pdf [retrieved Nov. 2017].

73
[47] Andersson, J., Hjorth, M., Habinc, S., and Gaisler, J., “Development of a Functional Prototype of the Quad Core NGMP Space Processor,” Proceedings of Data Systems in Aerospace Conference (DASIA), AeroSpace and Defence Industries Association of Europe, ESA SP-701, Dubrovnik, Croatia, May 2012, http://microelectronics.esa.int/ gr740/NGMP-NGFP-DASIA-2012-Paper.pdf [retrieved Nov. 2017].
[48] “P5040/5020/3041 DS (Super Hydra) HW User Guide,” Rev. 1.3, Freescale Semiconductor, Austin, TX, July 2013, pp. 1–111.
[49] Berger, R., Chadwick, S., Chan, E., Ferguson, R., Fleming, P., Gilliam, J., Graziano, M., Hanley, M., Kelly, A., Lassa, M., Li, B., Lapihuska, R., Marshall, J., Miller, H., Moser, D., Pirkl, D., Rickard, D., Ross, J., Saari, B., Stanley, D., and Stevenson, J., “Quadcore Radiation-Hardened System-On-Chip Power Architecture Processor,” Proceedings of the IEEE Aerospace Conference (AERO), IEEE, Piscataway, NJ, March 2015. doi:10.1109/AERO.2015.7119114
[50] “HiKey (LeMaker Version) Hardware User Manual,” Ver. 0.1, Rev. 0.2, Shenzhen LeMaker Technology Co. Ltd., Shenzhen, China, Dec. 2015, pp. 1–22, https://github.com/96boards/documentation/blob/master/ConsumerEdition/HiKey/ AdditionalDocs/HiKey_Hardware_User_Manual_Rev0.2.pdf [retrieved Nov. 2017].
[51] Walters, J. P., Crago, S., and Bancroft, M., “Maestro User Group (MUG),” 10th Workshop on Fault-Tolerant Spaceborne Computing Employing New Technologies, Sandia National Laboratories, Albuquerque, NM, May-June 2017.
[52] Rogers, C. M., Barnhart, D., and Crago, S., “The Maestro Flight Experiment: A 49-Core Radiation Hardened Processor in Space,” Proceedings of the IEEE Aerospace Conference (AERO), IEEE, Piscataway, NJ, March 2016. doi:10.1109/AERO.2016.7500626
[53] Suh, J., Kang, D. I. D., and Crago, S. P., “Implementation of Kernels on the Maestro Processor,” Proceedings of the IEEE Aerospace Conference (AERO), CFP13AAC·CDR, IEEE, Piscataway, NJ, March 2013. doi:10.1109/AERO.2013.6496949
[54] Villalpando, C., Rennels, D., Some, R., and Cabanas-Holmen, M., “Reliable Multicore Processors for NASA Space Missions,” Proceedings of the IEEE Aerospace Conference (AERO), IEEE, Piscataway, NJ, March 2011. doi:10.1109/AERO.2011.5747447
[55] “ML510 Embedded Development Platform User Guide,” UG356, Ver. 1.2, Xilinx, Inc., San Jose, CA, June 2011, https://www.xilinx.com/support/documentation/ boards_and_kits/ug356.pdf [retrieved Nov. 2017].
[56] “Radiation-Hardened, Space-Grade Virtex-5QV Family Overview,” DS192, Ver. 1.5, Xilinx Inc., San Jose, CA, Apr. 2017, https://www.xilinx.com/support/documentation/ data_sheets/ds192_V5QV_Device_Overview.pdf [retrieved Nov. 2017].

74
[57] “RTG4 FPGA Development Kit User Guide,” UG0617, Rev. 4.0, Microsemi Corp., Aliso Viejo, CA, July 2017, https://www.microsemi.com/document-portal/doc_download/ 135213-ug0617-rtg4-fpga-development-kit-user-guide [retrieved Nov. 2017].
[58] “PB0051 Product Brief: RTG4 FPGAs,” Rev. 10.0, Microsemi Corp., Aliso Viejo, CA, July 2017, http://www.microsemi.com/document-portal/doc_view/134430-pb0051-rtg4-fpgas-product-brief [retrieved Nov. 2017].
[59] Blackford, L. S., Demmel, J., Dongarra, J., Duff, I., Hammarling, S., Henry, G., Heroux, M., Kaufman, L., Lumsdaine, A., Petitet, A., Pozo, R., Remington, K., and Whaley, R. C., “An Updated Set of Basic Linear Algebra Subprograms (BLAS),” ACM Transactions on Mathematical Software (TOMS), Vol. 28, No. 2, June 2002, pp. 135–151. doi:10.1145/567806.567807
[60] Whaley, R. C., and Petitet, A., “Minimizing Development and Maintenance Costs in Supporting Persistently Optimized BLAS,” Wiley Journal of Software: Practice and Experience, Vol. 35, No. 2, Feb. 2005, pp. 101–121. doi:10.1002/spe.626
[61] Dagum, L., and Menon, R., “OpenMP: An Industry Standard API for Shared-Memory Programming,” IEEE Computational Science and Engineering, Vol. 5, No. 1, Jan.-March 1998, pp. 46–55. doi:10.1109/99.660313
[62] “ARM NEON Intrinsics Reference,” IHI0073B, ARM Holdings, San Jose, CA, March 2016, pp. 1–348, https://static.docs.arm.com/ihi0073/b/IHI0073B_arm_neon_intrinsics _ref.pdf [retrieved Nov. 2017].
[63] Holtzman, S. H., Lovelly, T. M., and George, A. D., “Performance Optimization of Space Benchmarks on the Maestro Processor,” Proceedings of the 10th Workshop on Fault-Tolerant Spaceborne Computing Employing New Technologies, Sandia National Laboratories, Albuquerque, NM, June 2017, pp. 1–15.
[64] “Multicore Development Environment: Application Libraries Reference Manual,” UG227, Release 2.1.0.98943, Tilera Corp., San Jose, CA, April 2010.
[65] “LogiCORE IP Floating-Point Operator,” Product Specification PG060, Ver. 7.0, Xilinx Inc., San Jose, CA, April 2014, https://www.xilinx.com/support/documentation/ ip_documentation/floating_point/v7_0/pg060-floating-point.pdf [retrieved Nov. 2017].
[66] “LogiCORE IP Divider Generator,” Product Specification DS819, Ver. 4.0, Xilinx Inc., San Jose, CA, June 2011, https://www.xilinx.com/support/documentation/ ip_documentation/div_gen/v4_0/ds819_div_gen.pdf [retrieved Nov. 2017].
[67] “CoreCORDIC v4.0 Handbook,” Rev. 6, Microsemi Corp., Aliso Viejo, CA, June 2015, http://www.actel.com/ipdocs/CoreCORDIC_HB.pdf [retrieved Nov. 2017].
[68] Marcus, G., “Floating Point Adder and Multiplier,” OpenCores.org/Oliscience, Amsterdam, Netherlands, Feb. 2012, http://opencores.org/project,fpuvhdl [retrieved Nov. 2017].

75
[69] “HXRHPPC Rad Hard Microprocessor,” Honeywell International, Inc., Plymouth, MN, Aug. 2008, https://aerocontent.honeywell.com/aero/common/documents/ myaerospacecatalog-documents/Space-documents/ HXRHPPC_Processor.pdf [retrieved Nov. 2017].
[70] Berger, R. W., Bayles, D., Brown, R., Doyle, S., Kazemzadeh, A., Knowles, K., Moser, D., Rodgers, J., Saari, B., and Stanley, D., “The RAD750: A Radiation Hardened PowerPC Processor for High Performance Spaceborne Applications,” Proceedings of the IEEE Aerospace Conference (AERO), IEEE, Piscataway, NJ, March 2001. doi:10.1109/AERO.2001.931184
[71] “GR712RC: Dual-Core LEON3-FT SPARC V8 Processor,” GR712RC-DS, Ver. 2.3, Cobham/Gaisler, Göteborg, Sweden, Jan. 2016, http://www.gaisler.com/ j25/doc/gr712rc-datasheet.pdf [retrieved Nov. 2017].
[72] “LEON3-FT SPARC V8 Processor LEON3FT-RTAX Data Sheet and User’s Manual,” LEON3FT-RTAX, Ver. 1.9, Cobham/Gaisler, Göteborg, Sweden, Jan. 2013, pp. 1–2, 15–17, 28, 32–33, http://www.gaisler.com/doc/leon3ft-rtax-ag.pdf [retrieved Nov. 2017].
[73] Ginosar, R., Aviely, P., Israeli, T., and Meirov, H., “RC64: High Performance Rad-Hard Manycore,” Proceedings of the IEEE Aerospace Conference (AERO), IEEE, Piscataway, NJ, March 2016. doi:10.1109/AERO.2016.7500697
[74] Ginosar, R., Aviely, P., Gellis, H., Liran, T., Israeli, T., Nesher, R., Lange, F., Dobkin, R., Meirov, H., and Reznik, D., “A Rad-Hard Many-Core High-Performance DSP for Space Applications,” Proceedings of the Data Systems in Aerospace Conference (DASIA), AeroSpace and Defence Industries Association of Europe, ESA SP-732, Barcelona, Spain, May 2015, http://www.ramon-chips.com/papers/ DASIA2015-RC64-paper.pdf [retrieved Nov. 2017].
[75] Ginosar, R., Aviely, P., Lange, F., and Liran, T., “RC64: High Performance Rad-Hard Manycore with FPGA Extension for Telecomm Satellites and Other Space Applications,” Proceedings of the Military and Aerospace Programmable-Logic Devices Conference (MAPLD), SEE Symposium, San Diego, CA, May 2015, pp. 1–4, http:// www.ramon-chips.com/papers/MAPLD2015-RC64-paper.pdf [retrieved Nov. 2017].
[76] Byrne, J., “Ceva Trains DSP Guns on TI: Ceva Coaxes Designers to Move to Its Ceva-X and Ceva-XC DSP IP,” Linley Newsletter, No. 331, 11 Nov. 2010, http:// linleygroup.com/newsletters/newsletter_detail.php?num=3993 [retrieved Nov. 2017].
[77] Balaish, E., “Architecture Oriented C Optimizations, Part 1: DSP Features,” EE Times, 27 Aug. 2008, http://www.eetimes.com/document.asp?doc_id=1275609 [retrieved Nov. 2017].

76
[78] Marshall, J. R., Bear, M., Hollinden, L., and Lapihuska, R., “Emergence of a High Performance Tiled Rad-Hard Digital Signal Processor for Spaceborne Applications,” AIAA Infotech@Aerospace Conference (I@A), AIAA Paper 2013-4728, Aug. 2013. doi:10.2514/6.2013-4728
[79] Marshall, J., Berger, R., Bear, M., Hollinden, L., Robertson, J., and Rickard, D., “Applying a High Performance Tiled Rad-Hard Digital Signal Processor to Spaceborne Applications,” Proceedings of the IEEE Aerospace Conference (AERO), IEEE, Piscataway, NJ, March 2012. doi:10.1109/AERO.2012.6187229
[80] “RTG4 FPGA: DS0131 Datasheet,” Rev. 2i, Microsemi Corp., Aliso Viejo, CA, May 2016, http://www.microsemi.com/document-portal/doc_download/135193-ds0131-rtg4-fpga-datasheet [retrieved Nov. 2017].
[81] “Microsemi Power Estimator: RTG4,” MPE v3j, Microsemi Corp., Aliso Viejo, CA, Feb. 2016, https://www.microsemi.com/document-portal/doc_download/134921-rtg4-power-estimator [retrieved Nov. 2017].
[82] “SmartFusion2, IGLOO2, and RTG4L Hard Multiplier AddSub Configuration,” Microsemi Corp., Aliso Viejo, CA, June 2015, http://microsemi.com/document-portal/ doc_download/135182-smartfusion2-hard-multiplier-addsub-configuration-guide [retrieved Nov. 2017].
[83] Weisstein, E. W., “Matrix Addition,” MathWorld – A Wolfram Web Resource, Oct. 2017, http://mathworld.wolfram.com/MatrixAddition.html [retrieved Nov. 2017].
[84] Weisstein, E. W., “Fast Fourier Transform,” MathWorld – A Wolfram Web Resource, Oct. 2017, http://mathworld.wolfram.com/FastFourierTransform.html [retrieved Nov. 2017].
[85] Weisstein, E. W., “Matrix Multiplication,” MathWorld – A Wolfram Web Resource, Oct. 2017, http://mathworld.wolfram.com/MatrixMultiplication.html [retrieved Nov. 2017].
[86] Weisstein, E. W., “Convolution,” MathWorld – A Wolfram Web Resource, Oct. 2017, http://mathworld.wolfram.com/Convolution.html [retrieved Nov. 2017].
[87] Weisstein, E. W., “Jacobi Transformation,” MathWorld – A Wolfram Web Resource, Oct. 2017, http://mathworld.wolfram.com/JacobiTransformation.html [retrieved Nov. 2017].
[88] Weisstein, E. W., “Kronecker Product,” MathWorld – A Wolfram Web Resource, Oct. 2017, http://mathworld.wolfram.com/KroneckerProduct.html [retrieved Nov. 2017].
[89] “Advance Information: PowerPC 603 RISC Microprocessor Technical Summary,” MPC603/D, Rev. 3, Freescale Semiconductor, Austin, TX, June 1994, http://www.nxp. com/assets/documents/data/en/data-sheets/MPC603.pdf [retrieved Nov. 2017].

77
[90] “MPC750 RISC Microprocessor Family User’s Manual,” MPC750UM/D, Rev. 1, Freescale Semiconductor, Austin, TX, Dec. 2001, http://www.nxp.com/ assets/documents/data/en/reference-manuals/MPC750UM.pdf [retrieved Nov. 2017].
[91] “PowerPC 740 and PowerPC7 50 Microprocessor Datasheet,” Ver. 2.0, IBM Microelectronics Division, Hopewell Junction, NY, Sept. 2002, http://datasheets. chipdb.org/IBM/PowerPC/7xx/PowerPC-740-750.pdf [retrieved Nov. 2017].
[92] “PowerPC Microprocessor Family: The Bus Interface for 32-Bit Microprocessors,” MPC60XBUSRM, Rev. 0.1, Freescale Semiconductor, Austin, TX, Jan. 2004, http:// www.nxp.com/assets/documents/data/en/reference-manuals/MPC60XBUSRM.pdf [retrieved Nov. 2017].
[93] “Tile Processor Architecture Overview for the TILEPro Series,” UG120, Release 1.2, Tilera Corp., San Jose, CA, Feb. 2013, http://www.mellanox.com/repository/ solutions/tile-scm/docs/UG120-Architecture-Overview-TILEPro.pdf [retrieved Nov. 2017].
[94] “Tile Processor User Architecture Manual,” UG101, Release 2.4, Tilera Corp., San Jose, CA, Nov. 2011, http://www.mellanox.com/repository/solutions/tile-scm/docs/ UG101-User-Architecture-Reference.pdf [retrieved Nov. 2017].
[95] “CSX700 Floating Point Processor Datasheet,” 06-PD-1425, Rev. 1E, ClearSpeed Technology, Ltd., Bristol, England, U.K., Jan. 2011.
[96] “CSX600/CSX700 Instruction Set Reference Manual,” 06-RM-1137, Rev. 4B, ClearSpeed Technology, Ltd., Bristol, England, U.K., Nov. 2009.
[97] “Intel Quark SoC X1000 Core: Hardware Reference Manual,” Order Number 329678-002US, Intel Corp., Santa Clara, CA, April 2014, pp. 12–24, 28, http://www. intel.com/content/dam/support/us/en/documents/processors/quark/sb/329678_ intelquarkcore_hwrefman_002.pdf [retrieved Nov. 2017].
[98] “Intel Quark SoC X1000 Core: Developer’s Manual,” Order Number 329679-001US, Intel Corp., Santa Clara, CA, Oct. 2013, pp. 21–23, 114, 252–290, http://www.intel.com/ content/dam/support/us/en/documents/processors/quark/sb/intelquarkcore_ devman_001.pdf [retrieved Nov. 2017].
[99] “Intel Atom Processor Z3600 and Z3700 Series: Datasheet,” Document Number 329474-003, Rev. 003, Intel Corp., Santa Clara, CA, Dec. 2014, http://www.intel.com/ content/dam/www/public/us/en/documents/datasheets/atom-z36xxx-z37xxx-datasheet-vol-1.pdf [retrieved Nov. 2017].
[100] “ARK Atom Processor Z3770 Specifications,” Intel Corp., Santa Clara, CA, Sept. 2013, http://ark.intel.com/products/76760 [retrieved Nov. 2017].

78
[101] “Intel 64 and IA-32 Architectures Software Developer’s Manual,” Order Number 325462-060US, Combined Vols. 1, 2A–2D, and 3A–3D, Intel Corp., Santa Clara, CA, Sept. 2016, pp. 113–146, http://www.intel.com/content/dam/www/public/us/en/ documents/manuals/64-ia-32-architectures-software-developermanual-325462.pdf [retrieved Nov. 2017].
[102] “Intel 64 and IA-32 Architectures Optimization Reference Manual,” Order Number 248966-033, Intel Corp., Santa Clara, CA, June 2016, pp. 36–43, 62–69, http://www. intel.com/content/dam/www/public/us/en/documents/manuals/64-ia-32-architectures-optimization-manual.pdf [retrieved Nov. 2017].
[103] ”Desktop 4th Generation Intel Core Processor Family, Desktop Intel Pentium Processor Family, and Desktop Intel Celeron Processor Family: Datasheet,” Order Number 328897-010, Vol. 1, Intel Corp., Santa Clara, CA, March 2015, http://www. intel.com/content/dam/www/public/us/en/documents/datasheets/4th-gen-core-family-desktop-vol-1-datasheet.pdf [retrieved Nov. 2017].
[104] “ARK Core i7-4610Y Processor Specifications,” Intel Corp., Santa Clara, CA, Sept. 2013, http://ark.intel.com/products/76618 [retrieved Nov. 2017].
[105] Frumusanu, A., and Smith, R., “ARM A53/A57/T760 Investigated: Samsung Galaxy Note 4 Exynos Review,” AnandTech, Los Angeles, CA, Feb. 2015, http://www.anandtech.com/show/8718 [retrieved Nov. 2017].
[106] “ARM Cortex-A57 MPCore Processor Technical Reference Manual,” DDI 0488H, Rev. r1p3, ARM Holdings, San Jose, CA, Feb. 2016, pp. 24–27, 509–521, http:// infocenter.arm.com/help/index.jsp?topic=/com.arm.doc.ddi0488h [retrieved Nov. 2017].
[107] “ARM Cortex-A53 MPCore Processor Technical Reference Manual,” DDI 0500D, Rev. r0p2, ARM Holdings, San Jose, CA, Feb. 2014, pp. 13–19, 24–29, http:// infocenter.arm.com/help/index.jsp?topic=/com.arm.doc.ddi0500d [retrieved Nov. 2017].
[108] “Tile Processor and I/O Device Guide: For the TILE-Gx Family of Processors,” UG404, Release 1.12, Tilera Corp., San Jose, CA, Oct. 2014, http://www.mellanox.com/ repository/solutions/tile-scm/docs/UG404-IO-Device-Guide.pdf [retrieved Nov. 2017].
[109] “TILE-Gx Instruction Set Architecture,” UG401, Release 1.2, Tilera Corp., San Jose, CA, Feb. 2013, http://www.mellanox.com/repository/solutions/tile-scm/docs/ UG401-ISA.pdf [retrieved Nov. 2017].
[110] “Tile Processor Architecture Overview for the TILE-Gx Series,” UG130, Release 1.1, Tilera Corp., San Jose, CA, May 2012, http://www.mellanox.com/repository/ solutions/tile-scm/docs/UG130-ArchOverview-TILE-Gx.pdf [retrieved Nov. 2017].
[111] “MSC8256: Six-Core Digital Signal Processor,” Datasheet MSC8256, Rev. 6, Freescale Semiconductor, Austin, TX, July 2013, http://www.nxp.com/assets/ documents/data/en/data-sheets/MSC8256.pdf [retrieved Nov. 2017].

79
[112] “MSC8256 Reference Manual: Six Core Digital Signal Processor,” Document MSC8256RM, Rev. 0, Freescale Semiconductor, Austin, TX, July 2011, pp. 44–72, 80–82, http://www.nxp.com/assets/documents/data/en/reference-manuals/MSC8256RM.pdf [retrieved Nov. 2017].
[113] “MSC8256 Product Brief: Six-Core DSP,” Document MSC8256PB, Rev. 1, Freescale Semiconductor, Austin, TX, May 2011, http://www.nxp.com/assets/ documents/data/en/product-briefs/MSC8256PB.pdf [retrieved Nov. 2017].
[114] “Multicore DSP+ARM KeyStone II System-on-Chip (SoC),” Document SPRS866E, Texas Instruments, Dallas, TX, Nov. 2013, http://www.ti.com/lit/ds/symlink/66ak2h12.pdf [retrieved Nov. 2017].
[115] “ARM Architecture Reference Manual: ARMv7-A and ARMv7-R Edition,” DDI 0406C.c, ARM Holdings, San Jose, CA, May 2014, pp. 165–171, 181–191, 261–272, http://infocenter.arm.com/help/index.jsp?topic=/com.arm.doc.ddi0406c [retrieved Nov. 2017].
[116] ARM Cortex-A15 MPCore Processor Technical Reference Manual, DDI 0438I, Rev. r4p0, ARM Holdings, San Jose, CA, June 2013, pp. 12–16, 26–29, http:// infocenter.arm.com/help/index.jsp?topic=/com.arm.doc.ddi0438i [retrieved Nov. 2017].
[117] “Defense-Grade Spartan-6Q Family Overview,” Product Specification DS172, Ver. 1.1, Xilinx, Inc., San Jose, CA, May 2014, https://www.xilinx.com/support/ documentation/data_sheets/ds172_S6Q_Overview.pdf [retrieved Nov. 2017].
[118] “Xilinx Power Estimator: Extended Spartan-3A, Spartan-6,” XPE 14.3, Xilinx, Inc., San Jose, CA, Oct. 2012, https://www.xilinx.com/products/technology/power/xpe.html [retrieved Nov. 2017]
[119] “Defense-Grade 7 Series FPGAs Overview,” Product Specification DS185, Ver. 1.2, Xilinx, Inc., San Jose, CA, July 2015, https://www.xilinx.com/support/ documentation/data_sheets/ds185-7SeriesQ-Overview.pdf [retrieved Nov. 2017].
[120] “Xilinx Power Estimator: Artix-7, Kintex-7, Virtex-7, Zynq-7000,” XPE 2014.1, Xilinx, Inc., San Jose, CA, April 2014, https://www.xilinx.com/products/technology/ power/xpe.html [retrieved Nov. 2017].
[121] “NVIDIA Tegra 3 HD Mobile Processors: T30 Series, AP30 Series,” Technical Reference Manual DP-05644-001_v01p, NVIDIA Corp., Santa Clara, CA, Jan. 2012.
[122] “Cortex-A9 Technical Reference Manual,” DDI 0388F, Rev. r2p2, ARM Holdings, San Jose, CA, April 2010, http://infocenter.arm.com/help/index.jsp?topic= /com.arm.doc.ddi0388f [retrieved Nov. 2017].
[123] “NVIDIA Tegra K1: A New Era in Mobile Computing,” NVIDIA Corp. Whitepaper v1.1, Santa Clara, CA, Jan. 2014, http://www.nvidia.com/content/pdf/tegra_white_ papers/tegra-K1-whitepaper.pdf [retrieved Nov. 2017].

80
[124] “NVIDIA Tegra X1: NVIDIA’s New Mobile Superchip,” NVIDIA Corp. Whitepaper v1.0, Santa Clara, CA, Jan. 2015, http://international.download.nvidia.com/pdf/tegra/ Tegra-X1-whitepaper-v1.0.pdf [retrieved Nov. 2017].
[125] Martín del Campo, G., Reigber, A., and Shkvarko, Y. “Resolution Enhanced SAR Tomography: From Match Filtering to Compressed Sensing Beamforming Techniques,” Proceedings of the 11th European Conference on Synthetic Aperture Radar (EUSAR), VDE, Frankfurt, Germany, June 2016.
[126] Sun, X., Abshire, J. B., McGarry, J. F., Neumann, G. A., Smith, J. C., Cavanaugh, J. F., Harding, D. J., Zwally, H. J., Smith, D. E., and Zuber, M. T., “Space Lidar Developed at the NASA Goddard Space Flight Center: The First 20 Years,” IEEE Journal of Selected Topics in Applied Earth Observations and Remote Sensing (J-STARS), Vol. 6, No. 3, June 2013, pp. 1660–1675. doi:10.1109/JSTARS.2013.2259578
[127] Najjar, N., Gupta, S., Hare, J., Kandil, S., and Walthall, R., “Optimal Sensor Selection and Fusion for Heat Exchanger Fouling Diagnosis in Aerospace Systems,” IEEE Sensors Journal, Vol. 16, No. 12, June 2016, pp. 4866–4881. doi:10.1109/JSEN.2016.2549860
[128] Bay, H., Ess, A., Tuytelaars, T., and Van Gool, L., “Speeded-Up Robust Features (SURF),” Elsevier Journal of Computer Vision and Image Understanding, Vol. 110, No. 3, June 2008, pp. 346–359. doi:10.1016/j.cviu.2007.09.014
[129] Plaza, A., Qian, D., Yang-Lang, C., and King, R. L., “High Performance Computing for Hyperspectral Remote Sensing,” IEEE Journal of Selected Topics in Applied Earth Observations and Remote Sensing (J-STARS), Vol. 4, No. 3, Sep 2011, pp. 528–544. doi:10.1109/JSTARS.2010.2095495
[130] Goldberg, S. B., and Matthies, L., “Stereo and IMU Assisted Visual Odometry on an OMAP3530 for Small Robots,” Proceedings of the IEEE Computer Society Conference on Computer Vision and Pattern Recognition Workshops (CVPRW), IEEE, Piscataway, NJ, June 2011. doi:10.1109/CVPRW.2011.5981842
[131] Chang, C., Ren, H., and Chiang, S., “Real-Time Processing Algorithms for Target Detection and Classification in Hyperspectral Imagery,” IEEE Transactions on Geoscience and Remote Sensing (TGRS), Vol. 39, No. 4, April 2001, pp. 760–768. doi:10.1109/36.917889
[132] Ho, A., George, A., and Gordon-Ross, A., “Improving Compression Ratios for High Bit-Depth Grayscale Video Formats,” Proceedings of the IEEE Aerospace Conference (AERO), IEEE, Piscataway, NJ, March 2016. doi:10.1109/AERO.2016.7500799
[133] “Image Data Compression,” Recommended Standard 122.0-B-2, Consultative Committee for Space Data Systems (CCSDS), Washington, D.C., Sept. 2017, https://public.ccsds.org/Pubs/122x0b2.pdf [retrieved Nov. 2017].

81
[134] “Lossless Multispectral & Hyperspectral Image Compression,” Recommended Standard 123.0-B-1, Consultative Committee for Space Data Systems (CCSDS), Washington, D.C., May. 2012, https://public.ccsds.org/Pubs/123x0b1ec1.pdf [retrieved Nov. 2017].
[135] Tappe, J. A., “Development of Star Tracker System for Accurate Estimation OF Spacecraft Attitude,” Master’s Thesis, Naval Postgraduate School, Monterey, CA, Dec. 2009, https://calhoun.nps.edu/handle/10945/4335 [retrieved Nov. 2017].
[136] Boyarko, G. A., Romano, M., and Yakimenko, O. A., “Time-Optimal Reorientation of a Spacecraft Using an Inverse Dynamics Optimization Method,” AIAA Journal of Guidance, Control and Dynamics (JGCD), Vol. 34, No. 4, July 2011, pp. 1197–1208. doi:10.2514/1.49449
[137] Curtis, H., Orbital Mechanics for Engineering Students, 1st ed., Elsevier Aerospace Engineering Series, Elsevier Butterworth-Heinemann, Burlington, MA, 2005.
[138] Palmerini, G. B., “Relative Navigation in Autonomous Spacecraft Formations,” Proceedings of the IEEE Aerospace Conference (AERO), IEEE, Piscataway, NJ, March 2016. doi:10.1109/AERO.2016.7500944
[139] Boyarko, G. A., Yakimenko, O. A., and Romano, M., “Real-Time 6DoF Guidance For of Spacecraft Proximity Maneuvering and Close Approach with a Tumbling Object,” Proceedings of the AIAA/AAS Astrodynamics Specialist Conference, AIAA Paper 2010-7666, Aug. 2010. doi:10.2514/6.2010-7666
[140] Lopez, I., and McInnes, C. R., “Autonomous Rendezvous Using Artificial Potential Function Guidance,” AIAA Journal of Guidance, Control, and Dynamics (JGCD), Vol. 18, No. 2, March 1995, pp. 237–241. doi:10.2514/3.21375
[141] Lovell, T. A., and Spencer, D. A., “Relative Orbital Elements Formulation Based upon the Clohessy-Wiltshire Equations,” Springer Journal of the Astronautical Sciences, Vol. 61, No. 4, Dec. 2014, pp. 341–366. doi:10.1007/s40295-014-0029-6
[142] Badawy, A., and McInnes, C. R., “On-Orbit Assembly Using Superquadric Potential Fields,” AIAA Journal of Guidance, Control and Dynamics (JGCD), Vol. 31, No. 1, Jan. 2008, pp. 30–43. doi:10.2514/1.28865
[143] Epp, C. D., and Smith, T. B., “Autonomous Precision Landing and Hazard Detection and Avoidance Technology (ALHAT),” Proceedings of the IEEE Aerospace Conference (AERO), IEEE, Piscataway, NJ, March 2007. doi:10.1109/AERO.2007.352724
[144] Estlin, T., Bornstein, B., Gaines, D., Thompson, D. R., Castano, R., Anderson, R. C., de Granville, C., Burl, M., Judd, M., and Chien, S., “AEGIS Automated Science Targeting for the MER Opportunity Rover,” ACM Transactions on Intelligent Systems and Technology (TIST), Vol. 3, No. 50, May 2012. doi:10.1145/2168752.2168764

82
[145] Wolf, A. A., Acikmese, B., Cheng, Y., Casoliva, J., Carson, J. M., and Ivanov, M. C., “Toward Improved Landing Precision on Mars,” Proceedings of the IEEE Aerospace Conference (AERO), IEEE, Piscataway, NJ, March 2011. doi:10.1109/AERO.2011.5747243
[146] Goldberg, S. B., Maimone, M. W., and Matthies, L., “Stereo Vision and Rover Navigation Software for Planetary Exploration,” Proceedings of the IEEE Aerospace Conference (AERO), IEEE, Piscataway, NJ, March 2002. doi:10.1109/AERO.2002.1035370
[147] Bajracharya, M., Ma, J., Howard, A., and Matthies, L., “Real-Time 3D Stereo Mapping in Complex Dynamic Environments,” Semantic Mapping, Perception, and Exploration Workshop (SPME) at International Conference on Robotics and Automation (ICRA), May 2012.
[148] Knight R., and Hu, S., “Compressed Large-Scale Activity Scheduling and Planning (CLASP),” Proceedings of the Sixth International Workshop in Planning and Scheduling for Space (IWPSS), Pasadena, California, July 2009, https://smcit.ecs.baylor.edu/2009/ iwpss/papers/22.pdf [retrieved Nov. 2017].
[149] Visser, W., Havelund, K., Brat, G., Park, S., and Lerda, F., “Model Checking Programs,” Springer International Journal of Automated Software Engineering, Vol. 10, No. 2, April 2003, pp. 203–232. doi:10.1023/A:1022920129859
[150] Weiss, A., Kolmanovsky, I., Baldwin, M., and Erwin, R. S., “Model Predictive Control of Three Dimensional Spacecraft Relative Motion,” Proceedings of the American Control Conference (ACC), pp. 173–178, June 2012. doi:10.1109/ACC.2012.6314862
[151] Wongpiromsarn, T., Topcu, U., and Murray, R. M., “Receding Horizon Temporal Logic Planning,” IEEE Transactions on Automatic Control (TAC), Vol. 57, No. 11, Nov. 2012, pp. 2817–2830. doi:10.1109/TAC.2012.2195811
[152] Sadiku, M. N. O., and Akujuobi, C. M., “Software-Defined Radio: A Brief Overview,” IEEE Potentials, Vol. 23, No. 4, Oct. 2004, pp. 14–15. doi:10.1109/MP.2004.1343223
[153] Martin, Q., and George, A. D., “Scrubbing Optimization via Availability Prediction (SOAP) for Reconfigurable Space Computing,” Proceedings of the IEEE High Performance Extreme Computing Conference (HPEC), IEEE, Piscataway, NJ, Sept. 2012. doi:10.1109/HPEC.2012.6408673
[154] “TM Synchronization and Channel Coding,” Recommended Standard 131.0-B-3, Consultative Committee for Space Data Systems (CCSDS), Washington, D.C., Sept. 2017, https://public.ccsds.org/Pubs/131x0b3.pdf [retrieved Nov. 2017].

83
[155] “National Information Assurance Policy for Space Systems Used to Support National Security Missions,” CNSS Policy 12, Committee on National Security Systems (CNSS), Fort George G. Meade, MD, Nov. 2012, https://www.cnss.gov/CNSS/ issuances/Policies.cfm [retrieved Nov. 2017].
[156] “Use of Public Standards for Secure Information Sharing,” CNSS Policy 15, Committee on National Security Systems (CNSS), Fort George G. Meade, MD, Oct. 2016, https://www.cnss.gov/CNSS/issuances/Policies.cfm [retrieved Nov. 2017].
[157] “CCSDS Cryptographic Algorithms,” Recommended Standard 352.0-B-1, Consultative Committee for Space Data Systems (CCSDS), Washington, D.C., Nov. 2012, https://public.ccsds.org/Pubs/352x0b1.pdf [retrieved Nov. 2017].

84
BIOGRAPHICAL SKETCH
Tyler Michael Lovelly received the Bachelor of Science in Computer Engineering
in 2011, Master of Science in Electrical and Computer Engineering in 2013, and Doctor
of Philosophy in Electrical and Computer Engineering in 2017 from the University of
Florida. He completed internships with United Space Alliance at NASA Kennedy Space
Center as part of the Space Shuttle program in 2009 and 2010 and with the Air Force
Research Laboratory at Kirtland Air Force Base as part of the Space Electronics
Technology program from 2013 to 2016. He was a research group leader at the NSF
Center for High-Performance Reconfigurable Computing and the NSF Center for Space,
High-Performance, and Resilient Computing from 2012 to 2017 and a visiting scholar at
the University of Pittsburgh in 2017.