by OVERTON L. PARISH IV. B.S.M.E., M.S.M.E. IN DOCTOR OF ...
132
PREDICTION METHODOLOGY FOR THE HEAT REJECTION FROM TURBOCHARGED OR NATURALLY ASPIRED AUTOMOBILE ENGINES by OVERTON L. PARISH IV. B.S.M.E., M.S.M.E. A DISSERTATION IN MECHANICAL ENGINEERING Submitted to the Graduate Faculty of Texas Tech University in Partial Fulfilhnent of the Requirements for the Degree of DOCTOR OF PHILOSOPHY Approved Chairperson of the Committee —J * •• .. . St- • '• §^* ^-r f—=—^f • ™' ' ^ Accepted r^nr, If -. K-:^^„ Dean of the Graduate School May, 2003
Transcript of by OVERTON L. PARISH IV. B.S.M.E., M.S.M.E. IN DOCTOR OF ...
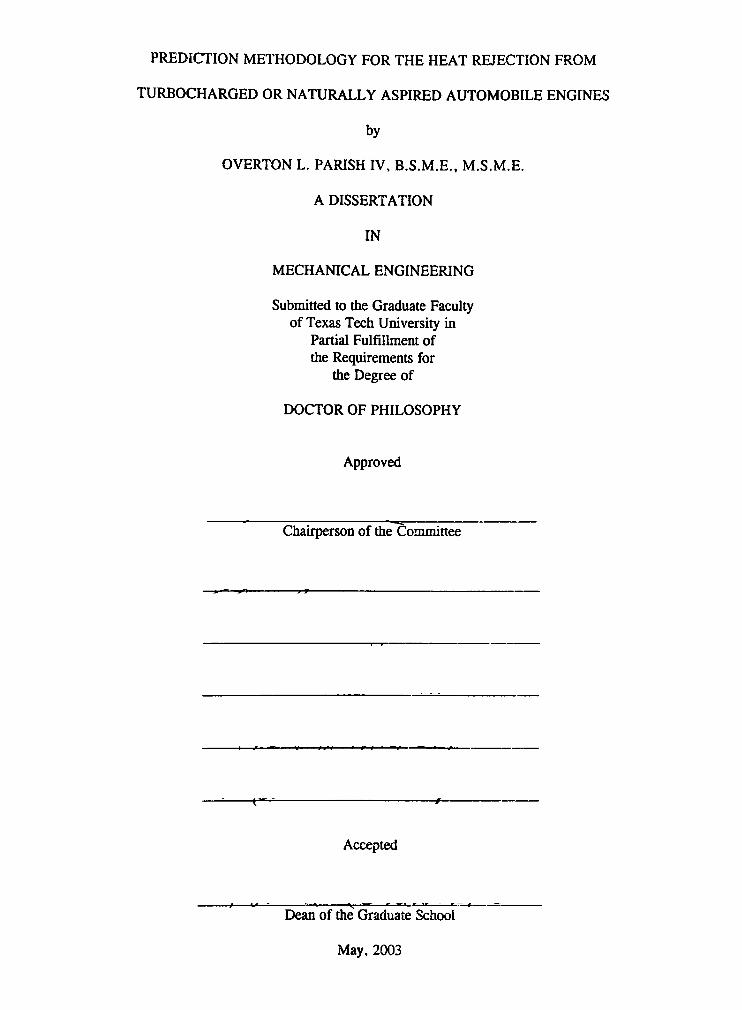
PREDICTION METHODOLOGY FOR THE HEAT REJECTION FROM
TURBOCHARGED OR NATURALLY ASPIRED AUTOMOBILE ENGINES
by
OVERTON L PARISH IV BSME MSME
A DISSERTATION
IN
MECHANICAL ENGINEERING
Submitted to the Graduate Faculty of Texas Tech University in
Partial Fulfilhnent of the Requirements for
the Degree of
DOCTOR OF PHILOSOPHY
Approved
Chairperson of the Committee
mdashJ bull bull St- bull bull sect^ ^ - r fmdash=mdash^f bull trade ^
Accepted
r ^n r I f - K - ^ ^ bdquo
Dean of the Graduate School
May 2003
ACKNOWLEDGMENTS
I thank the following for theh contributions to my dissertation Ford Motor
Company for theh generous support for automotive research at Texas Tech Universit
Jack Williams and Mark Burns of Ford Motor Company for theh insight into vehicle
engine and heat rejection systems Texas Tech University for their dedication to research
and the faculty the mechanical engineering department for theh support of graduate
research Dr Walter Oler for all the support help thoughtful insight and systematic
approach my doctorial committee for their support and creativit) contributmg to the
analysis and understanding of automotive engineering thermodjoiamic systems and heat
transfer ThermoTek Inc for employment flexibility support and experience
opportunities Heywood for the most comprehensive text on a specific subject that I have
ever seen Jeimifer Schmidt for her prompt and accurate editing our parentsmdashLiim and
Terry Parish and DNard and Beth Arthur~for all the support our kids Catherine and
Isabella Parish for being so patient and special and my bride Deidre Parish for her
compassion and love
11
TABLE OF CONTENTS
ACKNOWLEDGMENTS ii
ABSTRACT y
LIST OF FIGURES vi
LIST OF SYMBOLS ix
CHAPTER
I INTRODUCTION 1
II BACKGROUND AND LITERATURE SURVEY 3
21 Spark Ignition Engine 3
22 Turbocharging and Intercooling 12
23 Turbocharged Compression Ignition Engine 24
24 Heat Transfer 36
25 Computer Shnulation 47
26 Adiabatic Engine Research 53
27 Other Topics Relating to Diesel Engines
and Heat Rejection 61
IL METHODOLOGY 63
31 General Methodology to Approximate Enghie Heat Rejection 63
32 Naturally Aspired Spark Ignition Enghie Power Methodology 68
33 Naturally Asphed Spark Ignition Engine Heat Transfer Methodology 71
111
34 Turbocharged Compression Ignition Engine Power Methodology 76
35 Tvirbocharged Compression Ignition Enghie
Heat Transfer Methodology 81
TV RESULTS AND DISCUSSION 88
41 Naturally Aspired Spark Ignition Enghie Results and Discussion 90
42 Turbocharged Compression Ignition Engine
Results and Discussion 106
V CONCLUSIONS 115
REFERENCES 117
IV
ABSTRACT
The objective of this research is to accurately predict the heat rejection of
naturally aspired spark ignition (SI) engines and turbocharged compression ignition (CI)
engines This prediction method will be added to TTU-Cool a software package
developed at Texas Tech University for Ford Motor Company The objective of TTU-
Cool is to give the aerodynamics division at Ford a tool to predict with minimal up front
data the cooling performance of a proposed automotive cooling system The minimal
data includes the road load requirements as well as engine size and number of cylinders
Historically Ford has used a least squares fit of the above data to approximate the
heat rejection The proposed methodology replaces the approximation with a physics-
based approach to determining the heat rejection The thermal model significantly
expands the capabilities of TTU-Cool SI and CI engine data are analyzed and correlated
into a usefiil tool for new automobile concepts
LIST OF FIGURES
21 Modem Naturally Asphated Spark Ignition Enghie (Ford 2003) 4
22 Actual Normalized Pressure versus Volume Diagram for a Naturally Asphed Spark
Ignition Engine (Heywood 1988) 5
23 Pressures versus Specific Volume for the Ideal SI Engme Cycle (Cengel 1989) 6
24 Indicated Mean Effective Pressure versus Available Mean Effective Pressure 12
25 Garrett GT-15-25 Turbocharger (GT15-25 nd) 13
26 Thermodynamic Representation of a Turbocharger 14
27 Turbocharger AR Ratio from Merrion in Diesel Engine Design for the 1990s
(Merrion 1993) 17
28 Typical Compressor Performance Map (Brandstetter amp Dziggel 1982) 18
29 Typical Turbine Performance Map (Watson amp Janota 1982) 19
210 Altemative Turbme Map (Flynn 1979) 20
211 Diesel Engine (The new DELTA engine nd) 24
212 Schematic of Ideal Turbocharged CI Engine 27
213 State Diagram for Ideal Turbocharged CI Engine 27
214 Volumetric Efficiency versus Pressure Ratio for Ideal Turbocharged CI Engine 31
215 Indicated Mean Effective Pressure versus Available Mean Effective Pressure for Ideal Turbocharged CI Engine 32
216 Specific Turbocharger Works for Ideal Turbocharged CI Enghie 33
217 Air-fiiel Ratio versus Pressure Ratio for Ideal Turbocharged CI Engine 34
vi
218 Pressure Ratio versus Available Mean Effective Pressure for Turbocharged Ideal CI Engme 35
219 Indicated Mean Effective Pressure versus Available Mean Effective Pressure for Matched Ideal Tiu-bocharged CI Engme 36
220 Highly Simplified Diagram of a Typical Heat Rejection Test Setup 41
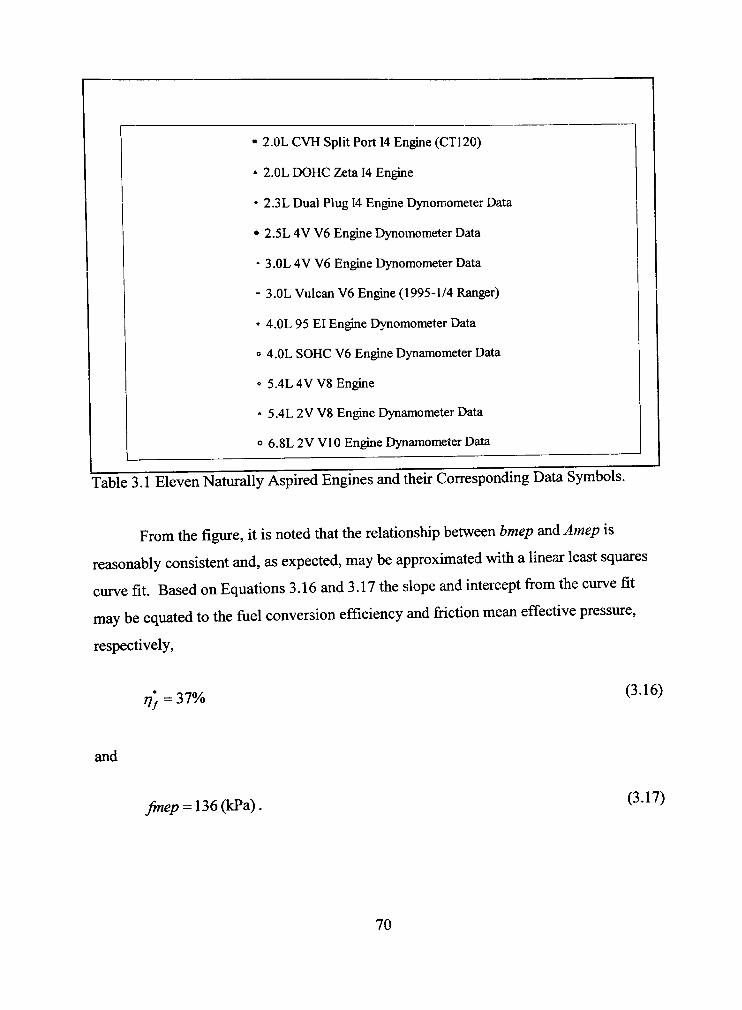
31 Brake Mean Effective Pressure versus Available Mean Effective Pressure for SI Engines 69
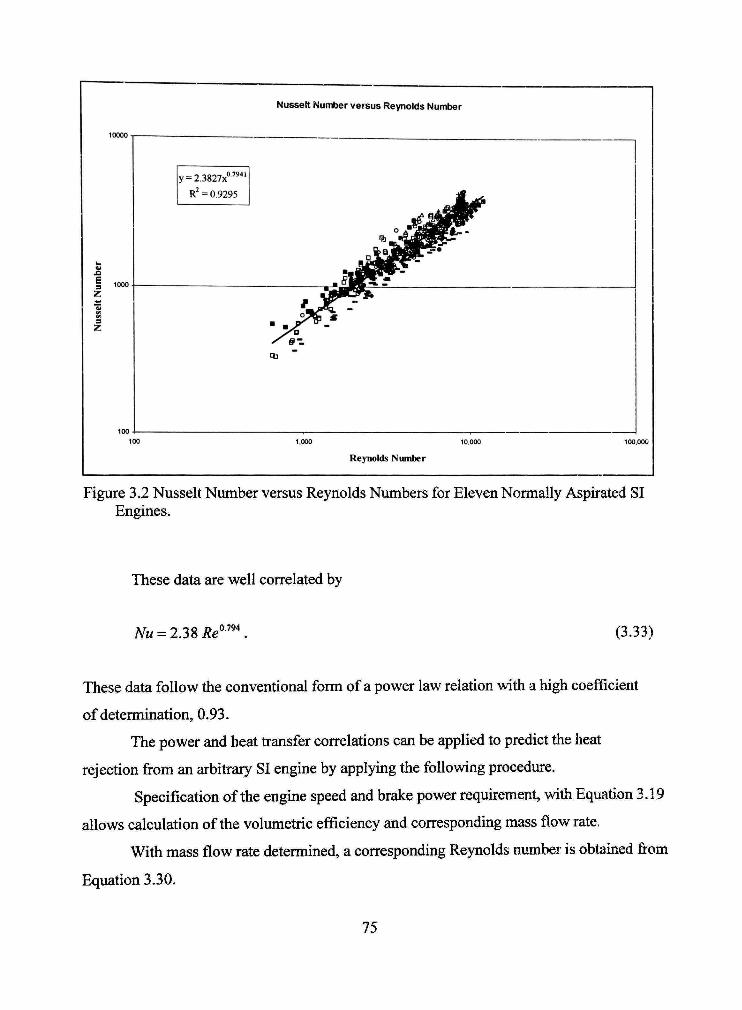
32 Nusseh Number versus Reynolds Numbers for Eleven Normally Asphated SI Engines 75
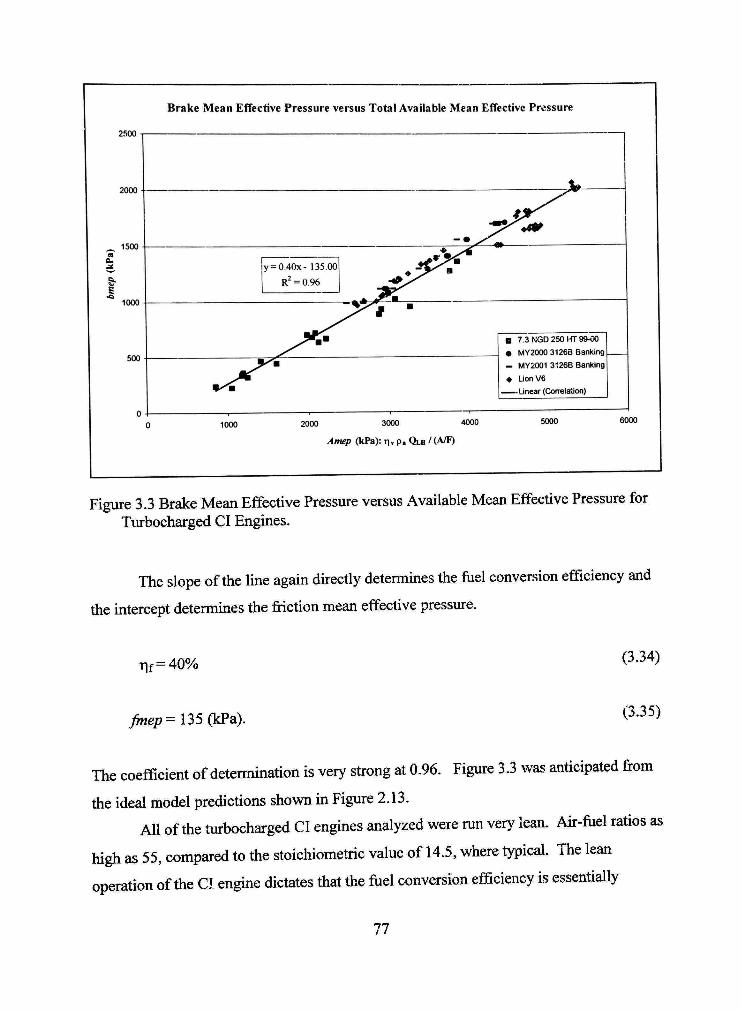
33 Brake Mean Effective Pressure versus Available Mean Effective Pressure for
Turbocharged CI Engines 77
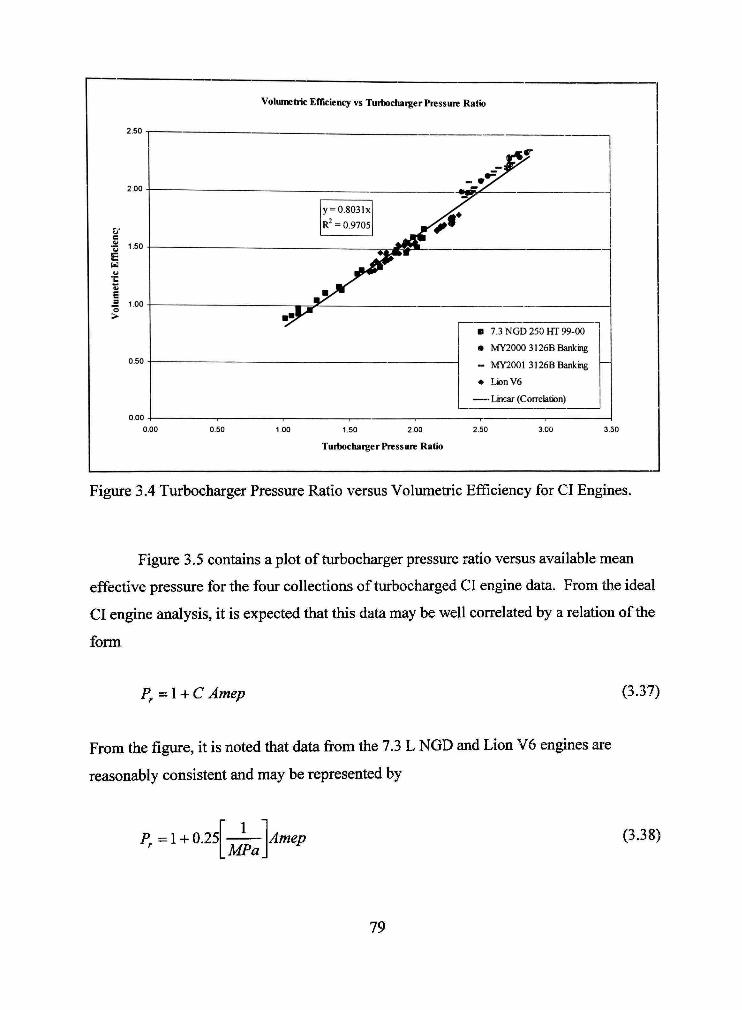
34 Turbocharger Pressure Ratio versus Volumetric Efficiency for CI Engines 79
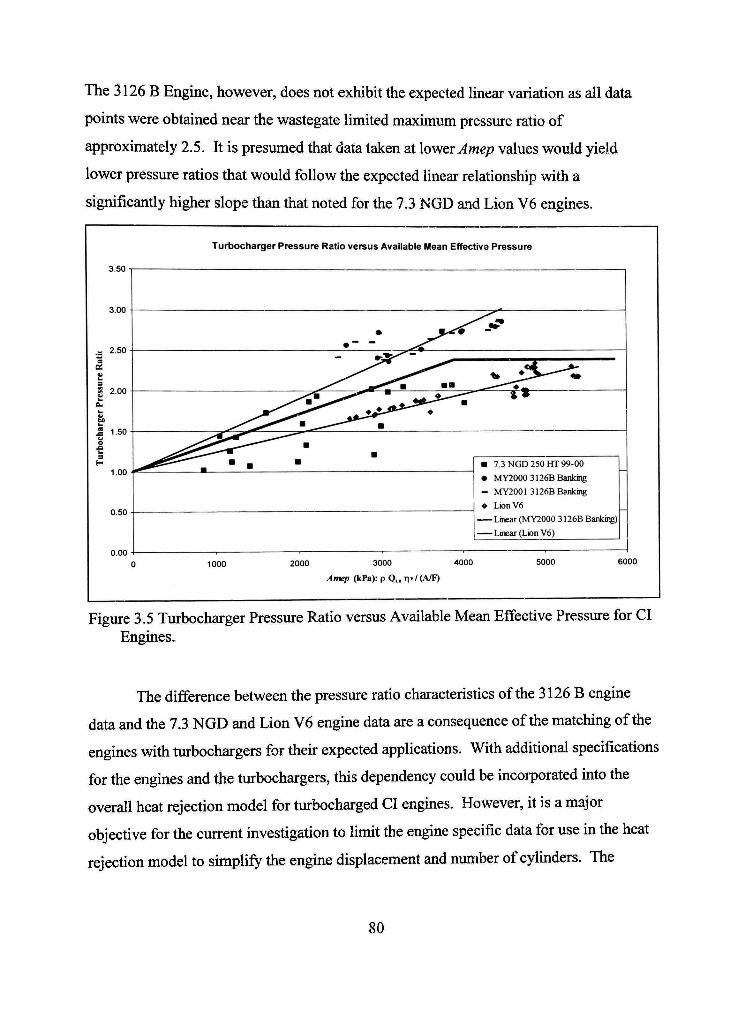
35 Turbocharger Pressure Ratio versus Available Mean Effective Pressure for CI
Engines 80
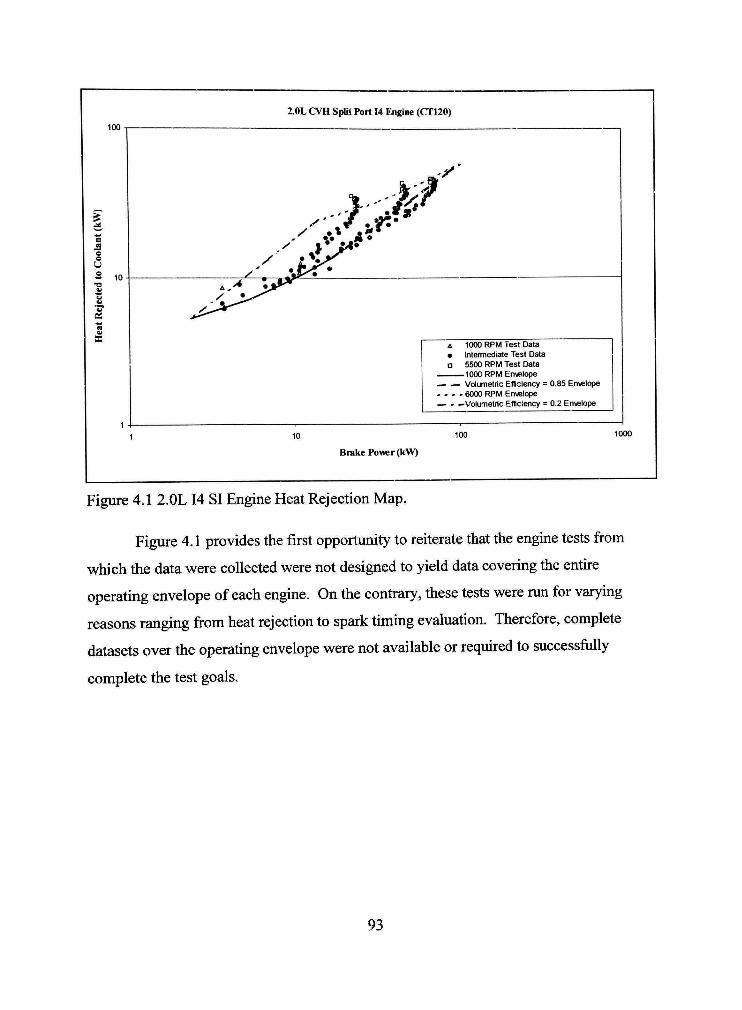
41 20L 14 SI Engine Heat Rejection Map 93
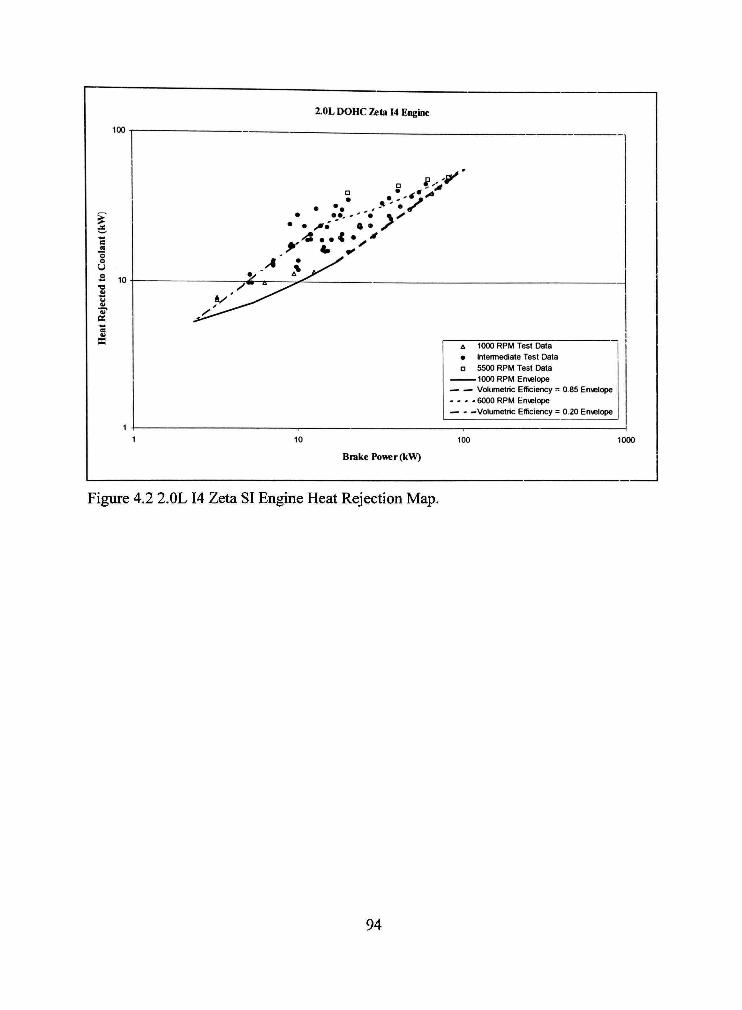
42 20L 14 Zeta SI Engine Heat Rejection Map 94
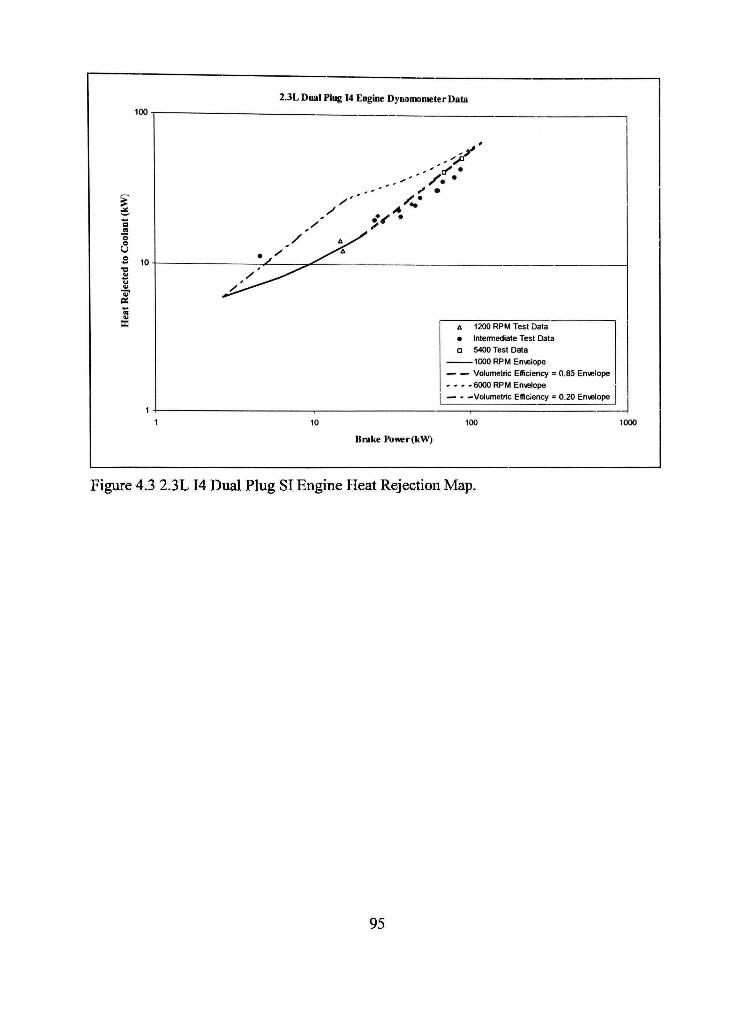
43 23L 14 Dual Plug SI Enghie Heat Rejection Map 95
44 25L V6 4V SI Engme Heat Rejection Map 96
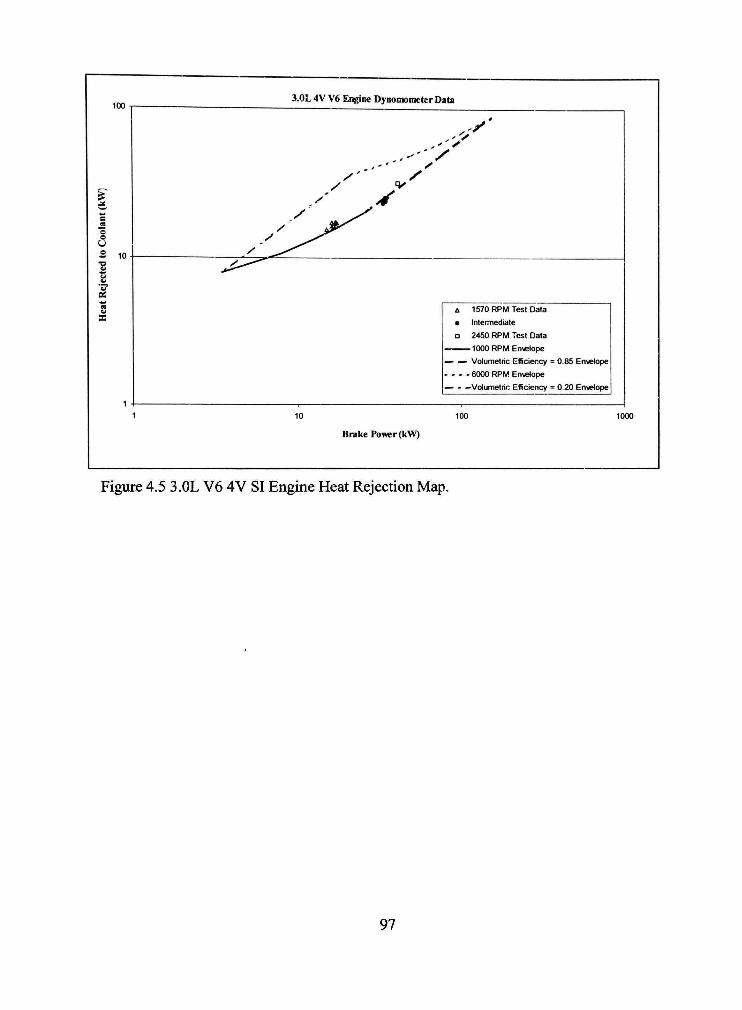
45 30L V6 4V SI Engme Heat Rejection Map 97
46 30L V6 Vulcan SI Engme Heat Rejection Map 98
47 40L EI 95 SI Enghie Heat Rejection Map 99
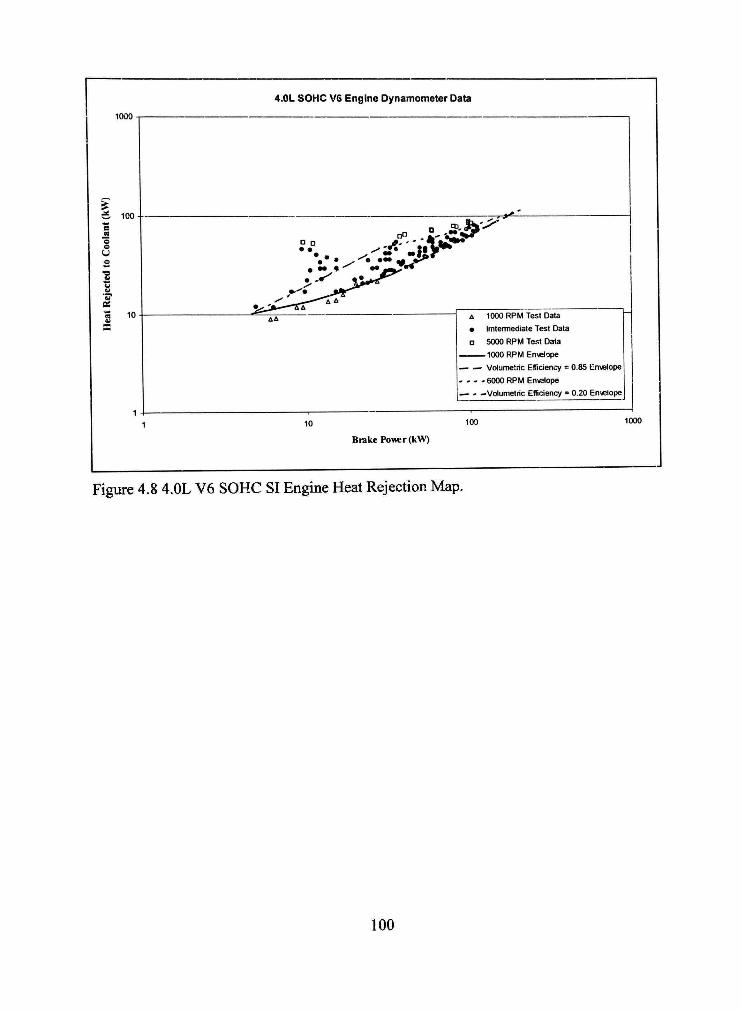
48 40L V6 SOHC SI Engme Heat Rejection Map 100
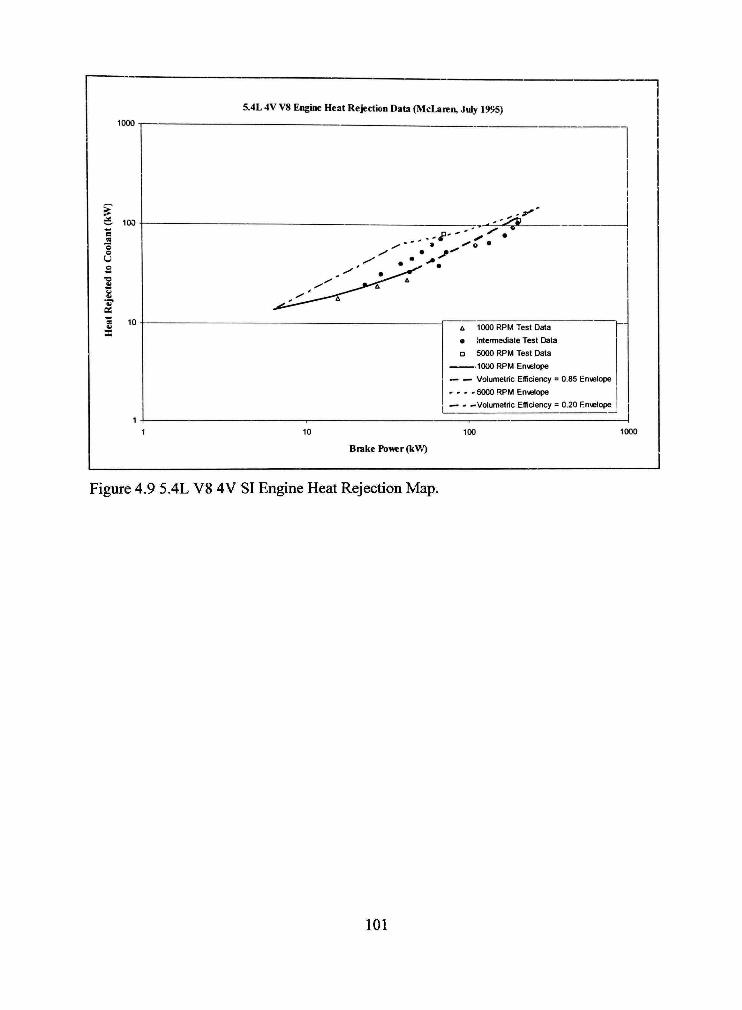
49 54L V8 4V SI Engme Heat Rejection Map 101 Vll
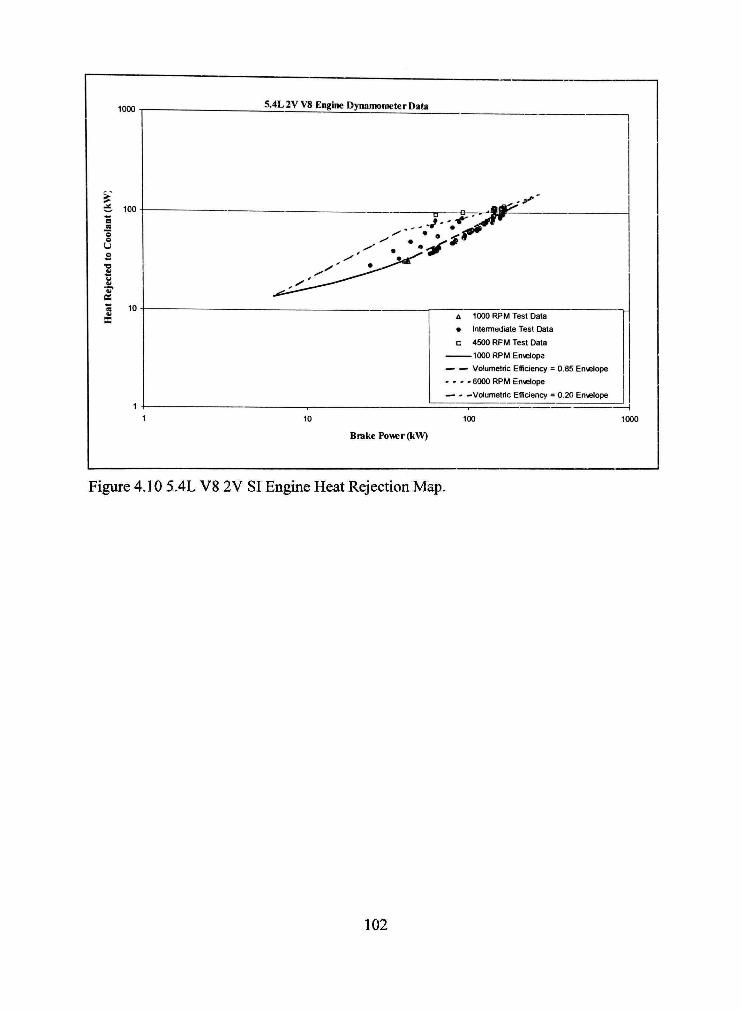
410 54L V8 2V SI Engine Heat Rejection Map 102
411 68L VIO 2V SI Engine Heat Rejection Map 103
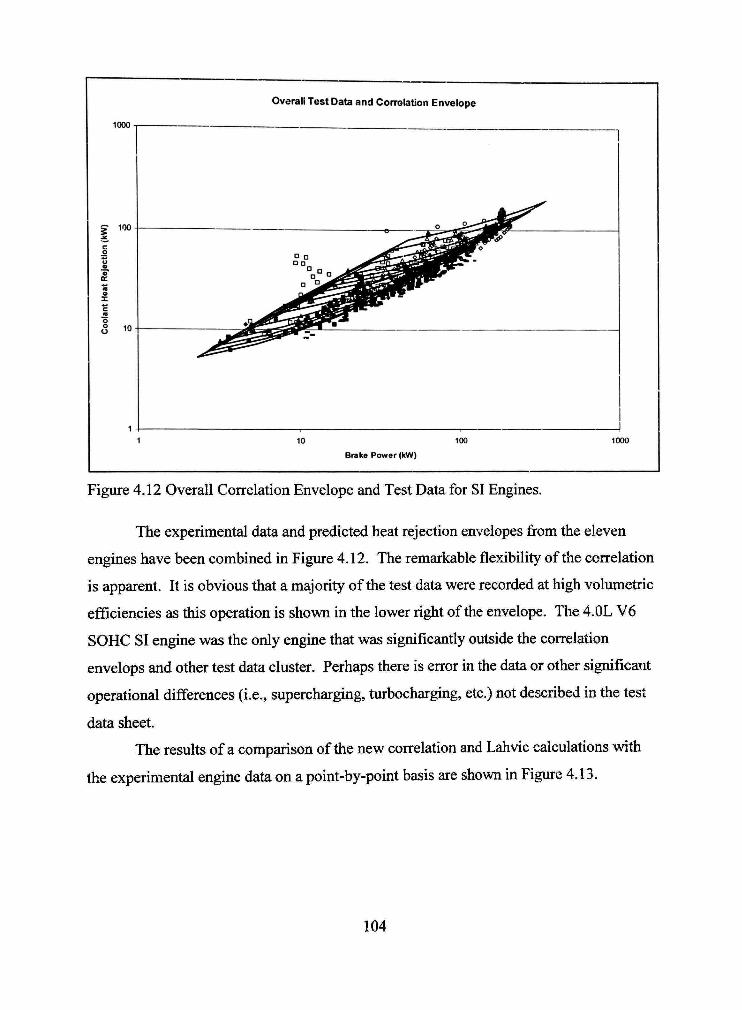
412 Overall Correlation Envelope and Test Data for SI Engmes 104
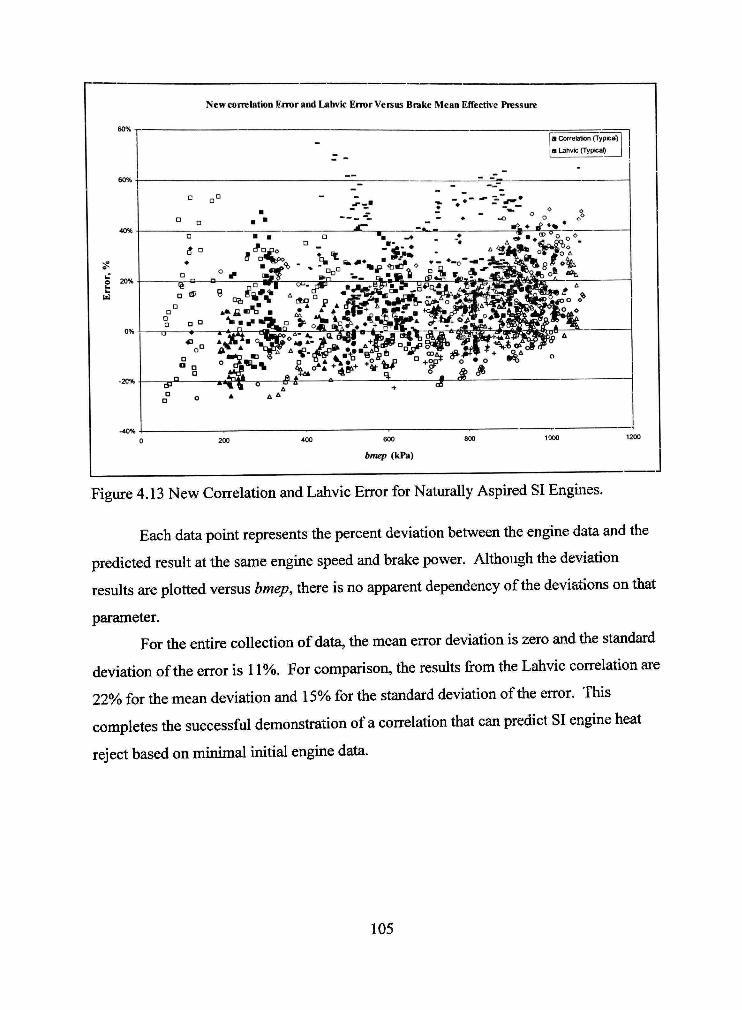
413 New Correlation and Lahvic Error for Naturally Aspired SI Engmes 105
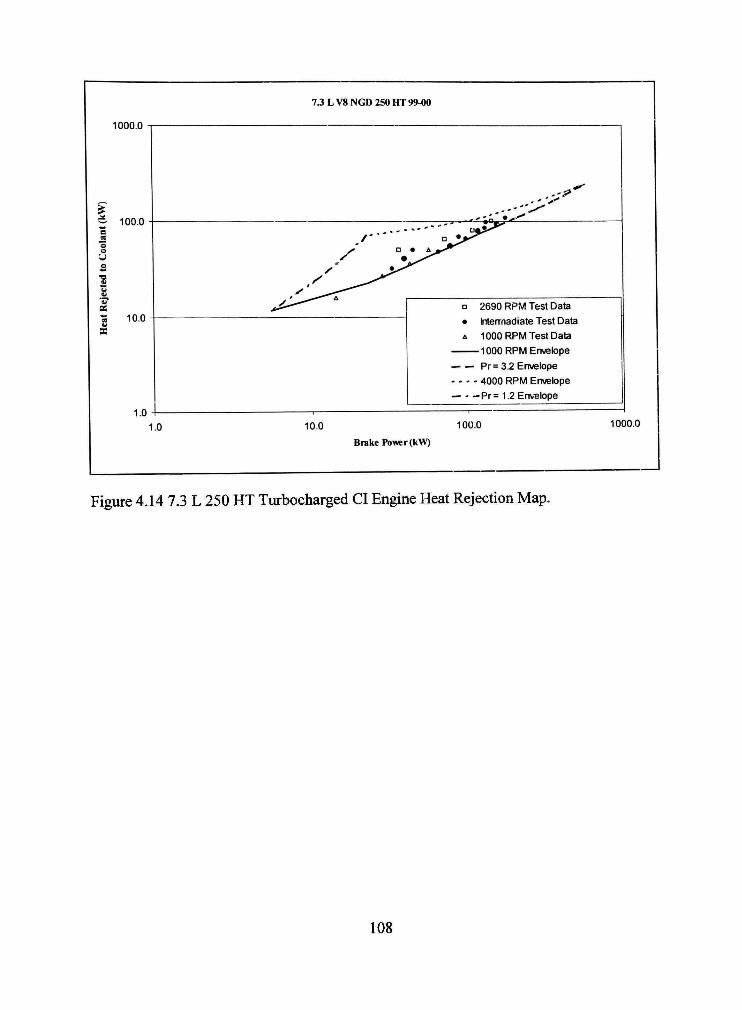
414 73 L 250 HT Turbocharged CI Enghie Heat Rejection Map 108
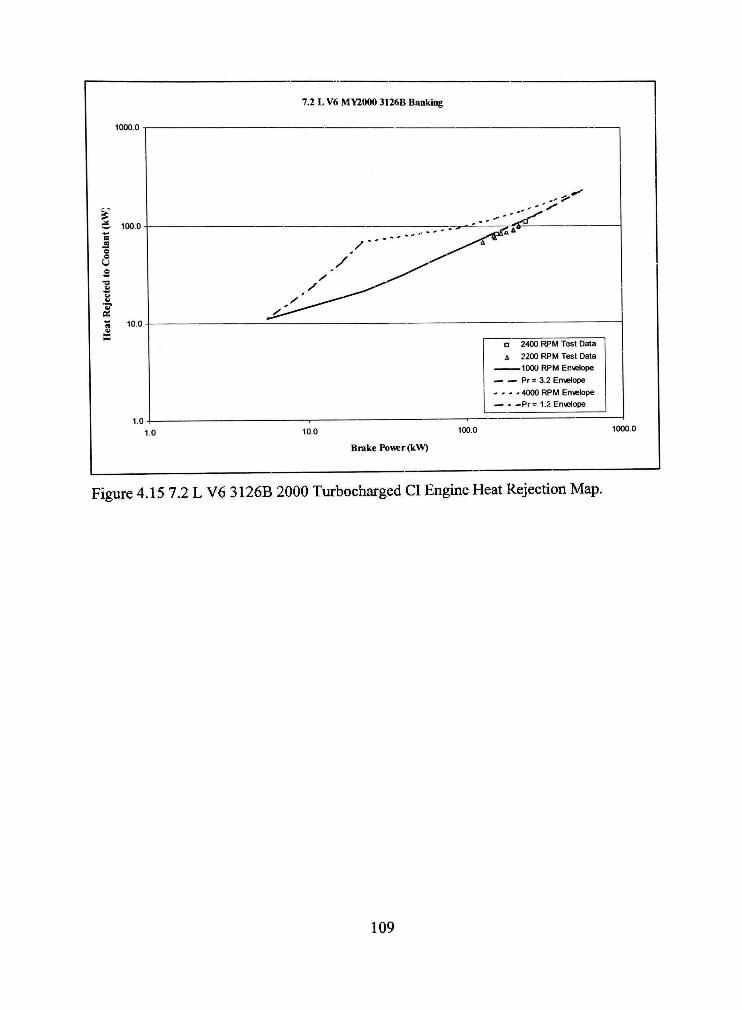
415 72 L V6 3126B 2000 Turbocharged CI Engme Heat Rejection Map 109
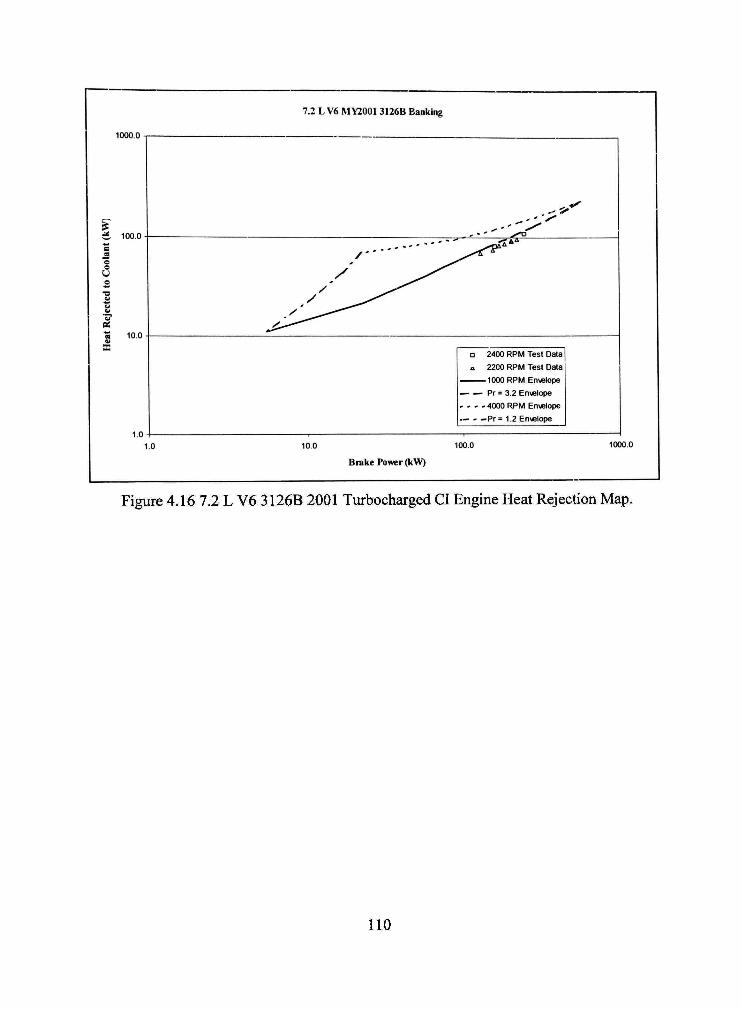
416 72 L V6 3126B 2001 Turbocharged CI Engme Heat Rejection Map 110
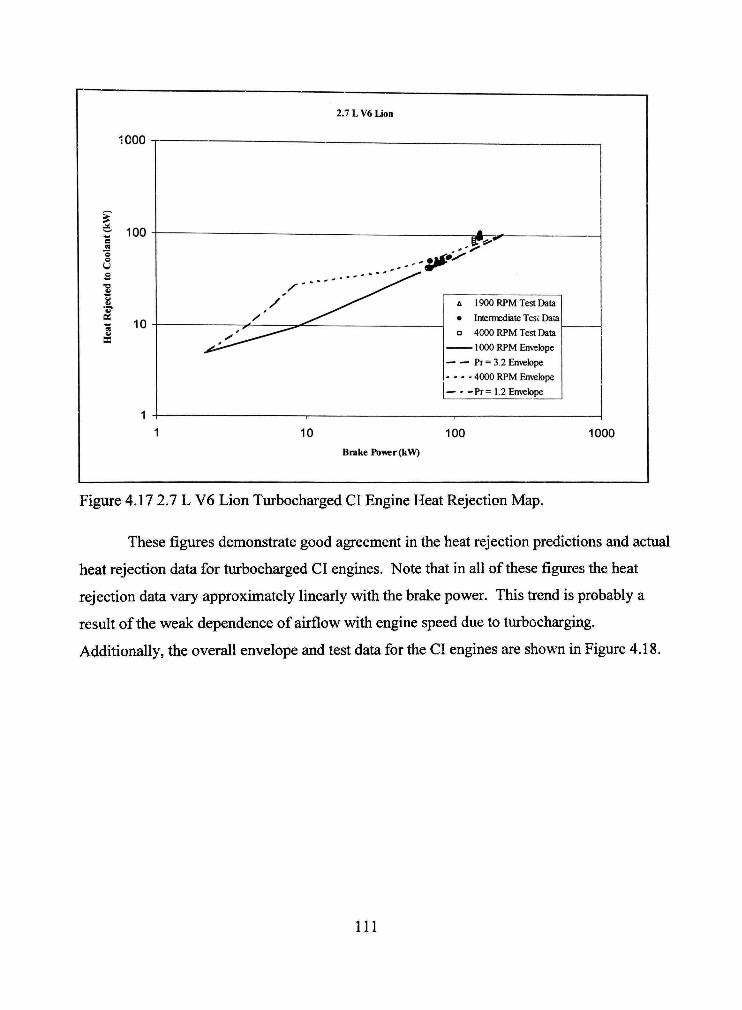
417 27 L V6 Lion Turbocharged CI Engme Heat Rejection Map I l l
418 OveraU CI Test Data and Correlation Envelope 112
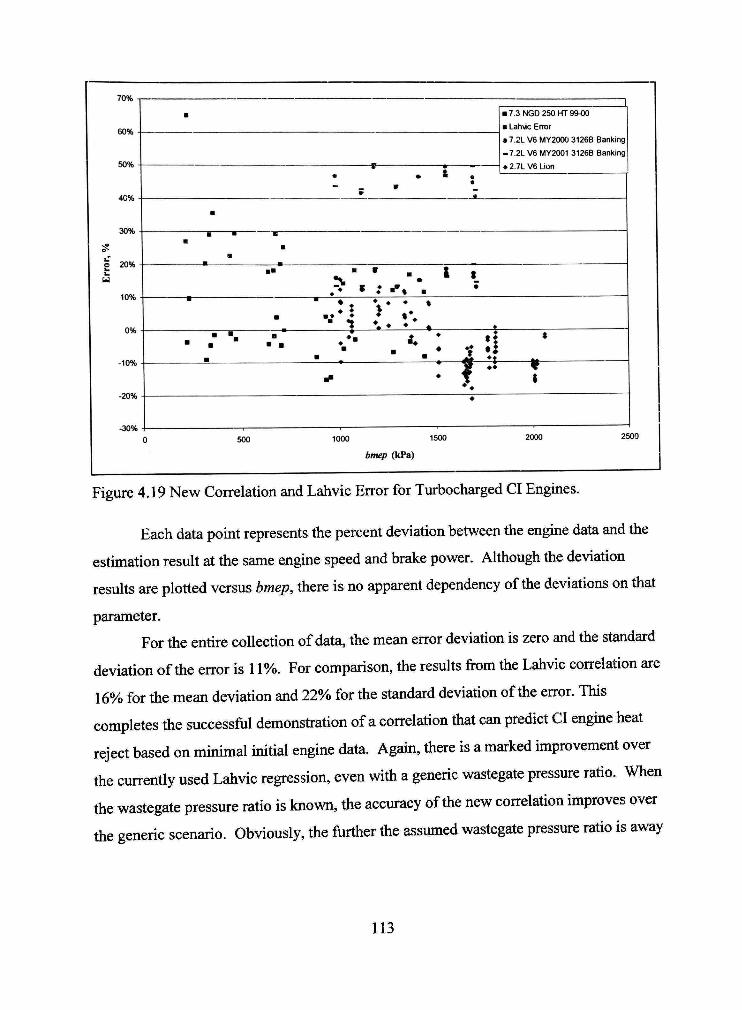
419 New Correlation and Lahvic Error for Turbocharged CI Engines 113
Vlll
LIST OF SYMBOLS
Alphabet
amep
A
bmep
B
C
D
frnep
F
H
imep
K
I
m
n
N
Nu
pmep
P
Pr
Q
ii
rfinep
R
Re
T
V
Auxiliaiy Mean Effective Pressure (kPa)
Area (m^) Air Mass (kga)
Brake Mean Effective Pressure (kPa)
Bore (m)
Specific Heat (kJkgK) Constant
Diameter (m)
Friction Mean Effective Pressure (kPa)
Fuel Mass (kgf)
Heat Transfer Coefficient (Wm^K)
Indicated Mean Effective Pressure (kPa)
Thermal Conductivity (WmK)
Length (m)
mass (kg)
Engine Speed (rpm)
Number
Nusselt Number
Pumping Mean Effective Pressure (kPa)
Pressure (kPa) Power (kW)
Prandtl Number
Heat (kJ)
Ratio
Rubbing Friction Mean Effective Pressure (kPa)
Ideal Gas Constant (kJkgK) Radius (m)
Reynolds Number
Temperature K
Velocity (ms) Volume (m^)
IX
w Greek Svmbols
Y
A
8
11 -copy
-
^
P
a
u
Subscripts
1-7
a
b
c
compressor
cyl
coolant
D
e
f
g
in
LH
Net
0
out
Work (kJ)
Ratio of Specific Heats
Change
Heat Exchanger Effectiveness
Efficiency
Fuel Equivalence Ratio
Viscosity (NsW)
Density (kgm )
Stefan-Boltzman Constant for Radiation
Specific Volume (m^kg)
Stations of Thermodynamic Cycle
Air Actual Adiabatic
Brake
Compression coolant
Compressor
Cylinder
Coolant
Displacement
Combusted Gas of Ah and Fuel
Fuel Flame
Combustion gas
Flows Into a System
Lower Heating Value
Net
Ambient Stagnant Conditions
Flows Out of a System
p
r
ref
rf
s
V
w
Superscripts
-
Pressure Prime Mover
Radiation Ratio
Reference
Rubbing Friction
Stoichiometric
Volume
Wall
Average
Stoichiometric
XI
CHAPTER I
INTRODUCTION
Proper design of the vehicle coolmg system requires accurate knowledge of the
engine heat rejected to coolant Unfortunately tiiis data is frequentiy unavailable during
tiie early stages of vehicle design as there is often no engine hardware available for
experimental testmg This problem is exacerbated under the shrinking duration of the
design cycle which dictates that a calibrated power fram will not be available until she
months before the first prototypes are to be completed on any given program Analytical
tools are needed to close this gap and provide the necessary information The current
method the Lahvic regression m Fords CVSP (Corporate Vehicle Shnulation Program)
is known to overesthnate the thermal loads (Lahvic 1986) A new model is necessary to
more accurately and completely estimate heat rejection from both naturally asphed spark
ignition (SI) and turbocharged compression ignition (CI) engmes
The goal therefore of this new physics-based methodology is to estimate coolant
heat rejection for an arbitrary naturally asphated gasolhie and turbocharged Diesel
engine with reasonable accuracy This method is based on dynamometer tests of 11
naturally asphed gasoline Ford engines (4 6 and 8 cylinders 20L through 68L
displacements) and four turbocharged Diesel Ford engines (6 and 8 cylinders 27L
through 73L displacements) However if experimental data is available for a specific
engine the correlation coefficients in the model can be explicitly optimized for the given
engine In that case the correlation accuracy is within the uncertainty of the
experimental data
The target users for this methodology are cooling system designers who requhe
knowledge of engine heat rejection to coolant to properly size radiators fans and vehicle
front-end openings It allows design engineers to conduct upfront robustness studies of
the cooling system and analytical mvestigations into target setting The method can also
be used to improve confidence in CAE modeling of front-end geometry and increase
productivity of experimental testing of vehicle cooling systems
The naturally asphed spark ignition engine heat rejection method is available in
an Excel workbook called ttiiHeat Turbocharged CI engme heat rejection method will
be incorporated into this workbook in the near fiiture By default heat rejection
predictions for the SI engines utilize the standard correlation coefficients based on the
data from the 11 engines Optionally the user can generate a unique correlation for a
specific engme Plots of a heat rejection map power and heat transfer correlation results
and a correlation error summary support the calculations Also included in ttu_Heat is a
worksheet to facilitate unit conversions from dynamometer data files to the SI data
needed for the correlation All of the calculation worksheets are protected except for the
user data entry areas The workbook as a whole is not protected which allows users to
collect calculation results and build additional worksheets and plots to meet individual
needs
In addition to the above-mentioned Excel worksheet this prediction method will
be added to TTU-Cool a software package developed at Texas Tech University for Ford
Motor Company The objective of TTU-Cool is to give the aerodynamics division at
Ford a tool to predict the cooling requhements of a proposed automotive configuration
with minimal data The minimal data includes the road load requhements enghie size
and number of cylinders
The Diesel engine has several imusual additional features that must be included
m the analysis These additional features include the stronger presence of radiation due
to elevated temperatures as compared to the gasolme cycle and the addition of a
turbocharger (Heywood 1988)
The addition of the physics-based method for estimatmg engine heat rejection for
both naturally asphed SI and Diesel CI engines will significantly expand the capabilities
of ITU-Cool and has been requested by Ford Motor Company SI and CI engme data
were analyzed and correlated hito a useful tool for new automobile concepts
CHAPTER II
BACKGROUND AND LITERATURE SURVEY
In the current chapter the background and basic information for naturally asphed
spark ignition (SI) engmes and turbocharged compression ignition (CI) engines are
discussed The literature survey reveals several major areas relevant to heat transfer from
automotive engmes Turbocharging and mtercoolmg automotive heat transfer computer
simulations for the automotive performance prediction and adiabatic engine
performance are all mcluded m tiie literature review By far most of the recent research
for the compression ignition engmes has been in the area of adiabatic enghie
performance Adiabatic engine literature is relevant to the current research because
turbochargmg is an hnportant accessory m adiabatic engmes Additionally the area of
pollution research for CI Diesel engmes is huge Although there is a large amount of
recent literature concerning the reduction of pollutants from SI and CI engines the topic
is not critically related to the current research objectives and will only be briefly
summarized herein
Internal combustion engines capture energy released by combustion of
hydrocarbon based fiiel and ah mixture reactants The mam products of combustion are
the heat of combustion nitrogen carbon dioxide and water Other products are tpically
considered pollutants and include partially or unbumed fuel carbon monoxide nitric
oxide nifrogen dioxide and particles The heat of combustion is the primary variable
needed from the combustion process For octane the heat of combustion is 44000 kJkg
which is the lower heating value of the fuel For Diesel fiiel the heat of combustion is
43000 kJkg which again is the lower heating value of the fuel
21 Spark Ignition Engine
Nikolaus Otto invented the spark ignition (SI) enghie in 1876 Figure 21 is a
photograph of a modem SI engine
Figure 21 Modem Naturally Asphated Spark Igiution Enghie (Ford 2003)
Since its infroduction the SI engine has become the most widely used prime
mover in the automotive industry The SI engine is a four-stroke engine The term four-
sfroke relates to the cycle that the engine must traverse These four strokes of the piston
are the intake compression combustion and exhaust Each of these processes occurs
only once every other rotation of the engine crankshaft Altematively the power output
from a given cylinder only occurs every other rotation
The experimentally evaluated variation of cylmder pressure with respect to
cylinder volume for a four-stroke SI engine (Heywood 1988) is illustrated in Figure 22
Figure 22 Actual Normalized Pressure versus Volume Diagram for a Naturally Asphed Spark Igiution Enghie (Heywood 1988)
The lower portion of Figure 22 shows tiie intake and exhaust portion of the cycle
The actual process shown m Figure 22 followed by tiie ah and fiiel within tiie cylmder
is modeled with a closed system following the ideal Otto cycle as illusfi-ated m Figure
23
p bull
TT 11 w
(2)
fl)
it AIK
T gt
(2)-lt3gt
(4)-a)
TDC BDC LOUlplCJIlOll ll=CI)Mt
iMStiuiillUon bdltraplc expumlo
ii^consl heaxttfOoa
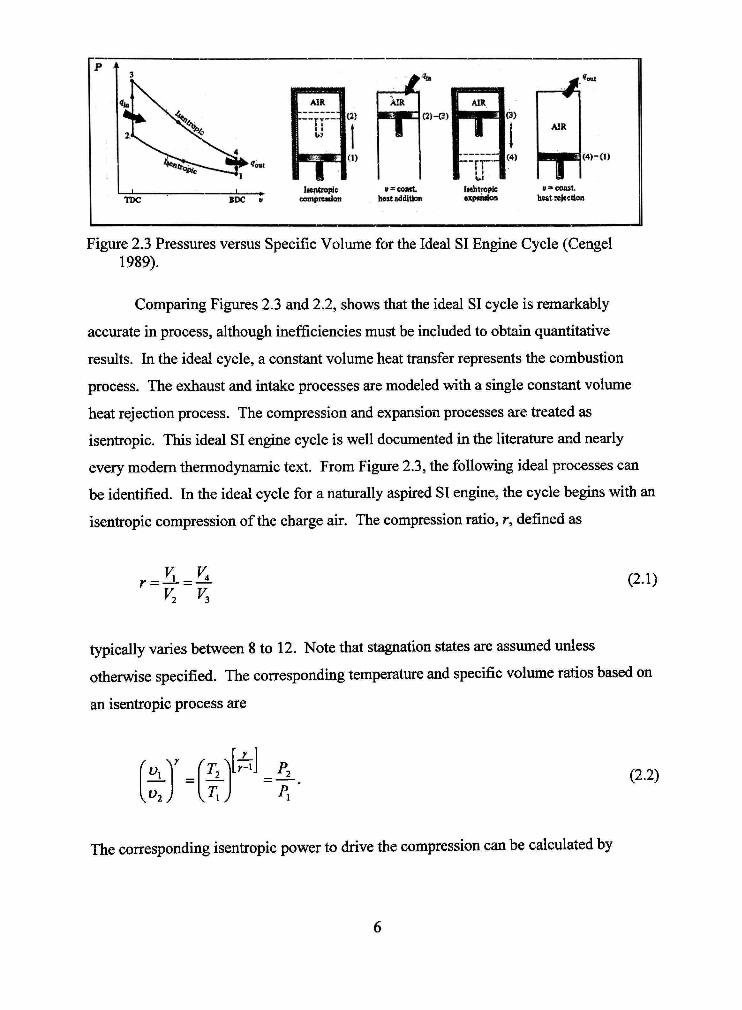
Figure 23 Pressures versus Specific Volume for the Ideal SI Engine Cycle (Cengel 1989)
Comparing Figures 23 and 22 shows that the ideal SI cycle is remarkably
accurate in process although inefficiencies must be included to obtain quantitative
results In the ideal cycle a constant volume heat transfer represents the combustion
process The exhaust and intake processes are modeled with a single constant volume
heat rejection process The compression and expansion processes are treated as
isentropic This ideal SI engine cycle is well documented in the literature and nearly
every modem thermodynamic text From Figure 23 the following ideal processes can
be identified In the ideal cycle for a naturally asphed SI engine the cycle begins with an
isentropic compression of the charge air The compression ratio r defined as
V2 V (21)
typically varies between 8 to 12 Note that stagnation states are assumed unless
otherwise specified The correspondmg temperature and specific volume ratios based on
an isenfropic process are
^ u V
^iJ P (22)
The correspondmg isentropic power to drive the compression can be calculated by
-KM=rhcJr--l) (23)
The heat mput from tiie fuel combustion occurs between States 2 and 3 In the ideal
cycle tiie combustion occurs at constant specific volume SI engmes are designed to
have an ah-fiiel ratio very close to the ideal stoichiometiic value of 146 Using the first
law of tiiermodynamics the temperattire at State 3 can be calculated
r = r-h QML
c ^7- (24)
The ideal gas law and the ah cycle standard can then be used to calculate the pressure at
State 3
^ 3 = ^ ^ (25)
From States 3 to 4 the power to drive the compression and the net output power are
found ushig isentropic expansion relations The specific volume at State 4 is the same as
the startmg specific volume at State 1
V4=v (26)
With the assumption of an isenfropic expansion the temperatuie and pressure at State 4
f ^ f 3
V^4
te] (27)
The power output from States 3 to 4 are calculated using the first law of
thermodynamics as
^pou =
V F) cM-T) (28)
The net power is the difference between the expansion and the compression power as
defined m Equation 28 and 23 respectively
The net power thus defined is referred to as the indicated power or the power
indicated by the integral Qp dVfor the complete cycle m one cylinder The brake
power is the power available at the output shaft of the engine The brake power is
reduced from the indicated power by fiictional losses within the engine pumphig losses
in the induction and exhaust systems and by the accessory power requhements such as
the fuel oil and water pumps and the altemator The net of these losses or the difference
between the indicated and brake power is defined as the fiictional power
The thermal efficiency for a work producing cycle is
7 =5^- (2-9)
Referring to Figure 23 the thermal efficiency can be expanded to
7
bdquo 34- 12 rnCMn-T)-T-Tj T - 1
HT- (210)
For the isenfropic compression and expansion processes between the same minimum and
maximum volumes
ZL = I i = K- (211) T T 4
where r is defined m Equation 21 Additionally from tiie ideal cycle the following can
be shown
T T
y = f- (212)
Substittiting Equations 211 and 212 mto Equation 210 yields
^tgt=^-^- (213)
Thus it is apparent that the maximum thermal efficiency for the ideal Otto cycle is a
fimction of only the compression ratio and the ratio of the specific heats for the ah-fuel
mixture For typical SI engines compression ratios are generally between 8 and 12
Taking the ratio of specific heats at 13 as a representative average for the combusted ah-
fuel mixture yields maximum thermal efficiencies of 05 to 06 with the higher efficiency
occurring at the highest compression ratio
Utilization of compression ratios above 12 results in premature ignition of the ah-
fiiel mixture at the high temperatures and pressures at the end of the compression sfroke
This behavior commonly known as engine knock results in unacceptable damage to
the engine and therefore places an upper limit on the usefiil compression ratio
The ah induction rate is quantified in terms of the volumetric efficiency which is
the ratio of the ahflow rate to the enghie volume displacement rate
Tjy= y (210)
The volumetric efficiency is a non-dimensional expression of the mass flow rate through
the engme and is dhectly dependent on throttle position
Assummg 100 fuel combustion the fuel conversion efficiency
w (214)
is equivalent to tiie thermal efficiency witii the same dependence on compression ratio
and specific heat ratio The net power output from an engme is equal to the net work
output from a single cycle times the rate of work producmg cycles ie
n n n Pne=-Ke=^VffnfQuf (215)
The fuel mass per cycle may be written as
(216)
Substituting Equation 216 into Equation 215
Pne=^ ipylti
F J Q LH (217)
After normalizing the indicated power by dividing by engine speed and volume the
indicated mean effective pressure is defined as
^v F (218)
The imep is the pressure requhed in a constant pressure expansion of the displaced
volume to produce the same net work as the ideal cycle The practical significance of the
10
imep is that h provides a normalized measure of enghie power for which the effects of
engine displacement and speed are removed
In tiie application of Equation 218 to SI engines rj^p^and Qjjj are effectively
constants determined by the engine compression ratio and the air-fuel properties
Furthermore the air-fiiel ratio is maintained at approximately the stoichiometric value of
146
The variable element in Equation 218 or the mechamsm for power confrol of a SI
enghie is the volumetric efficiency Its value is determined by the fixed and variable
elements of the air induction system The fixed elements include the ah induction system
while the prmciple variable element is the operator confroUed throttle plate Typical
values for volumetric efficiency are 02 (throttle closed) to 085 (throttle wide open)
From another perspective
^ (219) F
is effectively a non-dimensional characterization of the fuel flow rate The product of
that quotient with the lower heating vjdue of the fuel gives an indication of the available
fuel energy and is defined poundis the available mean effective pressure
Amep = ^^P^^ (220)
and
imep = Tjf Amep (221)
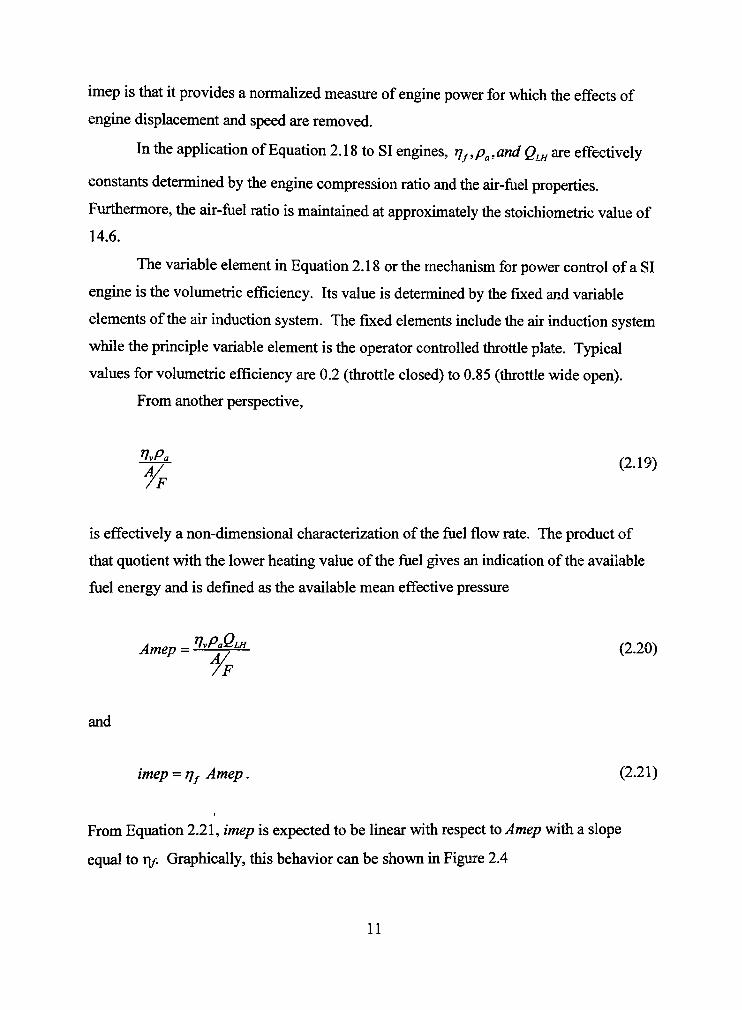
From Equation 221 imep is expected to be linear with respect to Amep with a slope
equal to x] Graphically this behavior can be shown in Figure 24
11
SI Indicated Mean effective Pressure vs Volumetric Efficiency
^y^ 11 bull bull ^ ^ 1 slope IS tif
^ ^
^ ^ ^
1
(00) Available Mean Effective Pressore - ii p QLH AF (kPa)
Figure 24 Indicated Mean Effective Pressure versus Available Mean Effective Pressure
This behavior is demonsfrated with actual engine data m the next chapter As
mentioned previously the maximum volumetric efficiency in a naturally asphed SI
engine is approxhnately 085 This limit effectively puts an upper bound on the hnep and
the power output for a given enghie at a particular speed However this limit can be
exceeded by mechanically compressmg the cylinder ah-fuel charge through
supercharging or turbocharging
22 Turbochargmg and Intercooling
The difference between superchargmg and turbochargmg is the power source for
the enghie mflow compressor The engme crankshaft drives superchargers whereas
turbochargers utilize a turbine m tiie hot exhaust sfream to provide the necessary power
There is a limh to tiie power mcrease achieved by turbocharging or supercharghig By
compressing the air-fuel charge to the cylinder tiiere is higher pressure and temperature
12
at the beginning and end of the compression sfroke Inflow compression ratios must be
limited to avoid premature ignition or knock in the SI engine The problem is somewhat
alleviated by providing charge air-cooling between the compressor and the intake
manifold with an intercooler Intercoolers are ah-to-ah or ah-to-coolant heat
exchangers A turbocharger is more commonly used with the compression ignition (CI)
engine The CI engine is discussed in detail in the next section Figure 25 is a picture of
a modem turbocharger
Figure 25 Garrett GT-15-25 Turbocharger (GT15-25 nd)
Merrion (1993) provides msight into the turbochargmg process The process
consists of compressmg tiie mtake ah to an mtemal combustion enghie utilizmg the
energy in the exhaust gas sfream to run a turbine that is dhectiy connected to the
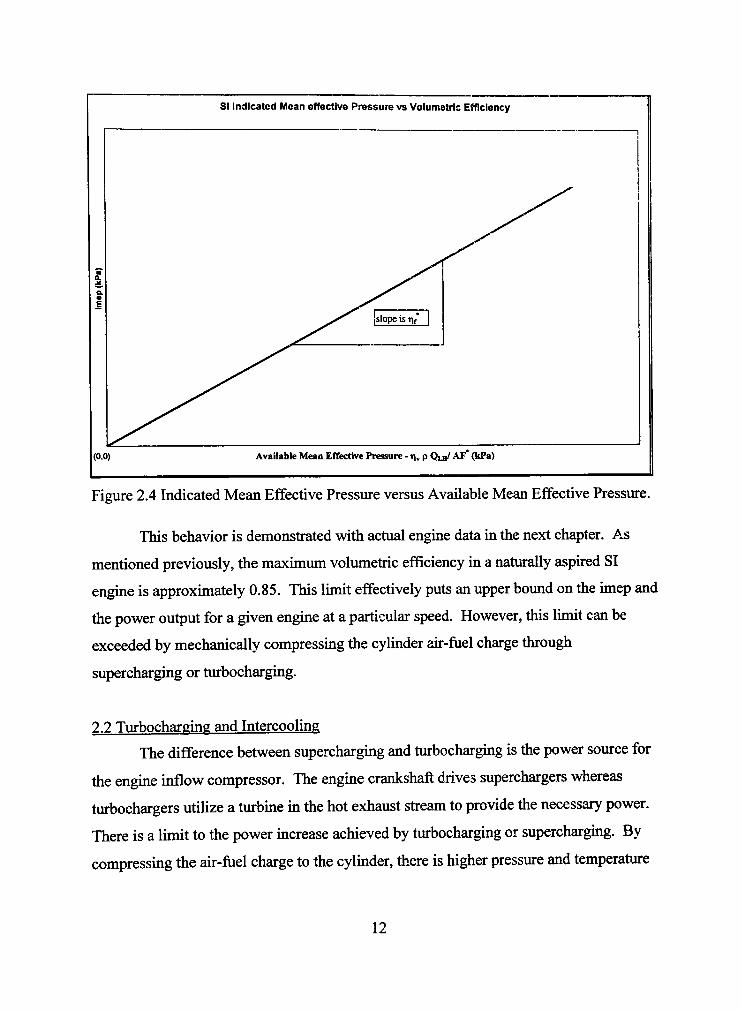
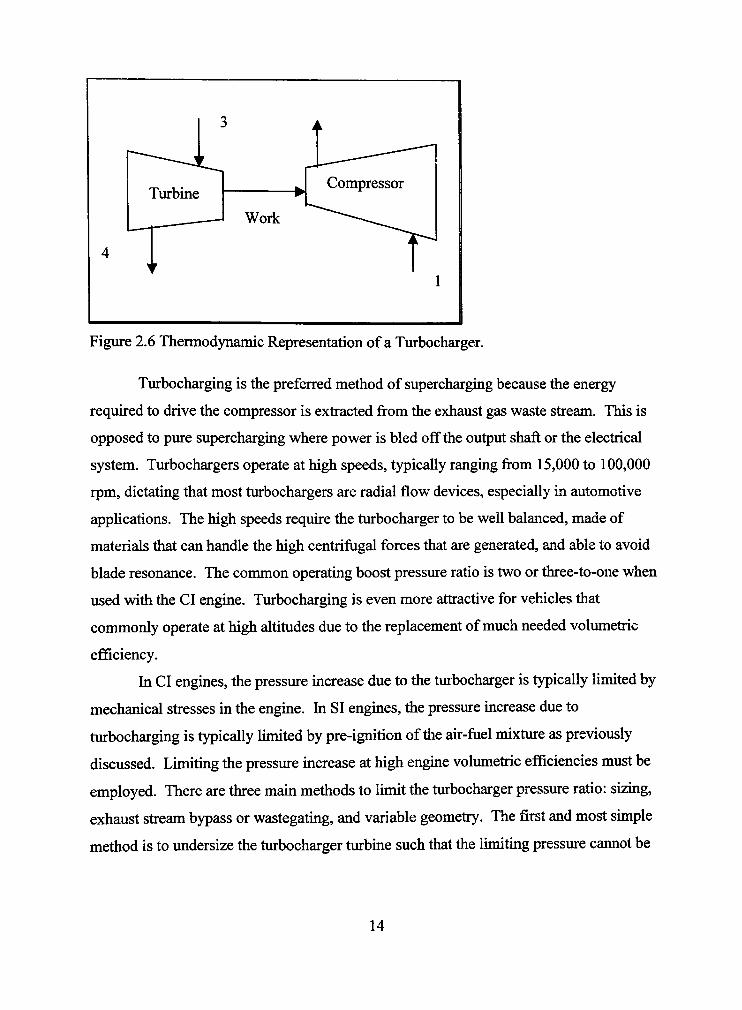
compressor feedmg ah mto tiie enghie The schematic shown m Figure 26 is a physical
and thermodynamic sketch of a turbocharger
13
TEXAS TECH LIBRARY
3 A
-^---J^^^
Turbine h
w Compressor
Work ^^^--^^ ^^
4 T
1
Figure 26 Thermodynamic Representation of a Turbocharger
Turbocharging is the preferred method of supercharging because the energy
requhed to drive the compressor is exfracted from the exhaust gas waste sfream This is
opposed to pvu-e supercharging where power is bled off the output shaft or the electrical
system Turbochargers operate at high speeds typically rangmg from 15000 to 100000
rpm dictating that most turbochargers are radial flow devices especially in automotive
applications The high speeds requhe the turbocharger to be well balanced made of
materials that can handle the high centrifugal forces that are generated and able to avoid
blade resonance The common operating boost pressure ratio is two or three-to-one when
used with the CI engine Turbocharging is even more atfractive for vehicles that
commonly operate at high altitudes due to the replacement of much needed volumetric
efficiency
In CI engines the pressure mcrease due to tiie tiirbocharger is typically limited by
mechanical sfresses in the enghie In SI engmes the pressure increase due to
turbocharging is typically Ihnited by pre-ignition of tiie ah-fiiel mixture as previously
discussed Lhniting the pressure mcrease at high enghie volumetiic efficiencies must be
employed There are three mam metiiods to limit tiie turbocharger pressure ratio sizmg
exhaust stream bypass or wastegatmg and variable geometry llie first and most shnple
method is to vmdersize the turbocharger turbhie such that tiie limithig pressure cannot be
14
reached The drawback to this method is tiiat the boost at nominal drivmg conditions is
mirumal and insignificant
The next level m over-boost protection is wastegating which is currentiy tiie most
common method It is hnplemented by bypassing some of the exhaust gas arovmd the
turbhie to limit the power supplied to the compressor Wastegatmg increases the
complexity of the turbocharger and does not utilize all of the energy available from the
exhaust gasses The most efficient and complicated method of over-boost protection is
variable geometry turbochargers These typically consist of varymg either the nozzle or
the vanes of the turbine
Merrion (1993) describes two distinct philosophies in the design of
turbochargers Constant pressure turbochargers use the exhaust maiufold to absorb blow-
down pressure pulses By absorbing these pulses the flow is constant Therefore
constant pressure turbochargers are more conducive to high turbhie efficiencies There
is however a relatively high backpressure on the engine requiring additional exhaust
pumping during the exhaust sfroke Pulsed flow turbochargers represent the second
philosophy in turbocharger design They use the kinetic energy of pulses from the
cylhiders The non-uiuform flow and pressure reduces turbine efficiency However with
a properly designed system reduced efficiency in the turbine can be offset by lower
backpressure on the engine This type of design uses divided turbine housings to take
advantage of individual cylinder pulses thereby increasing the cost of this type of
turbocharger
Recalling the representation of the turbocharger in Figure 26 Station 1 is the
ambient condition Station 2 is the compressed air or mixture that is mjected into the
engine Station 3 is the exhaust from the enghie Station 4 exits the turbine back to
atmosphere From a thermodynamic analysis assuming negligible heat loss and
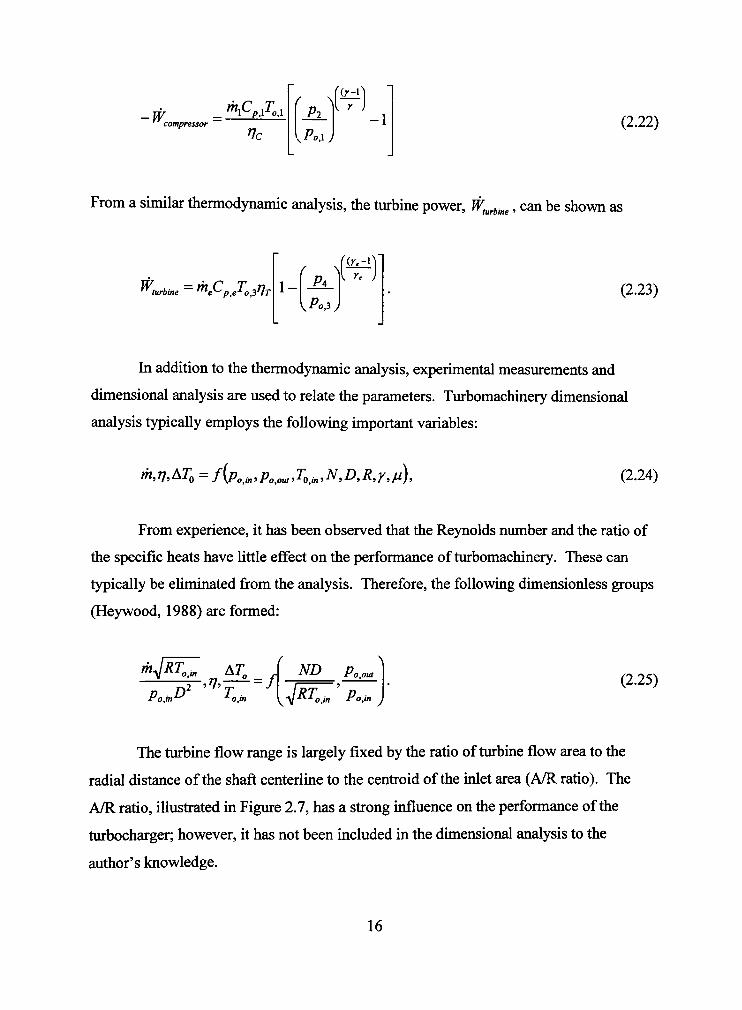
elevation change and ideal gases the compressor power W^bdquopressor can be shown as
15
- I T ^xCpJ
compressor nc Polj
-] (222)
From a shnilar tiiermodynamic analysis tiie ttirbine power W^iibdquo can be shown as
turbine ~ ^e^pe^oS^T 1 - PA
Po^)
m (223)
In addition to the thermodynamic analysis experimental measurements and
dimensional analysis are used to relate the parameters Turbomachhiery dimensional
analysis typically employs the following hnportant variables
mriKT^ = f(pbdquo^p^^^T^^NDRyn) 11A)
From experience it has been observed that the Reynolds number and the ratio of
the specific heats have little effect on the performance of turbomachinery These can
typically be eliminated from the analysis Therefore the following dimensionless groups
(Heywood 1988) are formed
m J^n^-f PcD
ND Po^
4^Pom Pom
(225)
The turbine flow range is largely fixed by the ratio of turbme flow area to the
radial distance of the shaft centerlme to the cenfroid of the mlet area (AR ratio) The
AR ratio illusfrated m Figure 27 has a sfrong mfluence on tiie performance of the
turbocharger however h has not been mcluded in the dimensional analysis to the
authors knowledge
16
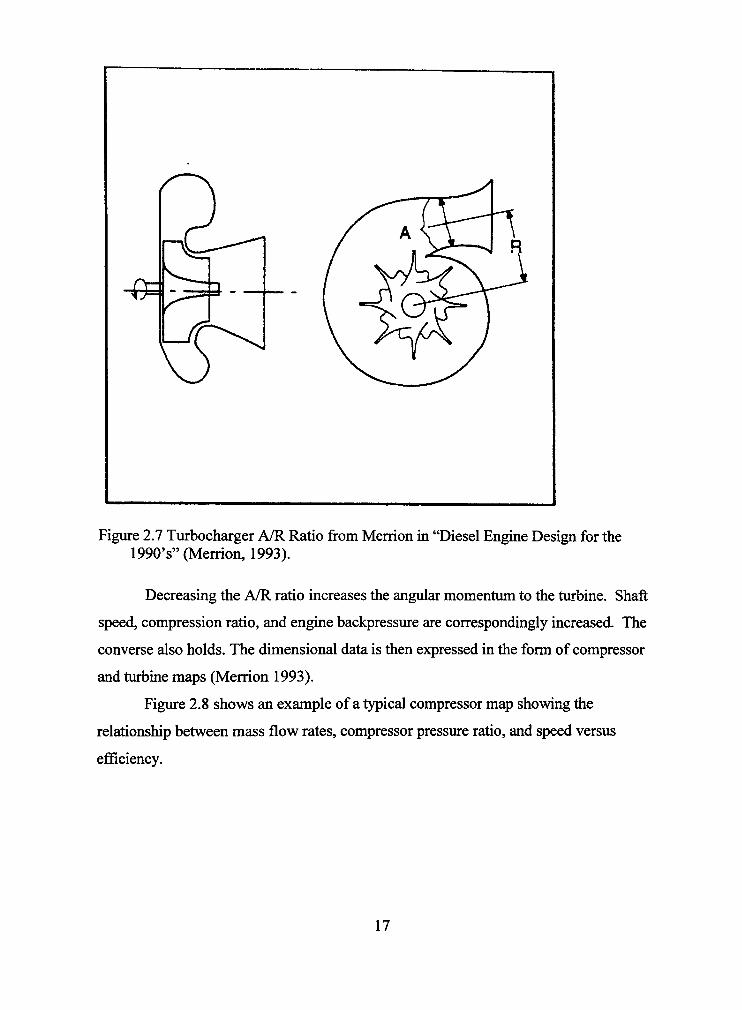
Figure 27 Turbocharger AR Ratio from Merrion in Diesel Engine Design for the 1990s (Merrion 1993)
Decreasing the AR ratio increases the angular momentum to the turbine Shaft
speed compression ratio and engine backpressure are correspondingly increased The
converse also holds The dimensional data is then expressed in the form of compressor
and turbine maps (Merrion 1993)
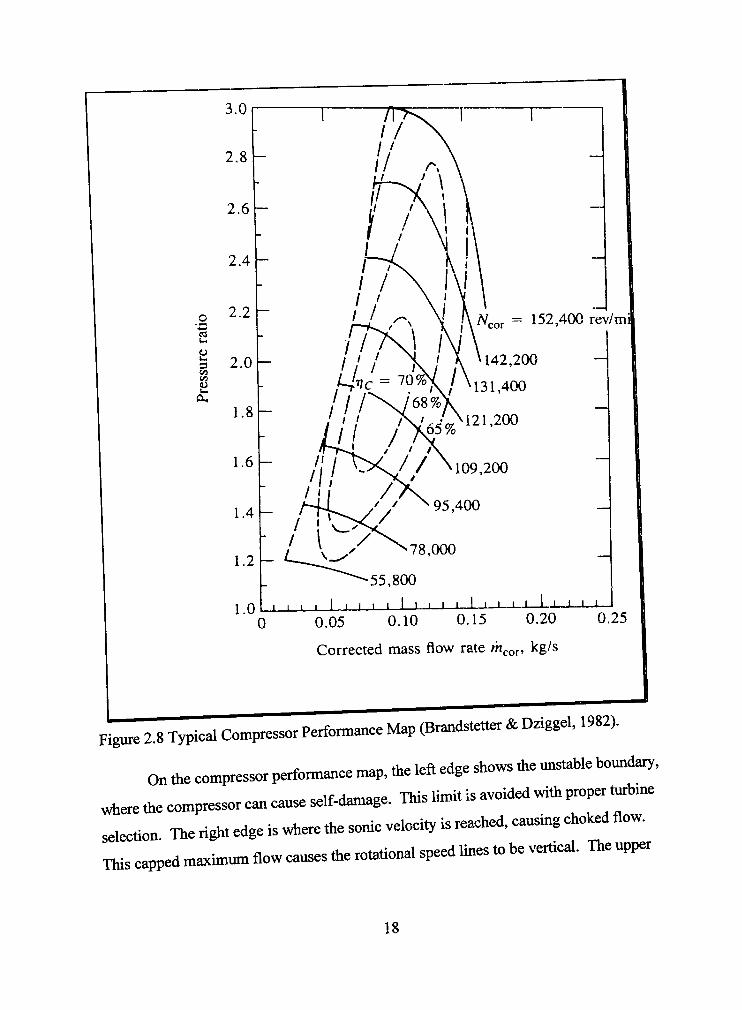
Figure 28 shows an example of a typical compressor map showing the
relationship between mass flow rates compressor pressure ratio and speed versus
efficiency
17
o
ltu a
N or = 152400 revmi
l__l_J L X I I I
005 010 015 020
Corrected mass flow rate m^or ^B^^
025
Figure 28 Typical Compressor Performance Map (Brandstetter amp Dziggel 1982)
On e compressor performance map the left edge shows the unstable boundary
^ e r e the compressor can cause self-damage Tins limit is avoided with proper njrbme
selection Tire right edge is where the sonic velocity is reached causing choklaquoi flov
M s capped maximum flow causes the rotational speed lines to be verhcal The upper
18
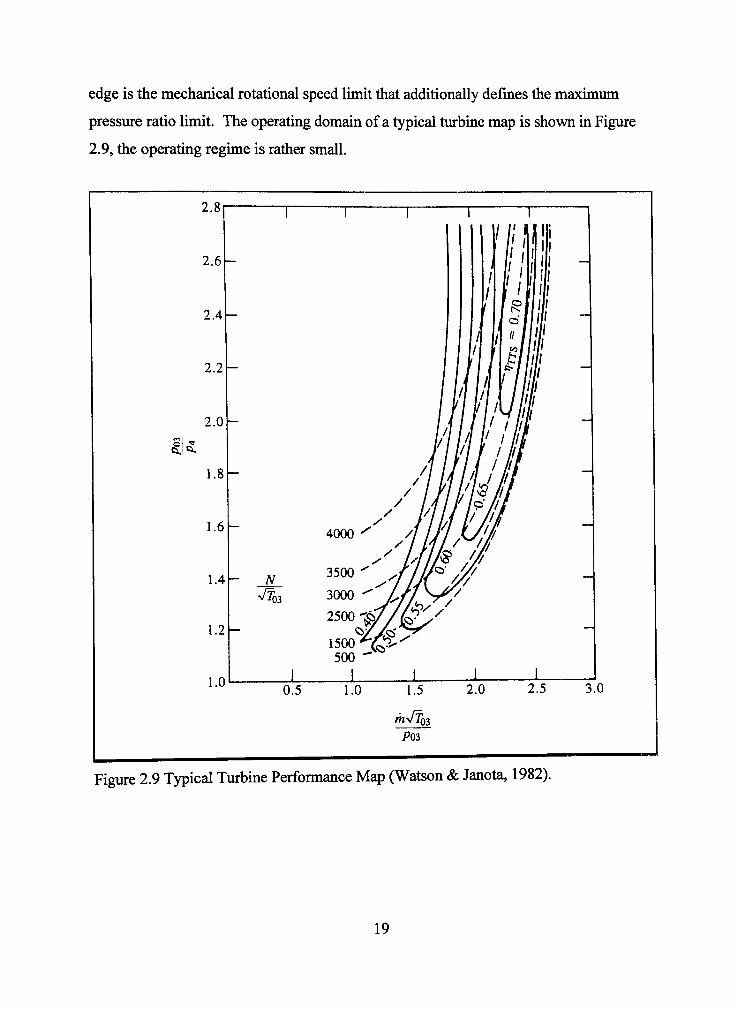
edge is the mechanical rotational speed limit that additionally defines the maxhnum
pressvire ratio limit The operating domain of a typical turbme map is shown in Figure
29 the operating reghne is rather small
Figure 29 Typical Turbhie Performance Map (Watson amp Janota 1982)
19
From Figure 29 at higher mass flow rates tiie turbine rotational speed Imes tend
to overlap one another This overiap causes difficulty workmg witii this type of
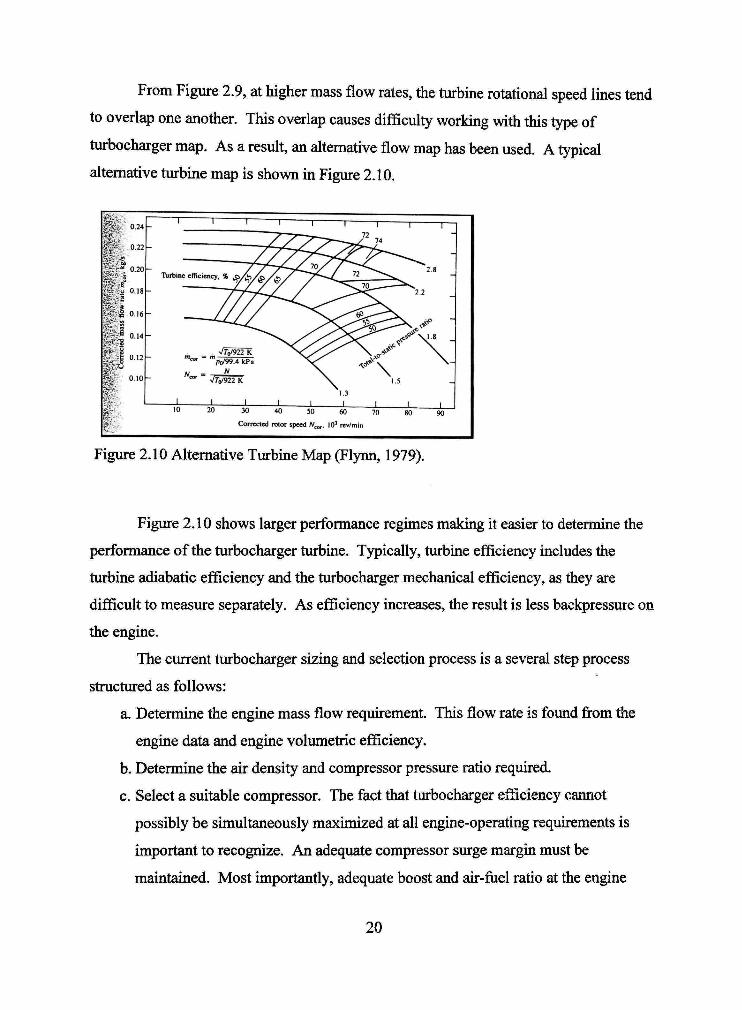
turbocharger map As a result an altemative flow map has been used A typical
altemative turbine map is shown m Figure 210
^ bull
5Si 024
^i- 022
i ^ 0 2 0
Wamp 018
fefel 016
i K 014
w^ fe 012
it-
bullHjitiinc efficiency Sgt^
60 70 80 90
Corrected rotor speed N^bdquo 10 revmiri
Figure 210 Altemative Turbme Map (Flynn 1979)
Figure 210 shows larger performance regimes making it easier to determine the
performance of the turbocharger turbine Typically turbine efficiency includes the
turbine adiabatic efficiency and the turbocharger mechanical efficiency as they are
difficult to measure separately As efficiency increases the result is less backpressure on
the engine
The current turbocharger sizing and selection process is a several step process
structured as follows
a Determine the enghie mass flow requhement This flow rate is found from the
enghie data and engine volumetric efficiency
b Determine the air density and compressor pressure ratio requhed
c Select a suitable compressor The fact that turbocharger efticiency cannot
possibly be simultaneously maxhnized at all engine-operating requhements is
important to recognize An adequate compressor surge margm must be
maintained Most importantly adequate boost and ah-fiiel ratio at the enghie
20
peak torque speed must be balanced while avoiding excessive boost tiiat causes
knock and exceedmg stmctural requhements at higher speeds
d Select tiie ttirbme design tiiat produces the requhed shaft power (or torque) at
each compressor matched ahflow condition
e Select an over-boost prevention technology as discussed previously coupled witii
the avoidance of ttirbo lag Turbo lag is caused by tiie inability of tiie rotatmg
mertia m the turbocharger to change mstantaneously As a resuh tiie vehicle has
a delayed response and smoke may dominate the exhaust due to lack of ah from
the compressor To avoid turbo lag h is deshable to reduce turbhie AU
Reducmg the turbme AR ratio mcreases the ahflow and rotational speed at the
turbocharger resultmg m excessive boost at high speeds This couplhig is the
reason that these steps are commonly analyzed together Turbines with ceramic
wheels are mcreasing m popularity especially in passenger cars because of lower
inertia and better response
The compression of any gas in any real process causes a temperature rise in the
gas This increase in temperature decreases the density of the gas entering the engine
Intercooling heat exchangers provides charge air cooling thereby increasing the density
of the ah supplied to the engine As outlined by Merrion (1993) intercoolmg mcreases
the specific output of the engine the altitude capability and the reliability (due to lower
engine temperatures) Additionally it decreases the brake specific fuel consumption
Component material cost is also lowered due to the lower temperatures that occur
Intercooling has a positive effect on exhaust emissions especially NOx There are three
types of intercoolers (1) ah-to-engine water exiting from the radiator (2) ah-to-water
with separate radiator system and (3) air-to-ah Option 1 is the easiest to hnplement but
it is the least effective Option 2 is deshable but it requhes excessive additional
equipment The ah-to-air option provides the best performance and shnphcity but ah
ducting requhes a lot of space Whichever option is utilized intercooimg is very
atfractive when turbocharging engines (Merrion 1993)
21
Sekar (1982) discussed the evolution of the Diesel engine There was a
significant trend towards higher specific output Diftering approaches have been
employed to achieve a higher power-to-weight ratio in Diesel engines A key parameter
was the charge airflow rate Most of the methods to increase the power output of a given
displacement engine concenfrated on providing more ah for combustion In the 1960s
and 1970s turbocharghig became the standard method utilized for mcreasmg the power
output reducing smoke and improving fuel consumption In many applications
compressor pressure ratios greater than 25 were common limited only by turbocharger
speeds and materials As discussed previously the objective is to hicrease the intake
charge air density and one way of accomplishing this is to cool the charge ah Sekar
reviewed the evolution of ah charge cooling and its effects on engine performance Air
charge cooling favorably impacted fuel consumption emissions (especially NOx)
altitude performance thermal loadmg of engine components and the capability for
higher specific output The exhaust gas turbhie inlet temperature generally limited tiie
enghie capability Charge ah-coolmg helped to hicrease the ratmg m two ways higher
charge ah density and lower ttubine inlet temperature Vertically mtegrated companies
generally preferred an ah-to-ah system while mdependent enghie manufacturers seem to
prefer air-to-water systems
Davidson (1984) additionally discussed the benefits of charge ah-coolmg An air
charge coolmg system was developed to provide the reqmred mtake maiufold
temperatures This system went further to warm charge air under light enghie loads
while also providmg superior ah charge coolhig when reqiured This system unproved
dvu-ability hnproved fiiel economy and permitted less restiictive smoke confrols
Wallace et al (1997) discussed tiie use of Variable Geomefry Turbocharging
(VGT) VGT generally adjusts tiie AR ratio by changhig tiie turbine nozzle sizes VGT
has found Ihnited applications on heavy-duty tiiick-type engmes due to hnprovmg
torque back-up and fransient response Diesel passenger cars have also begun to
mcorporate VGT technology It was recognized that VGT additionally offered tiie
potential to hnprove the emission characteristics relative to engmes equipped witii
22
conventional wastegated fixed geometry turbochargers (FGT) The mvestigation was to
assess the benefits of VGT over conventional turbochargers relative to lower fuel
consumption and reduced emissions It was demonsfrated that torque backup was
hnproved by VGT from approxhnately 25 to 35 with peak torque occurring at lower
speeds than with conventional turbocharging The passenger car engine under urban
drive conditions operates mainly m the low load low speed regime where emissions of
NOx and hydrocarbons are critical Wallace et al investigated the potential of a VGT to
reduce and confrol the emissions from a prototype passenger car dhect injection (DI)
Diesel engine The automotive engine was first base-lined for emissions and brake
specific fuel consumption with a fixed geometry turbocharger followed by installation
and evaluation of a VGT equipped with swiveling turbine nozzle vanes An iritial
investigation of a VGT in conjunction with a controlled exhaust gas rechculation valve
showed that up to 19 improvement at partial load of NOx emissions could be made
without compromising fiiel consumption
In the following study Hawley et al (1988) determined that usmg a VGT resulted
m a 10 torque enhancement over the speed range 1000 to 3500 revolutions per minute
without exceeding the limits of maxhnum cylhider pressure pre-turbhie temperature and
the Bosch smoke test Hawley et al used a computer shnulation where compressor and
turbine performance maps are input as numerical arrays in the usual manner This
method of entering performance maps was standard procedure for fixed gate
turbocharghig (FGT) with a uniquely defined turbine map However tiie variable gate
turbocharghig (VGT) used has a different operatmg map for each vane settmg witii
dramatic enhancement in mass flow and smaller changes m efficiency The procedure
adopted was to use a turbme map for the baseline FGT and employ mass flow and
efficiency scale factors These factors corrected for changes m behavior due to vane
angle The scale factors were calibrated by varymg them m small hicrements for any
given operating point
VGT offered hnprovements over the baselme FGT performance by lowering
brake specific fiiel consumption pre-turbme temperature at higher speeds smoke
23
levels over the entire speed range and by possibly raismg the general limithig torque
level up to 13 percent without exceeding engine turbocharger limits
The simulation package ODES (Otto Diesel Engine Simulation) was developed at
the Uruversity of Bath The approach was incorporated into this simulation package
(Hawley etal 1998)
Shayler Baylis Chick and Bell (1999) provide an excellent precursor to the
research described herein When comparing Diesel engines to spark ignition gasoline
engines Diesel engines offered superior fiiel economy with inferior power to weight
ratios in naturally asphed form The differential in power output is reduced when the
engine is turbocharged andor intercooled The use of exhaust gas rechculation EGR is
commonly used to limit NOx emissions on both and spark ignition engines
23 Turbocharged Compression Ignition Engine
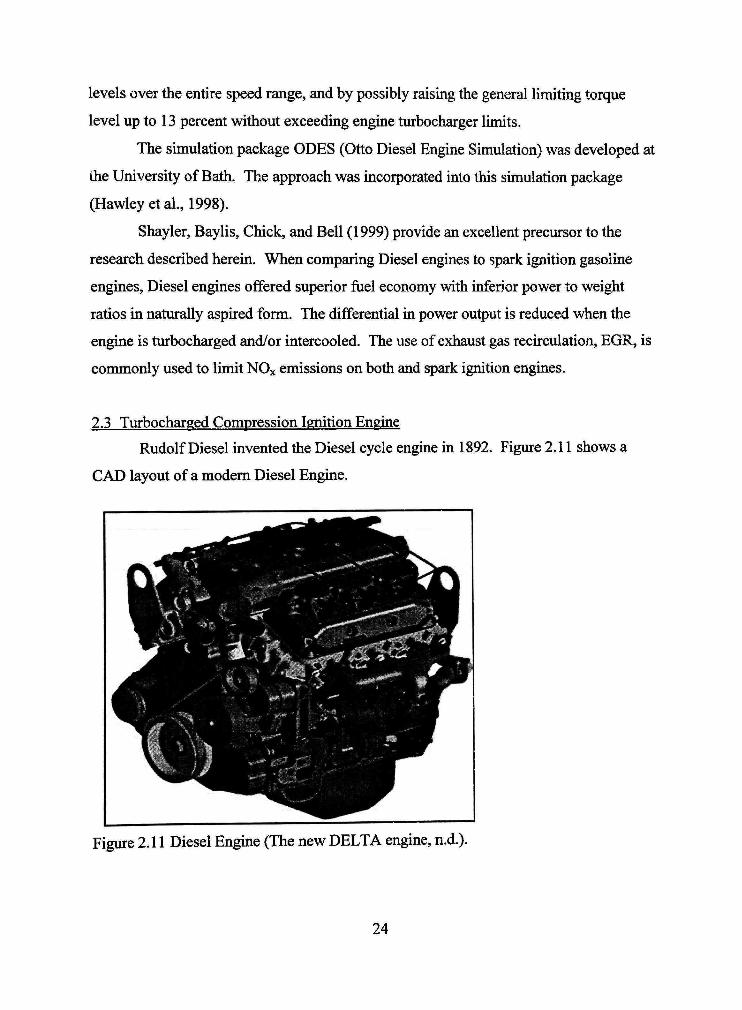
Rudolf Diesel mvented the Diesel cycle engine m 1892 Figure 211 shows a
CAD layout of a modem Diesel Enghie
Figure 211 Diesel Enghie (The new DELTA engine nd)
24
The Diesel engine is fimctionally shnilar to tiie gasolme engine The major
difference is that a Diesel enghie utilizes compression ignition (CI) while a gasolme
enghie uses a spark ignition (SI) A CI engine does not typically coiitam spark plugs to
ignite the air-fuel mixture m the cylmder Instead the heat associated with the
compression of the air-fiiel mixture causes the mixture to igiute
The Diesel engine is frequently applied m marine mdustrial and agriculture
applications due to its fuel efficiency and relatively small parts count The disadvantages
to the Diesel enghie have been weight and increased exhaust pollution compared to the
gasolme enghie Both disadvantages are a result of the higher pressures at which a CI
engine operates The higher pressure causes the stmcture of the engine to be sfronger and
heavier The higher pressure also increases the concenfration of several pollutants in the
exhaust sfream Substantial research in the last 20 years has made the Diesel engine more
useful for automotive applications by addressing these shortcomings The majority of the
improvements have resulted from the development of reliable efficient turbochargers
Because the CI enghie process injects the fuel after the air has been compressed
supercharging and turbocharging advantageous This process avoids premature
detonation or knock that is an issue with the SI engine
The definition for the indicated mean effective pressure was given previously as
imep = TjfAmep = rj^ ^^^^- (226)
For SI engmes the ah-fuel ratio is held approxhnately constant equal to or slightly less
than the stoichiometric value or a slightiy rich mixture Operator regulation of tiie power
output is accompUshed through variations of the volumetric efficiency with the throttle
plate
By contrast for normally asphated CI engines the volumetiic efficiency is
approxhnately constant at a value determmed by the fixed elements in the ah mduction
system Power regulation is achieved by controlling the cylinder fiiel mjection rate or the
25
afr-fuel ratio Values of the ah-fiiel ratio for CI engmes are generally significantly above
the stoichiometric value or a lean mixture
In the case of turbocharged CI engines the volumetric efficiency varies because
of the action of the compressor in the air induction path The turbocharger pressure ratio
and thereby the volumetric efficiency are not dhectiy confroUed by the operator The
pressure ratio is determined by the energy hiput to the turbme from the exhaust sfream
and the flow rate speed and power matching of the turbhie and compressor The flow
rates through the turbine and compressor are approximately equal the power output from
the turbine is equal to the power input requirement of the compressor and since the
turbhie and compressor usually share a common shaft theh rotation speeds are equal As
with the normally aspirated CI engine the operator confrols the power output by
regulating the fuel injection rate
The combined influence of the air-fiiel ratio and the volumetric efficiency on
engine power or hnep complicates the problem of determining the engine operational
state It is useful to examine the results of a shnple analysis of an ideal CI engine to
determine the underlying relationships between volumetric efficiency ah-fuel ratio
turbocharger pressure ratio and enghie speed and power As will be described in the
next chapter these relationships are used as a guide hi the reduction and correlation of
actual experhnental data Consider the block diagram for a CI engine witii a turbocharger
illusfrated m Figure 212 and the corresponding Pv diagram for the CI engine cycle m
Figure 213
26
CI Engine
Intercooler
Turbhie Compressor
Work
Figure 212 Schematic of Ideal Turbocharged CI Engine
Figure 213 State Diagram for Ideal Turbocharged CI Enghie
The primary assumptions for the analysis are an ideal gas constant specific heats
an isenfropic compression sfroke from state 2 to state 3 constant pressure during the fiiel
combustion and mitial phase of the expansion sfroke from state 3 to state 4 vitii fiirther
isenfropic expansion after the fuel combustion from state 4 to state 5 The turbhie and
compressor efficiencies are each approxhnated witii constant or average values In
27
addition tiie ah mduction chcuit mcludes an intercooler where tiie exh temperattire is
taken as approximately equal to the ambient temperattu-e
For the process through the compressor
^i - Pamb
Pi = Pamb
P = PrPamb
Pl=Tarrb+^ Vc
( r-1 ^
Pr - 1
V i = -RT^
P
111)
The exit conditions from the intercooler are
V2=v T2=T amb P2--=-RTn
(228)
The isenfropic compression from state 2 to state 3 yields
V 3 = ^ 7 3 = 7 2
r T3gt 1 ^ 3
V (229)
and the work input requhed for the compression is
^c=^2-i=(^^i-Pi) (230)
The initial expansion with fuel combustion from state 3 to state 4 is approximated with a
constant pressure process
PA=P3 34 = QLH
1-1-AlF
CpAlF + ) V 4 = -
RJ
PA (231)
28
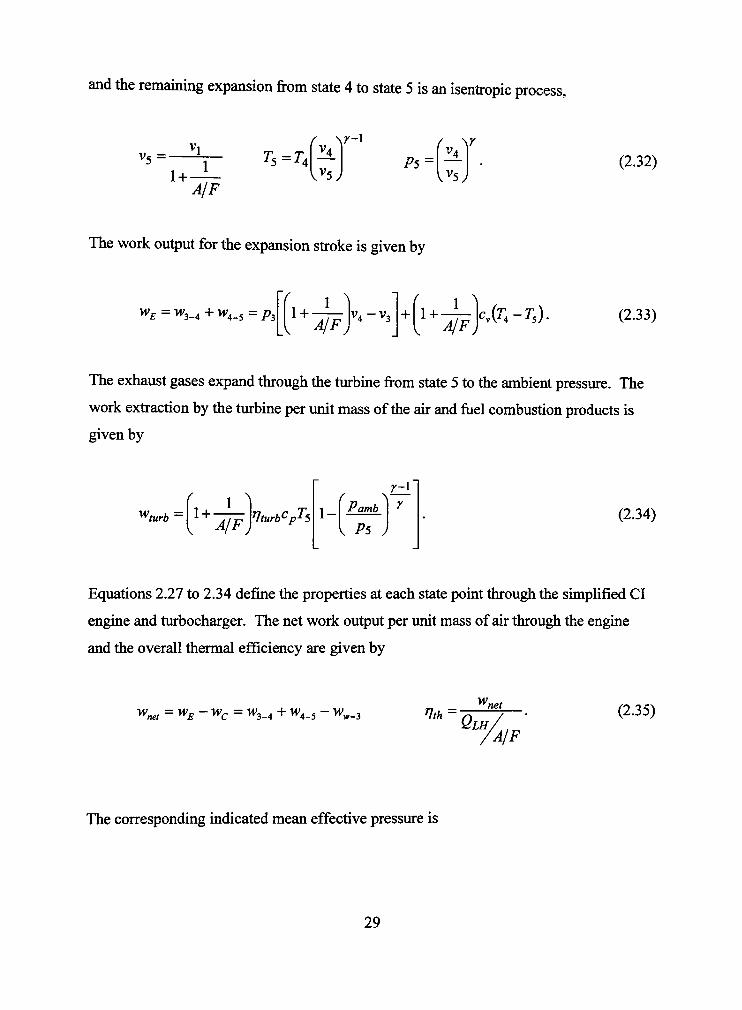
and tiie remaming expansion from state 4 to state 5 is an isenfropic process
V 5 = -
1-h-P5=TA
AF
y- r V P5 =
V^s (232)
The work output for the expansion sfroke is given by
W pound = W 3 _ 4 + W 4 _ 5 = P 3 r 1
1 - K -LV APj
V4-V3 1 ^
1 + AF) XT-TS)- (233)
The exhaust gases expand through tiie turbhie from state 5 to tiie ambient pressure The
work exfraction by the turbine per unit mass of tiie ah and fiiel combustion products is
given by
^turb =
r 1 A 1-I--
V AP^ ^turb^pPs 1 - ^Pamb^ r
Ps ) (234)
Equations 227 to 234 define the properties at each state point through the simplified CI
engine and turbocharger The net work output per unit mass of ah through the engine
and the overall thermal efficiency are given by
Wbdquoer =^E-^C= ^3 -4 + W4_5 - W^j ^th w net
QLH AF
(235)
The corresponding indicated mean effective pressure is
29
imep = ^ = rjfAmep = TJ^TJ^ ^Jf (236) v j l - - l ^ ^ 2
where
Vv=-m^
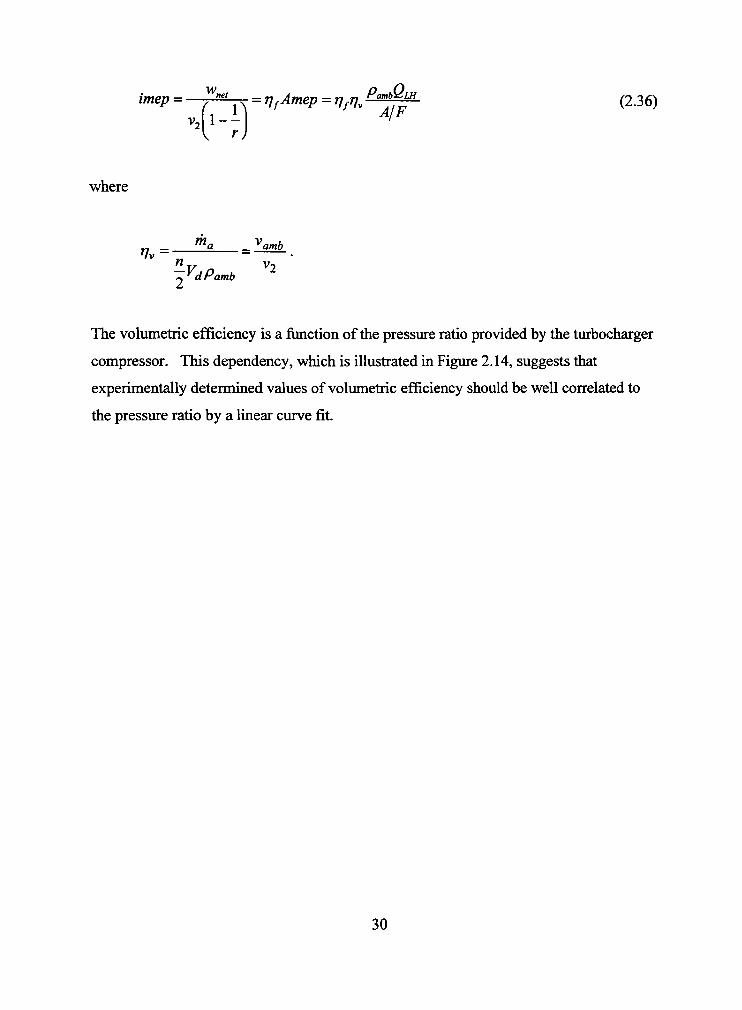
The volumetric efficiency is a function of the pressure ratio provided by the turbocharger
compressor This dependency which is illusfrated in Figure 214 suggests that
experimentally determined values of volumetric efficiency should be well correlated to
the pressure ratio by a linear curve fit
30
Volumetric Efficiency versus Turbocharger Pressure Ratio for Ideal Turtiocharded CI Eogine
35
Z5
bullC 20 E u u bulls a 15
10 15 20 25
Turbocharger Compressor Pressure Ratio
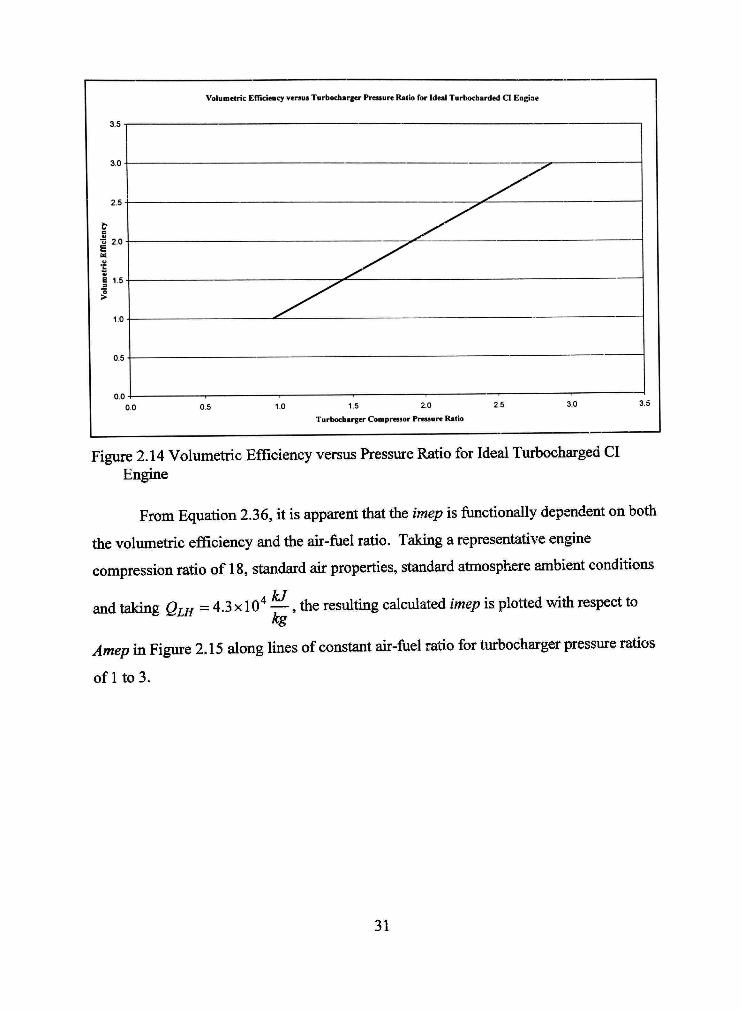
Figure 214 Volumetric Efficiency versus Pressure Ratio for Ideal Turbocharged CI Engine
From Equation 236 h is apparent that tiie imep is functionally dependent on both
the volumetric efficiency and tiie ah-fuel ratio Takmg a representative engine
compression ratio of 18 standard afr properties standard atinosphere ambient conditions
and takmg Quj = 43 x lO mdash tiie resultmg calculated imep is plotted witii respect to
Amep m Figure 215 along Imes of constant afr-fiiel ratio for ttirbocharger pressure ratios
of 1 to 3
31
4 0 -1
35
30
25-
I
=bull 20 V
B
16-
10-
0 5-
00 0
Indicated Mean Effective Pressure versus Available Mean Effective Pressure
^
^ ^
jt^
^ ^
gt^
0
bull
10
y
Air-fuel Ratio = 30 mdash mdashAlr-fuGl Ratio = 40 - - - Air-fuel Ratio = 50
20 30 4 0 50
Amep (MPa) 11 p QLH 1 (AF)
60
Figure 215 Indicated Mean Effective Pressure versus Available Mean Effective Pressure for Ideal Turbocharged CI Engine
This figure illusfrates the principal difficulty in analyzing the turbocharged CI
engine Note that based on the CI engine cycle analysis alone the specification of an
engine power and speed requhement or equivalently the imep does not lead to a unique
combination of volumetric efficiency and ah-fuel ratio Determination of the specific
values of these parameters requhes appUcation of the matched operatmg conditions for
the turbocharger compressor m the enghie mlet flow and the turbme in the exhaust flow
Figure 216 illusfrates the variation of the energy input requhement per unit mass of ah
for the turbocharger compressor and the energy exfraction per unit mass of the ah-fiiel
combustion products for the turbine
32
Turbocharger Worii Interaction for Ideai Turbacharged a Engine
I
1 1 - raquo Tiubinc Work AF = 30 - ^ Turbine Work AF = 40 - bull Turbine Work AF = 50 ^ ^ bull ~ Compressor Work
_ raquo 1
^ m
raquo - bull
- bull - bull
- - bull l ^ ^
i i - - bull
- - lt gt - - bull - - - - - -
16 18 20 22 24
Turbocharger Compressor Pressure Ratio
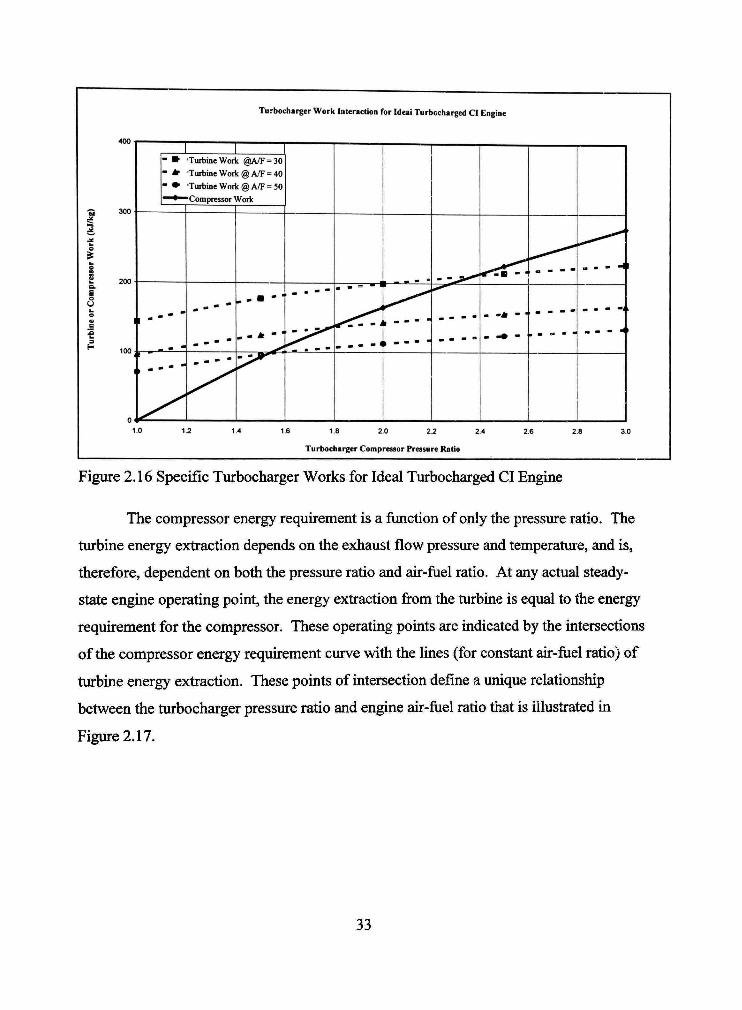
Figure 216 Specific Turbocharger Works for Ideal Turbocharged CI Engine
The compressor energy requhement is a function of only the pressure ratio The
turbine energy exfraction depends on the exhaust flow pressure and temperatuie and is
therefore dependent on both the pressure ratio and edr-fiiel ratio At any actual steady-
state enghie operating point the energy exfraction from the turbine is equal to the energy
requirement for the compressor These operating points are indicated by the intersections
of the compressor energy requhement curve with the lines (for constant ah-fiiel ratio) of
turbine energy exfraction These points of intersection define a unique relationship
between the turbocharger pressure ratio and engine ah-fiiel ratio that is illusfrated m
Figure 217
33
Air-fiiel Ratio versus Pressure Ratio for Ideal Turbochai ed CI Eugice
40
20
n
r
10 Z5 30
Turbocharger Pressure Ratio
Figure 217 Air-fiiel Ratio versus Pressure Ratio for Ideal Turbocharged CI Engine
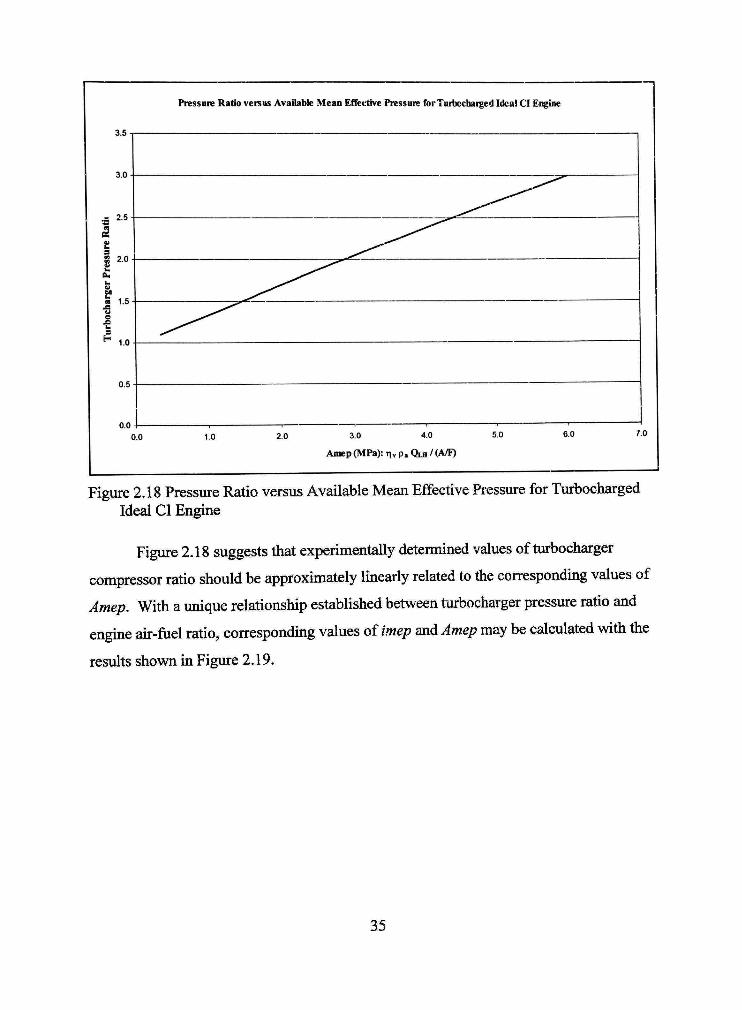
The relationship is more converuently represented m Figure 218 by plottmg
ttirbocharger pressure ratio versus Amep = rj^PambQiH ^ ^ gt where both tiie ah-fuel
ratio (Figure 217) and volumetiic efficiency (Figure 214) are unique functions of tiie
pressure ratio
34
Pressure Ratio versus Available Mean Eflective Pressure forTuibocharged Ideal CI Engine
35
30
= 25
I pound
a 15 u
E U ^ 10
00 00 10 20 30 40
Amep (MPa) ti p QLH (AF)
70
Figure 218 Pressure Ratio versus Available Mean Effective Pressure for Turbocharged Ideal CI Engine
Figure 218 suggests that experimentally determined values of turbocharger
compressor ratio should be approxhnately Imearly related to tiie correspondmg values of
Amep With a unique relationship established between turbocharger pressure ratio and
engine ah-fuel ratio correspondmg values of imep and Amep may be calculated witii tiie
results shovm in Figure 219
35
Indicated Mean Effective Pressure venus AvailaUe Mean EffectWe Pressure
40
35
30
25
bull^ 20
15
10
05
00 10 20 30 40 50
Amep (MPa) tiraquo P QLH (AF)
Figure 219 Indicated Mean Effective Pressure versus Available Mean Effective Pressure for Matched Ideal Turbocharged CI Engine
Not surprisingly the imep is linear with respect to Amep with the slope equal to
the fuel conversion efficiency
24 Heat Transfer
Many researchers currently use some form of the heat fransfer analysis outlined
by Annand (1963) This is a generalized equation accounting for both the convection and
radiation component of the heat fransfer m a cylhider of a reciprocatmg engine
Gehres (1963) of Union Carbide discussed the mterestmg phenomena of nucleate
boilmg that can occur under severe drivmg condhions Tests mdicate tiiat at these severe
drivmg conditions up to 60 of the cylmder heat fransfer surface is cooled by nucleate
boilmg Additionally tiiese hot spots represent 80 of the heat fransferred to tiie
coolant The coolant boiling pomt confrols the engine hot spot temperatures Gehres
36
fiirther correlated tiie effects of differing cooling media properties to tiie occurrences of
tills type of engine coolmg The heat fransfer coefficient from tiie coolant-to-metal is
many tunes greater tiian the fransfer coefficient of metal-to-ah Therefore at tiie radiator
tiie properties of tiie coolant do not have a major impact on the heat fransferred
Fmlay Harris Boam and Parks (1985) discussed the mfluence of cylinder head
material coolant composition pressure temperattire and velocity on cylinder head
temperatures Each of tiiese parameters was varied and its mfluence on combustion
chamber wall temperature was determined Agreement was shown between measured
values and correspondmg predictions from a heat transfer model Forced convection
sub-cooled and nucleate boilmg were mcluded m tiie model The results suggested that
nucleate boilmg was an integral factor in tiie fransfer of heat from the cylhider head to
coolant
Fmlay et al (1985) reiterated that the reduction of lead levels in pefrol higher
compression ratios and the mcreasing use of turbocharging is aggravatmg premature
detonation in the automotive spark igiution engines Knowledge of the local coolant
temperatures and velocities surface heat fluxes and heat fransfer coefficients were
necessary to design an effective engine cooling system In 1985 this information was not
available due to the complex geometry of the coolant flow passages in most engines
An aluminum cylinder head was found to have lower combustion chamber wall
temperatures and was able to tolerate more ignition advance than a cast hon cylhider
head of similar geometry under conditions of ahnost equal power generation
Combustion chamber wall temperatures were not sensitive to cooling water pump speed
Therefore pump speed changes did not increase resistance to low speed knock
Equations developed for forced convective nucleate boilmg heat fransfer were used to
predict the relationship between heat flux and surface temperature in the cylinder bead in
the liquid-cooled regions The theory predicted the measured changes in the wall
temperature resulting from changes in coolant velocity pressure and composition (Finlay
etal 1985)
37
Alkidas and Cole (1985) reported tiiat the time histories of the local heat fluxes
were significantiy different at different locations of measui-ement These differences are
attributed to tiie lack of spatial uniformity in the fluid motion and combustion Because
of the exfreme difficulties associated with the estimation of errors in the measurement of
surface heat flux an error analysis of the heat flux temperature measurements was not
performed
Lahvic (1986) presented a correlation for the estimatmg heat rejection to the tiien
engine coolant This dissertation is the resuh of updating the prediction methodology for
Ford Motor Company Lahvic regression is the following correlation (Lahvic 1986)
QcooiantiBtuIhr] = 866F0 [L]n[rpm] +148r[^ lb]+S35P[hp]-101 (FQ + 2890 (231)
Liu Xu and Hou (1993) investigated the heat exchange characteristics of an
engine series containing a water-cooled radiating system The analysis of the radiator
hidicated that most of the heat fransfer resistance comes from the fin to air heat fransfer
coefficients Increasing the airflow or the fin surface efficiency could increase the heat
fransfer coefficient Liu et al also proposed to meet differing loads by varying the fan
size and speed From a heat balance 24 (30 at lower speeds) of the overall heat of
combustion is rejected to cooling system If the intercooler is placed before the radiator
the net impact could be negative Therefore ahflow path is critical in the design of an
intercooler For the particular engine used in their test the enghie coolant was held to
95degC correspondmg to a 35degC ambient temperature
Cao and Wang (1995) investigated tiie use of heat pipes for cooling pistons
Piston coolhig is a critical measure for achieving efficient engine performance A higher
working temperature is required to hicrease enghie thermal efficiency and reduce the
discharge of soot from the engine The maximum temperature a piston can sustam is a
critical restriction in engine performance The maxhnum temperature is even more
critical for aluminum alloy-based pistons These alloys have a pronounced temperature
dependence on their mechanical properties Due to the reciprocatmg motion of the piston
38
coolhig is difficult Commonly pistons are cooled by the crankcase oil plashmist under
crown cooling method Additional oil coolhig may be necessary for medium- and highshy
speed engine pistons An internal coolmg gallery in conjunction with an oil jet on tiie
piston crown provided improved coolmg Cao and Wang observed that the reciprocatmg
heat pipe was also feasible for cooling an enghie piston In similar systems an analysis
of the piston cooling system mdicated tiiat the reciprocating heat pipe coolmg metiiod at
the valve stems could sustain much higher engine powders
Rakopoulos and Mavropoulos (2000) discussed the complexity of heat fransfer in
an hitemal combustion engine This complexity was attiibuted to the fact that the
relevant phenomena are fransient three-dimensional and subject to rapid swings
in cylinder gas pressures and temperatures The combustion chamber itself with
its moving boundaries adds more complexity Theh experimental investigation was an
effort to examine the short-term response during an engine cycle Heat fluxes to the
exhaust manifold wall were obtained and analyzed with the corresponding heat losses to
the combustion chamber walls under the same engine operating conditions
Rakopoulos and Mavropoilos (2000) applied the unsteady heat conduction
equation to calculate the heat flux with boundary conditions derived from experhnental
temperature measurements As expected increasing the enghie speed resulted in
increases of the values of the peak heat fluxes in both the cylinder head and exhaust
manifold This hicrease was due to the increase of the gas side heat fransfer coefficients
However it was shown that as engine speed increases the increase of cylinder head peak
heat flux becomes minimal whereas the heat losses from the exhaust gases to the
manifold hicrease As tiie engme speed increases there is only a small hicrease m the
cylinder head peak heat flux because the combustion gas peak pressure and temperature
decrease with increasmg speed imder constant load The decreasing load was attiibuted
to combustion deterioration The higher gas velocities in tiie exhaust maiufold domhiate
the heat fransfer as the enghie speed mcreases The heat loss mcreases are approxhnately
proportional with engine speed After tiie inlet valve opens the warmer combustion
chamber walls fransfer heat to the fresh ah entering tiie cylhider Thus the cylmder heat
39
flux becomes negative during tiiat period The cylhider pressure mcreases after tiie inlet
valve closes However the cylinder heat flux remains negative at the begmning then
rises slightly during compression Combustion starts and tiie heat flux mcreases rapidly
reachmg a maxhnum and tiien decreases to a small value by 40-60deg after top-dead-
center
Hribemik and Moskwa (2000) discussed the effects of coolhig tiie charge ah
usmg a heat exchanger between the turbocharger and tiie enghie mtake This additional
equipment offset the temperature rise of charge air due to pressure boostmg Air-to-air
intercoolers typically have high thermal inertia therefore theh fransient characteristics
are normally overlooked Because of this the NTU-effectiveness method which is most
appropriate for steady state analysis is often used in the simulation of fransient engine
operation However during fransient operation the intercooler is subjected to a wide
range of unsteady operating conditions Air mass flow rate boost pressure and
temperature vary during fransient operation as fimctions of enghie speed turbocharger
speed and mass flow rate of cooling ah The cooling ah mass flow is a fimction of
engine fan speed vehicle speed and obstructions around the intercooler Recogihzing
that the NTU-effectiveness method is not accurate under transient conditions Hribemik
and Moskwa proposed a two-dimensional model of a cross-flow heat exchanger to study
the intercoolerengine mteraction After the model had been verified against
experimental results it was incorporated into a zero-dimensional simulation model of a
turbocharged Diesel engine Hribemik and Moskwa found that steady state conditions
were reached after approxhnately 12 seconds while the rated power was reached after
approximately 7 seconds Under most situations this seems like a short period however
m heavy urban fraffic this could affect enghie performance
The development of an analytical method for predictmg enghie heat rejection to
coolant requhes experimental measurement of enghie heat rejection This experimental
data is necessary not only to assess the accuracy of the analgtiical predictions but also for
derivmg emphical constants used in the analytical method
40
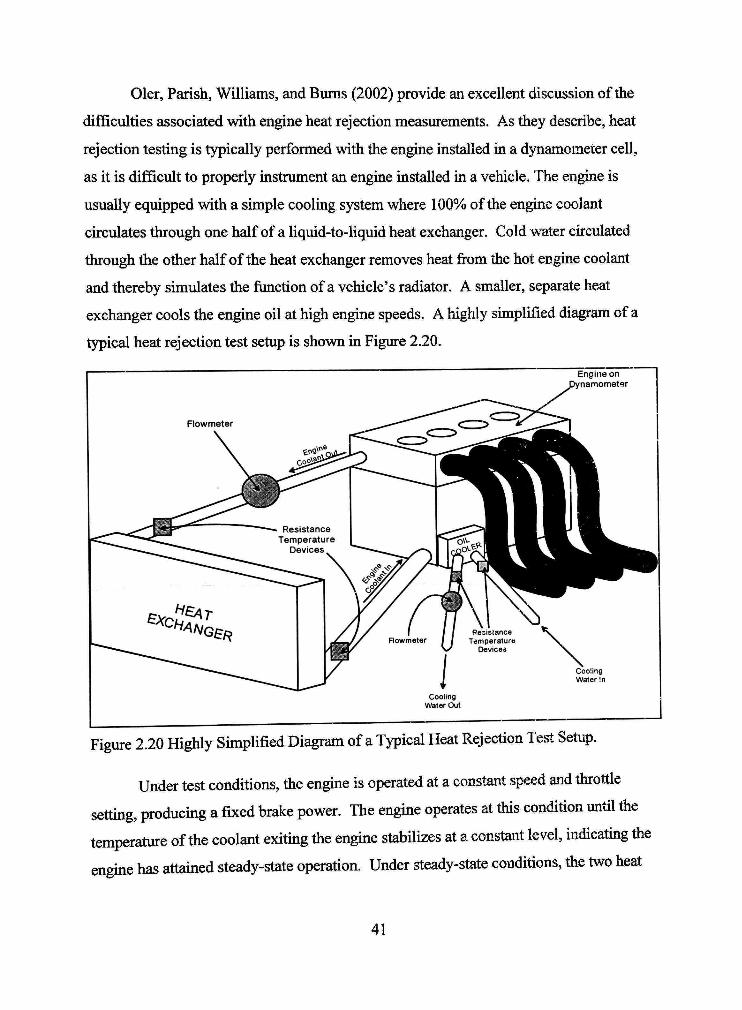
Oler Parish Williams and Bums (2002) provide an excellent discussion of the
difficulties associated with engine heat rejection measurements As they describe heat
rejection testing is typically performed with the engine mstalled in a dynamometer cell
as it is difficult to properly mstrument an enghie installed hi a vehicle The enghie is
usually equipped with a simple coolhig system where 100 of the engine coolant
chculates through one half of a Uquid-to-liquid heat exchanger Cold water chculated
through the other half of the heat exchanger removes heat from the hot enghie coolant
and thereby simulates the function of a vehicles radiator A smaller separate heat
exchanger cools the engine oil at high engine speeds A higlily simplified diagram of a
typical heat rejection test setup is shown in Figure 220
Flowmeter
-- ^
= 4
~ ^ Resistance Temperature
Devices
Engine on Dynamometer
j Peslslance f Rowmeter 1 1 Temperaturt r V Devices
1 Cooling
Water Out
Cooling Water n
Figure 220 Highly Shnplified Diagram of a Typical Heat Rejection Test Setup
Under test conditions tiie enghie is operated at a constant speed and tiirottle
setting producmg a fixed brake power The engme operates at tins condition until tiie
temperattire of the coolant exitmg tiie enghie stabilizes at a constant level hidicatmg tiie
enghie has attamed steady-state operation Under steady-state conditions the two heat
41
exchangers mamtain constant coolarh mlet and engine oil temperatiires by exfractmg heat
from the coolant and engine oil at a constant rate
For an engme operatmg under steady-state conditions heat rejection to coolant
can be calculated from tiie difference between tiie inlet and outlet temperatures of the
coolant coolant mass flow rate and coolant specific heat
Qcoolant = nicCpATc (2 31)
A matched set of resistance temperature devices (RTDs) is used to measure the
difference m coolant mlet and outiet temperatures The mass flow rate of the coolant is
determined using a flow meter installed m the engine coolhig chcuit These
measurements used in conjunction with Equation 231 allow calculation of tiie enghie
heat rejection to coolant If the engine oil cooler is in operation the heat rejected to the
oil cooler is calculated in a shnilar manner and included m the total engine heat rejection
to coolant
Oler et al note that there is a certam amount of error associated with any
experimental data and heat rejection to coolant is no exception Engine heat rejection to
coolant is in fact quite difficult to measure accurately and with repeatability The two
primary sources of error in measuring heat rejection to coolant are errors in flow rate
measurement and errors in temperature measurement
Typically the type of flow meter used in a given experiment drives the accuracy
of coolant mass flow rate measurement Measuring engine heat rejection with the engine
installed on a dynamometer stand allows the use of an orifice-type flow meter which
measures the mass flow rate of a liquid based upon the pressure drop the moving liquid
experiences as it passes through an orifice When properly calibrated this type of device
produces measurements that are accurate to within less than three percent Given the
turbulent nature of the flow through an engine coolhig system and the frequent presence
of vapor bubbles in the coolant this is a very accurate measurement These devices
however are too large to fit under the hood of a typical vehicle plus they requhe that the
42
coolmg circuit have relatively few bends to keep flow turbulence to a mmimum These
limitations restrict the use of this type of flow meter to the dynamometer stand
Measurement of heat rejection m the vehicle environment requhes tiie use of a smaller
turbme-style flow meter These flow meters are typically less accurate than the orifice-
type flow meter In addition the cooling system as installed in a vehicle typically
features many bends in the circuh creating turbulence in the coolant flow that decreases
the accuracy of the flow measurement
An additional cause for inaccuracy in the measurement of engine heat rejection is
the relatively small temperature change that takes place across the heat exchanger Under
steady state operation the engine coolant typically undergoes a temperature change of
approximately 10deg C as it passes through the heat exchanger which is relatively small
As a result the errors inherent in the inlet and exit temperature measurements while
small in the absolute sense can appear relatively large as a percentage of the total
measurement Thus a 1deg C error in the measurement of the coolant temperature change
across the heat exchanger can result in a 10 error in the calculated heat rejection to
coolant
Because of these factors even xmder the best circumstances any measurement of
engine heat rejection can be in error by approximately 5 due to measurement error
alone Unfortunately given the large amount of thne requhed for an enghie to reach
steady state operation at any given operating condition it is impractical to take a laige
number of data samples and determine a mean which could eliminate at least some of the
common cause variability
For a given mass of ah and fiiel inside an engine cylhider optimum spark tinting
exists that produces maxhnum enghie torque This timing is called maxhnum brake
torque (MBT) spark timing For a given enghie operating condition firing the spaik plug
earlier or later than MBT thnmg produces less than the maxhnum amount of output
torque
In typical automotive applications engmes usually employ spark timmg that is
retarded relative to MBT (ie tiie spark plug is fked later m the cycle tiian the optimum
43
timmg) This is because tiie use of retarded spark thnmg reduces the occurrence of
enghie knock altiiough retarded spark also causes tiie enghie to produce less tiian tiie
maxhnum amount of brake torque for a given operating condition The amount of spark
retard relative to MBT thnmg varies from one enghie operating condition to the next In
addition tiie amount of spark retard requhed for a given enghie operathig condition may
be completely different for two different enghie configurations Thus when examinmg a
large sample of enghie data such as the one used in the current study the data will
contain a fremendous amount of variation hi spark thning relative to MBT It is
hnportant therefore to understand the hnpact that this variability may have upon the
results of the study
Operating an engine with retarded spark timing relative to MBT causes the enghie
to operate less efficiently The peak pressure attained mside the cylinder is low er tiian
realized with MBT timing thus leadmg to a lower power output from the engme In turn
a lower power output means the enghie is exfracting less energy from the hot combustion
gases The net effect of this is that retarded spark timing produces higher exhaust gas
temperatures than MBT timing for a given engine operating condition This is an
intuitive result Simply stated if the engine operates at a less efficient condition it
should waste a greater amount of energy In this case potentially usefiil energy is lost in
the form of hotter exhaust gases
As the hot exhaust gas flows through the engine exhaust ports at high velocity h
transfers a significant amount of heat to the coolant in the enghie cylinder head A higher
exhaust gas temperature therefore increases the amoimt of heat rejection to the coolant
Retarding the spark timing from MBT thus increases the amovmt of engine heat rejection
to the coolant Again this is an intuitive result given that heat rejected to the coolant is
another form of wasted energy
It is important to note that the precedmg analysis assumes tiiat constant output
torque was maintained from the engine as the spark timing was retarded This seems
confusing at first given that the output torque should decrease as the spark timing is
retarded Indeed if the spark timing was simply retarded at a given operating condition
44
and tiie amount of throttle openmg was unchanged the preceding analysis may be
invalid Keep m mind however that engmes are designed for use in motor vehicles~not
on dynamometer stands-and that tiie operator of a motor vehicle primarily is concerned
with mamtahung constant torque output not a constant throttle openmg Motor vehicles
requfre a fixed amount of output power from the engine to maintam a given speed on a
particular grade of road regardless of the engine spark timmg or amount of tiirottle
opening If the engine calibration computer retards the engine spark for a given operating
condition the driver will simply tip-m the accelerator pedal and open the throttle wider to
maintain the same amount of output power and therefore the same speed When
discussing heat rejection to coolant which is a parameter applicable to the design of the
full vehicle instead of just the enghie it is more useful to think m terms of constant
enghie output torque or power instead of constant throttle position
The data used in deriving the analytical method for predicting engine heat
rejection comes from a variety of different engines using a wide variety of engine
calibration sfrategies Some of the dynamometer data in fact contains heat rejection
measurements for four to five different settings of spark timing at a constant amount of
output torque Given that no data exists on the value of MBT spark timing for the various
operathig conditions tested h is impossible to analytically correct this data back to
MBT timing or even to determine the amount of spark retard relative to MBT for a given
operating condition This wide variation of spark timings therefore mfroduces a certain
amoimt of error mto the results of the analytical method as the analytical method cannot
account for tiie effect of retarded spark thning upon heat rejection Altiiough h is
hnpossible to accurately quantify the effects of this error h is known that for a constant
amoimt of output torque significant changes m spark thnmg can produce changes in heat
rejection to coolant on the order of 5
One significant aspect of automobile emissions is the formation of oxides of
nifrogen (NOx) which can act as a source of urban ah pollution NOx formation is a
complex process that occurs m high temperature regions during m-cylmder combustion
events primarily m tiie areas immediately behind the flame front NOx formation can be
45
reduced by diluting the air-fiiel mixture in the cylinder with recycled exhaust gas which
among other things has the net effect of reducing the peak temperature of the combustion
products Dilution of the ah-fuel mixture often is accomplished using exhaust gas
recfrculation (EGR)
A vehicles EGR system captures a small portion of engine exhaust gas and
reroutes this gas into the engines incoming charge of fresh ah thus diluting the ah-fiiel
mixture and lowering the peak combustion temperature Since excessive dilution of the
air-fuel mixture causes unstable combustion or engine misfhes the amount of exhaust
gas recycled must vary witii engine operating condition to ensure stable combustion
Typically no exhaust gas is recycled at high relative power operation shice such dilution
reduces the engines peak power output At partial throttle setthigs the amount of
recycled exhaust gas may exceed 10 of the amount of mcommg fresh ah The amount
of EGR that an enghie can tolerate at any given operathig condition is highly dependent
upon unique characteristics of that particular enghie tiius as witii spark thnmg there is
no generic rule as to tiie proper amount of EGR for a given part-tiirottle engme operating
condition
EGR rate therefore mfroduces another potential source of error mto the
comparison of heat rejection predicted analytically to tiiat measured on tiie dynamometer
Recall tiiat the experhnental data used m tius sttidy was origmally mtended for use m
designing vehicle-coolmg systems not derivmg an analytical metiiod The data used
tiierefore reflects a wide variety of enghie calibration sfrategies Some but not all of tiie
experimental heat rejection data used m tiiis sttidy was measured witii tiie engmes EGR
system m operation Experimental determmation of tiie amount of EGR used at any
given enghie operatmg condition is exfraordmarily difficult requhmg a detailed analysis
of tiie composition of tiie enghie exhaust gas For the vast majority of tiie engmes tested
therefore EGR rate shnply was not measured
The fact tiiat at least some of tiie engmes used to generate tiie experimental heat
rejection data were equipped witii fimctionmg EGR systems ensures tiiat tiie
experimental data covers a broad range of combustion gas temperatiires Since no data is
46
available as to how much EGR was used at mdividual operatmg conditions h is
hnpossible to mcorporate a correction for EGR effect upon combustion gas temperattire
into tiie analytical metiiod This difference in assumed and acttial combustion gas
temperatiires tiierefore account for some of the difference between tiie predicted and
measured enghie heat rejection (Oler 2002)
25 Computer Simulation
Computer simulation is the next area where significant research is being
conducted There is obviously a need to accurately model automobile performance
before an actual automobile is produced The shear expense of prototypmg activities
such as wind tunnel validation is enormous Additionally design cycle thnes may be
significantly diminished through the application of computer-aided shnulation design
and manufacturing
Gerhard (2002) developed an engine simulation from experimental investigations
conducted on a high speed Diesel engine Evaluating heat balances and measuring steady
state temperature fields separately determined heat fluxes to the different engine
components A comparison with the results of cycle simulations carried out with
correlations for the local mean heat fransfer coefficient demonsfrated that the heat lost to
the cylinder walls and the resulting influence on the process variables could be accurately
modeled The steady state temperature fields occurring in the components during
operation could also be accurately predicted Gerhard noted that the design of
supercharged Diesel engines could become a problem of optimization A compromise
must be found between power density fuel consumption and consfruction effort The
numbers of design parameters that can be varied is too large to investigate
experimentally The expense and complexity make h hnpossible to find the opthnum
solution by experiments alone Computer simulations allow designers to solve problems
theoretically with many variables These calculations cannot substitute for experiments
but they could reduce the number of experimental tests necessary The time cost and
risks for the development of a new engine are decreased
47
Watts and Heywood (1980) give an excellent overview of computer shnulation
techniques tiiat are still used today Computer shnulations of tiie complete cycle for a
four-sfroke spark-ignition engine can be used to examine tiie effect of changes m
operating and design variables on engme performance efficiency and emissions These
types of shnulations are tiiermodynamic or zero-dimensional in stiiicture Theh
formulation is based on tiie ffrst law of tiiermodynamics witiiout hicludmg the details of
the combustion chamber and the shape of the flame front The mputs to the calculation
are typically basic enghie geometry engine speed intake mixture fiiel-ah equivalence
ratio exhaust gas recycle fraction intake manifold pressure combustion chamber wall
temperatures and parameters which define the mixture burning rate One-dhnensional
quasi-steady flow equations are used to obtam the mass flow through the valves during
the mtake and exhaust sfroke The first law of thermodynamics is used to determine the
condition in the engine cylinder during each portion of the four-sfroke cycle Empirical
correlations are used for heat fransfer between the gas in the cylinder and the walls The
cycle simulation then predicts the mass flow rate of fuel and ah through the engine
cylinder pressure unbumed and burned mixture temperatures heat fransfer to the
combustion chamber walls and work fransfer to the piston All of these outputs are
determined as fimctions of crank angle during the cycle The indicated power specific
fuel consumption efficiency mean effective pressure and mean exhaust temperature are
then computed for the particular engine operating pomt Enghie friction is then esthnated
to obtain brake values of these quantities The calculated cylinder pressure burned gas
temperature profiles equivalence ratio and fiiel composition can be used to compute the
rate of formation and decomposition of NOx This approach permeates the literature
Additionally Watts and Heywood (1980) evaluated the wide-open-throttle
predictions of a previously developed cycle simulation against experimental data from
both a naturally asphated and a turbocharged production enghie The shnulation was
then used to compare the fuel consumption NOx emissions and performance
characteristics of these two engines over the complete load and speed range This
example illusfrated the usefulness of a cycle simulation of this type evaluating two
48
different engme concepts to provide the same performance characteristics Various
aspects of tiie effect of heat fransfer on engine performance efficiency and NOx
emissions were compared These aspects compared tiie effect of variations and
uncertamty m heat fransfer predictions witii cold combustion chamber walls The hnpact
of ceramic materials on selected engine components over a range of combustion chamber
wall temperatures at engine compression ratios of 8 and 161 was also evaluated The
results of the ceramic component simulations were discussed in the previous adiabatic
engine section
A smaller turbocharged engine was determmed to be more efficient than the
larger engine at the same power level at speeds and loads typical of normal vehicle use
This increase in efficiency is attributed to improved mechanical efficiency At the
maximum brake torque speed the two engines provided similar brake power However
the smaller turbocharged engine exhibited higher brake specific NOx emissions than the
larger enghie at a given power output due to the higher relative load Consequentiy the
smaller engine ran at higher cylinder pressures and temperatures to produce equal power
Additionally studies were performed for the large naturally asphated engine to
examine the effect of reduced heat fransfer on engine performance efficiency and NOx
emissions Decreasing load and speed increased the heat fransfers impact Retarded
timing reduced heat fransfer due to reduced peak burned gas temperatures Heat fransfer
peaked at the stoichiometric equivalence ratio and decreased for rich mixtures Watts
and Heywood (1980) found that heat fransfer uncertainty did not significantly affect
simulation predictions of performance and efficiency Brake specific NOx mcreased as
heat fransfer was reduced due to the higher burned gas temperatures Watt and Heywood
used a standard heat fransfer model that was found throughout the literature with the
exception of including a burned and imbumed portion to the gas temperatures
Moeckel (1994) used a commercially available computational fluid dynamics
code Flofran to identify modifications that hnproved coolant distiibution throughout tiie
engine A shnplified 2-D approach was taken and experimentally verified The accurate
49
prediction of tiiree-dimensional heat fransfer fihn coefficients requhes exfr-emely large
models tiiat were not available at tiie thne of publication
DAdda Lisbona Occella and Maiorana (1994) outlmed tiie use of the
considerable development of recent analytical methodologies for engine design The
application of tiiese metiiodologies to the design of tiie coolhig system of a high
specific power enghie was performed For tiie opthnization of tiie coolant flow inside tiie
block and head passages two different codes have been employed The complete
analysis of tiie coolant circuh was performed usmg a one-dhnensional code developed at
the Fiat Research Center The results were mput as boundary conditions for a detailed
three-dimensional shnulation of the coolant passages mside the engine with the
commercial code STAR-CD The study focused on an mitial enghie design with possible
design modifications deduced analytically verified and tiien applied to tiie final enghie
solution This new approach for the optimization of the cooling system was considered a
useful tool for enghie design DAdda et al considered opthnization of tiie coolant
system in hitemal combustion engines a critical task m the design process Tlie tiiermal
condition influenced the stmctural integrity of the engine as well as performance and
emissions The design of high specific power engines has to ensure sufficient cooling
velocities to prevent metal temperature reaching excessive levels It has been
demonsfrated that the thermal condition of the engine is not very sensitive to the total
coolant flow rate but it is sensitive to local geometrical characteristics of the passages
and coolant velocities
The current need for time reduction in the design process does not allow an
experimentally based trial and error approach The development of analytical
methodology helped engine designers in the definition of the cooling system primarily for
the coolant passages inside the enghie
The approach outlmed by DAdda et al (1994) has a common theme throughout
engineering first use a macro approach to find a sound design and then follow up with a
more detailed simulation andor experimentation Results usmg this approach appUed to
engine cooling passages were promising in reducing design cycle thne
50
Woodward (1995) offered another tiiermodynamic approach and improvement to
the fraditional limited pressure ah-cycle that has an unrealistic constant-volume coolhig
model between the cylhider exhaust and cylinder mtake By substituting isenfropic
expansion throttlmg and constant-pressure cooling m the place of constant volume
cooling a better ideal cycle for the actual processes is formulated This model is better
equipped to handle the prediction of 30 losses to the engine coolant This essential heat
rejection is predicted from the new model and a second law analysis
Bulaty Codan and Skopil (1996) reiterated the common theme of shrinking
design cycle times Powerful personal computers and technically mature simulation
software were driving this new surge for decreased cycle times Hence the calculation of
engine performance had not only become reliable but also far more economical than
experimentation The sharp rise in the power density of the modem engine was primarily
due to the parallel development of reliable turbochargers Engine builders have provided
increased demand for turbocharged equipment Thus these engine systems have become
considerably more complex and flexible
Additionally to add code to existing simulation software for the future
turbocharging demand would have been a costly modification Clearly an augmented
system that allowed for insertion into existhig codes was a necessity The requhed
turbocharging computer simulation program would need to be user-fiiendly refiable and
accurate Bulaty Codan and Skopil (1996) believed tiiat they developed a necessar
useful computer shnulation of turbocharghig systems However the details of the
simulator are not presented
Mohan Ariel Yang and Johnson (1997) outiined a similar code which was an
enhancement of the Vehicle Engine Coolhig System Shnulation (VECSS) developed at
Michigan Technological University and modified to mclude a turbocharged Diesel enghie
with a charge ah cooler model The radiator and charge ah cooler model showed good
agreement witii experhnental data These models consisted of heat balances and a
Colbum or NusseU type analysis to find tiie heat transfer coefficients~a typical approach
The code showed that accuracy for the thermal performance was within 15 at the
51
middle to high loads and 5 at low loads The VECSS code uses a standard convective
Nusseh correlation Additionally Mohan et al (1997) pointed out that engmes have a
significant amount of radiation heat fransfer due to the high temperatures of gases as well
as carbonaceous particles formed during combustion Standard forms of radiation heat
fransfer equations were used witii experimentally deteimined coefficients Turbocharger
performance maps were used in the simulation
Intercoolers or charge air coolers are heat exchangers located between a
turbocharger compressor and the enghie These devices cool the ah that leaves tiie
compressor thereby mcreasmg the charge density and performance of the engine There
were few models m the literature that used fiill gas dynamic or wave-action
shnulation Furthermore these models tended to approximate the behavior of tiie
intercooler by assuming constant performance under all operating conditions A full-
wave action intercooler model was developed that predicts intercooler performance at
different engine operating conditions Intercoolers pass hot ah to be cooled through a
heat exchanger exposed to a coolant Like all heat exchangers the design goal was to
expose the hot gases to the maxhnum allowable cooling surface area while minimizing
the pressure drop One approach to quantify the performance of an intercooler is its
effectiveness Heat exchanger effectiveness is defined as the ratio of the actual heat
fransfer to the theoretical maximum heat fransfer This approach is a standard analysis
that can be found in any undergraduate heat fransfer text Intercooler performance varies
sfrongly with the mass flow rates through the heat exchanger As the mass flow rate of
the charge ah mcreases the effectiveness drops for a given coolant flow rate Thus the
performance of the intercooler varies over the load and speed range of the enghie
Another hnportant characteristic of the intercooler is the pressure drop This pressure
drop impahs engine performance Therefore it must be accounted Computational fluid
dynamics (CFD) is beginning to become prevalent m intercooler design CFD does and
will contmue to accurately characterize heat fransfer versus the requhed pressure to
overcome flow restriction (Bromnick Pearson amp Wmterbone 1998)
52
Worden and Zehr (1999) discussed the critical nature of coolant flow velocities to
the durability of the engine itself The geometries of the mdividual component parts used
m the system should be designed to minimize turbulence tiiat affects the type and rate of
corrosion Additionally flow passages must be sized to maintain mhuinum coolant
velocities In high velocity flow a combination of the mechanical damage produced by
the imphigement on a metal surface and the inherent corrodibility of the metal may result
Aluminum alloys are more prone than other alloy metals to corrosion damage because of
the low inherent haidness of the material Coolant velocities for the flow were predicated
in the individual cooling system components based on CFD analysis Erosion-corrosion
damage is shown to be a function of the type of coolant and the angle of attack of the
fluid sti-eam with the casting wall surface
26 Adiabatic Engine Research
An adiabatic engine is a term used to describe any engine where the heat
rejected to the coolant is reduced by some means Techniques mclude coating tiie
cylinder walls and using emulsified fuel (water added) or oil (mstead of water) as the
coolant
Kamo (1977) made a clahn of greatly hnproved thermal efficiency due to
turbocharghig an engine with thermal msulation
Wallace Way and VoUmert (1979) hivestigated tiie constant temperatiu-e Ihnitmg
case An existhig and well-proven Diesel cycle simulation program was apphed to the
Perkins 6354 6-cylhider 4-cycle Diesel enghie A relatively thm layer of 2 mm bonded
silicon nitride to the cylinder walls was used to reduce heat loss to coolant by
approxhnately 50 Such materials were associated witii isotiiermal operation of the
enghie The wall temperattire had mmhnal cyclic fluctiiations approachhig a temperattu-e
of 300degC Wallace et al found tiiat isotiiermal operation of the enghie resulted m little
hnprovement of tiie mdicated tiiermal efficiency The reduced heat loss to coolant was
fransferred primarily to the exhaust enthalpy This conclusion was based on cycle
calculations witii unlhnited maxhnum cylmder pressure and fixed heat release thnmg and
53
duration The benefit of increased exhaust entiialpy could be realized fiilly only when a
turbocharger was added to tiie enghie Substantial improvements m Diesel engmes
indicated thermal efficiency could be achieved only if adiabatic enghie operation was
approxhnated witii gams of tiie order of 14 for fully adiabatic operation or 7 for
semi-adiabatic operation Materials and methods of constiiiction showed that the
requhements for tme adiabatic operation presented great practical difficulties (Wallace et
al 1979)
Way and Wallace (1979) extended theh purely theoretical investigation with the
addition of a turbocharger Turbocharging was frequently suggested as a way of
improving the thermal efficiency of engines However m the past the gains had not
proved sufficient to justify the additional expense Way and Wallace hypothesized as
discussed in thefr previous paper that when an insulated engine was used to reduce heat
losses to a minimum the increase in exhaust temperature should make the compounded
engine more atfractive The investigation showed the effect of reduced heat loss on the
interaction between an engine and the turbocharger Turbocharging hicreased the
efficiency by a significant margm while the effect of heat suppression on engine
efficiency alone was relatively small The turbocharger performance did increase due to
the increased exhaust temperature This combination was necessary before the viability
for any partially insulated engine scheme to be successful
Way and Wallace (1979) found that the use of turbo compounding enabled the
thermal efficiency and correspondmg torque to be raised by 2-3 percentage pomts Turbo
compounding is accomplished through multiple turbocharger and hitercoolers designed
for the flows and temperatures that they would see Turbo compoundmg significantly
improved the matchmg of the turbocharger thus enablmg a smaller turbhie to be fitted
This configuration hnproved the ah-fuel ratio hence hnprovmg efficiency and smoke at
low engine speeds hnprovements that are more significant would be achieved at low
engine speeds by hnplementmg a variable turbhie geometiy device Reduction of heat
loss with conventional msulatmg techniques without turbocharghig yields Ihnited
hnprovements in efficiency Way and Wallace clahned that tine adiabatic operation
54
would resuh m much more drastic improvements m efficiency of up to 10 percentage
pomts Altemative forms of compoundmg such as the use of variable geomefry ttirbmes
and splh power arrangements could become more cost atfractive as fuel prices increase
Watts and Heywood (1980) found tiiat using ceramic-coated engme components
witiiout tiiermally isolating tiie ceramic material from its metal support and coolant
system produced modest reductions in heat fransfer However use of isolated ceramic
materials and high wall temperatures substantially reduced heat fransfer This reduced
heat fransfer and decreased the volumetiic efficiency and power Brake specific fuel
consumption remained constant Exhaust temperature and brake specific NOx hicreased
substantially From a computer shnulation the use of ceramic material for the piston
crown and cylhider head proved to be tiie most effective means for reducmg heat fransfer
Watson Kyrtatos and Holmes (1983) described tiiat from a first law of
thermodynamics analysis the limited heat rejection engine had merit and potential
To veil (1983) discussed the benefits of applying thermal insulation to the exhaust
ports and combustion chamber The reduction of heat loss to the coolant system has
always been of considerable interest as this would allow a reduction in the cost size
weight and power requhements Traditionally the exhaust port lengths are minimized
and the engine internal coolant chcuit is configured to provide high coolant velocities in
critical areas while using flood cooling elsewhere Higher fuel efficiencies and shrinking
volumes to accommodate cooling systems of sufficient size in high-powered vehicles
have made the reduction of heat loss to the engine coolant mcreashigly hnportant Tovell
also used a computer shnulation of a highly rated turbocharged DI tmck engine to
determine the effectiveness of reduced heat fransfer engmes Comparisons were made
between a standard enghie and engines with the exhaust port cylhider head piston and
cylinder liner insulated Also examined was the necessity of modifying engine
conditions when heat losses through the combustion chamber walls are retarded Tovell
also sfressed the difficulties in practically and economically insulating actual enghie
components However the successfiil testmg of a ceramic liner located in the exhaust
55
duct of an enghie during more than 1000 hours of engine operation was deemed
significant
Tovells (1983) shnulation found favorable results to insulating the engine
components By eliminating heat loss to the coolant system fuel consumption was
reduced by approximately 75 The effects of this msulation were high exhaust
temperatures and cylinder pressures The largest reduction in fiiel consumption and the
associated heat loss to coolant was obtained by insulating the piston crown or cylinder
head Tovell stated that reducing heat losses by partially hisulathig the piston crown top
of the bore and exhaust port should be feasible in existing engine designs The
simulation predicted a reduction of full power fuel consumption by about 46
Additionally higher exhaust temperatures must be tolerated with exhaust manifolds and
turbochargers capable of operating at higher temperatures An increase in power unit
efficiency to 50 can be obtained if exhaust energy can be recovered The IMEP of the
reciprocating engine should be monitored to avoid excessive maximum cylhider
pressures The pollution impact was also discussed An increase in NOx emissions was
expected but hydrocarbons particulates and smoke should be reduced The shnulation
also predicted that engine noise would be slightly reduced Fan noise could also be
reduced by 2 to 4 dB (Tovell 1983) This noise reduction is significant as 3 dB
represents a noise reduction of a half
Kadoli and Aknamurthy (1984) found that a substantial reduction m tiie heat loss
to the coolant resulted m an mcrease m cylhider work and exhaust gas energy They
studied the performance of a semi-adiabatic enghie through compound coolhig which
was defined as a cooling method using external oil cooling and an intemal methanol
water-fuel mixture The purpose of the oil coolhig is to partially insulate the cylhider
head and walls as the thermal conductivity and specific heat of tiie oil are lower tiian
water thereby mcreasing the enghie load To reduce thermal loading watermetiianol
was mjected at the mtake manifold Oil cooling and metiianol mjection lowered tiie
BSEC with energy savings of 4-6 In addition NOx emissions were lowered
56
fridividually botii oil coolhig alone and oil coolmg witii water mjection versions
provided lower values of BSEC witii energy savmgs of 3-5
Hashem (1989) presented that tiie waste energy potential by exhaust gases was
178 to 303 of tiie energy mput at a temperattire range of 170degC to 670degC Tlie
tiiermal content of cooling water represents 92 to 132 of tiie engine energy mput
The energy lost to tiie surroundmg by convection in tiie still ah state represents 32 to
57 of the energy mput (Hashem 1989)
Woods Bryzik and Swartz (1992) discussed that removmg tiie water-cooling
system usmg sfrategic oil cooling and upgradmg critical engine component materials
reduced the heat rejection to the radiator of a conventional water-cooled engine This
approach has been identified as the low heat rejection enghie (LHRE) Many of these
LHREs do not apply in-cylinder msulation Dovrasizing of the coolhig system in a non-
insulated LHRE resulted m a sigiuficant increase in structural temperatures Reduced
component life increased heat loading and hicreased ahflow resistance occurred
Volumetric efficiency losses lead to increased intake manifold pressures which increase
after cooling heat rejection offsettmg in-cylinder heat rejection reductions An advanced
LHRE employs the use of in-cylmder insulation This additional step reduces the heat
rejection and stmctural temperatures Intake ah after coolhig is reduced which is a
significant portion of the overall heat rejection
Adiabatic engine intake boost pressure was predominantly confroUed by the need
to maintam air density and not volumetric efficiency factors Boost pressure was
primarily dependent on the airflow requhements and resulting ah temperature factors
By reducing the ah-fuel ratio requhements a sigiuficant reduction of the intake ah
temperature and boost pressure would occur thereby further reducing heat rejection
Woods et al (1992) reiterated that the future adiabatic engine should use reduced ah-fiiel
ratios be non after-cooled and use turbo compomiding to utilize the high level of
available exhaust energy Comprehensive combustion optimization was not completed
A single cylinder non-aftercooled fully insulated engine produced a 52 reduction in
radiator heat rejection but no change in net fuel consumption Combustion optimization
57
is hypotiiesized to significantiy enhance tiie system fiiel consumption of the fiiUy non-
aftercooled msulated enghie and to fiirtiier reduce heat rejection
Witii tiie exception of Kadoli and Aknamurtiiy (1992) as discussed above there
was not a successfiil demonsfration of a real low heat rejection system The most
sophisticated approach to date comes from Rakopoulos Andritsalds and Kyritsis (1992)
who employed the second law of tiiermodynamics to analyze the LHRE It is a
significant tool for understandmg tiie utilization of tiie fiiels ability to produce reversible
work m the hitemal combustion enghie The hreversibilit) from combustion is defined
by tiie subfraction of the system availability hicrease from the availability fransferred mto
the combustion system This energy is fransferred by work heat and fuel flow mput
Rakopoulos et al proved that this subfraction leads to an expression connectmg the rate
of hreversibility production This expression is applied m this work for the fuel
preparation reaction and work and heat fransfer rate The hreversibility balance also
provides important information for the combustion analysis that caimot be evaluated with
a first law analysis
From the analysis it was evident that the sum of useful mechanical work per
cycle plus the exhaust gas availability hicreases as the heat rejection decreases Thus the
second law analysis showed that the limited heat rejection seems to have an advantage
especially when combined with recovery devices This result is in fiill agreement with
the results of Watson et al (1983) that approached the problem with a first law analysis
Rakopoulos et al (1992) also discussed how the irreversibility must increase as the
engine speed increases
Yoshimoto Tsukahara and Kuramoto (1996) discussed using water-emulsified
fuel and oil cooling (replacing waterantifreeze mixtures) in engines This technique
reduced NOx and smoke emissions Additionally these techniques lowered combustion
temperature promoted mixing of sprayed fuel with ah and enhanced water gas
reactionthat resulted in improvements in the overall combustion process Yoshimoto et
al discussed that there was little agreement that the hnproved fiiel consumption with
emulsified fuel operation was more likely the sfrong influence of operathig conditions
58
enghie variables mjection characteristics and emulsion properties These researchers
showed that cyclmg loss had a sfrong influence on fuel consumption or thermal
efficiency The coolhig loss during the combustion process was determined from the gas
pressure in tiie cylhider The heat fransferred out of tiie system to tiie cooling water
through tiie enthe cycle was measured by varymg the outiet temperature of the coolmg
water The hidicated thermal efficiency was found to correspond dhectiy to changes m
the coolhig loss Lower cooling losses than with water-free gasoline and oil coolhig were
observed with the emulsified fuel due to the evaporating water and the combustion
promotion Therefore it was established that the reduced cooling loss hnproved the
indicated thermal efficiency The cycle-to-cycle variation of maximum combustion
pressure was the same as with water-free gasoline and oil cooling regardless of load and
injection timing conditions when a fuel emulsion with water was used The NOx
concenfration was reduced by about 40 Additionally the specific fuel consumption
was hnproved by 5 to 9 at rated output It was confirmed that the emulsified fuel
improved the degree of constant volume of combustion and reduced the cooling loss
during combustion Cooling loss and indicated thermal efficiency were shown to closely
correlate (Yoshimoto 1996)
Taymaz Gur and Halici (1998) discussed the effect of msulated heat fransfer
surfaces on dhect injected and turbocharged engine fuel consumption and cooling
systems The results indicated a reduction in fuel consumption and heat losses to the
engine cooling system of the ceramic-coated engine The efficiency of the theoretical
engine cycle depends dhectiy upon the temperature difference between the hot and cold
portions of the engine cycle Therefore there is an advantage in hicreased combustion
chamber temperatures If combustion gas energy can be contained through the expansion
cycle then the efficiency of hitemal combustion engmes can also be hicreased While
several researchers have reported improvements in thermal efficiency with a LHR engine
others have noted that ft declmed With compound techniques up to 65 suppression of
normal heat loss to the coolant is possible with ah-gap wall systems or with very high-
grade ceramics Partially stabilized zirconium is a commonly used ceramic The effect
59
of msulated heat fransfer surfaces on dhect injected and turbocharged engine fuel
consumption and cooling system was again analyzed A standard engine and ceramic-
coated engine were examined at different engine speeds loads and mjection timmgs
The results showed a reduction in fuel consumption and heat loss in the ceramic-coated
engine Application of ceramic coating provided a 5-25 decrease in heat flow rate to
the coolant
From the timeline shown above there have been significant steps achieved in
placing a ceramic coating on the inside surfaces of Diesel engines While the process has
come a long way in the past several years it has not yet shown to be an economical
proposition Additioneilly NASA has provided several research grants over the years to
hnprove the ceramic coating processes The improvement of a LHRE to date has most
likely been disappointing From a general concept the LHRE with turbocharging is a
logical improvement but the performance gains have not been realized (Taymazet al
1998)
60
27 Other Topics Relating to Diesel Engines and Heat Rejection
The last two articles presented in tiie literattire search reveal an mterestmg frend
m engine coolhig research Engme designers are mvestigatmg differing schemes of
enghie coolhig to gam relatively small hnprovements m performance The suspected
reason would be tiie governmental regulation that is continually tightenmg
Ap and Gohn (1997) hivestigated an approach to enghie coolmg The mtent of
this study was reduced cost of all engme-coolmg components reduced gasoline
consumption reduced weight of the enghie cooling system and hnproved thermal
comfort m the passenger compartment This basic concept consisted of addmg a small
electric water pump instead of the larger conventional engine-driven water pump This
system ensured enghie cooling at speeds up to 120 kmh under convective coolhig m
normal conditions This condition fulfills 95 of the flow requhements of a vehicle at
the same performance level as a conventional cooling system The remaming 5 of the
reqmrements-at vehicle speeds greater tiian 120 kmh and hill climbmg-have been
resolved by the use of nucleate boiling in the cylmder head The nucleate boilmg
phenomenon has been discussed previously in the proposal and is consistent with this
literature Enghie power and vehicle weight were frending upward while at the same
time the engine cooling specification remained unchanged (ie the validation tests of hill
climbing 12 or 13 grade with and without frailer and the maximum speed at high
outside ambient temperature) The physical parameters of the engine cooling system
such as coolant temperature and flow rate had been increasing Water pump power
ranged from 1 to 2 kW depending on the engine size Liquid chcuit pressure has been
mcreasing from 18 to 25 bars caushig the cost to increase particularly the hoses
Reasonable enghie coolhig and thermal comfort performance were confirmed
except for an over temperature of 10degC to 20degC on the cylinder head at full enghie load
This problem was proposed solved by simple geometric modifications of intemal
coolant passages of the cylinder head Heater performance for the passenger
compartment was improved during the idle and fransient otherwise
61
Kem and Ambros (1997) proposed a new concept m engine coolmg The coolhig
system was designed based on critical operathig conditions as mentioned above For
tiiermally uncritical partial-load conditions where a vehicle normally operates tiiermal-
management measures offer considerable potential for reducmg the hnpact of tiie motor
vehicle on tiie envfronment Actuators m conjunction with mtelligent confrol systems
could be used to enhance the automobile hnpact on the environment and passengers As
part of its thermal-management sfrategy Behr is developmg new kmds of actuators
system configurations and confrol algorithms that use demand-responsive confrol and
supply of mass and heat flows Operation mode-dependent confrol measures depended
on the priority of the confrol objectives requhed The mtelUgent system could adjust the
configuration to reduce fiiel consumption pollutant emissions the cold-start phase
thermal sfress and mechanical loads to be seen in vehicle components A theoretical
study showed a potential savings of up to 50 of the power demand of fan and coolant
pump Measurements on a tmck showed savings of more than 18 of fuel consumption
(Kem amp Ambros 1997)
62
CHAPTER m
METHODOLOGY
The general metiiodology utilizes tiie resuhs of tiie ideal cycle models for botii tiie
nattirally asphed spark ignition (SI) and ttirbocharged compression ignition (CI) engmes
The background and ideal models of tiie cycles were not provided to obtam quantitative
results but to understand the physics governing the power cycle and to create a concise
physics-based heat rejection analysis from actual engine data
31 General Methodologv to Approximate Engine Heat Rejection
The origms of the heat rejected to the coolant are the heat fransfer between the
combustion gases and the cylinder walls and the power dissipation due to mbbing friction
between moving engine components
Qcoolant = Qcyl + Prf bull (31)
Predictions of the heat fransfer to the cylinder walls are obtained from a Nusselt
number correlation while estimates of the fiictional power dissipation are based on the
engine power and efficiency
To quantify the heat fransfer from the combustion gases it is broken into
contributions from convection and radiation heat fransfer For both SI and CI engines
convection is the dominant heat fransfer mechanism Convection is especially dominant
for the spark ignition engine where it is assumed that the radiation contribution is
negligible The generalized expression for the heat fransfer is
e^ =H^(f -T)+KA^a(T-T)+P (32)
63
In Equation 32 tiie convective heat fransfer coefficient h is calculated from
correlations of the form
Nu = fRe) (3 3)
or
hiref _ k
PV1 g^ref (34)
Development of the correlation is based on experimental data from which the
convective heat fransfer coefficient and characteristic combustion gas velocity are
obtained The radiation heat fransfer coefficient is assumed constant throughout tiie data
reduction process for the CI engine
The presentation of the method for predicting heat rejection to the coolant is
broken mto three components
1 development of the engine power correlation from w hich the fiictional
power dissipation air and fiiel flow rates and the corresponding combustion gas velocity
are calculated
2 development of the heat fransfer correlations for estimatmg the rate of heat
fransfer between the combustion gases and the cylinder walls and
3 application of the engine power and cylhider heat fransfer correlations to
calculate the net heat fransfer to the coolant due to convection to the cylinder walls and
energy dissipation resultmg from friction between moving engine components This
application will be applied in the Results and Discussion chapter of this dissertation
As discussed above the first step in the derivation is to review the ideal model of the
process as previously outlined in Chapter II These guides provide insight to the
underlying relationships and guide the reduction of the actual engine data
64
The indicated power P^ is the enghie power output based on tiie hitegral jPdyen^
for tiie compression and expansion sfrokes in a single cylinder tiie number of cylhiders
and tiie rate of work producmg cycles (half of tiie engine speed for four-cycle engines)
The indicated enghie power output is reflected m two components tiie brake power
output from tiie engine and tiie friction power dissipation
P=Pi+Pf (35)
Following Heywood (1988) tiie fiiction power is defined to include mbbmg friction
between movmg engine components pumping vork during the intake and exhaust
sfrokes and the accessory power requirements
The efficiency of the enghie in converting the energy available through fuel
combustion into indicated power is defined as the fuel conversion efficiency
^QH
The fuel flow rate is expressed in terms of the airflow rate and the ah-to-fuel mixture
ratio
rh=-^ (37) AF
The ah induction rate for a particular engme is determined by the enghie
displacement engine speed and the fixed and variable elements of the ah intake system
Specifically the fixed elements include the ah filter carburetor body intake manifold
and the intake ports and valves The SI engine has an additional prmciple variable
element~the throttle plate The afr induction rate is quantified in terms of the volumetric
efficiency which is the ratio of the ahflow rate to the engine volume displacement rate
65
^ ^ - (38)
Poi^v
The volumetric efficiency is a non-dimensional expression of the mass flow rate through
the engine and is directly dependent on throttle position For normally asphated engines
the volumetric efficiency typically varies between approximately 025 with the throttle
closed and 085 with the throttle wide open For turbocharged engmes the volumetric
efficiency is typically between 08 and 30
Combirung Equations 37 and 38 and substituting into Equation 35 yields
PoQ bdquo n V ^^f = P +P (39)
Rearranging and dividing through by the volume displacement rate results in
_I^^rjynf^^-^^ (310) v^y^ ^ip vy^
or
e^MLfmev (311) bmep = wnj ^^jff- - M^P
where
P jmep = mdash ^ = brake mean effective pressure (3-12) V laquo
p frnep = mdash ^ = fiiction mean effective pressure (3-13)
^D 2
66
Dividmg the brake and friction power by the volume displacement rate has the effect of
normalizing the influences of engine speed and displacement The resulting ratios have
the units of pressure which is tiie basis for the term mean effective pressure The
indicated mean effective pressure is by definition the brake mean effective pressure plus
the friction mean effective pressure
The operation of normally aspired SI engines and turbocharged CI engines is
fundamentally different In SI engines the fuel is mjected with the cylinder charge either
at the throttle body or near the cylinder intake ports Due to emission and ignition knock
limitations the ah-fuel ratio is held approximately constant at the ideal stoichiometric
ratio In CI engines the fuel injection occurs directly into the cylinder at approximately
the end of the compression sfroke With the higher compression ratios and cylinder
charge temperatures of CI engines the fuel immediately combusts Throttling of CI
engines is accomplished by regulathig the mjected fuel fiOw thereby changing the ah-
fuel ratio In contrast to SI engines the air-fuel ratio varies widely with values between
15 and 65
From Chapter II the fundamental expression defined was the indicated mean
effective pressure as a function of the available mean effective pressui-e Equation 230 is
repeated here for clarity
Pre _ bdquo bdquo POQL net _ bdquo bdquo Ha^LH
-V 1
imep = - ^ = 7]ft] ^
By examination of this equation the only variable from the SI enghie operation that is
not constant is the volumetric efficiency Compared to the CI engine operation two
parameters are not constant Those two parameters are tiie volumetric efficiency like the
SI engine and the air-fuel ratio
67
32 Naturallv Aspired Spark Ignition Engine Power Methologv
For the spark ignition engine the fuel conversion efficiency is fimctionally
dependent on the ah-fuel ratio Experimental data presented by Edson and Taylor (1964)
suggests that for slightly rich mixtures the relationship is linear such that
AF
where AF is the ideal stoichiometric value of 146 and riy is the coiTespondmg fuel
conversion efficiency Substitution of Equation 314 into Equation 311 yields the final
expression for bmep
bmep = TjyTj ^p- - finep bull (3-15)
A plot of the brake mean effective pressure versus the available mean effective
pressure for the enthe data sets from tiie eleven normally asphed SI engines is shown in
Figure 31 A legend for this figure indicating the plot symbols used for each enghie is
presented in Table 31
68
Brake Mean Effective Pressure versus Available Mean Effective Pressure
1200
1000-
8 0 0 -
600 bull
400
0 -
y= = 037x - 13569
093
o-
(poundn o
D r
^ 4
o
S
- oA
A
^ ^ 9 ^ASS^Ufml
9Ajj^tgjwSBy^
^
A
500 1000 1500 2000 2500 3000
Amqgt (kPa) rj p QwHMf)
35C0
Figure 31 Brake Mean Effective Pressure versus Available Mean Effective Pressure for SI Engines
69
- 20L CVH Split Port 14 E n ^ e (CT120)
raquo 20L DOHC Zeta 14 Engine
bull 23L Dual Plug 14 Engine Dynomometer Data
bull 25L 4V V6 Engine Dynomometer Data
- 30L 4V V6 Engine Dynomometer Data
- 30L Vulcan V6 Engine (1995-14 Ranger)
40L 95 EI E n ^ e Dynomometer Data
deg 40L SOHC V6 Engine Dynamometer Data
bull 54L4VV8 Engine
laquo 54L 2V V8 Engine Dynamometer Data
o 68L 2V VIO Engine Dynamometer Data
Table 31 Eleven Nattirally Asphed Engines and theh Corresponding Data Symbols
From the figure h is noted tiiat tiie relationship between bmep and Amep is
reasonably consistent and as expected may be approxhnated with a linear least squares
curve fit Based on Equations 316 and 317 tiie slope and mtercept from the curve fit
may be equated to the fiiel conversion efficiency and fiiction mean effective pressure
respectively
7 bull=37 ( - ^
and
finep = ne(yPa) ^ - ^
70
The Amep calculated from tiie experimental enghie data utilized the stoichiometiic ah-
fiiel rather tiian the acttial experimental value Consequentiy tiie fiiel conversion
efficiency obtamed from the curve fit is a stoichiometiic value The acttial values of fiiel
conversion efficiency at the respective experimental ah-ftiel ratios varied between 28
and 40 As shown m Figure 31 there is a high coefficient of detennination of 093
Recalling that
imep = bmep + finep (2S)
the actual engine data is very similar to the ideal SI enghie model shown m Figure 24
When the process is reversed in the Results and Discussion chapter Equation 315
can be rearranged and combmed witii Equation 316 and 317 to yield the volumetiic
efficiency
_ AFbmep-^136)
In application to the heat transfer predictions the engine speed and power are specified
from knowledge of the road load and power trahi ratios and efficiencies This allows
dhect calculation of the bmep With the bmep known Equation 319 can be used to
calculate the volumetric efficiency and thereby the air mass flow rate through the
enghie which is the desired result of the enghie power correlation for SI engines This
flow rate is applied to the heat transfer correlation to determine a characteristic RegtTiolds
number for flow through the cylinder
33 Naturallv Aspired Spark Ignition Engine Heat Transfer Methodologv
The convective heat fransfer to the cylinder walls is characterized in terms of a
convective heat transfer coefficient
71
where
4Q ^o- deg T7~Tr cylinder heat flux 01)
N^nB
X Boz 4 ^
= cylmder bore (322)
Assuming a cycle-averaged combustion gas temperature T^ of 447C (Heywood 1988)
and wall temperature T^ of 110degC based on constant coolant temperature results in a
temperattire differential (f -T^) of 337degC This temperattire differential of 337degC has
been used for all SI engine experimental data reduction in the current investigation
Direct measurements of the cylinder heat fransfer rate Qcyi are difficult to
accomplish and are not generally available Instead the cylinder heat fransfer rate must
be deduced from the overall heat rejection to the coolant which also includes the effect
of mbbing friction
Qcyl = Qcoolant-Prf- (3-23)
The fiiction power dissipation P and the correspondmg fiiction mean effective pressure
finep include contributions associated with mbbing friction between moving
components pumping work during the mtake and exhaust sfrokes and accessory power
requhements
72
finep = rfinep -- pmep -i- amep (324)
For analysis of experimental engine heat rejection data the fraction of the friction power
dissipation due to mbbing friction is taken as a constaih
rfinep ^ ^ ^ - ^ = 06 (325) finep
Recall that the fiiction mean effective pressure was determined as pait of tiie power
correlation of the previous section The value is consistent with recommendations from
the literature and is chosen to yield the best collapse of the experimental data It should
be noted that the rubbing fiiction is a relatively small contribution to the total heat
rejected to the coolant Consequently the overall accuracy of the heat transfer
correlation is relatively insensitive to the choice for the rfinepfinep ratio
With Equation 325 the cylinder heat fransfer rate may be found from
experimental heat rejection to coolant data using
Qcyl = Qcoolant -06finepVn Y^ (326)
and with application of Equation 320 the corresponding convection heat fransfer
coefficients can be determined
Variations of the convective heat fransfer coefficient are correlated in terms of a
general Nusselt number versus Reynolds number relationship The Nusselt number is
defined as
Nu = ^ (327)
and for application to an engine the Reynolds number is defined as
73
Re = (328)
The characteristic gas velocity is
7 ^^
pnB^N (329)
givmg
Re Am
KBN^P
For Equation 330 the mass flow rate is found from
m = m^--mf =m^ 1 + -AF)
(331)
With Equations 327 and 328 the Nusselt number versus Reynolds number can be
determined from the data for eleven normally aspired SI engines and are presented in
Figure 32
74
innon
Nus
selt
Num
ber
5 sect
1
y = 23827xtrade
R = 09295
Nusselt Nufnber vei-sus Reynolds Number
cb
)0 1000 10000
Rejuolds Number
10O0OO
Figure 32 Nusselt Number versus Reynolds Numbers for Eleven Normally Aspirated SI Engines
These data are well correlated by
Nu = 13SRe 0794 (333)
These data follow the conventional form of a power law relation with a high coefficient
of determination 093
The power and heat transfer correlations can be applied to predict the heat
rejection from an arbifrary SI engine by applying the foUo^ ing procedure
Specification of the enghie speed and brake power requhement witii Equation 319
allows calculation of the volumetiic efficiency and correspondmg mass flow rate
With mass flow rate determined a corresponding Reynolds number is obtamed from
Equation 330
75
Equation 333 is applied to determine the Nusselt number and Equation 327 is used
to calculate the corresponding heat fransfer coefficient
The rate of convected heat transfer from tiie cylinder walls and to the coolant is
obtained from Equation 320
The additional heat to the coolant from rubbing fiiction is calculated as prescribed by
Equation 325
34 Turbocharged Compression Ignition Engine Power Correlation
As previously discussed there are two additional complications hi the analysis to
the turbocharged CI engine heat rejection These differences are the stronger presence of
the radiation heat transfer mode and the coupled variations in ah flow and ah-fuel ratio
that are dependent on the turbocharger operation For convenience Equation 315 and
the definition of available mean effective pressure are restated as
bmep - TjfAmep = rjj-rjy ^ - finep
This relation is used to compare the experiment data for the CI engines The results are
presented in Figure 33 showing the brake mean effective pressure versus the available
mean effective pressure with the resulting linear regression
76
Brake Mean Effective Pressure versus Total Available Mean Effective Pressure
2500
bull 73 NGD 250 IHT 99-00
bull MY2000 3126B Banking
- MY2001 3126B Banking
laquo LionVe
mdash - Linear (Correlation)
1000 2000 3000 4000
Amep (kPa) TI p QLH (AF)
Figure 33 Brake Mean Effective Pressure versus Available Mean Effective Pressure for Turbocharged CI Engmes
The slope of tiie line again directiy determines tiie fuel conversion efficiency and
the mtercept determmes the fiiction mean effective pressure
Tif = 4 0 (334)
finep = 135 (kPa) (335)
The coefficient of determination is very sfrong at 096 Figure 33 was anticipated from
tiie ideal model predictions shown hi Figure 213
All of the ttirbocharged CI engines analyzed were nm very lean Ah-fiiel ratios as
high as 55 compared to the stoichiometiic value of 145 where typical The lean
operation of the CJ enghie dictates that the fiiel conversion efficiency is essentially
77
constant For the turbocharged CI engines the fuel conversion efficiency is constant at
40 hi comparison SI engines have a constant stoichiometiic fuel conversion
efficiency of 37 but tiie actual fuel conversion efficiency ranged from 28 to 40
depending on how rich to lean respectively
In the experimental data the ahflow rate and air- fuel ratio are known However
the underlying relationship between the volumetric efficiency and AF ratio must be
determined From the ideal turbocharged CI model the volumetric efficiency is
determmed by the interaction with the turbocharger The turbocharger pressure ratio or
corresponding rate of energy supplied to the induction airflow is m turn dependent on
the inlet conditions to the turbine and turbine power exfraction The general approach to
handle the coupling between the enghie and turbocharger will be to correlate the
turbocharger pressure ratio to the available mean effective pressure The volumetric
efficiency can then be correlated to the turbocharger pressure ratio With the volumetric
efficiency known the heat transfer correlation will then be developed
A plot of volumetric efficiency versus turbocharger pressure ratio for the four
collections of CI engine data is presented in Figure 34 As expected this data is well
correlated by a linear curve fit
7 =08031 P (336)
78
200
E 3 100
050
Volumetric Efficiency vs Turbocharger Pressure Ratio
y = 08031x
R = 09705
bull 73 NGD 250 HT 99-00
bull MY2000 3126B Barking
- M 2001 3126B Banking
bull LionV6
Linear (Correlation)
150 200
Turtmcharger Pressure Ratio
250
Figure 34 Turbocharger Pressure Ratio versus Volumetric Efficiency for CI Engines
Figure 35 contains a plot of turbocharger pressuie ratio versus available mean
effective pressure for the four collections of turbocharged CI engine data From the ideal
CI enghie analysis h is expected that this data may be well correlated by a relation of the
form
P = 1 -I- C Amep (337)
From the figure it is noted tiiat data from tiie 73 L NGD and Lion V6 engines are
reasonably consistent and may be represented by
P = 1 -h 025 MPa
Amep (338)
79
The 3126 B Engine however does not exhibh the expected linear variation as all data
points were obtahied near the wastegate limited maximum pressure ratio of
approximately 25 It is presumed that data taken at loyverAmep values would yield
lower pressure ratios that would follow the expected linear relationship with a
significantiy higher slope tiian that noted for the 73 NGD and Lion V6 engines
Turbocharger Pressure Ratio versus Available Mean Effective Pressure
300
250
200
150
050
bull 73 NGD 250 HT 99-00
bull MY2000 3126B Banking
- MY2001 3126B Banking
bull LionVfi
Linear (MY2000 3126B Banking)
Linear (Lion V6)
1000 2000 3000 4000
Amep (kPa) p Qbdquo ^y(AJ^F)
5000 6000
Figure 35 Turbocharger Pressure Ratio versus Available Mean Effective Pressure for CI Engines
The difference between the pressure ratio characteristics of the 3126 B engine
data and the 73 NGD and Lion V6 enghie data are a consequence of the matching of the
engines with turbochargers for their expected applications With additional specifications
for the engines and the mrbochargers this dependency could be incoiporated mto the
overall heat rejection model for turbocharged CI engmes However h is a major
objective for the current mvestigation to limit tiie engine specific data for use m the heat
rejection model to shnplify the enghie displacement and number of cylhiders The
80
motivation for tins objective is additional enghie data is often simply not available early
in a vehicle design cycle
With this limitation in mmd h was determined that a satisfactory representation
of the pressure ratio versus available mean effective pressure relationship for all four
engines is
1 + 035 1
MPa 24
Amep Amep lt 40 MPa
Amep gt 40 MPa (339)
35 Turbocharged Compression Ignition Engine Heat Transfer Methodologv
The heat fransferred to the coolant for a turbochai-ged CI engine can be
determined by
i^cool ~ iicom bull icrad ^ if (340)
Using standard correlations for the convection and radiation heat transfer Equation 340
can be expanded to yield
Qcoo = hAT^ -rj+ KaAT -T^) + P^
as was indicated for the SI engine correlation the heat fransfer reference area is defined
to be the cylinder area
A = r5 (342)
and
81
Bcc 4F^ X = cylinder bore
From the data analysis it became evident that the normalized form of Equation
341 provided a better analysis of tiie heat fransfer to the coolant for the CI enghie This
normalized form is shown in Equation 344
q^mep = hAg f^ ^ hM
iP-P^-^^PhPty rfinep (344) V n ^ y n
D2 DJ
For SI engines the ah-fuel ratio is approximately constant so that a constant cycle
averaged temperature and corresponding combustion gas properties could be assumed
For the CI engines wide variations of lean air-fuel ratios and gas temperatures are
expected and must be incorporated in the heat rejection model The cycle-averaged
temperature for the turbocharged engines will be approximated as the average
temperature between the wall and potential heat release of the fuel
T^=^ + T^ (345)
The change m combustion temperature due to the potential heat released from
combustion found in Equation 346 is calculated by
^T^QuL mCr
The specific heat of the combusted gas can be calculated from an approximation from
data found in Heywood 1988
C^^ = l + 142jcl0-^r-h247xl0-^r
82
As was done for the SI engines the coolant and wall temperatures are assumed constant
atllOdegC
Where the convection heat transfer is proportional to the difference in the gas and
wall temperatures the radiation heat transfer is expected to be proportional to the
difference in tiie temperatures raised to the fourth power Consequentiy a simple
average of the expected minimum and maximum temperatuies is not appropriate for
radiation heat fransfer calculations Applying the simple average temperature to the
correlations was found to yield radiant emissivity thne view factor greater than one This
result is clearly unrealistic and dictates that the gas temperature has been underesthnated
A more appropriate choice for a cycle averaged gas temperature for the radiation
heat fransfer correlation is
7 =Ar+28816 (348)
The choices for average gas temperatures in the convection and radiation heat fransfer
calculation is essentially arbifrary The expressions given by Equations 345 and 348 can
be expected to yield temperature estimates that are at least proportional to the actual
temperatures over the expected range of ah-fuel ratios Any discrepancy that results from
the temperature approximations will be folded into the correlation coefficients and will
not cause a problem so long as the temperatures used in the heat transfer predictions are
obtahied in the same way Furthermore the temperature approximations that have been
chosen yield mmitive satisfactory values for the convection and radiative heat fransfer
coefficients
The convective heat fransfer coefficient is correlated in terms of a general Nusseh
number versus Reynolds number relationship The Nusseh number is defined as
Nu = mdash = aRer (349)
where
83
Re pV^B
S
(350)
and
Pr = MC
(351)
For the turbocharged CI engines the thermal conductivity of the gas is not
constant due to variations of the air-fuel ratio and thus the cycle averaged temperature
Equation 352 approximates Combusted gas thermal conductivity
k^ = 8 82e- r W
mK (352)
Equation 352 is derived from extrapolated themial conductivit^ information found in
Heywood (1988)
The gas viscosity variation with cycle averaged temperature is taken as
M= 3 3 pound ^
1 + 0027^ (353)
where ^ is the fuel equivalence ratio
^ A_ V
ltgtbullbull
Fl J
(354)
The characteristic gas velocity is
84
T ^f^
^g ^ 2 (355)
givmg
D 4m ^^^~^r bull (3-56)
The ah mass flow rate for Equation 357 is found from
1 A w = w^+w^=m^ 1 +
1
AIF)
thus completing the required variables for the convection heat fransfer Radiation from
the gas to the walls must now be outlined
Heywood (1988) detailed that finep can be approximated as follows
finep = C+C^-^ + C^ f-^ 1 (358) 120 Hl20J ^ ^
where Ci term represents the boundary loss euro2 term represents the hydrodynamic or
mbbing loss and C3 term is the turbulent loss Therefore the hydrodynamic term was
used to determine the rfinep through the coefficient C2 This approach is different from
the approach used on the SI engine The rfinep is determined from the heat transfer
correlation instead of the power correlation
A multiple linear regression of Equation 344 can be analyzed to determine the
heat transfer coefficients No plots are available due to the multivariable output
requirements From the regression the heat fransfer coefficients and mbbing friction
coefficient were determined
85
7 = 2495 RePr ^
z =0341
C = 5 9 8 ^ (359)
or
qmep = - - (j TJ)+-^^ (T-7)+598 Av^ Avy^ kPa
- (360) 2
The coefficient of determination was 097 yielding evidence of a satisfactory correlation
Additionally the radiation contributed between 2 to 30
These correlations can be applied to predict the heat rejection from an arbifrary CI
engine by applying the following procedure
Given brake power and engine speed calculate bmep
The bmep and Equation 315 are used to find the Amep
The Amep and Equation 339 are used to find the turbocharger pressure ratio that with
Equation 336 yields the volumetric efficiency
The volumetric efficiency and Amep are combined to find the ah-fuel ratio
The air-fuel ratio and volumetric efficiency yield the fuel and ahflow rates and allows
calculation of the cycle averaged temperatures and gas properties
Reynolds number and Prandtl number can be calculated and used to obtahi Nusselt
number and corresponding convection heat fransfer coefficient
Equation 360 is used to obtahi the heat fransferred to the coolant
This completes the process to determine the heat rejection to the coolant for the CI
engine Applymg the correlation data back to the original dataset is discussed m the
86
Results and Discussion section of the dissertation The results are used to help quantify
the success of the correlation
87
CHAPTER rV
RESULTS AND DISCUSSION
Correlations have been developed for the naturally aspired SI engmes and
turbocharged CI engines The new correlations will be applied to tiie original sets of
engmes to determine the accuracy of the method The scope of this investigation is to
determine the heat rejection based on minimal initial data The input parameter
requirements for the heat rejection calculations are the engine speed brake power
requirement engine displacement and number of cylhiders With the engine pover
correlation and the cylhider heat fransfer correlation known the heat rejection to the
coolant may be predicted for any arbitrary combination of normally asphated gasoline or
turbocharged Diesel engine power requirement and engine speed
The experimental data used in the development of this analytical method
represent eleven different naturally asphated gasoline engines ranging from 20 liters to
68 liters in displacement and three different turbocharged Diesel engines ranging from
27 liters to 73 liters This sample of engines covers a very broad spectmm of vehicle
applications ranging from small economy cars to commercial tmcks In addition the
experimental data covers a wide range of engine geometries ranging from inline four
cylinder engines to ten cylinder engines in a V configuration Both two and four valve
per cylinder designs is included
It is important to note that although all of the heat rejection data used in this
experiment was obtained using the same overall method of measurement this data was
not gathered expressly for use m developing this analytical method On the confrary this
analytical method was developed from existing data as a potential means of reducmg the
reliance of vehicle design upon experimental data particularly early in the design of a
new vehicle when experimental data may be unavailable The experimental data used
here originally was gathered for use m the design of cooling systems for a variety of
vehicles The experimental data therefore represents a wide range of enghie calibration
sfrategies Although this is not an ideal scenario for the development of an analytical
88
tool recreating the amount of data used in this study witii consistent engine calibration
sfrategies would require such a fremendous investment of time and money as to make the
project impractical
The analytical metiiod presented here produces predictions tiiat in general
correlate well with measured experimental data There are however some discrepancies
between the predicted heat rejection to coolant and the heat to coolant measured
experimentally This fact is not surprising given that the analytical method uses several
approximations and assumptions in its derivation Many factors may account for the
discrepancies between the predicted engine heat rejection and that measured
experimentally
Heat fransfer is dependent upon temperature differential and thus heat rejection to
coolant is dependent upon the difference between the temperature of the hot engine
cylinder liner and the coolant The heat rejection to coolant predicted using the analytical
method assumes a constant coolant inlet temperature of 110deg C On the other hand a
variety of different coolant inlet temperatures was used in the development of the
experimental heat rejection data No single coolant inlet temperature is applicable to all
of the experimental data The resulting differences between assumed and acttial coolant
inlet temperature will account for some of the disparities between the predicted and
measured heat rejection to coolant
Accurate prediction of engine heat rejection depends upon accurate prediction of
engine fiiction as the heat generated by mbbing fiiction is a significant contiibutor to
heat rejection to coolant The relationship given in the new correlations was used m
conjunction witii the experimental data to derive an finep of 136 kPa for the SI engines
In reality finep varies significantly with engine speed In a typical four-cylinder enghie
for example h is typical for finep to vary from approximately 100 kPa at low enghie
speeds to 300 kPa at very high speeds this variation is not linear (Patton 1989 Thring
1992 The value of 135 kPa therefore represents a best-fit value of finep for all of the
experhnental data and not necessarily a precise prediction of finep at any particular
engine operating condition
89
Comparison of tiie analytically predicted value of finep to measurements found m
tiie literattire (Patton Nhschke amp HeyAvood 1989 Thring 1992) mdicates tiiat tiie finep
assumed in tiie analytical heat rejection predictions is probably smaller than the acttial
finep at moderate to high engine speeds If tins is the case at high engine speeds tiie
analytical model is under-predictmg the confribution of mbbmg fiiction to tiie total
amount of engine heat rejection to coolant The effect of this under-prediction would be
most significant at part-tiirottle operation at high engme speeds At part-throttle
operation the amount of heat rejection from the hot combustion gases is lower than at
full-throttle operation yet the amount of heat rejection from mbbhig friction is
effectively the same as at full-throttle operation smce mbbhig fiiction is prhnarily a
function of enghie rotational speed Thus the contribution of mbbhig friction to overall
engine heat rejection is greater at part-throttle operation Any negative effects due to
under-predicting the mbbing friction would therefore be most apparent at part-throttle
operation at high engine speeds For the turbocharged compression ignition heat
rejection correlation the variable mbbing fiiction was included
This behavior seems to support the theory that the analytical model undershy
estimates the contribution due to mbbing fiiction at moderate to high engme speeds for
the SI engine series Analytical methods do exist for predicting engme finep due to
mbbing components (Patton et al 1989 Thring 1992) although these methods are
somewhat complex It is possible that as a future improvement one of these methods to
denve finep could enhance the analytical method It is possible however that the
inclusion of one of these methods could infroduce a level of complexity into the
analytical method far exceeding the intended scope of the analytical method (Oler 2002)
41 Naturallv Aspired Spark Ignition Engine Results and Discussion
For the SI engine the only limitation on the calculation is that the power
specification be within the capabilities of the given engine Testing for this limitation is
easily incorporated into the calculations as described below
90
The first step in the calculation is tiie application of the engine power correlation
to determine the mass flow rate through the engme
p -I O
bmep = mdash ^ = 1^^7^^ ^ ^ - finep (41) ^^2 F
The general SI engine power correlation is rearranged to obtahi the corresponding
volumetric efficiency
rjy=bmep + 35) fl^ (42)
As previously stated the volumetric efficiency is a non-dimensional expression of the
mass flow rate through the engine It is also a dhect indication of the throttle position
with a volumetric efficiency of approximately 025 at the throttle closed or idle position
and 085 at wide-open throttle An engine speed and power requhement leading to a
bmep and corresponding volumetric efficiency significantly outside of that range is not
within the capabilities of the specified engine and a meaningful heat rejection calculation
cannot be accomplished
With the volumetric efficiency known the heat fransfer correlation may be
evaluated This begins by rearranging Equation 330 and substimtmg in Equation 331
thus calculating the cylinder Reynolds number
P^Vj^^il + JL ^ Re = l^^-^Tjy TiBpi ^ AF
(43)
The Reynolds number is applied to find the Nusselt number and the corresponding
convection heat transfer coefficient
Nu = 13Ke (44)
91
and
kgNu ^ = - ^ (45)
The cylinder heat rejection is obtahied from
a=N^^h(T^-TS (46)
The total heat rejection to the coolant is the combination of the cylinder heat transfer and
the mbbing fiiction energy dissipation
Qcoolant = Qcyl + Prf - (4-7)
The additional heat rejection associated with the mbbing fiiction energy dissipation is
obtained as a fraction of the overall friction power
P^=06finepV^^ (48)
Although heat fransfer from the engine block is partially accomplished through
convection to the surrounding air radiation to the engine bay and conduction through
engine attachments the heat transfer rates associated with these mechanisms should be
small relative to the heat transfer rate to the coolant
The heat rejection maps for the eleven SI engines are presented in Figures 41
through 411 The envelope represents the heat rejection predictions bounded by speeds
of 1000 rpm and 6000 rpm and volumetric efficiencies of 02 and 085 Note that
mdividual engines are keyed per Table 31 The overall envelope and coiresponding test
data points are shown in Figure 412
92
20L CVH Split Port 14 Engine (CT120) 100
I
-laquo w
i 1000 RPM Test Data bull intermediate Test Data a 5500 RPM Test Data
mdash _ - Volumetric Efficiency = 085 Envelope bull - - - 6000 RPM Emelope _ mdashVolumetric Efficiency = 02 Envelope
1
Brake Power (kW)
Figure 41 20L 14 SI Engine Heat Rejection Map
Figure 41 provides the first opportunity to reiterate tiiat the engine tests from
which the data were collected were not designed to yield data covering the enthe
operathig envelope of each engine On the contrary tiiese tests were run for varying
reasons ranging from heat rejection to spark thning evaluation Therefore complete
datasets over the operating envelope were not available or required to successfully
complete the test goals
93
20L DOHC Zeta 14 Engine
Brake Power (kW)
Figure 42 20L 14 Zeta SI Engine Heat Rejection Map
94
100
S 10
23LDual Plug 14 Eogine Dynomometer Data
amp bull D
1200 RPM Test Data
intennediate Test Data 5400 Test Data
-1000 RPM Envelope
Volumetric Efficiency = - 6000 RPM Envelope
mdashVolumetric Efficiency =
085 Envelope
020 Envelope
Brake Power(kW)
Figure 43 23L 14 Dual Plug SI Engine Heat Rejection Map
95
100
o a 10
25L 4V V6 Engine Dynomometer Data
^^y^^^ A 1380 RPM Test Data
bull Intennediate Test Data
a 4000 RPM Test Data
mdash mdash Volumetric Efficiency = 085 Envelope
6000 RPM Envelope
mdash - mdashVolumetric Efficiency = 020 Envelope
1000
Brake Power (kW)
Figure 44 25L V6 4V SI Engine Heat Rejection Map
96
100 30L 4V 6 Engine Dynomometer Data
y J y
^ i 1570 RPM Test Data
bull Intemediate
D 2450 RPM Test Data
mdash mdash Volumetric Efficiency = 085 Enelope
mdash - - - 6000 RPM Envelope
mdash - mdashVolumetric Efficiency = 020 Envelope
10 100
Brake Power (kW)
Figure 45 30L V6 4V SI Engine Heat Rejection Map
97
100
I
30L Vukan V6 Engine (1995-14 Ranger)
y^
gt - - A
a 1000 RPM Test Data
bull Intemiediate Test Data
bull 5000 RPM Test Data
1000 RPM Envekipe
Volumetric Efficiency = 085 Envelope
- - - -6000 RPM Envelope
mdash - -Volumetric Efficiency = 020 Envelcpe
100 1000
Brake Power (kW)
Figure 46 30L V6 Vulcan SI Engine Heat Rejection Map
98
Figure 47 40L EI 95 SI Engine Heat Rejection Map
99
40L SOHC V6 Engine Dynamometer Data
1000
e 100
10
o a
A 1000 RPM Test Data
bull Imtemiediate Test Data
a 5000 RPM Te1t Data
1000 RPM Envelope
Volumetric EfTiciency = 085 Envelope
- - - - 6000 RPM Envelope
mdash bull -Volumetric Efficiency = 020 Envelope
10
Brake Power (kW)
Figure 48 40L V6 SOHC SI Enghie Heat Rejection Map
100
S4L4V V8 Engine Heat Rejectron Data (McLaren July 1995) 1000
Brake Power (kV)
Figure 49 54L V8 4V SI Engine Heat Rejection Map
101
1000
6 100
10
54L 2V V8 Engine Dynamometer Data
G
1000 RPM Test Data
Intemiediate Test Data
4500 RPM Test Data
1000 RPM Envelope
- Volumetric Efficiency = 085 Envelope
- - 6000 RPM Envelope
- mdashVolumetric Efficiency = 020 Envelope
100 1000
Brake Power (kW)
Figure 410 54L V8 2V SI Enghie Heat Rejection Map
102
68L2V VlO Engine DynanvimetcrData
6 100
^ ^ ^ lt
^
ltJ^
a a 10 1000 RPM Test Data
Intemiediate Test Data
4500 RPM Test Data
-1000 RPM Envelope
Volumetric Efficiency = aBfi Enlaquolope
6000 RPM Envelope
mdash -Volumetric Efficiency = 020 Envelope
100 1000
Brake Power (kW)
Figure 411 68L VIO 2V SI Enghie Heat Rejection Map
103
Overall Test Data and Correlation Envelope
1000
10
10
Brake Povgtrer(kW)
Figure 412 Overall Correlation Envelope and Test Data for SI Engines
The experimental data and predicted heat rejection envelopes from the eleven
engines have been combined in Figure 412 The remarkable flexibility of the correlation
is apparent It is obvious that a majority of the test data were recorded at high volumetric
efficiencies as this operation is shown in the lower right of the envelope The 40L V6
SOHC SI enghie was the only engme that was significantly outside tiie correlation
envelops and other test data cluster Perhaps there is error in the data or other significant
operational differences (ie superchargmg turbocharghig etc) not described in the test
data sheet
The resuhs of a comparison of the new correlation and Lahvic calculations with
the experimental engine data on a pomt-by-point basis are shown in Figure 413
104
NewcorTelation Error and Labvic Error Vereus Brake Mean Effecthc Pressure
n Correlation (Typical
a Lahvic (Typical)
s deg Jo
lti -Jicf
^
A trade - n
f ^ - n Vs
v laquo- tf- ^mdashf mdash -^mdash-^-^mdash O bdquo A A A
6mg7 (kPa)
Figure 413 New Correlation and Lahvic Error for Naturally Aspired SI Enghies
Each data pomt represents the percent deviation between the enghie data and the
predicted resuh at the same enghie speed and brake power Although the deviation
results are plotted versus bmep there is no apparent dependency of the deviations on tiiat
parameter
For the entire collection of data the mean error deviation is zero and tiie standard
deviation of tiie error is 11 For comparison tiie results from the Lalivic correlation aie
22 for the mean deviation and 15 for the standard deviation of tiie error Tliis
completes tiie successful demonsfration of a correlation that can predict SI engine heat
reject based on mmimal initial enghie data
105
42 Turbocharged Compression Ignition Engine Results and Discussion
With the enghie power correlation and the cylmder heat transfer correlation
known the heat rejection to the coolant may be predicted for any arbitrary combination
of turbocharged CI engine power requirement and enghie speed The only limitation on
tiie calculation is that the power specification be within the capabilities of the given
engine The input parameter requirements for the heat rejection calculations are the
engine speed brake power requirement enghie displacement and number of cylinders
Additionally if known the turbocharger wastegate pressure ratio can increase the
accuracy of the prediction although using a typical value for the pressure ratio will yield
satisfactory results
The first step in the calculation is to determine the air mass flow rate though the
engine The bmep and corresponding Amep are calculated Equation 41 with a fuel
conversion efficiency of 040 and an fmep of 136 kPa From the turbocharged CI enghie
analysis the turbocharger pressure ratio was a fimction of the available mean effective
pressure and wastegate pressure ratio As discussed in the previous chapter an
approximation for the turbocharger characteristics is
r^ = Minimuml 1 + 035 MPa
Amep 24 (410)
These two generic parameters are needed to represent the turbocharger sufficiently to
obtahi the ahflow through the CI engines
With the turbocharger pressure ratio known based on the generic representation
from discussions on Figure 36 the volumetric efficiency can be found from the
correlated values found in Figure 35 and Equation 411
7bdquo= 0803 IP
The airflow rate is determined by definition as shown in Equation 412
106
lt=VPa~V (412)
The next step in the calculation is the application of the engine power correlation to
determine the fiiel mass flow rate through the enghie where Equation 41 finds the brake
mean effective pressure
bmep = - ^ = 77bdquo7 ^ ^ - fmep bull (4-1) ^^2 F
The general turbocharged CI engine power correlation is then applied to obtain the
corresponding ah-fuel ratio
4 ^ nyO-^^PaQiH (4 11) P bmep--135)
With the ahflow rate and air-fiiel ratio known the fiiel mass flow rate is also knovm The
heat fransfer correlation for CI engines from Equation 357 may be evaluated
250k^RcPT^(- ^ a 3 4 l pound ^ = 4 7^4VQo
kPa a (357)
Figures 414 to 417 contain the heat rejection maps for the turbochaiged CI
engmes The correlation envelopes are bounded by speeds of 1000 ipm and 4000 rpm
and pressure ratios of 12 and 32
107
10
73 L V8 NGD 250 UT 99-00
s Ji
ecte
d to
Coo
lant
i tR
ej
Hea
1000 -
100 -
10
-
~ 1
o 2690 RPM Test Data bull Inten-nadiate Test Data i 1000 RPM Test Data
1000 RPM Envetope
Pr = 32 Envelope - - - - 4000 RPM Envelope mdash - - P r = t2 Envelope
^ 1 100 1000
Brake Power(kW)
Figure 414 73 L 250 HT Turbocharged CI Engine Heat Rejection Map
10000
108
10000
C- 1000
u e
10
72 L V6 MY2000 3126B Banking
D 2400 RPM Test Data
i 2200 RPM Test Data 1000 RPM Envelope
mdash mdash Pr = 32 Envelope 4000 RPM Envelope _bull - P r = 12 Envelope
1000
Brake Power (kW)
10000
Figure 415 72 L V6 3126B 2000 Turbocharged CI Enghie Heat Rejection Map
109
10000
d 1000
e
as 100
10
72 L V6 MY2001 3126B Banking
100
bull 2400 RPM Test Data
a 2200 RPM Test Data
1000 RPM Envelope
mdash ^ Pr = 32 Envelope
4000 RPM Envelope
mdash - - P r = 12 Envelope
1000
Brake Power (kW)
10000
Figure 416 72 L V6 3126B 2001 Turbocharged CI Engine Heat Rejection Map
110
Hea
t R
ejec
ted
to
Coo
lant
(k
W)
1000 -|
100 -
10 -
1 -
27 LV6 Lion
1 10
i 1900 RPM Test Data
bull Intemiediate Tesi Data
D 4000 RPM Test Data
mdash mdash Pr = 32 Envelope
4000 RPM Emelope
mdash - - Pr = 12 Envelope
100 Brake Power(kW)
10 00
Figure 417 27 L V6 Lion Turbocharged CI Engine Heat Rejection Map
These figures demonsfrate good agreement in the heat rejection predictions and actual
heat rejection data for turbocharged CI engines Note that in all of these figures the heat
rejection data vary approximately linearly with the brake power This trend is probably a
result of the weak dependence of airflow with engine speed due to turbocharging
Additionally the overall envelope and test data for the CI engines are shovra m Figure 418
I l l
10
Overall CI Test Data and Correlation Envelope
10
Correlation Envelope bull 7 3LV8 250m99-00 bull 72LV6MY2000 3126B Banking - 72L V6 M2001 3126B Banking bull 27LV6Lion
1000
Brake Power (kW)
Figure 418 Overall CI Test Data and Correlation Envelope
Again Figure 418 shows the remarkable flexibility of the correlation The error
in the new correlation with a generic ttu-bocharger and the existing Lahvic correlation are
presented versus bmep in Figure 419
112
70
60
50
30
p 20
n bull 73 NGD 250 KT 99-00
bull Lalivic Error
bull 72L V6 MY2000 3126B Banking
-72L V6 MY2001 3126B Banking
bull 27L V6 Lion
10
0
-10
-20
raquo bull ^ 1
bull bull bull
500 1000 2500
bmep (kPa)
Figure 419 New Correlation and Lahvic Error for Turbocharged CI Enghies
Each data pomt represents the percent deviation between the engme data and the
estimation resuh at the same enghie speed and brake power Although the deviation
results are plotted versus bmep there is no apparent dependency of tiie deviations on tiiat
parameter
For the entire collection of data the mean error deviation is zero and tiie standard
deviation of tiie error is 11 For comparison the results from the Lahvic correlation are
16 for tiie mean deviation and 22 for tiie standard deviation of tiie error This
completes the successfiil demonsfration of a correlation that can predict CI enghie heat
reject based on minhnal initial engine data Agam there is a marked improvement over
the currentiy used Lahvic regression even with a generic wastegate pressui-e ratio When
the wastegate pressure ratio is known the accuracy of the new correlation hnproves over
the generic scenario Obviously the fiuther the assumed wastegate pressure ratio is away
113
from the true wastegate pressure ratio the further the correlation is from predicting an
accurate heat rejection
114
CHAPTER V
CONCLUSIONS
General methods for estimating the heat rejection to the coolant of a normally
aspirated spark ignition (SI) engine and a turbocharged compression ignition (CI) engine
have been given The vehicle parameters or input required for the calculations aie the
engine displacement number of cylinders enghie speed and brake power requhement
For the enthe collection of SI engine data the mean error deviation is zero and the
standard deviation of the error is 11 For the collection of CI engine data the mean
error deviation is zero and the standard deviation of the error is 11 The CI error is no
larger than the SI heat rejection error In addition with its dhect dependence on
volumetric efficiency the engine power correlation makes it readily apparent if a given
speed and power requirement are within the capabilities of a given naturally asphed SI
engine
The primary objective for the calculation method that has been presented is to
predict coolant heat load for an arbifrary engine with reasonable accuracy If however
data is available for a particular engine unique values for the fiiction mean effective
pressure fiiel conversion efficiency and Nusselt number correlation coefficients can be
obtained The resulting coolant heat load calculations can be accomplished with an
accuracy that appears to only be Ihnited by the original data This approach vv ould
provide an efficient means of compressing extensive sets of experhnental data mto an
engine database
The method for naturally asphed SI enghies is available in an Excel workbook
called ttuHeat Heat rejection predictions are based on the standard correlation
coefficients from data from eleven engmes Optionally the user can generate a unique
correlation for a specific engine A heat rejection map power and heat tiansfer
correlation resuhs and a correlation error summary support tiie calculations The
computer program thiHeat also includes a worksheet to facilitate unit conversions from
dynamometer data files to the SI data needed for the correlation All of tiie calculation
115
worksheets are protected except for the user data entry areas Tlie workbook as a whole
is not protected which allows users to collect calculation results and build additional
worksheets and plots to meet the users needs Modifications to these correlations were
successfiil at predicting heat rejection from turbocharged diesel enghies Additionally a
theoretical basis for extending the spark ignition engine to include turbocharging has
been infroduced
116
REFERENCES
Alkidas A C amp Cole R M (1985) Transient heat flux measurements in a divided-chamber Diesel engine Journal of Heat Transfer 107 439-444
^miand W J (1963) Heat transfer m the cylinders of reciprocating intemal combustion enghies Proceedings of the Institution Mechanical Engineers 177 973-990
Ap N S amp Gohn N C (1997) New concept of engine cooling system (Newcool) SAE 971775
Brandstetter W amp Dziggel R (1982) The 4- and 5-cylhider ttirbocharged Diesel engines for VoUcswagen and Audi Society of Automotive Engmeers SAE Transactions 91 SAE Paper 82044 1982
Bromnick P A Pearson R J amp Wmterbone D E (1998) hitercooler model for unsteady flows in engine manifolds Proceedings of the Institution Mechanical Engineers 212 PartD 119-132
Bulaty T Codan E amp Skopil M (1996) A flexible system for tiie simulation of turbocharged Diesel engines and turbocharging systems Proceedings of the ICE-Spring Technical Conference Youngs town Ohio 26-3 57-63
Cao Y amp Wang Q (1995) Thermal analysis of a piston cooling system with reciprocating heat pipes Heat Transfer Engineering 7(5(2)
Cengel Y A Boles M A (1989) Thermodynamics An Engineering Approach New York New York McGraw-Hill
Chick J P (1998) The modeling of engine thermal systems Unpublished doctoral dissertation University of Nottingham
DAdda C Lisbona M G Occella S amp Maiorana G (1994) Optimization of the cooling system of a high specific power Diesel engine with analytical methodologies SAE Conference Proceedmgs 4 International Conferencemdash 1994 Mar 1209-1220
Davidson S D (1984 August) On-highway performance evaluation of a Cummins Diesel enghie featuring optimized charge ah cooling Paper presented at West Coast International Meeting amp Exposition San Diego
Edson M H amp Taylor C F (1964) The limhs of engine performance - comparison of actual and theoretical cycles Digital Calculations of Engine Cycles 7 65-81
117
Fmlay I C Harris D Boam D J amp Parks B I (1985) Factors influencmg combustion chamber wall temperatiires in a liquid-cooled automotive spark-Gerhard W (1979) Prediction of tiiermal loading of supercharged Diesel engines Proceedings from the Institution of Mechanical Engineers 199207-214
Flynn P (1979) Turbocharging four cycle Diesel engines Society of Automotive EngineeTSSAE Transactions 88 SAE Paper 790314 1979
Ford Power Products (nd) Retiieved March 232003 from httpv^wwfordpowerproductsconienghie2jpeg
Gehres E (1963 March) An analysis of engine cooling in modern passenger cars Paper presented at National Automobile Meeting Defroh
GT15-25 (nd) Retiieved August 15 2002 from httpwwwegarrettcomproductsgt 15_25jsp
Hashem H H (1989 9th) Waste energy potential of Diesel engine (experimental evaluation) Paper presented at 9th Miami International Congress on Energgt amp Environment Miami Beach
Hawley I G Wallace F J Cox A Pease AC Bird GL amp Horrocks R W (1998) Use of a VGT to improve the limiting torque characteristics of a DI automotive Diesel engine Institution of Mechanical Engineers Conference Transactions 11 347-357
Heywood J (1988) Internal combustion engine fundamentals New York New York McGraw-Hill
Hribemik A amp Moskwa J J (2000) Transient response of a cross-flow charge air intercooler and its influence on engine operation Journal of Dynamic Systems Measurement amp Control 111 483-489
Kadoli F G amp Aknamurthy (1984) Performance of Diesel engine with compound cooling Proceedings of the XIII National Conference on IC Engines and Combustion Bangaloro 241-246
Kamo R (1977 March) Cycles and performance studies for advanced Diesel engines Paper presented at the Conference on Ceramics for High Performance Applications Newport RI
Kem J amp Ambros P (1997) Concepts for a controlled optimized vehicle enghie cooling system Society of Automotive Engineers Publication 971816 357-362
118
Kunitomo T Matsuoka K amp Oguri T (1975) Prediction of radiative heat fliuc m a Diesel enghie Society of Automotive Engineers Transaction 750786
Liu D Xu X amp Hou J (1993) Analysis and computation of characteristic of tiie water cooling and radiatmg system for a heavy duty truck Diesel engine SAE 939160 Seventh Intemational Pacific Conference and Exposition on Automotive Engineering Pheonix Arizona Nov 15 -19 1993 53-62
Lahvic T R Investigation of Enghie Heat Rejection August 1986 Ford Motor Co
Lundun B Povohiy J amp Chelko L (1949) Correlation of cylmder head temperatures and coolant heat rejections of a multi-cylinder liquid cooled engine of 1710 cubic-inch displacement (NACA Report No 931)
Merrion D Diesel engine design for the 1990s SAE Special Presentation 1011 1993
Moeckel M D (1994) Computational fluid dynamic (CFD) analysis of a six cylinder th
Annual Earthmoving Industry Conference Pioria Illinois April 12 amp13^ 1994 Diesel engine cooling system with experimental correlations SAE 941081 45 Am 1-9
Mohan K V Arici O Yang S amp Johnson J H (1997) A computer simulation of the turbocharged Diesel engine as an enhancement of tiie vehicle engine cooling system shnulation SAE No 971804 237-253
Oler W Parish O Williams J Bums M (2002) Heat rejection fiom naturally aspired gasoline automobile engines Journal of Ford Engineering
Patton K Nitschke RG amp Heywood J B (1989) Development and evaluation of a fiiction model for spark-ignition engines SAE Paper 890836
Povohiy J Bogdan mitial amp Chelco L (1950) Cylinder head temperatures and coolant heat rejection of a multi-cylinder liquid cooled engine of a 1650 cubic inch displacement (NACA TN 2069)
Rakopoulos C D Andritsakis E C amp Kyritsis D K (1992) Availability accumulation and destruction in a DI Diesel engine with special reference to the limited cooled case (Tech Rep No 3) Athens Greece National Technical University of Athens Mechanical Engmeering Departinent Thermal Engmeering Section
Rakopoulos C D amp Mavropoulos G C (2000) Experhnental instantaneous heat flux m the cylhider head and exhaust manifold of an air-cooled Diesel engine Energy Conversion iSc Management 41 1265-1281
119
Sekar R R (1982 Febmaiy) Trends in Diesel engine charge air cooling Paper presented at Intemational Congress amp Exposition Defroh
Shayler P J Baylis W S Chick J P amp Bell P (1999) The effects of EGR and tt^bocharging on engine heat rejection rates fristitiition of Mechanical Engineers 4 Vehicle Thermal Management Systems Conference London United Kmgdom 1999 679-693
Shayler P Chick J Hayden D Yuen H amp Ma T (1997) Progress on modeling engine thermal behavior for VTMS applications Society of Mechanical Engmeers SE Paper 971852 1997
Shayler P Chick J amp Ma T (1996) Effect of coolant mixmre composition on heat rejection rate Society of Automotive Engineers SAE Paper 960275 1996
Shayler P Chick J Ma T (1997) Correlation of engine heat transfer for heat rejection and warm-up modelmg Society of Automotive Engineers SAE Paper 971851 1997
Taylor C (1985) The intemal combustion engine in theory and practice (Vol 1) (2 ed) MIT
Taylor C F amp Toong T Y (1957) Heat ttansfer in intemal combustion engines American Society of Mechanical Engmeers ASME Paper 57-HT-171957
Taymaz I Gur M amp Halici F (1998 June) The effect of insulated heat fransfer surfaces on direct injected and turbocharged Diesel engine fuel consumption and coolhig system Paper presented at T^ Trabzon Intemational Energy amp Envhonment Symposium Trabzon Turkey
The new DELTA engine There are common engines and there are exfraordhiargt enghies (nd) Retrieved August 17 2002 from httpwwwdefroitdieselconiPublicMarketsautomotiveadeltalasp
Thring RH (1992) Engine fiiction modelmg Society of Automotive Engmeers SAE Paper 9204821982
Tovell J F (1983 Febmary) The reduction of heat losses to the Diesel engine cooling system Paper presented at Intemational Congress amp Exposition Detroh
Wallace F J Hawley J G Cox A Pease A C Horrocks R W amp Bhd GL (1997) Variable geometry turbocharging of a 18 DI automotive Diesel engine Paper presented at 30 Intemational Symposium on Automotive Technolog^ amp Automation Florence Italy
120
Wallace F J Way R J B amp VoUmert H (1979) Effect of partial suppression of heat loss to coolant on the high output Diesel engine cycle Society of Automotive Engineers SAE Paper 790821979
Watson N amp Janota M (1982) Turbocharging the internal combustion engine New Vork Wiley-Interscience
Watson N KjTtatos K amp Holmes K (1983) The perfonnance potential of Ihnited cooled Diesel engines Proceedings from the Institution of Mechanical Engineers 197A 197-207
Watts P A amp Heywood J B (1980 Febmary) Shnulation stiidies of tiie effects of turbocharging and reduced heat fransfer on spark-ignition engine operation Paper presented at Congress amp Exposition Defroh
Way R J B amp Wallace F J (1979) Results of matching calculations for turbocharged and compound engines with reduced heat loss Society of Automotive Engineers SAE Number 790824 1979
Woods M Bryzik W amp Schwarz E (1992 Febmary) Heat rejection fiom high output adiabatic Diesel engine Paper presented at Intemational Congress amp Exposition Defroit
Woodward J B (1995) Air-standard modeling for closed cycle Diesel engines Proceedings of the Institution of Mechanical Engineers 209 115-123
Worden J A amp Zehr R L (1999 March) Consideration of fluid velocity effects in the design and development of aluminum cooling system components for heavy duty Dieselengines Paper presented at Heavy Duty Coolants and Cooling Systems Intemational Congress and Exposition Defroit
Yoshimoto Y Tsukahara M amp Kuramoto T (1996 October) improvement ofBSFC by reducing Diesel engine cooling losses with emulsified fuel Paper presented at Intemational Fall Fuels amp Lubricants Meeting amp Exposition San Antonio
121

ACKNOWLEDGMENTS
I thank the following for theh contributions to my dissertation Ford Motor
Company for theh generous support for automotive research at Texas Tech Universit
Jack Williams and Mark Burns of Ford Motor Company for theh insight into vehicle
engine and heat rejection systems Texas Tech University for their dedication to research
and the faculty the mechanical engineering department for theh support of graduate
research Dr Walter Oler for all the support help thoughtful insight and systematic
approach my doctorial committee for their support and creativit) contributmg to the
analysis and understanding of automotive engineering thermodjoiamic systems and heat
transfer ThermoTek Inc for employment flexibility support and experience
opportunities Heywood for the most comprehensive text on a specific subject that I have
ever seen Jeimifer Schmidt for her prompt and accurate editing our parentsmdashLiim and
Terry Parish and DNard and Beth Arthur~for all the support our kids Catherine and
Isabella Parish for being so patient and special and my bride Deidre Parish for her
compassion and love
11
TABLE OF CONTENTS
ACKNOWLEDGMENTS ii
ABSTRACT y
LIST OF FIGURES vi
LIST OF SYMBOLS ix
CHAPTER
I INTRODUCTION 1
II BACKGROUND AND LITERATURE SURVEY 3
21 Spark Ignition Engine 3
22 Turbocharging and Intercooling 12
23 Turbocharged Compression Ignition Engine 24
24 Heat Transfer 36
25 Computer Shnulation 47
26 Adiabatic Engine Research 53
27 Other Topics Relating to Diesel Engines
and Heat Rejection 61
IL METHODOLOGY 63
31 General Methodology to Approximate Enghie Heat Rejection 63
32 Naturally Aspired Spark Ignition Enghie Power Methodology 68
33 Naturally Asphed Spark Ignition Engine Heat Transfer Methodology 71
111
34 Turbocharged Compression Ignition Engine Power Methodology 76
35 Tvirbocharged Compression Ignition Enghie
Heat Transfer Methodology 81
TV RESULTS AND DISCUSSION 88
41 Naturally Aspired Spark Ignition Enghie Results and Discussion 90
42 Turbocharged Compression Ignition Engine
Results and Discussion 106
V CONCLUSIONS 115
REFERENCES 117
IV
ABSTRACT
The objective of this research is to accurately predict the heat rejection of
naturally aspired spark ignition (SI) engines and turbocharged compression ignition (CI)
engines This prediction method will be added to TTU-Cool a software package
developed at Texas Tech University for Ford Motor Company The objective of TTU-
Cool is to give the aerodynamics division at Ford a tool to predict with minimal up front
data the cooling performance of a proposed automotive cooling system The minimal
data includes the road load requirements as well as engine size and number of cylinders
Historically Ford has used a least squares fit of the above data to approximate the
heat rejection The proposed methodology replaces the approximation with a physics-
based approach to determining the heat rejection The thermal model significantly
expands the capabilities of TTU-Cool SI and CI engine data are analyzed and correlated
into a usefiil tool for new automobile concepts
LIST OF FIGURES
21 Modem Naturally Asphated Spark Ignition Enghie (Ford 2003) 4
22 Actual Normalized Pressure versus Volume Diagram for a Naturally Asphed Spark
Ignition Engine (Heywood 1988) 5
23 Pressures versus Specific Volume for the Ideal SI Engme Cycle (Cengel 1989) 6
24 Indicated Mean Effective Pressure versus Available Mean Effective Pressure 12
25 Garrett GT-15-25 Turbocharger (GT15-25 nd) 13
26 Thermodynamic Representation of a Turbocharger 14
27 Turbocharger AR Ratio from Merrion in Diesel Engine Design for the 1990s
(Merrion 1993) 17
28 Typical Compressor Performance Map (Brandstetter amp Dziggel 1982) 18
29 Typical Turbine Performance Map (Watson amp Janota 1982) 19
210 Altemative Turbme Map (Flynn 1979) 20
211 Diesel Engine (The new DELTA engine nd) 24
212 Schematic of Ideal Turbocharged CI Engine 27
213 State Diagram for Ideal Turbocharged CI Engine 27
214 Volumetric Efficiency versus Pressure Ratio for Ideal Turbocharged CI Engine 31
215 Indicated Mean Effective Pressure versus Available Mean Effective Pressure for Ideal Turbocharged CI Engine 32
216 Specific Turbocharger Works for Ideal Turbocharged CI Enghie 33
217 Air-fiiel Ratio versus Pressure Ratio for Ideal Turbocharged CI Engine 34
vi
218 Pressure Ratio versus Available Mean Effective Pressure for Turbocharged Ideal CI Engme 35
219 Indicated Mean Effective Pressure versus Available Mean Effective Pressure for Matched Ideal Tiu-bocharged CI Engme 36
220 Highly Simplified Diagram of a Typical Heat Rejection Test Setup 41
31 Brake Mean Effective Pressure versus Available Mean Effective Pressure for SI Engines 69
32 Nusseh Number versus Reynolds Numbers for Eleven Normally Asphated SI Engines 75
33 Brake Mean Effective Pressure versus Available Mean Effective Pressure for
Turbocharged CI Engines 77
34 Turbocharger Pressure Ratio versus Volumetric Efficiency for CI Engines 79
35 Turbocharger Pressure Ratio versus Available Mean Effective Pressure for CI
Engines 80
41 20L 14 SI Engine Heat Rejection Map 93
42 20L 14 Zeta SI Engine Heat Rejection Map 94
43 23L 14 Dual Plug SI Enghie Heat Rejection Map 95
44 25L V6 4V SI Engme Heat Rejection Map 96
45 30L V6 4V SI Engme Heat Rejection Map 97
46 30L V6 Vulcan SI Engme Heat Rejection Map 98
47 40L EI 95 SI Enghie Heat Rejection Map 99
48 40L V6 SOHC SI Engme Heat Rejection Map 100
49 54L V8 4V SI Engme Heat Rejection Map 101 Vll
410 54L V8 2V SI Engine Heat Rejection Map 102
411 68L VIO 2V SI Engine Heat Rejection Map 103
412 Overall Correlation Envelope and Test Data for SI Engmes 104
413 New Correlation and Lahvic Error for Naturally Aspired SI Engmes 105
414 73 L 250 HT Turbocharged CI Enghie Heat Rejection Map 108
415 72 L V6 3126B 2000 Turbocharged CI Engme Heat Rejection Map 109
416 72 L V6 3126B 2001 Turbocharged CI Engme Heat Rejection Map 110
417 27 L V6 Lion Turbocharged CI Engme Heat Rejection Map I l l
418 OveraU CI Test Data and Correlation Envelope 112
419 New Correlation and Lahvic Error for Turbocharged CI Engines 113
Vlll
LIST OF SYMBOLS
Alphabet
amep
A
bmep
B
C
D
frnep
F
H
imep
K
I
m
n
N
Nu
pmep
P
Pr
Q
ii
rfinep
R
Re
T
V
Auxiliaiy Mean Effective Pressure (kPa)
Area (m^) Air Mass (kga)
Brake Mean Effective Pressure (kPa)
Bore (m)
Specific Heat (kJkgK) Constant
Diameter (m)
Friction Mean Effective Pressure (kPa)
Fuel Mass (kgf)
Heat Transfer Coefficient (Wm^K)
Indicated Mean Effective Pressure (kPa)
Thermal Conductivity (WmK)
Length (m)
mass (kg)
Engine Speed (rpm)
Number
Nusselt Number
Pumping Mean Effective Pressure (kPa)
Pressure (kPa) Power (kW)
Prandtl Number
Heat (kJ)
Ratio
Rubbing Friction Mean Effective Pressure (kPa)
Ideal Gas Constant (kJkgK) Radius (m)
Reynolds Number
Temperature K
Velocity (ms) Volume (m^)
IX
w Greek Svmbols
Y
A
8
11 -copy
-
^
P
a
u
Subscripts
1-7
a
b
c
compressor
cyl
coolant
D
e
f
g
in
LH
Net
0
out
Work (kJ)
Ratio of Specific Heats
Change
Heat Exchanger Effectiveness
Efficiency
Fuel Equivalence Ratio
Viscosity (NsW)
Density (kgm )
Stefan-Boltzman Constant for Radiation
Specific Volume (m^kg)
Stations of Thermodynamic Cycle
Air Actual Adiabatic
Brake
Compression coolant
Compressor
Cylinder
Coolant
Displacement
Combusted Gas of Ah and Fuel
Fuel Flame
Combustion gas
Flows Into a System
Lower Heating Value
Net
Ambient Stagnant Conditions
Flows Out of a System
p
r
ref
rf
s
V
w
Superscripts
-
Pressure Prime Mover
Radiation Ratio
Reference
Rubbing Friction
Stoichiometric
Volume
Wall
Average
Stoichiometric
XI
CHAPTER I
INTRODUCTION
Proper design of the vehicle coolmg system requires accurate knowledge of the
engine heat rejected to coolant Unfortunately tiiis data is frequentiy unavailable during
tiie early stages of vehicle design as there is often no engine hardware available for
experimental testmg This problem is exacerbated under the shrinking duration of the
design cycle which dictates that a calibrated power fram will not be available until she
months before the first prototypes are to be completed on any given program Analytical
tools are needed to close this gap and provide the necessary information The current
method the Lahvic regression m Fords CVSP (Corporate Vehicle Shnulation Program)
is known to overesthnate the thermal loads (Lahvic 1986) A new model is necessary to
more accurately and completely estimate heat rejection from both naturally asphed spark
ignition (SI) and turbocharged compression ignition (CI) engmes
The goal therefore of this new physics-based methodology is to estimate coolant
heat rejection for an arbitrary naturally asphated gasolhie and turbocharged Diesel
engine with reasonable accuracy This method is based on dynamometer tests of 11
naturally asphed gasoline Ford engines (4 6 and 8 cylinders 20L through 68L
displacements) and four turbocharged Diesel Ford engines (6 and 8 cylinders 27L
through 73L displacements) However if experimental data is available for a specific
engine the correlation coefficients in the model can be explicitly optimized for the given
engine In that case the correlation accuracy is within the uncertainty of the
experimental data
The target users for this methodology are cooling system designers who requhe
knowledge of engine heat rejection to coolant to properly size radiators fans and vehicle
front-end openings It allows design engineers to conduct upfront robustness studies of
the cooling system and analytical mvestigations into target setting The method can also
be used to improve confidence in CAE modeling of front-end geometry and increase
productivity of experimental testing of vehicle cooling systems
The naturally asphed spark ignition engine heat rejection method is available in
an Excel workbook called ttiiHeat Turbocharged CI engme heat rejection method will
be incorporated into this workbook in the near fiiture By default heat rejection
predictions for the SI engines utilize the standard correlation coefficients based on the
data from the 11 engines Optionally the user can generate a unique correlation for a
specific engme Plots of a heat rejection map power and heat transfer correlation results
and a correlation error summary support the calculations Also included in ttu_Heat is a
worksheet to facilitate unit conversions from dynamometer data files to the SI data
needed for the correlation All of the calculation worksheets are protected except for the
user data entry areas The workbook as a whole is not protected which allows users to
collect calculation results and build additional worksheets and plots to meet individual
needs
In addition to the above-mentioned Excel worksheet this prediction method will
be added to TTU-Cool a software package developed at Texas Tech University for Ford
Motor Company The objective of TTU-Cool is to give the aerodynamics division at
Ford a tool to predict the cooling requhements of a proposed automotive configuration
with minimal data The minimal data includes the road load requhements enghie size
and number of cylinders
The Diesel engine has several imusual additional features that must be included
m the analysis These additional features include the stronger presence of radiation due
to elevated temperatures as compared to the gasolme cycle and the addition of a
turbocharger (Heywood 1988)
The addition of the physics-based method for estimatmg engine heat rejection for
both naturally asphed SI and Diesel CI engines will significantly expand the capabilities
of ITU-Cool and has been requested by Ford Motor Company SI and CI engme data
were analyzed and correlated hito a useful tool for new automobile concepts
CHAPTER II
BACKGROUND AND LITERATURE SURVEY
In the current chapter the background and basic information for naturally asphed
spark ignition (SI) engmes and turbocharged compression ignition (CI) engines are
discussed The literature survey reveals several major areas relevant to heat transfer from
automotive engmes Turbocharging and mtercoolmg automotive heat transfer computer
simulations for the automotive performance prediction and adiabatic engine
performance are all mcluded m tiie literature review By far most of the recent research
for the compression ignition engmes has been in the area of adiabatic enghie
performance Adiabatic engine literature is relevant to the current research because
turbochargmg is an hnportant accessory m adiabatic engmes Additionally the area of
pollution research for CI Diesel engmes is huge Although there is a large amount of
recent literature concerning the reduction of pollutants from SI and CI engines the topic
is not critically related to the current research objectives and will only be briefly
summarized herein
Internal combustion engines capture energy released by combustion of
hydrocarbon based fiiel and ah mixture reactants The mam products of combustion are
the heat of combustion nitrogen carbon dioxide and water Other products are tpically
considered pollutants and include partially or unbumed fuel carbon monoxide nitric
oxide nifrogen dioxide and particles The heat of combustion is the primary variable
needed from the combustion process For octane the heat of combustion is 44000 kJkg
which is the lower heating value of the fuel For Diesel fiiel the heat of combustion is
43000 kJkg which again is the lower heating value of the fuel
21 Spark Ignition Engine
Nikolaus Otto invented the spark ignition (SI) enghie in 1876 Figure 21 is a
photograph of a modem SI engine
Figure 21 Modem Naturally Asphated Spark Igiution Enghie (Ford 2003)
Since its infroduction the SI engine has become the most widely used prime
mover in the automotive industry The SI engine is a four-stroke engine The term four-
sfroke relates to the cycle that the engine must traverse These four strokes of the piston
are the intake compression combustion and exhaust Each of these processes occurs
only once every other rotation of the engine crankshaft Altematively the power output
from a given cylinder only occurs every other rotation
The experimentally evaluated variation of cylmder pressure with respect to
cylinder volume for a four-stroke SI engine (Heywood 1988) is illustrated in Figure 22
Figure 22 Actual Normalized Pressure versus Volume Diagram for a Naturally Asphed Spark Igiution Enghie (Heywood 1988)
The lower portion of Figure 22 shows tiie intake and exhaust portion of the cycle
The actual process shown m Figure 22 followed by tiie ah and fiiel within tiie cylmder
is modeled with a closed system following the ideal Otto cycle as illusfi-ated m Figure
23
p bull
TT 11 w
(2)
fl)
it AIK
T gt
(2)-lt3gt
(4)-a)
TDC BDC LOUlplCJIlOll ll=CI)Mt
iMStiuiillUon bdltraplc expumlo
ii^consl heaxttfOoa
Figure 23 Pressures versus Specific Volume for the Ideal SI Engine Cycle (Cengel 1989)
Comparing Figures 23 and 22 shows that the ideal SI cycle is remarkably
accurate in process although inefficiencies must be included to obtain quantitative
results In the ideal cycle a constant volume heat transfer represents the combustion
process The exhaust and intake processes are modeled with a single constant volume
heat rejection process The compression and expansion processes are treated as
isentropic This ideal SI engine cycle is well documented in the literature and nearly
every modem thermodynamic text From Figure 23 the following ideal processes can
be identified In the ideal cycle for a naturally asphed SI engine the cycle begins with an
isentropic compression of the charge air The compression ratio r defined as
V2 V (21)
typically varies between 8 to 12 Note that stagnation states are assumed unless
otherwise specified The correspondmg temperature and specific volume ratios based on
an isenfropic process are
^ u V
^iJ P (22)
The correspondmg isentropic power to drive the compression can be calculated by
-KM=rhcJr--l) (23)
The heat mput from tiie fuel combustion occurs between States 2 and 3 In the ideal
cycle tiie combustion occurs at constant specific volume SI engmes are designed to
have an ah-fiiel ratio very close to the ideal stoichiometiic value of 146 Using the first
law of tiiermodynamics the temperattire at State 3 can be calculated
r = r-h QML
c ^7- (24)
The ideal gas law and the ah cycle standard can then be used to calculate the pressure at
State 3
^ 3 = ^ ^ (25)
From States 3 to 4 the power to drive the compression and the net output power are
found ushig isentropic expansion relations The specific volume at State 4 is the same as
the startmg specific volume at State 1
V4=v (26)
With the assumption of an isenfropic expansion the temperatuie and pressure at State 4
f ^ f 3
V^4
te] (27)
The power output from States 3 to 4 are calculated using the first law of
thermodynamics as
^pou =
V F) cM-T) (28)
The net power is the difference between the expansion and the compression power as
defined m Equation 28 and 23 respectively
The net power thus defined is referred to as the indicated power or the power
indicated by the integral Qp dVfor the complete cycle m one cylinder The brake
power is the power available at the output shaft of the engine The brake power is
reduced from the indicated power by fiictional losses within the engine pumphig losses
in the induction and exhaust systems and by the accessory power requhements such as
the fuel oil and water pumps and the altemator The net of these losses or the difference
between the indicated and brake power is defined as the fiictional power
The thermal efficiency for a work producing cycle is
7 =5^- (2-9)
Referring to Figure 23 the thermal efficiency can be expanded to
7
bdquo 34- 12 rnCMn-T)-T-Tj T - 1
HT- (210)
For the isenfropic compression and expansion processes between the same minimum and
maximum volumes
ZL = I i = K- (211) T T 4
where r is defined m Equation 21 Additionally from tiie ideal cycle the following can
be shown
T T
y = f- (212)
Substittiting Equations 211 and 212 mto Equation 210 yields
^tgt=^-^- (213)
Thus it is apparent that the maximum thermal efficiency for the ideal Otto cycle is a
fimction of only the compression ratio and the ratio of the specific heats for the ah-fuel
mixture For typical SI engines compression ratios are generally between 8 and 12
Taking the ratio of specific heats at 13 as a representative average for the combusted ah-
fuel mixture yields maximum thermal efficiencies of 05 to 06 with the higher efficiency
occurring at the highest compression ratio
Utilization of compression ratios above 12 results in premature ignition of the ah-
fiiel mixture at the high temperatures and pressures at the end of the compression sfroke
This behavior commonly known as engine knock results in unacceptable damage to
the engine and therefore places an upper limit on the usefiil compression ratio
The ah induction rate is quantified in terms of the volumetric efficiency which is
the ratio of the ahflow rate to the enghie volume displacement rate
Tjy= y (210)
The volumetric efficiency is a non-dimensional expression of the mass flow rate through
the engme and is dhectly dependent on throttle position
Assummg 100 fuel combustion the fuel conversion efficiency
w (214)
is equivalent to tiie thermal efficiency witii the same dependence on compression ratio
and specific heat ratio The net power output from an engme is equal to the net work
output from a single cycle times the rate of work producmg cycles ie
n n n Pne=-Ke=^VffnfQuf (215)
The fuel mass per cycle may be written as
(216)
Substituting Equation 216 into Equation 215
Pne=^ ipylti
F J Q LH (217)
After normalizing the indicated power by dividing by engine speed and volume the
indicated mean effective pressure is defined as
^v F (218)
The imep is the pressure requhed in a constant pressure expansion of the displaced
volume to produce the same net work as the ideal cycle The practical significance of the
10
imep is that h provides a normalized measure of enghie power for which the effects of
engine displacement and speed are removed
In tiie application of Equation 218 to SI engines rj^p^and Qjjj are effectively
constants determined by the engine compression ratio and the air-fuel properties
Furthermore the air-fiiel ratio is maintained at approximately the stoichiometric value of
146
The variable element in Equation 218 or the mechamsm for power confrol of a SI
enghie is the volumetric efficiency Its value is determined by the fixed and variable
elements of the air induction system The fixed elements include the ah induction system
while the prmciple variable element is the operator confroUed throttle plate Typical
values for volumetric efficiency are 02 (throttle closed) to 085 (throttle wide open)
From another perspective
^ (219) F
is effectively a non-dimensional characterization of the fuel flow rate The product of
that quotient with the lower heating vjdue of the fuel gives an indication of the available
fuel energy and is defined poundis the available mean effective pressure
Amep = ^^P^^ (220)
and
imep = Tjf Amep (221)
From Equation 221 imep is expected to be linear with respect to Amep with a slope
equal to x] Graphically this behavior can be shown in Figure 24
11
SI Indicated Mean effective Pressure vs Volumetric Efficiency
^y^ 11 bull bull ^ ^ 1 slope IS tif
^ ^
^ ^ ^
1
(00) Available Mean Effective Pressore - ii p QLH AF (kPa)
Figure 24 Indicated Mean Effective Pressure versus Available Mean Effective Pressure
This behavior is demonsfrated with actual engine data m the next chapter As
mentioned previously the maximum volumetric efficiency in a naturally asphed SI
engine is approxhnately 085 This limit effectively puts an upper bound on the hnep and
the power output for a given enghie at a particular speed However this limit can be
exceeded by mechanically compressmg the cylinder ah-fuel charge through
supercharging or turbocharging
22 Turbochargmg and Intercooling
The difference between superchargmg and turbochargmg is the power source for
the enghie mflow compressor The engme crankshaft drives superchargers whereas
turbochargers utilize a turbine m tiie hot exhaust sfream to provide the necessary power
There is a limh to tiie power mcrease achieved by turbocharging or supercharghig By
compressing the air-fuel charge to the cylinder tiiere is higher pressure and temperature
12
at the beginning and end of the compression sfroke Inflow compression ratios must be
limited to avoid premature ignition or knock in the SI engine The problem is somewhat
alleviated by providing charge air-cooling between the compressor and the intake
manifold with an intercooler Intercoolers are ah-to-ah or ah-to-coolant heat
exchangers A turbocharger is more commonly used with the compression ignition (CI)
engine The CI engine is discussed in detail in the next section Figure 25 is a picture of
a modem turbocharger
Figure 25 Garrett GT-15-25 Turbocharger (GT15-25 nd)
Merrion (1993) provides msight into the turbochargmg process The process
consists of compressmg tiie mtake ah to an mtemal combustion enghie utilizmg the
energy in the exhaust gas sfream to run a turbine that is dhectiy connected to the
compressor feedmg ah mto tiie enghie The schematic shown m Figure 26 is a physical
and thermodynamic sketch of a turbocharger
13
TEXAS TECH LIBRARY
3 A
-^---J^^^
Turbine h
w Compressor
Work ^^^--^^ ^^
4 T
1
Figure 26 Thermodynamic Representation of a Turbocharger
Turbocharging is the preferred method of supercharging because the energy
requhed to drive the compressor is exfracted from the exhaust gas waste sfream This is
opposed to pvu-e supercharging where power is bled off the output shaft or the electrical
system Turbochargers operate at high speeds typically rangmg from 15000 to 100000
rpm dictating that most turbochargers are radial flow devices especially in automotive
applications The high speeds requhe the turbocharger to be well balanced made of
materials that can handle the high centrifugal forces that are generated and able to avoid
blade resonance The common operating boost pressure ratio is two or three-to-one when
used with the CI engine Turbocharging is even more atfractive for vehicles that
commonly operate at high altitudes due to the replacement of much needed volumetric
efficiency
In CI engines the pressure mcrease due to tiie tiirbocharger is typically limited by
mechanical sfresses in the enghie In SI engmes the pressure increase due to
turbocharging is typically Ihnited by pre-ignition of tiie ah-fiiel mixture as previously
discussed Lhniting the pressure mcrease at high enghie volumetiic efficiencies must be
employed There are three mam metiiods to limit tiie turbocharger pressure ratio sizmg
exhaust stream bypass or wastegatmg and variable geometry llie first and most shnple
method is to vmdersize the turbocharger turbhie such that tiie limithig pressure cannot be
14
reached The drawback to this method is tiiat the boost at nominal drivmg conditions is
mirumal and insignificant
The next level m over-boost protection is wastegating which is currentiy tiie most
common method It is hnplemented by bypassing some of the exhaust gas arovmd the
turbhie to limit the power supplied to the compressor Wastegatmg increases the
complexity of the turbocharger and does not utilize all of the energy available from the
exhaust gasses The most efficient and complicated method of over-boost protection is
variable geometry turbochargers These typically consist of varymg either the nozzle or
the vanes of the turbine
Merrion (1993) describes two distinct philosophies in the design of
turbochargers Constant pressure turbochargers use the exhaust maiufold to absorb blow-
down pressure pulses By absorbing these pulses the flow is constant Therefore
constant pressure turbochargers are more conducive to high turbhie efficiencies There
is however a relatively high backpressure on the engine requiring additional exhaust
pumping during the exhaust sfroke Pulsed flow turbochargers represent the second
philosophy in turbocharger design They use the kinetic energy of pulses from the
cylhiders The non-uiuform flow and pressure reduces turbine efficiency However with
a properly designed system reduced efficiency in the turbine can be offset by lower
backpressure on the engine This type of design uses divided turbine housings to take
advantage of individual cylinder pulses thereby increasing the cost of this type of
turbocharger
Recalling the representation of the turbocharger in Figure 26 Station 1 is the
ambient condition Station 2 is the compressed air or mixture that is mjected into the
engine Station 3 is the exhaust from the enghie Station 4 exits the turbine back to
atmosphere From a thermodynamic analysis assuming negligible heat loss and
elevation change and ideal gases the compressor power W^bdquopressor can be shown as
15
- I T ^xCpJ
compressor nc Polj
-] (222)
From a shnilar tiiermodynamic analysis tiie ttirbine power W^iibdquo can be shown as
turbine ~ ^e^pe^oS^T 1 - PA
Po^)
m (223)
In addition to the thermodynamic analysis experimental measurements and
dimensional analysis are used to relate the parameters Turbomachhiery dimensional
analysis typically employs the following hnportant variables
mriKT^ = f(pbdquo^p^^^T^^NDRyn) 11A)
From experience it has been observed that the Reynolds number and the ratio of
the specific heats have little effect on the performance of turbomachinery These can
typically be eliminated from the analysis Therefore the following dimensionless groups
(Heywood 1988) are formed
m J^n^-f PcD
ND Po^
4^Pom Pom
(225)
The turbine flow range is largely fixed by the ratio of turbme flow area to the
radial distance of the shaft centerlme to the cenfroid of the mlet area (AR ratio) The
AR ratio illusfrated m Figure 27 has a sfrong mfluence on tiie performance of the
turbocharger however h has not been mcluded in the dimensional analysis to the
authors knowledge
16
Figure 27 Turbocharger AR Ratio from Merrion in Diesel Engine Design for the 1990s (Merrion 1993)
Decreasing the AR ratio increases the angular momentum to the turbine Shaft
speed compression ratio and engine backpressure are correspondingly increased The
converse also holds The dimensional data is then expressed in the form of compressor
and turbine maps (Merrion 1993)
Figure 28 shows an example of a typical compressor map showing the
relationship between mass flow rates compressor pressure ratio and speed versus
efficiency
17
o
ltu a
N or = 152400 revmi
l__l_J L X I I I
005 010 015 020
Corrected mass flow rate m^or ^B^^
025
Figure 28 Typical Compressor Performance Map (Brandstetter amp Dziggel 1982)
On e compressor performance map the left edge shows the unstable boundary
^ e r e the compressor can cause self-damage Tins limit is avoided with proper njrbme
selection Tire right edge is where the sonic velocity is reached causing choklaquoi flov
M s capped maximum flow causes the rotational speed lines to be verhcal The upper
18
edge is the mechanical rotational speed limit that additionally defines the maxhnum
pressvire ratio limit The operating domain of a typical turbme map is shown in Figure
29 the operating reghne is rather small
Figure 29 Typical Turbhie Performance Map (Watson amp Janota 1982)
19
From Figure 29 at higher mass flow rates tiie turbine rotational speed Imes tend
to overlap one another This overiap causes difficulty workmg witii this type of
turbocharger map As a result an altemative flow map has been used A typical
altemative turbine map is shown m Figure 210
^ bull
5Si 024
^i- 022
i ^ 0 2 0
Wamp 018
fefel 016
i K 014
w^ fe 012
it-
bullHjitiinc efficiency Sgt^
60 70 80 90
Corrected rotor speed N^bdquo 10 revmiri
Figure 210 Altemative Turbme Map (Flynn 1979)
Figure 210 shows larger performance regimes making it easier to determine the
performance of the turbocharger turbine Typically turbine efficiency includes the
turbine adiabatic efficiency and the turbocharger mechanical efficiency as they are
difficult to measure separately As efficiency increases the result is less backpressure on
the engine
The current turbocharger sizing and selection process is a several step process
structured as follows
a Determine the enghie mass flow requhement This flow rate is found from the
enghie data and engine volumetric efficiency
b Determine the air density and compressor pressure ratio requhed
c Select a suitable compressor The fact that turbocharger efticiency cannot
possibly be simultaneously maxhnized at all engine-operating requhements is
important to recognize An adequate compressor surge margm must be
maintained Most importantly adequate boost and ah-fiiel ratio at the enghie
20
peak torque speed must be balanced while avoiding excessive boost tiiat causes
knock and exceedmg stmctural requhements at higher speeds
d Select tiie ttirbme design tiiat produces the requhed shaft power (or torque) at
each compressor matched ahflow condition
e Select an over-boost prevention technology as discussed previously coupled witii
the avoidance of ttirbo lag Turbo lag is caused by tiie inability of tiie rotatmg
mertia m the turbocharger to change mstantaneously As a resuh tiie vehicle has
a delayed response and smoke may dominate the exhaust due to lack of ah from
the compressor To avoid turbo lag h is deshable to reduce turbhie AU
Reducmg the turbme AR ratio mcreases the ahflow and rotational speed at the
turbocharger resultmg m excessive boost at high speeds This couplhig is the
reason that these steps are commonly analyzed together Turbines with ceramic
wheels are mcreasing m popularity especially in passenger cars because of lower
inertia and better response
The compression of any gas in any real process causes a temperature rise in the
gas This increase in temperature decreases the density of the gas entering the engine
Intercooling heat exchangers provides charge air cooling thereby increasing the density
of the ah supplied to the engine As outlined by Merrion (1993) intercoolmg mcreases
the specific output of the engine the altitude capability and the reliability (due to lower
engine temperatures) Additionally it decreases the brake specific fuel consumption
Component material cost is also lowered due to the lower temperatures that occur
Intercooling has a positive effect on exhaust emissions especially NOx There are three
types of intercoolers (1) ah-to-engine water exiting from the radiator (2) ah-to-water
with separate radiator system and (3) air-to-ah Option 1 is the easiest to hnplement but
it is the least effective Option 2 is deshable but it requhes excessive additional
equipment The ah-to-air option provides the best performance and shnphcity but ah
ducting requhes a lot of space Whichever option is utilized intercooimg is very
atfractive when turbocharging engines (Merrion 1993)
21
Sekar (1982) discussed the evolution of the Diesel engine There was a
significant trend towards higher specific output Diftering approaches have been
employed to achieve a higher power-to-weight ratio in Diesel engines A key parameter
was the charge airflow rate Most of the methods to increase the power output of a given
displacement engine concenfrated on providing more ah for combustion In the 1960s
and 1970s turbocharghig became the standard method utilized for mcreasmg the power
output reducing smoke and improving fuel consumption In many applications
compressor pressure ratios greater than 25 were common limited only by turbocharger
speeds and materials As discussed previously the objective is to hicrease the intake
charge air density and one way of accomplishing this is to cool the charge ah Sekar
reviewed the evolution of ah charge cooling and its effects on engine performance Air
charge cooling favorably impacted fuel consumption emissions (especially NOx)
altitude performance thermal loadmg of engine components and the capability for
higher specific output The exhaust gas turbhie inlet temperature generally limited tiie
enghie capability Charge ah-coolmg helped to hicrease the ratmg m two ways higher
charge ah density and lower ttubine inlet temperature Vertically mtegrated companies
generally preferred an ah-to-ah system while mdependent enghie manufacturers seem to
prefer air-to-water systems
Davidson (1984) additionally discussed the benefits of charge ah-coolmg An air
charge coolmg system was developed to provide the reqmred mtake maiufold
temperatures This system went further to warm charge air under light enghie loads
while also providmg superior ah charge coolhig when reqiured This system unproved
dvu-ability hnproved fiiel economy and permitted less restiictive smoke confrols
Wallace et al (1997) discussed tiie use of Variable Geomefry Turbocharging
(VGT) VGT generally adjusts tiie AR ratio by changhig tiie turbine nozzle sizes VGT
has found Ihnited applications on heavy-duty tiiick-type engmes due to hnprovmg
torque back-up and fransient response Diesel passenger cars have also begun to
mcorporate VGT technology It was recognized that VGT additionally offered tiie
potential to hnprove the emission characteristics relative to engmes equipped witii
22
conventional wastegated fixed geometry turbochargers (FGT) The mvestigation was to
assess the benefits of VGT over conventional turbochargers relative to lower fuel
consumption and reduced emissions It was demonsfrated that torque backup was
hnproved by VGT from approxhnately 25 to 35 with peak torque occurring at lower
speeds than with conventional turbocharging The passenger car engine under urban
drive conditions operates mainly m the low load low speed regime where emissions of
NOx and hydrocarbons are critical Wallace et al investigated the potential of a VGT to
reduce and confrol the emissions from a prototype passenger car dhect injection (DI)
Diesel engine The automotive engine was first base-lined for emissions and brake
specific fuel consumption with a fixed geometry turbocharger followed by installation
and evaluation of a VGT equipped with swiveling turbine nozzle vanes An iritial
investigation of a VGT in conjunction with a controlled exhaust gas rechculation valve
showed that up to 19 improvement at partial load of NOx emissions could be made
without compromising fiiel consumption
In the following study Hawley et al (1988) determined that usmg a VGT resulted
m a 10 torque enhancement over the speed range 1000 to 3500 revolutions per minute
without exceeding the limits of maxhnum cylhider pressure pre-turbhie temperature and
the Bosch smoke test Hawley et al used a computer shnulation where compressor and
turbine performance maps are input as numerical arrays in the usual manner This
method of entering performance maps was standard procedure for fixed gate
turbocharghig (FGT) with a uniquely defined turbine map However tiie variable gate
turbocharghig (VGT) used has a different operatmg map for each vane settmg witii
dramatic enhancement in mass flow and smaller changes m efficiency The procedure
adopted was to use a turbme map for the baseline FGT and employ mass flow and
efficiency scale factors These factors corrected for changes m behavior due to vane
angle The scale factors were calibrated by varymg them m small hicrements for any
given operating point
VGT offered hnprovements over the baselme FGT performance by lowering
brake specific fiiel consumption pre-turbme temperature at higher speeds smoke
23
levels over the entire speed range and by possibly raismg the general limithig torque
level up to 13 percent without exceeding engine turbocharger limits
The simulation package ODES (Otto Diesel Engine Simulation) was developed at
the Uruversity of Bath The approach was incorporated into this simulation package
(Hawley etal 1998)
Shayler Baylis Chick and Bell (1999) provide an excellent precursor to the
research described herein When comparing Diesel engines to spark ignition gasoline
engines Diesel engines offered superior fiiel economy with inferior power to weight
ratios in naturally asphed form The differential in power output is reduced when the
engine is turbocharged andor intercooled The use of exhaust gas rechculation EGR is
commonly used to limit NOx emissions on both and spark ignition engines
23 Turbocharged Compression Ignition Engine
Rudolf Diesel mvented the Diesel cycle engine m 1892 Figure 211 shows a
CAD layout of a modem Diesel Enghie
Figure 211 Diesel Enghie (The new DELTA engine nd)
24
The Diesel engine is fimctionally shnilar to tiie gasolme engine The major
difference is that a Diesel enghie utilizes compression ignition (CI) while a gasolme
enghie uses a spark ignition (SI) A CI engine does not typically coiitam spark plugs to
ignite the air-fuel mixture m the cylmder Instead the heat associated with the
compression of the air-fiiel mixture causes the mixture to igiute
The Diesel engine is frequently applied m marine mdustrial and agriculture
applications due to its fuel efficiency and relatively small parts count The disadvantages
to the Diesel enghie have been weight and increased exhaust pollution compared to the
gasolme enghie Both disadvantages are a result of the higher pressures at which a CI
engine operates The higher pressure causes the stmcture of the engine to be sfronger and
heavier The higher pressure also increases the concenfration of several pollutants in the
exhaust sfream Substantial research in the last 20 years has made the Diesel engine more
useful for automotive applications by addressing these shortcomings The majority of the
improvements have resulted from the development of reliable efficient turbochargers
Because the CI enghie process injects the fuel after the air has been compressed
supercharging and turbocharging advantageous This process avoids premature
detonation or knock that is an issue with the SI engine
The definition for the indicated mean effective pressure was given previously as
imep = TjfAmep = rj^ ^^^^- (226)
For SI engmes the ah-fuel ratio is held approxhnately constant equal to or slightly less
than the stoichiometric value or a slightiy rich mixture Operator regulation of tiie power
output is accompUshed through variations of the volumetric efficiency with the throttle
plate
By contrast for normally asphated CI engines the volumetiic efficiency is
approxhnately constant at a value determmed by the fixed elements in the ah mduction
system Power regulation is achieved by controlling the cylinder fiiel mjection rate or the
25
afr-fuel ratio Values of the ah-fiiel ratio for CI engmes are generally significantly above
the stoichiometric value or a lean mixture
In the case of turbocharged CI engines the volumetric efficiency varies because
of the action of the compressor in the air induction path The turbocharger pressure ratio
and thereby the volumetric efficiency are not dhectiy confroUed by the operator The
pressure ratio is determined by the energy hiput to the turbme from the exhaust sfream
and the flow rate speed and power matching of the turbhie and compressor The flow
rates through the turbine and compressor are approximately equal the power output from
the turbine is equal to the power input requirement of the compressor and since the
turbhie and compressor usually share a common shaft theh rotation speeds are equal As
with the normally aspirated CI engine the operator confrols the power output by
regulating the fuel injection rate
The combined influence of the air-fiiel ratio and the volumetric efficiency on
engine power or hnep complicates the problem of determining the engine operational
state It is useful to examine the results of a shnple analysis of an ideal CI engine to
determine the underlying relationships between volumetric efficiency ah-fuel ratio
turbocharger pressure ratio and enghie speed and power As will be described in the
next chapter these relationships are used as a guide hi the reduction and correlation of
actual experhnental data Consider the block diagram for a CI engine witii a turbocharger
illusfrated m Figure 212 and the corresponding Pv diagram for the CI engine cycle m
Figure 213
26
CI Engine
Intercooler
Turbhie Compressor
Work
Figure 212 Schematic of Ideal Turbocharged CI Engine
Figure 213 State Diagram for Ideal Turbocharged CI Enghie
The primary assumptions for the analysis are an ideal gas constant specific heats
an isenfropic compression sfroke from state 2 to state 3 constant pressure during the fiiel
combustion and mitial phase of the expansion sfroke from state 3 to state 4 vitii fiirther
isenfropic expansion after the fuel combustion from state 4 to state 5 The turbhie and
compressor efficiencies are each approxhnated witii constant or average values In
27
addition tiie ah mduction chcuit mcludes an intercooler where tiie exh temperattire is
taken as approximately equal to the ambient temperattu-e
For the process through the compressor
^i - Pamb
Pi = Pamb
P = PrPamb
Pl=Tarrb+^ Vc
( r-1 ^
Pr - 1
V i = -RT^
P
111)
The exit conditions from the intercooler are
V2=v T2=T amb P2--=-RTn
(228)
The isenfropic compression from state 2 to state 3 yields
V 3 = ^ 7 3 = 7 2
r T3gt 1 ^ 3
V (229)
and the work input requhed for the compression is
^c=^2-i=(^^i-Pi) (230)
The initial expansion with fuel combustion from state 3 to state 4 is approximated with a
constant pressure process
PA=P3 34 = QLH
1-1-AlF
CpAlF + ) V 4 = -
RJ
PA (231)
28
and tiie remaming expansion from state 4 to state 5 is an isenfropic process
V 5 = -
1-h-P5=TA
AF
y- r V P5 =
V^s (232)
The work output for the expansion sfroke is given by
W pound = W 3 _ 4 + W 4 _ 5 = P 3 r 1
1 - K -LV APj
V4-V3 1 ^
1 + AF) XT-TS)- (233)
The exhaust gases expand through tiie turbhie from state 5 to tiie ambient pressure The
work exfraction by the turbine per unit mass of tiie ah and fiiel combustion products is
given by
^turb =
r 1 A 1-I--
V AP^ ^turb^pPs 1 - ^Pamb^ r
Ps ) (234)
Equations 227 to 234 define the properties at each state point through the simplified CI
engine and turbocharger The net work output per unit mass of ah through the engine
and the overall thermal efficiency are given by
Wbdquoer =^E-^C= ^3 -4 + W4_5 - W^j ^th w net
QLH AF
(235)
The corresponding indicated mean effective pressure is
29
imep = ^ = rjfAmep = TJ^TJ^ ^Jf (236) v j l - - l ^ ^ 2
where
Vv=-m^
The volumetric efficiency is a function of the pressure ratio provided by the turbocharger
compressor This dependency which is illusfrated in Figure 214 suggests that
experimentally determined values of volumetric efficiency should be well correlated to
the pressure ratio by a linear curve fit
30
Volumetric Efficiency versus Turbocharger Pressure Ratio for Ideal Turtiocharded CI Eogine
35
Z5
bullC 20 E u u bulls a 15
10 15 20 25
Turbocharger Compressor Pressure Ratio
Figure 214 Volumetric Efficiency versus Pressure Ratio for Ideal Turbocharged CI Engine
From Equation 236 h is apparent that tiie imep is functionally dependent on both
the volumetric efficiency and tiie ah-fuel ratio Takmg a representative engine
compression ratio of 18 standard afr properties standard atinosphere ambient conditions
and takmg Quj = 43 x lO mdash tiie resultmg calculated imep is plotted witii respect to
Amep m Figure 215 along Imes of constant afr-fiiel ratio for ttirbocharger pressure ratios
of 1 to 3
31
4 0 -1
35
30
25-
I
=bull 20 V
B
16-
10-
0 5-
00 0
Indicated Mean Effective Pressure versus Available Mean Effective Pressure
^
^ ^
jt^
^ ^
gt^
0
bull
10
y
Air-fuel Ratio = 30 mdash mdashAlr-fuGl Ratio = 40 - - - Air-fuel Ratio = 50
20 30 4 0 50
Amep (MPa) 11 p QLH 1 (AF)
60
Figure 215 Indicated Mean Effective Pressure versus Available Mean Effective Pressure for Ideal Turbocharged CI Engine
This figure illusfrates the principal difficulty in analyzing the turbocharged CI
engine Note that based on the CI engine cycle analysis alone the specification of an
engine power and speed requhement or equivalently the imep does not lead to a unique
combination of volumetric efficiency and ah-fuel ratio Determination of the specific
values of these parameters requhes appUcation of the matched operatmg conditions for
the turbocharger compressor m the enghie mlet flow and the turbme in the exhaust flow
Figure 216 illusfrates the variation of the energy input requhement per unit mass of ah
for the turbocharger compressor and the energy exfraction per unit mass of the ah-fiiel
combustion products for the turbine
32
Turbocharger Worii Interaction for Ideai Turbacharged a Engine
I
1 1 - raquo Tiubinc Work AF = 30 - ^ Turbine Work AF = 40 - bull Turbine Work AF = 50 ^ ^ bull ~ Compressor Work
_ raquo 1
^ m
raquo - bull
- bull - bull
- - bull l ^ ^
i i - - bull
- - lt gt - - bull - - - - - -
16 18 20 22 24
Turbocharger Compressor Pressure Ratio
Figure 216 Specific Turbocharger Works for Ideal Turbocharged CI Engine
The compressor energy requhement is a function of only the pressure ratio The
turbine energy exfraction depends on the exhaust flow pressure and temperatuie and is
therefore dependent on both the pressure ratio and edr-fiiel ratio At any actual steady-
state enghie operating point the energy exfraction from the turbine is equal to the energy
requirement for the compressor These operating points are indicated by the intersections
of the compressor energy requhement curve with the lines (for constant ah-fiiel ratio) of
turbine energy exfraction These points of intersection define a unique relationship
between the turbocharger pressure ratio and engine ah-fiiel ratio that is illusfrated m
Figure 217
33
Air-fiiel Ratio versus Pressure Ratio for Ideal Turbochai ed CI Eugice
40
20
n
r
10 Z5 30
Turbocharger Pressure Ratio
Figure 217 Air-fiiel Ratio versus Pressure Ratio for Ideal Turbocharged CI Engine
The relationship is more converuently represented m Figure 218 by plottmg
ttirbocharger pressure ratio versus Amep = rj^PambQiH ^ ^ gt where both tiie ah-fuel
ratio (Figure 217) and volumetiic efficiency (Figure 214) are unique functions of tiie
pressure ratio
34
Pressure Ratio versus Available Mean Eflective Pressure forTuibocharged Ideal CI Engine
35
30
= 25
I pound
a 15 u
E U ^ 10
00 00 10 20 30 40
Amep (MPa) ti p QLH (AF)
70
Figure 218 Pressure Ratio versus Available Mean Effective Pressure for Turbocharged Ideal CI Engine
Figure 218 suggests that experimentally determined values of turbocharger
compressor ratio should be approxhnately Imearly related to tiie correspondmg values of
Amep With a unique relationship established between turbocharger pressure ratio and
engine ah-fuel ratio correspondmg values of imep and Amep may be calculated witii tiie
results shovm in Figure 219
35
Indicated Mean Effective Pressure venus AvailaUe Mean EffectWe Pressure
40
35
30
25
bull^ 20
15
10
05
00 10 20 30 40 50
Amep (MPa) tiraquo P QLH (AF)
Figure 219 Indicated Mean Effective Pressure versus Available Mean Effective Pressure for Matched Ideal Turbocharged CI Engine
Not surprisingly the imep is linear with respect to Amep with the slope equal to
the fuel conversion efficiency
24 Heat Transfer
Many researchers currently use some form of the heat fransfer analysis outlined
by Annand (1963) This is a generalized equation accounting for both the convection and
radiation component of the heat fransfer m a cylhider of a reciprocatmg engine
Gehres (1963) of Union Carbide discussed the mterestmg phenomena of nucleate
boilmg that can occur under severe drivmg condhions Tests mdicate tiiat at these severe
drivmg conditions up to 60 of the cylmder heat fransfer surface is cooled by nucleate
boilmg Additionally tiiese hot spots represent 80 of the heat fransferred to tiie
coolant The coolant boiling pomt confrols the engine hot spot temperatures Gehres
36
fiirther correlated tiie effects of differing cooling media properties to tiie occurrences of
tills type of engine coolmg The heat fransfer coefficient from tiie coolant-to-metal is
many tunes greater tiian the fransfer coefficient of metal-to-ah Therefore at tiie radiator
tiie properties of tiie coolant do not have a major impact on the heat fransferred
Fmlay Harris Boam and Parks (1985) discussed the mfluence of cylinder head
material coolant composition pressure temperattire and velocity on cylinder head
temperatures Each of tiiese parameters was varied and its mfluence on combustion
chamber wall temperature was determined Agreement was shown between measured
values and correspondmg predictions from a heat transfer model Forced convection
sub-cooled and nucleate boilmg were mcluded m tiie model The results suggested that
nucleate boilmg was an integral factor in tiie fransfer of heat from the cylhider head to
coolant
Fmlay et al (1985) reiterated that the reduction of lead levels in pefrol higher
compression ratios and the mcreasing use of turbocharging is aggravatmg premature
detonation in the automotive spark igiution engines Knowledge of the local coolant
temperatures and velocities surface heat fluxes and heat fransfer coefficients were
necessary to design an effective engine cooling system In 1985 this information was not
available due to the complex geometry of the coolant flow passages in most engines
An aluminum cylinder head was found to have lower combustion chamber wall
temperatures and was able to tolerate more ignition advance than a cast hon cylhider
head of similar geometry under conditions of ahnost equal power generation
Combustion chamber wall temperatures were not sensitive to cooling water pump speed
Therefore pump speed changes did not increase resistance to low speed knock
Equations developed for forced convective nucleate boilmg heat fransfer were used to
predict the relationship between heat flux and surface temperature in the cylinder bead in
the liquid-cooled regions The theory predicted the measured changes in the wall
temperature resulting from changes in coolant velocity pressure and composition (Finlay
etal 1985)
37
Alkidas and Cole (1985) reported tiiat the time histories of the local heat fluxes
were significantiy different at different locations of measui-ement These differences are
attributed to tiie lack of spatial uniformity in the fluid motion and combustion Because
of the exfreme difficulties associated with the estimation of errors in the measurement of
surface heat flux an error analysis of the heat flux temperature measurements was not
performed
Lahvic (1986) presented a correlation for the estimatmg heat rejection to the tiien
engine coolant This dissertation is the resuh of updating the prediction methodology for
Ford Motor Company Lahvic regression is the following correlation (Lahvic 1986)
QcooiantiBtuIhr] = 866F0 [L]n[rpm] +148r[^ lb]+S35P[hp]-101 (FQ + 2890 (231)
Liu Xu and Hou (1993) investigated the heat exchange characteristics of an
engine series containing a water-cooled radiating system The analysis of the radiator
hidicated that most of the heat fransfer resistance comes from the fin to air heat fransfer
coefficients Increasing the airflow or the fin surface efficiency could increase the heat
fransfer coefficient Liu et al also proposed to meet differing loads by varying the fan
size and speed From a heat balance 24 (30 at lower speeds) of the overall heat of
combustion is rejected to cooling system If the intercooler is placed before the radiator
the net impact could be negative Therefore ahflow path is critical in the design of an
intercooler For the particular engine used in their test the enghie coolant was held to
95degC correspondmg to a 35degC ambient temperature
Cao and Wang (1995) investigated tiie use of heat pipes for cooling pistons
Piston coolhig is a critical measure for achieving efficient engine performance A higher
working temperature is required to hicrease enghie thermal efficiency and reduce the
discharge of soot from the engine The maximum temperature a piston can sustam is a
critical restriction in engine performance The maxhnum temperature is even more
critical for aluminum alloy-based pistons These alloys have a pronounced temperature
dependence on their mechanical properties Due to the reciprocatmg motion of the piston
38
coolhig is difficult Commonly pistons are cooled by the crankcase oil plashmist under
crown cooling method Additional oil coolhig may be necessary for medium- and highshy
speed engine pistons An internal coolmg gallery in conjunction with an oil jet on tiie
piston crown provided improved coolmg Cao and Wang observed that the reciprocatmg
heat pipe was also feasible for cooling an enghie piston In similar systems an analysis
of the piston cooling system mdicated tiiat the reciprocating heat pipe coolmg metiiod at
the valve stems could sustain much higher engine powders
Rakopoulos and Mavropoulos (2000) discussed the complexity of heat fransfer in
an hitemal combustion engine This complexity was attiibuted to the fact that the
relevant phenomena are fransient three-dimensional and subject to rapid swings
in cylinder gas pressures and temperatures The combustion chamber itself with
its moving boundaries adds more complexity Theh experimental investigation was an
effort to examine the short-term response during an engine cycle Heat fluxes to the
exhaust manifold wall were obtained and analyzed with the corresponding heat losses to
the combustion chamber walls under the same engine operating conditions
Rakopoulos and Mavropoilos (2000) applied the unsteady heat conduction
equation to calculate the heat flux with boundary conditions derived from experhnental
temperature measurements As expected increasing the enghie speed resulted in
increases of the values of the peak heat fluxes in both the cylinder head and exhaust
manifold This hicrease was due to the increase of the gas side heat fransfer coefficients
However it was shown that as engine speed increases the increase of cylinder head peak
heat flux becomes minimal whereas the heat losses from the exhaust gases to the
manifold hicrease As tiie engme speed increases there is only a small hicrease m the
cylinder head peak heat flux because the combustion gas peak pressure and temperature
decrease with increasmg speed imder constant load The decreasing load was attiibuted
to combustion deterioration The higher gas velocities in tiie exhaust maiufold domhiate
the heat fransfer as the enghie speed mcreases The heat loss mcreases are approxhnately
proportional with engine speed After tiie inlet valve opens the warmer combustion
chamber walls fransfer heat to the fresh ah entering tiie cylhider Thus the cylmder heat
39
flux becomes negative during tiiat period The cylhider pressure mcreases after tiie inlet
valve closes However the cylinder heat flux remains negative at the begmning then
rises slightly during compression Combustion starts and tiie heat flux mcreases rapidly
reachmg a maxhnum and tiien decreases to a small value by 40-60deg after top-dead-
center
Hribemik and Moskwa (2000) discussed the effects of coolhig tiie charge ah
usmg a heat exchanger between the turbocharger and tiie enghie mtake This additional
equipment offset the temperature rise of charge air due to pressure boostmg Air-to-air
intercoolers typically have high thermal inertia therefore theh fransient characteristics
are normally overlooked Because of this the NTU-effectiveness method which is most
appropriate for steady state analysis is often used in the simulation of fransient engine
operation However during fransient operation the intercooler is subjected to a wide
range of unsteady operating conditions Air mass flow rate boost pressure and
temperature vary during fransient operation as fimctions of enghie speed turbocharger
speed and mass flow rate of cooling ah The cooling ah mass flow is a fimction of
engine fan speed vehicle speed and obstructions around the intercooler Recogihzing
that the NTU-effectiveness method is not accurate under transient conditions Hribemik
and Moskwa proposed a two-dimensional model of a cross-flow heat exchanger to study
the intercoolerengine mteraction After the model had been verified against
experimental results it was incorporated into a zero-dimensional simulation model of a
turbocharged Diesel engine Hribemik and Moskwa found that steady state conditions
were reached after approxhnately 12 seconds while the rated power was reached after
approximately 7 seconds Under most situations this seems like a short period however
m heavy urban fraffic this could affect enghie performance
The development of an analytical method for predictmg enghie heat rejection to
coolant requhes experimental measurement of enghie heat rejection This experimental
data is necessary not only to assess the accuracy of the analgtiical predictions but also for
derivmg emphical constants used in the analytical method
40
Oler Parish Williams and Bums (2002) provide an excellent discussion of the
difficulties associated with engine heat rejection measurements As they describe heat
rejection testing is typically performed with the engine mstalled in a dynamometer cell
as it is difficult to properly mstrument an enghie installed hi a vehicle The enghie is
usually equipped with a simple coolhig system where 100 of the engine coolant
chculates through one half of a Uquid-to-liquid heat exchanger Cold water chculated
through the other half of the heat exchanger removes heat from the hot enghie coolant
and thereby simulates the function of a vehicles radiator A smaller separate heat
exchanger cools the engine oil at high engine speeds A higlily simplified diagram of a
typical heat rejection test setup is shown in Figure 220
Flowmeter
-- ^
= 4
~ ^ Resistance Temperature
Devices
Engine on Dynamometer
j Peslslance f Rowmeter 1 1 Temperaturt r V Devices
1 Cooling
Water Out
Cooling Water n
Figure 220 Highly Shnplified Diagram of a Typical Heat Rejection Test Setup
Under test conditions tiie enghie is operated at a constant speed and tiirottle
setting producmg a fixed brake power The engme operates at tins condition until tiie
temperattire of the coolant exitmg tiie enghie stabilizes at a constant level hidicatmg tiie
enghie has attamed steady-state operation Under steady-state conditions the two heat
41
exchangers mamtain constant coolarh mlet and engine oil temperatiires by exfractmg heat
from the coolant and engine oil at a constant rate
For an engme operatmg under steady-state conditions heat rejection to coolant
can be calculated from tiie difference between tiie inlet and outlet temperatures of the
coolant coolant mass flow rate and coolant specific heat
Qcoolant = nicCpATc (2 31)
A matched set of resistance temperature devices (RTDs) is used to measure the
difference m coolant mlet and outiet temperatures The mass flow rate of the coolant is
determined using a flow meter installed m the engine coolhig chcuit These
measurements used in conjunction with Equation 231 allow calculation of tiie enghie
heat rejection to coolant If the engine oil cooler is in operation the heat rejected to the
oil cooler is calculated in a shnilar manner and included m the total engine heat rejection
to coolant
Oler et al note that there is a certam amount of error associated with any
experimental data and heat rejection to coolant is no exception Engine heat rejection to
coolant is in fact quite difficult to measure accurately and with repeatability The two
primary sources of error in measuring heat rejection to coolant are errors in flow rate
measurement and errors in temperature measurement
Typically the type of flow meter used in a given experiment drives the accuracy
of coolant mass flow rate measurement Measuring engine heat rejection with the engine
installed on a dynamometer stand allows the use of an orifice-type flow meter which
measures the mass flow rate of a liquid based upon the pressure drop the moving liquid
experiences as it passes through an orifice When properly calibrated this type of device
produces measurements that are accurate to within less than three percent Given the
turbulent nature of the flow through an engine coolhig system and the frequent presence
of vapor bubbles in the coolant this is a very accurate measurement These devices
however are too large to fit under the hood of a typical vehicle plus they requhe that the
42
coolmg circuit have relatively few bends to keep flow turbulence to a mmimum These
limitations restrict the use of this type of flow meter to the dynamometer stand
Measurement of heat rejection m the vehicle environment requhes tiie use of a smaller
turbme-style flow meter These flow meters are typically less accurate than the orifice-
type flow meter In addition the cooling system as installed in a vehicle typically
features many bends in the circuh creating turbulence in the coolant flow that decreases
the accuracy of the flow measurement
An additional cause for inaccuracy in the measurement of engine heat rejection is
the relatively small temperature change that takes place across the heat exchanger Under
steady state operation the engine coolant typically undergoes a temperature change of
approximately 10deg C as it passes through the heat exchanger which is relatively small
As a result the errors inherent in the inlet and exit temperature measurements while
small in the absolute sense can appear relatively large as a percentage of the total
measurement Thus a 1deg C error in the measurement of the coolant temperature change
across the heat exchanger can result in a 10 error in the calculated heat rejection to
coolant
Because of these factors even xmder the best circumstances any measurement of
engine heat rejection can be in error by approximately 5 due to measurement error
alone Unfortunately given the large amount of thne requhed for an enghie to reach
steady state operation at any given operating condition it is impractical to take a laige
number of data samples and determine a mean which could eliminate at least some of the
common cause variability
For a given mass of ah and fiiel inside an engine cylhider optimum spark tinting
exists that produces maxhnum enghie torque This timing is called maxhnum brake
torque (MBT) spark timing For a given enghie operating condition firing the spaik plug
earlier or later than MBT thnmg produces less than the maxhnum amount of output
torque
In typical automotive applications engmes usually employ spark timmg that is
retarded relative to MBT (ie tiie spark plug is fked later m the cycle tiian the optimum
43
timmg) This is because tiie use of retarded spark thnmg reduces the occurrence of
enghie knock altiiough retarded spark also causes tiie enghie to produce less tiian tiie
maxhnum amount of brake torque for a given operating condition The amount of spark
retard relative to MBT thnmg varies from one enghie operating condition to the next In
addition tiie amount of spark retard requhed for a given enghie operathig condition may
be completely different for two different enghie configurations Thus when examinmg a
large sample of enghie data such as the one used in the current study the data will
contain a fremendous amount of variation hi spark thning relative to MBT It is
hnportant therefore to understand the hnpact that this variability may have upon the
results of the study
Operating an engine with retarded spark timing relative to MBT causes the enghie
to operate less efficiently The peak pressure attained mside the cylinder is low er tiian
realized with MBT timing thus leadmg to a lower power output from the engme In turn
a lower power output means the enghie is exfracting less energy from the hot combustion
gases The net effect of this is that retarded spark timing produces higher exhaust gas
temperatures than MBT timing for a given engine operating condition This is an
intuitive result Simply stated if the engine operates at a less efficient condition it
should waste a greater amount of energy In this case potentially usefiil energy is lost in
the form of hotter exhaust gases
As the hot exhaust gas flows through the engine exhaust ports at high velocity h
transfers a significant amount of heat to the coolant in the enghie cylinder head A higher
exhaust gas temperature therefore increases the amoimt of heat rejection to the coolant
Retarding the spark timing from MBT thus increases the amovmt of engine heat rejection
to the coolant Again this is an intuitive result given that heat rejected to the coolant is
another form of wasted energy
It is important to note that the precedmg analysis assumes tiiat constant output
torque was maintained from the engine as the spark timing was retarded This seems
confusing at first given that the output torque should decrease as the spark timing is
retarded Indeed if the spark timing was simply retarded at a given operating condition
44
and tiie amount of throttle openmg was unchanged the preceding analysis may be
invalid Keep m mind however that engmes are designed for use in motor vehicles~not
on dynamometer stands-and that tiie operator of a motor vehicle primarily is concerned
with mamtahung constant torque output not a constant throttle openmg Motor vehicles
requfre a fixed amount of output power from the engine to maintam a given speed on a
particular grade of road regardless of the engine spark timmg or amount of tiirottle
opening If the engine calibration computer retards the engine spark for a given operating
condition the driver will simply tip-m the accelerator pedal and open the throttle wider to
maintain the same amount of output power and therefore the same speed When
discussing heat rejection to coolant which is a parameter applicable to the design of the
full vehicle instead of just the enghie it is more useful to think m terms of constant
enghie output torque or power instead of constant throttle position
The data used in deriving the analytical method for predicting engine heat
rejection comes from a variety of different engines using a wide variety of engine
calibration sfrategies Some of the dynamometer data in fact contains heat rejection
measurements for four to five different settings of spark timing at a constant amount of
output torque Given that no data exists on the value of MBT spark timing for the various
operathig conditions tested h is impossible to analytically correct this data back to
MBT timing or even to determine the amount of spark retard relative to MBT for a given
operating condition This wide variation of spark timings therefore mfroduces a certain
amoimt of error mto the results of the analytical method as the analytical method cannot
account for tiie effect of retarded spark thning upon heat rejection Altiiough h is
hnpossible to accurately quantify the effects of this error h is known that for a constant
amoimt of output torque significant changes m spark thnmg can produce changes in heat
rejection to coolant on the order of 5
One significant aspect of automobile emissions is the formation of oxides of
nifrogen (NOx) which can act as a source of urban ah pollution NOx formation is a
complex process that occurs m high temperature regions during m-cylmder combustion
events primarily m tiie areas immediately behind the flame front NOx formation can be
45
reduced by diluting the air-fiiel mixture in the cylinder with recycled exhaust gas which
among other things has the net effect of reducing the peak temperature of the combustion
products Dilution of the ah-fuel mixture often is accomplished using exhaust gas
recfrculation (EGR)
A vehicles EGR system captures a small portion of engine exhaust gas and
reroutes this gas into the engines incoming charge of fresh ah thus diluting the ah-fiiel
mixture and lowering the peak combustion temperature Since excessive dilution of the
air-fuel mixture causes unstable combustion or engine misfhes the amount of exhaust
gas recycled must vary witii engine operating condition to ensure stable combustion
Typically no exhaust gas is recycled at high relative power operation shice such dilution
reduces the engines peak power output At partial throttle setthigs the amount of
recycled exhaust gas may exceed 10 of the amount of mcommg fresh ah The amount
of EGR that an enghie can tolerate at any given operathig condition is highly dependent
upon unique characteristics of that particular enghie tiius as witii spark thnmg there is
no generic rule as to tiie proper amount of EGR for a given part-tiirottle engme operating
condition
EGR rate therefore mfroduces another potential source of error mto the
comparison of heat rejection predicted analytically to tiiat measured on tiie dynamometer
Recall tiiat the experhnental data used m tius sttidy was origmally mtended for use m
designing vehicle-coolmg systems not derivmg an analytical metiiod The data used
tiierefore reflects a wide variety of enghie calibration sfrategies Some but not all of tiie
experimental heat rejection data used m tiiis sttidy was measured witii tiie engmes EGR
system m operation Experimental determmation of tiie amount of EGR used at any
given enghie operatmg condition is exfraordmarily difficult requhmg a detailed analysis
of tiie composition of tiie enghie exhaust gas For the vast majority of tiie engmes tested
therefore EGR rate shnply was not measured
The fact tiiat at least some of tiie engmes used to generate tiie experimental heat
rejection data were equipped witii fimctionmg EGR systems ensures tiiat tiie
experimental data covers a broad range of combustion gas temperatiires Since no data is
46
available as to how much EGR was used at mdividual operatmg conditions h is
hnpossible to mcorporate a correction for EGR effect upon combustion gas temperattire
into tiie analytical metiiod This difference in assumed and acttial combustion gas
temperatiires tiierefore account for some of the difference between tiie predicted and
measured enghie heat rejection (Oler 2002)
25 Computer Simulation
Computer simulation is the next area where significant research is being
conducted There is obviously a need to accurately model automobile performance
before an actual automobile is produced The shear expense of prototypmg activities
such as wind tunnel validation is enormous Additionally design cycle thnes may be
significantly diminished through the application of computer-aided shnulation design
and manufacturing
Gerhard (2002) developed an engine simulation from experimental investigations
conducted on a high speed Diesel engine Evaluating heat balances and measuring steady
state temperature fields separately determined heat fluxes to the different engine
components A comparison with the results of cycle simulations carried out with
correlations for the local mean heat fransfer coefficient demonsfrated that the heat lost to
the cylinder walls and the resulting influence on the process variables could be accurately
modeled The steady state temperature fields occurring in the components during
operation could also be accurately predicted Gerhard noted that the design of
supercharged Diesel engines could become a problem of optimization A compromise
must be found between power density fuel consumption and consfruction effort The
numbers of design parameters that can be varied is too large to investigate
experimentally The expense and complexity make h hnpossible to find the opthnum
solution by experiments alone Computer simulations allow designers to solve problems
theoretically with many variables These calculations cannot substitute for experiments
but they could reduce the number of experimental tests necessary The time cost and
risks for the development of a new engine are decreased
47
Watts and Heywood (1980) give an excellent overview of computer shnulation
techniques tiiat are still used today Computer shnulations of tiie complete cycle for a
four-sfroke spark-ignition engine can be used to examine tiie effect of changes m
operating and design variables on engme performance efficiency and emissions These
types of shnulations are tiiermodynamic or zero-dimensional in stiiicture Theh
formulation is based on tiie ffrst law of tiiermodynamics witiiout hicludmg the details of
the combustion chamber and the shape of the flame front The mputs to the calculation
are typically basic enghie geometry engine speed intake mixture fiiel-ah equivalence
ratio exhaust gas recycle fraction intake manifold pressure combustion chamber wall
temperatures and parameters which define the mixture burning rate One-dhnensional
quasi-steady flow equations are used to obtam the mass flow through the valves during
the mtake and exhaust sfroke The first law of thermodynamics is used to determine the
condition in the engine cylinder during each portion of the four-sfroke cycle Empirical
correlations are used for heat fransfer between the gas in the cylinder and the walls The
cycle simulation then predicts the mass flow rate of fuel and ah through the engine
cylinder pressure unbumed and burned mixture temperatures heat fransfer to the
combustion chamber walls and work fransfer to the piston All of these outputs are
determined as fimctions of crank angle during the cycle The indicated power specific
fuel consumption efficiency mean effective pressure and mean exhaust temperature are
then computed for the particular engine operating pomt Enghie friction is then esthnated
to obtain brake values of these quantities The calculated cylinder pressure burned gas
temperature profiles equivalence ratio and fiiel composition can be used to compute the
rate of formation and decomposition of NOx This approach permeates the literature
Additionally Watts and Heywood (1980) evaluated the wide-open-throttle
predictions of a previously developed cycle simulation against experimental data from
both a naturally asphated and a turbocharged production enghie The shnulation was
then used to compare the fuel consumption NOx emissions and performance
characteristics of these two engines over the complete load and speed range This
example illusfrated the usefulness of a cycle simulation of this type evaluating two
48
different engme concepts to provide the same performance characteristics Various
aspects of tiie effect of heat fransfer on engine performance efficiency and NOx
emissions were compared These aspects compared tiie effect of variations and
uncertamty m heat fransfer predictions witii cold combustion chamber walls The hnpact
of ceramic materials on selected engine components over a range of combustion chamber
wall temperatures at engine compression ratios of 8 and 161 was also evaluated The
results of the ceramic component simulations were discussed in the previous adiabatic
engine section
A smaller turbocharged engine was determmed to be more efficient than the
larger engine at the same power level at speeds and loads typical of normal vehicle use
This increase in efficiency is attributed to improved mechanical efficiency At the
maximum brake torque speed the two engines provided similar brake power However
the smaller turbocharged engine exhibited higher brake specific NOx emissions than the
larger enghie at a given power output due to the higher relative load Consequentiy the
smaller engine ran at higher cylinder pressures and temperatures to produce equal power
Additionally studies were performed for the large naturally asphated engine to
examine the effect of reduced heat fransfer on engine performance efficiency and NOx
emissions Decreasing load and speed increased the heat fransfers impact Retarded
timing reduced heat fransfer due to reduced peak burned gas temperatures Heat fransfer
peaked at the stoichiometric equivalence ratio and decreased for rich mixtures Watts
and Heywood (1980) found that heat fransfer uncertainty did not significantly affect
simulation predictions of performance and efficiency Brake specific NOx mcreased as
heat fransfer was reduced due to the higher burned gas temperatures Watt and Heywood
used a standard heat fransfer model that was found throughout the literature with the
exception of including a burned and imbumed portion to the gas temperatures
Moeckel (1994) used a commercially available computational fluid dynamics
code Flofran to identify modifications that hnproved coolant distiibution throughout tiie
engine A shnplified 2-D approach was taken and experimentally verified The accurate
49
prediction of tiiree-dimensional heat fransfer fihn coefficients requhes exfr-emely large
models tiiat were not available at tiie thne of publication
DAdda Lisbona Occella and Maiorana (1994) outlmed tiie use of the
considerable development of recent analytical methodologies for engine design The
application of tiiese metiiodologies to the design of tiie coolhig system of a high
specific power enghie was performed For tiie opthnization of tiie coolant flow inside tiie
block and head passages two different codes have been employed The complete
analysis of tiie coolant circuh was performed usmg a one-dhnensional code developed at
the Fiat Research Center The results were mput as boundary conditions for a detailed
three-dimensional shnulation of the coolant passages mside the engine with the
commercial code STAR-CD The study focused on an mitial enghie design with possible
design modifications deduced analytically verified and tiien applied to tiie final enghie
solution This new approach for the optimization of the cooling system was considered a
useful tool for enghie design DAdda et al considered opthnization of tiie coolant
system in hitemal combustion engines a critical task m the design process Tlie tiiermal
condition influenced the stmctural integrity of the engine as well as performance and
emissions The design of high specific power engines has to ensure sufficient cooling
velocities to prevent metal temperature reaching excessive levels It has been
demonsfrated that the thermal condition of the engine is not very sensitive to the total
coolant flow rate but it is sensitive to local geometrical characteristics of the passages
and coolant velocities
The current need for time reduction in the design process does not allow an
experimentally based trial and error approach The development of analytical
methodology helped engine designers in the definition of the cooling system primarily for
the coolant passages inside the enghie
The approach outlmed by DAdda et al (1994) has a common theme throughout
engineering first use a macro approach to find a sound design and then follow up with a
more detailed simulation andor experimentation Results usmg this approach appUed to
engine cooling passages were promising in reducing design cycle thne
50
Woodward (1995) offered another tiiermodynamic approach and improvement to
the fraditional limited pressure ah-cycle that has an unrealistic constant-volume coolhig
model between the cylhider exhaust and cylinder mtake By substituting isenfropic
expansion throttlmg and constant-pressure cooling m the place of constant volume
cooling a better ideal cycle for the actual processes is formulated This model is better
equipped to handle the prediction of 30 losses to the engine coolant This essential heat
rejection is predicted from the new model and a second law analysis
Bulaty Codan and Skopil (1996) reiterated the common theme of shrinking
design cycle times Powerful personal computers and technically mature simulation
software were driving this new surge for decreased cycle times Hence the calculation of
engine performance had not only become reliable but also far more economical than
experimentation The sharp rise in the power density of the modem engine was primarily
due to the parallel development of reliable turbochargers Engine builders have provided
increased demand for turbocharged equipment Thus these engine systems have become
considerably more complex and flexible
Additionally to add code to existing simulation software for the future
turbocharging demand would have been a costly modification Clearly an augmented
system that allowed for insertion into existhig codes was a necessity The requhed
turbocharging computer simulation program would need to be user-fiiendly refiable and
accurate Bulaty Codan and Skopil (1996) believed tiiat they developed a necessar
useful computer shnulation of turbocharghig systems However the details of the
simulator are not presented
Mohan Ariel Yang and Johnson (1997) outiined a similar code which was an
enhancement of the Vehicle Engine Coolhig System Shnulation (VECSS) developed at
Michigan Technological University and modified to mclude a turbocharged Diesel enghie
with a charge ah cooler model The radiator and charge ah cooler model showed good
agreement witii experhnental data These models consisted of heat balances and a
Colbum or NusseU type analysis to find tiie heat transfer coefficients~a typical approach
The code showed that accuracy for the thermal performance was within 15 at the
51
middle to high loads and 5 at low loads The VECSS code uses a standard convective
Nusseh correlation Additionally Mohan et al (1997) pointed out that engmes have a
significant amount of radiation heat fransfer due to the high temperatures of gases as well
as carbonaceous particles formed during combustion Standard forms of radiation heat
fransfer equations were used witii experimentally deteimined coefficients Turbocharger
performance maps were used in the simulation
Intercoolers or charge air coolers are heat exchangers located between a
turbocharger compressor and the enghie These devices cool the ah that leaves tiie
compressor thereby mcreasmg the charge density and performance of the engine There
were few models m the literature that used fiill gas dynamic or wave-action
shnulation Furthermore these models tended to approximate the behavior of tiie
intercooler by assuming constant performance under all operating conditions A full-
wave action intercooler model was developed that predicts intercooler performance at
different engine operating conditions Intercoolers pass hot ah to be cooled through a
heat exchanger exposed to a coolant Like all heat exchangers the design goal was to
expose the hot gases to the maxhnum allowable cooling surface area while minimizing
the pressure drop One approach to quantify the performance of an intercooler is its
effectiveness Heat exchanger effectiveness is defined as the ratio of the actual heat
fransfer to the theoretical maximum heat fransfer This approach is a standard analysis
that can be found in any undergraduate heat fransfer text Intercooler performance varies
sfrongly with the mass flow rates through the heat exchanger As the mass flow rate of
the charge ah mcreases the effectiveness drops for a given coolant flow rate Thus the
performance of the intercooler varies over the load and speed range of the enghie
Another hnportant characteristic of the intercooler is the pressure drop This pressure
drop impahs engine performance Therefore it must be accounted Computational fluid
dynamics (CFD) is beginning to become prevalent m intercooler design CFD does and
will contmue to accurately characterize heat fransfer versus the requhed pressure to
overcome flow restriction (Bromnick Pearson amp Wmterbone 1998)
52
Worden and Zehr (1999) discussed the critical nature of coolant flow velocities to
the durability of the engine itself The geometries of the mdividual component parts used
m the system should be designed to minimize turbulence tiiat affects the type and rate of
corrosion Additionally flow passages must be sized to maintain mhuinum coolant
velocities In high velocity flow a combination of the mechanical damage produced by
the imphigement on a metal surface and the inherent corrodibility of the metal may result
Aluminum alloys are more prone than other alloy metals to corrosion damage because of
the low inherent haidness of the material Coolant velocities for the flow were predicated
in the individual cooling system components based on CFD analysis Erosion-corrosion
damage is shown to be a function of the type of coolant and the angle of attack of the
fluid sti-eam with the casting wall surface
26 Adiabatic Engine Research
An adiabatic engine is a term used to describe any engine where the heat
rejected to the coolant is reduced by some means Techniques mclude coating tiie
cylinder walls and using emulsified fuel (water added) or oil (mstead of water) as the
coolant
Kamo (1977) made a clahn of greatly hnproved thermal efficiency due to
turbocharghig an engine with thermal msulation
Wallace Way and VoUmert (1979) hivestigated tiie constant temperatiu-e Ihnitmg
case An existhig and well-proven Diesel cycle simulation program was apphed to the
Perkins 6354 6-cylhider 4-cycle Diesel enghie A relatively thm layer of 2 mm bonded
silicon nitride to the cylinder walls was used to reduce heat loss to coolant by
approxhnately 50 Such materials were associated witii isotiiermal operation of the
enghie The wall temperattire had mmhnal cyclic fluctiiations approachhig a temperattu-e
of 300degC Wallace et al found tiiat isotiiermal operation of the enghie resulted m little
hnprovement of tiie mdicated tiiermal efficiency The reduced heat loss to coolant was
fransferred primarily to the exhaust enthalpy This conclusion was based on cycle
calculations witii unlhnited maxhnum cylmder pressure and fixed heat release thnmg and
53
duration The benefit of increased exhaust entiialpy could be realized fiilly only when a
turbocharger was added to tiie enghie Substantial improvements m Diesel engmes
indicated thermal efficiency could be achieved only if adiabatic enghie operation was
approxhnated witii gams of tiie order of 14 for fully adiabatic operation or 7 for
semi-adiabatic operation Materials and methods of constiiiction showed that the
requhements for tme adiabatic operation presented great practical difficulties (Wallace et
al 1979)
Way and Wallace (1979) extended theh purely theoretical investigation with the
addition of a turbocharger Turbocharging was frequently suggested as a way of
improving the thermal efficiency of engines However m the past the gains had not
proved sufficient to justify the additional expense Way and Wallace hypothesized as
discussed in thefr previous paper that when an insulated engine was used to reduce heat
losses to a minimum the increase in exhaust temperature should make the compounded
engine more atfractive The investigation showed the effect of reduced heat loss on the
interaction between an engine and the turbocharger Turbocharging hicreased the
efficiency by a significant margm while the effect of heat suppression on engine
efficiency alone was relatively small The turbocharger performance did increase due to
the increased exhaust temperature This combination was necessary before the viability
for any partially insulated engine scheme to be successful
Way and Wallace (1979) found that the use of turbo compounding enabled the
thermal efficiency and correspondmg torque to be raised by 2-3 percentage pomts Turbo
compounding is accomplished through multiple turbocharger and hitercoolers designed
for the flows and temperatures that they would see Turbo compoundmg significantly
improved the matchmg of the turbocharger thus enablmg a smaller turbhie to be fitted
This configuration hnproved the ah-fuel ratio hence hnprovmg efficiency and smoke at
low engine speeds hnprovements that are more significant would be achieved at low
engine speeds by hnplementmg a variable turbhie geometiy device Reduction of heat
loss with conventional msulatmg techniques without turbocharghig yields Ihnited
hnprovements in efficiency Way and Wallace clahned that tine adiabatic operation
54
would resuh m much more drastic improvements m efficiency of up to 10 percentage
pomts Altemative forms of compoundmg such as the use of variable geomefry ttirbmes
and splh power arrangements could become more cost atfractive as fuel prices increase
Watts and Heywood (1980) found tiiat using ceramic-coated engme components
witiiout tiiermally isolating tiie ceramic material from its metal support and coolant
system produced modest reductions in heat fransfer However use of isolated ceramic
materials and high wall temperatures substantially reduced heat fransfer This reduced
heat fransfer and decreased the volumetiic efficiency and power Brake specific fuel
consumption remained constant Exhaust temperature and brake specific NOx hicreased
substantially From a computer shnulation the use of ceramic material for the piston
crown and cylhider head proved to be tiie most effective means for reducmg heat fransfer
Watson Kyrtatos and Holmes (1983) described tiiat from a first law of
thermodynamics analysis the limited heat rejection engine had merit and potential
To veil (1983) discussed the benefits of applying thermal insulation to the exhaust
ports and combustion chamber The reduction of heat loss to the coolant system has
always been of considerable interest as this would allow a reduction in the cost size
weight and power requhements Traditionally the exhaust port lengths are minimized
and the engine internal coolant chcuit is configured to provide high coolant velocities in
critical areas while using flood cooling elsewhere Higher fuel efficiencies and shrinking
volumes to accommodate cooling systems of sufficient size in high-powered vehicles
have made the reduction of heat loss to the engine coolant mcreashigly hnportant Tovell
also used a computer shnulation of a highly rated turbocharged DI tmck engine to
determine the effectiveness of reduced heat fransfer engmes Comparisons were made
between a standard enghie and engines with the exhaust port cylhider head piston and
cylinder liner insulated Also examined was the necessity of modifying engine
conditions when heat losses through the combustion chamber walls are retarded Tovell
also sfressed the difficulties in practically and economically insulating actual enghie
components However the successfiil testmg of a ceramic liner located in the exhaust
55
duct of an enghie during more than 1000 hours of engine operation was deemed
significant
Tovells (1983) shnulation found favorable results to insulating the engine
components By eliminating heat loss to the coolant system fuel consumption was
reduced by approximately 75 The effects of this msulation were high exhaust
temperatures and cylinder pressures The largest reduction in fiiel consumption and the
associated heat loss to coolant was obtained by insulating the piston crown or cylinder
head Tovell stated that reducing heat losses by partially hisulathig the piston crown top
of the bore and exhaust port should be feasible in existing engine designs The
simulation predicted a reduction of full power fuel consumption by about 46
Additionally higher exhaust temperatures must be tolerated with exhaust manifolds and
turbochargers capable of operating at higher temperatures An increase in power unit
efficiency to 50 can be obtained if exhaust energy can be recovered The IMEP of the
reciprocating engine should be monitored to avoid excessive maximum cylhider
pressures The pollution impact was also discussed An increase in NOx emissions was
expected but hydrocarbons particulates and smoke should be reduced The shnulation
also predicted that engine noise would be slightly reduced Fan noise could also be
reduced by 2 to 4 dB (Tovell 1983) This noise reduction is significant as 3 dB
represents a noise reduction of a half
Kadoli and Aknamurthy (1984) found that a substantial reduction m tiie heat loss
to the coolant resulted m an mcrease m cylhider work and exhaust gas energy They
studied the performance of a semi-adiabatic enghie through compound coolhig which
was defined as a cooling method using external oil cooling and an intemal methanol
water-fuel mixture The purpose of the oil coolhig is to partially insulate the cylhider
head and walls as the thermal conductivity and specific heat of tiie oil are lower tiian
water thereby mcreasing the enghie load To reduce thermal loading watermetiianol
was mjected at the mtake manifold Oil cooling and metiianol mjection lowered tiie
BSEC with energy savings of 4-6 In addition NOx emissions were lowered
56
fridividually botii oil coolhig alone and oil coolmg witii water mjection versions
provided lower values of BSEC witii energy savmgs of 3-5
Hashem (1989) presented that tiie waste energy potential by exhaust gases was
178 to 303 of tiie energy mput at a temperattire range of 170degC to 670degC Tlie
tiiermal content of cooling water represents 92 to 132 of tiie engine energy mput
The energy lost to tiie surroundmg by convection in tiie still ah state represents 32 to
57 of the energy mput (Hashem 1989)
Woods Bryzik and Swartz (1992) discussed that removmg tiie water-cooling
system usmg sfrategic oil cooling and upgradmg critical engine component materials
reduced the heat rejection to the radiator of a conventional water-cooled engine This
approach has been identified as the low heat rejection enghie (LHRE) Many of these
LHREs do not apply in-cylinder msulation Dovrasizing of the coolhig system in a non-
insulated LHRE resulted m a sigiuficant increase in structural temperatures Reduced
component life increased heat loading and hicreased ahflow resistance occurred
Volumetric efficiency losses lead to increased intake manifold pressures which increase
after cooling heat rejection offsettmg in-cylinder heat rejection reductions An advanced
LHRE employs the use of in-cylmder insulation This additional step reduces the heat
rejection and stmctural temperatures Intake ah after coolhig is reduced which is a
significant portion of the overall heat rejection
Adiabatic engine intake boost pressure was predominantly confroUed by the need
to maintam air density and not volumetric efficiency factors Boost pressure was
primarily dependent on the airflow requhements and resulting ah temperature factors
By reducing the ah-fuel ratio requhements a sigiuficant reduction of the intake ah
temperature and boost pressure would occur thereby further reducing heat rejection
Woods et al (1992) reiterated that the future adiabatic engine should use reduced ah-fiiel
ratios be non after-cooled and use turbo compomiding to utilize the high level of
available exhaust energy Comprehensive combustion optimization was not completed
A single cylinder non-aftercooled fully insulated engine produced a 52 reduction in
radiator heat rejection but no change in net fuel consumption Combustion optimization
57
is hypotiiesized to significantiy enhance tiie system fiiel consumption of the fiiUy non-
aftercooled msulated enghie and to fiirtiier reduce heat rejection
Witii tiie exception of Kadoli and Aknamurtiiy (1992) as discussed above there
was not a successfiil demonsfration of a real low heat rejection system The most
sophisticated approach to date comes from Rakopoulos Andritsalds and Kyritsis (1992)
who employed the second law of tiiermodynamics to analyze the LHRE It is a
significant tool for understandmg tiie utilization of tiie fiiels ability to produce reversible
work m the hitemal combustion enghie The hreversibilit) from combustion is defined
by tiie subfraction of the system availability hicrease from the availability fransferred mto
the combustion system This energy is fransferred by work heat and fuel flow mput
Rakopoulos et al proved that this subfraction leads to an expression connectmg the rate
of hreversibility production This expression is applied m this work for the fuel
preparation reaction and work and heat fransfer rate The hreversibility balance also
provides important information for the combustion analysis that caimot be evaluated with
a first law analysis
From the analysis it was evident that the sum of useful mechanical work per
cycle plus the exhaust gas availability hicreases as the heat rejection decreases Thus the
second law analysis showed that the limited heat rejection seems to have an advantage
especially when combined with recovery devices This result is in fiill agreement with
the results of Watson et al (1983) that approached the problem with a first law analysis
Rakopoulos et al (1992) also discussed how the irreversibility must increase as the
engine speed increases
Yoshimoto Tsukahara and Kuramoto (1996) discussed using water-emulsified
fuel and oil cooling (replacing waterantifreeze mixtures) in engines This technique
reduced NOx and smoke emissions Additionally these techniques lowered combustion
temperature promoted mixing of sprayed fuel with ah and enhanced water gas
reactionthat resulted in improvements in the overall combustion process Yoshimoto et
al discussed that there was little agreement that the hnproved fiiel consumption with
emulsified fuel operation was more likely the sfrong influence of operathig conditions
58
enghie variables mjection characteristics and emulsion properties These researchers
showed that cyclmg loss had a sfrong influence on fuel consumption or thermal
efficiency The coolhig loss during the combustion process was determined from the gas
pressure in tiie cylhider The heat fransferred out of tiie system to tiie cooling water
through tiie enthe cycle was measured by varymg the outiet temperature of the coolmg
water The hidicated thermal efficiency was found to correspond dhectiy to changes m
the coolhig loss Lower cooling losses than with water-free gasoline and oil coolhig were
observed with the emulsified fuel due to the evaporating water and the combustion
promotion Therefore it was established that the reduced cooling loss hnproved the
indicated thermal efficiency The cycle-to-cycle variation of maximum combustion
pressure was the same as with water-free gasoline and oil cooling regardless of load and
injection timing conditions when a fuel emulsion with water was used The NOx
concenfration was reduced by about 40 Additionally the specific fuel consumption
was hnproved by 5 to 9 at rated output It was confirmed that the emulsified fuel
improved the degree of constant volume of combustion and reduced the cooling loss
during combustion Cooling loss and indicated thermal efficiency were shown to closely
correlate (Yoshimoto 1996)
Taymaz Gur and Halici (1998) discussed the effect of msulated heat fransfer
surfaces on dhect injected and turbocharged engine fuel consumption and cooling
systems The results indicated a reduction in fuel consumption and heat losses to the
engine cooling system of the ceramic-coated engine The efficiency of the theoretical
engine cycle depends dhectiy upon the temperature difference between the hot and cold
portions of the engine cycle Therefore there is an advantage in hicreased combustion
chamber temperatures If combustion gas energy can be contained through the expansion
cycle then the efficiency of hitemal combustion engmes can also be hicreased While
several researchers have reported improvements in thermal efficiency with a LHR engine
others have noted that ft declmed With compound techniques up to 65 suppression of
normal heat loss to the coolant is possible with ah-gap wall systems or with very high-
grade ceramics Partially stabilized zirconium is a commonly used ceramic The effect
59
of msulated heat fransfer surfaces on dhect injected and turbocharged engine fuel
consumption and cooling system was again analyzed A standard engine and ceramic-
coated engine were examined at different engine speeds loads and mjection timmgs
The results showed a reduction in fuel consumption and heat loss in the ceramic-coated
engine Application of ceramic coating provided a 5-25 decrease in heat flow rate to
the coolant
From the timeline shown above there have been significant steps achieved in
placing a ceramic coating on the inside surfaces of Diesel engines While the process has
come a long way in the past several years it has not yet shown to be an economical
proposition Additioneilly NASA has provided several research grants over the years to
hnprove the ceramic coating processes The improvement of a LHRE to date has most
likely been disappointing From a general concept the LHRE with turbocharging is a
logical improvement but the performance gains have not been realized (Taymazet al
1998)
60
27 Other Topics Relating to Diesel Engines and Heat Rejection
The last two articles presented in tiie literattire search reveal an mterestmg frend
m engine coolhig research Engme designers are mvestigatmg differing schemes of
enghie coolhig to gam relatively small hnprovements m performance The suspected
reason would be tiie governmental regulation that is continually tightenmg
Ap and Gohn (1997) hivestigated an approach to enghie coolmg The mtent of
this study was reduced cost of all engme-coolmg components reduced gasoline
consumption reduced weight of the enghie cooling system and hnproved thermal
comfort m the passenger compartment This basic concept consisted of addmg a small
electric water pump instead of the larger conventional engine-driven water pump This
system ensured enghie cooling at speeds up to 120 kmh under convective coolhig m
normal conditions This condition fulfills 95 of the flow requhements of a vehicle at
the same performance level as a conventional cooling system The remaming 5 of the
reqmrements-at vehicle speeds greater tiian 120 kmh and hill climbmg-have been
resolved by the use of nucleate boiling in the cylmder head The nucleate boilmg
phenomenon has been discussed previously in the proposal and is consistent with this
literature Enghie power and vehicle weight were frending upward while at the same
time the engine cooling specification remained unchanged (ie the validation tests of hill
climbing 12 or 13 grade with and without frailer and the maximum speed at high
outside ambient temperature) The physical parameters of the engine cooling system
such as coolant temperature and flow rate had been increasing Water pump power
ranged from 1 to 2 kW depending on the engine size Liquid chcuit pressure has been
mcreasing from 18 to 25 bars caushig the cost to increase particularly the hoses
Reasonable enghie coolhig and thermal comfort performance were confirmed
except for an over temperature of 10degC to 20degC on the cylinder head at full enghie load
This problem was proposed solved by simple geometric modifications of intemal
coolant passages of the cylinder head Heater performance for the passenger
compartment was improved during the idle and fransient otherwise
61
Kem and Ambros (1997) proposed a new concept m engine coolmg The coolhig
system was designed based on critical operathig conditions as mentioned above For
tiiermally uncritical partial-load conditions where a vehicle normally operates tiiermal-
management measures offer considerable potential for reducmg the hnpact of tiie motor
vehicle on tiie envfronment Actuators m conjunction with mtelligent confrol systems
could be used to enhance the automobile hnpact on the environment and passengers As
part of its thermal-management sfrategy Behr is developmg new kmds of actuators
system configurations and confrol algorithms that use demand-responsive confrol and
supply of mass and heat flows Operation mode-dependent confrol measures depended
on the priority of the confrol objectives requhed The mtelUgent system could adjust the
configuration to reduce fiiel consumption pollutant emissions the cold-start phase
thermal sfress and mechanical loads to be seen in vehicle components A theoretical
study showed a potential savings of up to 50 of the power demand of fan and coolant
pump Measurements on a tmck showed savings of more than 18 of fuel consumption
(Kem amp Ambros 1997)
62
CHAPTER m
METHODOLOGY
The general metiiodology utilizes tiie resuhs of tiie ideal cycle models for botii tiie
nattirally asphed spark ignition (SI) and ttirbocharged compression ignition (CI) engmes
The background and ideal models of tiie cycles were not provided to obtam quantitative
results but to understand the physics governing the power cycle and to create a concise
physics-based heat rejection analysis from actual engine data
31 General Methodologv to Approximate Engine Heat Rejection
The origms of the heat rejected to the coolant are the heat fransfer between the
combustion gases and the cylinder walls and the power dissipation due to mbbing friction
between moving engine components
Qcoolant = Qcyl + Prf bull (31)
Predictions of the heat fransfer to the cylinder walls are obtained from a Nusselt
number correlation while estimates of the fiictional power dissipation are based on the
engine power and efficiency
To quantify the heat fransfer from the combustion gases it is broken into
contributions from convection and radiation heat fransfer For both SI and CI engines
convection is the dominant heat fransfer mechanism Convection is especially dominant
for the spark ignition engine where it is assumed that the radiation contribution is
negligible The generalized expression for the heat fransfer is
e^ =H^(f -T)+KA^a(T-T)+P (32)
63
In Equation 32 tiie convective heat fransfer coefficient h is calculated from
correlations of the form
Nu = fRe) (3 3)
or
hiref _ k
PV1 g^ref (34)
Development of the correlation is based on experimental data from which the
convective heat fransfer coefficient and characteristic combustion gas velocity are
obtained The radiation heat fransfer coefficient is assumed constant throughout tiie data
reduction process for the CI engine
The presentation of the method for predicting heat rejection to the coolant is
broken mto three components
1 development of the engine power correlation from w hich the fiictional
power dissipation air and fiiel flow rates and the corresponding combustion gas velocity
are calculated
2 development of the heat fransfer correlations for estimatmg the rate of heat
fransfer between the combustion gases and the cylinder walls and
3 application of the engine power and cylhider heat fransfer correlations to
calculate the net heat fransfer to the coolant due to convection to the cylinder walls and
energy dissipation resultmg from friction between moving engine components This
application will be applied in the Results and Discussion chapter of this dissertation
As discussed above the first step in the derivation is to review the ideal model of the
process as previously outlined in Chapter II These guides provide insight to the
underlying relationships and guide the reduction of the actual engine data
64
The indicated power P^ is the enghie power output based on tiie hitegral jPdyen^
for tiie compression and expansion sfrokes in a single cylinder tiie number of cylhiders
and tiie rate of work producmg cycles (half of tiie engine speed for four-cycle engines)
The indicated enghie power output is reflected m two components tiie brake power
output from tiie engine and tiie friction power dissipation
P=Pi+Pf (35)
Following Heywood (1988) tiie fiiction power is defined to include mbbmg friction
between movmg engine components pumping vork during the intake and exhaust
sfrokes and the accessory power requirements
The efficiency of the enghie in converting the energy available through fuel
combustion into indicated power is defined as the fuel conversion efficiency
^QH
The fuel flow rate is expressed in terms of the airflow rate and the ah-to-fuel mixture
ratio
rh=-^ (37) AF
The ah induction rate for a particular engme is determined by the enghie
displacement engine speed and the fixed and variable elements of the ah intake system
Specifically the fixed elements include the ah filter carburetor body intake manifold
and the intake ports and valves The SI engine has an additional prmciple variable
element~the throttle plate The afr induction rate is quantified in terms of the volumetric
efficiency which is the ratio of the ahflow rate to the engine volume displacement rate
65
^ ^ - (38)
Poi^v
The volumetric efficiency is a non-dimensional expression of the mass flow rate through
the engine and is directly dependent on throttle position For normally asphated engines
the volumetric efficiency typically varies between approximately 025 with the throttle
closed and 085 with the throttle wide open For turbocharged engmes the volumetric
efficiency is typically between 08 and 30
Combirung Equations 37 and 38 and substituting into Equation 35 yields
PoQ bdquo n V ^^f = P +P (39)
Rearranging and dividing through by the volume displacement rate results in
_I^^rjynf^^-^^ (310) v^y^ ^ip vy^
or
e^MLfmev (311) bmep = wnj ^^jff- - M^P
where
P jmep = mdash ^ = brake mean effective pressure (3-12) V laquo
p frnep = mdash ^ = fiiction mean effective pressure (3-13)
^D 2
66
Dividmg the brake and friction power by the volume displacement rate has the effect of
normalizing the influences of engine speed and displacement The resulting ratios have
the units of pressure which is tiie basis for the term mean effective pressure The
indicated mean effective pressure is by definition the brake mean effective pressure plus
the friction mean effective pressure
The operation of normally aspired SI engines and turbocharged CI engines is
fundamentally different In SI engines the fuel is mjected with the cylinder charge either
at the throttle body or near the cylinder intake ports Due to emission and ignition knock
limitations the ah-fuel ratio is held approximately constant at the ideal stoichiometric
ratio In CI engines the fuel injection occurs directly into the cylinder at approximately
the end of the compression sfroke With the higher compression ratios and cylinder
charge temperatures of CI engines the fuel immediately combusts Throttling of CI
engines is accomplished by regulathig the mjected fuel fiOw thereby changing the ah-
fuel ratio In contrast to SI engines the air-fuel ratio varies widely with values between
15 and 65
From Chapter II the fundamental expression defined was the indicated mean
effective pressure as a function of the available mean effective pressui-e Equation 230 is
repeated here for clarity
Pre _ bdquo bdquo POQL net _ bdquo bdquo Ha^LH
-V 1
imep = - ^ = 7]ft] ^
By examination of this equation the only variable from the SI enghie operation that is
not constant is the volumetric efficiency Compared to the CI engine operation two
parameters are not constant Those two parameters are tiie volumetric efficiency like the
SI engine and the air-fuel ratio
67
32 Naturallv Aspired Spark Ignition Engine Power Methologv
For the spark ignition engine the fuel conversion efficiency is fimctionally
dependent on the ah-fuel ratio Experimental data presented by Edson and Taylor (1964)
suggests that for slightly rich mixtures the relationship is linear such that
AF
where AF is the ideal stoichiometric value of 146 and riy is the coiTespondmg fuel
conversion efficiency Substitution of Equation 314 into Equation 311 yields the final
expression for bmep
bmep = TjyTj ^p- - finep bull (3-15)
A plot of the brake mean effective pressure versus the available mean effective
pressure for the enthe data sets from tiie eleven normally asphed SI engines is shown in
Figure 31 A legend for this figure indicating the plot symbols used for each enghie is
presented in Table 31
68
Brake Mean Effective Pressure versus Available Mean Effective Pressure
1200
1000-
8 0 0 -
600 bull
400
0 -
y= = 037x - 13569
093
o-
(poundn o
D r
^ 4
o
S
- oA
A
^ ^ 9 ^ASS^Ufml
9Ajj^tgjwSBy^
^
A
500 1000 1500 2000 2500 3000
Amqgt (kPa) rj p QwHMf)
35C0
Figure 31 Brake Mean Effective Pressure versus Available Mean Effective Pressure for SI Engines
69
- 20L CVH Split Port 14 E n ^ e (CT120)
raquo 20L DOHC Zeta 14 Engine
bull 23L Dual Plug 14 Engine Dynomometer Data
bull 25L 4V V6 Engine Dynomometer Data
- 30L 4V V6 Engine Dynomometer Data
- 30L Vulcan V6 Engine (1995-14 Ranger)
40L 95 EI E n ^ e Dynomometer Data
deg 40L SOHC V6 Engine Dynamometer Data
bull 54L4VV8 Engine
laquo 54L 2V V8 Engine Dynamometer Data
o 68L 2V VIO Engine Dynamometer Data
Table 31 Eleven Nattirally Asphed Engines and theh Corresponding Data Symbols
From the figure h is noted tiiat tiie relationship between bmep and Amep is
reasonably consistent and as expected may be approxhnated with a linear least squares
curve fit Based on Equations 316 and 317 tiie slope and mtercept from the curve fit
may be equated to the fiiel conversion efficiency and fiiction mean effective pressure
respectively
7 bull=37 ( - ^
and
finep = ne(yPa) ^ - ^
70
The Amep calculated from tiie experimental enghie data utilized the stoichiometiic ah-
fiiel rather tiian the acttial experimental value Consequentiy tiie fiiel conversion
efficiency obtamed from the curve fit is a stoichiometiic value The acttial values of fiiel
conversion efficiency at the respective experimental ah-ftiel ratios varied between 28
and 40 As shown m Figure 31 there is a high coefficient of detennination of 093
Recalling that
imep = bmep + finep (2S)
the actual engine data is very similar to the ideal SI enghie model shown m Figure 24
When the process is reversed in the Results and Discussion chapter Equation 315
can be rearranged and combmed witii Equation 316 and 317 to yield the volumetiic
efficiency
_ AFbmep-^136)
In application to the heat transfer predictions the engine speed and power are specified
from knowledge of the road load and power trahi ratios and efficiencies This allows
dhect calculation of the bmep With the bmep known Equation 319 can be used to
calculate the volumetric efficiency and thereby the air mass flow rate through the
enghie which is the desired result of the enghie power correlation for SI engines This
flow rate is applied to the heat transfer correlation to determine a characteristic RegtTiolds
number for flow through the cylinder
33 Naturallv Aspired Spark Ignition Engine Heat Transfer Methodologv
The convective heat fransfer to the cylinder walls is characterized in terms of a
convective heat transfer coefficient
71
where
4Q ^o- deg T7~Tr cylinder heat flux 01)
N^nB
X Boz 4 ^
= cylmder bore (322)
Assuming a cycle-averaged combustion gas temperature T^ of 447C (Heywood 1988)
and wall temperature T^ of 110degC based on constant coolant temperature results in a
temperattire differential (f -T^) of 337degC This temperattire differential of 337degC has
been used for all SI engine experimental data reduction in the current investigation
Direct measurements of the cylinder heat fransfer rate Qcyi are difficult to
accomplish and are not generally available Instead the cylinder heat fransfer rate must
be deduced from the overall heat rejection to the coolant which also includes the effect
of mbbing friction
Qcyl = Qcoolant-Prf- (3-23)
The fiiction power dissipation P and the correspondmg fiiction mean effective pressure
finep include contributions associated with mbbing friction between moving
components pumping work during the mtake and exhaust sfrokes and accessory power
requhements
72
finep = rfinep -- pmep -i- amep (324)
For analysis of experimental engine heat rejection data the fraction of the friction power
dissipation due to mbbing friction is taken as a constaih
rfinep ^ ^ ^ - ^ = 06 (325) finep
Recall that the fiiction mean effective pressure was determined as pait of tiie power
correlation of the previous section The value is consistent with recommendations from
the literature and is chosen to yield the best collapse of the experimental data It should
be noted that the rubbing fiiction is a relatively small contribution to the total heat
rejected to the coolant Consequently the overall accuracy of the heat transfer
correlation is relatively insensitive to the choice for the rfinepfinep ratio
With Equation 325 the cylinder heat fransfer rate may be found from
experimental heat rejection to coolant data using
Qcyl = Qcoolant -06finepVn Y^ (326)
and with application of Equation 320 the corresponding convection heat fransfer
coefficients can be determined
Variations of the convective heat fransfer coefficient are correlated in terms of a
general Nusselt number versus Reynolds number relationship The Nusselt number is
defined as
Nu = ^ (327)
and for application to an engine the Reynolds number is defined as
73
Re = (328)
The characteristic gas velocity is
7 ^^
pnB^N (329)
givmg
Re Am
KBN^P
For Equation 330 the mass flow rate is found from
m = m^--mf =m^ 1 + -AF)
(331)
With Equations 327 and 328 the Nusselt number versus Reynolds number can be
determined from the data for eleven normally aspired SI engines and are presented in
Figure 32
74
innon
Nus
selt
Num
ber
5 sect
1
y = 23827xtrade
R = 09295
Nusselt Nufnber vei-sus Reynolds Number
cb
)0 1000 10000
Rejuolds Number
10O0OO
Figure 32 Nusselt Number versus Reynolds Numbers for Eleven Normally Aspirated SI Engines
These data are well correlated by
Nu = 13SRe 0794 (333)
These data follow the conventional form of a power law relation with a high coefficient
of determination 093
The power and heat transfer correlations can be applied to predict the heat
rejection from an arbifrary SI engine by applying the foUo^ ing procedure
Specification of the enghie speed and brake power requhement witii Equation 319
allows calculation of the volumetiic efficiency and correspondmg mass flow rate
With mass flow rate determined a corresponding Reynolds number is obtamed from
Equation 330
75
Equation 333 is applied to determine the Nusselt number and Equation 327 is used
to calculate the corresponding heat fransfer coefficient
The rate of convected heat transfer from tiie cylinder walls and to the coolant is
obtained from Equation 320
The additional heat to the coolant from rubbing fiiction is calculated as prescribed by
Equation 325
34 Turbocharged Compression Ignition Engine Power Correlation
As previously discussed there are two additional complications hi the analysis to
the turbocharged CI engine heat rejection These differences are the stronger presence of
the radiation heat transfer mode and the coupled variations in ah flow and ah-fuel ratio
that are dependent on the turbocharger operation For convenience Equation 315 and
the definition of available mean effective pressure are restated as
bmep - TjfAmep = rjj-rjy ^ - finep
This relation is used to compare the experiment data for the CI engines The results are
presented in Figure 33 showing the brake mean effective pressure versus the available
mean effective pressure with the resulting linear regression
76
Brake Mean Effective Pressure versus Total Available Mean Effective Pressure
2500
bull 73 NGD 250 IHT 99-00
bull MY2000 3126B Banking
- MY2001 3126B Banking
laquo LionVe
mdash - Linear (Correlation)
1000 2000 3000 4000
Amep (kPa) TI p QLH (AF)
Figure 33 Brake Mean Effective Pressure versus Available Mean Effective Pressure for Turbocharged CI Engmes
The slope of tiie line again directiy determines tiie fuel conversion efficiency and
the mtercept determmes the fiiction mean effective pressure
Tif = 4 0 (334)
finep = 135 (kPa) (335)
The coefficient of determination is very sfrong at 096 Figure 33 was anticipated from
tiie ideal model predictions shown hi Figure 213
All of the ttirbocharged CI engines analyzed were nm very lean Ah-fiiel ratios as
high as 55 compared to the stoichiometiic value of 145 where typical The lean
operation of the CJ enghie dictates that the fiiel conversion efficiency is essentially
77
constant For the turbocharged CI engines the fuel conversion efficiency is constant at
40 hi comparison SI engines have a constant stoichiometiic fuel conversion
efficiency of 37 but tiie actual fuel conversion efficiency ranged from 28 to 40
depending on how rich to lean respectively
In the experimental data the ahflow rate and air- fuel ratio are known However
the underlying relationship between the volumetric efficiency and AF ratio must be
determined From the ideal turbocharged CI model the volumetric efficiency is
determmed by the interaction with the turbocharger The turbocharger pressure ratio or
corresponding rate of energy supplied to the induction airflow is m turn dependent on
the inlet conditions to the turbine and turbine power exfraction The general approach to
handle the coupling between the enghie and turbocharger will be to correlate the
turbocharger pressure ratio to the available mean effective pressure The volumetric
efficiency can then be correlated to the turbocharger pressure ratio With the volumetric
efficiency known the heat transfer correlation will then be developed
A plot of volumetric efficiency versus turbocharger pressure ratio for the four
collections of CI engine data is presented in Figure 34 As expected this data is well
correlated by a linear curve fit
7 =08031 P (336)
78
200
E 3 100
050
Volumetric Efficiency vs Turbocharger Pressure Ratio
y = 08031x
R = 09705
bull 73 NGD 250 HT 99-00
bull MY2000 3126B Barking
- M 2001 3126B Banking
bull LionV6
Linear (Correlation)
150 200
Turtmcharger Pressure Ratio
250
Figure 34 Turbocharger Pressure Ratio versus Volumetric Efficiency for CI Engines
Figure 35 contains a plot of turbocharger pressuie ratio versus available mean
effective pressure for the four collections of turbocharged CI engine data From the ideal
CI enghie analysis h is expected that this data may be well correlated by a relation of the
form
P = 1 -I- C Amep (337)
From the figure it is noted tiiat data from tiie 73 L NGD and Lion V6 engines are
reasonably consistent and may be represented by
P = 1 -h 025 MPa
Amep (338)
79
The 3126 B Engine however does not exhibh the expected linear variation as all data
points were obtahied near the wastegate limited maximum pressure ratio of
approximately 25 It is presumed that data taken at loyverAmep values would yield
lower pressure ratios that would follow the expected linear relationship with a
significantiy higher slope tiian that noted for the 73 NGD and Lion V6 engines
Turbocharger Pressure Ratio versus Available Mean Effective Pressure
300
250
200
150
050
bull 73 NGD 250 HT 99-00
bull MY2000 3126B Banking
- MY2001 3126B Banking
bull LionVfi
Linear (MY2000 3126B Banking)
Linear (Lion V6)
1000 2000 3000 4000
Amep (kPa) p Qbdquo ^y(AJ^F)
5000 6000
Figure 35 Turbocharger Pressure Ratio versus Available Mean Effective Pressure for CI Engines
The difference between the pressure ratio characteristics of the 3126 B engine
data and the 73 NGD and Lion V6 enghie data are a consequence of the matching of the
engines with turbochargers for their expected applications With additional specifications
for the engines and the mrbochargers this dependency could be incoiporated mto the
overall heat rejection model for turbocharged CI engmes However h is a major
objective for the current mvestigation to limit tiie engine specific data for use m the heat
rejection model to shnplify the enghie displacement and number of cylhiders The
80
motivation for tins objective is additional enghie data is often simply not available early
in a vehicle design cycle
With this limitation in mmd h was determined that a satisfactory representation
of the pressure ratio versus available mean effective pressure relationship for all four
engines is
1 + 035 1
MPa 24
Amep Amep lt 40 MPa
Amep gt 40 MPa (339)
35 Turbocharged Compression Ignition Engine Heat Transfer Methodologv
The heat fransferred to the coolant for a turbochai-ged CI engine can be
determined by
i^cool ~ iicom bull icrad ^ if (340)
Using standard correlations for the convection and radiation heat transfer Equation 340
can be expanded to yield
Qcoo = hAT^ -rj+ KaAT -T^) + P^
as was indicated for the SI engine correlation the heat fransfer reference area is defined
to be the cylinder area
A = r5 (342)
and
81
Bcc 4F^ X = cylinder bore
From the data analysis it became evident that the normalized form of Equation
341 provided a better analysis of tiie heat fransfer to the coolant for the CI enghie This
normalized form is shown in Equation 344
q^mep = hAg f^ ^ hM
iP-P^-^^PhPty rfinep (344) V n ^ y n
D2 DJ
For SI engines the ah-fuel ratio is approximately constant so that a constant cycle
averaged temperature and corresponding combustion gas properties could be assumed
For the CI engines wide variations of lean air-fuel ratios and gas temperatures are
expected and must be incorporated in the heat rejection model The cycle-averaged
temperature for the turbocharged engines will be approximated as the average
temperature between the wall and potential heat release of the fuel
T^=^ + T^ (345)
The change m combustion temperature due to the potential heat released from
combustion found in Equation 346 is calculated by
^T^QuL mCr
The specific heat of the combusted gas can be calculated from an approximation from
data found in Heywood 1988
C^^ = l + 142jcl0-^r-h247xl0-^r
82
As was done for the SI engines the coolant and wall temperatures are assumed constant
atllOdegC
Where the convection heat transfer is proportional to the difference in the gas and
wall temperatures the radiation heat transfer is expected to be proportional to the
difference in tiie temperatures raised to the fourth power Consequentiy a simple
average of the expected minimum and maximum temperatuies is not appropriate for
radiation heat fransfer calculations Applying the simple average temperature to the
correlations was found to yield radiant emissivity thne view factor greater than one This
result is clearly unrealistic and dictates that the gas temperature has been underesthnated
A more appropriate choice for a cycle averaged gas temperature for the radiation
heat fransfer correlation is
7 =Ar+28816 (348)
The choices for average gas temperatures in the convection and radiation heat fransfer
calculation is essentially arbifrary The expressions given by Equations 345 and 348 can
be expected to yield temperature estimates that are at least proportional to the actual
temperatures over the expected range of ah-fuel ratios Any discrepancy that results from
the temperature approximations will be folded into the correlation coefficients and will
not cause a problem so long as the temperatures used in the heat transfer predictions are
obtahied in the same way Furthermore the temperature approximations that have been
chosen yield mmitive satisfactory values for the convection and radiative heat fransfer
coefficients
The convective heat fransfer coefficient is correlated in terms of a general Nusseh
number versus Reynolds number relationship The Nusseh number is defined as
Nu = mdash = aRer (349)
where
83
Re pV^B
S
(350)
and
Pr = MC
(351)
For the turbocharged CI engines the thermal conductivity of the gas is not
constant due to variations of the air-fuel ratio and thus the cycle averaged temperature
Equation 352 approximates Combusted gas thermal conductivity
k^ = 8 82e- r W
mK (352)
Equation 352 is derived from extrapolated themial conductivit^ information found in
Heywood (1988)
The gas viscosity variation with cycle averaged temperature is taken as
M= 3 3 pound ^
1 + 0027^ (353)
where ^ is the fuel equivalence ratio
^ A_ V
ltgtbullbull
Fl J
(354)
The characteristic gas velocity is
84
T ^f^
^g ^ 2 (355)
givmg
D 4m ^^^~^r bull (3-56)
The ah mass flow rate for Equation 357 is found from
1 A w = w^+w^=m^ 1 +
1
AIF)
thus completing the required variables for the convection heat fransfer Radiation from
the gas to the walls must now be outlined
Heywood (1988) detailed that finep can be approximated as follows
finep = C+C^-^ + C^ f-^ 1 (358) 120 Hl20J ^ ^
where Ci term represents the boundary loss euro2 term represents the hydrodynamic or
mbbing loss and C3 term is the turbulent loss Therefore the hydrodynamic term was
used to determine the rfinep through the coefficient C2 This approach is different from
the approach used on the SI engine The rfinep is determined from the heat transfer
correlation instead of the power correlation
A multiple linear regression of Equation 344 can be analyzed to determine the
heat transfer coefficients No plots are available due to the multivariable output
requirements From the regression the heat fransfer coefficients and mbbing friction
coefficient were determined
85
7 = 2495 RePr ^
z =0341
C = 5 9 8 ^ (359)
or
qmep = - - (j TJ)+-^^ (T-7)+598 Av^ Avy^ kPa
- (360) 2
The coefficient of determination was 097 yielding evidence of a satisfactory correlation
Additionally the radiation contributed between 2 to 30
These correlations can be applied to predict the heat rejection from an arbifrary CI
engine by applying the following procedure
Given brake power and engine speed calculate bmep
The bmep and Equation 315 are used to find the Amep
The Amep and Equation 339 are used to find the turbocharger pressure ratio that with
Equation 336 yields the volumetric efficiency
The volumetric efficiency and Amep are combined to find the ah-fuel ratio
The air-fuel ratio and volumetric efficiency yield the fuel and ahflow rates and allows
calculation of the cycle averaged temperatures and gas properties
Reynolds number and Prandtl number can be calculated and used to obtahi Nusselt
number and corresponding convection heat fransfer coefficient
Equation 360 is used to obtahi the heat fransferred to the coolant
This completes the process to determine the heat rejection to the coolant for the CI
engine Applymg the correlation data back to the original dataset is discussed m the
86
Results and Discussion section of the dissertation The results are used to help quantify
the success of the correlation
87
CHAPTER rV
RESULTS AND DISCUSSION
Correlations have been developed for the naturally aspired SI engmes and
turbocharged CI engines The new correlations will be applied to tiie original sets of
engmes to determine the accuracy of the method The scope of this investigation is to
determine the heat rejection based on minimal initial data The input parameter
requirements for the heat rejection calculations are the engine speed brake power
requirement engine displacement and number of cylhiders With the engine pover
correlation and the cylhider heat fransfer correlation known the heat rejection to the
coolant may be predicted for any arbitrary combination of normally asphated gasoline or
turbocharged Diesel engine power requirement and engine speed
The experimental data used in the development of this analytical method
represent eleven different naturally asphated gasoline engines ranging from 20 liters to
68 liters in displacement and three different turbocharged Diesel engines ranging from
27 liters to 73 liters This sample of engines covers a very broad spectmm of vehicle
applications ranging from small economy cars to commercial tmcks In addition the
experimental data covers a wide range of engine geometries ranging from inline four
cylinder engines to ten cylinder engines in a V configuration Both two and four valve
per cylinder designs is included
It is important to note that although all of the heat rejection data used in this
experiment was obtained using the same overall method of measurement this data was
not gathered expressly for use m developing this analytical method On the confrary this
analytical method was developed from existing data as a potential means of reducmg the
reliance of vehicle design upon experimental data particularly early in the design of a
new vehicle when experimental data may be unavailable The experimental data used
here originally was gathered for use m the design of cooling systems for a variety of
vehicles The experimental data therefore represents a wide range of enghie calibration
sfrategies Although this is not an ideal scenario for the development of an analytical
88
tool recreating the amount of data used in this study witii consistent engine calibration
sfrategies would require such a fremendous investment of time and money as to make the
project impractical
The analytical metiiod presented here produces predictions tiiat in general
correlate well with measured experimental data There are however some discrepancies
between the predicted heat rejection to coolant and the heat to coolant measured
experimentally This fact is not surprising given that the analytical method uses several
approximations and assumptions in its derivation Many factors may account for the
discrepancies between the predicted engine heat rejection and that measured
experimentally
Heat fransfer is dependent upon temperature differential and thus heat rejection to
coolant is dependent upon the difference between the temperature of the hot engine
cylinder liner and the coolant The heat rejection to coolant predicted using the analytical
method assumes a constant coolant inlet temperature of 110deg C On the other hand a
variety of different coolant inlet temperatures was used in the development of the
experimental heat rejection data No single coolant inlet temperature is applicable to all
of the experimental data The resulting differences between assumed and acttial coolant
inlet temperature will account for some of the disparities between the predicted and
measured heat rejection to coolant
Accurate prediction of engine heat rejection depends upon accurate prediction of
engine fiiction as the heat generated by mbbing fiiction is a significant contiibutor to
heat rejection to coolant The relationship given in the new correlations was used m
conjunction witii the experimental data to derive an finep of 136 kPa for the SI engines
In reality finep varies significantly with engine speed In a typical four-cylinder enghie
for example h is typical for finep to vary from approximately 100 kPa at low enghie
speeds to 300 kPa at very high speeds this variation is not linear (Patton 1989 Thring
1992 The value of 135 kPa therefore represents a best-fit value of finep for all of the
experhnental data and not necessarily a precise prediction of finep at any particular
engine operating condition
89
Comparison of tiie analytically predicted value of finep to measurements found m
tiie literattire (Patton Nhschke amp HeyAvood 1989 Thring 1992) mdicates tiiat tiie finep
assumed in tiie analytical heat rejection predictions is probably smaller than the acttial
finep at moderate to high engine speeds If tins is the case at high engine speeds tiie
analytical model is under-predictmg the confribution of mbbmg fiiction to tiie total
amount of engine heat rejection to coolant The effect of this under-prediction would be
most significant at part-tiirottle operation at high engme speeds At part-throttle
operation the amount of heat rejection from the hot combustion gases is lower than at
full-throttle operation yet the amount of heat rejection from mbbhig friction is
effectively the same as at full-throttle operation smce mbbhig fiiction is prhnarily a
function of enghie rotational speed Thus the contribution of mbbhig friction to overall
engine heat rejection is greater at part-throttle operation Any negative effects due to
under-predicting the mbbing friction would therefore be most apparent at part-throttle
operation at high engine speeds For the turbocharged compression ignition heat
rejection correlation the variable mbbing fiiction was included
This behavior seems to support the theory that the analytical model undershy
estimates the contribution due to mbbing fiiction at moderate to high engme speeds for
the SI engine series Analytical methods do exist for predicting engme finep due to
mbbing components (Patton et al 1989 Thring 1992) although these methods are
somewhat complex It is possible that as a future improvement one of these methods to
denve finep could enhance the analytical method It is possible however that the
inclusion of one of these methods could infroduce a level of complexity into the
analytical method far exceeding the intended scope of the analytical method (Oler 2002)
41 Naturallv Aspired Spark Ignition Engine Results and Discussion
For the SI engine the only limitation on the calculation is that the power
specification be within the capabilities of the given engine Testing for this limitation is
easily incorporated into the calculations as described below
90
The first step in the calculation is tiie application of the engine power correlation
to determine the mass flow rate through the engme
p -I O
bmep = mdash ^ = 1^^7^^ ^ ^ - finep (41) ^^2 F
The general SI engine power correlation is rearranged to obtahi the corresponding
volumetric efficiency
rjy=bmep + 35) fl^ (42)
As previously stated the volumetric efficiency is a non-dimensional expression of the
mass flow rate through the engine It is also a dhect indication of the throttle position
with a volumetric efficiency of approximately 025 at the throttle closed or idle position
and 085 at wide-open throttle An engine speed and power requhement leading to a
bmep and corresponding volumetric efficiency significantly outside of that range is not
within the capabilities of the specified engine and a meaningful heat rejection calculation
cannot be accomplished
With the volumetric efficiency known the heat fransfer correlation may be
evaluated This begins by rearranging Equation 330 and substimtmg in Equation 331
thus calculating the cylinder Reynolds number
P^Vj^^il + JL ^ Re = l^^-^Tjy TiBpi ^ AF
(43)
The Reynolds number is applied to find the Nusselt number and the corresponding
convection heat transfer coefficient
Nu = 13Ke (44)
91
and
kgNu ^ = - ^ (45)
The cylinder heat rejection is obtahied from
a=N^^h(T^-TS (46)
The total heat rejection to the coolant is the combination of the cylinder heat transfer and
the mbbing fiiction energy dissipation
Qcoolant = Qcyl + Prf - (4-7)
The additional heat rejection associated with the mbbing fiiction energy dissipation is
obtained as a fraction of the overall friction power
P^=06finepV^^ (48)
Although heat fransfer from the engine block is partially accomplished through
convection to the surrounding air radiation to the engine bay and conduction through
engine attachments the heat transfer rates associated with these mechanisms should be
small relative to the heat transfer rate to the coolant
The heat rejection maps for the eleven SI engines are presented in Figures 41
through 411 The envelope represents the heat rejection predictions bounded by speeds
of 1000 rpm and 6000 rpm and volumetric efficiencies of 02 and 085 Note that
mdividual engines are keyed per Table 31 The overall envelope and coiresponding test
data points are shown in Figure 412
92
20L CVH Split Port 14 Engine (CT120) 100
I
-laquo w
i 1000 RPM Test Data bull intermediate Test Data a 5500 RPM Test Data
mdash _ - Volumetric Efficiency = 085 Envelope bull - - - 6000 RPM Emelope _ mdashVolumetric Efficiency = 02 Envelope
1
Brake Power (kW)
Figure 41 20L 14 SI Engine Heat Rejection Map
Figure 41 provides the first opportunity to reiterate tiiat the engine tests from
which the data were collected were not designed to yield data covering the enthe
operathig envelope of each engine On the contrary tiiese tests were run for varying
reasons ranging from heat rejection to spark thning evaluation Therefore complete
datasets over the operating envelope were not available or required to successfully
complete the test goals
93
20L DOHC Zeta 14 Engine
Brake Power (kW)
Figure 42 20L 14 Zeta SI Engine Heat Rejection Map
94
100
S 10
23LDual Plug 14 Eogine Dynomometer Data
amp bull D
1200 RPM Test Data
intennediate Test Data 5400 Test Data
-1000 RPM Envelope
Volumetric Efficiency = - 6000 RPM Envelope
mdashVolumetric Efficiency =
085 Envelope
020 Envelope
Brake Power(kW)
Figure 43 23L 14 Dual Plug SI Engine Heat Rejection Map
95
100
o a 10
25L 4V V6 Engine Dynomometer Data
^^y^^^ A 1380 RPM Test Data
bull Intennediate Test Data
a 4000 RPM Test Data
mdash mdash Volumetric Efficiency = 085 Envelope
6000 RPM Envelope
mdash - mdashVolumetric Efficiency = 020 Envelope
1000
Brake Power (kW)
Figure 44 25L V6 4V SI Engine Heat Rejection Map
96
100 30L 4V 6 Engine Dynomometer Data
y J y
^ i 1570 RPM Test Data
bull Intemediate
D 2450 RPM Test Data
mdash mdash Volumetric Efficiency = 085 Enelope
mdash - - - 6000 RPM Envelope
mdash - mdashVolumetric Efficiency = 020 Envelope
10 100
Brake Power (kW)
Figure 45 30L V6 4V SI Engine Heat Rejection Map
97
100
I
30L Vukan V6 Engine (1995-14 Ranger)
y^
gt - - A
a 1000 RPM Test Data
bull Intemiediate Test Data
bull 5000 RPM Test Data
1000 RPM Envekipe
Volumetric Efficiency = 085 Envelope
- - - -6000 RPM Envelope
mdash - -Volumetric Efficiency = 020 Envelcpe
100 1000
Brake Power (kW)
Figure 46 30L V6 Vulcan SI Engine Heat Rejection Map
98
Figure 47 40L EI 95 SI Engine Heat Rejection Map
99
40L SOHC V6 Engine Dynamometer Data
1000
e 100
10
o a
A 1000 RPM Test Data
bull Imtemiediate Test Data
a 5000 RPM Te1t Data
1000 RPM Envelope
Volumetric EfTiciency = 085 Envelope
- - - - 6000 RPM Envelope
mdash bull -Volumetric Efficiency = 020 Envelope
10
Brake Power (kW)
Figure 48 40L V6 SOHC SI Enghie Heat Rejection Map
100
S4L4V V8 Engine Heat Rejectron Data (McLaren July 1995) 1000
Brake Power (kV)
Figure 49 54L V8 4V SI Engine Heat Rejection Map
101
1000
6 100
10
54L 2V V8 Engine Dynamometer Data
G
1000 RPM Test Data
Intemiediate Test Data
4500 RPM Test Data
1000 RPM Envelope
- Volumetric Efficiency = 085 Envelope
- - 6000 RPM Envelope
- mdashVolumetric Efficiency = 020 Envelope
100 1000
Brake Power (kW)
Figure 410 54L V8 2V SI Enghie Heat Rejection Map
102
68L2V VlO Engine DynanvimetcrData
6 100
^ ^ ^ lt
^
ltJ^
a a 10 1000 RPM Test Data
Intemiediate Test Data
4500 RPM Test Data
-1000 RPM Envelope
Volumetric Efficiency = aBfi Enlaquolope
6000 RPM Envelope
mdash -Volumetric Efficiency = 020 Envelope
100 1000
Brake Power (kW)
Figure 411 68L VIO 2V SI Enghie Heat Rejection Map
103
Overall Test Data and Correlation Envelope
1000
10
10
Brake Povgtrer(kW)
Figure 412 Overall Correlation Envelope and Test Data for SI Engines
The experimental data and predicted heat rejection envelopes from the eleven
engines have been combined in Figure 412 The remarkable flexibility of the correlation
is apparent It is obvious that a majority of the test data were recorded at high volumetric
efficiencies as this operation is shown in the lower right of the envelope The 40L V6
SOHC SI enghie was the only engme that was significantly outside tiie correlation
envelops and other test data cluster Perhaps there is error in the data or other significant
operational differences (ie superchargmg turbocharghig etc) not described in the test
data sheet
The resuhs of a comparison of the new correlation and Lahvic calculations with
the experimental engine data on a pomt-by-point basis are shown in Figure 413
104
NewcorTelation Error and Labvic Error Vereus Brake Mean Effecthc Pressure
n Correlation (Typical
a Lahvic (Typical)
s deg Jo
lti -Jicf
^
A trade - n
f ^ - n Vs
v laquo- tf- ^mdashf mdash -^mdash-^-^mdash O bdquo A A A
6mg7 (kPa)
Figure 413 New Correlation and Lahvic Error for Naturally Aspired SI Enghies
Each data pomt represents the percent deviation between the enghie data and the
predicted resuh at the same enghie speed and brake power Although the deviation
results are plotted versus bmep there is no apparent dependency of the deviations on tiiat
parameter
For the entire collection of data the mean error deviation is zero and tiie standard
deviation of tiie error is 11 For comparison tiie results from the Lalivic correlation aie
22 for the mean deviation and 15 for the standard deviation of tiie error Tliis
completes tiie successful demonsfration of a correlation that can predict SI engine heat
reject based on mmimal initial enghie data
105
42 Turbocharged Compression Ignition Engine Results and Discussion
With the enghie power correlation and the cylmder heat transfer correlation
known the heat rejection to the coolant may be predicted for any arbitrary combination
of turbocharged CI engine power requirement and enghie speed The only limitation on
tiie calculation is that the power specification be within the capabilities of the given
engine The input parameter requirements for the heat rejection calculations are the
engine speed brake power requirement enghie displacement and number of cylinders
Additionally if known the turbocharger wastegate pressure ratio can increase the
accuracy of the prediction although using a typical value for the pressure ratio will yield
satisfactory results
The first step in the calculation is to determine the air mass flow rate though the
engine The bmep and corresponding Amep are calculated Equation 41 with a fuel
conversion efficiency of 040 and an fmep of 136 kPa From the turbocharged CI enghie
analysis the turbocharger pressure ratio was a fimction of the available mean effective
pressure and wastegate pressure ratio As discussed in the previous chapter an
approximation for the turbocharger characteristics is
r^ = Minimuml 1 + 035 MPa
Amep 24 (410)
These two generic parameters are needed to represent the turbocharger sufficiently to
obtahi the ahflow through the CI engines
With the turbocharger pressure ratio known based on the generic representation
from discussions on Figure 36 the volumetric efficiency can be found from the
correlated values found in Figure 35 and Equation 411
7bdquo= 0803 IP
The airflow rate is determined by definition as shown in Equation 412
106
lt=VPa~V (412)
The next step in the calculation is the application of the engine power correlation to
determine the fiiel mass flow rate through the enghie where Equation 41 finds the brake
mean effective pressure
bmep = - ^ = 77bdquo7 ^ ^ - fmep bull (4-1) ^^2 F
The general turbocharged CI engine power correlation is then applied to obtain the
corresponding ah-fuel ratio
4 ^ nyO-^^PaQiH (4 11) P bmep--135)
With the ahflow rate and air-fiiel ratio known the fiiel mass flow rate is also knovm The
heat fransfer correlation for CI engines from Equation 357 may be evaluated
250k^RcPT^(- ^ a 3 4 l pound ^ = 4 7^4VQo
kPa a (357)
Figures 414 to 417 contain the heat rejection maps for the turbochaiged CI
engmes The correlation envelopes are bounded by speeds of 1000 ipm and 4000 rpm
and pressure ratios of 12 and 32
107
10
73 L V8 NGD 250 UT 99-00
s Ji
ecte
d to
Coo
lant
i tR
ej
Hea
1000 -
100 -
10
-
~ 1
o 2690 RPM Test Data bull Inten-nadiate Test Data i 1000 RPM Test Data
1000 RPM Envetope
Pr = 32 Envelope - - - - 4000 RPM Envelope mdash - - P r = t2 Envelope
^ 1 100 1000
Brake Power(kW)
Figure 414 73 L 250 HT Turbocharged CI Engine Heat Rejection Map
10000
108
10000
C- 1000
u e
10
72 L V6 MY2000 3126B Banking
D 2400 RPM Test Data
i 2200 RPM Test Data 1000 RPM Envelope
mdash mdash Pr = 32 Envelope 4000 RPM Envelope _bull - P r = 12 Envelope
1000
Brake Power (kW)
10000
Figure 415 72 L V6 3126B 2000 Turbocharged CI Enghie Heat Rejection Map
109
10000
d 1000
e
as 100
10
72 L V6 MY2001 3126B Banking
100
bull 2400 RPM Test Data
a 2200 RPM Test Data
1000 RPM Envelope
mdash ^ Pr = 32 Envelope
4000 RPM Envelope
mdash - - P r = 12 Envelope
1000
Brake Power (kW)
10000
Figure 416 72 L V6 3126B 2001 Turbocharged CI Engine Heat Rejection Map
110
Hea
t R
ejec
ted
to
Coo
lant
(k
W)
1000 -|
100 -
10 -
1 -
27 LV6 Lion
1 10
i 1900 RPM Test Data
bull Intemiediate Tesi Data
D 4000 RPM Test Data
mdash mdash Pr = 32 Envelope
4000 RPM Emelope
mdash - - Pr = 12 Envelope
100 Brake Power(kW)
10 00
Figure 417 27 L V6 Lion Turbocharged CI Engine Heat Rejection Map
These figures demonsfrate good agreement in the heat rejection predictions and actual
heat rejection data for turbocharged CI engines Note that in all of these figures the heat
rejection data vary approximately linearly with the brake power This trend is probably a
result of the weak dependence of airflow with engine speed due to turbocharging
Additionally the overall envelope and test data for the CI engines are shovra m Figure 418
I l l
10
Overall CI Test Data and Correlation Envelope
10
Correlation Envelope bull 7 3LV8 250m99-00 bull 72LV6MY2000 3126B Banking - 72L V6 M2001 3126B Banking bull 27LV6Lion
1000
Brake Power (kW)
Figure 418 Overall CI Test Data and Correlation Envelope
Again Figure 418 shows the remarkable flexibility of the correlation The error
in the new correlation with a generic ttu-bocharger and the existing Lahvic correlation are
presented versus bmep in Figure 419
112
70
60
50
30
p 20
n bull 73 NGD 250 KT 99-00
bull Lalivic Error
bull 72L V6 MY2000 3126B Banking
-72L V6 MY2001 3126B Banking
bull 27L V6 Lion
10
0
-10
-20
raquo bull ^ 1
bull bull bull
500 1000 2500
bmep (kPa)
Figure 419 New Correlation and Lahvic Error for Turbocharged CI Enghies
Each data pomt represents the percent deviation between the engme data and the
estimation resuh at the same enghie speed and brake power Although the deviation
results are plotted versus bmep there is no apparent dependency of tiie deviations on tiiat
parameter
For the entire collection of data the mean error deviation is zero and tiie standard
deviation of tiie error is 11 For comparison the results from the Lahvic correlation are
16 for tiie mean deviation and 22 for tiie standard deviation of tiie error This
completes the successfiil demonsfration of a correlation that can predict CI enghie heat
reject based on minhnal initial engine data Agam there is a marked improvement over
the currentiy used Lahvic regression even with a generic wastegate pressui-e ratio When
the wastegate pressure ratio is known the accuracy of the new correlation hnproves over
the generic scenario Obviously the fiuther the assumed wastegate pressure ratio is away
113
from the true wastegate pressure ratio the further the correlation is from predicting an
accurate heat rejection
114
CHAPTER V
CONCLUSIONS
General methods for estimating the heat rejection to the coolant of a normally
aspirated spark ignition (SI) engine and a turbocharged compression ignition (CI) engine
have been given The vehicle parameters or input required for the calculations aie the
engine displacement number of cylinders enghie speed and brake power requhement
For the enthe collection of SI engine data the mean error deviation is zero and the
standard deviation of the error is 11 For the collection of CI engine data the mean
error deviation is zero and the standard deviation of the error is 11 The CI error is no
larger than the SI heat rejection error In addition with its dhect dependence on
volumetric efficiency the engine power correlation makes it readily apparent if a given
speed and power requirement are within the capabilities of a given naturally asphed SI
engine
The primary objective for the calculation method that has been presented is to
predict coolant heat load for an arbifrary engine with reasonable accuracy If however
data is available for a particular engine unique values for the fiiction mean effective
pressure fiiel conversion efficiency and Nusselt number correlation coefficients can be
obtained The resulting coolant heat load calculations can be accomplished with an
accuracy that appears to only be Ihnited by the original data This approach vv ould
provide an efficient means of compressing extensive sets of experhnental data mto an
engine database
The method for naturally asphed SI enghies is available in an Excel workbook
called ttuHeat Heat rejection predictions are based on the standard correlation
coefficients from data from eleven engmes Optionally the user can generate a unique
correlation for a specific engine A heat rejection map power and heat tiansfer
correlation resuhs and a correlation error summary support tiie calculations The
computer program thiHeat also includes a worksheet to facilitate unit conversions from
dynamometer data files to the SI data needed for the correlation All of tiie calculation
115
worksheets are protected except for the user data entry areas Tlie workbook as a whole
is not protected which allows users to collect calculation results and build additional
worksheets and plots to meet the users needs Modifications to these correlations were
successfiil at predicting heat rejection from turbocharged diesel enghies Additionally a
theoretical basis for extending the spark ignition engine to include turbocharging has
been infroduced
116
REFERENCES
Alkidas A C amp Cole R M (1985) Transient heat flux measurements in a divided-chamber Diesel engine Journal of Heat Transfer 107 439-444
^miand W J (1963) Heat transfer m the cylinders of reciprocating intemal combustion enghies Proceedings of the Institution Mechanical Engineers 177 973-990
Ap N S amp Gohn N C (1997) New concept of engine cooling system (Newcool) SAE 971775
Brandstetter W amp Dziggel R (1982) The 4- and 5-cylhider ttirbocharged Diesel engines for VoUcswagen and Audi Society of Automotive Engmeers SAE Transactions 91 SAE Paper 82044 1982
Bromnick P A Pearson R J amp Wmterbone D E (1998) hitercooler model for unsteady flows in engine manifolds Proceedings of the Institution Mechanical Engineers 212 PartD 119-132
Bulaty T Codan E amp Skopil M (1996) A flexible system for tiie simulation of turbocharged Diesel engines and turbocharging systems Proceedings of the ICE-Spring Technical Conference Youngs town Ohio 26-3 57-63
Cao Y amp Wang Q (1995) Thermal analysis of a piston cooling system with reciprocating heat pipes Heat Transfer Engineering 7(5(2)
Cengel Y A Boles M A (1989) Thermodynamics An Engineering Approach New York New York McGraw-Hill
Chick J P (1998) The modeling of engine thermal systems Unpublished doctoral dissertation University of Nottingham
DAdda C Lisbona M G Occella S amp Maiorana G (1994) Optimization of the cooling system of a high specific power Diesel engine with analytical methodologies SAE Conference Proceedmgs 4 International Conferencemdash 1994 Mar 1209-1220
Davidson S D (1984 August) On-highway performance evaluation of a Cummins Diesel enghie featuring optimized charge ah cooling Paper presented at West Coast International Meeting amp Exposition San Diego
Edson M H amp Taylor C F (1964) The limhs of engine performance - comparison of actual and theoretical cycles Digital Calculations of Engine Cycles 7 65-81
117
Fmlay I C Harris D Boam D J amp Parks B I (1985) Factors influencmg combustion chamber wall temperatiires in a liquid-cooled automotive spark-Gerhard W (1979) Prediction of tiiermal loading of supercharged Diesel engines Proceedings from the Institution of Mechanical Engineers 199207-214
Flynn P (1979) Turbocharging four cycle Diesel engines Society of Automotive EngineeTSSAE Transactions 88 SAE Paper 790314 1979
Ford Power Products (nd) Retiieved March 232003 from httpv^wwfordpowerproductsconienghie2jpeg
Gehres E (1963 March) An analysis of engine cooling in modern passenger cars Paper presented at National Automobile Meeting Defroh
GT15-25 (nd) Retiieved August 15 2002 from httpwwwegarrettcomproductsgt 15_25jsp
Hashem H H (1989 9th) Waste energy potential of Diesel engine (experimental evaluation) Paper presented at 9th Miami International Congress on Energgt amp Environment Miami Beach
Hawley I G Wallace F J Cox A Pease AC Bird GL amp Horrocks R W (1998) Use of a VGT to improve the limiting torque characteristics of a DI automotive Diesel engine Institution of Mechanical Engineers Conference Transactions 11 347-357
Heywood J (1988) Internal combustion engine fundamentals New York New York McGraw-Hill
Hribemik A amp Moskwa J J (2000) Transient response of a cross-flow charge air intercooler and its influence on engine operation Journal of Dynamic Systems Measurement amp Control 111 483-489
Kadoli F G amp Aknamurthy (1984) Performance of Diesel engine with compound cooling Proceedings of the XIII National Conference on IC Engines and Combustion Bangaloro 241-246
Kamo R (1977 March) Cycles and performance studies for advanced Diesel engines Paper presented at the Conference on Ceramics for High Performance Applications Newport RI
Kem J amp Ambros P (1997) Concepts for a controlled optimized vehicle enghie cooling system Society of Automotive Engineers Publication 971816 357-362
118
Kunitomo T Matsuoka K amp Oguri T (1975) Prediction of radiative heat fliuc m a Diesel enghie Society of Automotive Engineers Transaction 750786
Liu D Xu X amp Hou J (1993) Analysis and computation of characteristic of tiie water cooling and radiatmg system for a heavy duty truck Diesel engine SAE 939160 Seventh Intemational Pacific Conference and Exposition on Automotive Engineering Pheonix Arizona Nov 15 -19 1993 53-62
Lahvic T R Investigation of Enghie Heat Rejection August 1986 Ford Motor Co
Lundun B Povohiy J amp Chelko L (1949) Correlation of cylmder head temperatures and coolant heat rejections of a multi-cylinder liquid cooled engine of 1710 cubic-inch displacement (NACA Report No 931)
Merrion D Diesel engine design for the 1990s SAE Special Presentation 1011 1993
Moeckel M D (1994) Computational fluid dynamic (CFD) analysis of a six cylinder th
Annual Earthmoving Industry Conference Pioria Illinois April 12 amp13^ 1994 Diesel engine cooling system with experimental correlations SAE 941081 45 Am 1-9
Mohan K V Arici O Yang S amp Johnson J H (1997) A computer simulation of the turbocharged Diesel engine as an enhancement of tiie vehicle engine cooling system shnulation SAE No 971804 237-253
Oler W Parish O Williams J Bums M (2002) Heat rejection fiom naturally aspired gasoline automobile engines Journal of Ford Engineering
Patton K Nitschke RG amp Heywood J B (1989) Development and evaluation of a fiiction model for spark-ignition engines SAE Paper 890836
Povohiy J Bogdan mitial amp Chelco L (1950) Cylinder head temperatures and coolant heat rejection of a multi-cylinder liquid cooled engine of a 1650 cubic inch displacement (NACA TN 2069)
Rakopoulos C D Andritsakis E C amp Kyritsis D K (1992) Availability accumulation and destruction in a DI Diesel engine with special reference to the limited cooled case (Tech Rep No 3) Athens Greece National Technical University of Athens Mechanical Engmeering Departinent Thermal Engmeering Section
Rakopoulos C D amp Mavropoulos G C (2000) Experhnental instantaneous heat flux m the cylhider head and exhaust manifold of an air-cooled Diesel engine Energy Conversion iSc Management 41 1265-1281
119
Sekar R R (1982 Febmaiy) Trends in Diesel engine charge air cooling Paper presented at Intemational Congress amp Exposition Defroh
Shayler P J Baylis W S Chick J P amp Bell P (1999) The effects of EGR and tt^bocharging on engine heat rejection rates fristitiition of Mechanical Engineers 4 Vehicle Thermal Management Systems Conference London United Kmgdom 1999 679-693
Shayler P Chick J Hayden D Yuen H amp Ma T (1997) Progress on modeling engine thermal behavior for VTMS applications Society of Mechanical Engmeers SE Paper 971852 1997
Shayler P Chick J amp Ma T (1996) Effect of coolant mixmre composition on heat rejection rate Society of Automotive Engineers SAE Paper 960275 1996
Shayler P Chick J Ma T (1997) Correlation of engine heat transfer for heat rejection and warm-up modelmg Society of Automotive Engineers SAE Paper 971851 1997
Taylor C (1985) The intemal combustion engine in theory and practice (Vol 1) (2 ed) MIT
Taylor C F amp Toong T Y (1957) Heat ttansfer in intemal combustion engines American Society of Mechanical Engmeers ASME Paper 57-HT-171957
Taymaz I Gur M amp Halici F (1998 June) The effect of insulated heat fransfer surfaces on direct injected and turbocharged Diesel engine fuel consumption and coolhig system Paper presented at T^ Trabzon Intemational Energy amp Envhonment Symposium Trabzon Turkey
The new DELTA engine There are common engines and there are exfraordhiargt enghies (nd) Retrieved August 17 2002 from httpwwwdefroitdieselconiPublicMarketsautomotiveadeltalasp
Thring RH (1992) Engine fiiction modelmg Society of Automotive Engmeers SAE Paper 9204821982
Tovell J F (1983 Febmary) The reduction of heat losses to the Diesel engine cooling system Paper presented at Intemational Congress amp Exposition Detroh
Wallace F J Hawley J G Cox A Pease A C Horrocks R W amp Bhd GL (1997) Variable geometry turbocharging of a 18 DI automotive Diesel engine Paper presented at 30 Intemational Symposium on Automotive Technolog^ amp Automation Florence Italy
120
Wallace F J Way R J B amp VoUmert H (1979) Effect of partial suppression of heat loss to coolant on the high output Diesel engine cycle Society of Automotive Engineers SAE Paper 790821979
Watson N amp Janota M (1982) Turbocharging the internal combustion engine New Vork Wiley-Interscience
Watson N KjTtatos K amp Holmes K (1983) The perfonnance potential of Ihnited cooled Diesel engines Proceedings from the Institution of Mechanical Engineers 197A 197-207
Watts P A amp Heywood J B (1980 Febmary) Shnulation stiidies of tiie effects of turbocharging and reduced heat fransfer on spark-ignition engine operation Paper presented at Congress amp Exposition Defroh
Way R J B amp Wallace F J (1979) Results of matching calculations for turbocharged and compound engines with reduced heat loss Society of Automotive Engineers SAE Number 790824 1979
Woods M Bryzik W amp Schwarz E (1992 Febmary) Heat rejection fiom high output adiabatic Diesel engine Paper presented at Intemational Congress amp Exposition Defroit
Woodward J B (1995) Air-standard modeling for closed cycle Diesel engines Proceedings of the Institution of Mechanical Engineers 209 115-123
Worden J A amp Zehr R L (1999 March) Consideration of fluid velocity effects in the design and development of aluminum cooling system components for heavy duty Dieselengines Paper presented at Heavy Duty Coolants and Cooling Systems Intemational Congress and Exposition Defroit
Yoshimoto Y Tsukahara M amp Kuramoto T (1996 October) improvement ofBSFC by reducing Diesel engine cooling losses with emulsified fuel Paper presented at Intemational Fall Fuels amp Lubricants Meeting amp Exposition San Antonio
121
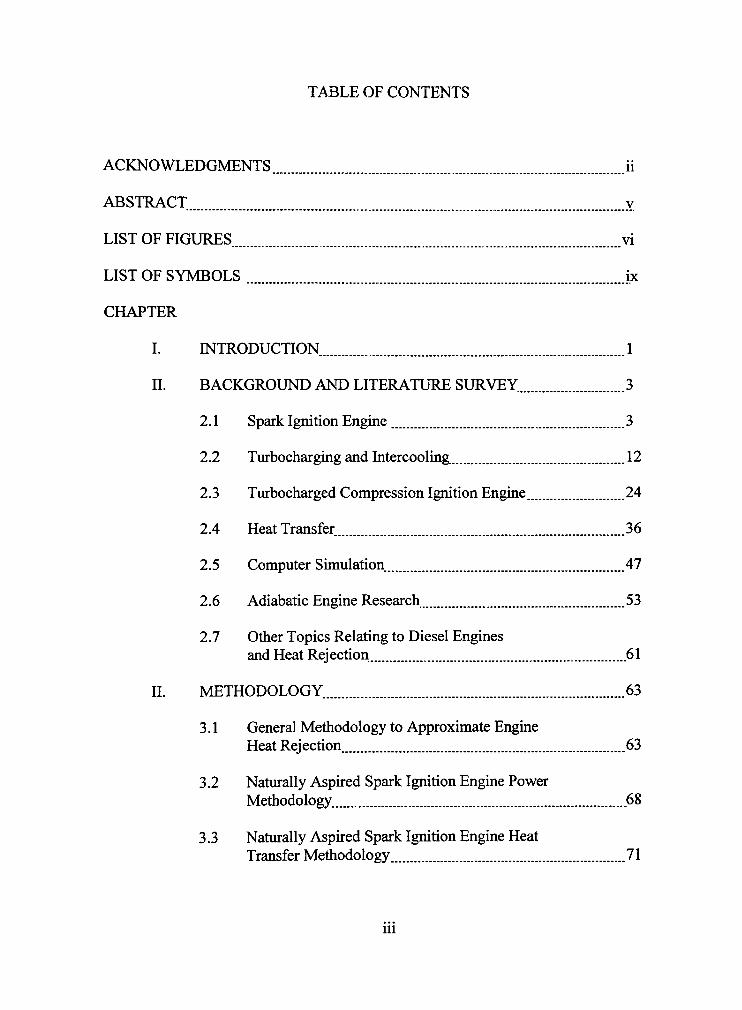
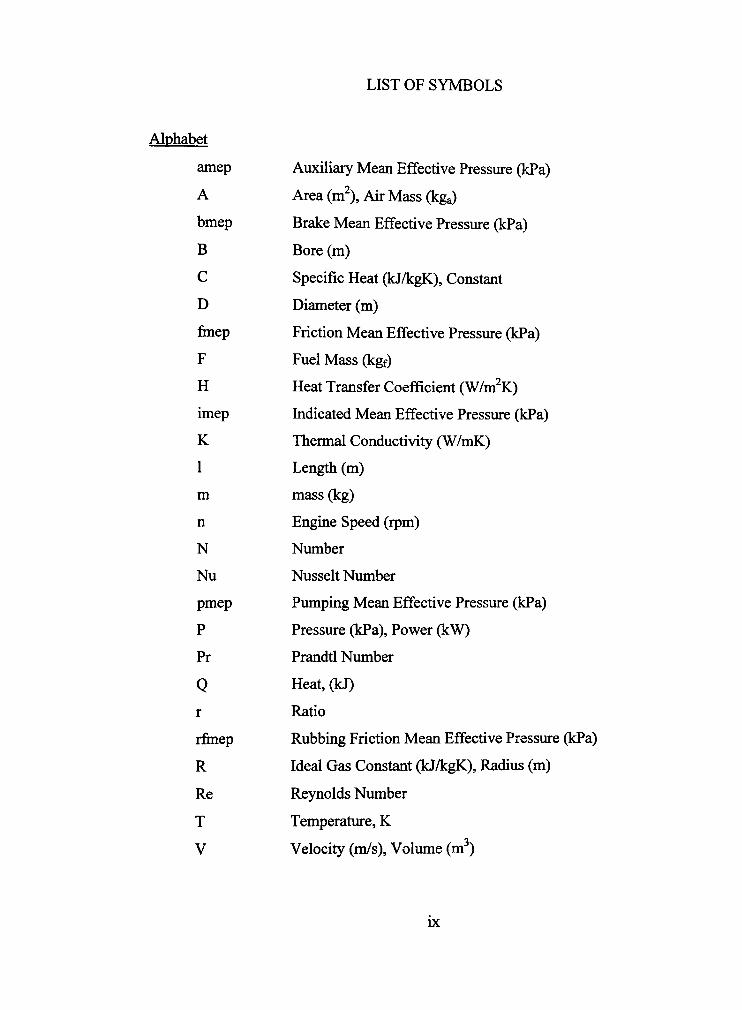