By Kayla Ann Boortz - Vanderbilt...
186
Exploring the Function of G6PC2 in Pancreatic Islet Beta Cells By Kayla Ann Boortz Dissertation Submitted to the Faculty of the Graduate School of Vanderbilt University in partial fulfillment of the requirements for the degree of DOCTOR OF PHILOSOPHY in Molecular Physiology and Biophysics December, 2016 Nashville, Tennessee Approved: Owen P. McGuinness, Ph.D. Roger D. Cone, Ph.D. David A. Jacobson, Ph.D. Fiona E. Yull, D.Phil
-
Upload
truongxuyen -
Category
Documents
-
view
213 -
download
0
Transcript of By Kayla Ann Boortz - Vanderbilt...

Exploring the Function of G6PC2 in Pancreatic Islet Beta Cells
By
Kayla Ann Boortz
Dissertation
Submitted to the Faculty of the
Graduate School of Vanderbilt University
in partial fulfillment of the requirements
for the degree of
DOCTOR OF PHILOSOPHY
in
Molecular Physiology and Biophysics
December, 2016
Nashville, Tennessee
Approved:
Owen P. McGuinness, Ph.D.
Roger D. Cone, Ph.D.
David A. Jacobson, Ph.D.
Fiona E. Yull, D.Phil

ii
Acknowledgments
Primarily I need to thank the O’Brien Lab and all of its members. Specifically, I need to thank Ken
for always keeping things entertaining and keeping me on my toes. Not to mention doing my tails and
always supporting me with whatever help I may need at the time. I can truly say I will never work with an
individual like Ken again and I am thankful for the time I got to spend with him. Next I need to thank Kristen
who not only has become one of my dear friends but has been a constant support system since she joined.
Her willingness to answer my dumb questions, help me with math or encouragement during times of stress
is invaluable and I will miss her dearly. Next, Karin’s support in a time of transition and help in all things is
very much appreciated. Finally, none of this work would be possible without the support, guidance and aid
of Richard. His training and knowledge has created an environment that is both challenging but
encouraging. I am a better student, scientist, writer, speaker and soccer enthusiast because of him.
I also need to thank my committee, department and support staff at Vanderbilt. My committee was
crucial to guiding me through my project and making me a better problem solver and scientist. There, often
critical, evaluation was necessary to making me better and I appreciate them for always pushing me to
improve and think about my data harder. I also need to thank MP&B for the support and opportunities I
was given while I was here. Being in such a collaborative and friendly department definitely makes a
difference on the day to day of graduate school. I will miss the Halloween Parties and relay races and just
general environment that was cultivated within our ranks. Finally I need to thank Colette Bosley and Karen
Gieg for making our lives as students just a little bit easier. Colette always has a smile and just calming
effect when you are around her, while Karen was crucial to making everything simpler for us.
Next I need to thank my family. My parent’s support throughout my life gave me the courage and
will to not only pursue my PhD but also to be successful. While they always stressed that I pursue
something I was good at, I am sure they did not anticipate me staying in school this long. From the
emotional phone calls to the excited ones, they have been by my side from the start. Next I need to thank
all my friends, both new and old that have been along for this ride. Having a support system disconnected

iii
from graduate school was such a necessary thing for me to stay balanced and focused. While they didn’t
understand what I was talking about half the time, I love them for pretending like they did and knowing
when to ask questions and when to just listen. Last but not least, I need to thank Jesse. Not only did he
survive organic chemistry in undergraduate with me but, also, every single day of graduate school. Day in
and day out he was someone to lean on and a driving force for when things weren’t exactly going my way
in lab. He was supportive and provided a constant relief from the stresses of graduate school, always
making me laugh and smile regardless of the situation. I can’t imagine having gone through my PhD without
his presence and support.
As they say “it takes a village” and, as evidence by this lengthy acknowledgments section, that
couldn’t be truer.
Acknowledgments of Support
This research was supported by the following grants: R.O’B., DK92589; D.A.J., DK081666 and
DK20593; J.-C.W., DK083591; O.P.M., DK043748 and DK078188; and A.C.P., DK72473, DK89572,
DK104211, the Department of Veterans Affairs and the JDRF. The Vanderbilt Hormone Assay & Analytical
Services Core and the Vanderbilt Islet Procurement and Analysis Core are both supported by NIH grant
P60 DK20593, to the Vanderbilt Diabetes Research Training Center and NIH grant DK59637, to the
Vanderbilt Mouse Metabolic Phenotyping Center. K. E. S. and L. D. P. were supported by the Vanderbilt
Molecular Endocrinology Training Program grant 5T32 DK07563.

iv
Table of Contents
Acknowledgments ........................................................................................................................................................... ii
Acknowledgments of Support .................................................................................................................................... iii
Abbreviations .................................................................................................................................................................. vi
List of Tables .................................................................................................................................................................. viii
List of Figures .................................................................................................................................................................. ix Chapter
I. Introduction .............................................................................................................................................................. 1 Diabetes Mellitus ...................................................................................................................................................................... 1
Type 1 Diabetes ................................................................................................................................................................... 1 Type 2 Diabetes ................................................................................................................................................................... 4
Discovery of Hepatic Glucose-6-phosphatase .............................................................................................................. 7 The Glucose-6-Phosphatase Gene Family ...................................................................................................................... 8
G6PC1 ...................................................................................................................................................................................... 8 G6PC3 .................................................................................................................................................................................... 11 G6PC2 .................................................................................................................................................................................... 12
The Identification of G6PC2 Single Nucleotide Polymorphisms (SNPs) that Regulate Fasting Blood Glucose in Humans ................................................................................................................................................................ 12 G6pc2 Function In Vivo ........................................................................................................................................................ 13 Characterization of Common G6PC2 SNPs ................................................................................................................... 23 Identification and Characterization of Rare SNP Variants..................................................................................... 27 Glucocorticoid Biology ......................................................................................................................................................... 28 Glucocorticoids Effect Glucose Metabolism in the Liver, Skeletal Muscle and White Adipose Tissue . 32 Glucocorticoids Effect Glucose Metabolism in Pancreatic Islets ......................................................................... 36 Hypothesis: Glucocorticoids Modulate G6pc2 Expression and Glucose Metabolism .................................. 39 Hypothesis: Rare G6PC2 SNPs Exist and Affect Protein Expression and Enzyme Activity ....................... 40
II. Materials and Methods ...................................................................................................................................... 41 Generation of G6pc2 KO Mice ............................................................................................................................................ 41 PCR Genotyping of G6pc2 KO Mice .................................................................................................................................. 42 Animal Care .............................................................................................................................................................................. 42 Phenotypic Analysis of Fasted WT and G6pc2 KO Mice .......................................................................................... 42 Intraperitoneal Glucose Tolerance Tests ..................................................................................................................... 43 Analysis of Glucose-Stimulated Insulin Secretion In Vivo ...................................................................................... 43 Dexamethasone Injection Paradigm .............................................................................................................................. 43 Physical Restraint Paradigm ............................................................................................................................................. 44 Mouse and Human Islet Isolation .................................................................................................................................... 44 Analysis of G6pc2 Gene Expression in Mouse Pancreata by Quantitative RT-PCR ...................................... 44 Electronic Health Record (EHR)-Based Phenotyping of Human Research Subjects ................................... 45 Site Directed Mutagenesis and Plasmid Preparation ............................................................................................... 45 Cell Culture ............................................................................................................................................................................... 46 SNP Databases ......................................................................................................................................................................... 46 G6PC1 Expression Vector Construction ........................................................................................................................ 46 G6pc1 and Pklr Fusion Gene Construction ................................................................................................................... 47 RNA Isolation and Quantification .................................................................................................................................... 47 Protein Expression Analysis by Transient Transfection, Western blotting and Luciferase Assays ...... 49 Fusion Gene Analyses ........................................................................................................................................................... 50

v
Gel Retardation Assays ........................................................................................................................................................ 50 Statistical Analyses ................................................................................................................................................................ 50
III. G6pc2 Modulates Fasting Blood Glucose in Male Mice in Response to Stress .............................. 52 Introduction ............................................................................................................................................................................. 52 Results ........................................................................................................................................................................................ 52
Dexamethasone Stimulates Human G6PC2 Expression ..................................................................................... 52 Dexamethasone Stimulates 129SvEv but not C57BL/6J Mouse G6pc2 Promoter Activity .................. 53 The Induction of G6pc2 in Response to Physical Restraint Modulates FBG in 129SvEv Mice ............ 56
Discussion ................................................................................................................................................................................. 58 IV. G6pc2 Modulates the Effects of Dexamethasone on Fasting Blood Glucose and Glucose Tolerance ..................................................................................................................................................................... 62
Introduction ............................................................................................................................................................................. 62 Results ........................................................................................................................................................................................ 62
The Glucocorticoid Receptor Stimulates G6PC2 Promoter Activity by Displacing MafA ...................... 62 The rs2232316 G6PC2 SNP has Opposite Effects on Basal and Dex-Stimulated Promoter Activity 64 G6pc2 Modulates the Effect of Dexamethasone on FBG and Glucose Tolerance in 129SvEv Mice ... 67 G6pc2 Also Modulates the Effect of Dexamethasone on FBG and Glucose Tolerance in C57BL/6J Mice ........................................................................................................................................................................................ 71
Discussion ................................................................................................................................................................................. 77 V. The Effect of G6pc2 Deletion on Body Weight and Fat Mass in Mice is Dependent on Diet, Genetic Background and Gender ......................................................................................................................... 81
Introduction ............................................................................................................................................................................. 81 Results ........................................................................................................................................................................................ 82
Analysis of the Effect of G6pc2 Deletion on Body Weight and Composition in Chow Fed 129SvEv Mice ........................................................................................................................................................................................ 82 Analysis of the Effect of G6pc2 Deletion on FBG and FPI in Chow Fed 129SvEv Mice ........................... 84 Analysis of the Effect of G6pc2 Deletion on Body Weight and Composition in High Fat Fed 129SvEv Mice ........................................................................................................................................................................................ 85 Analysis of the Effect of G6pc2 Deletion on FBG and FPI in High Fat Fed 129SvEv mice ..................... 88 Analysis of the Effect of High Fat Feeding on Glucose Tolerance in 129SvEv WT and G6pc2 KO Mice .................................................................................................................................................................................................. 90 Comparison of Pancreatic Expression of Key Genes in G6pc2 129SvEv and C57BL/6J Mice.............. 90 Analysis of the Effect of G6pc2 Deletion on Body Weight, FBG and FBI in High Fat Fed Mixed Genetic Background Mice .............................................................................................................................................. 92 Analysis of the Effect of G6pc2 Deletion on the Time Course of Changes in Plasma Insulin During an IPGTT ..................................................................................................................................................................................... 93 Analysis of the Effect of G6pc2 Deletion on Plasma Triglyceride and Cholesterol in 129SvEv, C57BL/6J and Mixed Genetic Background Mice ................................................................................................... 96 Analysis of the relationship between G6PC2 SNPs and metabolic parameters in humans using BioVU ..................................................................................................................................................................................... 96
Discussion .............................................................................................................................................................................. 100 VI. Analysis of the Effect of 11-Dehydrocorticosterone Treatment on C57BL/6J and 129SvEv WT and G6pc2 KO Mice ................................................................................................................................................ 105
Introduction .......................................................................................................................................................................... 105 Results ..................................................................................................................................................................................... 108
Analysis of FBG and Gene Expression from 11-DHC Treated C57BL/6J WT and G6pc2 KO Mice .. 108 Analysis of FBG and Gene Expression from 11-DHC Treated 129SvEv WT and G6pc2 KO Mice .... 111
Discussion .............................................................................................................................................................................. 111

vi
VII. Functional Analysis of Non-Synonymous Human G6PC2 Single Nucleotide Polymorphisms Using a Novel in situ Assay for Glucose-6-Phosphatase Activity ........................................................... 115
Introduction .......................................................................................................................................................................... 115 Results ..................................................................................................................................................................................... 116
Analysis of the Effect of Human G6PC2 Codon Variation on Protein Expression ................................. 116 Characterization of a Novel Assay for the Measurement of Glucose-6-Phosphatase Activity In Situ ............................................................................................................................................................................................... 118 Analysis of the Effect of Human G6PC2 SNPs on Glucose-6-Phosphatase Activity ............................... 126 Analysis of the Effect of Human G6PC2 SNPs on Protein Expression ........................................................ 133
Discussion .............................................................................................................................................................................. 135 VIII. Summary and Future Directions ............................................................................................................. 142
Thesis Summary .................................................................................................................................................................. 142 Further Studies to Elucidate the Role of G6pc2 in Pancreatic β-cells ............................................................. 144
Analysis of the Effect of Corticosterone Pellets in C57BL/6J and 129SvEv WT and G6pc2 KO Mice ............................................................................................................................................................................................... 147 Characterization of a β-cell Specific G6pc2 KO Mouse ..................................................................................... 149 Analysis of a Secondary Role of G6PC2 in Modulating Calcium Flux: Preliminary Data and Future Directions .......................................................................................................................................................................... 150 Analysis of a Secondary Role of G6PC2 in Preventing Hypoglycemia: Preliminary Data and Future Directions .......................................................................................................................................................................... 154
References .................................................................................................................................................................... 159
Abbreviations
β-cell Pancreatic islet beta cell(s)
11-DHC 11-Dehydrocorticosterone
11β-HSD 11β- hydroxysteroid dehydrogenase
11β-HSD1 11β- hydroxysteroid dehydrogenase type 1
11β-HSD2 11β- hydroxysteroid dehydrogenase type 2
BMI Body mass index
CAM Cardiovascular associated mortality
CBG Corticosteroid Binding Globulin
DEX Dexamethasone
DIO Diet induced obesity
FBG Fasting blood glucose
FPI Fasting plasma insulin
G6P Glucose-6-phosphate
G6Pase Glucose-6-phosphatase
G6PC1 Glucose-6-phosphatase catalytic subunit
G6PC2 Glucose-6-phosphatase catalytic subunit, member 2 (formerly IGRP)

vii
G6PC3 Glucose-6-phosphatase catalytic subunit, member 3 (formerly UGRP)
G6PT G6P translocase
GC Glucocorticoid(s)
GCK Glucokinase
GR Glucocorticoid receptor
GRE Glucocorticoid receptor element
GREV Glucocorticoid receptor expression vector
GSD1a Glycogen storage disease type 1a
GSIS Glucose stimulated insulin secretion
GWAS Genome wide association studies
HLA Human Leukocyte Antigen
HPA Hypothalmus-Pituitary-Adrenal Axis
IGRP Islet specific glucose-6-phosphatase catalytic subunit related protein
IPGTT Intraperitoneal glucose tolerance test
KATP ATP-sensitive potassium channel
KO Knockout
LCMV The Lymphocytic Choriomeningitis Virus
MODY Mature onset of diabetes of the young
NOD Non-obese diabetic
NFκB Nuclear Factor kappa B
OGTT Oral glucose tolerance test
PEPCK Phosphoenolpyruvate carboxykinase
PCR Polymerase chain reaction
PR Physical restraint
SD Synthetic derivative
SNP Single nucleotide polymorphism
T1D Type 1 diabetes
T2D Type 2 diabetes
UGRP Ubiquitously expressed G6Pase catalytic subunit related protein 3
WAT White adipose tissue
WB Western Blot
WT Wild type

viii
List of Tables
1.1 The glucose-6-phosphatase catalytic subunit gene family
1.2 Characterization of common G6PC2 single nucleotide polymorphisms associated with FBG
5.1 NMR Analysis of Female Chow Fed 129SvEv G6pc2 KO Mouse Body Composition
5.2 NMR Analysis of Male Chow Fed 129SvEv G6pc2 KO Mouse Body Composition
5.3. NMR Analysis of Female High Fat Fed 129SvEv G6pc2 KO Mouse Body Composition
5.4 NMR Analysis of Male High Fat Fed 129SvEv G6pc2 KO Mouse Body Composition 5.5 Association Between G6PC2 SNP rs560887 and Plasma Lipid Measurements Using Electronic
Health Record (EHR)-Derived Phenotype Analyses 6.1 Characterization of 14 week old male C57BL/6J WT and G6pc2 KO mice after 6 weeks of 11-DHC
supplementation.
6.2 Characterization of 14 week old male 129/SvEv WT and G6pc2 KO mice after 6 weeks of 11-DHC supplementation.
7.1 Comparison of Codon Usage in Human G6PC2 mRNA with Common Codon Usage in Human
mRNAs 7.2 Comparison of Codon Usage in Human G6PC2 mRNA with Common Codon Usage in Human
mRNAs. 7.3 Analysis of the Effect of Amino Acids Changed by Human G6PC2 SNPs on Human G6PC2 and Mouse
G6pc1 Protein Expression and Activity 7.4 Amino Acids in Human G6PC1 Whose Mutation Causes Glycogen Storage Disease Type 1a are
Highly Conserved in Mouse G6pc1, Mouse G6pc2 and Human G6PC2 7.5 Human G6PC2 SNPs that Alter Amino Acids that are not Conserved in Human G6PC2, Mouse
G6pc2, Human G6PC1 and Mouse G6pc1 7.6 Human G6PC2 SNPs that Cause Frameshift Mutations and Premature Termination

ix
List of Figures
1.1 Model of the glucose-6-phosphatase multicomponent enzyme system
1.2 G6Pase activity is absent from G6pc2 KO islets
1.3 Glucose cycling is absent from G6pc2 KO islets
1.4 Diagram depicting glucose stimulated insulin secretion (GSIS)
1.5 A leftward shift in the dose response curve for GSIS results in decreased fasting blood glucose in G6pc2 KO
1.6 A leftward shift in the dose response curve for GSIS results in enhanced insulin secretion from
G6pc2 KO 1.7 Analysis of GSIS in islets isolated from G6pc2 KO mice
1.8 Analysis of GSIS from perfused pancreas experiments in situ in G6pc2 KO mice
1.9 G6pc2 KO mice have significantly reduced FBG levels on a C57BL/6J background
1.10 G6pc2 KO mice have significantly reduced FBG levels on a mixed genetic background
1.11 Model predicting that the effect of glucocorticoid treatment is to increase FBG in WT and G6pc2 KO mice
1.12 Model predicting that the effect of glucocorticoid treatment is to increase FBG in WT and G6pc2
KO mice 1.13 Hypothalmic-pituitary-axis (HPA) signaling and regulation
1.14 Overview of the effects of glucocorticoids on liver, white adipose tissue and skeletal muscle
3.1 Dexamethasone Stimulates Human G6PC2 Expression.
3.2 Dexamethasone Stimulates 129SvEv but not C57BL/6J Mouse G6pc2 Promoter Activity.
3.3 The Induction of G6pc2 in Response to Physical Restraint Modulates FBG and Glucose Tolerance in 129SvEv Mice
4.1 The Glucocorticoid Receptor Stimulates G6PC2 Promoter Activity by Displacing MafA
4.2 Gel Retardation Competition Assay with Maf Mutants
4.3 Dexamethasone Stimulates G6PC2 Promoter Activity in Multiple Islet-Derived Cell Lines
4.4 Dexamethasone Does Not Stimulate Fkbp or Sgk Gene Expression in Multiple Islet-Derived Cell Lines

x
4.5 The rs2232316 G6PC2 SNP has Opposite Effects on Basal and Dex-Stimulated Promoter Activity 4.6 Chronic Dexamethasone Treatment Stimulates Pancreatic G6pc2 Gene Expression in 129SvEv
Mice 4.7 G6pc2 Modulates the Effect of Dexamethasone on FBG and Glucose Tolerance in 129SvEv Mice 4.8 Chronic Dexamethasone Treatment Stimulates Pancreatic G6pc2 Gene Expression in C57BL/6J
Mice 4.9 Mechanisms of G6pc2 Gene Regulation in C57BL/6J and 129SvEv Mice 4.10 The Induction of G6pc2 by Dexamethasone Modulates FBG and Glucose Tolerance in C57BL/6J
Mice 4.11 Diagram of Changes in Glucose Levels Following Injection 5.1 Effect of G6pc2 Deletion on Metabolic Parameters in Chow Fed 129SvEv Mice
5.2 Effect of G6pc2 Deletion on Body Weight, Composition and Metabolic Parameters in High Fat Fed 129SvEv Mice
5.3 Comparison of Pancreatic G6pc2 Expression in 129SvEv and C57BL/6J Mice
5.4 Effect of G6pc2 Deletion on Body Weight and Metabolic Parameters in High Fat fed Mixed Background Mice
5.5 Effect of G6pc2 Deletion on the Time Course of Changes in Plasma Insulin During an IPGTT
5.6 Effect of G6pc2 Deletion on Plasma Triglyceride in 129SvEv, C57BL/6J and Mixed Genetic Background Mice
5.7 Effect of G6pc2 Deletion on Plasma Cholesterol in 129SvEv, C57BL/6J and Mixed Genetic
Background Mice 6.1 11β-HSD1 Modulates Glucocorticoid Metabolism in the Islet β-cell
6.2 11-DHC Treatment Improves the Glucose Tolerance of C57BL/6J WT and G6pc2 KO Mice
6.3 Analysis of G6pc2 and G6pt Gene Expression in 11-DHC treated C57BL/6J WT Mice
6.4 Analysis of FBG in 11-DHC treated C57BL/6J WT and G6pc2 KO Mice
6.5 11-DHC Treatment in 129SvEv mice improves glucose tolerance in G6pc2 KO mice
6.6 Analysis of G6pc2 and G6pt Gene Expression in 11-DHC treated 129SvEv WT Mice
6.7 Analysis of FBG in 11-DHC treated 129SvEv WT and G6pc2 KO Mice

xi
7.1 Analysis of Human G6PC2 and Mouse G6pc2 mRNA and Protein Expression
7.2 Analysis of Human G6PC2:Mouse G6pc2 Chimeric Protein Expression
7.3 Analysis of the Effect of Human G6PC2 Codon Variation on Protein Expression
7.4 Glucose-Regulated Fusion Gene Expression in 832/13 Cells 7.5 Overexpression of G6pc1 Suppresses Glucose-Stimulated Fusion Gene Expression in 832/13 Cells
7.6 Conservation of Amino Acids Between Human G6PC2, Mouse G6pc2, Human G6PC1 and Mouse G6pc1
7.7 Analysis of the Effect of Amino Acid Changes on Mouse G6pc1 Protein Expression
7.8 Analysis of the Effect of Amino Acid Changes on Mouse G6pc1 Protein Expression
7.9 Analysis of the Effect of Human G6PC2 SNPs on Human G6PC2 Protein Expression
8.1. C57BL/6J G6pc2 HET Mice Have Improved Glucose Tolerance Using a 0.75 g/kg Glucose Dose
8.2. 129SvEv G6pc2 HET Mice Have Improved Glucose Tolerance Using a 2.0 g/kg Glucose Dose 8.3. Glucose Tolerance is the Same Between WT, HET and KO C57BL/6J Mice Using a 2.0 g/kg Glucose
Dose 8.4. FBG is Not Reduced in 18hr Fasted C57BL/6J G6pc2 KO Mice 8.5. FBG is Not Reduced in 18hr Fasted 129SvEv G6pc2 KO Mice 8.6. FPI Levels Are Trending Higher in 18hr Fasted C57BL/6J G6pc2 KO Mice 8.7. FPI Levels Are Trending Higher in 18hr Fasted 129SvEv G6pc2 KO Mice 8.8. 18hr Fasted C57BL/6J G6pc2 KO Mice Have Significantly Elevated Plasma Corticosterone Levels 8.9. 18hr Fasted 129SvEv G6pc2 KO Mice Have Similar Plasma Corticosterone Levels

1
I. INTRODUCTION
Diabetes Mellitus
According to the World Health Organization, as of 2014, approximately 347 million people
worldwide have diabetes and this number is expected to steadily increase, as it has over the last 30 years.
It is predicted that by 2030, diabetes will be the 7th leading cause of death worldwide. While diabetes
typically results in a cardiovascular event, which will ultimately kill 50-80% of the diabetic population,
diabetes mellitus is also the leading cause of amputation, blindness and kidney failure [1]. There is a
pressing need for new and improved treatments and modes of preventing diabetes, as it has become an
epidemic that continues to affect millions of humans while also costing the world billions of dollars
annually. The next two sections will focus on the two major forms of diabetes: type 1 and type 2 diabetes
(T1D and T2D).
Type 1 Diabetes
While there are similarities between T1D and T2D, they are fundamentally different diseases; this
section will focus specifically on the etiology of T1D and models for studying its onset and progression.
T1D is the less common form of diabetes, accounting for 10% of the 347 million diabetes diagnoses
worldwide [1]. As T1D generally presents at an earlier age than T2D, with the average age of onset being
14, it is also referred to as juvenile or childhood onset diabetes. Patients will most often have symptoms of
excessive urination, thirst, and hunger, which are all results of chronic hyperglycemia [2]. T1D is a chronic
autoimmune disease that occurs as a result of genetic susceptibility paired with environmental factors.
More specifically, T1D is an autoimmune disorder that results in specific destruction of the insulin
producing islet beta cells (β-cells) and ultimately the ability to make and secrete insulin. Without insulin,
the body is unable to maintain normal glycaemia and, untreated, this can lead to both hyper- and
hypoglycemia [3]. Most often, progression of T1D begins with a genetically susceptible individual being
exposed to a specific environmental trigger that promotes a pro-inflammatory state, which is associated

2
with the production of autoantibodies that results in T-cell mediated destruction of β-cells and ultimately
T1D diagnosis. Patients with T1D are treated by exogenous administration of insulin either via injection or
a subcutaneous pump. This treatment requires a great deal of discipline, as glucose levels must be
monitored throughout the day for the remainder of the patient’s life in order to maintain normal glycaemia.
While the genetics of T1D have been extensively characterized, the environmental triggers leading to
progression of the disease remain to be identified. The following section will focus on the implicated and
characterized susceptibility genes in T1D.
T1D is a polygenic disorder with 40 currently known loci that affect disease susceptibility. Since the
early 1970’s the Human Leukocyte Antigen (HLA) region on chromosome 6p21 has been implicated as a
critical susceptibility locus for many autoimmune diseases, including T1D. Variation in this region accounts
for the most significant association signal between T1D risk and development, accounting for about half of
the genetic susceptibility of T1D, with an odds ratio of 6.8 [2, 3]. Despite many other susceptibility loci
being identified, none have an association signal as significant as the signal between the HLA locus and T1D
[3]. The other main identified loci that associate with T1D are in the insulin, PTPN22, CTLA-4 and IL2RA
genes. The insulin gene has been established as a primary autoantigen in T1D and, as insulin is produced
exclusively in the pancreatic islet β-cell, the mechanism by which these mutations result in T1D is obvious,
directly relating to the body’s ability to produce insulin and death of the β-cell population. Of the remaining
loci that have been implicated, the mechanisms by which variation at that location contribute to T1D relate
to deficiencies in an individual’s immune response or aberrant signaling in immune response pathways
[2]. Additionally, with the advent of genome wide association studies (GWAS), other loci have been
identified that make a modest contribution to overall T1D risk. As previously mentioned, the specific
environmental triggers that lead to T1D onset and progression are unclear and indirect. There are reports
of certain viral infections and chemical exposures, the composition of an individual’s gut bacteria and
vitamin D deficiency all associating with T1D diagnosis [3]. While environmental triggers and susceptibility
loci have been identified, the relation between the two and T1D still remains elusive.

3
There are multiple models that are used to study T1D. The most commonly used genetic model is
the non-obese diabetic (NOD) mouse, which is characterized by insulitis and leukocyte infiltration of the
pancreas, resulting in decreased insulin content and β-cell mass as early as 12 weeks after birth [4].
Interestingly, by studying the progression of T1D in NOD mice, researchers discovered that a population
of T-cells isolated from diabetic NOD mice target the β-cell specific protein glucose-6-phosphatase catalytic
subunit, member 2 (G6pc2), formerly known as islet specific glucose-6-phosphatase catalytic subunit
related protein (IGRP) [5]. It was further established that G6PC2 is also a T1D autoantibody in humanized
mice and humans [6-8]. Further studies found that deletion of G6pc2 from NOD mice does not prevent or
slow the progression of T1D. This finding suggests that T-cell recognition of G6pc2 autoantibodies is not
necessary for T1D development and instead is a secondary, downstream event in the progression of T1D
[9]. Another commonly used model to study the progression of T1D is the Akita mouse model. These mice
have a spontaneous autosomal dominant deletion on chromosome 7 that results in defective protein
folding and an inability to induce the unfolded protein response pathway. This results in endoplasmic
reticulum (ER) stress and β-cell apoptosis, ultimately resulting in T1D [10]. A final method that is used to
study T1D is the Lymphocytic Choriomeningitis Virus (LCMV) model. This involves injecting susceptible
mouse strains with LCMV which results in a rapid T-cell mediated targeting of β-cells and thus the inability
to produce and secrete insulin [11]. Using these models, the pathogenesis of T1D has successfully been
studied; yet, despite the detailed characterization of T1D progression and multiple genetic susceptibility
loci being identified, methods of preventing T1D onset or progression have not been discovered.
Another model that is commonly used to characterize the effects of β-cell destruction on glucose
metabolism is a chemical model in which mice are treated with streptozotocin or alloxan, both of which
are cytotoxic glucose analogs. Treatment with these toxins results in selective destruction of the islet β-
cells and ultimately diabetes, however, the progression of disease in these models relative to that in T1D is
different in that there is not an autoimmune response [12]. While treatment with these drugs does not
result in an autoimmune response, they do ablate the β-cell such that insulin production, and therefore
4
secretion, does not occur, similar to T1D and therefore provides an alternative model for studying the
effects of β-cell destruction on glucose metabolism.
Type 2 Diabetes T2D is the most common form of diabetes, accounting for the remaining ~90% of diabetes
diagnoses. It is characterized by hyperglycemia, insulin resistance, and comparative insulin deficiency [13].
Clinically, it is diagnosed with a glycated hemoglobin test, an indicator of average blood sugar levels over
time, above 6.5% or a glucose level in an oral glucose tolerance test (OGTT) over 200mg/dl two hours post
injection [14]. Importantly, T2D is almost entirely preventable with lifestyle factors being the major
component in determining T2D risk [15]. It is well established that lack of physical activity, cigarette
smoking, excessive alcohol consumption and obesity contribute to the development of T2D. Currently, it is
predicted that ~55% of T2D cases are linked to obesity [15]. While there is a population of non-obese
individuals diagnosed with T2D, this is presumably due to the loss of β-cells that naturally occurs with age.
Treatment for T2D patients typically includes lifestyle interventions, oral medication and potentially
exogenous insulin treatment. Two of the most common oral medications are glipizide and metformin.
Glipizide, a sulfonyurea, acts to increase insulin secretion from the pancreas and metformin, a biguanide,
decreases blood glucose levels by increasing muscle insulin sensitivity and limiting glucose production
from the liver [16]. Despite the effects of metformin being clear and being the most common and frequently
prescribed T2D drug, researchers have not been able to reach a consensus regarding its primary site of
action. However, Buse et al. recently showed that the gut is the primary site of action [17]. Metformin
accumulates at 300 times the concentration of plasma in the gut and this accumulation results in enhanced
GLP-1 and peptide YY secretion. These hormones have glucose-lowering effects via reduction of hepatic
glucose production through suppression of glucagon and enhanced glucose dependent insulin secretion,
thereby providing a site of action and mechanism by which metformin lowers blood glucose levels [17].

5
Because obesity is the main risk factor for T2D, researchers have established multiple induced and
genetic mouse models of obesity to study the disease. One of the most commonly used models to study the
effect of obesity in mice is the diet induced obesity (DIO) model, which involves feeding mice high fat food
in lieu of standard chow diet in order to induce obesity and, typically, impaired glucose tolerance. Male
C57BL/6J mice fed 12+ weeks of high fat food mimics human metabolic syndrome, as defined as having
hyperglycemia, increased blood pressure, excess body fat and increased cholesterol levels [18]. High fat
feeding is a very common model for studying impaired glucose tolerance in the context of obesity; one
observation in these studies is that there is inherent variability in responses between inbred mouse strains,
resulting in differences in the degree of obesity, insulin resistance and impairment in glucose tolerance and
alterations to plasma lipid composition among other parameters [19-22]. For example, AKR/J and
C57BL/6J mice are hyper-responsive to DIO, becoming significantly obese, while SWR/J and, as will be
shown in chapter V, 129SvEv mice are relatively resistant to DIO [19]. These results highlight the
importance of genetic modifiers in different mouse genetic backgrounds.
In addition to the DIO model, there are multiple genetic models of T2D. The two most common
genetic models are the leptin deficient (ob/ob) and leptin receptor deficient (db/db) knockout (KO) mouse
models. The ob/ob mouse model, when bred on the KsJ genetic background, exhibits severe hyperphagia,
which leads to obesity, insulin resistance and dyslipidemia, ultimately resulting in spontaneous
development of impaired glucose tolerance [23-27]. Interestingly, when the ob/ob mutation is backcrossed
on to the C57BL6/J genetic background, the same phenotype is not observed and T2D does not occur [28].
Similar to the ob/ob mouse model, the db/db mouse model also exhibits hyperphagia, insulin resistance,
dyslipidemia and impaired glucose tolerance [23, 25-27].
A final model to study impaired glucose tolerance in mice involves administering the S961 insulin
receptor antagonist. Mice treated with S961 are hyperinsulinemic, insulin resistant, glucose intolerant and
hyperglycemic [29]. This is due to the inability of insulin to transduce its signal, and subsequently, lower

6
blood glucose levels. While there are other genetic models available to study impaired glucose tolerance in
vitro in mice, these are the most commonly used and best characterized.
Although development of T2D is primarily attributed to lifestyle factors, there is also a genetic
component. Individuals who have a relative with T2D have a ~25% chance of developing the disease [13].
Through advances in GWAS, many genetic loci have been identified that associate with altered risk of T2D
development. Although a majority of the identified mutations occur in non-coding regions of the genomes,
making it difficult to determine their function, these studies have also identified mutations in the GCK, IRS1,
HNF1B, TCF7L2, PPARG, FTO, KCNJ11, NOTCH2, WFS1, CDKAL1, IGF2BP2, SLC30A8, JAZF1 and HHEX genes,
among others [13, 15]. The clinical relevance of some of these signals remains to be determined but the
mechanism behind others, such as GCK and KCNJ11 are clearer, relating to β-cell dysfunction and/or
improper insulin secretion [13, 15]. Specifically, mutations in KCNJ11, which encodes the Kir6.2 subunit of
the ATP sensitive potassium channel (KATP), result in diabetes [30]. These patients have impaired insulin
secretion caused by a failure of the KATP channel to close in response to increased cytoplasmic ATP [30].
These patients can be treated with sulfonylureas that specifically act to close the KATP channel [30].
In addition to mutations that increase the risk of developing T2D, multiple genetic mutations have
been identified that lead to monogenic forms of diabetes namely mature onset diabetes of the young
(MODY). MODY is a third subset of diabetes that is 50% heritable and arises from a mutation in multiple
genes, with the most common mutations being in HNF1A or GCK [31]. As of 2015, there are 28 distinct gene
mutations that can result in monogenic diabetes, highlighting the fact that MODY is a multifactorial
polygenic disease. Like T2D patients, MODY patients cannot produce adequate levels of insulin and
subsequently become hyperglycemic and insulin resistant [31]. Overall, it is evident that the environment,
genetics and the interactions between the two plays a significant role in diabetes risk. Only with better
understanding of the underlying mechanisms governing normal glucose homeostasis and insulin secretion
will more effective drugs be established to treat or prevent T2D.
7
Discovery of Hepatic Glucose-6-phosphatase
The liver plays a key role in regulating whole body glucose homeostasis by acting as a metabolic
hub and providing key metabolites to other tissues. As the brain, under basal conditions, accounts for the
vast majority (~60%) of glucose metabolism and skeletal muscle, following glucose stimulation, accounts
for ~75% of glucose utilization, it is crucial that metabolite levels in the blood are tightly maintained by
the liver so as to provide adequate energy in both basal and post-prandial states [32, 33]. In the post-
prandial state, glucose is taken up by the liver and converted to glucose-6-phosphate (G6P), which is either
metabolized through glycolytic or pentose phosphate pathways for immediate energy production or, in
times of excess dietary glucose, can be stored as glycogen. When dietary glucose is not available, such as
during a prolonged fast or in a pre-prandial state, the liver breaks down glycogen via glycogenolysis and/or
produces glucose from the gluconeogenic precursors glycerol, amino acids and lactate. Because the
terminal step in both gluconeogenesis and glycogenolysis generates G6P, it was postulated that there must
be an enzyme that de-phosphorylates G6P to create glucose and a free phosphate, thereby driving this
mechanism in the opposite direction to increase or modulate blood glucose levels [34]. While isolation and
identification of this enzyme was difficult due to its localization in the ER membrane, Chou and colleagues
successfully identified the gene that encodes the enzyme by irradiating mice to induce chromosomal
deletions at the albino locus [35-37]. These mice were hypoglycemic and died shortly after birth due to
reduced gluconeogenic activity caused specifically by decreased glucose-6-phospatase (G6Pase) activity
[35-37]. Using these mice, Chou et al. screened a murine cDNA library with cDNA probes to both wild type
(WT) and mutant mice and were able to successfully isolate a glucose-6-phosphatase catalytic subunit
(G6PC1) cDNA [36, 38]. Upon isolation, it was further confirmed that G6PC1 mRNA is expressed in the liver
and kidney primarily, with low expression detected in the small intestine [36, 39, 40]. Further
characterization of this enzyme has established that G6PC1 is a component of the G6Pase multi-component
enzyme system located in the ER membrane with an active site facing the ER lumen (Fig. 1.1) [41]. The
8
liver G6Pase system is comprised of a glucose transporter, a G6P/Phosphate transporter (G6PT), encoded
by the SLC37A4 gene, and a catalytic subunit, G6PC1 (Fig. 1.1). The system functions by G6P entering the
ER lumen through G6PT where, once in the ER lumen, the catalytic subunit catalyzes the hydrolysis of G6P
to glucose and an inorganic phosphate (Pi)(Fig. 1.1) [42]. The following sections will describe the G6Pase
system in greater detail.
The Glucose-6-Phosphatase Gene Family
The G6Pase catalytic subunit gene family is composed of three members which mainly differ in their
tissue expression pattern and activity: G6PC1 (formerly G6Pase), G6PC2 (formerly IGRP), and G6PC3
(formerly UGRP) (Fig. 1.1 and Table 1.1). Table 1.1 highlights key features of the G6Pase catalytic subunit
gene family. Briefly, G6PC1 is primarily expressed in the liver, G6PC2 is exclusively expressed in islet β-
cells and G6PC3 is almost ubiquitously expressed with the exception of in islet β-cells (Table 1.1) [42]. The
G6PC1 and G6PC3 genes are located on chromosome 17 while the G6PC2 gene is located on chromosome 2
(Table 1.1). All three genes encode transmembrane ER proteins that are predicted to have 9
transmembrane domains with similar topology [42] (Table 1.1). The other major differences between
these isoforms are their enzymatic activity (Table 1.1) and roles in human health and disease, which will
be discussed in greater detail in the following sections.
G6PC1
Liver G6PC1 functions as the terminal step in both glycogenolysis and gluconeogenesis. G6PC1 is
the most catalytically active isoform of the G6Pase gene family (Table 1.1). Due to its high activity in the
liver and role in glucose homeostasis, it is no surprise that mutations of G6PC1 that decrease activity result
in human disease, namely glycogen storage disease type 1a (GSD1a). Most frequently, GSD1a patients
present with severe hypoglycemia, hyperlipidemia, hyperuricemia and lactic acidemia, although they are
also prone to growth retardation, renal failure, hepatic steatosis, cirrhosis and adenomas [43]. Chou and
Mansfield have extensively characterized G6PC1 mutations identified in human Gsd1a patients [43, 44].

9
There are two other forms of glycogen storage disease, type 1b and type 1c, which occur as a result of
mutations in the genes that encodes G6PT, SLC37A4 (Fig 1.1). Gsd1b and Gsd1c, despite having mutations
in the same gene, differ by whether the patients exhibit symptoms consistent with defective glucose
transport or phosphate transport, respectively. Despite having a different defect in the G6Pase system, the
patients have similar hepatic dysfunctions as GSD1a patients as well as dysfunctional neutrophils, which
results in an increased susceptibility to bacterial infection [45]. Due to the observation that mutations in
G6PC1 or G6PT result in reduced G6Pase activity, and leads to glycogen storage diseases, it is obvious that
the G6Pase system is critical to maintaining glucose homeostasis.
Finally, increased hepatic G6PC1 activity and expression is also a characteristic of T1D and T2D.
Multiple groups have detected a 2-4 fold increase in G6pc1 mRNA levels and a 2-3 fold increase in hepatic
glucose-6-phosphatase activity from rodents and humans with diabetes [46-48]. The most likely
explanation for this observation is, presumably, due to a reduction in insulin secretion, relative (T2D) or
absolute (T1D). Further analysis of the mechanism causing decreased G6PC1 activity following insulin
treatment revealed that insulin signaling regulates G6PC1 gene transcription through an HNF-1 and two
FOXO1 transcription factor binding sites that make up an insulin response unit [49-52]. Insulin decreases
G6PC1 transcription by targeting FOXO1, such that it is excluded from the nucleus and can’t bind the G6PC1
promoter to induce transcription. Thus, in the diabetic state where insulin signaling is altered and
relatively (or absolutely as in T1D) decreased, there is an inappropriate elevation of G6PC1 transcription,
which contributes to elevation of blood glucose and thus further contributes to the pathogenesis of T2D
[49-52].

10
Figure 1.1. Model of the glucose-6-phosphatase multicomponent system [53]. The G6Pase system is composed of a glucose-6-phosphate transporter, a phosphate transporter and a catalytic subunit. The system functions by hydrolyzing G6P to glucose and a free phosphate.
Table 1.1. The glucose-6-phosphatase catalytic subunit gene family
Gene G6PC1 (G6Pase) G6PC2 (IGRP) G6PC3 (UGRP)
Tissue Liver Islet β-cells Ubiquitous
Size 357 AA 355 AA 346 AA
% Identity 100 50 36
Chromosome 17q21 2 17q21
Location ER ER ER
# Transmembranes 9 9 9
Substrate G6P G6P G6P
Vmax (nmol/mg/min) 666.7 32 108.7
Km (mM) 2.5 0.45 2
11
These observations were further supported by studies in vitro that showed a 2.5 fold increase in G6PC1
activity from microsomes isolated from diabetic rat livers, which was accompanied by decreased hepatic
glycogen stores. This affect was reversed with the administration of insulin [54]. In conclusion, G6PC1
expression and activity need to be tightly regulated in order to maintain normal whole body glucose
homeostasis.
G6PC3
G6PC3, the third isoform of the glucose-6-phosphatase gene family, was discovered by a BLAST
search against human G6PC2. G6PC3, formerly known as ubiquitously expressed G6Pase catalytic subunit
related protein 3 (UGRP), as the name alludes, is ubiquitously expressed but at relatively higher levels in
the heart, skeletal muscle, brain and kidney [55]. Further characterization of the cDNA and protein
sequence showed that it has the same predicted topology and function as G6PC1 and G6PC2, however
hydrolysis of G6P by G6PC3 in transient transfection assays has been unsuccessful [56]. Two groups were
successful in demonstrating its hydrolase activity in COS7 cells via stable [57] or adenoviral transfections
[58-60]. These groups estimated the VMAX of G6PC3 to be one sixth of G6PC1, yet with similar KM values
(Table 1.1) [58, 59, 61]. Analysis of G6pc3 KO mice showed that deletion of G6pc3 impairs G6P hydrolysis
in brain and testis homogenates [61] and leads to defective neutrophil and macrophage function, resulting
in neutropenia [60, 62]. These data support human studies that associate loss of G6PC3 function with
congenital neutropenia [60, 63]. One hypothesis explaining the dysfunctional neutrophil and macrophage
phenotype is that in the absence of G6pc3, there is an inadequate supply of energy due to inadequate
recycling of ER glucose back to the cytoplasm [64]. However, this hypothesis is not consistent with the
previous observation that patients with mutations in SLC37A4 (G6PT) have GSD1b and 1c. These mutations
limit G6P entry into the ER, leaving glucose in the cytoplasm for energy usage, opposite of what is expected
in G6pc3 KO mice, yet they still are diagnosed with GSD. Therefore, this contradiction regarding the

12
mutations in G6PT versus mutations in G6PC3 and the mechanisms linking G6PC3 to neutropenia remains
to be determined.
G6PC2
Arden et al. successfully cloned G6pc2 from mouse insulinoma tissue [65]. G6PC2 is ~50% identical
to G6PC1, having similar predicted topologies, conservation of catalytically important residues and an ER
retention signal [65]. Historically, many groups struggled to demonstrate G6P hydrolysis following
overexpression of either human or mouse G6pc2 [55, 58, 65, 66]. Only one group was successful; Petrolonis
et al. demonstrated that mouse G6pc2 has 20-40 fold lower activity than G6PC1 when overexpressed in
COS7 cells [67]. While determination of the specific activity of G6PC2 and its contribution to glucose cycling
was controversial, recent data from Wall et al., obtained using a novel stable isotope method, has predicted
the activity of mouse G6pc2 to be greater than previously appreciated [68]. They demonstrated that
glucose cycling, as defined by the rate glucose is converted to G6P and back to glucose, occurs at ~16% of
net glucose uptake at a submaximal concentration of 5mM glucose in islets isolated from chow fed mice
[68]. Importantly, when G6pc2 KO islets were examined, glucose-6-phosphatase activity and glucose
cycling was abolished (Fig. 1.2 and 1.3). These data confirm that G6pc2 is the major isoform in pancreatic
β-cells acting to hydrolyze G6P [68, 69]. The role of G6pc2 function in vivo and in human disease will be
discussed in greater detail in the following sections.
The Identification of G6PC2 Single Nucleotide Polymorphisms (SNPs) that Regulate Fasting Blood Glucose
in Humans
Elevated fasting blood glucose (FBG) has been associated with increased risk for the development
of T2D and cardiovascular associated mortality (CAM) [70-72]. Previous studies have shown that an
increase in FBG of ~9-18 mg/dl is associated with a 30% increased risk of mortality [71], while a reduction
in FBG of ~9 mg/dl is associated with a 25% reduction in mortality [72]. In an effort to identify genes
associated with variations in human FBG, multiple groups performed GWAS. To date, these studies have

13
identified single nucleotide polymorphisms (SNPs) in over 50 loci that are associated with FBG variation,
many of which are also associated with altered risk of T2D [73, 74]. Notably, the rs560887 SNP located in
the intronic region of the G6PC2 locus has been identified as the strongest common genetic determinant of
FBG levels in terms of significance and effect size, accounting for about one percent of total variance of FBG
in humans [73, 75-78] (Table 1.2). GWAS also identified three additional common promoter SNPs in high
linkage disequilibrium with rs560887 (rs13431652, rs2232316 and rs573225) as potentially causative
with respect to variations in FBG [79-83]. In vivo mouse models have further confirmed the function of
G6pc2 in regulating FBG and GSIS, which will be discussed in later sections [69]. The goal of the studies
described within this thesis is to provide further evidence of the role of G6pc2 in modulating FBG and GSIS.
G6pc2 Function In Vivo
While the liver, and to a lesser extent the kidney, are the main glucose producing organs, the
presence of G6Pase catalytic subunit isoforms and glucose-6-phosphatase activity in other tissues and cell
types, including the pancreatic β-cell, highlights the role of the G6pase system in modulating glucose
metabolism in other tissues [78, 84]. As such, there has been growing appreciation for the contribution of
other cell types to modulating glucose metabolism and whole body glucose homeostasis. With the finding
that glucose-6-phosphatase activity is present in islet β-cells, it was hypothesized that glucose-6-
phosphatase activity in the islet β-cell could act as a negative regulator of GSIS by opposing the actions of
glucokinase (GCK) [69, 85].
Canonical GSIS is depicted in Figure 1.4. Briefly, GSIS occurs when blood glucose levels increase,
such as after a meal. As glucose levels increase, glucose enters the β-cell through the bidirectional GLUT2
glucose transporter. GCK phosphorylates glucose to create G6P, which is metabolized by the glycolytic
pathway and tricarboxylic acid cycle (TCA) in the mitochondrion (Fig. 1.4).

14
Figure 1.2. G6Pase activity is absent from G6pc2 KO islets [69]. Glucose-6-phosphatase activity was compared in two independent islet preparations isolated from G6pc2 WT and KO mice. The results show mean glucose-6-phosphatase activity ± SD [69].
Figure 1.3. Glucose cycling activity is absent from G6pc2 KO islets [68]. Glucose cycling in WT or G6pc2 KO islets isolated from chow-fed mice and incubated in 11 mmol/L D7-glucose. WT islets n = 10; KO islets n = 8 incubations of 100 islets. *P < 0.05 vs. WT islets [68].
0
1
2
3
4
WT KO
Glu
cose
-6-P
ho
sph
ata
se
Act
ivit
y (
nm
ol/
min
/m
g)

15
Metabolism of G6P to pyruvate in the mitochondrion increases cytoplasmic ATP levels and consequently
increases the ATP:ADP ratio, which causes a closure of KATP channels. Decreased potassium influx into the
β-cell results in depolarization of the β-cell membrane and opening of the voltage-gated calcium channels
to promote calcium influx into the cytoplasm. As intracellular calcium increases, the exocytotic machinery
is activated and promotes the fusion of insulin secretory vesicles with the cellular membrane, subsequently
resulting with insulin secretion [86, 87]. However, the presence of G6PC2 in β-cells provides an alternate
fate for G6P in addition to being metabolized by the mitochondrion (Fig. 1.4). Specifically, G6P can be
hydrolyzed to glucose by G6PC2, creating a futile cycle with GCK, thereby modulating the FBG without
affecting fasting plasma insulin (FPI) levels (Fig. 1.5). Therefore, as depicted in Figure 1.5, we predict that
in the absence of G6pc2 there is a leftward shift of the dose response curve for GSIS. This shift in the dose
response curve is predicted to decrease FBG in KO mice (Fig. 1.5). Moreover, activation of G6PC2 is
expected to produce less ATP per glucose and, therefore, a relative decrease in the cytoplasmic ATP:ADP
ratio. This decrease in the cytoplasmic ATP:ADP ratio is predicted to diminish GSIS (Fig. 1.6) [69]. Figure
1.6 predicts that islets from G6pc2 KO mice will secrete more insulin at a submaximal dose of glucose
relative to WT. While a futile cycle is inefficient in terms of energy usage, this system allows for the set
point of FBG to be modulated while also regulating GSIS at two points, GCK and G6PC2 [88, 89].
Before determining the mechanism by which G6PC2 modulates FBG and GSIS, groups wanted to
determine if β-cell glucose cycling occurs at a sufficient rate to counteract GCK and ultimately affect GSIS.
Khan et al. initially estimated glucose dephosphorylation to occur at a rate of 3-4.5% of phosphorylated
glucose in healthy rat islets, 40% in ob/ob islets and 15.7% in streptozotocin-induced diabetic islets [84,
90]. Another group found evidence of glucose-6-phosphatase activity in islets isolated from rats but they
suggested that the level of glucose cycling occurred at too low of rate to significantly affect GSIS [91]. There
are several important caveats to these rat studies.

16
Figure 1.4. Diagram depicting glucose-stimulated insulin secretion (GSIS). Glucose enters the cell through the Glut2 glucose transporter where once in the cell it is converted to glucose-6-phosphate by glucokinase. G6P is then metabolized via the glycolytic pathway and TCA cycle. This increases the ATP:ADP ratio , resulting in an opening of the ATP sensitive potassium channel and depolarization of the cell membrane and opening of the voltage dependent sensitive calcium channel, an influx of calcium into the cytoplasm and ultimately insulin secretion. G6PC2 acts to oppose glucokinase, creating a futile glucose cycle where glucose is converted to G6P by glucokinase and back to glucose by G6PC2. Adapted from [53].
Fig 1.5. A leftward shift in the dose response curve for GSIS results in decreased FBG in G6pc2 KO. Deletion of G6pc2 will result in a leftward shift of the dose response curve for GSIS and enhanced sensitivity to glucose. This will further result in decreased FBG in G6pc2 KO mice without a difference in FPI levels. The first is that G6pc2 is a pseudogene in rats [66]. Instead, as G6PC1 has been detected in rat islets, it is
hypothesized that glucose cycling in rat islets is G6pc1 mediated [66]. A second caveat is that the rat islets
G6PC2 May Regulate Pancreatic Islet Beta Cell
Glucocorticoid Metabolism
G6P G6P
PiGlucose
Ca2+Ca2+
Corticosterone(Cortisol)
G6PC2
G6PT
SERCA
ER
6PG
NADP+ NADPH
11-Dehydrocorticosterone(Cortisone)
6PG: 6-phosphogluconolactone; H6PD: Hexose-6-phosphate dehydrogenase11b-HSD1: 11b-Hydroxysteroid dehydrogenase type 1
H6PD
11b-HSD1

17
were cultured in low glucose. This is important because glucose stimulates G6pc1 gene transcription [92-
94], indicating that in low glucose there would be low G6pc1 expression and thus activity would be
expected to be relatively low. The final caveat relates to the use of radioisotopes to study glucose cycling.
These studies yielded very low glucose cycling rates, which can be interpreted as minimal glucose cycling
occurring, or alternatively, that there are technical issues regarding these radiotracer studies is islets [90,
95]. These estimates may be inaccurate because G6PC2 could modulate GSIS independently of its ability to
hydrolyze G6P, which would not be reflected in radiotracer assays. Moreover, because G6PC2 modestly
affects glucose cycling in pancreatic islets [90, 95], has ∼40-fold lower G6Pase activity relative to G6PC1
[67, 69] and, finally, it possesses a phosphatidic acid phosphatase domain [55], a method that is more
sensitive than radiotracer studies may need to be used in order to identify the contribution of G6pc2 to
glucose cycling. To overcome the pitfalls of radiotracer studies, more recently, Wall et al. developed a stable
isotope methodology to estimate the influence of G6PC2 on glucose cycling. Using this approach, they
demonstrated higher levels of glucose cycling than has previously been reported. These studies showed
that glucose cycling occurred at a rate of 16% net glucose uptake when measured from islets incubated in
5mM glucose and up to 40% when measured from islets incubated in 11mM glucose. Importantly, glucose
cycling was abolished in G6pc2 KO mouse islets, suggesting that G6pc2 hydrolyzes G6P, thereby
contributing to glucose cycling, and opposing the action of the β-cell glucose sensor GCK [68].
Consistent with the most recent glucose cycling data, previous data from the O’Brien lab further
established the role of G6pc2 as a negative regulator of GSIS in vivo [69]. Pound et al. hypothesized that
deletion of G6pc2 would result in a leftward shift in the dose response curve for GSIS (Fig. 1.5). The
implications for this shift in the dose response curve are two fold.

18
Fig 1.6. A leftward shift in the dose response curve for GSIS results in enhanced insulin secretion from G6pc2 KO. Deletion of G6pc2 will result in a leftward shift of the dose response curve for GSIS and enhanced sensitivity to glucose. This will further result in enhanced insulin secretion from islets isolated from G6pc2 KO at a submaximal glucose concentration.

19
The first is that G6pc2 KO mice will have decreased FBG (Fig. 1.5). The second is that there will be
increased insulin secretion from G6pc2 KO mice due to enhanced sensitivity of GSIS to glucose (Fig. 1.6)
[69, 96]. The following findings support these hypotheses and the role of G6PC2 as a negative regulator of
GSIS. The first observation was that, as predicted in Fig. 1.6, there is significantly increased insulin
secretion at submaximal glucose concentrations from islets isolated from G6pc2 KO mice relative to WT
littermates (Fig 1.6 and 1.7) [69]. Secondly, in perfused pancreata, G6pc2 KO mice had enhanced insulin
secretion at a submaximal glucose concentration, consistent with a leftward shift of the dose response
curve for GSIS (Fig 1.6 and Fig 1.8) [69]. The final piece of data, as predicted in Fig. 1.5, is that in both male
and female mice bred on either a C57BL/6J (Fig. 1.9) or mixed background (Fig. 1.10), male and female
G6pc2 KO mice have significantly reduced FBG, consistent with the role of G6PC2 modulating the set point
for FBG (Fig 1.5, 1.9 and 1.10) [69]. Additionally, these in vivo data support the human GWAS data that
identified G6PC2 SNPs associated with variation in FBG [70, 73, 74, 79, 96]. These data as a whole support
the role of G6PC2 as a negative regulator of GSIS and as a key enzyme in modulating the set point for FBG.
The goal of the work described in this thesis was to further elucidate the mechanism and role of
G6PC2 in modulating GSIS and the set point for FBG [69]. A preliminary study in the O’Brien lab showed
that dexamethasone (Dex), a synthetic glucocorticoid (GC), stimulates G6pc2 promoter activity and
expression in a fusion gene assay. We therefore hypothesized that under certain physiological conditions
that activate G6pc2 gene expression or activity, such as stress, there will be a shift in the dose response
curve of WT mice, resulting in an enhanced difference in FBG between WT and G6pc2 KO treated mice (Fig.
1.10). While we predict an enhancement in the difference of FBG between WT and KO glucocorticoid
treated mice, there are two potential outcomes of these studies (Fig. 1.11 and 1.12). We predicted that if
the whole body effect of glucocorticoids was to raise FBG levels, than the difference in FBG between WT
and KO mice would be increased because of the effect of Dex on G6pc2 expression and deletion of G6pc2
would serve to limit the increase in FBG (Fig. 1.11).
20
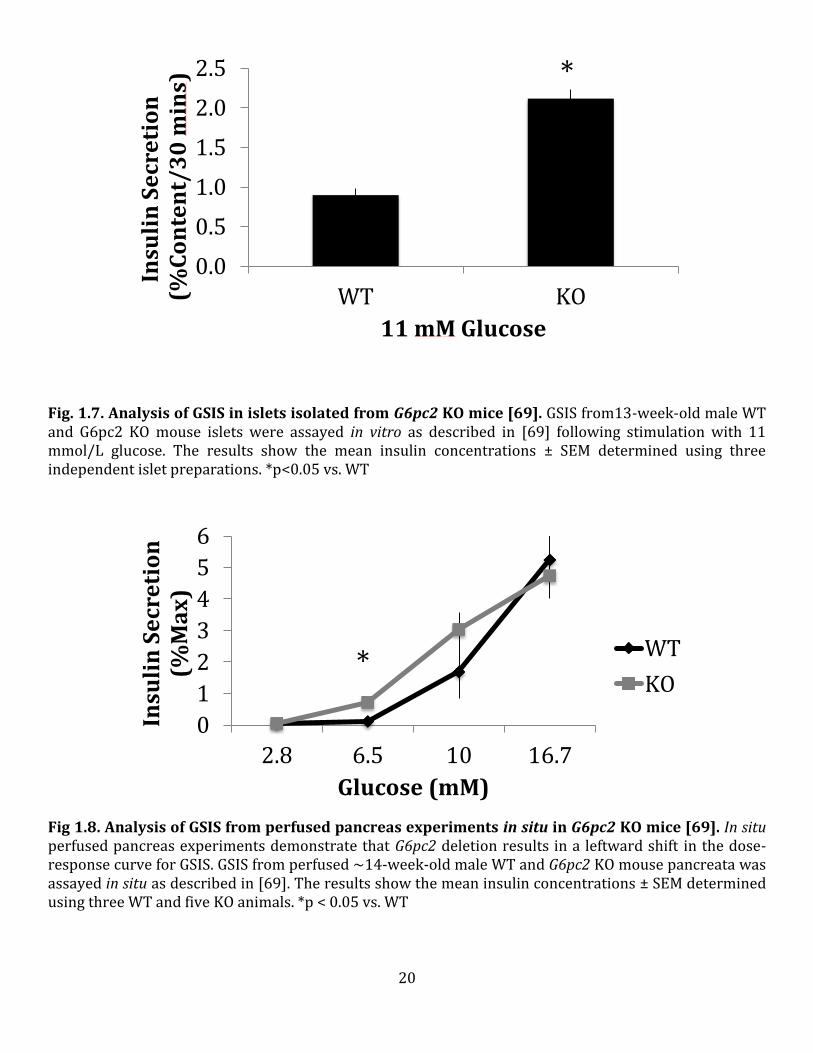
Fig. 1.7. Analysis of GSIS in islets isolated from G6pc2 KO mice [69]. GSIS from13-week-old male WT and G6pc2 KO mouse islets were assayed in vitro as described in [69] following stimulation with 11 mmol/L glucose. The results show the mean insulin concentrations ± SEM determined using three independent islet preparations. *p<0.05 vs. WT
Fig 1.8. Analysis of GSIS from perfused pancreas experiments in situ in G6pc2 KO mice [69]. In situ perfused pancreas experiments demonstrate that G6pc2 deletion results in a leftward shift in the dose-response curve for GSIS. GSIS from perfused ~14-week-old male WT and G6pc2 KO mouse pancreata was assayed in situ as described in [69]. The results show the mean insulin concentrations ± SEM determined using three WT and five KO animals. *p < 0.05 vs. WT
0
1
2
3
4
5
6
2.8 6.5 10 16.7
Insu
lin
Se
cre
tio
n
(%M
ax
)
Glucose (mM)
WT
KO*
0.0
0.5
1.0
1.5
2.0
2.5
WT KO
Insu
lin
Se
cre
tio
n(%
Co
nte
nt/
30
min
s)
11 mM Glucose
*

21
Fig. 1.9. G6pc2 KO mice have significantly reduced FBG levels on a C57BL/6J genetic background [69]. FBG is reduced in G6pc2 KO mice due to a leftward shift in the dose-response curve for GSIS relative to WT mice. At 17 weeks of age, mice were fasted for 6 h and then mice were anesthetized and blood was isolated. Blood glucose was measured as described in chapter II. Results are the mean ± SEM. p<0.05. Female WT N=12, KO N=11. Male WT N=31, KO=17.
Fig. 1.10. G6pc2 KO mice have significantly reduced FBG levels on a mixed genetic background [96]. FBG is reduced in G6pc2 KO mice due to a leftward shift in the dose-response curve for GSIS relative to WT mice. At 17 weeks of age, mice were fasted for 6 h and then mice were anesthetized and blood was isolated. Blood glucose was determined as described in chapter II. Results are the mean ± SEM. p<0.05. Female WT N=23, KO N=23. Male WT N=20, KO=28.
020406080
100120140
WT KO WT KO
Females Males
Blo
od
Glu
cose
(m
g/d
l)
* *
020406080
100120140
WT KO WT KO
Females Males
Blo
od
Glu
cose
(m
g/d
l)
* *

22
Fig. 1.11. Model predicting that the effect of glucocorticoid treatment is to increase FBG in WT and G6pc2 KO mice. This model predicts that following glucocorticoid treatment, there will be an increase in FBG of both WT and KO mice. This increase in FBG will increase the difference between WT and KO FBG relative to control mice. In this model, the presence of G6pc2 functions to limit the increase in FBG.
Fig 1.12. Model predicting that the effect of glucocorticoid treatment is to decrease FBG in WT and G6pc2 KO mice. This model predicts that following glucocorticoid treatment, there will be a decrease in FBG of both WT and KO mice. This decrease in FBG will increase the difference between WT and KO FBG relative to control mice. In this model, the presence of G6pc2 functions to prevent hypoglycemia.

23
Alternatively, if the whole body effect of glucocorticoids was to repress FBG levels, than the difference in
FBG between WT and KO mice would still be increased because of the effect of glucocorticoids on G6pc2
expression and, in this case, the presence of G6pc2 in WT mice would limit hypoglycemia (Fig. 1.12). The
results of these studies will be outlined in chapters III, IV and VI.
Characterization of Common G6PC2 SNPs
Because of the identification of G6PC2 SNPs that strongly affect FBG levels in humans, labs further
worked to characterize these signals and whether the SNPs were causative. Prior to discussing the
characterization of G6PC2 SNPs, the caveats relating to interpretation of GWAS data will be outlined.
Primarily, one issue with interpretation of GWAS data, is that these studies typically identify common SNPs
with low odds ratios [78]. This indicates that even the strongest “hits” individually may have a minimal or
modest effect on disease manifestation or effect size [78]. Instead, it is more likely that the genetic cause of
a disease or effect size of a parameter such as FBG is due to either rare, high impact variants or many,
common, low impact variants being present. Moreover, there could also be an effect from the interaction
of SNPs with other genes or an environmental cause [78]. Another critical caveat to GWAS is that, more
often than not, SNPs are in non-coding regions and are therefore assumed to associate with the gene that
is closest in proximity. This is important for two reasons. The first is that the identified SNP/SNPs may be
causative but are altering the activity of a long-range enhancer, which in turn affects the expression of a
distal gene, not the proximal one. An example of this was uncovered in studies done characterizing SNPs
in the FTO gene [97]. Variation in an intronic region of the FTO locus has reproducibly been associated with
obesity and T2D, yet years of research have not been able to identify the mechanism behind this association
[98-100]. While studies in mice have demonstrated that FTO expression levels affect body mass and
composition, studies have not been able to link these SNPs to mechanisms regulating obesity or T2D risk
[101-106]. It wasn’t until more recently that Smemo et al. identified these SNPs to be located in a long-
range enhancer that regulates the expression of the homeobox gene IRX3 [97]. Further studies

24
characterizing IRX3 deficient mice revealed that these mice had a 25-30% reduction in body weight,
strongly supporting the role of these SNPs in affecting IRX3 function, not FTO [97]. The second caveat to
interpretation of GWAS data is that the SNP may not be causative for the observed phenotype but is instead
in linkage disequilibrium with the causative SNP, as is demonstrated with the rs573225 G6PC2 SNP that is
in linkage disequilibrium with the lead G6PC2 rs560887 SNP [107]. Because of the limitations of GWAS, it
is crucial to design functional studies that identify the gene that the SNP is affecting as well as to establish
that the SNP is in fact causative. The following section presents an overview of the characterization that
has been done on the G6PC2 SNPs so as to determine which were most likely to be causative.
Table 1.2 highlights the main findings from studies which aimed to characterize the following
common G6PC2 SNPs: rs560887, rs13431652, rs2232316 and rs573225 (Table 1.2). These studies were
performed in order to determine the mechanism by which each SNP contributes to the association signal.
Molecular studies from the O’Brien lab using minigene analyses showed that the rs560887 SNP is located
at a branch site and affects G6PC2 protein expression by altering splicing efficiency [79] (Table 1.2). The
rs560887-G allele enhances pre-mRNA splicing while the rs560887-A allele reduces pre-mRNA splicing.
This is consistent with the genetic association between the rs560887-G allele, elevated FBG and the
hypothesized function of G6PC2, suggesting that rs560887 is a potentially causative SNP [79]. It was
further determined that with each additional A allele, the minor allele, there is an approximate 1mg/dl
reduction in FBG levels [82]. It has been shown that the rs2232316, rs13431652 and rs573225 SNPs are
in high linkage disequilibrium with rs560887 (>0.8) and are associated with FBG levels as part of the same
association signal [80]. The O’Brien lab further characterized the effect of the rs2232316 SNP on G6PC2
expression and promoter activity (Table 1.2). They demonstrated that the rs2232316-A allele enhances
G6PC2 transcription by promoting Foxa2 binding, which is predicted to increase expression and
consequently increase FBG, however this SNP does not have an effect on FBG in the absence of the
rs560887 SNP [79]. Another SNP that has been characterizes is the rs13431652 promoter SNP, which was
shown to alter binding of the NF-Y transcription factor to the G6PC2 promoter (Table 1.2). Specifically, the

25
rs13431652-A allele improved NF-Y binding and increased G6PC2 promoter activity, and is associated with
elevated FBG and as such is potentially causative [80]. Finally, two groups performed studies to elucidate
whether the rs573225 SNP, located in the promoter and within a Foxa2 binding site, affects G6PC2
promoter activity (Table 1.2). It was shown that the minor allele, rs573225-A, had a higher affinity for
Foxa2 binding but decreased promoter activity, which would be expected to result in decreased FBG due
to decreased G6PC2 protein expression. Interestingly though, the rs573225 SNP is associated with
increased FBG in GWAS, which is inconsistent with the decreased promoter activity that was observed in
these studies [80, 83]. There are two explanations for these findings. The first is that this is an artifact of
experiments done in cell lines and not representative of human biology. The second is that the conclusions
are correct but this SNP opposes the actions of other SNPs with which it is in linkage disequilibrium with.
Another important note in studying G6PC2 SNPs is that, despite being strongly associated with FBG,
SNPs in G6PC2 are not reproducibly associated with T2D risk [108-111]. While there were two studies that
successfully linked SNPs in G6PC2 to both FBG variation and T2D risk, these studies were performed with
a small sample size in a Chinese population [112, 113]. Other studies done with individuals of a European
descent and in much larger cohorts were not able to replicate these findings, despite replicating the
association of G6PC2 with FBG [114, 115]. This is of interest because elevated FBG is reproducibly
correlated with an increased risk of developing T2D as well as increased risk of cardiovascular associated
mortality (CAM). As G6PC2 is associated with variation in FBG, it would be predicted to also associate with
T2D risk and CAM why G6PC2 is not associated with T2D remains unclear [116, 117]. Studies in G6pc2 KO
mice were consistent with GWAS data in that there were minimal differences in intraperitoneal or oral
glucose tolerance relative to WT mice over a range of glucose concentrations [69]. Moreover, GWAS data
showed no association of G6PC2 SNPs with alterations in insulin sensitivity or FPI, which was also
confirmed in G6pc2 KO mice [69, 108-111].
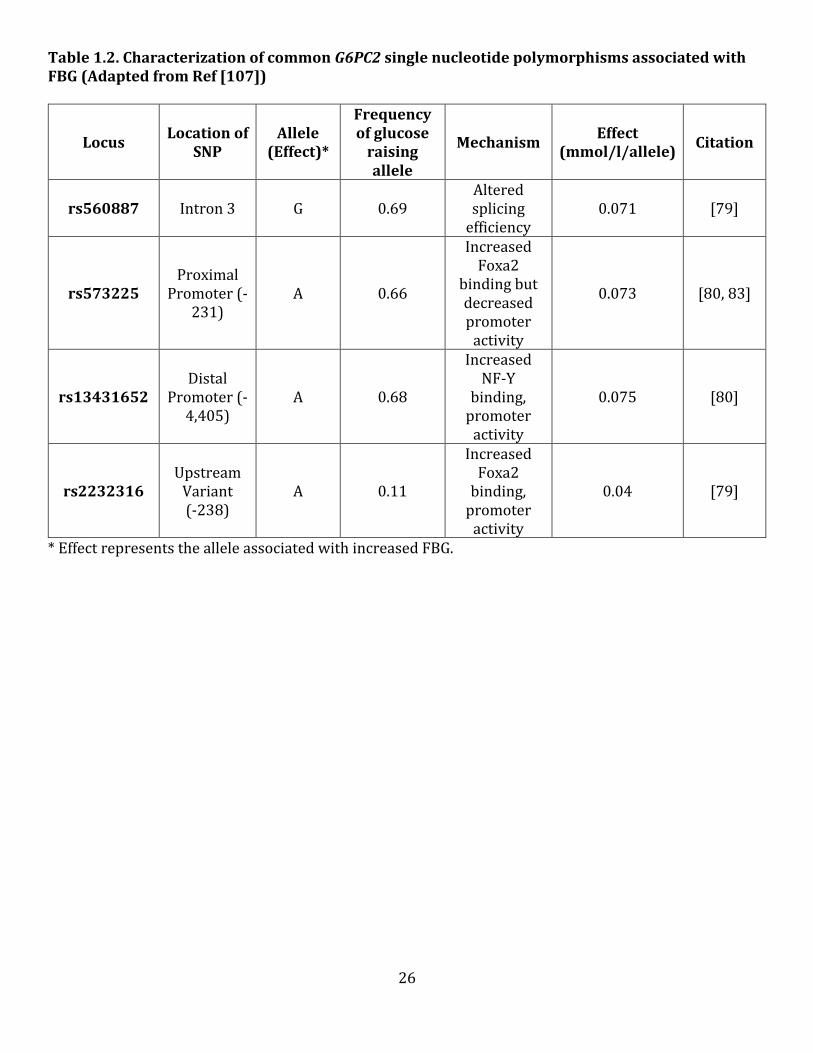
26
Table 1.2. Characterization of common G6PC2 single nucleotide polymorphisms associated with FBG (Adapted from Ref [107])
Locus Location of
SNP Allele
(Effect)*
Frequency of glucose
raising allele
Mechanism Effect
(mmol/l/allele) Citation
rs560887 Intron 3 G 0.69 Altered splicing
efficiency 0.071 [79]
rs573225 Proximal
Promoter (-231)
A 0.66
Increased Foxa2
binding but decreased promoter
activity
0.073 [80, 83]
rs13431652 Distal
Promoter (-4,405)
A 0.68
Increased NF-Y
binding, promoter
activity
0.075 [80]
rs2232316 Upstream
Variant (-238)
A 0.11
Increased Foxa2
binding, promoter
activity
0.04 [79]
* Effect represents the allele associated with increased FBG.

27
These data further highlighted a complication in reconciling GWAS and in vivo mouse studies; namely that
the rs560887-A allele, despite reducing G6PC2 expression and decreasing FBG, is actually associated with
decreased insulin secretion during a glucose tolerance test, instead of the expected increase. One potential
explanation for the inconsistency between GWAS and in vitro data is that G6pc2 affects insulin pulsatility
by altering intracellular calcium levels, which have been shown to alter the magnitude of metabolic
oscillations in islets [111, 118]. A change in insulin pulsatility would result in less efficient insulin signaling
and could explain how decreased G6PC2 expression could reduce insulin secretion without a change in
either glucose tolerance or insulin sensitivity to counterbalance those changes [108, 110, 111, 119]. In
summary, rs560887 is the most predictive and causative G6PC2 SNP in relation to FBG but work still needs
to be done reconciling the FBG and insulin secretion data.
Identification and Characterization of Rare SNP Variants
Because common SNPs tend to associate with mild phenotypes and only account for a small
percentage of genetic heritability, is has been suggested that rare variants (defined as minor allele
frequency (MAF) <0.5%) could account for the remaining heritability that cannot be explained by currently
identified SNPs. It is hypothesized that this “missing heritability” may associate with more detrimental
phenotypes and have more substantial effect sizes [78, 120]. These rare variants do not occur at a high
enough frequency to be captured by current GWA genotyping techniques and do not carry an adequate
effect size to be detected by familial linkage analysis studies [120]. An exception to this would be
monogenic conditions in which the MAF is less than 0.5% but the effect size is large enough to be detected
[120]. An example of this phenomenon is evident when comparing rare and common variants in G6PC2
and GCK. While the common rs560887 G6PC2 SNP accounts for approximately 1% of variation in human
FBG levels and is the strongest common genetic determinant of FBG in terms of significance and effect size,
G6pc2 KO mice have a mild metabolic phenotype showing ~14% decrease in FBG and, moreover, the rare
variants identified to date do not associate with more severe phenotypes such as diabetes [69, 78, 96, 121].

28
In contrast, common variants in GCK have a low, but significant, association with FBG but when Gck is
deleted in mice, it is lethal [122]. Importantly, in contrast to the currently identified common G6PC2 SNPs,
rare GCK variants, which result in heterozygous inactivation, cause MODY [123]. Similarly, homozygous
inactivating GCK mutations lead to permanent neonatal diabetes mellitus, which is characterized by severe
hyperglycemia. In contrast, rare activating mutations in GCK result in hypoglycemia due to
hyperinsulinemia [123]. Because of these studies which highlighted the magnitude rare GCK variants have
on a disease phenotype, many groups went on to look at the effect of Gck overexpression and tissue specific
deletion to learn more about the function of the gene and protein [122, 124, 125]. These studies ultimately
defined GCK as the pancreatic glucose sensor and established its role in glucose metabolism and GSIS. The
work done to characterize GCK function exemplifies how rare variants, that have yet to be identified, might
associate with more detrimental phenotypes. However, a more recent model has suggested that instead of
rare variants accounting for the missing heritability, there are in fact numerous SNPs that have not yet
been identified and, instead, these account for a large portion of the missing genetic heritability observed
in current GWA studies [126-128]. Nevertheless, this new model does not rule out the importance of
studying rare variants. Overall, these studies highlight an important caveat in analyzing GWAS data: the
size of the effect of common genetic variants does not necessarily correlate with the importance of the gene
in relation to the disease or phenotype being studied.
Glucocorticoid Biology
Glucocorticoids were aptly named due to their role in glucose metabolism (gluco-), secretion from
the adrenal cortex (-cort-) and steroid structure (-coid). Cortisol and corticosterone are the main active
endogenous glucocorticoids present in humans and mice, respectively, and play a variety of roles
throughout the body [129]. These functions include, but are not limited to, regulating glucose [130-134]
lipid [135-138] and protein metabolism [139, 140] to ultimately modulate energy homeostasis. Under
stressful conditions, the canonical function of glucocorticoids is to inhibit glucose uptake, antagonize

29
insulin secretion and raise blood glucose levels so that vital organs are supplied with adequate energy [129,
141, 142]. In addition to regulation of nutrient metabolism in times of stress, glucocorticoids are potent
anti-inflammatory, anti-allergic and immunosuppressive agents [143]. Synthetic glucocorticoids such as
Dex and prednisolone are used mainly in medical practice for this purpose and are prescribed for chronic
inflammatory diseases such as rheumatoid arthritis, asthma, eczema and allergic reactions [129, 144]. Side
effects of glucocorticoid treatment depend on dose and length of treatment but can include peripheral
insulin resistance, glucose intolerance, hyperglycemia, glucocorticoid induced diabetes, hepatic steatosis,
dyslipidemia, decreased skeletal muscle mass and central adiposity [144-148]. These side effects highlight
the importance of glucocorticoids in regulating whole body nutrient metabolism and glucose homeostasis.
In the following sections, the regulation of glucocorticoid secretion as well as the mechanisms of action will
be discussed.
Glucocorticoids are secreted from the cortex of the adrenal gland under the control of the
hypothalmus-pituitary-adrenal (HPA) Axis. Briefly, the hypothalmus senses the emotional or physical
stress and activates corticotrophin-releasing hormone (CRH) producing neurons, resulting in CRH
secretion. CRH levels are sensed by the pituitary, which results in secretion of adrenocorticotropic
hormone (ACTH), which is subsequently sensed by the adrenal cortex, resulting in glucocorticoid secretion
(Fig. 1.13). An important characteristic of the HPA axis is the ability of glucocorticoids to exert feedback
inhibition on CRH and ACTH, ultimately resulting in suppression of the HPA axis and reduced
glucocorticoid secretion [149]. As such, adrenalectomy results in blunted HPA axis activity and decreased
plasma corticosterone [150]. Circulating levels of cortisol range between ~50-100nM/L in humans, but
this can vary from low nanomolar to low micromolar range depending on stress and time of day [151, 152].
Basal glucocorticoid secretion follows a circadian rhythm, with the peaks of glucocorticoid secretion, in
humans, occurring on the onset of activity in the morning and the troughs occurring when activity ceases
at night.

30
Fig. 1.13. Hypothalmic-pituitary-axis (HPA) signaling and regulation. In response to stress, the hypothalamus activates CRH producing neurons, which is sensed by the pituitary gland and results in ACTH secretion. ACTH levels are sensed by the adrenal gland, which then secretes glucocorticoids. Glucocorticoids exert negative feedback by inhibiting both CRH and ACTH secretion.
Hypothalmus Pituitary Adrenal Glucocorticoids CRH ACTH
Negative Feedback

31
As rodents are nocturnal, this cycle is opposite; peaks occur in the evening and troughs in the morning
[153]. Approximately 95% of all circulating glucocorticoids are bound tightly by corticosteroid binding
globulins (CBGs) and albumin, with very little free glucocorticoids in the plasma. During times of stress,
glucocorticoid levels exceed the capacity of CBGs, which results in increased circulating free
glucocorticoids in the plasma [153]. The saturation point of CBGs occurs at glucocorticoid concentrations
approximately equal to the peak glucocorticoid concentrations throughout the day (400-500nmol
cortisol)[154]. This is important as only the fraction of glucocorticoids unbound to CBGs are able to diffuse
across cellular membranes and exert their downstream effects.
Past the point of CBG saturation, free/unbound glucocorticoids diffuse across membranes where,
once in the cell, local glucocorticoid concentrations are determined by the amount of 11β-hydroxysteroid
dehydrogenases (11β-HSD) present in the specific tissue. There are two isoforms of 11β-HSD: 11β-HSD1
and 11β-HSD2. 11β-HSD1 is a reductase that converts inactive glucocorticoid to active glucocorticoid,
specifically cortisone to cortisol in humans and 11-dehydrocorticosterone (11-DHC) to corticosterone in
rodents [155, 156]. 11β-HSD2 functions as a dehydrogenase that catalyzes the reverse reaction [157]. The
relative amounts of 11β-HSD1 and 11β-HSD2 present in a tissue act to control glucocorticoid levels and
thereby determine local glucocorticoid concentrations and activity. 11β-HSD1 is predominantly expressed
in liver and adipose tissue whereas 11β-HSD2 is mainly expressed in the kidney [144]. Importantly, 11β-
HSD1 is also found in pancreatic islets but it remains unclear if this localization occurs specifically in α-
cells [158], β-cells [159, 160] or both. Regardless of the cell type, the presence of 11β-HSD1 in pancreatic
islets directly connects glucocorticoid metabolism with β-cell function, either in a direct or paracrine
fashion [159, 160]. The role of glucocorticoids in modulating β-cell function will be discussed in greater
detail in subsequent sections.
Glucocorticoids signal by binding to the glucocorticoid receptor (GR). The GR is part of the nuclear
receptor superfamily and is a ligand-regulated transcription factor that is widely expressed throughout the
body [161]. Once glucocorticoids are in the cytoplasm, they binds the GR, which is bound in an inactive

32
form by chaperone proteins [162]. Upon glucocorticoid binding, the GR undergoes a conformational
change, which reveals a nuclear import signal on the receptor. As this occurs, the GC-GR complex enters
the nucleus and, as a dimer, binds a glucocorticoid receptor element (GRE) in the promoter region of a
target gene in order to activate or repress transcription [163]. It has been shown that approximately 2%
of the human genome is regulated in this manner by glucocorticoids [164]. Specific examples of this type
of induction are the phosphoenolpyruvate carboxykinase (PEPCK) and G6PC1 genes, which further
highlight the role glucocorticoids play in activating gluconeogenesis and modulating glucose homeostasis
in times of stress [144, 165-167]. Importantly, these GRE binding sites are critical for maximum promoter
activity. It has been demonstrated in various glucocorticoids regulated genes that deletion of the GRE or
mutation of key nucleotides in the GRE abolishes or drastically reduces promoter activity as shown in
fusion gene assays [149]. While inducing transcriptional changes via GRE binding is the most common way
glucocorticoids exert their effects, there are two other common mechanisms of glucocorticoid signaling.
The first is that the GC-GR complex can interact, as a monomer, with other transcription factors via protein-
protein interactions and trans-repress transcription of target genes. The final mechanism involves
nongenomic modulation, both activation and inhibition, of protein activity by the GC-GR complex [144,
168]. Overall, it is clear that glucocorticoids have many pleiotropic effects throughout the body that are
mediated through a variety of mechanisms and regulatory pathways.
Glucocorticoids Effect Glucose Metabolism in the Liver, Skeletal Muscle and White Adipose Tissue
The widely accepted dogma with respect to the effect of glucocorticoids in regulating glucose
metabolism in both rodents and humans in vivo is that they inhibit glucose uptake by inducing insulin
resistance [169], stimulating hepatic glucose production [170, 171] and inhibiting insulin secretion [147,
172-178], thereby inducing glucose intolerance and hyperglycemia [129, 179-185]. Fig. 1.14 gives a brief
overview of how glucocorticoids are thought to exert their effects specifically on the liver, skeletal muscle,
white adipose tissue (WAT) and pancreas. As mentioned in the previous section, glucocorticoids have

33
pleiotropic effects and regulate nutrient metabolism in complex ways. The next section will highlight the
central mechanisms by which glucocorticoids modulate glucose homeostasis (Fig. 1.14).
It is well established that treatment with glucocorticoids activates hepatic gluconeogenesis (Fig.
1.14). In both humans and rodents, injection with Dex results in increased hepatic glucose output by
transcriptional activation of many genes involved in the gluconeogenic pathway, as mentioned in the
previous section [165-167, 184, 186]. These genes include pyruvate carboxylase, PEPCK, fructose-1,6-
bisphophatase 1, phosphofructokinase 2/fructose bisphosphatase 2, G6PT and G6PC1 [169]. While the
specific mechanisms by which glucocorticoids induce transcription of PEPCK, phosphofructokinase
2/fructose bisphosphatase 2 and G6PC1 have been abundantly characterized, more work needs to be done
to understand how glucocorticoids alter transcription of the other mentioned genes. Despite the
mechanisms not being entirely established, it is clear that induction of these genes by glucocorticoids
ultimately results in increased hepatic glucose output, subsequently resulting in increased blood glucose
levels [187, 188]. Paradoxically, glucocorticoids also increase liver glycogen storage following
glucocorticoid treatment by inducing glycogen synthase activity [187, 188]. Glucocorticoid treatment in
various species, including humans, results in rapid deposition of liver glycogen that correlates with
increased activity of glycogen synthase in liver homogenates following glucocorticoid treatment [188-190].
This is thought to occur by glucocorticoid activation of glycogen synthase phosphatase, which activates
glycogen synthase through dephosphorylation [191]. Overall, in the liver, glucocorticoids act to increase
glucose output, which results in increased blood glucose levels. However the reasons behind the observed
concomitant inactivation of glycogen phosphorylase and activation of glycogen synthase, resulting in a net
increase in liver glycogen content, remains elusive [191, 192].
Glucocorticoids further modulate glucose metabolism by mediating their effects on skeletal muscle
and WAT (Fig. 1.14). Primarily, glucocorticoids inhibit glucose uptake and glucose oxidation by interfering
with insulin stimulated glucose uptake in both tissues [169]. This occurs in skeletal muscle, in part, by
decreased GLUT4 translocation to the cell membrane in myocytes, thereby diminishing the availability of

34
glucose present in the cytoplasm for glycolysis [193, 194]. The specific mechanism whereby
glucocorticoids are able to influence GLUT4 translocation and interfere with insulin signaling in myotubes
is unclear at this time. Glucocorticoids also affect glucose metabolism by reducing glycogen storage in
skeletal muscle, in contrast to the increased glycogen storage observed in liver [169]. This occurs by
glucocorticoids interfering with insulin’s ability to dephosphorylate and therefore activate glycogen
synthase, thereby inhibiting insulin stimulated glycogen synthase activity and glycogen synthesis [195-
197]. The different effects that glucocorticoids have on glycogen metabolism in the liver and skeletal
muscle highlight the important point that there are tissue specific differences in glucocorticoid signaling
and its downstream effects. The final way glucocorticoids affect glucose homeostasis in skeletal muscle and
WAT is by breaking down either amino acids or lipids, respectively, to provide gluconeogenic precursors
for the liver. Specifically in WAT, glucocorticoids enhance lipolysis, which results in increased plasma
glycerol and fatty acids, the former which can be used as a gluconeogenic precursor and the latter providing
energy for gluconeogenesis [198, 199]. Similarly, in skeletal muscle, glucocorticoids increase protein
degradation to provide amino acid precursors [169]. Unsurprisingly, chronic glucocorticoid treatment or
chronic glucocorticoid secretion, as is observed in Cushing’s syndrome, results in decreased muscle mass
and muscle atrophy due to prolonged protein degradation in skeletal muscle [200]. As skeletal muscle
accounts for approximately 75% of glucose utilization following glucose stimulation, the advantages of
glucocorticoid action on skeletal muscle are clear; they inhibit muscle glucose uptake in order to increase
blood glucose levels so as to supply vital organs with adequate energy. This is just a brief overview of
primary mechanisms thought to contribute to metabolic regulation of glucose homeostasis by
glucocorticoids in skeletal muscle and WAT. The final tissue affected by glucocorticoids that affects glucose
metabolism are pancreatic islets, which will be discussed in greater depth in the next section.

35
Fig. 1.14. Overview of the effects of glucocorticoids on liver, white adipose tissue, skeletal muscle and the pancreas. Adapted from [169].
Corticosterone or
(?)

36
Importantly, from an evolutionary standpoint, these mechanisms described in the liver, skeletal
muscle and WAT are meant to be activated as an acute and temporary reaction to perceived stress and, as
such, it has been shown that this transient increase in blood glucose is beneficial over short periods of time
[201]. However, it is not surprising, given the major role that glucocorticoids play in glucose homeostasis
and nutrient metabolism, that prolonged elevation of glucocorticoids, as occurs in Cushing’s disease or
chronic glucocorticoid treatment [202, 203], can lead to a metabolic syndrome like phenotype associated
with insulin resistance, increased central adiposity, and hyperglycemia, which can result in an increased
risk of glucocorticoid induced diabetes and/or a cardiovascular event [179]. Because of the similarities
between metabolic syndrome and chronic glucocorticoid treatment, there has been increasing interest in
determining if targeting steps in glucocorticoid signaling pathways could ablate or prevent these negative
health outcomes.
Glucocorticoids Effect Glucose Metabolism in Pancreatic Islets
This section will highlight the effects of glucocorticoid treatment on islet function, specifically in α
and β-cells. The studies performed, which characterize the mechanisms related to the effects of
glucocorticoids on islet function, are performed in either islets isolated from glucocorticoid treated animals
or, islets that are treated with glucocorticoids following isolation. The literature on isolated rodent islets is
contradictory with multiple studies reporting that glucocorticoids inhibit [160, 204-208] or stimulate
[209-213] GSIS in vitro. However, studies that were performed in dispersed β-cells and insulin secreting
cell lines showed a decrease in GSIS following glucocorticoid treatment [204, 208, 214, 215]. These
discrepancies in vitro cannot simply be explained by variations in the duration of glucocorticoid exposure
or differences in the steroids used [206]. Instead, the discrepancies almost certainly relate to variations in
experimental conditions coupled with the kinetic complexity of the transcriptional actions of
glucocorticoids [216] and the ability of the GR to signal through non-genomic mechanisms [168].
Moreover, given the observation that marked differences exist between the regulation of gene expression

37
by glucocorticoids in isolated cells and in vivo [217], the relevance of these isolated islet studies to in vivo
glucocorticoid action is questionable.
Unfortunately, the in vivo studies on glucocorticoid regulation of islet function are just as
contradictory as the in vitro data. Human studies show that individuals who are obese or older respond
differently to glucocorticoid treatments. These individuals exhibit hyperinsulinemia, insulin resistance and
glucose intolerance [144]. Conversely, glucocorticoid treatment in healthy, non-obese individuals showed
that a single dose of glucocorticoids inhibits insulin secretion during a meal or OGTT [184, 218]. Similarly
in rodents and primates it has been shown, contradictorily, that glucocorticoids enhance insulin secretion,
beyond the level required to counteract insulin resistance. This ultimately resulted in improved glucose
tolerance and enhanced glycogen deposition [219-223]. Moreover, glucocorticoids have been shown to
increase insulin secretion during an intraperitoneal glucose tolerance test (IPGTT) or OGTT in healthy men
and adult rats and that glucocorticoids actually enhance β-cell function in response to glucocorticoid
induced insulin resistance [224, 225]. This in vivo hyperinsulinemia is consistent with in vitro data that
shows enhanced GSIS from pancreatic islets isolated from glucocorticoid treated rodents [209-213].
Hyperinsulinemia is thought to be a compensatory mechanism to counterbalance the insulin resistance in
skeletal muscle, liver and WAT and can result, in healthy individuals, in normal glycaemia [129]. It remains
unclear whether the observed hyperinsulinemia is a glucocorticoid dependent or independent effect. It has
been hypothesized that the hyperinsulinemia is a compensatory response to the insulin resistance and not
a direct action of glucocorticoids on β-cells to increase insulin secretion. This hypothesis is supported by
studies that show that treatment of isolated islets with glucocorticoids, in the absence of whole body
insulin resistance, directly inhibits insulin secretion [204]. Whether hyperinsulinemia is an effect directly
mediated by glucocorticoid action on β-cells or indirectly mediated by glucocorticoid induced insulin
resistance, hyperinsulinemia is one of the few consistent findings in experiments on healthy volunteers
[131, 141, 142, 184, 218, 226] and in healthy rats [147, 210, 227]. A final observation that confounds these
studies is that there is a glucocorticoid dependent increase in β-cell mass, which has been demonstrated to
38
occur in a time and dose dependent manner relative to the degree of insulin resistance [147, 210]. This
increase in β-cell mass could also explain the hyperinsulinemia. It should be noted that a majority of studies
characterizing the effects of glucocorticoid on insulin secretion and islet function have been performed in
rats and humans. This is important because G6pc2, as previously mentioned, is a pseudogene in rats,
indicating that the results from these studied were obtained in the absence of G6pc2 mediated glucose
cycling and therefore may not be representative of the human or mouse condition [66].
Lastly, a few in vivo studies have been performed to look at the effect of glucocorticoid treatment in
mice. Unfortunately though, the in vivo mouse data is sparse, with the majority of work being performed in
transgenic or ob/ob mice. Studies performed with obese ob/ob mice have not measured insulin sensitivity
or glucose tolerance but they did observe decreased insulin secretion and unaltered fasting insulinemia, in
contrast to human and in vitro rat studies [228, 229]. Notably, Khan and colleagues found that glucose
cycling is markedly enhanced in isolated islets treated with glucocorticoids from ob/ob mice and this
enhancement was accompanied by a reduction in GSIS [90, 228-230]. Interestingly, these data were
published prior to the identification of G6pc2 and G6pt and, at the time it was published, there was not a
mechanism that explained the observed increase in glucose cycling following glucocorticoid treatment in
islets. Now that the role of G6pc2 in glucose cycling in islets has been discovered, G6pc2’s function could
explain the previously published findings from Khan et al [90, 228, 229]. Finally, the effect of glucocorticoid
treatment in transgenic models that overexpress the GR specifically in β-cells showed glucose intolerance,
increased or unaltered fasting glycaemia and decreased fasting insulinemia [160, 173, 231]. As with the
previously discussed in vitro isolated islet data, the in vivo mouse data is contradictory, making
interpretation of the data difficult in the context of determining what the direct contributions of
glucocorticoids are on the mouse islet.
While the main goal of this section has been to outline the effects of glucocorticoids on β-cell
function, glucocorticoids also affect other pancreatic cell types and secretion of other islet hormones.
Similar to the data on glucocorticoids and β-cell function, studies on α-cell function and glucagon secretion

39
are just as conflicting. Studies show no change, an increase and a decrease in glucagon secretion following
glucocorticoid treatment. For example, in vivo, one study showed that treatment of healthy subjects with
Dex does not change glucagon secretion [232]. Similarly, treatment of isolated rat or mouse islets with
glucocorticoids was shown to have no effect on glucagon secretion [233, 234]. In contrast to these findings,
treatment of mouse islets with glucocorticoids for 2 hours reduced glucagon secretion relative to control
islets in the presence of low glucose and was reversed by antagonizing the GR, implicating glucocorticoid
signaling directly [158]. Finally, in vivo there is fasting hyperglucagonemia observed in glucocorticoid
treated rhesus macaques [219] and healthy, non-obese men [141, 235, 236] and rats [234, 237]. Consistent
with this finding, there is enhanced α-cell mass from Dex treated rats, indicating most likely that there is
islet hyperplasia in glucocorticoid treated subjects [234]. As with the data on β-cell function, there are
different paradigms for studying glucocorticoid biology and these vary in the type of glucocorticoids used
and the length of treatment and dose, which may explain the inconclusive results. In conclusion, the effects
of glucocorticoids on pancreatic β-cell function are complicated in part because of the pleiotropic effects of
glucocorticoids throughout the whole body but also because of technical consideration regarding the
design and interpretation of results. The studies described in Chapter III, IV and VI will examine the effect
that endogenous and synthetic glucocorticoids have on G6pc2 expression and whole body glucose
metabolism, namely fasting blood glucose.
Hypothesis: Glucocorticoids Modulate G6pc2 Expression and Glucose Metabolism
Because of the findings that Dex stimulates human G6PC2 promoter activity and that glucocorticoids
have widespread effects throughout the body, we hypothesize that stressing mice or treating them with
glucocorticoids will result in increased G6pc2 gene expression and modulation of FBG. The studies
performed in Chapter III examine the effects of endogenous glucocorticoids in the physical restraint
paradigm, Chapter IV outlines the effects of Dex treatment and Chapter VI examines the effect of 11-DHC

40
water supplementation. The data described in these chapters support the role of G6pc2 in modulating the
set point for FBG under conditions of physiological stress.
Hypothesis: Rare G6PC2 SNPs Exist and Affect Protein Expression and Enzyme Activity
Due to the successful studies on rare GCK variants, we hypothesized that there are rare variants in
G6PC2 that could account for the missing heritability observed in GWA studies examining the genetics of
FBG. We predict that these rare variants would have a significant effect on either protein expression or
enzyme activity, which would be expected to modulate the set point for FBG. Since the identified SNP’s in
the G6PC2 locus have a minor effect on FBG (~1mg/dl) yet in vivo deletion of G6pc2 has a relatively major
effect on FBG, decreasing it by ~14 mg/dl; we hypothesize that a rare variant, which disables G6PC2, would
have the same effect on FBG as seen in G6pc2 KO mice [69]. The studies described in Chapter VII outline a
systematic functional analysis of 23 non-synonymous G6PC2 SNPs using a novel in situ functional assay for
G6Pase activity.

41
II. MATERIALS AND METHODS
Generation of G6pc2 KO Mice
The G6pc2 targeting vector and G6pc2 mutant mice were generated as previously described [96,
238]. Both the 129SvEv and C57BL/6J G6pc2 KO congenic strains were developed via a speed congenic
breeding strategy [239, 240]. A male G6pc2 heterozygous mouse on a mixed 129SvEv X C57BL/6J
background was bred with female 129SvEv or C57BL/6J mice. The male offspring with the mutated G6pc2
allele and with the highest content of C57BL/6J or 129SvEv genome, respectively, as determined by
microsatellite DNA, was used for the next round of breeding. Further rounds of backcrossing were
performed using the same approach. Backcrossing was complete after 6 generations in C57BL/6J mice and
129SvEv mice. In order to fix the Y chromosome, a male mouse with 100% C57BL/6J or 129SvEv genome
based on marker analysis was bred with female C57BL/6J or 129SvEv, respectively. Female offspring were
crossed with male C57BL/6J or 129SvEv mice in order to ensure that all subsequent offspring carried the
correct C57BL/6J or 129SvEv Y chromosome.
Speed congenic breeding was achieved by using a panel of 61 microsatellite markers that were
equally spaced throughout the genome (~30cM intervals). These markers were used to differentiate the
genetic background or the original/donor and target/recipient mouse strains. The markers selected to
distinguish between strains were chosen using a “panel generator” at
http://www.cidr.jhmi.edu/mouse/mmset.html. Genomic DNA was isolated by standard proteinase K
digestion protocols, mixed with True Allele PCR Premix (Applied Biosystems, Foster City, CA) and
dispensed into a panel of Mouse Mapping Primers (Applied Biosystems). The multiplexing reaction and
amplification parameters followed manufacturer directions. After PCR, 4 mls of multiplexed product, 0.6
mls of GS500-ROX size standard and 6 mls of Hi-Di formamide were mixed (Applied Biosystems).
Denaturing was done at 94°C for 3 minutes and loaded onto the ABI 3100 Avant Genetic Analyzed.
Chromatogram data was analyzed using GeneMapper 3.5 software (Applied Biosystems). Once mice were

42
confirmed to only have C57BL/6J or 129SvEv markers, heterozygous mice were bred to generate WT, KO
and heterozygous mice.
PCR Genotyping of G6pc2 KO Mice
Mice were tailed and their DNA was genotyped by PCR and primers, which distinguish between WT
and target alleles. Specific details of G6pc2 genotyping are found in reference [96].
Animal Care
All animal housing and mouse facilities met the American Association for the Accreditation of
Laboratory Animal Care standards. The Vanderbilt University Medical Center Animal Care and Use
Committee approved all protocols used. Mice were maintained on a standard rodent chow diet (LabDiet
5001; 23% protein and 4.5% fat; PMI Nutrition International) with food and water provided ad libitum.
Where specified, mice were placed on a high fat (60% fat calories; Mouse diet F3282; BioServ) diet at 8
weeks of age and maintained on the diet for 12-14 weeks. Where specified, mice were maintained on a
standard chow diet and water supplemented with 5mg/ml 11-dehydrocorticosterone (Steraloids, Inc) as
described in ref [241].
Phenotypic Analysis of Fasted WT and G6pc2 KO Mice
Mice were fasted for 5 hours and then weighed. After an additional hour of fasting, mice were
anesthetized using isoflurane and blood samples were isolated from the retro-orbital venous plexus.
Glucose concentrations were measured in whole blood using a glucose monitor (Accu-Check Advantage;
Roche, Indianapolis, USA). EDTA (5 l; 0.5 M) was then added to blood samples prior to isolation of plasma
by centrifugation. Insulin samples were assayed using RIA by the Vanderbilt Diabetes Center Hormone
Assay Core [242].

43
Intraperitoneal Glucose Tolerance Tests
Intraperitoneal glucose tolerance tests (IPGTTs) on 6-24 hour fasted conscious mice were
performed as previously described [243]. Mouse age and duration of the fast are indicated in the respective
experiments. In all of the described IPGTTs, mice were fasted for the respective time and weighed an hour
prior to the experiment. After an hour of recovery, the mice were either given an injection or oral gavage
of 0.75 or 2.0 mg/kg body weight glucose in sterile PBS. Tail vein blood was used to obtain glucose
measurements after the injection at the following time points: 0, 15, 30, 60, 90 and 120 using a Freestyle
glucose meter (Abbott). In the physical restraint paradigm, IPGTTs were performed 4 hours after a final
hour of physical restraint.
Analysis of Glucose-Stimulated Insulin Secretion In Vivo
Insulin secretion during IPGTTs was assessed in Male WT, Het and KO mice following a 6 or 18
hours fast as previously described [69]. Mice were anesthetized with isoflurane and blood samples were
collected from the retro-orbital venous plexus in order to obtain basal glucose and insulin levels. Mice were
given 15-30 minutes to recover from anesthesia and were then injected or orally administered a 0.75 or
2.0 mg/kg body weight bolus of glucose. Basal insulin and glucose were assessed after a specific amount of
time that is indicated in the respective chapters. Blood glucose was measured using a glucose monitor
(Accu-Check Aviva, Roche, Indianapolis, IN, USA). EDTA (5 μl; 0.5 M) was added to blood samples prior to
isolation of plasma by centrifugation. Insulin samples were assayed using RIA by the Vanderbilt Diabetes
Center Hormone Assay Core [242].
Dexamethasone Injection Paradigm
Mice were injected at 8 am with 13 μg/g dexamethasone (Dex) phosphate (2 mg/ml dissolved in
PBS) for 4-5 days prior to IPGTTs. This dose of Dex was based on the results of a previous publication [244].
Alternate doses were used as stated in figure legends.

44
Physical Restraint Paradigm
The repeated physical restraint experimental paradigm has been previously described [245].
Briefly, mice were immobilized in a 50 ml conical tube at 10 am each day for 1 hour for 10 consecutive
days.
Mouse and Human Islet Isolation
Mouse islets were isolated by the Vanderbilt Islet Procurement and Analysis Core as previously
described [246]. Human islets were obtained by A.C.P. through the NIDDK-funded Integrated Islet
Distribution Program (https://iidp.coh.org/).
Analysis of G6pc2 Gene Expression in Mouse Pancreata by Quantitative RT-PCR
Gene expression was quantitated using real time PCR. Pancreatic and tissue culture cell gene
expression were quantitated after RNA isolation by using the Turbo DNA-free DNAse Treatment Kit
(Ambion, Carlsbad, CA) to remove trace genomic DNA followed by cDNA generation using the iScript DNA
Synthesis Kit (Bio-Rad, Hercules, CA) and then PCR using the dUTP-containing FastStart SYBR Green
Master Mix in conjunction with Uracil-Glycosylase (Roche, Nutley, NJ). Islet gene expression was
quantitated using the primer-probe TaqMan® approach from Life Technologies (Carlsbad, CA) as
described [247]. Fold induction of gene expression was calculated using the 2(-ΔΔC(T)) method [248].
The following primer pairs were used for the analysis of pancreatic RNA expression:
Mouse G6pc2 Forward 5’-GTCTGTGGGTGGAGCAGGAC-3’
Mouse G6pc2 Reverse 5’-CCCTGATGGTGGTGGCTCTA-3’
Mouse Slc37a4 Forward 5’-GCCAGTAAGGCTGCAGTTGG-3’
Mouse Slc37a4 Reverse 5’-TCTGGCTGGCTTACCCTTCA-3’
Mouse Fkbp5 Forward 5’-AGGCCGTGATTCAGTACAGG-3’
Mouse Fkbp5 Reverse 5’-GAACGACTCTGAGGCTTTGG-3’
For the analysis of mouse and human islet gene expression TaqMan® primers were purchased from

45
Life Technologies (Carlsbad, CA). The catalogue numbers are as follows:
Mouse G6pc2 Mm00491176_m1
Human G6PC2 Hs01549773_m1
Mouse Slc37a4 Mm00484574_m1
Human SLC37A4 Hs00259865_m1
The genes used as internal controls in islet gene expression analyses were as previously reported [247].
Electronic Health Record (EHR)-Based Phenotyping of Human Research Subjects
EHR-based phenotyping was conducted using data on human subjects in the Vanderbilt University
Medical Center (VUMC) BioVU DNA databank. Genotyping data in BioVU is linked to the Synthetic
Derivative (SD), a de-identified version of the VUMC EHR repository. Detailed descriptions of program
operations, ethical considerations, and continuing oversight and patient engagement have been published
[249, 250]. For these studies we used a previously genotyped cohort of 29,722 European descendants from
VUMC with longitudinal medical care. Genotyping was performed on the Illumina Human Exome BeadChip
platform. For this study, we specifically analyzed the intronic G6PC2 SNP rs560887. Lipid measurements
utilized routine clinical laboratory testing values present in the EHR.
Site Directed Mutagenesis and Plasmid Preparation
Human G6PC2, mouse G6pc2 or mouse G6pc1 in the pcDNA3.1D v5-His-TOPO Vector with a C-
terminal V5-His Tag was used to generate non-synonymous variants in the coding sequence using
Quikchange II Site-Directed Mutagenesis (Agilent). V5-His constructs are terminally extended versions of
the plasmids, which incorporate a V5 epitope and His6 tag generated by deletion of the stop codon [56].
Sanger Sequencing was used to verify all mutations. Two to three independent preps were made for each
mutant described. All mutant plasmid constructs were purified by centrifugation through cesium chloride
gradients [51].

46
Cell Culture
Rat islet-derived 832/13 cells and monkey kidney-derived COS 7 cells were passaged as
subconfluent cultures in RPMI medium supplemented with 10% (vol/vol) fetal bovine serum, 0.05 mM β-
mercaptoethanol, 100 U/ml penicillin and 100 g/ml streptomycin.
SNP Databases
Human G6PC2 SNPs were identified using the UCSC Genome Browser (https://genome.ucsc.edu/),
HumSAVR (http://omictools.com/humsavar-tool) or dbSNP (http://www.ncbi.nlm.nih.gov/SNP/)
databases.
G6PC1 Expression Vector Construction
The construction of plasmids encoding human G6PC2 (accession number NM_021176), mouse
G6pc2 (accession number NM_021331), human G6PC1 (accession number NM_000151) and mouse G6pc1
(accession number NM_008061) in the pcDNA3.1D v5-His-TOPO vector with a C-terminal V5-His Tag has
been previously described [55, 56]. Our human G6PC2 cDNA contains a leucine at amino acid (AA) 219 [66].
Alternate alleles of SNP rs492594 switch a valine for a leucine at AA 219.
Human G6PC2:mouse G6pc2 and mouse G6pc2:human G6PC2 chimeras in the pcDNA3.1D v5-His-
TOPO vector were constructed by ligating fragments of the respective open reading frames. This was
achieved by sub-cloning using a combination of restriction enzyme sites in the pcDNA3.1D v5-His-TOPO
vector and the Dra I, Stu I and BamH I restriction enzyme sites, which are common to both human G6PC2
and mouse G6pc2. These three sites truncate G6PC2 at AAs 72, 192 and 249, respectively, from the N
terminus.
Site-directed mutagenesis was used to change specific codons in human G6PC2 and mouse G6pc1.
This was achieved either by using the Quikchange II kit (Agilent) or a three-step PCR protocol [51]. DNA
sequencing was used to verify all codon changes and the absence of secondary mutations. Two to three

47
independent plasmid preparations were analyzed for each mutant described. Plasmids were purified by
centrifugation through cesium chloride gradients [51].
G6pc1 and Pklr Fusion Gene Construction
A bacterial artificial chromosome (BAC) clone (CH230-220J5) containing the entire rat G6pc1 gene
(Accession number AC123346) was purchased from BACPAC Resources, Children's Hospital Oakland
Research Institute, Oakland, CA. This clone was digested with Kpn I to isolate a 7319 bp fragment,
representing the rat G6pc1 promoter region between -7253 and +66 [251], that was then ligated into a Kpn
I digested pGEM7 vector (Promega). This fragment was then re-isolated, blunted ended using Klenow and
ligated into the Xba I - Bgl II, digested and Klenow treated pCAT(An) vector, a gift from Dr. Howard Towle
[252]. Fragments of the rat G6pc1 promoter, representing promoter sequence between -7248 and +62 and
-1640 and +62, were then re-isolated from the pCAT(An) plasmid by digestion with Hind III and Xho I and
ligated into the Hind III and Xho I digested pGL3 MOD luciferase vector [55].
Two fragments of the rat liver pyruvate kinase (Pklr) promoter representing sequences from -206
to +1 and -100 to +1 [253], were generated by PCR reaction using rat genomic DNA as the template in
conjunction with the following primers:
(5'-CCCAAGCT(-206)TCTGCAGACAGGCCAAAGGGGATCC-3'),
(5'-CCCAAGCT(-100)TGCTAGCTGGTTATACTTTAAC-3'), and
(5'-CCGCTCGAGA(+1)CCTGCTGTGTCTGTGGGTCTGCT-3'); Hind III and Xho I cloning sites underlined. The
PCR fragments generated were digested with Hind III and Xho I, ligated into the Hind III and Xho I digested
pGEM7 vector (Promega) and then sequenced to ensure the absence of polymerase errors. The fragments
were then re-isolated from the pGEM7 plasmid and ligated into the Hind III and Xho I digested pGL3 MOD
luciferase vector [55].
RNA Isolation and Quantification
To compare wild type human G6PC2 and mouse G6pc2 RNA expression plasmids encoding human

48
G6PC2 and mouse G6pc2 (3 g) were expressed by transient transfection of semi-confluent COS 7 cells in
10 cm diameter dishes using the lipofectamine reagent (InVitrogen, Waltham, MA) as previously described
[254]. Following transfection, cells were incubated for 18-20 hours in serum-containing medium. RNA was
then harvested and purified using the RNAqueous® kit (Ambion, Carlsbad, CA). Gene expression was then
quantitated by using the Turbo DNA-free DNAse Treatment Kit (Ambion, Carlsbad, CA) to remove trace
genomic DNA followed by cDNA generation using the iScript DNA Synthesis Kit (Bio-Rad, Hercules, CA) and
then PCR using the dUTP-containing FastStart SYBR Green Master Mix in conjunction with Uracil-
Glycosylase (Roche, Nutley, NJ). PCR products were analyzed by electrophoresis on 1% agarose gels.
The following primer pairs, that recognize non-coding sequences in the pcDNA3.1D v5-His-TOPO
vector, were used for the analysis of both human G6PC2 and mouse G6pc2 expression:
pcDNA Forward 5’ CCCAAGCTTGGTACCGAGCTCGGATCCAGT
pcDNA Reverse 3’ CCCGTTTAACTCAATGGTGATGGTGATGATGACCGGTA
The pcDNA forward primer recognizes 5’ untranslated leader sequence in the mRNA. This sequence
represents part of the polylinker 3’ of the CMV transcription start site. The pcDNA reverse primer
recognizes 3’ untranslated sequence in the mRNA. This sequence represents the region immediately 3’ of
the V5 His tag.
Monkey cyclophilin A (PPIA) expression was quantitated as an internal control using the following
primers:
Monkey PPIA Forward 5’-AATGGCACTGGTGGCAAGTC -3’
Monkey PPIA Reverse 5’- GCTCCATGGCCTCCACAATA -3’
Ins2 Forward 5’-CACCCAGGCTTTTGTCAAGC-3’
Ins2 Reverse 5’-CCAGTGCCAAGGTCTGAAGG-3’

49
Protein Expression Analysis by Transient Transfection, Western blotting and Luciferase Assays
Semi-confluent 832/13 or Cos7 cell lines were used for all transfection experiments. For luciferase
assays, cells were cultured and co-transfected with plasmids encoding WT or mutated hG6PC2, mG6pc2 or
mG6pc in the pcDNA3.1D v5-His-TOPO vector (2ug) and the Renilla luciferase expression vector (0.5ug)
using lipofectamine as previously described [66, 254-256]. After the transfection, cells were incubated for
18-20 hours in serum-containing medium supplemented with 2 or 30 mM glucose. As previously described,
the cells were harvested and Renilla and firefly luciferase activity were assayed using the Promega Dual-
Luciferase Reporter Assay System according to the manufacturer’s instructions [255]. To correct for
variations in transfection efficiency, the results were calculated as a ratio of firefly to Renilla luciferase
activity. Results were presented either as this ratio or relative to the ratio obtained with 30 mM glucose or
relative to the ratio obtained at 30 mM glucose with either catalytically dead G6pc1 or WT G6pc1. The data
was analyzed using the principles described in the novel 832/12 transcription assay described in chapter
VII. Each construct was analyzed in duplicate across multiple transfections using at least two independent
plasmid preparations.
For protein expression analysis, as just described, semi-confluent cells were cultured and
transfected with V5-his tagged WT or mutated hG6PC2, mG6pc2 or mG6pc (2ug) using lipofectamine [61,
254]. After the transfection, cells were incubated for 18-20 hours in serum-containing medium. Cells were
harvested using passive lysis buffer and protein was isolated. Protein samples were quantified using the
BCA Protein Assay Kit according to manufacturer’s instructions as previously described [257]. Western
blots were performed using a 10% SDS-PAGE gel and transferred to a PVDF membrane. Protein expression
was determined by immunoblotting with a mouse monoclonal Anti-V5-HRP antibody (1:100-1:5000,
Invitrogen). A primary Anti-Beta Actin monoclonal antibody (1:10,000, Sigma) with an Anti-Mouse HRP
secondary antibody was used as a loading control (1:10,000, Promega). Protein bands were detected using
ECL reagent (Pierce Thermo Fisher Scientific). Protein expression data were normalized by scanning both
50
V5 and actin signals on Western blots. The ratio of V5 to actin expression obtained with the variants shown
was expressed as a percentage relative to the ratio obtained with WT human G6PC2 or mouse G6pc1.
The expected sizes of human G6PC2, mouse G6pc2, human G6PC1 and mouse G6pc1 with V5 His
tags are 45.60, 45.71, 45.54 and 45.51 kDa. As previously observed, both the human G6PC1 [55] and mouse
G6pc1 [56] expression plasmids generate doublets, possibly though the use of alternate methionine start
codons (Fig. 7.6).
Fusion Gene Analyses
The construction of wild type human G6PC2-luciferase fusion genes have been previously described
[255], as have G6PC2 SNP promoter variants [79, 80]. Site directed mutations of the Maf and GR binding
sites in the G6PC2 promoter and 5’ truncations were constructed using PCR as described [79, 80]. The
mouse G6pc2 promoter was isolated using PCR and 129SvEv or C57BL/6J genomic DNA as the template.
Cells were transfected using lipofectamine as described [255] and incubated for 18-20 hrs in the
indicated concentration of Dex prior to harvesting.
Gel Retardation Assays
Gel retardation assays were used to assess MafA binding exactly as previously described [255].
Statistical Analyses
Mouse data were analyzed using a two-way ANOVA assuming normal distribution and equal
variance. A post hoc analysis was performed using the Bonferroni correction for multiple comparisons. The
level of significance was as indicated. Other data including analysis of time zero basal glucose and singular
time point measurements were analyzed using Student’s t-test: two sample assuming equal variance or
one-way ANOVA’s. The level of significance was as indicated (two-sided test).
To analyze genetic associations with lipids in BioVU, we used the median value for each individual.
The associations between the genotypes and the aggregated laboratory values (as continuous variables)
were performed on R with linear model, adjusted for age, sex, and body mass index (BMI). We report beta

51
values, 95% confidence intervals (CI), and p values. P < 0.05 was considered to be significant. All tests
assumed a two-tailed distribution.
52
III. G6PC2 MODULATES FASTING BLOOD GLUCOSE IN MALE MICE IN RESPONSE TO STRESS
Introduction The role of G6PC2 in islet β-cells has been extensively covered in the introduction of this
dissertation. Figure 1.1 highlights the main function of G6PC2 to hydrolyze G6P to glucose and a free
phosphate, thereby creating a futile cycle that opposes the actions of glucokinase. Previous data supports
the role of G6PC2 as a negative regulator of GSIS and as contributing to glucose cycling in β-cells [69].
Because chronically elevated FBG has been associated with both increased risk for cardiovascular-
associated mortality [72] and the development of T2D [70], this implies that G6PC2 is actually detrimental
to health in the modern Western environment, which is associated with nutrient excess and longevity. In
contrast, during evolution the ability of G6PC2 to regulate FBG must have conferred a specific advantage.
We hypothesized that factors that induce G6PC2 expression would confer a transient beneficial change in
FBG. We therefore screened for factors that regulate G6PC2 promoter activity. In this study we show that
glucocorticoids stimulate G6PC2 expression and we present in vivo data suggesting that G6PC2 may have
evolved to modulate FBG in response to stress.
Results
Dexamethasone Stimulates Human G6PC2 Expression Although chronically elevated G6PC2 expression increases FBG and is detrimental over the long
term to human health we hypothesized that the ability of G6PC2 to transiently regulate FBG must
nonetheless confer an evolutionarily conserved benefit. We therefore screened factors known to regulate
FBG to determine whether they could also modulate G6PC2 promoter activity. Figure 3.1A shows that the
synthetic glucocorticoid Dex stimulates a marked, concentration dependent activation of the human G6PC2
promoter, as assessed by fusion gene transient transfection assays in the TC-3 islet-derived cell line. The
effect of Dex was enhanced by co-transfection with a plasmid encoding the glucocorticoid receptor (GR)
(Fig. 3.1B), consistent with previous studies that observed a limiting intracellular concentration of this

53
receptor [258]. A similar marked stimulation of human G6PC2–luciferase fusion gene expression by Dex
was observed in primary mouse islet cells (Fig. 3.1C). Furthermore Dex stimulated endogenous G6PC2 and
SLC37A4 gene expression in primary human islets (Fig. 3.1D). Human G6PC2–luciferase fusion gene
expression was also induced by the endogenous glucocorticoid corticosterone (Fig. 3.1E).
To localize the G6PC2 glucocorticoid response element (GRE) a series of 5' truncated G6PC2-
luciferase fusion genes were analyzed by transient transfection. Figure 3.1F shows that Dex-stimulated
fusion gene expression was abolished when the region of the promoter between -171 to -131 was deleted.
Visual inspection of this region identified the presence of a putative GRE [259] that is conserved across
multiple species (Fig. 3.1G). A point mutation of a nucleotide in this putative GRE known to be required for
GR binding (Fig. 3.1G; [259]), in the context of an otherwise intact promoter, had a limited effect on basal
fusion gene expression but abolished the Dex response (Fig. 3.1H).
Dexamethasone Stimulates 129SvEv but not C57BL/6J Mouse G6pc2 Promoter Activity We next sought to confirm that Dex also regulates mouse G6pc2 gene expression in vivo.
Surprisingly, 3 hours following a single Dex injection we observed that endogenous pancreatic G6pc2
expression was induced in 129SvEv (Fig. 3.2A) but not C57BL/6J (Fig. 3.2B) mice, whereas Slc37a4 gene
expression was induced in both (Figs. 3.2A & B). Consistent with these in vivo gene expression data, Dex
only stimulated endogenous G6pc2 expression in isolated 129SvEv islets (Fig. 3.2C) but not C57BL/6J islets
(Fig. 3.2D), whereas Slc37a4 gene expression was induced in both 129SvEv (Fig. 3.2E) and C57BL/6J (Fig.
3.2D) islets.
An explanation for this unexpected result became apparent from sequence analyses, which revealed
that the alternate alleles of a mouse SNP, rs32980497, affect a key nucleotide in the G6pc2 GRE, that is
required for GR binding [259]. 129SvEv mice, but not C57BL/6J mice, harbor the allele that supports GR
binding (Fig. 3.1G).

54
Figure 3.1. Dexamethasone Stimulates Human G6PC2 Expression. A: Induction of G6PC2-luciferase fusion gene expression in TC-3 cells by Dex. B: Co-transfection of an expression vector encoding the glucocorticoid receptor (GREV) enhances the induction of G6PC2-luciferase fusion gene expression in TC-3 cells by Dex (250 nM). C: Induction of G6PC2-luciferase fusion gene expression in dispersed primary mouse islet cells by Dex (250 nM). These primary cells represent a mixed population of islet cell types. D: Induction of endogenous G6PC2 and SLC37A4 gene expression in human islets by Dex. Human islets were treated for 3 hrs with 250 nM Dex. E: Induction of G6PC2-luciferase fusion gene expression in 832/13 cells by corticosterone (250 nM). F: Localization of the G6PC2 GRE through the analysis of the effect of Dex (250 nM) on truncated G6PC2-luciferase fusion gene expression in TC-3 cells. G: Cross-species sequence alignment of the G6PC2 GRE and comparison with the consensus [259]. H: Point mutation of the G6PC2 GRE reduces basal G6PC2-luciferase fusion gene expression in TC-3 cells and abolishes the effect of Dex (250 nM). Results show the mean ± S.E.M. of 3-4 experiments. *p < 0.05 versus control.

55
Figure 3.2. Dexamethasone Stimulates 129SvEv but not C57BL/6J Mouse G6pc2 Promoter Activity. A-B: Selective induction of G6pc2 gene expression in 129SvEv (A) but not C57BL/6J (B) mice by short term Dex treatment. Pancreatic RNA was isolated from mice (129SvEv, n=6; C57BL/6J n=6) 3 hrs following injection with PBS or Dex phosphate (13 g/g). Results show the mean ± S.E.M. *p < 0.05 versus control. C-E: Induction of G6pc2 and Slc37a4 gene expression in 129SvEv (C; E) and C57BL/6J (D) mouse islets by Dex. RNA was isolated from islets incubated for 3 hrs in the presence or absence of variable concentrations (C; E) or 250 nM (D) Dex. Results show the mean ± S.E.M. of 3-9 experiments. *p < 0.05 versus control. F-G: Dex-stimulates 129SvEv (F) but not C57BL/6J (G) G6pc2-luciferase fusion gene expression in 832/13 cells. Results show the mean ± S.E.M. of 3 experiments. *p < 0.05 versus control. H: The stimulation of C57BL/6J G6pc2-luciferase fusion gene expression in 832/13 cells by Dex is modulated by the alternate alleles of rs32980497. Results show the mean ± S.E.M. of 3 experiments. *p < 0.05 versus control. Different vectors (F, G: pGL4) and (H: pGL3) were used in these experiments, explaining the differences in basal expression.

56
As a result, Dex markedly activates the 129SvEv G6pc2 promoter (Fig. 3.2F) but not the C57BL/6J G6pc2
promoter (Fig. 3.2G), as assessed by fusion gene transient transfection assays. Four other nucleotides differ
between the proximal C57BL/6J and 129SvEv G6pc2 promoters (data not shown) but substitution of the
alternate allele of rs32980497 in the C57BL/6J promoter is sufficient to restore responsiveness to Dex (Fig.
3.2H). The reverse experiment, mutating the equivalent nucleotide in the human G6PC2 promoter,
abolishes the Dex response (Fig. 3.1H).
The Induction of G6pc2 in Response to Physical Restraint Modulates FBG in 129SvEv Mice Previous studies have shown that G6Pase activity and glucose cycling are increased in islets isolated
from Dex-injected mice [229, 231]. These observations, which were published before the G6PC2 gene was
identified [260], can now be explained by the induction of G6PC2 gene expression by glucocorticoids and
are entirely consistent with our model of G6PC2 function. To extend these in vitro isolated islet studies, we
next sought to study the physiological consequences of glucocorticoid-stimulated 129SvEv G6pc2
expression in vivo.
For these studies the G6pc2 KO allele was backcrossed onto the 129SvEv genetic background using
a speed congenic approach [69]. Before analyzing the effect of G6pc2 deletion on the response to
glucocorticoids in 129SvEv mice, we first sought to compare the effect of G6pc2 deletion on FBG and
glucose tolerance in control 129SvEv mice. As seen in mixed genetic background [96] and C57BL/6J mice
[69] FBG was reduced in 129SvEv G6pc2 KO mice relative to WT mice whereas fasting insulin was
unchanged (Figs. 3.3A & B). As in C57BL/6J mice [69], IPGTTs showed no difference in glucose tolerance
between WT and G6pc2 KO 129SvEv mice (Fig. 3.3C). These data suggest that G6pc2 regulates FBG rather
than glucose tolerance in control 129SvEv mice as previously observed in C57BL/6J mice [69].
To study the physiological consequences of glucocorticoid-stimulated 129SvEv G6pc2 expression in
vivo, we examined the effect of a 10 day, repeated physical restraint experimental paradigm [245] on FBG
in 129SvEv G6pc2 WT and KO mice. Figure 3.3D shows that this treatment stimulated endogenous

57
pancreatic G6pc2 and Slc37a4 gene expression in 129SvEv mice with little change in body weight (Fig.
3.3E). This paradigm is associated with elevated endogenous glucocorticoid levels (Fig. 3.3F) but also the
activation of many other autonomic and neuroendocrine axes, beside the hypothalamic-pituitary-adrenal
axis, resulting in the release of epinephrine and norepinephrine [261]. The observed induction of G6pc2
expression could therefore be mediated by factors in addition to glucocorticoids. This presumably explains
why G6pc2 expression is also induced to a lesser degree in C57BL/6J mice (Fig. 3.3G), despite the GRE
mutation (Fig. 3.1G).
We have previously shown that, under fasting conditions, insulin levels are identical in WT and
G6pc2 KO mice, but FBG is lower in G6pc2 KO mice due to a leftward shift in the dose response curve for
GSIS [69]. We hypothesized that the induction of G6pc2 expression by physical restraint would enhance
this existing difference in FBG between WT and KO mice (Fig. 3.3H & I). However, we reasoned that the
physiological benefit conferred by G6pc2 induction would depend on the overall combined effects of
physical restraint on whole body glucose metabolism in vivo because FBG is determined by multiple factors
other than G6PC2. We predicted that if physical restraint results in an elevation in FBG in WT mice then
the induction of G6pc2 expression would contribute to that elevation and it would be prevented or reduced
in G6pc2 KO mice (Fig. 3.3H). On the other hand we predicted that if physical restraint results in
hypoglycemia in G6pc2 KO mice then the induction of G6pc2 expression in WT mice would limit or prevent
hypoglycemia (Fig. 3.3I). Following a 6 hr fast, FBG was unchanged in physically restrained 129SvEv WT
mice but decreased in physically restrained 129SvEv G6pc2 KO mice (Fig. 3.3J), indicating that the
difference in FBG between 129SvEv WT and KO mice was enhanced by physical restraint and that the
induction of G6pc2 expression protects against low blood glucose, consistent with the model shown in
Figure 3.3I. Fasting insulin levels were unchanged in 129SvEv mice following physical restraint (Fig. 3.3K),
again consistent with the model shown in Figure 3I. Physical restraint had no effect on FBG in C57BL/6J
mice (Fig. 3.3L) consistent with the small change in G6pc2 expression (Fig. 3.3G). In these studies no
difference in FBG was observed between control 129SvEv (Fig. 3.3J) or C57BL/6J (Fig. 3.3L) WT and KO

58
mice because the difference in FBG is small such that it is only consistently observed with much higher n
values (Fig. 3.3A; Ref. [69]). In contrast a clear difference in FBG was observed in physically restrained
129SvEv WT and KO mice (Fig. 3.3J).
Discussion
We show here that the synthetic glucocorticoid Dex induces human G6PC2 promoter activity (Fig.
3.1). Dex also induces 129SvEv but not C57BL/6J mouse G6pc2 promoter activity, the difference being due
to a mutation in the C57BL/6J promoter GR binding site (Fig. 3.2). In response to stress generated by
physical restraint, G6pc2 expression is induced, enhancing the difference in FBG between 129SvEv WT and
KO mice and protecting against low blood glucose (Fig. 3.3). Thus while in modern society the chronic
influence of G6PC2 on FBG affects the risks of cardiovascular-associated mortality and T2D, our data
suggest that G6PC2 may have initially evolved to transiently modulate FBG under conditions of
glucocorticoid-related stress. Interestingly, G6PC2 expression is decreased in islets isolated from
individuals with T2D [262] but it is unclear whether this contributes to islet dysfunction, given that the
resulting enhanced glycolytic flux would promote the cytotoxic effects of glucose [263], or whether,
because this would also lead to enhanced insulin secretion, this represents a compensatory change in
unhealthy islets designed to maintain glucose homeostasis.
The widely accepted dogma with respect to the effect of glucocorticoids on glucose metabolism in
both rodents and humans in vivo is that they inhibit glucose uptake by inducing insulin resistance, stimulate
hepatic glucose production and inhibit insulin secretion, thereby inducing glucose intolerance [129, 181].
While the resulting increase in blood glucose is considered beneficial during periods of transient stress
[201], prolonged elevation of glucocorticoids, as occurs in Cushing’s disease [264], can lead to diabetes. In
contrast our studies (Fig. 3.3) and others [219] demonstrate the complexity of glucocorticoid physiology
by suggesting that, in some experimental paradigms, glucocorticoid action leads to improved FBG and/or
glucose tolerance.

59
Figure 3.3. The Induction of G6pc2 in Response to Physical Restraint Modulates FBG and Glucose Tolerance in 129SvEv Mice. A & B: Blood glucose (Panel A) and plasma insulin (Panel B) levels in control 6 hr fasted 129SvEv male WT (n=16) and G6pc2 KO (n=14) mice. Results show the mean ± S.E.M. *p < 0.05 versus WT. C: IPGTTs using 2.0 g/kg glucose performed on 6 hr fasted conscious male WT (n=13) and G6pc2 KO (n=11) mice. D: Induction of G6pc2 and Slc37a4 gene expression in 129SvEv mice by physical restraint (PR). Pancreatic RNA was isolated following a 6 hr fast from control (C) mice and mice that had been physically restrained (PR) (n=10-11). G6pc2 and Slc37a4 expression were quantitated using real-time PCR. *p < 0.05 versus control. E: Weight change in 129SvEv (WT, n=21; KO, n=22) mice following physical restraint (PR). Results show the mean ± S.E.M. *p < 0.05 versus initial body weight. The difference in weight loss between WT and KO was significant (**p < 0.05). F: Induction of plasma corticosterone by physical restraint (PR). Blood was isolated following a 3 hr fast from control (C) mice and mice that had been physically restrained (PR) (n=7-10). *p < 0.0001, one-way ANOVA. G: Induction of G6pc2 and Slc37a4 gene expression in C57BL/6J mice by physical restraint. Pancreatic RNA was isolated following a 6 hr fast from control (C) mice and mice that had been physically restrained (PR) (n=8). G6pc2 and Slc37a4 expression were quantitated using real-time PCR. *p < 0.05 versus control.

60
H & I: Diagrams proposing that the induction of G6pc2 expression by physical restraint (PR) will increase the difference in FBG between fasted WT and KO mice. The diagrams indicated that the actual values of the X axis (glucose) may be shifted to the right (Panel G) or left (Panel H), relative to those in control mice, depending on the effects of PR on other aspects of metabolism. In either case, FPI levels are predicted to not differ between WT and G6pc2 KO mice, as observed in control mice [69]. J: Blood glucose levels in 6 hr fasted conscious control (C) (WT, n=13; KO, n=11) or 6 hr fasted conscious physically restrained (PR) (WT, n=8; KO, n=10) 129SvEv male mice. Results show the mean ± S.E.M. *p < 0.0001, one-way ANOVA; NS, not significant. K: Plasma levels in 6 hr fasted conscious control (C) (WT, n=16; KO, n=14) or 6 hr fasted conscious physically restrained (PR) (WT, n=21; KO, n=24) 129SvEv male mice. Results show the mean ± S.E.M. L: Glucose levels in 6 hr fasted conscious control (C) (WT, n=12; KO, n=15) or physically restrained (PR) (WT, n=6; KO, n=7) C57BL/6J male mice. Results show the mean ± S.E.M.

61
Thus in 6 hr fasted mice this induction of G6pc2 by glucocorticoids limits the decrease in FBG (Fig. 3.3I)
which increases circulating glucose levels that could provide energy under stressful circumstances relative
to KO mice. While in the physical restraint paradigm the induction of G6pc2 expression protects against
low blood glucose (Fig. 3.3H) we predict that in other stress-associated paradigms this induction may
contribute to a transient increase in FBG (Fig. 3.3G), which could be a survival mechanism that is valuable
for keeping the brain supplied with glucose is times of stress [201].
In summary, our data suggest that G6PC2 may have initially evolved to transiently modulate the
sensitivity of GSIS to glucose under conditions of glucocorticoid-related stress. G6PC2 is thought to be
expressed exclusively in pancreatic islet β-cells [78, 82] but future studies on beta-cell specific KO mice
will be required to prove that low G6pc2 expression in rare cell types is not regulating FBG and FPI through
other mechanisms.

62
IV. G6PC2 MODULATES THE EFFECTS OF DEXAMETHASONE ON FASTING BLOOD GLUCOSE AND GLUCOSE TOLERANCE
Introduction Experiments using perfused pancreata and isolated islets demonstrate that deletion of G6pc2
enhances the sensitivity of GSIS to glucose, by shifting the dose response curve for GSIS to the left, rather
than affecting maximal GSIS [69]. This has two consequences. First, GSIS is enhanced in G6pc2 KO islets at
sub-maximal but not maximal glucose levels [69]. Second, this results in a counterintuitive reduction in
FBG levels in G6pc2 KO mice that is associated with no change in FPI levels [69, 96, 265]. These
observations are consistent with data from GWAS showing that common SNPs in the G6PC2 locus are
associated with variations in FBG but not FPI [82, 266].
Since chronically elevated FBG is associated with increased risk for the development of both T2D
[70] and cardiovascular-associated mortality [72] it implies that high G6PC2 expression is actually
detrimental to health over the long term. However, presumably during evolution the ability of G6PC2 to
regulate FBG must have conferred a specific advantage. We recently showed that glucocorticoids induce
G6PC2 expression and speculated that G6PC2 evolved to transiently modulate FBG in response to stress
[265]. We extend that observation here by exploring the mechanism by which the GR regulates G6PC2
promoter activity and how G6pc2 deletion modulates the effects of the synthetic glucocorticoid Dex on FBG
and glucose tolerance.
Results
The Glucocorticoid Receptor Stimulates G6PC2 Promoter Activity by Displacing MafA We have previously shown that corticosterone and Dex markedly activate the human G6PC2
promoter through a GRE located between -171 and -157 relative to the transcription start site [265].
Sequence analyses suggest that the G6PC2 GRE overlaps a binding site for the islet-enriched transcription
factor MafA (Fig. 4.1A) [267]. This putative human G6PC2 MafA binding site shows conservation at 13/14
nucleotides with a previously identified MafA binding site in the mouse G6pc2 promoter that contributes

63
to basal G6pc2 promoter activity [255]. Gel supershift assays confirmed that this human G6PC2 promoter
region also binds MafA (Fig. 4.1B). This raised the mechanistic question as to whether MafA and GR
compete for binding to this promoter region or whether MafA is acting as an accessory factor to stabilize
GR binding and promote glucocorticoid signaling. Thus, while the G6PC2 GRE closely matches the
endogenous consensus sequence (Fig. 4.1A), this is not the optimal sequence for high affinity GR binding
[259] such that accessory factor involvement is likely required for glucocorticoid signaling [268]. To
address this question, two G6PC2 promoter site-directed mutants (SDMs) were generated, designated Maf
SDM 1 and 2, that were predicted to reduce or increase MafA binding, respectively, without affecting GR
binding (Fig. 4.1A). The Maf SDM 1 mutation disrupts nucleotides that are required for MafA binding
whereas the Maf SDM 2 mutation enhances the G6PC2 MafA binding site such that it matches the consensus
sequence (Fig. 4.1A). Neither mutation disrupts nucleotides required for GR binding (Fig. 4.1A).
Gel retardation competition assays demonstrated that these mutations have the anticipated effect
on MafA binding (Fig. 4.1C; Fig. 4.2). When analyzed by transient transfection in TC-3 cells, the Maf SDM
1 mutation, which reduced MafA binding (Fig. 4.1C), led to reduced basal fusion gene expression (Fig. 4.1D),
whereas the Maf SDM 2 mutation, which increased MafA binding (Fig. 4.1C), led to increased basal fusion
gene expression (Fig. 4.1E). These data confirm the importance of MafA for basal G6PC2 promoter activity
as observed for the mouse G6pc2 promoter [255]. These mutations altered G6PC2 promoter activation by
Dex (Fig. 4.1F-I). When expressing data as fold induction (Fig. 4.1F & G), the Maf SDM 1 mutation enhanced
the Dex response (Fig. 4.1F) whereas the Maf SDM 2 mutation impaired the Dex response (Fig. 4.1G)
leading to the conclusion that MafA and GR compete for binding rather than MafA acting as an accessory
factor supporting GR binding. In contrast, when expressing data as maximal induction (Fig. 4.1H & I), both
the Maf SDM 1 (Fig. 4.1H) and Maf SDM 2 (Fig. 4.1I) mutations impaired the Dex response such that only
the SDM2 data support a competition model. However, co-transfection experiments demonstrated that
overexpression of MafA (Fig. 4.1J) but not NeuroD (Fig. 4.1K), which binds an E-Box in the G6pc2 promoter

64
[269], impairs the Dex response again leading to the conclusion that MafA and GR compete for binding
rather than MafA acting as an accessory factor supporting GR binding.
With a view to further exploring this model through the use of chromatin immunoprecipitation
(ChIP) assays, we also examined Dex-regulated endogenous gene expression in several islet-derived cell
lines. Dex induced human G6PC2-luciferase fusion gene expression in the mouse TC-3 [265], NIT-1 (Fig.
4.3A), TC-tet (Fig. 4.3B) and hamster HIT (Fig. 4.3C) islet-derived cell lines, with the effect of Dex being
enhanced in each case by co-transfection with a plasmid encoding the glucocorticoid receptor, consistent
with previous studies that observed a limiting intracellular concentration of this receptor [258]. However,
it failed to induce endogenous G6pc2 gene expression (data not shown). In the TC-3 and NIT-1, but not
the TC-tet and HIT cell lines, the lack of Dex-induced endogenous G6pc2 expression is likely explained by
the absence of a consensus GRE in the G6pc2 promoter (Fig. 4.3D). However, Dex stimulates endogenous
Fkbp5 and Sgk expression (Fig. 4.4), but not Slc37a4 gene expression (data not shown), in the three mouse
cell lines suggesting that G6pc2 and Slc37a4 gene expression are regulated by Dex through mechanisms
that are not recapitulated in these islet-derived cell lines. We also considered ChIP assays in primary islets
but the effect of Dex on G6pc2 (Fig. 4.1E), and Slc37a4 (Fig. 4.1F), gene expression were transient and
reduced in magnitude relative to effects on the endogenous genes in mouse pancreas in vivo [265].
The rs2232316 G6PC2 SNP has Opposite Effects on Basal and Dex-Stimulated Promoter Activity
The transcription factor Foxa2 is required for endogenous G6pc2 expression in mouse islets [270]
and high G6pc2 promoter activity [255].

65
Figure 4.1. The Glucocorticoid Receptor Stimulates G6PC2 Promoter Activity by Displacing MafA. A: The G6PC2 GRE overlaps a binding site for MafA [267]. B: Gel retardation supershift assays demonstrate that MafA binds the -182/-154 G6PC2 promoter region. The c-Maf antiserum cross-reacts with MafA [255]. A representative gel is shown. C: Gel retardation competition experiments demonstrate that the order of MafA binding affinity to the sequences shown in Panel A is Maf SDM 2 > WT > Maf SDM 1. A representative gel is shown. D-I: Effect of promoter mutations on basal and Dex-stimulated G6PC2-luciferase fusion gene expression in
TC-3 cells. A reduction in MafA binding (Maf SDM 1) decreases basal expression but has little effect on the Dex response. An increase in MafA binding (Maf SDM 2) increases basal expression and reduces the Dex response. Results show the mean ± S.E.M. of 3 experiments. *p < 0.05 versus control. J-K: Effect of MafA (J) or NeuroD (K) overexpression on Dex-stimulated G6PC2-luciferase fusion gene expression in 832/13 cells. Overexpression of MafA but not NeuroD inhibits G6PC2-luciferase fusion gene expression. Results show the mean ± S.E.M. of 3 experiments. *p < 0.05 versus control.
Figure 4.2. Gel Retardation Competition Assay with Maf Mutants. Experiment was performed as described in Materials and Methods.

66
Figure 4.3. Dexamethasone Stimulates G6PC2 Promoter Activity in Multiple Islet-Derived Cell Lines. A-C: Co-transfection of an expression vector encoding the glucocorticoid receptor (GREV) enhances the induction of G6PC2-luciferase fusion gene expression in NIT-1, TC-Tet and HIT cells by Dex (250 nM). Results show the mean ± S.E.M. of 3 experiments. *p < 0.05 versus control. D: Cross-species sequence alignment of the G6pc2 GRE in various cell lines and comparison with the consensus. E-F: Induction of G6pc2 (E) and Slc37a4 (F) gene expression in 129SvEv mouse islets by Dex. RNA was isolated from islets incubated in the presence or absence of 250 nM Dex for the times indicated. Results show the mean ± S.E.M. of 3-9 experiments. *p < 0.05 versus control.
Figure 4.4. Dexamethasone Does Not Stimulate Fkbp or Sgk Gene Expression in Multiple Islet-Derived Cell Lines. A-B: Endogenous Fkbp (A) or Sgk (B) is not induced in NIT-1, TC-Tet or HIT cells by Dex (250 nM). Results show the mean ± S.E.M. of 3 experiments.

67
Because in the related G6pc1 gene Foxa2 can act as an accessory factor to enhance glucocorticoid-
stimulated gene expression [165] and since the G6PC2 promoter contains two Foxa2 binding sites, located
between −261 and −250 and between −246 and −235, we investigated whether Foxa2 also acts as an
accessory factor to enhance glucocorticoid-stimulated G6PC2 gene expression. Specifically we investigated
the effect of two common SNPs in each of these Foxa2 binding sites, rs573225, located at −259, and
rs2232316, located at −238, that we have previously shown affect Foxa2 binding and basal G6PC2 fusion
gene expression [79, 80]. The ‘G’ allele of rs573225 is associated with altered kinetics of Foxa2 binding and
increased basal promoter activity (Fig. 4.5A; [80]). However, Figure 4.5B shows that this SNP has no effect
on Dex-induced G6PC2-luciferase fusion gene expression. In contrast, while the ‘A’ allele of rs2232316 is
associated with enhanced Foxa2 binding affinity and increased basal promoter activity (Fig. 4.5C; [79]),
Figure 4.5D shows that it is also associated with reduced Dex-induced G6PC2-luciferase fusion gene
expression. These data suggest that it is unlikely Foxa2 acts as an accessory factor to enhance Dex-
stimulated G6PC2 gene expression through binding to these sites. Moreover, while rs573225 and
rs2232316 are both genetically associated with variations in FBG [79, 80], the data in Figure 4.3D suggest
that whether rs2232316 has a positive or negative influence on FBG may be dependent on glucocorticoid
levels.
G6pc2 Modulates the Effect of Dexamethasone on FBG and Glucose Tolerance in 129SvEv Mice
We have previously studied the physiological consequences of glucocorticoid-stimulated 129SvEv
G6pc2 expression on FBG in 129SvEv G6pc2 WT and KO mice using a repeated physical restraint
experimental paradigm [265]. This treatment stimulated endogenous pancreatic G6pc2 and Slc37a4 gene
expression in 129SvEv mice but is associated not only with activation of the hypothalamic-pituitary-
adrenal axis and elevated endogenous glucocorticoid levels [265], but also with activation of many other
autonomic and neuroendocrine axes resulting in the release of epinephrine and norepinephrine [261]. The

68
observed induction of G6pc2 expression could therefore have been mediated, in part, by factors in addition
to glucocorticoids.
Given this caveat, we examined the impact of G6pc2 deletion on the action of glucocorticoids using
an alternate experimental paradigm involving 5 days of once daily Dex injections [244]. Figure 4.6 shows
that a dose of 13 ug/g Dex induced both pancreatic G6pc2 and Slc37a4 expression. This is consistent with
our previous studies showing that Dex markedly activates the 129SvEv G6pc2 promoter as well as acutely
stimulating endogenous G6pc2 gene expression in primary 129SvEv mouse islets and mouse pancreas in
vivo [265]. Surprisingly, Dex had little effect on hepatic G6pc1 and Slc37a4 expression in 129SvEV mice in
vivo, despite the fact that both gene promoters are activated by Dex in hepatoma cells [165, 271]. This
probably is because plasma insulin is elevated in Dex treated 129SvEv mice (see below) and insulin
suppresses both G6pc1 and Slc37a4 gene expression [251, 272].
We have previously shown in mixed genetic background [96], C57BL/6J [69] and 129SvEv [265]
mice that FPI levels are identical in WT and G6pc2 KO mice, but FBG is lower in G6pc2 KO mice. This
counterintuitive change in glucose without a change in insulin occurs because deletion of G6pc2 results in
a leftward shift in the dose response curve for GSIS rather than a change in maximal GSIS [69]. We
hypothesized that the induction of G6pc2 expression by Dex would enhance this existing difference in FBG
between WT and KO mice (Fig. 4.7A & B). However, we reasoned that the physiological benefit conferred
by G6pc2 induction would depend on the overall combined effects of Dex on whole body glucose
metabolism in vivo because FBG is determined by multiple factors other than G6PC2. We predicted that if
Dex results in an elevation in FBG in WT mice, then the induction of G6pc2 expression would contribute to
that elevation and it would be prevented or reduced in G6pc2 KO mice (Fig. 4.7A). On the other hand, we
predicted that if Dex results in hypoglycemia in G6pc2 KO mice, then the induction of G6pc2 expression in
WT mice would limit or prevent hypoglycemia (Fig. 4.7B).

69
Figure 4.5. The rs2232316 G6PC2 SNP has Opposite Effects on Basal and Dex-Stimulated Promoter Activity. The influence of the alternate alleles of the rs573225 and rs2232316 SNPs on basal (A, C) and Dex-stimulated (B, D) G6PC2-luciferase fusion gene expression was analyzed by transient transfection in
TC-3 cells. The rs573225-G and rs2232316-A alleles both increase basal expression but only the rs2232316-A allele affects the Dex response. Results show the mean ± S.E.M. of 3 experiments. *p < 0.05 versus control.
Figure 4.6. Chronic Dexamethasone Treatment Stimulates Pancreatic G6pc2 Gene Expression in 129SvEv Mice. Effect of chronic Dex treatment on pancreatic G6pc2 and Slc37a4 (A-C) and hepatic G6pc1 and Slc37a4 (D-F) gene expression in 129SvEv mice. Pancreatic RNA was isolated following a 6 hr fast from control mice and mice that had received daily injections of the indicated amount of Dex phosphate for 5 days. Results show the mean ± S.E.M. of 3 experiments. *p < 0.05 versus control.

70
Unexpectedly 5/17 WT (Fig. 4.7C) and 5/15 G6pc2 KO (Fig. 4.7D) mice developed diabetes following Dex
treatment, defined here as a blood glucose level >200 mg/dl at the 60 min time point in an intraperitoneal
glucose tolerance test (IPGTT). The molecular basis for the development of diabetes in a sub-set of mice is
unknown, though this variable effect of Dex treatment on diabetes incidence resembles that in a previous
study by Ogawa et al. [175] who observed a 16% incidence of diabetes in Dex treated Wistar rats.
Considering only the non-diabetic 129SvEv WT and G6pc2 KO mice, prolonged Dex treatment was
associated with modest ~3% weight loss (Fig. 4.7E). Following a 6 hr fast, the difference in FBG between
control 129SvEv WT and KO mice was similar to the difference in FBG between Dex treated 129SvEv WT
and KO mice, however, only the latter difference was statistically significant (Fig. 4.7F). This likely reflects
the fact that large n values are usually required to detect the difference in FBG between control WT and
G6pc2 KO mice [69, 96, 265]. Figure 4.7F also shows that FBG was decreased in Dex treated 129SvEv G6pc2
KO relative to control KO mice. While FBG was statistically unchanged in Dex treated 129SvEv WT relative
to control WT mice, there was a clear trend towards reduced FBG in WT mice. Overall these data suggest
that the induction of G6pc2 expression by Dex did not markedly enhance the difference in FBG between
WT and KO mice. Nevertheless, the presence of G6pc2 in WT mice is clearly protecting against low blood
glucose, resembling the model shown in Figure 4.7B. As in control mice, FPI levels did not differ between
Dex treated 129SvEv WT and G6pc2 KO mice (Fig. 4.7G). However, FPI levels were higher in both WT and
KO mice following Dex treatment presumably due to the well characterized induction of insulin resistance
by Dex [169]. Figure 4.7B therefore represents an oversimplification that does not account for the effect of
Dex on insulin signaling.
Interestingly, Dex treatment improved glucose tolerance in both 129SvEv WT and KO mice relative
to untreated mice and a clear trend (p<0.06) towards a difference in glucose tolerance was apparent
between Dex treated 129SvEv WT and G6pc2 KO mice in contrast to no difference in control mice (Fig.
4.7H). Similarly, following 10 days of repeated physical restraint glucose tolerance was improved in both
129SvEv WT and KO mice relative to untreated mice and in this case a difference in glucose tolerance was

71
apparent between physically restrained 129SvEv G6pc2 KO mice and WT mice in contrast to no difference
in control mice (Fig. 4.7I).
G6pc2 Also Modulates the Effect of Dexamethasone on FBG and Glucose Tolerance in C57BL/6J Mice
We have previously shown that Dex fails to activate the C57BL/6J G6pc2 promoter or acutely
stimulate endogenous G6pc2 gene expression in primary C57BL/6J mouse islets and mouse pancreas in
vivo due to a SNP that inactivates the GRE in the C57BL/6J G6pc2 promoter [265]. Surprisingly, Figure 4.8
shows that daily injections of a dose of 13 ug/g Dex induced both pancreatic G6pc2 and Slc37a4 expression
in C57BL/6J mice, though not as markedly as in 129SvEv mice (Fig. 4.8). This observation suggests that the
regulation of G6pc2 expression by Dex in vivo is mediated through overlapping but distinct acute and
chronic mechanisms in 129SvEv and C57BL/6J mice (Fig. 4.9). In contrast to 129SvEv mice (Fig. 4.6), Dex
treatment induced hepatic expression of both G6pc1 and Slc37a4 in C57BL/6J mice (Fig. 4.8), though
because plasma insulin is elevated in Dex treated C57BL/6J mice (see below) and insulin suppresses both
G6pc1 and Slc37a4 gene expression [251, 272], this probably limited the magnitude of the induction.
Also in contrast to 129SvEv mice (Fig. 4.10), no Dex treated C57BL/6J mice developed diabetes (Fig.
4.10A). Interestingly, as with 129SvEv mice (Fig. 4.7), Dex treatment improved glucose tolerance in both
C57BL/6J WT and KO mice relative to untreated mice (Fig. 4.10A). In addition, a difference in glucose
tolerance was apparent between Dex treated C57BL/6J WT and G6pc2 KO mice in contrast to no difference
in control mice (Fig. 4.10A).
As in 129SvEv mice, prolonged Dex treatment was associated with modest ~4% weight loss in
C57BL/6J mice (Fig. 4.10B). Following a 6 hr fast, the difference in FBG between control C57BL/6J WT and
KO mice was similar to the difference in FBG between Dex treated C57BL/6J WT and KO mice (Fig. 4.10C).
Figure 4.10C also shows that FBG was decreased in Dex treated C57BL/6J G6pc2 KO relative to control KO
mice.

72
Figure 4.7. G6pc2 Modulates the Effect of Dexamethasone on FBG and Glucose Tolerance in 129SvEv Mice. A-B: Diagrams proposing that the induction of G6pc2 expression by Dex will increase the difference in FBG between fasted WT and KO mice. The diagrams indicated that the actual values of the X axis (glucose) may be shifted to the right (Panel A) or left (Panel B), relative to those in control mice, depending on the effects of Dex on other aspects of metabolism. In either case, FPI levels are predicted to not differ between WT and G6pc2 KO mice, as observed in control mice. C: Analysis of glucose tolerance using IPGTTs in 6 hr fasted conscious Dex treated WT 129SvEV mice. Glucose tolerance was significantly different between non-diabetic Dex-treated (n=12) and diabetic Dex-treated (n=5) WT mice based on ANOVA and at the indicated time points based on post-hoc analyses (*p < 0.05). D: Analysis of glucose tolerance using IPGTTs in 6 hr fasted conscious Dex treated KO 129SvEV mice. Results show the mean ± S.E.M. Glucose tolerance was significantly different between non-diabetic Dex-treated (n=10) and diabetic Dex-treated (n=5) KO mice based on ANOVA and at the indicated time points based on post-hoc analyses (*p < 0.05). E: Weight change following 4 days of Dex (D) injections in non-diabetic 129SvEv mice (WT, n=12; KO, n=10). Results show the mean ± S.E.M. *p < 0.05 versus initial body weight.
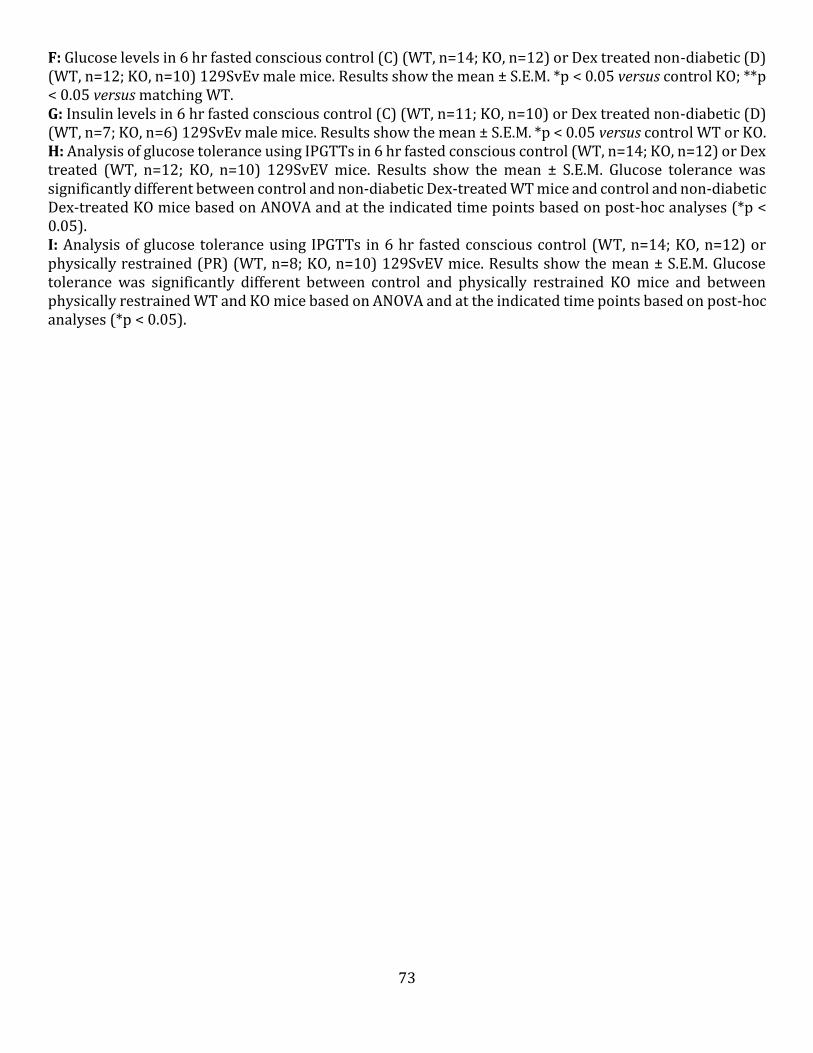
73
F: Glucose levels in 6 hr fasted conscious control (C) (WT, n=14; KO, n=12) or Dex treated non-diabetic (D) (WT, n=12; KO, n=10) 129SvEv male mice. Results show the mean ± S.E.M. *p < 0.05 versus control KO; **p < 0.05 versus matching WT. G: Insulin levels in 6 hr fasted conscious control (C) (WT, n=11; KO, n=10) or Dex treated non-diabetic (D) (WT, n=7; KO, n=6) 129SvEv male mice. Results show the mean ± S.E.M. *p < 0.05 versus control WT or KO. H: Analysis of glucose tolerance using IPGTTs in 6 hr fasted conscious control (WT, n=14; KO, n=12) or Dex treated (WT, n=12; KO, n=10) 129SvEV mice. Results show the mean ± S.E.M. Glucose tolerance was significantly different between control and non-diabetic Dex-treated WT mice and control and non-diabetic Dex-treated KO mice based on ANOVA and at the indicated time points based on post-hoc analyses (*p < 0.05). I: Analysis of glucose tolerance using IPGTTs in 6 hr fasted conscious control (WT, n=14; KO, n=12) or physically restrained (PR) (WT, n=8; KO, n=10) 129SvEV mice. Results show the mean ± S.E.M. Glucose tolerance was significantly different between control and physically restrained KO mice and between physically restrained WT and KO mice based on ANOVA and at the indicated time points based on post-hoc analyses (*p < 0.05).

74
While FBG was statistically unchanged in Dex treated C57BL/6J WT relative to control WT mice, there was
a clear trend towards reduced FBG in WT mice. Overall these data suggest that the induction of G6pc2
expression by Dex did not markedly enhance the difference in FBG between WT and KO mice. Nevertheless,
as in 129SvEv mice (Fig. 4.7F) the presence of G6pc2 in WT mice is clearly protecting against low blood
glucose, resembling the model shown in Figure 4.5B. As in control mice, FPI levels did not differ between
Dex treated C57BL/6J WT and G6pc2 KO mice (Fig. 4.10D), though FPI levels were higher in both WT and
KO mice following Dex treatment, again presumably due to the well characterized induction of insulin
resistance by Dex [169].
Strikingly different results were observed in 24 hr fasted mice. Dex treatment increased FBG in both
C57BL/6J WT and KO mice and a difference in FBG was observed between Dex treated, but not control,
C57BL/6J WT and KO mice (Fig. 4.10E). These results indicate that, in this context, G6pc2 deletion is
limiting the rise in blood glucose induced by Dex treatment, consistent with the model shown in Figure
4.7A. FPI levels did not differ between 24 hr fasted control C57BL/6J WT and KO mice or between Dex
treated C57BL/6J WT and KO mice (Fig. 4.10F), though FPI levels were again higher in both WT and KO
mice following Dex treatment, again presumably due to the well characterized induction of insulin
resistance by Dex [169]. Figure 4.7A, like Figure 4.7B, therefore also represents an oversimplification that
does not account for the effect of Dex on insulin signaling.
The reversal in the observed effect of Dex on FBG may be due to the marked decrease in FPI after
24 hr fasting (Fig. 4.10F) compared to 6 hr fasting (Fig. 4.10D). Presumably the low FPI in 24 hr fasted Dex
treated WT and KO mice is insufficient to counteract Dex-induced insulin resistance explaining why FBG is
now greater in Dex treated than control mice. Despite this reversal in the effect of Dex on FBG in 24 hr
versus 6 hr fasted mice, glucose tolerance was still improved in 24 hr fasted Dex treated G6pc2 KO mice
with a similar trend in WT mice (Fig. 4.10G), as was observed in 6 hr fasted mice (Fig. 4.10A). However, in
contrast to 6 hr fasted mice (Fig. 4.10A), glucose tolerance was not improved in Dex treated G6pc2 KO
relative to WT mice (Fig. 4.10G).

75
Figure 4.8. Chronic Dexamethasone Treatment Stimulates Pancreatic G6pc2 Gene Expression in C57BL/6J Mice. Effect of chronic Dex treatment on pancreatic G6pc2 and Slc37a4 (A-C) and hepatic G6pc1 and Slc37a4 (D-F) gene expression in C57BL/6J mice. Pancreatic RNA was isolated following a 6 hr fast from control mice and mice that had received daily injections of the indicated amount of Dex phosphate for 5 days. Results show the mean ± S.E.M. of 3 experiments. *p < 0.05 versus control.
Figure 4.9. Mechanisms of G6pc2 Gene Regulation in C57BL/6J and 129SvEv Mice. Regulation of G6pc2 expression by Dex in vivo is mediated through overlapping but distinct acute and chronic mechanisms in 129SvEv and C57BL/6J mice.

76
Figure 4.10. The Induction of G6pc2 by Dexamethasone Modulates FBG and Glucose Tolerance in C57BL/6J Mice. A: Analysis of glucose tolerance using IPGTTs in 6 hr fasted conscious control (WT, n=14; KO, n=12) or Dex treated (WT, n=13; KO, n=11) C57BL/6J male mice. Results show the mean ± S.E.M. Glucose tolerance was significantly different between control and Dex treated mice and between Dex treated WT and KO mice based on ANOVA (*p < 0.05). B: Weight change following 5 days of Dex (D) injections in WT (n=20) and KO (n=20) C57BL/6J mice. Results show the mean ± S.E.M. *p < 0.05 versus initial body weight. C: Glucose levels in 6 hr fasted conscious control (C) (WT, n=12; KO, n=22) or Dex treated (D) (WT, n=36; KO, n=46) C57BL/6J male mice. Results show the mean ± S.E.M. *p < 0.05 versus control KO; **p < 0.05 versus matching WT. D: Insulin levels in 6 hr fasted conscious control (C) (WT, n=12; KO, n=22) or Dex treated (D) (WT, n=33; KO, n=42) C57BL/6J male mice. Results show the mean ± S.E.M. *p < 0.05 versus control WT or KO. E: Glucose levels in 24 hr fasted conscious control (C) (WT, n=9; KO, n=8) or 24 hr fasted conscious Dex treated (D) (WT, n=6; KO, n=8) C57BL/6J male mice. Results show the mean ± S.E.M. *p < 0.05 versus control WT or KO; **p < 0.05 versus matching WT. F: Insulin levels in 24 hr fasted conscious control (C) (WT, n=9; KO, n=9) or 24 hr fasted conscious Dex treated (D) (WT, n=15; KO, n=12) C57BL/6J male mice. Results show the mean ± S.E.M. *p < 0.05 versus control WT or KO. G: Analysis of glucose tolerance using IPGTTs in 24 hr fasted conscious control (WT, n=9; KO, n=8) or Dex treated (WT, n=6; KO, n=8) C57BL/6J male mice. Results show the mean ± S.E.M. Glucose tolerance was significantly different between control and Dex treated KO mice based on ANOVA and at the indicated time points based on post-hoc analyses (*p < 0.05).

77
Discussion
We show here that the synthetic glucocorticoid Dex induces human G6PC2 expression through a
mechanism that, competition and mutagenesis studies suggest, involves displacement of the islet-enriched
transcription factor MafA by the glucocorticoid receptor (Fig. 4.1). The effect of Dex on G6PC2 promoter
activity is influenced by the rs2232316 SNP, which affects Foxa2 binding and has been linked to variations
in FBG (Fig. 4.5; Ref. [79]). Chronic 5 day treatment with Dex induces G6pc2 expression in both 129SvEv
(Fig. 4.6) and C57BL/6J (Fig. 4.8) mouse pancreata in vivo. This contrasts with a selective acute effect of
Dex on G6pc2 expression in 129SvEv mice [265]. In both 6 hr fasted 129SvEv (Fig. 4.7) and C57BL/6J (Fig.
4.10) mice, the induction of G6pc2 expression by Dex was insufficient to markedly enhance the difference
in FBG between WT and KO mice but the presence of G6pc2 in WT mice served to limit the repression of
FBG by Dex. In contrast, in 24 hr fasted C57BL/6J mice (Fig. 4.10) the induction of G6pc2 expression by
Dex enhanced the difference in FBG between WT and KO mice and G6pc2 deletion served to limit the
elevation of FBG induced by Dex. The latter observation is consistent with the hypothesis that the induction
of G6pc2 gene expression by Dex reduces the sensitivity of GSIS to glucose (Figs. 4.7A & B) [69, 265]. These
data suggest that G6PC2 initially evolved to transiently modulate the sensitivity of GSIS to glucose under
conditions of glucocorticoid-related stress, in contrast to modern society where the chronic influence of
G6PC2 on FBG affects the risks of cardiovascular-associated mortality and T2D. Interestingly, this
conclusion is consistent with pathway analyses that demonstrate connectivity between G6PC2 and genes
influencing steroid action [273].
In both rodents and humans in vivo the widely accepted dogma with respect to the effect of
Dex/glucocorticoids on glucose metabolism is that they inhibit glucose uptake by inducing insulin
resistance [169], stimulate hepatic glucose production [171] and inhibit insulin secretion [173, 175],
thereby inducing glucose intolerance [129]. These effects result in a transient increase in blood glucose
that is considered beneficial during periods of stress. In contrast, prolonged elevation of glucocorticoids,
as occurs in Cushing’s disease [202], can lead to diabetes. This dogma contrasts with our studies (Figs. 4.7

78
& 4.10) and others [219, 221] that demonstrate the complexity of glucocorticoid physiology by showing
that, in some experimental paradigms, Dex/glucocorticoids can enhance insulin secretion in vivo, beyond
the level required to counteract insulin resistance, thereby leading to improved glucose tolerance. This
improved glucose tolerance was observed in 6 hr fasted mice following chronic Dex treatment (Fig 4.5H &
4.7A) and following the elevation of endogenous glucocorticoids by physical restraint (Fig 4.7I). In
addition, the contrasting effects of G6pc2 deletion in 6 hr versus 24 hr fasted Dex treated mice demonstrate
that G6pc2 modulates the sensitivity of GSIS to glucose regardless of whether the overall whole body effect
of Dex results in reduced (Fig. 4.10D) or elevated (Fig. 4.10E) FBG. Similarly, in 6 hr fasted mice, the
elevation of endogenous glucocorticoids by physical restraint induces G6pc2 expression thereby
modulating the sensitivity of GSIS to glucose and increasing the difference in FBG between WT and KO mice
[265].
The literature on the effects of Dex/glucocorticoids on isolated rodent islets is equally complex with
multiple studies reporting that they inhibit [204] or stimulate [209] GSIS in vitro. The explanation for
these conflicting observations is unclear; they cannot simply be explained by variations in the duration of
Dex/glucocorticoid exposure. Instead it almost certainly relates to variations in experimental conditions
coupled with the kinetic complexity of the transcriptional actions of glucocorticoids [216] and the ability
of the glucocorticoid receptor to also signal through non-genomic mechanisms [168], with the initial
health of individuals studied [274] and strain background also being factors in human and mouse studies,
respectively.
Human GWAS data have linked common SNPs in G6PC2 to variations in FBG [82, 266] but not altered
glucose tolerance [108-111]. In contrast, we observed that glucose tolerance was improved in 129SvEv
G6pc2 KO mice relative to WT mice following Dex treatment (Fig. 4.7H) or physical restraint (Fig. 4.7I).
Similarly, we observed that glucose tolerance was improved in C57BL/6J G6pc2 KO mice relative to WT
mice following Dex treatment (Fig. 4.10A). We hypothesize that the explanation for this difference
between the human and mouse data relates to the fact that G6pc2 deletion affects the sensitivity of GSIS

79
to glucose rather than maximal GSIS [69]. This means that G6pc2 will only influence glucose tolerance if a
low amount of glucose is injected in the experiment or if insulin-stimulated glucose disposal is enhanced.
In both cases, the peak blood glucose will be in a sub-maximal region of the dose response curve for GSIS,
which would be optimal for detecting an effect of G6pc2 deletion (Fig. 4.11). Consistent with this concept,
in those experiments where G6pc2 deletion improved glucose tolerance, the peak glucose concentration
in the IPGTT was ~150 mg/dl in 129SvEv mice (Figs. 4.7H & 4.5I) and ~250 mg/dl in C57BL/6J mice (Fig.
4.10A), which are known to have lower insulin sensitivity [275]. This contrasts with peak glucose
concentrations of ~230 mg/dl (Figs. 4.7H & I) and ~350 mg/dl (Fig. 4.10A) in control 129SvEv and
C57BL/6J mice, respectively. Furthermore, in the 24 hr fasted mice where G6pc2 deletion did not improve
glucose tolerance, the peak glucose concentration in the IPGTT was almost 400 mg/dl (Fig. 4.10G). This
concept is also consistent with previous studies in control, non-Dex treated mice in which G6pc2 deletion
was associated with improved glucose tolerance when a dose of 0.4 g/kg glucose was injected but not
higher doses of 0.75 and 2 g/kg [69].
In summary, our data suggest that G6PC2 initially evolved to modulate the sensitivity of GSIS to
glucose under conditions of glucocorticoid-induced stress. Future studies will examine whether other
hormones/metabolites also regulate G6PC2 gene expression.

80
Figure 4.11. Diagram of Changes in Glucose Levels Following Injection. G6pc2 only influences glucose tolerance if a low amount of glucose is or if insulin-stimulated glucose disposal is enhanced. In both cases, the peak blood glucose will be in a sub-maximal region of the dose response curve for GSIS, which would be optimal for detecting an effect of G6pc2 deletion.

81
V. THE EFFECT OF G6PC2 DELETION ON BODY WEIGHT AND FAT MASS IN MICE IS DEPENDENT ON
DIET, GENETIC BACKGROUND AND GENDER
Introduction
The role of G6PC2 in islet β-cells has been extensively covered in the introduction of this
dissertation. Figure 1.1 highlights the main function of G6PC2 to hydrolyze G6P to glucose and a free
phosphate, thereby creating a futile cycle that opposes the actions of glucokinase Fig. 1.4. Previous data
supports the role of G6PC2 as a negative regulator of GSIS and as contributing to glucose cycling in β-cells
[69] [276, 277]. Deletion of G6pc2 results in leftward shift in the dose response curve for GSIS [69]. At sub-
maximal glucose levels this shift results in enhanced GSIS from G6pc2 KO relative to WT mouse islets [69].
Under fasting conditions, where insulin levels are the same in WT and G6pc2 KO mice, this shift results in
reduced FBG in KO mice [69, 96]. Consistent with these mouse studies, GWAS have linked SNPs in the
G6PC2 gene to variations in FBG [82, 266]. The rs560887 SNP located in the third intron of the G6PC2 gene
has been identified as the strongest common genetic determinant of FBG levels in human in terms of
significance and effect size, accounting for about one percent of total variance in FBG [82, 266]. The
association between G6PC2 and FBG has been confirmed in multiple GWAS and in different populations
[76, 81, 112-115, 278, 279].
Numerous GWAS have also examined the genes that are associated with variations in body mass
index (BMI), fat mass and fat distribution and have shown that greater than 160 loci are linked to these
parameters [280]. While these analyses did not identify G6PC2 as one of the loci linked to these parameters
[280], a GWAS performed in a relatively small cohort of Mexican Americans linked the G6PC2 rs560887-A
allele with decreased BMI and adiposity in this population [111]. This observation prompted us to examine
whether G6pc2 KO mice are protected from diet-induced obesity (DIO). We previously showed that female,
but not male, G6pc2 KO mice on a pure C57BL/6J genetic background had reduced body weight and body
fat on both a chow and high fat diet relative to WT mice, indicating that the effect of G6pc2 on these
parameters is influenced by gender [69]. This current study extends those analyses by examining the
82
influence of genetic background on the impact of G6pc2 deletion on body weight and fat mass in mice.
Specifically, we look at the effect of chow and high fat feeding in G6pc2 KO mice bred on a pure 129SvEv or
mixed C57BL/6J X 129SvEv genetic background. The results confirm striking differences in the response
of C57BL/6J and 129SvEv mice to high fat feeding [281] and show that the effect of G6pc2 deletion on FBG
is largely independent of gender, genetic background and diet whereas the effects of G6pc2 deletion on
body weight and fat mass are highly dependent on these variables We also show that G6pc2 deletion affects
plasma triglyceride and cholesterol levels in a manner dependent on gender, genetic background and diet
and demonstrate an association between G6PC2 and plasma cholesterol in humans through electronic
health record-derived phenotype analyses. These observations suggest that, in both mice and humans, the
action of G6PC2 on FBG is independent of modifier genes whereas the action of G6PC2 on BMI and body
fat are influenced by other genes.
Results
Analysis of the Effect of G6pc2 Deletion on Body Weight and Composition in Chow Fed 129SvEv Mice
We have previously shown that 16 week old chow fed female, but not male C57BL/6J G6pc2 KO mice
are slightly lighter than WT littermates and have reduced body fat [69]. When this analysis was repeated
using 16 week old chow fed 129SvEv G6pc2 mice no differences in either body weight or body fat were
observed between female WT or KO mice (Table 5.1). However, male chow fed 129SvEv G6pc2 KO mice
were slightly lighter than WT littermates (Table 5.2). This suggests that the effect of G6pc2 deletion on
body weight varies with both gender and genetic background.
A comparison of body weight and composition between 16 week old WT chow fed C57BL/6J [69]
and 129SvEv mice (Table 5.2) reveals little difference in body weight or composition between male mice.
However, female 129SvEv mice were ~2g heavier than female C57BL/6J mice and had approximately
double the fat mass [69] (Table 5.1).

83
Table 5.1. NMR Analysis of Female Chow Fed 129SvEv G6pc2 KO Mouse Body Composition. Body composition of 6 hour fasted, 16 week old animals was assessed using a mq10 NMR analyzer. Results are means ± S.E.M. obtained from the number of animals indicated in parentheses. WT=wild type; KO=knockout.
Gender & Genotype
Body Weight (g)
Fat (g) Muscle (g)
Free Fluid (g)
Fat (%) Muscle (%)
Free Fluid (%)
Female WT 22.23 ± 0.26 (15)
2.76 ± 0.26 (11)
13.94 ± 0.27 (11)
0.58 ± 0.05 (11)
13.04 ± 1.15 (11)
66.32 ± 0.94 (11)
2.78 ± 0.26 (11)
Female KO 22.11 ± 0.54 (14)
3.09 ± 0.46 (9)
14.69 ± 0.25 (9), *
0.60 ± 0.03 (9)
13.48 ± 1.62 (9)
66.05 ± 1.34 (9)
2.71 ± 0.15 (9)
1. Muscle: *p < 0.04
Table 5.2. NMR Analysis of Male Chow Fed 129SvEv G6pc2 KO Mouse Body Composition. Body composition of 6 hour fasted, 16 week old animals was assessed using a mq10 NMR analyzer. Results are means ± S.E.M. obtained from the number of animals indicated in parentheses. WT=wild type; KO=knockout.
Gender & Genotype
Body Weight (g)
Fat (g) Muscle (g)
Free Fluid (g)
Fat (%) Muscle (%)
Free Fluid (%)
Male WT 28.47 ± 0.34 (16)
2.02 ± 0.35 (11)
19.23 ± 0.37 (11)
0.82 ± 0.10 (11)
7.40 ± 1.29 (11)
69.90 ± 0.91 (11)
2.96 ± 0.25 (11)
Male KO 26.93 ± 0.54 (12), *
1.51 ± 0.25 (9)
18.21 ± 0.38 (9)
0.75 ± 0.12 (9)
6.03 ± 1.00 (9)
72.45 ± 0.96 (9)
3.01 ± 0.51 (9)
1. Weight: *p < 0.009

84
Analysis of the Effect of G6pc2 Deletion on FBG and FPI in Chow Fed 129SvEv Mice We have previously shown that 16 week old chow fed female and male G6pc2 KO mice on either a
mixed [96] or C57BL/6J [69] genetic background have reduced FBG but no change in FPI relative to WT
littermates. When this analysis was repeated using 16 week old female and male chow fed WT and G6pc2
KO mice on the 129SvEv genetic background the same reduction in FBG was observed in female G6pc2 KO
mice (Fig. 5.1A) with a similar trend toward reduced FBG in male KO mice relative to WT mice (Fig. 5.1B).
Consistent with previous results with mixed genetic background [96] and C57BL/6J G6pc2 KO mice
[69], FPI was unchanged in female G6pc2 KO relative to WT mice (Fig. 5.1C). However, in contrast to
previous results with mixed genetic background [96] and C57BL/6J G6pc2 KO mice [69], FPI was reduced
in male G6pc2 KO mice relative to WT mice (Fig. 5.1D). This reduction in FPI in chow fed 129SvEv G6pc2
KO mice may explain the lack of a statistically significant difference in FBG. Indeed, in a slightly older cohort
of chow fed 129SvEv mice we recently reported that FBG was reduced in male G6pc2 KO mice relative to
WT with no change in FPI [265].
The reduction in FPI in this cohort of chow fed 129SvEv G6pc2 KO mice (Fig. 5.1D) is unlikely to be
explained by an effect of G6pc2 deletion to enhance insulin sensitivity since glucose tolerance is not altered
in these mice [265]. Rather, because we are not looking at a steady state, we think that this result may
simply be explained by a difference in the kinetics of the fall in blood glucose during fasting. Two
hypothesized relationships between glucose and insulin levels in WT and G6pc2 KO mice when measured
following a 6 hr fast are shown diagrammatically in Figures 5.1E and 5.1F. These schematics illustrate how
a difference in FBG could exist between WT and G6pc2 KO mice without (Fig. 5.1E) or with (Fig. 5.1F) a
difference in FPI. Specifically, Figures 5.1E and 5.1F show how absolute glucose concentrations can be
different while absolute insulin levels at the two glucose levels may or may not be different depending on
where these values are on the curve. Despite these subtle differences, overall these data suggest that the
effect of G6pc2 on FBG is independent of both gender and genetic background.

85
Analysis of the Effect of G6pc2 Deletion on Body Weight and Composition in High Fat Fed 129SvEv Mice
We next investigated the effect of high-fat feeding, a standard nutritional challenge in the field of
obesity and diabetes research that induces insulin resistance and is considered to model human disease
[282]. After starting high fat feeding at 8 weeks of age and continuing for 12 weeks we have previously
shown that WT female and male C57BL/6J mice almost double their body weight relative to chow fed mice
[69], as observed by many other groups [283]. Strikingly, when this analysis was repeated using the same
feeding paradigm in 129SvEv mice we observed almost no difference in body weight between 16 week old
chow fed female (Table 5.1) and 20 week old high fat fed female (Table 5.3) or between 16 week old chow
fed male (Table 5.2) and 20 week old high fat fed male mice (Table 5.4). Weekly measurements of body
weight in non-fasted high fat fed mice during the 12 weeks of high fat feeding showed no evidence for a
biphasic change in weight, that would have been suggestive of a toxic effect of prolonged high fat feeding,
in either female (Fig. 5.2A) or male (Fig. 5.2B) WT and KO mice. This is consistent with previous studies
that have observed that 129SvEv mice are resistant to DIO [281].
Despite the lack of weight gain, high fat fed female and male 129SvEv mice showed a marked
increase in body fat (%) relative to chow fed mice (Fig. 5.2C). This was associated with a reduction in body
muscle (%) in both high fat fed female (Table 5.3) and male 129SvEv mice (Table 5.4) relative to chow fed
female (Table 5.1) and male (Table 5.2) mice (p<0.05). We observed the same pattern of increased body
fat (%) and decreased body muscle (%) in high fat fed C57BL/6J mice relative to chow fed mice [69].
However, because C57BL/6J mice gain substantially more weight following high fat feeding than 129SvEv
mice, the observed differences in weight and fat mass between female chow fed C57BL/6J and 129SvEv
mice are reversed.

86
Figure 5.1. Effect of G6pc2 Deletion on Metabolic Parameters in Chow Fed 129SvEv Mice. Panels A-D: At 17 weeks of age chow fed mice were fasted for 5 hours and then weighed. One hour later mice were anesthetized and blood isolated. Blood glucose (Panels A & B) and plasma insulin (Panels C & D) were determined as described in Methods. Results are the mean ± S.E.M. of data with the genotype, gender and number of animals indicated. WT=wild type; KO=knockout; F=female; M= male. *p < 0.014 WT versus KO (Panel A); *p < 0.01 WT versus KO (Panel D). Panels E & F: Schematics to explain the effect of G6pc2 deletion on fasting blood glucose levels. The model in Panel E proposes that in 6 hr fasted WT and G6pc2 KO mice, where insulin levels are the same, FBG is reduced in G6pc2 KO mice due to a leftward shift in the dose response curve for GSIS relative to WT mice. The model in Panel F proposes that in 6 hr fasted WT and G6pc2 KO mice, where insulin levels differ, FBG is still reduced in G6pc2 KO mice due to a leftward shift in the dose response curve for GSIS relative to WT mice.

87
Table 5.3. NMR Analysis of Female High Fat Fed 129SvEv G6pc2 KO Mouse Body Composition. Body composition of 6 hour fasted, 20 week old animals following 12 weeks of high fat feeding was assessed using a mq10 NMR analyzer. Results are means ± S.E.M. obtained from the number of animals indicated in parentheses. WT=wild type; KO=knockout.
Gender & Genotype
Body Weight (g)
Fat (g) Muscle (g) Free Fluid (g)
Fat (%) Muscle (%)
Free Fluid (%)
Female WT 23.06 ± 0.69 (11)
4.46 ± 0.34 (11)
14.80 ± 0.32 (11)
0.58 ± 0.06 (11)
19.26 ± 1.23 (11)
64.46 ± 144 (11)
2.48 ± 0.23 (11)
Female KO 22.65 ± 0.58 (11)
4.30 ± 0.32 (11)
14.37 ± 0.37 (11)
0.50 ± 0.04 (11)
18.88 ± 1.11 (11)
63.55 ± 1.02 (11)
2.17 ± 0.15 (11)
Table 5.4. NMR Analysis of Male High Fat Fed 129SvEv G6pc2 KO Mouse Body Composition. Body composition of 6 hour fasted, 20 week old animals following 12 weeks of high fat feeding was assessed using a mq10 NMR analyzer. Results are means ± S.E.M. obtained from the number of animals indicated in parentheses. WT=wild type; KO=knockout.
Gender & Genotype
Body Weight (g)
Fat (g) Muscle (g)
Free Fluid (g)
Fat (%) Muscle (%)
Free Fluid (%)
Male WT 26.80 ± 0.93 (10)
5 ± 0.78 (10)
16.72 ± 0.50 (10)
0.55 ± 0.07 (10)
18.18 ± 2.34 (10)
62.68 ± 1.63 (10)
2.02 ± 0.19 (10)
Male KO 30.20 ± 0.82 (13), *
6.98 ± 0.65 (13)
17.51 ± 0.35 (13)
0.60 ± 0.03 (13)
22.67 ± 1.75 (13)
58.35 ± 1.58 (13)
2.00 ± 0.09 (13)
1. Weight: *p < 0.0124

88
Thus, as noted above, female chow fed 129SvEv mice were ~2g heavier than C57BL/6J mice and had
approximately double the fat mass [69] (Table 5.1) whereas female high fat fed C57BL/6J mice were ~12g
heavier than 129SvEv mice and had approximately double the fat mass [69] (Table 5.3).
Following 12 weeks of high fat feeding we have previously shown that female, but not male,
C57BL/6J G6pc2 KO mice are lighter than WT littermates and have reduced body fat [69]. In contrast, in
high fat fed female 129SvEv mice we observed little difference in either body weight or body composition
between WT and KO mice (Table 5.3). In addition, in high fat fed male 129SvEv mice we observed a slight
increase in body weight in G6pc2 KO relative to WT mice, though body composition was unchanged (Table
5.4). This again suggests that the effect of G6pc2 deletion on body weight varies with both gender and
genetic background.
Analysis of the Effect of G6pc2 Deletion on FBG and FPI in High Fat Fed 129SvEv mice
We next analyzed the effect of high fat feeding on FBG and FPI in 129SvEv mice. Despite 13 weeks
of high fat feeding a comparison between female (Fig. 5.1A) and male (Fig. 5.1B) chow fed with female (Fig.
5.2D) and male (Fig. 5.2E) high fat fed 129SvEV WT mice revealed surprisingly no increase in FBG.
Similarly, a comparison between female (Fig. 5.1C) and male (Fig. 5.1D) chow fed with female (Fig. 5.2F)
and male (Fig. 5.2G) high fat fed 129SvEV WT mice revealed surprisingly no increase in FPI. In striking
contrast to these results with 129SvEv mice, we previously noted marked elevations in both FBG and FPI
in both female and male high fat fed C57BL/6J mice compared to chow fed mice [69].
After 13 weeks of high fat feeding a reduction in FBG was observed in both female (Fig. 5.2D) and
male G6pc2 (Fig. 5.2E) KO relative to WT mice with no differences in FPI in either female (Fig. 5.2F), or
male (Fig. 5.2G) mice relative to WT, similar to the observations in high fat fed C57BL/6J mice [69].

89
Figure 5.2. Effect of G6pc2 Deletion on Body Weight, Composition and Metabolic Parameters in High Fat Fed 129SvEv Mice. Panels A & B: Starting at 8 weeks of age, female (Panel A) and male (Panel B) mice were fed a high-fat diet with non-fasting body weights measured weekly. Results are the mean ± S.E.M. of data from the following number of animals: female WT n=11; male WT n=11. Panel C: Body composition was assessed in chow fed 129SvEv mice at 16 weeks of age and in high fat fed 129SvEv mice at 20 weeks of age following 12 weeks of high fat feeding. Mice were fasted for 5 hours and then weighed. One hour later body fat was determined by NMR. Results are the mean ± S.E.M. of data with the genotype, gender and number of animals indicated. WT=wild type; F=female; M= male. *p < 4.61E-10 high fat fed vs chow fed females; *p < 3.94E-05 high fat fed vs chow fed males. Panels D - G: Metabolic parameters were assessed in high fat fed 129SvEv mice at 21 weeks of age following 13 weeks of high fat feeding. Mice were fasted for 5 hours and then weighed. One hour later mice were anesthetized and blood isolated. Blood glucose (Panels D & E) and plasma insulin (Panels F & G) were determined as described in Methods. Results are the mean ± S.E.M. of data with the genotype, gender and number of animals indicated. WT=wild type; KO=knockout; F=female; M= male. *p < 0.001 female WT versus KO (Panel D); *p < 0.037 male WT versus KO (Panel E). Panel H: Glucose tolerance was assessed in chow fed 129SvEv at ~22 weeks of age and in high fat fed 129SvEv mice at 22 weeks of age following 13 weeks of high fat feeding. IPGTTs using 2.0 g/kg glucose were performed on 6 hr fasted, conscious, chow or high fat fed WT and G6pc2 KO male mice as described in Methods. The results show the mean glucose concentrations ± S.E.M.

90
Analysis of the Effect of High Fat Feeding on Glucose Tolerance in 129SvEv WT and G6pc2 KO Mice
We have previously shown that deletion of G6pc2 does not affect glucose tolerance in either chow
fed C57BL/6J [69] or 129SvEv mice (Chapter IV) [265], consistent with human GWAS data [108-111].
Although high fat feeding did not result in weight gain (Table 5.4) or elevated FPI (Fig. 5.2G) in male
129SvEv mice relative to chow fed mice (Table 5.2; Fig. 5.1D), IPGTTs revealed a clear impairment of
glucose tolerance in both WT (p<0.0002) and G6pc2 KO (p<0.0001) high fat fed 129SvEv mice relative to
chow fed mice (Fig. 5.2H), suggesting the presence of either insulin resistance and/or impaired GSIS in high
fat fed 129SvEv mice. However, even in high fat fed mice, deletion of G6pc2 did not affect glucose tolerance
(Fig. 5.2H).
Comparison of Pancreatic Expression of Key Genes in G6pc2 129SvEv and C57BL/6J Mice The data derived from studies on C57BL/6J and 129SvEv mice reveal that the effect of G6pc2
deletion on body weight varies with gender and genetic background. In addition, FBG is higher in both
female and male C57BL/6J mice than 129SvEv mice on both a chow and high fat diet (Figs. 5.1A & 5.2D)[69,
284, 285]. While there are likely multiple factors that account for these differences, one potential
contributing factor could be variations in G6pc2 or Slc37a4 gene expression between C57BL/6J and
129SvEv mice. To address this possibility we compared pancreatic G6pc2 and Ins2 gene expression in both
mouse strains. There was little difference in the ratio of G6pc2 to Ins2 gene expression between female and
male chow fed 129SvEv mice (Fig. 5.3A) or between female and male chow fed C57BL/6J mice (Fig. 5.3B).
There was little difference in the ratio of G6pc2 to Ins2 gene expression between chow fed female 129SvEv
and C57BL/6J mice (Fig. 5.3C) or between chow fed male 129SvEv and C57BL/6J mice (Fig. 5.3D). In
contrast, while there was little difference in the ratio of G6pc2 to Ins2 gene expression between female and
male high fat fed 129SvEv mice (Fig. 5.3E) there was a marked difference between female and male high
fat fed C57BL/6J mice (Fig. 5.3F).

91
Figure 5.3. Comparison of Pancreatic G6pc2 Expression in 129SvEv and C57BL/6J Mice. Pancreatic RNA was isolated following a 6 hr fast from chow fed 129SvEv (129) or C57BL/6J (C57) mice or mice fed a high fat diet for 2 weeks. G6pc2 and Ins2 expression were quantitated by Real Time PCR. Results show the ratio of G6pc2 to Ins2 expression ± S.E.M. in 3-5 pancreata. A-D are chow fed mice, E-H are high fat fed mice. *p < 0.05 versus control.

92
Similarly, while there was little difference in the ratio of G6pc2 to Ins2 gene expression between high fat
fed female 129SvEv and C57BL/6J mice (Fig. 5.3G) there was a marked difference between high fat fed
male 129SvEv and C57BL/6J mice (Fig. 5.3H). These data suggest that G6pc2 expression is induced by high
fat feeding relative to Ins2 expression, which may contribute to the observed gender- and strain-specific
differences between high fat fed 129SvEv and C57BL/6J mice.
Analysis of the Effect of G6pc2 Deletion on Body Weight, FBG and FBI in High Fat Fed Mixed Genetic Background Mice
Because the comparison of data derived from studies on C57BL/6J and 129SvEv mice reveal that
the effect of G6pc2 deletion on body weight varies with gender and genetic background we repeated these
high fat feeding analyses in mice with a mixed C57BL/6J X 129SvEv genetic background. After starting high
fat feeding at 8 weeks of age and continuing for 8 weeks we observed no differences in body weight
between female mixed genetic background WT and KO mice (Fig. 5.4A). In contrast, male mixed genetic
background G6pc2 KO mice exhibited a striking protection against DIO (Fig. 5.4B). A comparison of 16 week
old chow fed [96] and 16 week old high fat fed mixed genetic background mice revealed that body weight
was increased by high fat feeding in both female and male WT mice (p<0.05). These data derived from
mixed genetic background mice again strongly suggest that the effect of G6pc2 on body weight varies with
gender and genetic background.
We next analyzed the effect of high fat feeding on FBG and FPI in mixed genetic background mice. A
comparison of 16 week old chow fed [96] and 16 week old high fat fed mixed genetic background mice
revealed that FBG and FPI were increased by high fat feeding in male but not female WT mice (p<0.05). A
trend towards reduced FBG was observed in high fat fed female KO mice relative to WT mice (Fig. 5.4C)
whereas FBG was markedly reduced in high fat fed male KO mice relative to WT mice (Fig. 5.4D). Similarly,
while no difference in FPI was observed between high fat fed female KO mice relative to WT mice (Fig.
5.4E), FPI was markedly reduced in high fat fed male KO mice relative to WT mice (Fig. 5.4F).

93
Analysis of the Effect of G6pc2 Deletion on the Time Course of Changes in Plasma Insulin During an IPGTT
A key question that arises from these studies is how G6PC2, which is thought to be expressed
exclusively in pancreatic islet β-cells [42, 79], could be affecting body weight. One possible explanation for
the link between G6PC2 and body weight is that G6PC2 affects satiety. Thus the leftward shift in the dose
response curve for GSIS observed in G6pc2 KO mice [69] might result in a faster rise in plasma insulin levels
after eating, as shown diagrammatically in Fig. 5.5A. Since insulin is a satiety factor [286], this faster rise
in insulin could promote a quicker cessation of feeding and ultimately reduced food intake.
In IPGTTs G6pc2 deletion has little effect on glucose tolerance in chow fed C57BL/6J [69] and
129SvEv mice (Fig. 5.2F). Similarly, human GWAS data have linked common SNPs in G6PC2 to variations in
FBG [82, 266] but not altered glucose tolerance [111]. Both observations are consistent with the fact that
IPGTTs are not optimal for detecting subtle shifts in the sensitivity of GSIS to glucose because they are
dynamic assays, in which islets are exposed to variable glucose concentrations over the time course of the
assay, rather than a sustained stimulation with a sub-maximal glucose concentration. We have recently
found that G6pc2 expression in C57BL/6J mice is induced following 5 days of repeated injections with the
synthetic glucocorticoid dexamethasone (Dex) (K.A.B & R.O’B., unpublished data). We hypothesized that,
because a greater difference in the sensitivity of GSIS to glucose should now exist between WT and KO mice
(Fig. 5.5A), the time course of GSIS might sufficiently differ between WT and KO mice following glucose
injection that a difference in the time course of changes in plasma insulin between WT and KO mice might
be detectable in IPGTT assays. We therefore measured plasma glucose and insulin 0.5 mins (Fig. 5.5B-E), 2
mins (Fig. 5.5F-I) and 15 mins (Fig. 5.5J-M) following injection of 2 g/kg glucose. Though the data were not
statistically significant, the analysis of insulin AUC measurements show trends that suggest a change in the
kinetics of insulin release in G6pc2 KO mice, with insulin AUC higher at the early 0.5 min time point (Fig.
5.5E) and lower at the later 15 min time point (Fig. 5.5M).

94
Figure 5.4. Effect of G6pc2 Deletion on Body Weight and Metabolic Parameters in High Fat fed Mixed Background Mice. Metabolic parameters were assessed in high fat fed mixed genetic background mice at 16 weeks of age following 8 weeks of high fat feeding. Mice were fasted for 5 hours and then weighed (Panels A & B). One hour later mice were anesthetized and blood isolated. Blood glucose (Panels C & D) and plasma insulin (Panels E & F) were determined as described in Methods. Results are the mean ± S.E.M. of data with the genotype, gender and number of animals indicated. WT=wild type; KO=knockout; F=female; M= male. *p < 8.32E-05 WT versus KO (Panel B); *p < 3.45E-05 WT versus KO (Panel D); *p < 6.84E-05 WT versus KO (Panel F).

95
Figure 5.5. Effect of G6pc2 Deletion on the Time Course of Changes in Plasma Insulin During an IPGTT. Panel A: Diagram proposing that deletion of G6pc2 will affect the time course of GSIS during an IPGTT. WT=wild type; KO=knockout. Panels B-E: IPGTTs using 2.0 g/kg glucose performed on 6 hr fasted Dex-treated C57BL/6J G6pc2 WT (n=17) or KO (n=21) male mice. Results show the mean glucose or insulin concentrations at t=0 and t=0.5 mins or area under the curve (AUC) ± S.E.M. *p < 0.05 versus control. Panels F-I: IPGTTs using 2.0 g/kg glucose performed on 6 hr fasted Dex-treated C57BL/6J G6pc2 WT (n=13) or KO (n=8) male mice. Results show the mean glucose or insulin concentrations at t=0 and t=2 mins or area under the curve (AUC) ± S.E.M. *p < 0.05 versus control. Panels J-M: IPGTTs using 2.0 g/kg glucose performed on 6 hr fasted Dex-treated C57BL/6J G6pc2 WT (n=7) or KO (n=12) male mice. Results show the mean glucose or insulin concentrations at t=0 and t=15 mins or area under the curve (AUC) ± S.E.M. *p < 0.05 versus control.

96
Analysis of the Effect of G6pc2 Deletion on Plasma Triglyceride and Cholesterol in 129SvEv, C57BL/6J and Mixed Genetic Background Mice
We previously observed a slight reduction in plasma triglyceride levels in female, but not male,
mixed genetic background G6pc2 KO mice, with no change in cholesterol levels [96]. We repeated these
analyses in chow fed 129SvEv and C57BL/6J mice along with high fat fed 129SvEv, C57BL/6J and mixed
genetic background mice. Figure 5.6 shows that a slight reduction in plasma triglyceride levels was
observed in female chow fed 129SvEv G6pc2 KO mice (Fig. 5.6A), but not in male mice (Fig. 5.6B), and not
between WT and KO mice in any of the other groups examined. In contrast, Figure 5.7 shows that plasma
cholesterol levels were reduced in chow fed male C57BL/6J KO mice (Fig. 5.7D), high fat fed female (Fig.
5.7G) and male (Fig. 5.7H) C57BL/6J KO mice, and high fat fed mixed genetic background male KO mice
(Fig. 5.7J).
Analysis of the relationship between G6PC2 SNPs and metabolic parameters in humans using BioVU
Our results in mice demonstrate that the effect of G6pc2 deletion on triglyceride and cholesterol
levels varies with gender and genetic background. We next used Vanderbilt’s BioVU DNA databank to
determine whether G6PC2 affects these parameters in humans. BioVU individuals with extant genotyping
at the intronic G6PC2 SNP rs560887 were screened to identify associations with cholesterol and
triglyceride measurements. The rs560887-G allele, which enhances G6PC2 pre-mRNA splicing [79], was
associated with increased cholesterol (total cholesterol: = 1.0, p = 0.039; LDL-C: = 1.1, p = 0.006), but
not triglyceride levels ( = 0.90, p = 0.46) or HDL-C ( = -0.07, p = 0.75) (Table 5.5). We further analyzed
the population by sex and found that rs560887-G significantly associated with increased LDL-C in males (p
= 0.009) but not in females (p=0.15), although SNP and sex interaction is not significant (p=0.30) (Table
5.5). Rs560887 did not associate with diabetes status (p=0.37). Thus, as in mice, the impact in humans of
modulating G6PC2 expression on plasma lipids is dependent on gender.
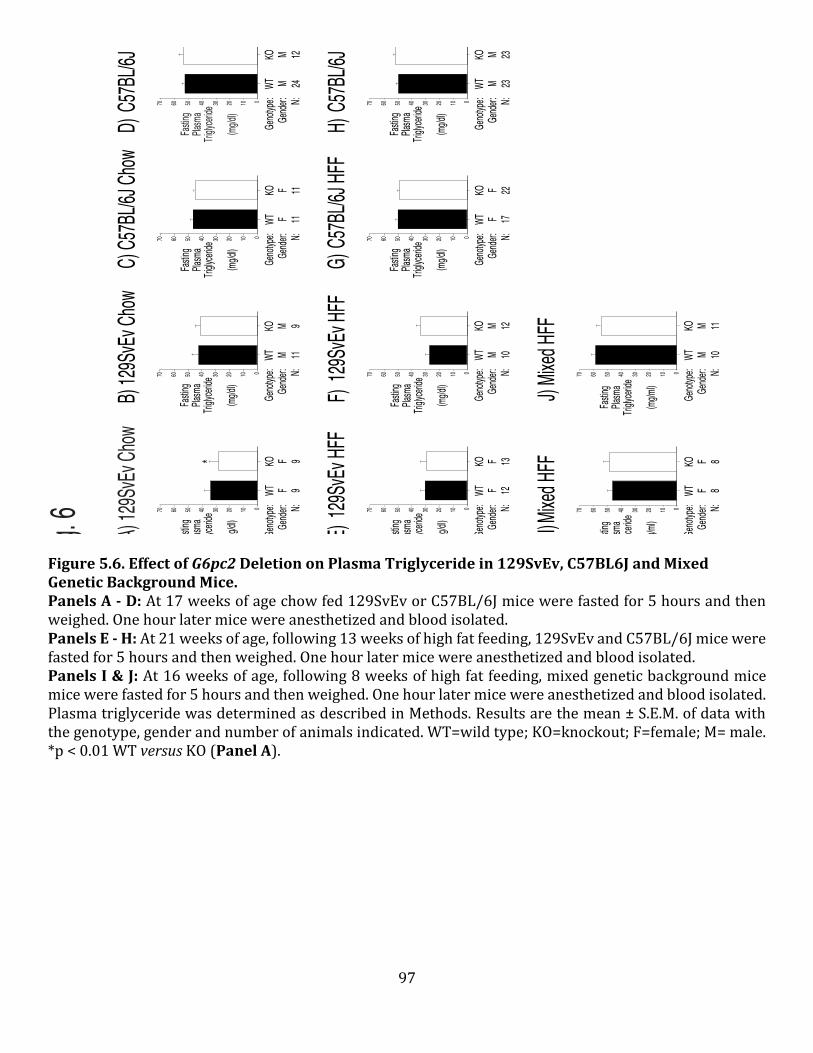
97
Figure 5.6. Effect of G6pc2 Deletion on Plasma Triglyceride in 129SvEv, C57BL6J and Mixed Genetic Background Mice. Panels A - D: At 17 weeks of age chow fed 129SvEv or C57BL/6J mice were fasted for 5 hours and then weighed. One hour later mice were anesthetized and blood isolated. Panels E - H: At 21 weeks of age, following 13 weeks of high fat feeding, 129SvEv and C57BL/6J mice were fasted for 5 hours and then weighed. One hour later mice were anesthetized and blood isolated. Panels I & J: At 16 weeks of age, following 8 weeks of high fat feeding, mixed genetic background mice mice were fasted for 5 hours and then weighed. One hour later mice were anesthetized and blood isolated. Plasma triglyceride was determined as described in Methods. Results are the mean ± S.E.M. of data with the genotype, gender and number of animals indicated. WT=wild type; KO=knockout; F=female; M= male. *p < 0.01 WT versus KO (Panel A).

98
Figure 5.7. Effect of G6pc2 Deletion on Plasma Cholesterol in 129SvEv, C57BL6J and Mixed Genetic Background Mice. Panels A - D: At 17 weeks of age chow fed 129SvEv or C57BL/6J mice were fasted for 5 hours and then weighed. One hour later mice were anesthetized and blood isolated. Panels E - H: At 21 weeks of age, following 13 weeks of high fat feeding, 129SvEv and C57BL/6J mice were fasted for 5 hours and then weighed. One hour later mice were anesthetized and blood isolated. Panels I & J: At 16 weeks of age, following 8 weeks of high fat feeding, mixed genetic background mice mice were fasted for 5 hours and then weighed. One hour later mice were anesthetized and blood isolated. Plasma cholesterol was determined as described in Methods. Results are the mean ± S.E.M. of data with the genotype, gender and number of animals indicated. WT=wild type; KO=knockout; F=female; M= male. *p < 0.0069 WT versus KO (Panel D); *p < 0.02 female WT versus KO (Panel G); *p < 7.01E-06 male WT versus KO (Panel H); *p < 0.001 WT versus KO (Panel J).
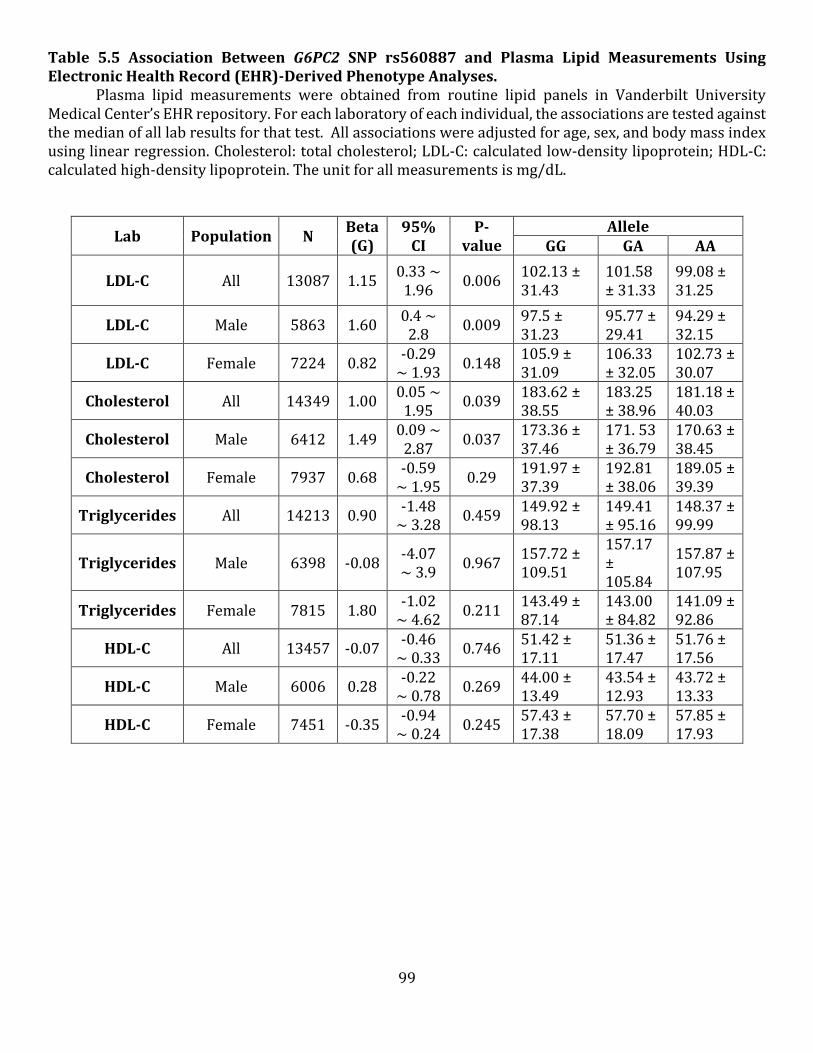
99
Table 5.5 Association Between G6PC2 SNP rs560887 and Plasma Lipid Measurements Using Electronic Health Record (EHR)-Derived Phenotype Analyses. Plasma lipid measurements were obtained from routine lipid panels in Vanderbilt University Medical Center’s EHR repository. For each laboratory of each individual, the associations are tested against the median of all lab results for that test. All associations were adjusted for age, sex, and body mass index using linear regression. Cholesterol: total cholesterol; LDL-C: calculated low-density lipoprotein; HDL-C: calculated high-density lipoprotein. The unit for all measurements is mg/dL.
Lab Population N Beta (G)
95% CI
P-value
Allele GG GA AA
LDL-C All 13087 1.15 0.33 ~
1.96 0.006
102.13 ± 31.43
101.58 ± 31.33
99.08 ± 31.25
LDL-C Male 5863 1.60 0.4 ~
2.8 0.009
97.5 ± 31.23
95.77 ± 29.41
94.29 ± 32.15
LDL-C Female 7224 0.82 -0.29
~ 1.93 0.148
105.9 ± 31.09
106.33 ± 32.05
102.73 ± 30.07
Cholesterol All 14349 1.00 0.05 ~
1.95 0.039
183.62 ± 38.55
183.25 ± 38.96
181.18 ± 40.03
Cholesterol Male 6412 1.49 0.09 ~
2.87 0.037
173.36 ± 37.46
171. 53 ± 36.79
170.63 ± 38.45
Cholesterol Female 7937 0.68 -0.59
~ 1.95 0.29
191.97 ± 37.39
192.81 ± 38.06
189.05 ± 39.39
Triglycerides All 14213 0.90 -1.48
~ 3.28 0.459
149.92 ± 98.13
149.41 ± 95.16
148.37 ± 99.99
Triglycerides Male 6398 -0.08 -4.07 ~ 3.9
0.967 157.72 ± 109.51
157.17 ± 105.84
157.87 ± 107.95
Triglycerides Female 7815 1.80 -1.02
~ 4.62 0.211
143.49 ± 87.14
143.00 ± 84.82
141.09 ± 92.86
HDL-C All 13457 -0.07 -0.46
~ 0.33 0.746
51.42 ± 17.11
51.36 ± 17.47
51.76 ± 17.56
HDL-C Male 6006 0.28 -0.22
~ 0.78 0.269
44.00 ± 13.49
43.54 ± 12.93
43.72 ± 13.33
HDL-C Female 7451 -0.35 -0.94
~ 0.24 0.245
57.43 ± 17.38
57.70 ± 18.09
57.85 ± 17.93

100
Discussion Our results demonstrate that the effect of G6pc2 deletion in mice on FBG, body weight and body
composition closely parallel human GWAS data in that the effect of G6pc2 deletion on FBG is largely
independent of gender and genetic background whereas the effect of G6pc2 deletion on body weight and
fat mass is highly dependent on gender, genetic background, as well, at least in mice, on diet.
With respect to FBG, we previously showed that FBG is reduced in both female and male chow fed
and high fat fed G6pc2 KO mice on a pure C57BL/6J genetic background [69]. We have also shown that FBG
is reduced in female and male chow fed G6pc2 KO mice on a mixed genetic background [96]. We show here
that FBG is also reduced in both female (Fig. 5.2D) and male (Fig. 5.2E) high fat fed G6pc2 KO mice on a
pure 129SvEv genetic background. FBG is also reduced in female chow fed 129SvEv G6pc2 KO mice (Fig.
5.1A) with a similar trend seen in 17 week old males (Fig. 5.1B) and a statistically significant decrease seen
in an older cohort of males [265]. Similarly, FBG is reduced in male high fat fed mixed genetic background
G6pc2 KO mice (Fig. 5.4D). FBG was not reduced in female high fat fed mixed genetic background G6pc2 KO
mice (Fig. 5.4C), though the n value in this study was relatively low. These observations are largely
consistent with human GWAS data showing an association between G6PC2 and FBG in multiple different
populations [76, 81, 112-115, 278, 279].
With respect to FPI, we previously showed that FPI is unchanged in both female and male chow fed
and high fat fed G6pc2 KO mice on a pure C57BL/6J genetic background [69]. We have also shown that FPI
is unchanged in female and male chow fed G6pc2 KO mice on a mixed genetic background [96]. We show
here that FPI is also unchanged in both female (Fig. 5.2F) and male (Fig. 5.2G) high fat fed G6pc2 KO mice
on a pure 129SvEv genetic background. Similarly, FPI is unchanged in female high fat fed mixed genetic
background G6pc2 KO mice (Fig. 5.4E). A reduction in FPI was observed in male high fat fed mixed genetic
background G6pc2 KO mice (Fig. 5.4F) but this is presumably secondary to the marked effect of G6pc2
deletion on body weight in males (Fig. 5.4B). These observations are consistent with human GWAS data
showing no association between G6PC2 and FPI in multiple different populations [82, 266, 287, 288]. The
101
one apparent exception to these matching mouse and human data are male chow fed 129SvEv G6pc2 KO
mice where a trend towards reduced FBG (Fig. 5.1B) was associated with a reduction in FPI (Fig. 5.1D).
However, in a slightly older cohort of chow fed 129SvEv mice we recently reported that FBG was reduced
in male G6pc2 KO mice relative to WT with no change in FPI [265]. We speculate that a difference in FPI
between WT and KO mice could arise depending on the kinetics of the fall in blood glucose and plasma
insulin during fasting (Figs. 5.1E & F).
In contrast to these data showing largely consistent effects of G6pc2 deletion on FBG and FPI
regardless of gender, diet and genetic background, the effect of G6pc2 deletion on body weight and body
composition is highly dependent on these variables. We previously showed that female, but not male,
G6pc2 KO mice on a pure C57BL/6J genetic background had reduced body weight and body fat on both a
chow and high fat diet relative to WT mice [69]. In contrast, we show here that deletion of G6pc2 in female
mice on the 129SvEv genetic background has no effect on body weight or body fat on either a chow (Table
5.1) or high fat (Table 5.3) diet relative to WT mice. Similarly, deletion of G6pc2 in female mice on a mixed
129SvEv X C57BL/6J genetic background has no effect on body weight on either a chow [96] or high fat
(Fig. 5.4A) diet relative to WT mice. In males deletion of G6pc2 on the 129SvEv genetic background was
associated with reduced body weight on a chow diet (Table 5.2) but increased body weight on a high fat
diet (Table 5.4). In contrast, deletion of G6pc2 in male mice on a mixed 129SvEv X C57BL/6J genetic
background had no effect on body weight on a chow diet [96] whereas this conferred a marked protection
against DIO on a high fat diet (Fig. 5.4B). Overall our results suggest that FBG is a much more tightly
regulated variable than body weight. Thus while FBG levels are relatively similar in chow fed C57BL/6J
[69], 129SvEv (Fig. 5.1) and mixed [96] genetic background mice, the increase in body weight and body fat
in response to high fat feeding is markedly different in C57BL/6J [69] and 129SvEv mice (Fig. 5.2).
Interestingly, the response to DIO varies remarkably even within inbred mice through poorly understood
epigenetic mechanisms [289-291].

102
As with the effects of G6pc2 deletion on body weight and body composition, the effects on
triglyceride and cholesterol levels also vary with gender, genetic background and diet. A reduction in
triglyceride levels was observed in female chow fed mice on a mixed [96] and 129SvEv genetic background
(Fig. 5.6A) whereas a reduction in cholesterol levels was observed in male chow fed mice on a C57BL/6J
genetic background (Fig. 5.7D), female (Fig. 5.7G) and male (Fig. 5.7H) high fat fed mice on a C57BL/6J
genetic background and male high fat fed mice on a mixed genetic background (Fig. 5.7J). BioVU studies
show that the rs560887-A allele, which confers reduced G6PC2 expression [79], is associated with a
reduction in cholesterol but not triglycerides in humans, with a sex-specific effect for males (Table 5.5).
Although FBG levels are relatively similar in chow fed C57BL/6J [69] and 129SvEv mice (Fig. 5.1),
we observed that, in 6 hr fasted mice, the FBG concentration in male 129SvEv mice (Fig. 5.1B) is lower than
that seen in male C57BL/6J mice [69] (p<0.05) whereas the FPI concentration is similar in male 129SvEv
mice (Fig. 5.1D) and male C57BL/6J mice [69]. This difference could potentially be explained by the
enhanced insulin sensitivity observed in chow fed 129SvEv versus C57BL/6J mice [275]. Whether insulin
sensitivity also differs between female chow fed 129SvEv and C57BL/6J mice has not been determined
[275] but clear gender differences exist. Thus body weight and fat mass are higher in 16 week old female
129SvEv mice (Table 5.1) than female C57BL/6J mice [69] (p<0.05) whereas these parameters do not differ
between 16 week old male 129SvEv mice (Table 5.2) and male C57BL/6J mice [69]. In addition, FBG
concentrations in 6 hr fasted female 129SvEv mice (Fig. 5.1A) are lower than those seen in female C57BL/6J
mice [69] (p<0.05) whereas FPI concentrations are higher in female 129SvEv mice (Fig. 5.1C) than female
C57BL/6J mice [69] (p<0.05). While multiple factors may explain the lower FBG in chow fed female (Fig.
5.1A) and male (Fig. 5.1B) 129SvEv mice relative to C57BL/6J mice [69], including the relative rates of non-
insulin dependent glucose disposal, a comparison of G6pc2 expression between chow fed 129SvEv and
C57BL/6J mice suggests that differences in G6pc2 expression do not contribute (Fig. 5.3A-D). On the other
hand, we observed a selective induction of G6pc2 expression in male C57BL/6J mice by high fat feeding
103
that might contribute to the observed gender- and strain-specific differences between high fat fed 129SvEv
and C57BL/6J mice (Fig. 5.3E-H).
A key question that remains to be addressed is how G6PC2, which is thought to be expressed
exclusively in pancreatic islet β-cells [42, 78], could be affecting body weight. One possibility, as proposed
by Li et al. [111], is that the differences in body weight they observed in humans are secondary effects due
to altered insulin signaling efficacy that arise due to an effect of G6PC2 on the pulsatility of insulin secretion.
Another possibility is that G6PC2 expression in other tissues that affect body weight has been overlooked.
Indeed while RNA blotting showed no evidence for G6PC2 expression in brain [66] and transgenic mouse
studies gave inconsistent results [292, 293], one group has reported G6pc2 expression in the mouse
hypothalamus [294], a region critical for the control of body weight [295]. However, this expression was
only detected using very high template concentrations and PCR cycles [294]. Moreover, while low levels of
expression were detected, it is unlikely to be biologically consequential since expression of the
enzymatically more active G6pc3 isoform was detected at much higher levels [42, 294]. One other potential
explanation for the link between G6PC2 and body weight is that G6PC2 affects satiety. Thus the leftward
shift in the dose response curve for GSIS observed in G6pc2 KO mice [69] might result in a faster rise in
plasma insulin levels after eating (Fig. 5.5A). Since insulin is a satiety factor [286], this faster rise in insulin
could promote a quicker cessation of feeding and ultimately reduced food intake. Though the data were
not statistically significant, the experiments shown in Figure 5.5 showed trends that supported his
hypothesis. Interestingly, our hypothesis that G6PC2 affects the timing of GSIS during glucose tolerance
tests could also explain the counterintuitive observation that the rs560887-G allele, which confers elevated
G6PC2 expression [79], is associated with elevated FBG but also higher insulin levels at the 30 minute time
point in a glucose tolerance test [111]. Future studies to determine whether deletion of G6pc2 affects food
intake or energy expenditure [296] and especially studies on β-cell-specific G6pc2 KO mice will provide
insight into these possibilities.

104
In summary, our data suggest the influence of G6pc2 on FBG is largely independent of diet, gender
and genetic background whereas its effect on body weight and fat mass is highly dependent on these
variables. This suggests that modifier genes influence some aspects of G6pc2 function, a conclusion that is
consistent with other studies showing that the influence of G6PC2 SNPs on the risk for type 2 diabetes also
varies between population [74, 112, 113, 114 , 278].

105
VI. ANALYSIS OF THE EFFECT OF 11-DEHYDROCORTICOSTERONE TREATMENT ON C57BL/6J AND 129SVEV WT AND G6PC2 KO MICE
Introduction
As T2D prevalence continues to rise, it is becoming increasingly important to better understand the
drivers of β-cell exhaustion in the context of insulin resistance. Because there is a strong link between the
phenotype of Cushing’s disease patients and metabolic syndrome, there have been many studies focusing
on the role that glucocorticoids and glucocorticoid metabolism play in regulating glucose metabolism.
Previous studies have indicated that transgenic mice overexpressing 11β-HSD1 in either WAT or liver,
resulting in increased local tissue glucocorticoid levels (Fig. 6.1), develop idiopathic metabolic syndrome
[297]. Specifically, this study showed that these mice are insulin resistance and glucose intolerant
Conversely, 11β-HSD1 null mice are protected from metabolic disease and exhibit fasting hypoglycemia,
increased whole body insulin sensitivity and increased basal and insulin stimulated glucose uptake [298].
Moreover, selective inhibition of 11β-HSD1, thereby increasing 11-DHC levels, in cell culture [299] or in
vivo by a selective inhibitor [300], results in enhanced insulin sensitivity in adipose, liver and muscle tissue.
These studies further demonstrated that 11β-HSD1 inhibition resulted in decreased fasting blood glucose,
decreased hepatic glucose production and increased insulin signaling as measured by serine 307
phosphorylation of the Insulin Receptor Substrate 1 protein [299, 300]. As such, 11β-HSD1 has been
intensively investigated as a target for therapy in T2D.
While it has been established that targeting 11β-HSD1 in the muscle, liver or adipose tissue
improves insulin sensitivity and represses FBG, the data regarding the role of 11β-HSD1 specifically in the
β-cell has been less well explored. Two studies indicate that 11β-HSD1 plays a role in regulating insulin
secretion directly. The first study showed that a mild increase in 11β-HSD1 protein expression in the islet,
resulting in increased cortisone levels, was associated with enhanced insulin secretion, which contradicts
studies done in vivo [160]. The second showed that deletion of 11β-HSD1 in the islet, i.e. increased 11-DHC
levels, results in diminished capacity for GSIS both in vitro and in vivo [153, 159], also contradicting in vivo

106
studies. Similarly, while not directly studying 11β-HSD1, treatment of islets with 11-DHC results in
decreased insulin secretion, supporting the 11β-HSD1 inhibition studies [158, 160, 301]. It remains unclear
how overexpression of 11β-HSD1 results in insulin resistance and metabolic syndrome yet increased β-
cell 11β-HSD1 expression enhances GSIS. Despite the confounding data, it is clear that modulation of 11β-
HSD1 alters the dynamics of GSIS, and as such it is important to continue exploring the role 11β-HSD1 plays
specifically in the β-cell prior to determining if it is an optimal target for treatment or prevention of
metabolic syndrome symptoms. One aspect of 11β-HSD1 activity and glucocorticoid metabolism in the β-
cell that remains unclear is whether there are additional upstream modulators of the pathway that regulate
the conversion of inactive to active glucocorticoids (Fig. 6.1).
As indicated in Figure 6.1, the inter-conversion of 11-DHC to corticosterone in rodents is driven by
the presence of G6P. Previous studies in the liver have shown that G6P transport by SLC37A4 (G6PT) into
the ER lumen requires the presence of G6PC1, indicating that G6P transport is linked to G6PC1 activity
[302]. Whether G6P transport into the β-cell ER lumen through G6PT requires the presence of G6PC2 is
unknown. If it is coupled, we hypothesized that in the absence of G6pc2, there would be impaired
corticosterone generation in β-cells due to diminished G6P levels in the ER lumen. On the other hand, if
G6PC2 is not coupled to G6PT and therefore G6P transport does not require G6PC2, we hypothesized that
the absence of G6PC2 would promote conversion of G6P to 6-phosphogluconolactone and hence promote
corticosterone generation in β-cells (Fig. 6.1). Whether increased corticosterone generation would results
in impaired or enhanced insulin secretion in mice remains to be determined as the available literature
regarding glucocorticoid treatments effects on insulin secretion is contradictory as mentioned in the
introductory section. To investigate these hypotheses, WT and G6pc2 KO 129SvEv and C57BL/6J mice were
exposed to 11-DHC supplemented water for 3-6 weeks [241] prior to the analysis of FBG and glucose
tolerance.

107
Figure 6.1. 11β-HSD1 Modulates Glucocorticoid Metabolism in the Islet β-cell. The conversion of inactive 11-DHC to active cortisol in rodents is dependent on the coupled reactions seen in this diagram. As the conversion is dependent on G6P levels in the ER lumen, hydrolysis of G6P to glucose by G6PC2 could affect the local GC concentrations in β-cells. Alternatively, if G6PC2 is coupled to G6P transport, as has been demonstrated with G6PC1 in the liver, this could also impact local GC concentrations.
G6PC2 May Regulate Entry of G6P into
the Pancreatic Islet Beta Cell ER Lumen
G6P G6P
PiGlucose
Ca2+Ca2+
Corticosterone(Cortisol)
G6PC2
G6PT
SERCA
ER
6PG
NADP+ NADPH
11-Dehydrocorticosterone(Cortisone)
6PG: 6-phosphogluconolactone; H6PD: Hexose-6-phosphate dehydrogenase11b-HSD1: 11b-Hydroxysteroid dehydrogenase type 1
H6PD
11b-HSD1
???

108
Results
Analysis of FBG and Gene Expression from 11-DHC Treated C57BL/6J WT and G6pc2 KO Mice
5 weeks of 11-DHC supplementation resulted in significant weight gain in both C57BL/6J WT and
KO mice, with no significant difference in weight gain between genotypes (Table 6.1). As the literature
supports the role of glucocorticoid treatment driving an increase in central adiposity, this increased weight
gain may be attributed to increased fat deposition although control, age matched mice were not measured
at this time point (Table 6.1) [129, 303-305]. After 3 or 5 weeks of 11-DHC supplementation, both WT and
G6pc2 KO C57BL/6J mice had improved glucose tolerance relative to non-treated controls (Fig. 6.2). After
3 weeks of treatment, G6pc2 KO mice had significantly improved glucose tolerance relative to the WT
littermates (Fig. 6.2). While at 5 weeks of treatment G6pc2 KO mice trended towards improved glucose
tolerance relative to WT treated mice, this improvement was not statistically significant (p=0.06, Fig. 6.2).
Importantly, Turban et al. showed that enhanced corticosterone generation by β-cells selectively
overexpressing 11β-HSD1 results in insulin hypersecretion rather inhibition [159]. Our data supports this
finding if we assume that enhanced insulin secretion explains the improvement in glucose tolerance, rather
than an improvement in insulin sensitivity [159]. Future studies will measure FPI and corticosterone levels
in order to further support these conclusions. Both G6pc2 and G6pt gene expression were induced
following 6 weeks of 11-DHC treatment in WT mice (Fig. 6.3). Surprisingly, while 11-DHC suppressed FBG
in both WT and KO mice, there was no observed difference in FBG levels between 11-DHC treated WT and
KO C57BL/6J mice (Fig. 6.4).

109
Table 6.1. Characterization of 14 week old male C57BL/6J WT and G6pc2 KO mice after 6 weeks of 11-DHC supplementation.
Initial Weight
(g)
Week 6 Weight
(g)
% Change
Fat (g)
Muscle (g)
Free Fluid
(g)
Fat %
Muscle %
Free Fluid
% WT 23.68 ±
0.76 (12) 29.26 ± 1.43 (12)
23.30 ± 2.68 * (12)
5.46 ± 0.77 (8)
16.57 ± 0.85 (8)
0.30 ± 0.03 (8)
22 ± 1
59 ± 1 1 ± 0.1
KO 24.91 ± 0.48 (14)
29.63 ± 0.50 (14)
20.42 ± 3.37 ** (14)
6.81 ± 0.43 (10)
17.36 ± 0.18 (10)
0.28 ± 0.04 (10)
19 ± 3
57 ± 4 1 ± 0.1
1. % Change: p<0.05 for WT weight week 0 vs WT week 6 2. % Change: p<0.05 for KO weight week 0 vs KO week 6
Figure 6.2. 11-DHC Treatment Improves the Glucose Tolerance of C57BL/6J WT and G6pc2 KO Mice. 8 week old male mice were given water supplemented with 11-DHC for 6 weeks. Glucose tolerance was assessed at week 3 and week 5.
0
50
100
150
200
250
300
350
400
0 15 30 60 90
Blo
od
Glu
cose
(m
g/
dl)
Time (mins)
WT
KO
WT wk 5 (12)
KO wk 5 (14)
WT wk 3 (4)
KO wk 3 (4) *

110
Figure 6.3. Analysis of G6pc2 and G6pt Gene Expression in 11-DHC treated C57BL/6J WT Mice. 8 week old male mice were placed on 11-DHC water for 6 weeks. After 6 weeks, WT mice were fasted for 6 hours before being isolating pancreatic RNA. Control samples were obtained from age matched mice.
Figure 6.4. Analysis of FBG in 11-DHC treated C57BL/6J WT and G6pc2 KO Mice. WT and KO mice have significantly reduced FBG relative to non-treated controls following 6 weeks of 11-DHC treatment (p<0.001).
0
20
40
60
80
100
120
140
160
WT (12) KO (15) WT (12) KO (14)
Control 11-DHC
Fa
stin
g B
loo
d
Glu
cose
(m
g/
dl) *
*
0
1
2
3
4
G6pc2 G6pt G6pc2 G6pt
Control (4) 11-DHC (4)
Fo
ld I
nd
uct
ion
of
Ge
ne
Ex
pre
ssio
n
*
*

111
Analysis of FBG and Gene Expression from 11-DHC Treated 129SvEv WT and G6pc2 KO Mice
In contrast to the C57BL/6J mice, after 6 weeks of 11-DHC supplementation, there were no
significant changes in body composition or weight in 11-DHC treated 129SvEv WT or G6pc2 KO mice (Table
6.2). 11-DHC treatment in G6pc2 KO mice resulted in a mild, yet significant, improvement in glucose
tolerance relative to WT 11-DHC treated mice (Fig. 6.5). There were no significant changes in glucose
tolerance between 11-DHC treated and non-treated WT or KO mice (Fig 6.5). Consistent with the minimal
change in glucose tolerance, a significant induction of G6pc2 or G6PT gene expression in WT mice was not
observed following 11-DHC treatment (Fig. 6.6). Moreover, the difference in FBG between WT and KO mice
was not enhanced (Fig. 6.7). Overall these data suggest limited generation of corticosterone in 129SvEv
mice. Future studies will repeat these experiments and measure both corticosterone levels and FPI.
Discussion While the studies described in this chapter are preliminary, they do begin to elucidate the role that
G6pc2 could be playing in glucocorticoid metabolism in the β-cell (Fig. 6.1). In C57BL/6J mice, the dramatic
improvement of glucose tolerance in both WT and G6pc2 KO mice indicates that 11-DHC treatment may
result in enhanced GSIS or insulin sensitivity (Fig. 6.2). The improvement in glucose tolerance was
observed both at a short 3-week and a longer 5-week 11-DHC treatment time and correlated with
significant induction of G6pc2 gene expression in C57BL/6J mice (Fig. 6.3). The more likely explanation is
that there is enhanced GSIS, as the literature showing that glucocorticoids cause insulin resistance is
extensive [129]. Moreover, based on my studies outlined in chapter IV, we observed enhanced GSIS
following Dex injection. These data strongly support the conclusion that the improved glucose tolerance in
11-DHC treated mice is due to enhanced GSIS.

112
Table 6.2. Characterization of 14 week old male 129/SvEv WT and G6pc2 KO mice after 6 weeks of 11-DHC supplementation.
Initial Weight (g)
Week 5 Weight (g)
% Change
Fat (g) Muscle (g)
Free Fluid
(g)
Fat %
Muscle %
Free Fluid %
WT 22.54 ± 0.57 (9)
22.79 ± 0.41 (9)
4 ± 0.01 (9)
2.47 ± 0.21 (4)
15.28 ± 0.33 (4)
0.51 ± 0.01 (4)
11 ± 1
67 ± 1 3 ± 1
KO 23.10 ± 0.84
24.04 ± 0.98 (11)
4 ± 0.02 (11)
2.47 ± 0.27 (6)
14.40 ± 0.49 (6)
0.68 ± 0.11 (6)
12 ± 1
73 ± 1 2 ± 1
Figure 6.5. 11-DHC Treatment in 129/SvEv Mice Improves Glucose Tolerance in G6pc2 KO Mice. 8 week old male mice were given water supplemented with 11-DHC for 6 weeks. Glucose tolerance was assessed in week 5 and showed that KO, but not WT, mice had improved glucose tolerance relative to non-treated controls (p<0.05).
0
50
100
150
200
250
300
0 15 30 60 90
Blo
od
Glu
cose
(m
g/
dl)
Time (mins)
WT (13)
KO (11)
WT 11-DHC (9)
KO 11-DHC (11)*

113
Figure 6.6. Analysis of G6pc2 and G6pt Gene Expression in 11-DHC treated 129SvEv WT Mice. 8 week old male mice were placed on 11-DHC water for 6 weeks. After 6 weeks, WT mice were fasted for 6 hours before isolating pancreatic RNA. Control samples were obtained from age matched mice.
Figure 6.7. Analysis of FBG in 11-DHC treated 129SvEv WT and G6pc2 KO Mice. WT, but not KO, mice have significantly reduced FBG relative to non-treated controls following 6 weeks of 11-DHC treatment (p<0.05).
0
0.5
1
1.5
2
G6pc2 G6pt G6pc2 G6pt
Control (8) 11-DHC (8)
Fo
ld I
nd
uct
ion
of
Ge
ne
Ex
pre
ssio
n
0
20
40
60
80
100
120
140
WT (13) KO (11) WT (9) KO (11)
Control 11-DHC
Fa
stin
g B
loo
d
Glu
cose
(m
g/
dl)
*

114
In contrast to the C57BL/6J mice, there was not a significant improvement of glucose tolerance in
129SvEv WT mice, which correlated with the lack of G6pc2 gene induction (Fig. 6.5-6.6). There was,
however, a significant enhancement of glucose tolerance in 11-DHC treated KO mice. Interestingly,
throughout these studies I observed that the 129SvEv mice appeared to drink less water relative to
C57BL/6J, which may explain the difference in magnitude of improvement of glucose tolerance (Fig. 6.2
and 6.5). Future studies need to measure the amount of water consumed from each cage in order to better
determine the amount of 11-DHC that each mouse strain is being exposed to.
If G6pc2 did not affect corticosterone generation in β-cells, we expected that FBG would be
repressed in 11-DHC treated WT and G6pc2 KO mice due to corticosterone generation in peripheral tissues
and that the difference in FBG between WT and KO mice would be changed in 11-DHC treated animals due
to the induction of G6pc2 expression. These data are consistent with the model shown in Fig 6.1 that
proposes coupling of G6pc2 and G6pt in β-cells. As noted above, we predict that glucocorticoids will be
generated by 11-DHC metabolism in other tissues. Future studies will measure circulating corticosterone
levels as well as insulin secretion. We predict that elevated circulating corticosterone explains the FBG
results in WT and KO mice. We hypothesize that improvement in glucose tolerance in 11-DHC KO mice
relative to WT mice is due to the decrease in peak glucose levels and hence an increase in the influence of
G6pc2 deletion on glucose tolerance as explained by figure 4.11.

115
VII. FUNCTIONAL ANALYSIS OF NON-SYNONYMOUS HUMAN G6PC2 SINGLE NUCLEOTIDE POLYMORPHISMS USING A NOVEL IN SITU ASSAY FOR GLUCOSE-6-PHOSPHATASE ACTIVITY
Introduction
Elevated FBG has been associated with increased risk for the development of T2D and CAM [70-72].
Previous studies have shown that an increase in FBG of 9-18 mg/dl is associated with a ~30% increased
risk of CAM [71]. Conversely, a reduction in FBG of ~9 mg/dl is associated with a 25% reduction in risk of
CAM [72]. Multiple groups have performed GWAS in an effort to identify genes associated with variations
in FBG and, as mentioned previously, the rs560887 SNP located in the third intron of the G6PC2 locus has
been identified as the strongest common genetic determinant of FBG levels in terms of significance and
effect size, accounting for ~1 % of total variance in FBG [73, 76, 79, 82, 114, 266, 278].
The role of G6PC2 in islet β-cells has been extensively covered in the introduction of this
dissertation. Figure 1.1 highlights the main function of G6PC2 to hydrolyze G6P to glucose and a free
phosphate, thereby creating a futile cycle that opposes the actions of glucokinase (Fig. 1.4). Previous data
supports the role of G6PC2 as a negative regulator of GSIS and as contributing to glucose cycling in β-cells
[69] [276, 277]. Deletion of G6pc2 results in leftward shift in the dose response curve for GSIS [69]. At sub-
maximal glucose levels this shift results in enhanced GSIS from G6pc2 KO relative to WT mouse islets [69].
Under fasting conditions, where insulin levels are the same in WT and G6pc2 KO mice, this shift results in
reduced FBG in KO mice [69, 96].
Common variants associated with variations in FBG were thought to account for a low percentage
(~10%; Ref. [306]) of total heritable variation, leading to speculation that rare (minor allele frequency
<5%), high impact variants undetected by GWAS might account for the remaining 90% of heritability [120].
However, more recent studies have suggested that the combined effects of multiple common variants have
the potential to largely account for missing heritability [126-128]. Nevertheless, the identification of high
impact rare variants has provided tremendous insight into β-cell biology [123, 307]. For example, while
common SNPs in the glucokinase (GCK) GCK locus have modest effects on FBG [82, 266], rare inactivating

116
variants in the GCK locus have been shown to cause neonatal diabetes mellitus or maturity-onset diabetes
in youth while rare activating variants cause hyperinsulinemia [123, 307]. Evolutionarily this is logical, as
rare variants with significant detrimental effects on health would be selected against and therefore not be
propagated in the human population. These data also highlight an important caveat in the interpretation
of GWAS data: the effect size of common genetic variants does not necessarily reflect the importance of the
gene in relation to the disease or phenotype being studied. As observed with GCK and G6PC2, despite the
greater effect size of common G6PC2 variants on FBG, deletion of the Gck gene in mice is lethal [122]
whereas deletion of G6pc2 results in a mild reduction in FBG [69, 96].
Because the identification of high impact rare variants in GCK has provided tremendous insight into
β-cell biology [123, 307], we were interested in identifying variants in G6PC2 that have a significant effect
on enzyme activity and/or protein expression. This current study describes a systematic functional
analysis of 22 non-synonymous G6PC2 SNPs using a novel in situ functional assay for glucose-6-
phosphatase activity.
Results
Analysis of the Effect of Human G6PC2 Codon Variation on Protein Expression Before beginning the functional analysis of non-synonymous human G6PC2 SNPs we sought to
maximize human G6PC2 protein expression in transient transfection assays. Plasmids encoding V5 His-
tagged variants of human G6PC2 and mouse G6pc2 [55, 56, 66] were transiently transfected into COS cells.
Figure 7.1A shows that human G6PC2 and mouse G6pc2 RNA were expressed at similar levels but mouse
G6pc2 protein expression was much higher than human G6PC2 (Fig. 7.1B).

117
Figure 7.1. Analysis of Human G6PC2 and Mouse G6pc2 mRNA and Protein Expression. COS 7 cells were transiently transfected, as described in Materials and Methods, with expression vectors encoding either wild type (WT) mouse (m) G6pc2, human (h) G6PC2 or the empty pcDNA3 vector. Following transfection, cells were incubated for 18-20 hr in serum-containing medium. Cells were then harvested and either RNA (Panel A) or protein (Panel B) expression were assayed as described in Materials and Methods. A representative agarose gel (Panel A) or Western blot (Panel B) are shown. The faint band of the same size in the empty vector transfected cells represents background plasmid contamination of our PCR reagents/tubes.

118
Chimeras of human G6PC2 and mouse G6pc2 were generated to investigate whether this difference
in protein expression was associated with a particular region of the human G6PC2 or mouse G6pc2
proteins (Fig. 7.2A). The results show that chimeric protein expression decreased as the proportion of
human G6PC2 coding sequence increased (Fig. 7.2B). The region of G6PC2 between AAs 72 and 192
appeared to have the greatest impact on the difference in expression between mouse G6pc2 and human
G6PC2 (Fig. 7.2B). In this region 110/121 AAs are conserved between mouse G6pc2 and human G6PC2.
This suggested that multiple differences between human and mouse codons potentially explained the
difference in protein expression. We therefore next investigated the effect of switching individual human
G6PC2 codons that are rarely present in human mRNAs, with codons that code for the same amino acid
(AA) but are more commonly found in human mRNAs. In some instances this resulted in a switch to the
same codon used to encode the equivalent AA in mouse G6pc2 (Fig. 7.3A; 7.1). In other cases this resulted
in a switch to a codon that was distinct from the codon used to encode the equivalent AA in mouse G6pc2
(Fig. 7.3B; Table 7.2). Switching the codons encoding three AAs, 58, 67 and 333, resulted in a slight
improvement in human G6PC2 expression but the effect of combining these codon changes was not
additive (Fig. 7.3A). Changing two other codons, encoding AAs 179 and 263, further reduced human G6PC2
expression (Fig. 7.3B). These data suggest that the molecular basis for the increased expression of mouse
G6pc2 versus human G6PC2 is complex and involves differences in translation efficiency and/or stability
that are conferred by multiple codons and/or AAs, respectively.
Characterization of a Novel Assay for the Measurement of Glucose-6-Phosphatase Activity In Situ
Because the activity of G6pc1 appears to be regulated by unknown factors [308], it is unclear
whether glucose-6-phosphatase activity assayed in vitro truly reflects activity in intact cells. Therefore,
before beginning the functional analysis of non-synonymous human G6PC2 SNPs, we first developed a
novel assay for the measurement of glucose-6-phosphatase activity in situ.

119
Figure 7.2. Analysis of Human G6PC2:Mouse G6pc2 Chimeric Protein Expression. 832/13 cells were transiently transfected, as described in Materials and Methods, with expression vectors encoding either wild type mouse (m) G6pc2, human (h) G6PC2 or the indicated chimeric proteins (Panel A). Following transfection, cells were incubated for 18-20 hr in serum containing medium. Cells were then harvested and protein expression assayed as described in Materials and Methods (Panel B). A representative blot is shown.

120
Figure 7.3. Analysis of the Effect of Human G6PC2 Codon Variation on Protein Expression. 832/13
cells were transiently transfected, as described in Materials and Methods, with expression vectors
encoding either WT mouse (m) G6pc2, human (h) G6PC2 or G6PC2 variants in which the codon used to
encode the indicated AAs had been optimized as shown in Tables 7.1 and7. 2. Following transfection, cells
were incubated for 18-20 hr in serum containing medium. Cells were then harvested and protein
expression assayed as described in Materials and Methods. In some instances codon optimization resulted
in a switch to the same codon used to encode the equivalent AA in mouse G6pc2 (Panel A; Table 7.1). In
other cases this resulted in a switch to a codon that was distinct from the codon used to encode the
equivalent AA in mouse G6pc2 (Panel B; Table 7.2). Representative blots are shown.

121
Table 7.1. Comparison of Codon Usage in Human G6PC2 mRNA with Common Codon Usage in Human mRNAs. The Table shows that the codons used to encode the indicated AAs in human G6PC2 are not the most commonly used codons to encode these AAs in human proteins. The Table also shows that the codons that are commonly used to encode these AAs in human proteins are the same as the codons used to encode these AAs in mouse G6pc2. The effect on human G6PC2 protein expression of changing some of these codons to the most frequently used codon was assessed as described in Figure 7.3A. Codon usage in human mRNAs is described at the following website:
http://www.kazusa.or.jp/codon/cgi-bin/showcodon.cgi?species=9606&aa=1&style=N
AA#
Human G6PC2 Codon
Frequency per 1000 Human cDNAs
Mouse G6pc2 Codon
Frequency per 1000 Human cDNAs
Frequency Difference
Effect on hG6PC2
Expression
333 CTA 7.15 CTG 39.64 32.49 Increased
15 TTG 12.93 CTG 39.64 26.71 N.C.
298 TTG 12.93 CTG 39.64 26.71 Decreased
301 TTG 12.93 CTG 39.64 26.71 Decreased
153 CTT 13.19 CTG 39.64 26.45 N.C.
48 CAA 12.34 CAG 34.23 21.89 Decreased
178 CAA 12.34 CAG 34.23 21.89 Decreased
183 GTA 7.08 GTG 28.12 21.04 N.C.
336 GTT 11.03 GTG 28.12 17.09 N.C.
289 ACA 15.11 AAG 31.86 16.75 N.C.
58 ATA 7.49 ATC 20.82 13.33 Increased
238 ATA 7.49 ATC 20.82 13.33 N.C.
67 TTA 7.67 TTC 20.28 12.61 Increased

122
Table 7.2. Comparison of Codon Usage in Human G6PC2 mRNA with Common Codon Usage in Human mRNAs. The Table shows that the codons used to encode the indicated AAs in human G6PC2 are not the most commonly used codons to encode these AAs in human proteins. The Table also shows that the codons that are commonly used to encode these AAs in human proteins are also different to the codons used to encode these AAs in mouse G6pc2. The effect on human G6PC2 protein expression of changing these codons to the most frequently used codon was assessed as described in Figure 7.3B. In this analysis we just focused on codons for AAs that are conserved between mouse G6pc2 and
human G6PC2. In other words, we did not optimize codons that encode AAs that are unique to human
G6PC2.
AA# Human G6PC2 Codon
Frequency per 1000 Human cDNAs
Most Frequently
Used Codon
Mouse G6pc2 Codon
Frequency per 1000 Human cDNAs
Frequency Difference
Effect on hG6PC2
Expression
219 CTT 13.19 CTG CTC 39.64 26.45 N.C.
263 CTT 13.19 CTG CTC 39.64 26.45 Decreased
225 CTT 13.19 CTG CTC 39.64 26.45 N.C.
69 CTT 13.19 CTG CTC 39.64 26.45 N.C. 336 GTT 11.03 GTG GTG 28.12 17.09 N.C. 179 GTT 11.03 GTG GTC 28.12 17.09 Decreased
11 ATA 7.49 ATC ATT 20.82 13.33 N.C. 303 ATA 7.49 ATC ACA 20.82 13.33 N.C.
108 GGT 10.75 GGC GGC 22.22 11.47 N.C.
77 GGT 10.75 GGC GGC 22.22 11.47 N.C.

123
Newgard and colleagues [309, 310] have previously described a highly glucose responsive INS-1
cell line variant, designated 832/13. Rat G6pc1 [311] and liver pyruvate kinase (Pklr) [312] fusion gene
expression are robustly induced by glucose in 832/13 cells. Figure 7.4A shows that, following transient
transfection of 832/13 cells with luciferase fusion genes containing Pklr promoter sequence between -206
and +1 or G6pc1 promoter sequence between -7248 and +62, glucose markedly stimulated reporter gene
expression, confirming published reports [311, 312]. Mannitol, a control for the osmotic effect of glucose,
had no effect (Fig. 7.4A). Deletion of the Pklr promoter region between -206 and -101 markedly reduced
the effect of glucose on Pklr-luciferase fusion gene expression whereas deletion of the G6pc1 promoter
region between -7248 and -1641 had little effect on glucose-stimulated G6pc1-luciferase fusion gene
expression (Fig. 7.4B). A comparison of the EC50 for glucose-stimulated Pklr-luciferase and G6pc1-
luciferase expression showed that Pklr-luciferase fusion gene expression was more sensitive to glucose
(Fig. 7.4C).
Since the 832/13 cell line is derived from rat islets [309, 310] these cells do not express endogenous
G6pc2 because, in contrast to all other species examined to date, G6pc2 is a pseudogene in rats [66]. It
therefore occurred to us that these cells could be used to assay glucose-6-phosphatase enzyme activity in
situ by measuring the ability of G6pc1 expression to blunt glucose-stimulated Pklr-luciferase or G6pc1-
luciferase fusion gene expression (Fig. 7.5A). We hypothesized that G6pc1 would repress glucose-
stimulated fusion gene expression by stimulating G6P hydrolysis [313], therefore opposing the action of
the endogenous glucokinase in these cells [314] and thereby reducing glycolytic flux. To test this
hypothesis plasmids encoding wild type (WT) G6pc1 or a catalytically dead (D) variant were co-transfected
with the Pklr-luciferase and G6pc1-luciferase fusion genes. WT and catalytically dead G6pc1 were
expressed at similar levels (Fig. 7.5B).

124
Figure 7.4. Glucose‑ Regulated Fusion Gene Expression in 832/13 Cells. 832/13 cells were transiently co‑ transfected, as described in Materials and Methods, with an expression vector encoding Renilla luciferase (0.5 μg) and Pklr‑ luciferase or G6pc1‑ luciferase fusion genes (2 μg) containing the promoter regions from ‑ 206 to +1 and ‑ 7253 to +66, respectively, (Panels A and C) or the indicated promoter regions (Panel B). Following transfection, cells were incubated for 18‑ 20 hr in serum‑ free medium in the presence of the indicated concentrations of glucose (Glc) or mannitol (Mann). Cells were then harvested and luciferase activity assayed as described in Materials and Methods. Results are presented as the ratio of firefly:Renilla luciferase activity (Panels A and B) or a percentage of the induction achieved with 30 mM glucose (Panel C). Results represent the mean ± S.E.M. of 3 experiments using independent preparations of all fusion gene constructs in which each experimental condition was assayed in triplicate.

125
Figure 7.5. Overexpression of G6pc1 Suppresses Glucose-Stimulated Fusion Gene Expression in 832/13 Cells. Panel A: Schematic illustrating how the extent of glucose cycling catalyzed by glucokinase and G6pc1 determines intracellular G6P levels and hence activation of fusion gene expression through ChREBP and CREB. Panel B: Western blot showing that wild type (W) and catalytically dead (D) G6pc1 are expressed at similar levels following expression in 832/13 cells as described in Figure 7.3. A representative blot is shown. Panel C and D: 832/13 cells were transiently co‑ transfected, as described in Materials and Methods, with the ‑ 206/+1 Pkl‑ luciferase or -7248/+62 G6pc1‑ luciferase fusion genes (2 μg), an expression vectors encoding Renilla luciferase (0.5 μg) and either 2 μg (Panel D) or the indicated amounts (Panel C) of expression vectors encoding either WT or catalytically dead (D) G6pc1. The total DNA added was kept constant using the empty pcDNA3 vector. Following transfection, cells were incubated for 18-20 hr in serum-free medium in the presence of the indicated glucose concentrations (Panel D) or 30 mM glucose (Panel C). Cells were then harvested and luciferase activity assayed as described in Materials and Methods. Results were calculated as the ratio of firefly:Renilla luciferase activity and are presented as a percentage relative to that in 30 mM glucose-treated cells transfected with the empty pcDNA3 vector (2 μg) (Panel C) or as a percentage relative to that in 30 mM glucose-treated cells in the presence of catalytically dead G6pc1 (Panel D). Results represent the mean ± S.E.M. of 3 experiments using independent preparations of both fusion gene constructs in which each experimental condition was assayed in triplicate.

126
In the catalytically dead variant AA 83 was changed from arginine to alanine, which abolishes G6P
hydrolysis [315]. Figures 7.5C and 7.5D show that WT G6pc1 repressed glucose-stimulated Pklr-luciferase
and G6pc1-luciferase fusion gene expression relative to the expression obtained in the presence of
catalytically dead G6pc1.
Most importantly, Figures 7.5C and 7.5D demonstrate that the effect of WT G6pc1 on glucose-
stimulated Pklr-luciferase and G6pc1-luciferase fusion gene expression was not equivalent with G6pc1
mediating a greater repression of the latter. For the purpose of studying the impact of SNPs on glucose-6-
phosphatase enzyme activity, subsequent experiments therefore examined the repression of glucose-
stimulated G6pc1-luciferase fusion gene expression by glucose-6-phosphatase.
Analysis of the Effect of Human G6PC2 SNPs on Glucose-6-Phosphatase Activity We have previously shown that glucose-6-phosphate activity is abolished in G6pc2 KO mouse islets
strongly suggesting that G6pc2 has phosphohydrolase activity [69]. However, while several groups have
attempted to detect G6P hydrolysis following overexpression of human G6PC2 or mouse G6pc2 [65, 66,
316], only one group has been successful [67]. Petrolonis et al. demonstrated that the rate of G6P hydrolysis
by G6PC2 overexpressed in COS7 cells was 20-40 fold lower than that of G6PC1 [67]. This suggests that
there are inherent technical difficulties in demonstrating G6P hydrolysis following overexpression of
G6PC2.
Because of the low enzyme activity of G6PC2 and difficulty with achieving high human G6PC2
expression (Figs. 7.1-7.3), we decided to focus on non-synonymous human G6PC2 SNPs that alter AAs that
are conserved in the highly related [66] and much more enzymatically active human G6PC1 and mouse
G6pc1 isoforms of the glucose-6-phosphatase catalytic subunit (Fig. 7.6; Table 7.3). Specifically, we decided
to analyze the effect of these G6PC2 SNPs indirectly by examining their effect on mouse G6pc1 enzyme
activity. We hypothesize that G6PC2 SNPs that affect the function of mouse G6pc2 are highly likely to affect
the function of human G6PC2 because of the strong conservation of catalytically important amino acids

127
between these proteins [66]. Supporting this hypothesis is the observation that of the 56 AAs in human
G6PC1 mutation of which gives rise to glycogen storage disease (GSD) type 1a [43], 51 are conserved or
represent conserved changes in human G6PC2 (Table 7.4). Based on this logic, we searched available
databases for non-synonymous human G6PC2 SNPs that alter AAs that are conserved in mouse G6pc2 and
the highly related and much more enzymatically active human G6PC1 and mouse G6pc1 isoforms of the
glucose-6-phosphatase catalytic subunit. We identified 22 such non-synonymous human G6PC2 SNPs (Fig.
7.6; Table 7.3). These SNPs change AAs in a number of different regions of G6PC2 (Table 7.3), based on the
predicted membrane topology of human G6PC1 [317]. We analyzed the effect of these G6PC2 SNPs
indirectly by examining their effect on mouse G6pc1 enzyme activity using our novel in situ assay.
For these experiments we transfected 0.05 g of plasmids encoding various G6pc1 variants, which
confers a sub-maximal repression of glucose-stimulated G6pc1-luciferase fusion gene expression (Fig.
7.5C). This approach allowed for the identification of both inhibitory and activating variants. Using this
assay we determined that the AA changes associated with the rs144254880 (Arg79Gln), rs149663725
(Gly114Arg) and rs2232326 (Ser324Pro) SNPs markedly reduce G6pc1 enzyme activity (Table 7.3)
without affecting protein expression (Figs. 7.7A & B). For simplicity and comparison with the effect of these
variants on human G6PC2 protein expression, these conserved AAs are numbered based on the position of
the AA in human G6PC2 rather than their actual location in mouse G6pc1 (Fig. 7.6). The AA changes
associated with the rs142189264 (Ser30Phe), rs199682245 (Asn68Ile) and rs150538801 (Phe256Leu)
SNPs also reduced G6pc1 enzyme activity (Table 7.3), though to a lesser degree, but again without affecting
protein expression (Fig. 7.7C). The AA changes associated with several other SNPs had statistically
significant though minor effects on G6pc1 enzyme activity (Table 7.3), without affecting protein expression
(Figure 7.8).

128
Figure 7.6. Conservation of Amino Acids Between Human G6PC2, Mouse G6pc2, Human G6PC1 and
Mouse G6pc1. Sequence alignment showing the conservation of AAs between human (h) G6PC2, mouse
(m) G6pc2, human G6PC1 and mouse G6pc1. Residues highlighted in green represent AAs mutation of
which in G6PC1 causes GSD type 1a [43]. Residues highlighted in pink represent AAs that are changed by
human G6PC2 SNPs that were identified using the UCSC Genome Browser (https://genome.ucsc.edu/) and
HumSAVR (http://omictools.com/humsavar‑ tool) databases. Residues highlighted in yellow represent
conserved AAs in human G6PC2, mouse G6pc2, human G6PC1 and mouse G6pc1 that are changed by a
human G6PC2 SNP and where mutation in G6PC1 can cause GSD type 1a. Identities are indicated by filled
circles and similarities by vertical bars.

129
Figure 7.7. Analysis of the Effect of Amino Acid Changes on Mouse G6pc1 Protein Expression. 832/13
cells were transiently transfected, as described in Materials and Methods, with expression vectors
encoding either WT mouse (m) G6pc1 or G6pc1 variants in which the indicated amino acid (AA) had been
changed as shown in Table 1. Following transfection, cells were incubated for 18‑ 20 hr in
serum‑ containing medium. Cells were then harvested and protein expression assayed as described in
Materials and Methods. In some instances these AA changes did not affect G6pc1 protein expression
(Panels A and B). In other cases they resulted in reduced expression (Panel C). Representative blots are
shown. The individual panels shown in Panel B were all derived from the same blot. For simplicity and
comparison with Figure 7.9, these AAs are numbered based on the position of the equivalent conserved AA
in human G6PC2 (Figure 7.4).

130
Figure 7.8. Analysis of the Effect of Amino Acid Changes on Mouse G6pc1 Protein Expression. 832/13 cells were transiently transfected, as described in Materials and Methods, with expression vectors encoding either wild type (WT) mouse (m) G6pc1 or G6pc1 variants in which the indicated amino acid (AA) had been changed as shown in Table 1. Following transfection, cells were incubated for 18-20 hr in serum-containing medium. Cells were then harvested and protein expression assayed as described in Materials and Methods. With the exception of AA 8, these AA changes did not markedly affect G6pc1 protein expression. Representative blots are shown. For simplicity and comparison with Figure 7.9, these AAs are numbered based on the position of the equivalent AA in human G6PC2 (Fig. 7.6).

131
Table 7.3. Analysis of the Effect of Amino Acids Changed by Human G6PC2 SNPs on Human G6PC2
and Mouse G6pc1 Protein Expression and Activity. Amino acids (AAs) changed by human G6PC2 SNPs
that are conserved in human G6PC2, mouse G6pc2, human G6PC1 and mouse G6pc1 were identified using
the UCSC Genome Browser (https://genome.ucsc.edu/) and HumSAVR
(http://omictools.com/humsavar‑ tool) databases. The G6PC2 domain affected by each AA change was
predicted by comparison with the proposed structure of G6PC1 [317]. The Table shows the effect of these
SNPs on G6pc1 enzyme activity based on comparison with WT G6pc1 as assessed 646 using a novel in situ
enzyme assay (Figs. 7.5 & 7.6). This assay measures the ability of G6pc1 to suppress glucose-stimulated
fusion gene expression (Figs. 7.5 & 7.6). Results for each variant represent the mean ± S.E.M. of 3
experiments using two independent preparations of each expression vector construct in which each
experimental condition was assayed in triplicate. Some of these G6PC2 SNPs change AAs that are not only
conserved in G6PC1 but where mutation of these AAs in G6PC1 causes GSD type 1a [318]. In each case the
AA associated with GSD type 1a is shown in parentheses. In each case the G6PC2 SNP changes the AA to
one distinct from that associated with GSD type 1a. For simplicity and comparisons between human G6PC2
and mouse G6pc1 the AAs in mouse G6pc1 are numbered based on the position of the equivalent conserved
AA in human G6PC2 (Figure 7.4). N.D., not determined; N.C., no change.

132
Table 7.4 Amino Acids in Human G6PC1 Whose Mutation Causes Glycogen Storage Disease Type 1a are Highly Conserved in Mouse G6pc1, Mouse G6pc2 and Human G6PC2. The Table shows AAs in human G6PC1 whose mutation causes glycogen storage disease (GSD) type 1a [43] and whether these AAs are conserved or similar in mouse G6pc1, mouse G6pc2 and human G6PC2.

133
Interestingly, the AA changes associated with the rs368382511 (Gly8Glu), rs374055555 (Arg293Trp) and
rs2232327 (Pro340Leu) SNPs markedly reduced G6pc1 protein expression (Figs. 7.7D & E) but only the
latter had a marked effect on enzyme activity (Table 7.3). This result suggests that these AA changes may
actually be increasing the specific activity of G6pc1.
Table 7.1 and Figure 7.6 show that there are six SNPs in G6PC2 that alter AAs that are conserved in
G6PC1 and where mutation of these AAs in G6PC1 causes GSD type 1a [43]. However, these SNPs change
the residue associated with GSD type 1a to an AA distinct from that that causes GSD type 1a. For example,
rs372008743 changes a glutamine at residue 16 to a histidine whereas the mutation associated with GSD
type 1a involves a change from a glutamine at residue 16 to an arginine (Table 7.3; Ref. [43]). For four of
these 6 SNPs the AA change associated with the G6PC2 SNP had little effect on G6pc1 enzyme activity or
protein expression (Table 7.3) suggesting that the change is silent. However, for two of these 6 SNPs the
AA change associated with the G6PC2 SNP markedly affected G6pc1 enzyme activity (rs144254880;
Arg79Gln) (Table 7.1) or expression (rs374055555; Arg293Trp) (Figs. 7.7D & E).
Analysis of the Effect of Human G6PC2 SNPs on Protein Expression We next analyzed the effect of several human non-synonymous G6PC2 SNPs on human G6PC2
protein expression (Table 7.3). We began by analyzing the 3 SNPs that were associated with reduced mouse
G6pc1 protein expression (Figs. 7.7D & E), namely rs368382511 (Gly8Glu), rs374055555 (Arg293Trp) and
rs2232327 (Pro340Leu). Figures 7.9A & B show that rs374055555 (Arg293Trp) and rs2232327
(Pro340Leu) also confer reduced expression of human G6PC2 in COS cells, with a trend towards reduced
expression observed with rs368382511 (Gly8Glu). We next analyzed three SNPs, namely rs138726309
(His177Tyr), rs2232323 (Tyr207Ser) and rs492594 (Val219Leu) that Mahajan et al. [287] recently
showed reduced human G6PC2 protein expression in 832/13 cells.

134
Figure 7.9. Analysis of the Effect of Human G6PC2 SNPs on Human G6PC2 Protein Expression. COS 7 cells were transiently transfected, as described in Materials and Methods, with expression vectors encoding either wild type (WT) human (h) G6PC2 or G6PC2 variants in which the indicated amino acid (AA) had been changed as shown in Table 1. Following transfection, cells were incubated for 18-20 hr in serum-containing medium. Cells were then harvested and protein expression assayed as described in Materials and Methods. The variants shown either reduced (Panels A-D) or had little effect (Panel E) on human G6PC2 protein expression. Data were quantitated by scanning with the results in Panels B and D showing the mean ± S.E.M. of 4 experiments. Representative blots are shown.

135
Figures 7.9C & D show that rs138726309 (His177Tyr) and rs2232323 (Tyr207Ser) also confer reduced
expression of human G6PC2 in COS cells. In contrast, the rs492594 (Val219Leu) variant had little effect on
human G6PC2 expression in COS cells (Fig. 7.9E). The AA changes associated with rs138726309
(His177Tyr) and rs2232323 (Tyr207Ser) did not affect mouse G6pc1 protein expression (Fig. 7.7A). The
rs492594 (Val219Leu) variant alters an AA that is not conserved in mouse G6pc2, human G6PC1 or mouse
G6pc1 (Table 7.5).
Finally, we analyzed two additional SNPs at the C terminus of human G6PC2, namely rs137857125
(Pro313Leu) and rs2232326 (Ser324Pro). Figures 7.9C & D show that these SNPs also confer reduced
expression of human G6PC2 in COS cells. In contrast, the AA changes associated with these SNPs did not
affect mouse G6pc1 protein expression (Fig. 7.7B). Strikingly, these results suggest that despite the
conservation of key AAs involved in enzyme activity between mouse G6pc1, mouse G6pc2, human G6PC1
and human G6PC2 [43, 315, 319] the mutation of conserved AAs has variable effects on human G6PC2 and
mouse G6pc1 protein expression.
Discussion This study focused on 22 non-synonymous SNPs in human G6PC2 that change AAs that are
conserved between human G6PC2, mouse G6pc2, human G6PC1 and mouse G6pc1 (Table 7.3) (Fig. 7.6),
though database analyses identified multiple additional non-synonymous G6PC2 SNPs that affect AAs in
G6PC2 that are not conserved across all four isoforms (Table 7.5). We show that the AA changes associated
with the rs144254880 (Arg79Gln), rs149663725 (Gly114Arg), rs2232326 (Ser324Pro), rs142189264
(Ser30Phe), rs199682245 (Asn68Ile) and rs150538801 (Phe256Leu) SNPs reduced G6pc1 enzyme
activity in situ (Table 7.3) without affecting protein expression (Figs. 7.7A-C). We also show that the AA
changes associated with the rs368382511 (Gly8Glu), rs374055555 (Arg293Trp) and rs2232327
(Pro340Leu) SNPs markedly reduced G6pc1 protein expression (Figs. 7.7D & E).

136
Table 7.5. Human G6PC2 SNPs that Alter Amino Acids that are not Conserved in Human G6PC2, Mouse G6pc2, Human G6PC1 and Mouse G6pc1. Human G6PC2 SNPs that change AAs that are not uniformly conserved in human G6PC2, mouse G6pc2, human G6PC1 and mouse G6pc1 were identified using the UCSC Genome Browser (https://genome.ucsc.edu/) and HumSAVR (http://omictools.com/humsavar-tool) databases. The G6PC2 domain affected by each AA change was predicted by comparison with the proposed structure of G6PC1 [317]. **, this residue has been associated with variations in FBG in healthy individuals who do not have diabetes [287].

137
Finally, we show that the rs368382511 (Gly8Glu), rs374055555 (Arg293Trp), rs2232327 (Pro340Leu),
rs138726309 (His177Tyr), rs2232323 (Tyr207Ser), rs137857125 (Pro313Leu) and rs2232326
(Ser324Pro) SNPs confer reduced expression of human G6PC2 (Figs. 7.8A-D).
Once the challenge of achieving high human G6PC2 expression is overcome (Figs. 7.1-7.3), future
studies will aim to determine whether the SNPs that affect mouse G6pc1 enzyme activity also affect human
G6PC2 enzyme activity. This seems highly likely since site directed mutagenesis studies [315, 319] and the
analysis of mutations causing GSD type 1a [43] have shown AAs that are essential for high G6PC1 enzyme
activity are conserved between mouse G6pc1, mouse G6pc2, human G6PC1 and human G6PC2. Indeed, of
the 56 AAs in human G6PC1 mutation of which gives rise to GSD type 1a [43], 51 are conserved or represent
conserved changes in human G6PC2 (Table 7.6). It is striking that the G6PC2 SNPs rs138726309
(His177Tyr) and rs2232323 (Tyr207Ser), that have been linked to variations in FBG [287, 288, 320], affect
AAs mutation of which in G6PC1 causes GSD type 1a (Table 7.3) [43]. Site directed mutagenesis studies
[321] and the analysis of mutations causing Dursun syndrome [322] have similarly shown a conservation
of catalytically important AAs between G6PC1 and the G6PC3 isoform of glucose-6-phosphatase, initially
referred to as UGRP, even though they share only a 36% overall AA conservation [55]. Furthermore, there
is a statistically significant association between residues that are associated with GSD type 1a and Dursun
syndrome [323], supporting the notion that SNPs that alter conserved residues in all three G6PC1 isoforms
will likely have similar effects on enzyme activity because catalytically important residues are conserved
in all three isoforms.
Future studies will also use Vanderbilt University’s BioVU biobank to examine whether SNPs that
affect human G6PC2 protein expression or activity are associated with altered phenotypic characteristics
in humans, such as FBG and T2D risk. BioVU is a DNA biobank linked to a de-identified version of the
Vanderbilt electronic health records, called the Synthetic Derivative (SD) [249, 250]. The SD can be
screened, using a procedure referred to as a PheWAS, to identify associations between specific SNPs and
human diseases as well as associations with altered plasma hormone/metabolite levels [324-328]. Of

138
particular interest will be the medical records of individuals with G6PC2 SNPs that result in frameshift
mutations or premature termination (Table 7.6).
Mahajan et al. [287] recently showed that the rs138726309 (His177Tyr) and rs2232323
(Tyr207Ser) SNPs result in reduced human G6PC2 protein expression in HEK293 and INS-1E cells, which
we confirmed in COS cells (Figs. 7.8C & D). They also showed that another SNP rs492594 (Val219Leu), that
changes an AA that is not conserved in mouse G6pc2, human G6PC1 or mouse G6pc1 (Table 7.5), also
results in reduced human G6PC2 protein expression in HEK293 cells though not in INS-1E cells [287]. We
observed that this SNP also does not appear to affect human G6PC2 protein expression in COS cells (Fig.
7.8E). This suggests that for this particular SNP, unknown cell line-dependent factors influence its action
on G6PC2 expression. As with the initially described GWAS SNP, rs560887 [82, 266], Mahajan et al. [287]
showed that all three of these SNPs are associated with variations in fasting plasma glucose (FPG).
Horikoshi et al. [320] have also shown that the rs138726309 (His177Tyr) is associated with variations in
FPG. In addition, Wessel et al. [329] have shown that rs138726309 (His177Tyr) and rs2232323
(Tyr207Ser), as well as two additional non-synonymous SNPs, rs2232326 (Ser324Pro) and rs146779637
(Arg283STOP) are associated with variations in FPG. We showed that the rs2232326 (Ser324Pro) SNP
results in altered G6PC2 protein expression in COS cells (Figs. 7.8C & D). Interestingly, for reasons that are
unclear, Mahajan et al. [287], in contrast to Wessel et al. [329], did not observe an association between
rs146779637 (Arg283STOP) and FPG. Mahajan et al. [287] speculated that the lack of association with FPG
was because this variant might retain activity despite the removal of the terminal 72 AAs of G6PC2. This
variant clearly merits further study, especially since the data suggest a potential difference with human
G6PC1, whose activity is susceptible to C terminal truncation [315].
Previous studies have suggested a complex relationship between G6PC2 and T2D risk with
apparently conflicting results in different populations [76, 112, 278, 330]. Interestingly, Mahajan et al.
[287] showed that the rs492594 (Val219Leu) SNP is associated with altered risk for T2D. In contrast, in
their study of non-synonymous G6PC2 SNPs, Wessel et al. [329] reported no association between G6PC2
139
and T2D risk. The rs492594 (Val219Leu) G6PC2 variant was not included in the studies of Wessel et al.
[329] so potential reasons for this apparent discrepancy between G6PC2 variation and T2D risk remain
unclear. These results may indicate that the rs492594 (Val219Leu) G6PC2 variant has a unique effect on
β-cell function, unrelated to the control of glycolytic flux, especially since our results (Fig. 7.8) and the
results of Mahajan et al. [287] suggest that the rs492594 (Val219Leu) variant reduces G6PC2 protein
expression less than the rs138726309 (His177Tyr) and rs2232323 (Tyr207Ser) variants that were
included in the studies of Wessel et al. [329]. Indeed, we have previously speculated that G6PC2 may affect
β-cell endoplasmic reticulum calcium retention, in addition to its action on glycolytic flux [78]. Indirect
support for such a function for G6PC2 was recently suggested by the observation that deletion of the sorcin
gene, which regulates endoplasmic reticulum calcium retention, resulted in elevated G6pc2 expression
[331].
Our study also describes a novel assay for the measurement of glucose-6-phosphatase activity in
situ (Figs. 7.4 & 7.5). G6pc1 is unstable [332] and much remains unknown about the factors regulating
G6pc1 activity [308] so this assay has the advantage that G6pc1 activity can be studied in an endogenous
environment rather than in isolated and/or permeabilized microsomes. However, there are several caveats
associated with this assay. Firstly, even though the amount of G6pc1 expressed was sufficient to achieve a
sub-maximal repression of glucose-stimulated G6pc1-luciferase gene expression (Fig. 7.5), this assay will
not have the same linearity relative to an in vitro assay given the influence of other intracellular factors on
G6pc1 activity. Secondly, in this assay apparent changes in G6pc1 activity could arise indirectly due to a
change in sub-cellular distribution. Finally, because G6pc1 is located in the endoplasmic reticulum with its
active site directed towards the lumen, the glucose-6-phosphatase activity of G6pc1 in situ is dependent on
transport of its substrate G6P into the lumen by a G6P/Pi transporter, encoded by the SLC37A4 gene [42,
78]. Pan et al. [302] have shown that G6PC1 and SLC37A4 are functionally coupled. Therefore, AA changes
that affect this coupling will also appear to affect the inherent glucose-6-phosphatase activity of G6pc1 in
the in situ assay. Future studies comparing the activity of specific G6pc1 variants in this in situ assay and

140
the standard in vitro assay may lead to the identification of variants that affect aspects of G6pc1 function
other than G6P hydrolysis.
In the course of developing our novel assay we made several interesting observations about
glucose-regulated gene expression. Collier et al. [312] demonstrated that the effect of glucose on rat Pklr
gene expression in 832/13 cells is mediated by the carbohydrate response element binding protein
(ChREBP), which binds a carbohydrate response element (ChoRE) located between -188 and -172 in the
rat Pklr promoter [333]. Consistent with this observation, deletion of the promoter region between -206
and -101 markedly reduced the effect of glucose on Pklr-luciferase fusion gene expression (Fig. 7.4B). In
contrast, Pederson et al. [311] demonstrated that the effect of glucose on rat G6pc1 expression in 832/13
cells is mediated by two promoter elements, a ChoRE located between -3616 and -3600 that binds ChREBP
[311], and a cAMP response element (CRE) located between -163 and -156 that binds CRE binding protein
(CREB) [272]. Pederson et al. [311] found that deletion of the G6PC1 ChoRE reduced the glucose response
by ~80%. However, Figure 7.4B shows that deletion of the promoter region between -7248 and -1641 had
little effect on glucose-stimulated G6pc1-luciferase fusion gene expression, suggesting that differences
possibly related to cell passage number or growth conditions have altered the relative importance of
ChREBP and CREB in glucose signaling to the G6pc1 promoter in our 832/13 cells. Interestingly, Pklr-
luciferase fusion gene expression was more sensitive to glucose suggesting that the signaling pathways
used by glucose to regulate ChREBP and CREB are distinct (Fig. 7.4C). Consistent with this idea, the effect
of WT G6pc1 on glucose-stimulated Pklr-luciferase and G6pc1-luciferase fusion gene expression was not
equivalent with G6pc1 mediating a greater repression of the latter (Fig. 7.5C & D). This result not only
suggests that the glucose-signaling pathways to ChREBP and CREB are distinct and that G6pc1
preferentially influences the latter. Finally, we also observed that catalytically dead G6pc1 partially
represses glucose-stimulated fusion gene expression (Figs. 7.5C & D). This may reflect activation of the
endoplasmic reticulum stress response [334] and could also explain why catalytically dead G6pc1 has a
greater effect on G6pc1 versus Pklr fusion gene expression since the former promoter contains a stress

141
response element [335]. Interestingly, over expression of G6PC2 in mice causes diabetes due to activation
of the ER stress response [336].
142
VIII. SUMMARY AND FUTURE DIRECTIONS
Thesis Summary The work described in this dissertation aims to provide insight into the role that G6pc2 plays in
modulating FBG during glucocorticoid induced stress, while also identifying the role G6pc2 is playing in
modulating BMI and how G6PC2 SNPs affect protein expression and activity. Briefly, as was described in
the introduction, G6pc2 functions to create a substrate cycle with glucokinase and, through hydrolyzing
G6P, it modulates FBG under certain physiological conditions by modulating glycolytic flux and the amount
of G6P metabolized by the β-cell. The work described here aimed to identify physiological conditions under
which G6pc2 activity or expression was regulated, as well as the mechanisms by which such regulation
occurs. Moreover, I further identified how, by using a variety of stress inducing experimental paradigms,
induction of G6pc2 gene expression affects glucose metabolism, specifically FBG. Additionally, due to the
novel association of human G6PC2 SNPs with BMI and adiposity in Mexican Americans, I aimed to
determine whether G6pc2 KO mice were protected from DIO. Finally, by using a systematic approach, I
worked to analyze whether rare human G6PC2 SNPs affect either protein expression or activity, as assayed
using a novel in vitro assay (Fig. 7.6A). Because my analysis of G6PC2 SNPs on protein expression and
enzyme activity was indirect due to technical issues in expressing the protein in tissue culture, these
analyses need to be repeated once this hurdle is overcome.
Because the synthetic glucocorticoid Dex was found to stimulate human G6PC2 promoter activity, I
extended these studies by characterizing the effect of three different models of stress (Dex injections,
physical restraint and 11-DHC) on FBG and glucose tolerance in WT and G6pc2 KO 129SvEv and C57BL/6J
mice. Briefly, I showed that stress induces G6pc2 gene expression and this results in improved glucose
tolerance in all three models (Fig. 4.7H&I, 4.10A&G, 6.2). The improvement in glucose tolerance was
greater in KO mice relative to WT in the 129SvEv physical restraint, C57BL/6J 11-DHC and C57BL/6J Dex
models, consistent with enhanced sensitivity of GSIS to glucose. Moreover, there was a significant reduction

143
in FBG of KO treated animals relative to WT in all three paradigms following a 6hr fast (Fig. 3.3J, 4.7F,
4.10C&E, 6.4)). This is consistent with GWAS data that associate G6PC2 with FBG variation in humans.
These data indicate that G6PC2 plays an important role in regulating the set point for FBG (Fig. 1.5).
As noted previously, the improvement in glucose tolerance that I observed in my stress paradigms
is not characteristic of other models and data in the glucocorticoid metabolism field. The literature more
frequently supports the role of glucocorticoid treatment and stress resulting in increased FBG, insulin
resistance and impaired glucose intolerance [129, 169, 173, 337]. The difference between my findings in
relation to the field can be explained in a number of ways. The first is that many of these papers used rats
to study the effects of glucocorticoid treatment, and as previously mentioned, G6pc2 is a pseudogene in
rats [147, 210, 211, 227, 338]. Secondly, there are differences in the amount of time animals were fasted
prior to FBG measurements. In my studies, mice were fasted for 6hrs prior to experiments, however a
majority of the published studies were performed on overnight fasted rats. However, while the 6hr data
opposes the generally accepted trends regarding the effect of glucocorticoids on glucose metabolism, when
I repeated my studies on 24hr fasted mice, I was able to replicate those studies and detect impaired glucose
tolerance and enhanced FBG in physically restrained WT and G6pc2 KO mice relative to controls (Fig.
4.10E). The final explanation for the inconsistencies between my data and other published studies can be
attributed to different experimental methods and paradigms, i.e. there is not a consistent dose, delivery
method or type of glucocorticoid used [206].
Because the rs560887 SNP in G6PC2 is associated with variations in BMI and adiposity, I wanted to
determine if G6pc2 KO mice were protected from DIO. The findings outlined in chapter V highlight the fact
that there are gender, genotype and background specific effects of high fat feeding in mice. Moreover, due
to the observed background differences, it seems that the effect of high fat feeding induced G6pc2 gene
expression is dependent on strain specific modifier genes. Interestingly, cholesterol levels were
significantly decreased in high fat fed C57BL/6J and mixed genetic background G6pc2 KO mice relative to
WT (Fig. 5.6 G,H&J). Future studies should focus on how the absence of G6pc2 could affect cholesterol

144
metabolism in these mice. I speculate that it is most likely through an indirect mechanism driven be the
observed decrease in FBG relative to WT high fat fed mice.
Finally, in an effort to identify rare G6PC2 variants that would be predicted to have significant effects
on FBG, I systematically characterized the effect that human G6PC2 SNPs have on protein expression and
enzyme activity. These studies identified numerous SNPs that were conserved at catalytically important
residues that had significant effects on activity and/or protein expression (Table 7.3). While the activity of
human G6PC2 was not successfully studied, this body of data will provide a database of SNPs that can be
used to characterize human SNPs when an improved system for studying human G6PC2 expression and
activity is available. Future studies should aim to improve human G6PC2 expression in tissue culture
systems so as to better understand how these SNPs affect activity in vitro. Once the effect of these human
SNPs have been characterized, we can use BioVU to address whether these SNPs correlate with marked
changes in FBG. Finally, future work needs to determine if the differences in protein expression in human
G6PC2 and mouse G6pc1 were caused by differences in translation efficiency and/or stability. Because our
RNA analysis of mouse G6pc2 and human G6pc2 in COS7 cells indicates that there is more endogenous
mouse G6pc2 RNA present relative to human (Fig. 7.1), this potentially could explain part of the difference
in protein expression that is observed (Fig. 7.2). However, I do not think that the different levels of RNA
expression fully accounts for the difference in protein expression because the magnitude of the difference
in mouse G6pc2 protein expressed relative to human is much larger than that at the RNA level. In order to
determine if there is a difference in protein stability between mouse and human G6PC2, a pulse-proteolysis
experiment could be performed in transiently transfected COS7 cells [339].
Further Studies to Elucidate the Role of G6pc2 in Pancreatic β-cells
The studies described here further aid in understanding the role that G6pc2 plays in vivo,
specifically in conditions of elevated glucocorticoid levels. While I examined multiple experimental

145
paradigms looking at the effect of stress on G6pc2 expression and its role in glucose metabolism, more
work needs to be done to examine the mechanisms by which glucocorticoids affect glucose cycling in islets
and subsequently affects FBG. With the advancements made by Dr. Jamey Young in studying glucose cycling
[68], we can now design experiments to directly examine how glucose cycling is modulated by elevated
glucocorticoid levels. By using Dr. Young’s stable isotope method, altered G6Pase activity and glucose
cycling in islets under conditions of enhanced glucocorticoid levels can be directly linked to the presence
of G6pc2 by using WT islets, with the expectation that glucocorticoids will increase glucose cycling rates
and decrease glycolytic flux following glucocorticoid treatment. Interestingly, work published prior to the
identification of G6PC2 and G6PT showed that G6Pase activity and glucose cycling are enhanced following
Dex treatment [90, 230]. The findings presented in chapter III can explain these previous findings in that
Dex stimulation of G6pc2 and G6pt gene expression would be expected to increase glucose cycling, increase
G6Pase activity and blunt insulin secretion, as these older studies observed [90, 230]. It would be valuable
to repeat these studies in order to confirm that these data can be explained by an action of G6pc2 on glucose
cycling and glycolytic flux; using WT islets we should be able to replicate their data, however, using G6pc2
glucocorticoid treated KO islets, we expect glucose cycling to be abolished.
These isolated islet studies could be performed in two ways, the first is to isolate islets from
glucocorticoid treated or stressed animals and the second is to directly treat isolated islets with
glucocorticoids. There are caveats to both methods. One concern with isolating islets from glucocorticoid
treated animals is that the isolation process will effect glucose cycling rates or that glucocorticoid
stimulated changes in the expression of key β-cell genes could be lost in the process of islet isolation, as
has previously been reported. Alternatively, the concern with directly treating isolated islets with
glucocorticoids is that multiple genes have been shown to be regulated differently in vitro relative to in vivo
function; so this method may not accurately reflect the effect of glucocorticoids on glucose cycling and
glycolytic flux in vivo [68, 90, 230, 340]. A final concern with isolated islet studies is that, while they
highlight important aspects of β-cell biology, they are not representative of the effect that glucocorticoids

146
have in vivo. As it has been well established that glucocorticoid treatment causes whole body insulin
resistance [129, 147, 169], performing studies in isolated islets is not ideal in that these studies are
executed in the absence of insulin resistance.
In addition to assessing the effect that stress has on glucose cycling in WT and G6pc2 KO islets, a
paradigm which detects a difference in insulin secretion between WT and G6pc2 KO glucocorticoid treated
mice, would provide further support for the models highlighted in this thesis. In my studies, I focused on
FBG and did not attempt to highlight a difference in GSIS, but our model predicts that, at submaximal
glucose concentrations, G6pc2 KO mice would have enhanced insulin secretion relative to WT (Fig. 1.6 &
4.11). Future studies directly examining GSIS in stressed mice using either perfused pancreata or clamp
studies are necessary because they will further support the findings in this thesis and provide increased
evidence for the role of G6pc2 as a negative regulator of GSIS. 11-DHC supplementation (chapter VI) and
long-term corticosterone treatment, as discussed in the next section, may prove to be more successful in
detecting a difference in insulin secretion. Performing these studies will further elucidate the function of
G6pc2 in modulating FBG and GSIS via increased rates of glucose cycling during stress.
While data presented in Chapter III-VI show that, under basal conditions, there are no differences
in glucose tolerance between WT and G6pc2 KO mice, consistent with GWAS data [69], we do see improved
glucose tolerance in KO mice relative to WT in the Dex injection, 11-DHC and physical restraint paradigms,
consistent with enhanced sensitivity of GSIS to glucose. Additionally, while not directly related to the
function of G6pc2, future studies should examine the mechanisms driving the improvement in glucose
tolerance that I observed in all three stress paradigms. Traditionally, it has been accepted that
glucocorticoid treatment results in an elevation of FBG caused by whole body insulin resistance, hepatic
glycogenolysis and inhibition of insulin secretion [129]. However, the data presented here does not
support this model following a 6hr fast. While it is evident the G6pc2 functions to protect against
hypoglycemia in WT mice following glucocorticoid treatment, it is unclear what the benefit of improved
glucose tolerance in stressed mice would be (Fig. 4.7H&I, 4.10A, 6.2 & 6.5). While this may be explained by

147
differences in fasting times, as previously discussed, another explanation is that I measured FBG and
glucose tolerance at a time point when β-cells were still functioning and able to hyper-secrete insulin,
thereby resulting in repressed FBG and enhanced glucose tolerance. Data presented in chapters III & IV
show that, following glucocorticoid treatment or restraint, FPI levels are significantly elevated (Fig. 4.7G,
4.10B&F), consistent with enhanced GSIS. While we did not directly show enhanced insulin secretion,
previous literature reports hyperinsulinemia following Dex injections, which supports our model [129,
141, 185, 211, 226]. However, following a more chronic paradigm such as 11-DHC or corticosterone
treatments, we may observe that the β-cells cannot adequately secrete insulin at a level necessary to
overcome the whole body, glucocorticoid induced, insulin resistance. As such, we would expect in these
paradigms to see impaired glucose tolerance and enhanced FBG relative to controls. These chronic
paradigms could also demonstrate impaired β-cell function, as seen in other paradigms in the literature,
and allow us to further detect differences in WT and G6pc2 KO glucose metabolism in vivo. These models
would also better mimic the human conditions of Cushing’s disease or diseases that require long-term
glucocorticoid treatments such as rheumatoid arthritis. Further support for this idea comes from the
observation that a subset of 129SvEv mice treated with Dex become diabetic, mimicking glucocorticoid
induced diabetes in humans (Fig. 4.7 C&D).
Analysis of the Effect of Corticosterone Pellets in C57BL/6J and 129SvEv WT and G6pc2 KO Mice
An alternate model to study the effect of enhanced glucocorticoid levels is to use slow releasing
corticosterone pellets in adrenalectomized mice [341-344]. There are multiple differences in this model
relative to the previously studied effects of physical restraint (chapter III), Dex injections (chapter IV) and
11-DHC (chapter VI) treatment. The first is that it is a chronic model using the endogenous active
glucocorticoid in adrenalectomized mice. By removing the adrenal gland, we will be able to study the effect
of chronic stress with less interference from the naturally produced corticosterone. The next difference is

148
that by chronically elevating glucocorticoids, we will enhance whole body glucocorticoid levels in a
sustained fashion. This will occur because, once the animals are adrenalectomized, their natural circadian
rhythm of glucocorticoid secretion will be abolished and, due to the slow-release nature of the pellet, there
will be a constant release of corticosterone into the system, thereby resulting in a constant level of
glucocorticoid exposure to all tissues [344]. While the 11-DHC studies were also chronic, the pellet studies
differ in that the 11-DHC mice still exhibit circadian control over endogenous glucocorticoid secretion.
Moreover, they differ because we will be administering the endogenously active corticosterone versus the
inactive 11-DHC. Finally, by using slow release pellets in adrenalectomized mice, it would allow us to more
closely mimic Cushing’s disease, which, in humans, is typically caused by an adenoma on the adrenal gland
that results in chronic and uninhibited secretion of cortisol. These patients do not exhibit negative feedback
of the HPA axis (Fig. 1.13) and demonstrate increased central adiposity, weight gain, high blood pressure,
bone loss and in some cases T2D [148, 202, 203, 345]. Overall, using slow release pellets will allow us to
examine the role that G6pc2 plays in chronically stressed mice versus acutely stressed.
Because of the chronic nature of the paradigm, I hypothesize that there will be widespread insulin
resistance, resulting in impaired glucose tolerance and increased FBG, with KO mice still having relatively
reduced FBG compared to WT. In comparison to the other models studied, I expect that FBG will be
significantly increased in treated animals compared to control animals, as observed in 24hr fasted Dex
treated mice, as opposed to the decrease in FBG we observed in the 6hr fasted models. As mentioned in
previous sections, we hypothesize that the models studied in chapters III, IV and VI demonstrated a relative
reduction in FBG because of the experimental paradigms that were studied, not necessarily because of the
biological function of glucocorticoids. However, in this chronic model, I expect that the β-cells will not be
able to compensate for the whole body insulin resistance by hyper-secreting insulin to adequate levels to
balance this resistance over the long-term of the study. Because glucocorticoid levels are expected to
remain significantly elevated over several weeks, I expect this to ultimately result in hyperglycemia, insulin
resistance, increased adiposity and weight gain. By abolishing endogenous glucocorticoid regulation and
149
increasing glucocorticoid levels to a supra-physiological level, this would allow us to examine the role
G6pc2 plays in modulating glucose metabolism and GSIS in periods of extreme stress.
Characterization of a β-cell Specific G6pc2 KO Mouse
Although G6pc2 is thought to be exclusively expressed in islet β-cells [346], G6pc2 transcripts have
been identified in liver [347] and hypothalamus [294], although at trace levels relative to G6pc1 and G6pc3.
Moreover, while the data presented in this thesis and previous studies [69, 96] support the role of G6pc2
in regulating glucose metabolism via its function in the islet β-cell, it is possible that there could be
developmental compensation that occurred following germline deletion of G6pc2. Justification for this
hypothesis comes from the observation that compensatory gene expression changes have been
documented to occur during development following a germline mutation of many other genes [348]. If this
hypothesis were correct, than adult mice lacking G6pc2 could show a more severe phenotype than mice
lacking G6pc2 since conception. Once these mice have been designed, FBG, glycolytic flux, glucose cycling
and GSIS should all be analyzed. Performing these KO studies in adult mice will allow us to determine
whether G6pc2 regulates glucose homeostasis solely through its function in islet β-cells as well as
determine if inactivation of G6pc2, in the absence of developmental compensation, results in a more severe
phenotype. By performing these studies we will be able to determine if targeted G6PC2 inhibition in adults
will prevent and/or treat T2D. If there is developmental compensation from conception in G6pc2 KO mice,
it is possible that a more severe phenotype in adults may be detrimental such that G6PC2 inhibition by
pharmacological agents would be beneficial in decreasing the chances for T2D or a cardiovascular event.
Additionally, as the mechanism that connects G6pc2 to cholesterol metabolism remains unclear,
G6pc2 expression in other cell types might explain why C57BL/6J and mixed genetic background KO mice
have reduced cholesterol levels. Therefore examining the role of G6pc2 in a β-cell specific KO mouse is
pertinent to improved interpretation of these findings.
150
Analysis of a Secondary Role of G6PC2 in Modulating Calcium Flux: Preliminary Data and Future Directions
Finally, we hypothesize that G6pc2 may have an additional function in pancreatic islet β-cells to
modulate calcium flux at submaximal glucose levels. In addition to regulating glucose cycling and
modulating the set point for FBG, we hypothesize that G6pc2 could affect calcium retention in the ER
mediated through the generation of Pi from the hydrolysis of G6P. Support for this hypothesis comes from
studies performed in liver microsomes that showed that G6P and glucose-6-phosphatase activity drives
the accumulation of calcium in the ER. Subsequently, there have been several studies looking at the
potential role of the liver G6PC1 isoform in modulating ER calcium retention in the liver (Fig. 1.4) [349-
353]. Researchers have proposed that ATP dependent ER calcium accumulation is stimulated by G6Pase
activity and potentially can regulate calcium-activated exocytosis of insulin granules [352, 353]. Moreover,
with increasing concentrations of Pi, as would be predicted with increased hydrolysis of G6P in WT islets,
there is a biphasic and Pi-dependent calcium uptake into the ER, consistent with this hypothesis [351]. As
it is known that increasing glucose concentrations drives an increase in the ER calcium pool in β-cells [354],
it is possible, given this data, that there is a relationship between β-cell G6PC2 activity and calcium flux
[355]. Therefore is has been hypothesized that if G6PC2 activity can regulate calcium signaling in β-cells,
as G6pc1 has been shown to in the liver, this function could alter the kinetics of GSIS [349, 355].
Preliminary data shown in Fig. 8.1 indicates that there is a selective improvement of glucose
tolerance in C57BL/6J G6pc2 Heterozygous (Het) mice using a low 0.75g/kg glucose dose. Similarly I saw
that a 2.0g/kg glucose dose in 129SvEv Het mice also improved glucose tolerance (Fig. 8.2). As 129SvEv
mice are more insulin sensitive, a 0.75g/kg glucose dose cannot be used in an IPGTT because the blood
glucose does not increase to an adequate level to allow us to identify differences between genotypes. The
improved glucose tolerance in both C57BL/6J and 129SvEv Het mice suggest that there could be an
additional positive function of G6pc2, which, we think, is to modulate ER calcium retention.

151
We propose that there is not a difference in glucose tolerance between WT and G6pc2 KO mice
because, while the WT mice benefit from increased calcium retention, this benefit is offset by reduced
glycolytic flux. In contrast, in KO mice the benefit of increased glycolytic flux is offset by the loss of G6pc2
modulating ER calcium levels, leading to similar glucose tolerance relative to WT mice (Fig.8.1&2).
However, I further hypothesize in Het mice that a single copy of G6pc2 is sufficient to retain control of ER
calcium levels, which is combined with the benefit of a partial decrease in glycolytic flux, leading to
improved glucose tolerance. This improvement in glucose tolerance in C57BL/6J Het mice is lost when a
high glucose dose (2.0 g/kg) is used (Fig. 8.3), consistent with the role of G6pc2 in modulating ER calcium
retention being only important at submaximal glucose concentrations. Also, at a high glucose dose, G6pc2’s
ability to modulate glycolytic flux is minimal due to the low Km for G6P. Further experiments need to be
performed to determine if these changes in glucose tolerance of Het mice depending on glucose dosage are
in fact due to alterations in calcium homeostasis. These studies can be done by analyzing GSIS from isolated
islets incubated with varied doses of glucose concentrations. I expect that Het islets would exhibit
enhanced GSIS relative to WT and KO at submaximal glucose concentrations (Het>KO>WT), with no
observed differences at maximal glucose concentrations.
0
50
100
150
200
250
300
0 15 30 60 90
Blo
od
Glu
cose
(m
g/
dl)
Time (mins)
WT (12)
HET (8)
KO (13)
*
* *

152
Figure 8.1. C57BL/6J G6pc2 HET Mice Have Improved Glucose Tolerance Using a 0.75 g/kg Glucose Dose. Het mice have significantly improved glucose tolerance relative to WT and KO mice (p<0.05).
Figure 8.2. 129SvEv G6pc2 HET Mice Have Improved Glucose Tolerance Using a 2.0 g/kg Glucose Dose. Het mice have significantly improved glucose tolerance relative to WT and KO mice (p<0.05).
0
50
100
150
200
250
300
0 15 30 60 90
Blo
od
Glu
cose
(m
g/
dl)
Time (mins)
WT (13)
HET (13)
KO (11)
*

153
Figure 8.3. Glucose Tolerance is the Same Between WT, HET and KO C57BL/6J Mice Using a 2.0 g/kg Glucose Dose. Following IP injection of 2.0 g/kg there was no significant difference in glucose tolerance between genotypes.
0
50
100
150
200
250
300
350
400
0 15 30 60 90 120
Blo
od
Glu
cose
(m
g/
dl)
Time (mins)
WT (12)
HET (11)
KO (15)

154
These studies can then be extended to look at ER calcium oscillations in collaboration with Dr. David
Jacobson using an ER-targeted calcium indicator. I expect decreased ER calcium and altered ER calcium
oscillations in KO islets, with no difference between Het and WT at submaximal glucose concentrations. By
performing these studies, we will better be able to understand the contribution of G6pc2 to both GSIS and
ER calcium regulation and whether this explains our observations regarding glucose tolerance in these
mice.
Analysis of a Secondary Role of G6PC2 in Preventing Hypoglycemia: Preliminary Data and Future Directions
Preliminary BioVU studies done in collaboration with the Denny laboratory have revealed that both
non-diabetic and T2D patients with the rs560887-A allele significantly associate with the presence of
hypoglycemic events (data in submission). As mentioned earlier, this locus is associated with variation in
FBG and, the A allele specifically, is associated with reduced FBG, consistent with these BioVU findings. To
extend these findings in mice, we performed preliminary fasting experiments on 18hr fasted mice. We have
previously shown that, following a 6-hour fast, FBG levels are reduced in G6pc2 KO mice on a mixed,
C57BL/6J and 129SvEv genetic background [69, 96, 265]. In contrast, following an 18-hour fast, FBG levels
were not reduced in C57BL/6J G6pc2 KO mice relative to WT mice (Figure 8.4) or in 129SvEv G6pc2 KO
mice relative to WT mice (Figure 8.5). This result initially suggested that 18-hour fasting, which represents
an extreme physiological challenge to mice that is associated with a ~10% reduction in body weight and
near complete depletion of liver glycogen, is not analogous to transient hypoglycemic events in humans
since G6PC2 appeared to only influence blood glucose in the latter. However, we noted a slight trend
towards increased FPI in both C57BL/6J G6pc2 KO mice relative to WT mice (Figure 8.6) and 129SvEv
G6pc2 KO mice relative to WT mice (Figure 8.7). This raised the possibility that an enhanced counter-
regulatory response was obscuring the influence of G6pc2 at low glucose levels in mice. Figure 8.8 shows
that this is indeed the case in C57BL/6J mice where corticosterone levels are significantly elevated in
C57BL/6J G6pc2 KO mice relative to WT.

155
Figure 8.4. FBG is Not Reduced in 18hr Fasted C57BL/6J G6pc2 KO Mice. Mice were fasted for 18hrs when we performed a retro-orbital bleed for glucose measurements n=10-20.
Figure 8.5. FBG is Not Reduced in 18hr Fasted 129SvEv G6pc2 KO Mice. Mice were fasted for 18hrs when we performed a retro-orbital bleed for glucose measurements n=10-20.
0
10
20
30
40
50
60
70
80
90
100
WT KO
Fa
stin
g B
loo
d
Glu
cose
(m
g/
dl)
0
20
40
60
80
100
WT KO
Fa
stin
g B
loo
d
Glu
cose
(m
g/
dl)

156
Figure 8.6. FPI Levels Are Trending Higher in 18hr Fasted C57BL/6J G6pc2 KO Mice. Mice were fasted for 18hrs when we performed a retro-orbital bleed. Samples were submitted to the Vanderbilt Hormone Assay Core for insulin measurements n=10-20.
Figure 8.7. FPI Levels Are Trending Higher in 18hr Fasted 129SvEv G6pc2 KO Mice. Mice were fasted for 18hrs when we performed a retro-orbital bleed. Samples were submitted to the Vanderbilt Hormone Assay Core for insulin measurements n=10-20.
0.00
0.05
0.10
0.15
0.20
0.25
WT KO
Fa
stin
g P
lasm
aIn
suli
n (
ng
/d
l)
0.00
0.02
0.04
0.06
0.08
0.10
0.12
0.14
0.16
WT KO
Fa
stin
g P
lasm
a
Insu
lin
(n
g/
dl)

157
Figure 8.8. 18hr Fasted C57BL/6J G6pc2 KO Mice Have Significantly Elevated Plasma Corticosterone Levels. Mice were fasted for 18hrs when we performed a retro-orbital bleed. Samples were submitted to the Vanderbilt Hormone Assay Core for measurements n=5; p<0.05.
Figure 8.9. 18hr Fasted 129SvEv G6pc2 KO Mice Have Similar Plasma Corticosterone Levels. Mice were fasted for 18hrs when we performed a retro-orbital bleed. Samples were submitted to the Vanderbilt Hormone Assay Core for measurements n=5.
0
50
100
150
200
250
300
350
WT KO
Pla
sma
Co
rtic
ost
ero
ne
(n
g/
ml)
*
0
100
200
300
400
500
600
WT KO
Pla
sma
Co
rtic
ost
ero
ne
(n
g/
ml)

158
In 129SvEv mice corticosterone levels were much higher than in C57BL/6J mice and no difference was
apparent between WT and G6pc2 KO mice (Fig. 8.9). This suggests that G6pc2 influences FBG at low glucose
levels in C57BL/6J mice as in humans but in 129SvEv mice this effect is obscured by a strong counter-
regulatory response to prolonged fasting. Moreover, this finding demonstrates that G6PC2 variants affect
blood glucose set-point in GSIS even in diabetic populations. Future studies should further examine how
the absence of G6pc2 drives this counter-regulatory response in KO mice.

159
References
1. (WHO), W.H.O. 2013; Available from: http://www.who.int/mediacentre/factsheets/fs312/en/. 2. Atkinson, M.A., G.S. Eisenbarth, and A.W. Michels, Type 1 diabetes. Lancet, 2014. 383(9911): p. 69-
82. 3. van Belle, T.L., K.T. Coppieters, and M.G. von Herrath, Type 1 diabetes: etiology, immunology, and
therapeutic strategies. Physiol Rev, 2011. 91(1): p. 79-118. 4. JAX. 2016. 5. Anderson, M.S. and J.A. Bluestone, The NOD mouse: a model of immune dysregulation. Annu Rev
Immunol, 2005. 23: p. 447-85. 6. Yang, J., et al., Islet-specific glucose-6-phosphatase catalytic subunit-related protein-reactive CD4+ T
cells in human subjects. J Immunol, 2006. 176(5): p. 2781-9. 7. Serreze, D.V., M.P. Marron, and T.P. Dilorenzo, "Humanized" HLA transgenic NOD mice to identify
pancreatic beta cell autoantigens of potential clinical relevance to type 1 diabetes. Ann N Y Acad Sci, 2007. 1103: p. 103-11.
8. Takaki, T., et al., HLA-A*0201-restricted T cells from humanized NOD mice recognize autoantigens of potential clinical relevance to type 1 diabetes. J Immunol, 2006. 176(5): p. 3257-65.
9. Oeser, J.K., et al., Deletion of the G6pc2 gene encoding the islet-specific glucose-6-phosphatase catalytic subunit-related protein does not affect the progression or incidence of type 1 diabetes in NOD/ShiLtJ mice. Diabetes, 2011. 60(11): p. 2922-7.
10. Leiter, E.H., et al., Comparison of Two New Mouse Models of Polygenic Type 2 Diabetes at the Jackson Laboratory, NONcNZO10Lt/J and TALLYHO/JngJ. J Diabetes Res, 2013. 2013: p. 165327.
11. Leiter, E.H. and A. Schile, Genetic and Pharmacologic Models for Type 1 Diabetes. Curr Protoc Mouse Biol, 2013. 3(1): p. 9-19.
12. Lenzen, S., The mechanisms of alloxan- and streptozotocin-induced diabetes. Diabetologia, 2008. 51(2): p. 216-26.
13. Olokoba, A.B., O.A. Obateru, and L.B. Olokoba, Type 2 diabetes mellitus: a review of current trends. Oman Med J, 2012. 27(4): p. 269-73.
14. Standards of Medical Care in Diabetes-2016 Abridged for Primary Care Providers. Clin Diabetes, 2016. 34(1): p. 3-21.
15. Bonnefond, A. and P. Froguel, Rare and common genetic events in type 2 diabetes: what should biologists know? Cell Metab, 2015. 21(3): p. 357-68.
16. Association, A.D. 2015; Available from: http://www.diabetes.org/living-with-diabetes/treatment-and-care/medication/oral-medications/what-are-my-options.html.
17. Buse, J.B., et al., The Primary Glucose-Lowering Effect of Metformin Resides in the Gut, Not the Circulation: Results From Short-term Pharmacokinetic and 12-Week Dose-Ranging Studies. Diabetes Care, 2016. 39(2): p. 198-205.
18. Fraulob, J.C., et al., A Mouse Model of Metabolic Syndrome: Insulin Resistance, Fatty Liver and Non-Alcoholic Fatty Pancreas Disease (NAFPD) in C57BL/6 Mice Fed a High Fat Diet. J Clin Biochem Nutr, 2010. 46(3): p. 212-23.
19. West, D.B., et al., Dietary obesity in nine inbred mouse strains. Am J Physiol, 1992. 262(6 Pt 2): p. R1025-32.
20. Paigen, B., Genetics of responsiveness to high-fat and high-cholesterol diets in the mouse. Am J Clin Nutr, 1995. 62(2): p. 458S-462S.
21. Eberhart, G.P., et al., Insulin sensitivity of adipocytes from inbred mouse strains resistant or sensitive to diet-induced obesity. Am J Physiol, 1994. 266(5 Pt 2): p. R1423-8.
22. Kirk, E.A., et al., Hyper- and hypo-responsiveness to dietary fat and cholesterol among inbred mice: searching for level and variability genes. J Lipid Res, 1995. 36(7): p. 1522-32.

160
23. Wang, B., P.C. Chandrasekera, and J.J. Pippin, Leptin- and leptin receptor-deficient rodent models: relevance for human type 2 diabetes. Curr Diabetes Rev, 2014. 10(2): p. 131-45.
24. Hummel, K.P., D.L. Coleman, and P.W. Lane, The influence of genetic background on expression of mutations at the diabetes locus in the mouse. I. C57BL-KsJ and C57BL-6J strains. Biochem Genet, 1972. 7(1): p. 1-13.
25. Della-Fera, M.A., et al., Sensitivity of ob/ob mice to leptin-induced adipose tissue apoptosis. Obes Res, 2005. 13(9): p. 1540-7.
26. Lindstrom, P., The physiology of obese-hyperglycemic mice [ob/ob mice]. ScientificWorldJournal, 2007. 7: p. 666-85.
27. Bray, G.A. and D.A. York, Hypothalamic and genetic obesity in experimental animals: an autonomic and endocrine hypothesis. Physiol Rev, 1979. 59(3): p. 719-809.
28. Coleman, D.L. and K.P. Hummel, The influence of genetic background on the expression of the obese (Ob) gene in the mouse. Diabetologia, 1973. 9(4): p. 287-93.
29. Vikram, A. and G. Jena, S961, an insulin receptor antagonist causes hyperinsulinemia, insulin-resistance and depletion of energy stores in rats. Biochem Biophys Res Commun, 2010. 398(2): p. 260-5.
30. Pearson, E.R., et al., Switching from insulin to oral sulfonylureas in patients with diabetes due to Kir6.2 mutations. N Engl J Med, 2006. 355(5): p. 467-77.
31. Froguel, P. and G. Velho, Molecular Genetics of Maturity-onset Diabetes of the Young. Trends Endocrinol Metab, 1999. 10(4): p. 142-146.
32. DeFronzo, R.A., et al., The effect of insulin on the disposal of intravenous glucose. Results from indirect calorimetry and hepatic and femoral venous catheterization. Diabetes, 1981. 30(12): p. 1000-7.
33. DeFronzo, R.A., Lilly lecture 1987. The triumvirate: beta-cell, muscle, liver. A collusion responsible for NIDDM. Diabetes, 1988. 37(6): p. 667-87.
34. Cori, G.T., C.F. Cori, and G. Schmidt, The role of glucose-1-phosphate in the formation of blood sugar and synthesis of glycogen in the liver. J Biol Chem, 1939. 129: p. 629-639.
35. Lei, K.J., et al., Identification of mutations in the gene for glucose-6-phosphatase, the enzyme deficient in glycogen storage disease type 1a. J Clin Invest, 1994. 93(5): p. 1994-9.
36. Shelly, L.L., et al., Isolation of the gene for murine glucose-6-phosphatase, the enzyme deficient in glycogen storage disease type 1A. J Biol Chem, 1993. 268(29): p. 21482-5.
37. Gluecksohn-Waelsch, S., Genetic control of morphogenetic and biochemical differentiation: lethal albino deletions in the mouse. Cell, 1979. 16(2): p. 225-37.
38. Chou, J.Y., et al., Isolation and characterization of mouse hepatocyte lines carrying a lethal albino deletion. J Biol Chem, 1991. 266(9): p. 5716-22.
39. Chatelain, F., et al., Development and regulation of glucose-6-phosphatase gene expression in rat liver, intestine, and kidney: in vivo and in vitro studies in cultured fetal hepatocytes. Diabetes, 1998. 47(6): p. 882-9.
40. Lin, B., et al., Cloning and characterization of cDNAs encoding a candidate glycogen storage disease type 1b protein in rodents. J Biol Chem, 1998. 273(48): p. 31656-60.
41. Puskas, F., et al., Conformational change of the catalytic subunit of glucose-6-phosphatase in rat liver during the fetal-to-neonatal transition. J Biol Chem, 1999. 274(1): p. 117-22.
42. Hutton, J.C. and R.M. O'Brien, The glucose-6-phosphatase catalytic subunit gene family. J Biol Chem, 2009. 284: p. 29241-5.
43. Chou, J.Y. and B.C. Mansfield, Mutations in the glucose-6-phosphatase-alpha (G6PC) gene that cause type Ia glycogen storage disease. Hum Mutat, 2008. 29(7): p. 921-30.
44. Chou, J.Y. and B.C. Mansfield, Molecular genetics of type I glycogen storage disease. Trends Endocrinol Metabol, 1999. 10: p. 104-113.

161
45. Veiga-da-Cunha, M., et al., A gene on chromosome 11q23 coding for a putative glucose- 6-phosphate translocase is mutated in glycogen-storage disease types Ib and Ic. Am J Hum Genet, 1998. 63(4): p. 976-83.
46. Li, Y., M.C. Mechin, and G. van de Werve, Diabetes affects similarly the catalytic subunit and putative glucose-6- phosphate translocase of glucose-6-phosphatase. J Biol Chem, 1999. 274(48): p. 33866-8.
47. Ashmore, J., A.B. Hastings, and F.B. Nesbett, The effect of diabetes and fasting on liver glucose-6-phosphatase. Proc Natl Acad Sci U S A, 1954. 40: p. 673-678.
48. Clore, J.N., J. Stillman, and H. Sugerman, Glucose-6-phosphatase flux in vitro is increased in type 2 diabetes. Diabetes, 2000. 49(6): p. 969-74.
49. Barthel, A. and D. Schmoll, Novel concepts in insulin regulation of hepatic gluconeogenesis. Am J Physiol Endocrinol Metab, 2003. 285(4): p. E685-92.
50. Barthel, A., et al., Differential regulation of endogenous glucose-6-phosphatase and phosphoenolpyruvate carboxykinase gene expression by the forkhead transcription factor FKHR in H4IIE-hepatoma cells. Biochem Biophys Res Commun, 2001. 285(4): p. 897-902.
51. Streeper, R.S., et al., Hepatocyte nuclear factor-1 acts as an accessory factor to enhance the inhibitory action of insulin on mouse glucose-6-phosphatase gene transcription. Proc Natl Acad Sci U S A, 1998. 95(16): p. 9208-13.
52. Schmoll, D., et al., Regulation of Glucose-6-phosphatase Gene Expression by Protein Kinase Balpha and the Forkhead Transcription Factor FKHR. EVIDENCE FOR INSULIN RESPONSE UNIT-DEPENDENT AND -INDEPENDENT EFFECTS OF INSULIN ON PROMOTER ACTIVITY. J Biol Chem, 2000. 275(46): p. 36324-36333.
53. Pound, L., Characterization of Islet Genes Implicated in Human Disease in Molecular Physiology and Biophysics. 2011, Vanderbilt University p. 163.
54. Garfield, S.A. and R.R. Cardell, Jr., Hepatic glucose-6-phosphatase activities and correlated ultrastructural alterations in hepatocytes of diabetic rats. Diabetes, 1979. 28(7): p. 664-79.
55. Martin, C.C., et al., Identification and Characterization of a Human cDNA and Gene Encoding a Ubiquitously Expressed Glucose-6-Phosphatase Catalytic Subunit-Related Protein. J Mol Endocrinol, 2002. 29: p. 205-22.
56. Boustead, J.N., et al., Identification and characterization of a cDNA and the gene encoding the mouse ubiquitously expressed glucose-6-phosphatase catalytic subunit-related protein. J Mol Endocrinol, 2004. 32(1): p. 33-53.
57. Guionie, O., et al., Identification and characterisation of a new human glucose-6-phosphatase isoform. FEBS Lett, 2003. 551(1-3): p. 159-64.
58. Shieh, J.J., et al., The islet-specific glucose-6-phosphatase-related protein, implicated in diabetes, is a glycoprotein embedded in the endoplasmic reticulum membrane. FEBS Lett, 2004. 562(1-3): p. 160-4.
59. Shieh, J.J., et al., A glucose-6-phosphate hydrolase, widely expressed outside the liver, can explain age-dependent resolution of hypoglycemia in glycogen storage disease type Ia. J Biol Chem, 2003. 278(47): p. 47098-103.
60. Lin, S.R., et al., Functional analysis of mutations in a severe congenital neutropenia syndrome caused by glucose-6-phosphatase-β deficiency. Molecular Genetics and Metabolism, 2015. 114.
61. Wang, Y., et al., Deletion of the gene encoding the ubiquitously expressed glucose-6-phosphatase catalytic subunit-related protein (UGRP)/glucose-6-phosphatase catalytic subunit-beta results in lowered plasma cholesterol and elevated glucagon. J Biol Chem, 2006. 281(52): p. 39982-9.
62. Cheung, Y.Y., et al., Impaired neutrophil activity and increased susceptibility to bacterial infection in mice lacking glucose-6-phosphatase-beta. J Clin Invest, 2007. 117(3): p. 784-93.
63. Boztug, K., et al., A syndrome with congenital neutropenia and mutations in G6PC3. N Engl J Med, 2009. 360(1): p. 32-43.
162
64. Jun, H.S. and e. al., Lack of glucose recycling between endoplasmic reticulum and cytoplasm underlies cellular dysfunction in glucose-6-phosphatase- –deficient neutrophils in a congenital neutropenia syndrome. Blood, 2010. 116(15).
65. Arden, S.D., et al., Molecular cloning of a pancreatic islet-specific glucose-6-phosphatase catalytic subunit-related protein. Diabetes, 1999. 48(3): p. 531-42.
66. Martin, C.C., et al., Cloning and Characterization of the Human and Rat Islet-Specific Glucose-6-Phosphatase Catalytic Subunit-Related Protein (IGRP) Genes. J Biol Chem, 2001. 276(27): p. 25197-207.
67. Petrolonis, A.J., et al., Enzymatic characterization of the pancreatic islet-specific glucose-6-phosphatase-related protein (IGRP). J Biol Chem, 2004. 279: p. 13976-13983.
68. Wall, M.L. and e. al., Novel Stable Isotope Analyses Demonstrate Significant Rates of Glucose Cycling In Mouse Pancreatic Islets. . Diabetes, 2014. 64(6): p. 2129-2137.
69. Pound, L.D., et al., G6PC2: A Negative Regulator of Basal Glucose-Stimulated Insulin Secretion. Diabetes, 2013. 62: p. 1547-1556.
70. Abdul-Ghani, M.A. and R.A. DeFronzo, Plasma glucose concentration and prediction of future risk of type 2 diabetes. Diabetes Care, 2009. 32 Suppl 2: p. S194-8.
71. Coutinho, M., et al., The relationship between glucose and incident cardiovascular events. A metaregression analysis of published data from 20 studies of 95,783 individuals followed for 12.4 years. Diabetes Care, 1999. 22(2): p. 233-40.
72. Lawes, C.M., et al., Blood glucose and risk of cardiovascular disease in the Asia Pacific region. Diabetes Care, 2004. 27(12): p. 2836-42.
73. Manning, A.K., et al., A genome-wide approach accounting for body mass index identifies genetic variants influencing fasting glycemic traits and insulin resistance. Nat Genet, 2012. 44(6): p. 659-69.
74. Mahajan, A., et al., Identification and functional characterization of G6PC2 coding variants influencing glycemic traits define an effector transcript at the G6PC2-ABCB11 locus. PLoS Genet, 2015. 11(1): p. e1004876.
75. Chen, W.M., et al., Variations in the G6PC2/ABCB11 genomic region are associated with fasting glucose levels. J Clin Invest, 2008. 118(7): p. 2620-8.
76. Wang, H., et al., Large Scale Meta-Analyses of Fasting Plasma Glucose Raising Variants in GCK, GCKR, MTNR1B and G6PC2 and Their Impacts on Type 2 Diabetes Mellitus Risk. PLoS One, 2013. 8(6): p. e67665.
77. Reiling, E., et al., Combined effects of single-nucleotide polymorphisms in GCK, GCKR, G6PC2 and MTNR1B on fasting plasma glucose and type 2 diabetes risk. Diabetologia, 2009. 52(9): p. 1866-70.
78. O'Brien, R.M., Moving on from GWAS: functional studies on the G6PC2 gene implicated in the regulation of fasting blood glucose. Curr Diab Rep, 2013. 13(6): p. 768-77.
79. Baerenwald, D.A., et al., Multiple functional polymorphisms in the G6PC2 gene contribute to the association with higher fasting plasma glucose levels. Diabetologia, 2013. 56(6): p. 1306-16.
80. Bouatia-Naji, N., et al., Genetic and Functional Assessment of the Role of the rs13431652-A and rs573225-A Alleles in the G6PC2 Promoter that Strongly Associate With Elevated Fasting Glucose Levels. Diabetes, 2010. 59(10): p. 2662-71.
81. Bouatia-Naji, N., et al., A variant near MTNR1B is associated with increased fasting plasma glucose levels and type 2 diabetes risk. Nat Genet, 2009. 41(1): p. 89-94.
82. Bouatia-Naji, N., et al., A polymorphism within the G6PC2 gene is associated with fasting plasma glucose levels. Science, 2008. 320(5879): p. 1085-8.
83. Dos Santos, C., P. Bougneres, and D. Fradin, An SNP in a methylatable Foxa2 binding site of the G6PC2 promoter is associated with insulin secretion in vivo and increased promoter activity in vitro. Diabetes, 2009. 58: p. 489-92.
84. Khan, A., et al., Glucose cycling in islets from healthy and diabetic rats. Diabetes, 1990. 39(4): p. 456-9.

163
85. Taljedal, I.B., Presence, induction, and possible role of glucose-6-phosphatase in mammalian pancreatic islets. Biochem Journal, 1969. 114: p. 387-394.
86. Newgard, C.B., et al., Stimulus/secretion coupling factors in glucose-stimulated insulin secretion: insights gained from a multidisciplinary approach. Diabetes, 2002. 51 Suppl 3: p. S389-93.
87. Prentki, M., F.M. Matschinsky, and S.R. Madiraju, Metabolic signaling in fuel-induced insulin secretion. Cell Metab, 2013. 18(2): p. 162-85.
88. Newsholme, E.A. and B. Crabtree, Substrate cycles in metabolic regulation and in heat generation. Biochem Soc Symp, 1976. 41: p. 61-109.
89. Newsholme, P., et al., Amino acid metabolism, insulin secretion and diabetes. Biochem Soc Trans, 2007. 35(Pt 5): p. 1180-6.
90. Khan, A., et al., Evidence for the presence of glucose cycling in pancreatic islets of the ob/ob mouse. J Biol Chem, 1989. 264(17): p. 9732-3.
91. Sweet, I.R., et al., Measurement and modeling of glucose-6-phosphatase in pancreatic islets. Am J Physiol, 1997. 272(4 Pt 1): p. E696-711.
92. Argaud, D., et al., Stimulation of glucose-6-phosphatase gene expression by glucose and fructose-2,6-bisphosphate. J Biol Chem, 1997. 272(19): p. 12854-61.
93. Massillon, D., et al., Glucose regulates in vivo glucose-6-phosphatase gene expression in the liver of diabetic rats. J Biol Chem, 1996. 271(17): p. 9871-4.
94. Massillon, D., et al., Carbon flux via the pentose phosphate pathway regulates the hepatic expression of the glucose-6-phosphatase and phosphoenolpyruvate carboxykinase genes in conscious rats. J Biol Chem, 1998. 273(1): p. 228-34.
95. Chandramouli, V., et al., Quantification of glucose cycling and the extent of equilibration of glucose 6-phosphate with fructose 6-phosphate in islets from ob/ob mice. Biochem J, 1991. 278 ( Pt 2): p. 353-9.
96. Wang, Y., et al., Deletion of the Gene Encoding the Islet-Specific Glucose-6-Phosphatase Catalytic Subunit-Related Protein Autoantigen Results in a Mild Metabolic Phenotype. Diabetologia, 2007. 50: p. 774-778.
97. Smemo, S., et al., Obesity-associated variants within FTO form long-range functional connections with IRX3. Nature, 2014. 507(7492): p. 371-5.
98. Dina, C., et al., Variation in FTO contributes to childhood obesity and severe adult obesity. Nat Genet, 2007. 39(6): p. 724-6.
99. Frayling, T.M., et al., A common variant in the FTO gene is associated with body mass index and predisposes to childhood and adult obesity. Science, 2007. 316(5826): p. 889-94.
100. Scuteri, A., et al., Genome-wide association scan shows genetic variants in the FTO gene are associated with obesity-related traits. PLoS Genet, 2007. 3(7): p. e115.
101. Wahlen, K., E. Sjolin, and J. Hoffstedt, The common rs9939609 gene variant of the fat mass- and obesity-associated gene FTO is related to fat cell lipolysis. J Lipid Res, 2008. 49(3): p. 607-11.
102. Kloting, N., et al., Inverse relationship between obesity and FTO gene expression in visceral adipose tissue in humans. Diabetologia, 2008. 51(4): p. 641-7.
103. Grunnet, L.G., et al., Regulation and function of FTO mRNA expression in human skeletal muscle and subcutaneous adipose tissue. Diabetes, 2009. 58(10): p. 2402-8.
104. Gao, X., et al., The fat mass and obesity associated gene FTO functions in the brain to regulate postnatal growth in mice. PLoS One, 2010. 5(11): p. e14005.
105. Fischer, J., et al., Inactivation of the Fto gene protects from obesity. Nature, 2009. 458(7240): p. 894-8.
106. Church, C., et al., Overexpression of Fto leads to increased food intake and results in obesity. Nat Genet, 2010. 42(12): p. 1086-92.
107. Billings, L.K. and J.C. Florez, The genetics of type 2 diabetes: what have we learned from GWAS? Ann. N.Y. Acad. Sci., 2010. 1212: p. 59-‐77.

164
108. Heni, M., et al., The Impact of Genetic Variation in the G6PC2 Gene on Insulin Secretion Depends on Glycemia. J Clin Endocrinol Metab, 2010. 95: p. E479-484.
109. Ingelsson, E., et al., Detailed physiologic characterization reveals diverse mechanisms for novel genetic Loci regulating glucose and insulin metabolism in humans. Diabetes, 2010. 59(5): p. 1266-75.
110. Rose, C.S., et al., A variant in the G6PC2/ABCB11 locus is associated with increased fasting plasma glucose, increased basal hepatic glucose production and increased insulin release after oral and intravenous glucose loads. Diabetologia, 2009. 52(10): p. 2122-9.
111. Li, X., et al., Additive Effects of Genetic Variation in Gck and G6pc2 on Insulin Secretion and Fasting Glucose. Diabetes, 2009. 58: p. 2946-53.
112. Hu, C., et al., A genetic variant of G6PC2 is associated with type 2 diabetes and fasting plasma glucose level in the Chinese population. Diabetologia, 2009. 52(3): p. 451-6.
113. Hu, C., et al., Effects of GCK, GCKR, G6PC2 and MTNR1B variants on glucose metabolism and insulin secretion. PLoS One, 2010. 5(7): p. e11761.
114. Reiling, E., et al., Combined effects of single-nucleotide polymorphisms in GCK, GCKR, G6PC2 and MTNR1B on fasting plasma glucose and type 2 diabetes risk. Diabetologia, 2009. 52: p. 1866-70.
115. Prokopenko, I., et al., Variants in MTNR1B influence fasting glucose levels. Nat Genet, 2008. 41: p. 77-81.
116. Abdul-Ghani, M.A., et al., Minimal contribution of fasting hyperglycemia to the incidence of type 2 diabetes in subjects with normal 2-h plasma glucose. Diabetes Care, 2010. 33(3): p. 557-61.
117. Sarwar, N., et al., Diabetes mellitus, fasting blood glucose concentration, and risk of vascular disease: a collaborative meta-analysis of 102 prospective studies. Lancet, 2010. 375(9733): p. 2215-22.
118. Merrins, M.J., et al., Metabolic oscillations in pancreatic islets depend on the intracellular Ca2+ level but not Ca2+ oscillations. Biophys J, 2010. 99(1): p. 76-84.
119. Ingelsson, E., et al., Detailed Physiologic Characterization Reveals Diverse Mechanisms for Novel Genetic Loci Regulating Glucose and Insulin Metabolism in Humans. Diabetes, 2010. 59(5): p. 1266-1275.
120. Manolio, T.A., et al., Finding the missing heritability of complex diseases. Nature, 2009. 461(7265): p. 747-53.
121. Bonnefond, A., et al., Mutations in G6PC2 do not contribute to monogenic forms of early infancy diabetes and beta cell dysfunction. Diabetologia, 2009. 52(5): p. 982-5.
122. Grupe, A., et al., Transgenic knockouts reveal a critical requirement for pancreatic beta cell glucokinase in maintaining glucose homeostasis. Cell, 1995. 83(1): p. 69-78.
123. Osbak, K.K., et al., Update on mutations in glucokinase (GCK), which cause maturity-onset diabetes of the young, permanent neonatal diabetes, and hyperinsulinemic hypoglycemia. Hum Mutat, 2009. 30(11): p. 1512-26.
124. Magnuson, M.A., P. She, and M. Shiota, Gene-altered mice and metabolic flux control. J Biol Chem, 2003. 278(35): p. 32485-8.
125. Postic, C., et al., Dual roles for glucokinase in glucose homeostasis as determined by liver and pancreatic beta cell-specific gene knock-outs using Cre recombinase. J Biol Chem, 1999. 274(1): p. 305-15.
126. Yang, J., et al., Genetic variance estimation with imputed variants finds negligible missing heritability for human height and body mass index. Nat Genet, 2015. 47(10): p. 1114-20.
127. Wood, A.R., et al., Defining the role of common variation in the genomic and biological architecture of adult human height. Nat Genet, 2014. 46(11): p. 1173-86.
128. Llewellyn, C.H., et al., Finding the missing heritability in pediatric obesity: the contribution of genome-wide complex trait analysis. Int J Obes (Lond), 2013. 37(11): p. 1506-9.
129. Rafacho, A., et al., Glucocorticoid treatment and endocrine pancreas function: implications for glucose homeostasis, insulin resistance and diabetes. J Endocrinol, 2014. 223(3): p. R49-62.
165
130. Rizza, R.A., L.J. Mandarino, and J.E. Gerich, Cortisol-induced insulin resistance in man: impaired suppression of glucose production and stimulation of glucose utilization due to a postreceptor detect of insulin action. J Clin Endocrinol Metab, 1982. 54(1): p. 131-8.
131. Pagano, G., et al., An in vivo and in vitro study of the mechanism of prednisone-induced insulin resistance in healthy subjects. J Clin Invest, 1983. 72(5): p. 1814-20.
132. Rooney, D.P., et al., The effect of cortisol on glucose/glucose-6-phosphate cycle activity and insulin action. J Clin Endocrinol Metab, 1993. 77(5): p. 1180-3.
133. Wajngot, A., et al., Dexamethasone increases glucose cycling, but not glucose production, in healthy subjects. American Physiological Society 1990: p. E626- E632.
134. Patel, R., et al., LXRbeta is required for glucocorticoid-induced hyperglycemia and hepatosteatosis in mice. J Clin Invest, 2011. 121(1): p. 431-41.
135. Rebuffe-Scrive, M., et al., Effect of chronic stress and exogenous glucocorticoids on regional fat distribution and metabolism. Physiol Behav, 1992. 52(3): p. 583-90.
136. Pedersen, S.B., M. Jonler, and B. Richelsen, Characterization of regional and gender differences in glucocorticoid receptors and lipoprotein lipase activity in human adipose tissue. J Clin Endocrinol Metab, 1994. 78(6): p. 1354-9.
137. Reynolds, R.M., et al., Glucocorticoid treatment and impaired mood, memory and metabolism in people with diabetes: the Edinburgh Type 2 Diabetes Study. Eur J Endocrinol, 2012. 166(5): p. 861-8.
138. Slavin, J., et al., Transforming growth factor beta (TGF-beta) and dexamethasone have direct opposing effects on collagen metabolism in low passage human dermal fibroblasts in vitro. Growth Factors, 1994. 11(3): p. 205-13.
139. Divertie, G.D., M.D. Jensen, and J.M. Miles, Stimulation of lipolysis in humans by physiological hypercortisolemia. Diabetes, 1991. 40(10): p. 1228-32.
140. Kim, J.S., et al., Influence of elevated liver fat on circulating adipocytokines and insulin resistance in obese Hispanic adolescents. Pediatr Obes, 2012. 7(2): p. 158-64.
141. Beard, J.C., et al., Dexamethasone-induced insulin resistance enhances B cell responsiveness to glucose level in normal men. Am J Physiol, 1984. 247(5 Pt 1): p. E592-6.
142. Nicod, N., et al., Metabolic adaptations to dexamethasone-induced insulin resistance in healthy volunteers. Obes Res, 2003. 11(5): p. 625-31.
143. Stahn, C. and F. Buttgereit, Genomic and nongenomic effects of glucocorticoids. Nat Clin Pract Rheumatol, 2008. 4(10): p. 525-33.
144. van Raalte, D.H., D.M. Ouwens, and M. Diamant, Novel insights into glucocorticoid-mediated diabetogenic effects: towards expansion of therapeutic options? Eur J Clin Invest, 2009. 39(2): p. 81-93.
145. Novelli, M., et al., Insufficient adaptive capability of pancreatic endocrine function in dexamethasone-treated ageing rats. J Endocrinol, 1999. 162(3): p. 425-32.
146. Jensen, D.H., et al., Steroid-induced insulin resistance and impaired glucose tolerance are both associated with a progressive decline of incretin effect in first-degree relatives of patients with type 2 diabetes. Diabetologia, 2012. 55(5): p. 1406-16.
147. Rafacho, A., et al., Functional alterations in endocrine pancreas of rats with different degrees of dexamethasone-induced insulin resistance. Pancreas, 2008. 36(3): p. 284-93.
148. Anagnostis, P., et al., Clinical review: The pathogenetic role of cortisol in the metabolic syndrome: a hypothesis. J Clin Endocrinol Metab, 2009. 94(8): p. 2692-701.
149. Wang, J.C., Glucocorticoid Signaling: From Molecule to Mice to Man. Advances in Experimental Medicine and Biology, ed. C. Harris. Vol. 872. 2015, New Yourk: Springer.
150. Droms, K.A., et al., Effects of adrenalectomy and corticosterone administration on mouse lung tumor susceptibility and histogenesis. J Natl Cancer Inst, 1988. 80(5): p. 365-9.
151. Walker, B.R., et al., Tissue-specific distribution of the NAD(+)-dependent isoform of 11 beta-hydroxysteroid dehydrogenase. Endocrinology, 1992. 131(2): p. 970-2.

166
152. Finken, M.J., et al., Cortisol metabolism in healthy young adults: sexual dimorphism in activities of A-ring reductases, but not 11beta-hydroxysteroid dehydrogenases. J Clin Endocrinol Metab, 1999. 84(9): p. 3316-21.
153. Chapman, K., M. Holmes, and J. Seckl, 11β-Hydroxysteroid Dehydrogenases: Intracellular Gate-Keepers of Tissue Glucocorticoid Action. American Physiological Society, 2013. 93(3).
154. Lightman, S.L. and B.L. Conway-Campbell, The crucial role of pulsatile activity of the HPA axis for continuous dynamic equilibration. Nat Rev Neurosci, 2010. 11(10): p. 710-8.
155. Low, S.C., et al., 'Liver-type' 11 beta-hydroxysteroid dehydrogenase cDNA encodes reductase but not dehydrogenase activity in intact mammalian COS-7 cells. J Mol Endocrinol, 1994. 13(2): p. 167-74.
156. Voice, M.W., et al., 11 beta-hydroxysteroid dehydrogenase type 1 expression in 2S FAZA hepatoma cells is hormonally regulated: a model system for the study of hepatic glucocorticoid metabolism. Biochem J, 1996. 317 ( Pt 2): p. 621-5.
157. Brown, R.W., et al., Human placental 11 beta-hydroxysteroid dehydrogenase: evidence for and partial purification of a distinct NAD-dependent isoform. Endocrinology, 1993. 132(6): p. 2614-21.
158. Swali, A., et al., 11beta-Hydroxysteroid dehydrogenase type 1 regulates insulin and glucagon secretion in pancreatic islets. Diabetologia, 2008. 51(11): p. 2003-11.
159. Turban, e.a., Optimal Elevation of b-Cell 11b-Hydroxysteroid Dehydrogenase Type 1 Is a Compensatory Mechanism That Prevents High-Fat Diet–Induced b-Cell Failure. Diabetes, 2012. 61.
160. Davani, B., et al., Type 1 11beta -hydroxysteroid dehydrogenase mediates glucocorticoid activation and insulin release in pancreatic islets. J Biol Chem, 2000. 275(45): p. 34841-4.
161. Mangelsdorf, D.J., et al., The nuclear receptor superfamily: the second decade. Cell, 1995. 83(6): p. 835-9.
162. Pratt, W.B., et al., Chaperoning of glucocorticoid receptors. Handb Exp Pharmacol, 2006(172): p. 111-38.
163. Payvar, F., et al., Purified glucocorticoid receptors bind selectively in vitro to a cloned DNA fragment whose transcription is regulated by glucocorticoids in vivo. Proc Natl Acad Sci U S A, 1981. 78(11): p. 6628-32.
164. Reddy, T.E., et al., Genomic determination of the glucocorticoid response reveals unexpected mechanisms of gene regulation. Genome Res, 2009. 19(12): p. 2163-71.
165. Vander Kooi, B.T., et al., The Glucose-6-Phosphatase Catalytic Subunit Gene Promoter Contains Both Positive and Negative Glucocorticoid Response Elements. Mol Endocrinol, 2005. 19: p. 3001-3022.
166. Shrago, E., et al., METABOLIC AND HORMONAL CONTROL OF PHOSPHOENOLPYRUVATE CARBOXYKINASE AND MALIC ENZYME IN RAT LIVER. J Biol Chem, 1963. 238: p. 3188-92.
167. Stafford, J.M., et al., Accessory factors facilitate the binding of glucocorticoid receptor to the phosphoenolpyruvate carboxykinase gene promoter. J Biol Chem, 2001. 276(43): p. 39885-91.
168. Strehl, C. and F. Buttgereit, Unraveling the functions of the membrane-bound glucocorticoid receptors: first clues on origin and functional activity. Ann N Y Acad Sci, 2014. 1318: p. 1-6.
169. Kuo, T., et al., Regulation of Glucose Homeostasis by Glucocorticoids. Adv Exp Med Biol 2015. 872: p. 99-126.
170. Pilkis, S.J. and D.K. Granner, Molecular physiology of the regulation of hepatic gluconeogenesis and glycolysis. Annu Rev Physiol, 1992. 54: p. 885-909.
171. McMahon, M., J. Gerich, and R. Rizza, Effects of glucocorticoids on carbohydrate metabolism. Diabetes Metab Rev, 1988. 4(1): p. 17-30.
172. Longano, C.A. and H.P. Fletcher, Insulin release after acute hydrocortisone treatment in mice. Metabolism, 1983. 32(6): p. 603-8.
173. Delaunay, F., et al., Pancreatic beta cells are important targets for the diabetogenic effects of glucocorticoids. J Clin Invest, 1997. 100(8): p. 2094-8.
174. Ohneda, M., et al., GLUT-2 function in glucose-unresponsive beta cells of dexamethasone-induced diabetes in rats. J Clin Invest, 1993. 92(4): p. 1950-6.

167
175. Ogawa, A., et al., Roles of insulin resistance and beta-cell dysfunction in dexamethasone-induced diabetes. J Clin Invest, 1992. 90(2): p. 497-504.
176. Dinneen, S., et al., Metabolic effects of the nocturnal rise in cortisol on carbohydrate metabolism in normal humans. J Clin Invest, 1993. 92(5): p. 2283-90.
177. Plat, L., et al., Effects of morning cortisol elevation on insulin secretion and glucose regulation in humans. Am J Physiol, 1996. 270(1 Pt 1): p. E36-42.
178. Kalhan, S.C. and P.A. Adam, Inhibitory effect of prednisone on insulin secretion in man: model for duplication of blood glucose concentration. J Clin Endocrinol Metab, 1975. 41(3): p. 600-10.
179. Karatsoreos, I.N., et al., Endocrine and physiological changes in response to chronic corticosterone: a potential model of the metabolic syndrome in mouse. Endocrinology, 2010. 151(5): p. 2117-27.
180. Fransson, L., et al., beta-Cell adaptation in a mouse model of glucocorticoid-induced metabolic syndrome. J Endocrinol, 2013. 219(3): p. 231-41.
181. Matsumoto, K., et al., High-dose but not low-dose dexamethasone impairs glucose tolerance by inducing compensatory failure of pancreatic beta-cells in normal men. J Clin Endocrinol Metab, 1996. 81(7): p. 2621-6.
182. Perley, M. and D.M. Kipnis, Effect of glucocorticoids on plasma insulin. N Engl J Med, 1966. 274(22): p. 1237-41.
183. Henriksen, E.J., et al., Stimulation by alpha-lipoic acid of glucose transport activity in skeletal muscle of lean and obese Zucker rats. Life Sci, 1997. 61(8): p. 805-12.
184. Schneiter, P. and L. Tappy, Kinetics of dexamethasone-induced alterations of glucose metabolism in healthy humans. Am J Physiol, 1998. 275(5 Pt 1): p. E806-13.
185. Besse, C., N. Nicod, and L. Tappy, Changes in insulin secretion and glucose metabolism induced by dexamethasone in lean and obese females. Obes Res, 2005. 13(2): p. 306-11.
186. Tounian, P., et al., Effects of dexamethasone on hepatic glucose production and fructose metabolism in healthy humans. Am J Physiol, 1997. 273(2 Pt 1): p. E315-20.
187. Mersmann, H.J. and H.L. Segal, Glucocorticoid control of the liver glycogen synthetase-activating system. J Biol Chem, 1969. 244(7): p. 1701-4.
188. Exton, J.H., et al., Carbohydrate metabolism in perfused livers of adrenalectomized and steroid-replaced rats. Am J Physiol, 1976. 230(1): p. 163-70.
189. De Wulf, H. and H.G. Hers, The stimulation of glycogen synthesis andof glycogen synthetase in the liver by glucocorticoids. Eur J Biochem, 1967. 2(1): p. 57-60.
190. Stalmans, W. and M. Laloux, Glucocorticoids and hepatic glycogen metabolism. Monogr Endocrinol, 1979. 12: p. 517-33.
191. Laloux, M., W. Stalmans, and H.G. Hers, On the mechanism by which glucocorticoids cause the activation of glycogen synthase in mouse and rat livers. Eur J Biochem, 1983. 136(1): p. 175-81.
192. de Wulf, H. and H.G. Hers, The influence of inorganic phosphate, adenosine triphosphate and glucose 6-phosphate on the activity of liver glycogen synthetase. Eur J Biochem, 1968. 6(4): p. 545-51.
193. Weinstein, S.P., et al., Dexamethasone inhibits insulin-stimulated recruitment of GLUT4 to the cell surface in rat skeletal muscle. Metabolism, 1998. 47(1): p. 3-6.
194. Dimitriadis, G., et al., Effects of glucocorticoid excess on the sensitivity of glucose transport and metabolism to insulin in rat skeletal muscle. Biochem J, 1997. 321 ( Pt 3): p. 707-12.
195. Ruzzin, J., A.S. Wagman, and J. Jensen, Glucocorticoid-induced insulin resistance in skeletal muscles: defects in insulin signalling and the effects of a selective glycogen synthase kinase-3 inhibitor. Diabetologia, 2005. 48(10): p. 2119-30.
196. Coderre, L., A.K. Srivastava, and J.L. Chiasson, Effect of hypercorticism on regulation of skeletal muscle glycogen metabolism by insulin. Am J Physiol, 1992. 262(4 Pt 1): p. E427-33.
197. Coderre, L., A.K. Srivastava, and J.L. Chiasson, Role of glucocorticoid in the regulation of glycogen metabolism in skeletal muscle. Am J Physiol, 1991. 260(6 Pt 1): p. E927-32.

168
198. Exton, J.H., et al., Interaction of glucocorticoids with glucagon and epinephrine in the control of gluconeogenesis and glycogenolysis in liver and of lipolysis in adipose tissue. J Biol Chem, 1972. 247(11): p. 3579-88.
199. Exton, J.H., et al., The hormonal control of hepatic gluconeogenesis. Recent Prog Horm Res, 1970. 26: p. 411-61.
200. Kuo, T., C.A. Harris, and J.C. Wang, Metabolic functions of glucocorticoid receptor in skeletal muscle. Mol Cell Endocrinol, 2013. 380(1-2): p. 79-88.
201. Charmandari, E., C. Tsigos, and G. Chrousos, Endocrinology of the stress response. Annu Rev Physiol, 2005. 67: p. 259-84.
202. Howlett, T.A., L.H. Rees, and G.M. Besser, Cushing's syndrome. Clin Endocrinol Metab, 1985. 14(4): p. 911-45.
203. Fardet, L. and B. Feve, Systemic glucocorticoid therapy: a review of its metabolic and cardiovascular adverse events. Drugs, 2014. 74(15): p. 1731-45.
204. Lambillotte, C., P. Gilon, and J.C. Henquin, Direct glucocorticoid inhibition of insulin secretion. An in vitro study of dexamethasone effects in mouse islets. J Clin Invest, 1997. 99(3): p. 414-23.
205. Gremlich, S., R. Roduit, and B. Thorens, Dexamethasone induces posttranslational degradation of GLUT2 and inhibition of insulin secretion in isolated pancreatic beta cells. Comparison with the effects of fatty acids. J Biol Chem, 1997. 272(6): p. 3216-22.
206. Jeong, I.K., et al., The effects of dexamethasone on insulin release and biosynthesis are dependent on the dose and duration of treatment. Diabetes Res Clin Pract, 2001. 51(3): p. 163-71.
207. Billaudel, B., et al., Inhibition by corticosterone of calcium inflow and insulin release in rat pancreatic islets. J Endocrinol, 1984. 100(2): p. 227-33.
208. Zawalich, W.S., et al., Dexamethasone suppresses phospholipase C activation and insulin secretion from isolated rat islets. Metabolism, 2006. 55(1): p. 35-42.
209. Hult, M., et al., Short-term glucocorticoid treatment increases insulin secretion in islets derived from lean mice through multiple pathways and mechanisms. Mol Cell Endocrinol, 2009. 301(1-2): p. 109-16.
210. Rafacho, A., et al., Morphofunctional alterations in endocrine pancreas of short- and long-term dexamethasone-treated rats. Horm Metab Res, 2011. 43(4): p. 275-81.
211. Rafacho, A., et al., Glucocorticoids in vivo induce both insulin hypersecretion and enhanced glucose sensitivity of stimulus-secretion coupling in isolated rat islets. Endocrinology, 2010. 151(1): p. 85-95.
212. Karlsson, S., et al., Beta cell adaptation to dexamethasone-induced insulin resistance in rats involves increased glucose responsiveness but not glucose effectiveness. Pancreas, 2001. 22(2): p. 148-56.
213. Sood, A. and F. Ismail-Beigi, Effect of dexamethasone on insulin secretion: examination of underlying mechanisms. Endocr Pract, 2010. 16(5): p. 763-9.
214. Shao, J., L. Qiao, and J.E. Friedman, Prolactin, progesterone, and dexamethasone coordinately and adversely regulate glucokinase and cAMP/PDE cascades in MIN6 beta-cells. Am J Physiol Endocrinol Metab, 2004. 286(2): p. E304-10.
215. Ullrich, S., et al., Serum- and glucocorticoid-inducible kinase 1 (SGK1) mediates glucocorticoid-induced inhibition of insulin secretion. Diabetes, 2005. 54(4): p. 1090-9.
216. John, S., et al., Kinetic complexity of the global response to glucocorticoid receptor action. Endocrinology, 2009. 150(4): p. 1766-74.
217. Wang, J.C., et al., Chromatin immunoprecipitation (ChIP) scanning identifies primary glucocorticoid receptor target genes. Proc Natl Acad Sci U S A, 2004. 101(44): p. 15603-8.
218. van Raalte, D.H., et al., Acute and 2-week exposure to prednisolone impair different aspects of beta-cell function in healthy men. Eur J Endocrinol, 2010. 162(4): p. 729-35.
219. Cummings, B.P., et al., Investigation of the mechanisms contributing to the compensatory increase in insulin secretion during dexamethasone-induced insulin resistance in rhesus macaques. J Endocrinol, 2013. 216(2): p. 207-15.

169
220. Sjors, A., et al., Increased insulin secretion and decreased glucose concentrations, but not allostatic load, are associated with stress-related exhaustion in a clinical patient population. Stress, 2013. 16(1): p. 24-33.
221. Bates, S.M., et al., A prospective, randomized, double-blind trial to evaluate the role of a short reducing course of oral corticosteroid therapy in the treatment of chronic prostatitis/chronic pelvic pain syndrome. BJU Int, 2007. 99(2): p. 355-9.
222. Kiraly, M.A., et al., Attenuation of type 2 diabetes mellitus in the male Zucker diabetic fatty rat: the effects of stress and non-volitional exercise. Metabolism, 2007. 56(6): p. 732-44.
223. Kai, K., et al., Environmental stress modifies glycemic control and diabetes onset in type 2 diabetes prone Otsuka Long Evans Tokushima Fatty (OLETF) rats. Physiol Behav, 2000. 68(4): p. 445-52.
224. Vila, G., et al., Acute effects of hydrocortisone on the metabolic response to a glucose load: increase in the first-phase insulin secretion. Eur J Endocrinol, 2010. 163(2): p. 225-31.
225. Stojanovska, L., G. Rosella, and J. Proietto, Evolution of dexamethasone-induced insulin resistance in rats. Am J Physiol, 1990. 258(5 Pt 1): p. E748-56.
226. Grill, V., et al., Effects of dexamethasone on glucose-induced insulin and proinsulin release in low and high insulin responders. Metabolism, 1990. 39(3): p. 251-8.
227. Rafacho, A., et al., High doses of dexamethasone induce increased beta-cell proliferation in pancreatic rat islets. Am J Physiol Endocrinol Metab, 2009. 296(4): p. E681-9.
228. Khan, A. and S. Efendic, Evidence that increased glucose cycling in islets of diabetic ob/ob mice is a primary feature of the disease. Am J Physiol, 1995. 269(4 Pt 1): p. E623-6.
229. Khan, A., et al., Glucocorticoid increases glucose cycling and inhibits insulin release in pancreatic islets of ob/ob mice. Am J Physiol, 1992. 263(4 Pt 1): p. E663-6.
230. Khan, A., et al., Glucose cycling is markedly enhanced in pancreatic islets of obese hyperglycemic mice. Endocrinology, 1990. 126(5): p. 2413-6.
231. Ling, Z.C., et al., Increased glucocorticoid sensitivity in islet beta-cells: effects on glucose 6-phosphatase, glucose cycling and insulin release. Diabetologia, 1998. 41(6): p. 634-9.
232. Larsson, H. and B. Ahren, Insulin resistant subjects lack islet adaptation to short-term dexamethasone-induced reduction in insulin sensitivity. Diabetologia, 1999. 42(8): p. 936-43.
233. Marco, J., et al., Enhanced glucagon secretion by pancreatic islets from prednisolone-treated mice. Diabetologia, 1976. 12(4): p. 307-11.
234. Rafacho, A., et al., Pancreatic alpha-cell dysfunction contributes to the disruption of glucose homeostasis and compensatory insulin hypersecretion in glucocorticoid-treated rats. PLoS One, 2014. 9(4): p. e93531.
235. Marco, J., et al., Hyperglucagonism induced by glucocorticoid treatment in man. N Engl J Med, 1973. 288(3): p. 128-31.
236. van Raalte, D.H., et al., Islet-cell dysfunction induced by glucocorticoid treatment: potential role for altered sympathovagal balance? Metabolism, 2013. 62(4): p. 568-77.
237. Barseghian, G. and R. Levine, Effect of corticosterone on insulin and glucagon secretion by the isolated perfused rat pancreas. Endocrinology, 1980. 106(2): p. 547-52.
238. Pound, L.D., et al., The physiological effects of deleting the mouse slc30a8 gene encoding zinc transporter-8 are influenced by gender and genetic background. PLoS One, 2012. 7(7): p. e40972.
239. Serreze, D.V., et al., B lymphocytes are essential for the initiation of T cell-mediated autoimmune diabetes: analysis of a new "speed congenic" stock of NOD.Ig mu null mice. J Exp Med, 1996. 184(5): p. 2049-53.
240. Markel, P., et al., Theoretical and empirical issues for marker-assisted breeding of congenic mouse strains. Nat Genet, 1997. 17(3): p. 280-4.
241. Harno, E., et al., 11-Dehydrocorticosterone causes metabolic syndrome, which is prevented when 11beta-HSD1 is knocked out in livers of male mice. Endocrinology, 2013. 154(10): p. 3599-609.

170
242. Morgan, C.R. and A.L. Lazarow, Immunoassay of insulin: two antibody system: plasma insulin of normal, subdiabetic, and diabetic rats. Am J Med Sci, 1963. 257: p. 415-19.
243. Zhang, H., et al., The FoxM1 transcription factor is required to maintain pancreatic beta-cell mass. Mol Endocrinol, 2006. 20(8): p. 1853-66.
244. Sadikot, R.T., et al., High-dose dexamethasone accentuates nuclear factor-kappa b activation in endotoxin-treated mice. Am J Respir Crit Care Med, 2001. 164(5): p. 873-8.
245. Patel, S., et al., Repeated homotypic stress elevates 2-arachidonoylglycerol levels and enhances short-term endocannabinoid signaling at inhibitory synapses in basolateral amygdala. Neuropsychopharmacology, 2009. 34(13): p. 2699-709.
246. Brissova, M., et al., Intraislet endothelial cells contribute to revascularization of transplanted pancreatic islets. Diabetes, 2004. 53(5): p. 1318-25.
247. Dai, C., et al., Islet-enriched gene expression and glucose-induced insulin secretion in human and mouse islets. Diabetologia, 2012. 55(3): p. 707-18.
248. Livak, K.J. and T.D. Schmittgen, Analysis of relative gene expression data using real-time quantitative PCR and the 2(-Delta Delta C(T)) Method. Methods, 2001. 25(4): p. 402-8.
249. Pulley, J., et al., Principles of human subjects protections applied in an opt-out, de-identified biobank. Clin Transl Sci, 2010. 3(1): p. 42-8.
250. Roden, D.M., et al., Development of a large-scale de-identified DNA biobank to enable personalized medicine. Clin Pharmacol Ther, 2008. 84(3): p. 362-9.
251. Hornbuckle, L.A., et al., Selective, Tonic Inhibition of G6Pase Catalytic Subunit but not G6P Transporter Gene Expression by Insulin in Vivo. Am J Physiol, 2001. 281: p. E713-25.
252. Jacoby, D.B., N.D. Zilz, and H.C. Towle, Sequences within the 5'-flanking region of the S14 gene confer responsiveness to glucose in primary hepatocytes. J Biol Chem, 1989. 264(30): p. 17623-6.
253. Noguchi, T., et al., The L- and R-type isozymes of rat pyruvate kinase are produced from a single gene by use of different promoters. J Biol Chem, 1987. 262(29): p. 14366-71.
254. Bischof, L.J., et al., Characterization of the Mouse Islet-Specific Glucose-6-Phosphatase Catalytic Subunit-Related Protein Gene Promoter by In Situ Footprinting. Correlation with Fusion Gene Expression in the Islet Derived bTC-3 and Hamster Insulinoma Tumor Cell Lines. Diabetes, 2001. 50: p. 502-514.
255. Martin, C., et al., Foxa2 and MafA Regulate Islet-specific Glucose-6-Phosphatase Catalytic Subunit-Related Protein (IGRP/G6PC2) Gene Expression. J Mol Endocrinol, 2008. 41: p. 315-28.
256. Andre, I., et al., Checkpoints in the progression of autoimmune disease: lessons from diabetes models. Proc Natl Acad Sci U S A, 1996. 93(6): p. 2260-3.
257. Martin, C.C., J.K. Oeser, and R.M. O'Brien, Differential regulation of islet-specific glucose-6-phosphatase catalytic subunit-related protein gene transcription by Pax-6 and Pdx-1. J Biol Chem, 2004. 279(33): p. 34277-89.
258. Vanderbilt, J.N., et al., Intracellular receptor concentration limits glucocorticoid-dependent enhancer activity. Mol Endocrinol, 1987. 1(1): p. 68-74.
259. Nordeen, S.K., et al., Structural determinants of a glucocorticoid receptor recognition element. Mol Endocrinol, 1990. 4(12): p. 1866-73.
260. Ebert, D.H., et al., Structure and promoter activity of an islet-specific glucose-6- phosphatase catalytic subunit-related gene. Diabetes, 1999. 48(3): p. 543-51.
261. Jeong, K.H., et al., Impaired basal and restraint-induced epinephrine secretion in corticotropin-releasing hormone-deficient mice. Endocrinology, 2000. 141(3): p. 1142-50.
262. Taneera, J., et al., A systems genetics approach identifies genes and pathways for type 2 diabetes in human islets. Cell Metab, 2012. 16(1): p. 122-34.
263. Dadon, D., et al., Glucose metabolism: key endogenous regulator of beta-cell replication and survival. Diabetes Obes Metab, 2012. 14 Suppl 3: p. 101-8.
264. Lacroix, A., et al., Cushing's syndrome. Lancet, 2015. 386(9996): p. 913-27.

171
265. Boortz, K.A., et al., G6PC2 Modulates Fasting Blood Glucose In Male Mice in Response to Stress. Endocrinology, 2016: p. en20161245.
266. Chen, W.M., et al., Variations in the G6PC2/ABCB11 genomic region are associated with fasting glucose levels. J Clin Invest, 2008. 118: p. 2620-28.
267. Kataoka, K., M. Noda, and M. Nishizawa, Maf nuclear oncoprotein recognizes sequences related to an AP-1 site and forms heterodimers with both Fos and Jun. Mol Cell Biol, 1994. 14(1): p. 700-12.
268. Lucas, P.C. and D.K. Granner, Hormone response domains in gene transcription. Annu Rev Biochem, 1992. 61: p. 1131-73.
269. Martin, C.C., et al., Upstream Stimulatory Factor (USF) and NeuroD/BETA2 Contribute toIslet-Specific Glucose-6-Phosphatase Catalytic Subunit Related Protein (IGRP)Gene Expression. Biochem J, 2003. 371: p. 675-686.
270. Gao, N., et al., Foxa1 and Foxa2 maintain the metabolic and secretory features of the mature beta-cell. Mol Endocrinol, 2010. 24(8): p. 1594-604.
271. Hiraiwa, H. and J.Y. Chou, Glucocorticoids activate transcription of the gene for the glucose-6-phosphate transporter, deficient in glycogen storage disease type 1b. DNA Cell Biol, 2001. 20(8): p. 447-53.
272. Hornbuckle, L.A., et al., Selective stimulation of G-6-Pase catalytic subunit but not G-6-P transporter gene expression by glucagon in vivo and cAMP in situ. Am J Physiol Endocrinol Metab, 2004. 286(5): p. E795-808.
273. Scott, R.A., et al., Large-scale association analyses identify new loci influencing glycemic traits and provide insight into the underlying biological pathways. Nat Genet, 2012. 44(9): p. 991-1005.
274. Wajngot, A., et al., The diabetogenic effects of glucocorticoids are more pronounced in low- than in high-insulin responders. Proc Natl Acad Sci U S A, 1992. 89(13): p. 6035-9.
275. Berglund, E.D., et al., Glucose metabolism in vivo in four commonly used inbred mouse strains. Diabetes, 2008. 57(7): p. 1790-9.
276. Matschinsky, F.M., Glucokinase, glucose homeostasis, and diabetes mellitus. Curr Diab Rep, 2005. 5(3): p. 171-6.
277. Iynedjian, P.B., Molecular physiology of mammalian glucokinase. Cell Mol Life Sci, 2009. 66(1): p. 27-42.
278. Dupuis, J., et al., New genetic loci implicated in fasting glucose homeostasis and their impact on type 2 diabetes risk. Nat Genet, 2010. 42(2): p. 105-116.
279. Tam, C.H., et al., Common polymorphisms in MTNR1B, G6PC2 and GCK are associated with increased fasting plasma glucose and impaired beta-cell function in Chinese subjects. PLoS One, 2010. 5(7): p. e11428.
280. Lu, Y., et al., New loci for body fat percentage reveal link between adiposity and cardiometabolic disease risk. Nat Commun, 2016. 7: p. 10495.
281. Almind, K. and C.R. Kahn, Genetic determinants of energy expenditure and insulin resistance in diet-induced obesity in mice. Diabetes, 2004. 53(12): p. 3274-85.
282. Young, G.S. and J.B. Kirkland, Rat models of caloric intake and activity: relationships to animal physiology and human health. Appl Physiol Nutr Metab, 2007. 32(2): p. 161-76.
283. Surwit, R.S., et al., Diet-induced type II diabetes in C57BL/6J mice. Diabetes, 1988. 37(9): p. 1163-7. 284. Goren, H.J., R.N. Kulkarni, and C.R. Kahn, Glucose homeostasis and tissue transcript content of insulin
signaling intermediates in four inbred strains of mice: C57BL/6, C57BLKS/6, DBA/2, and 129X1. Endocrinology, 2004. 145(7): p. 3307-23.
285. Mazzaccara, C., et al., Age-Related Reference Intervals of the Main Biochemical and Hematological Parameters in C57BL/6J, 129SV/EV and C3H/HeJ Mouse Strains. PLoS One, 2008. 3(11): p. e3772.
286. Woods, S.C., et al., Pancreatic signals controlling food intake; insulin, glucagon and amylin. Philos Trans R Soc Lond B Biol Sci, 2006. 361(1471): p. 1219-35.

172
287. Mahajan, A., et al., Identification and Functional Characterization of G6PC2 Coding Variants Influencing Glycemic Traits Define an Effector Transcript at the G6PC2-ABCB11 Locus. PLoS Genet, 2015. 11(1): p. e1004876.
288. Wessel, J., et al., Low-frequency and rare exome chip variants associate with fasting glucose and type 2 diabetes susceptibility. Nat Commun, 2015. 6: p. 5897.
289. Burcelin, R., et al., Heterogeneous metabolic adaptation of C57BL/6J mice to high-fat diet. Am J Physiol Endocrinol Metab, 2002. 282(4): p. E834-42.
290. Koza, R.A., et al., Changes in gene expression foreshadow diet-induced obesity in genetically identical mice. PLoS Genet, 2006. 2(5): p. e81.
291. Oey, H., et al., Genetic and epigenetic variation among inbred mouse littermates: identification of inter-individual differentially methylated regions. Epigenetics Chromatin, 2015. 8: p. 54.
292. Frigeri, C., et al., The Proximal Islet-Specific Glucose-6-Phosphatase Catalytic Subunit Related Protein (IGRP) Autoantigen Promoter is Sufficient to Initiate but not Maintain Transgene Expression in Mouse Islets In Vivo. Diabetes, 2004. 53: p. 1754-1764.
293. Wang, Y., et al., Long-range enhancers are required to maintain expression of the autoantigen islet-specific glucose-6-phosphatase catalytic subunit-related protein in adult mouse islets in vivo. Diabetes, 2008. 57(1): p. 133-41.
294. Goh, B.H., et al., Expression of glucose-6-phosphatase system genes in murine cortex and hypothalamus. Horm Metab Res, 2006. 38(1): p. 1-7.
295. Morton, G.J., et al., Central nervous system control of food intake and body weight. Nature, 2006. 443(7109): p. 289-95.
296. Ellacott, K.L., et al., Assessment of feeding behavior in laboratory mice. Cell Metab, 2010. 12(1): p. 10-7.
297. Morton, N.M. and J.R. Seckl, 11beta-hydroxysteroid dehydrogenase type 1 and obesity. Front Horm Res, 2008. 36: p. 146-64.
298. Lavery, G.G., et al., Deletion of hexose-6-phosphate dehydrogenase activates the unfolded protein response pathway and induces skeletal myopathy. J Biol Chem, 2008. 283(13): p. 8453-61.
299. Morgan, S.A., et al., 11beta-hydroxysteroid dehydrogenase type 1 regulates glucocorticoid-induced insulin resistance in skeletal muscle. Diabetes, 2009. 58(11): p. 2506-15.
300. Walker, B.R., et al., Carbenoxolone increases hepatic insulin sensitivity in man: a novel role for 11-oxosteroid reductase in enhancing glucocorticoid receptor activation. J Clin Endocrinol Metab, 1995. 80(11): p. 3155-9.
301. Ortsater, H., et al., Regulation of 11beta-hydroxysteroid dehydrogenase type 1 and glucose-stimulated insulin secretion in pancreatic islets of Langerhans. Diabetes Metab Res Rev, 2005. 21(4): p. 359-66.
302. Pan, C., et al., SLC37A1 and SLC37A2 Are Phosphate-Linked, Glucose-6-Phosphate Antiporters. PLOS One, 2011. 6(9).
303. Dallman, M.F., et al., Glucocorticoids, chronic stress, and obesity. 2006. 153: p. 75-105. 304. Dallman, M.F., Modulation of stress responses: how we cope with excess glucocorticoids. Exp Neurol,
2007. 206(2): p. 179-82. 305. Dallman, M.F., Stress-induced obesity and the emotional nervous system. Trends Endocrinol Metab,
2010. 21(3): p. 159-65. 306. Visscher, P.M., et al., Five years of GWAS discovery. Am J Hum Genet, 2012. 90(1): p. 7-24. 307. Bell, G.I., et al., Glucokinase mutations, insulin secretion, and diabetes mellitus. Annu Rev Physiol,
1996. 58: p. 171-86. 308. Mithieux, G., New knowledge regarding glucose-6 phosphatase gene and protein and their roles in the
regulation of glucose metabolism. Eur J Endocrinol, 1997. 136(2): p. 137-45. 309. Hohmeier, H.E., et al., Isolation of INS-1-derived cell lines with robust ATP-sensitive K+ channel-
dependent and -independent glucose-stimulated insulin secretion. Diabetes, 2000. 49(3): p. 424-30.

173
310. Newgard, C.B., et al., Engineered cell lines for insulin replacement in diabetes: current status and future prospects. Diabetologia, 1997. 40 Suppl 2: p. S42-7.
311. Pedersen, K.B., et al., The promoter for the gene encoding the catalytic subunit of rat glucose-6-phosphatase contains two distinct glucose-responsive regions. Am J Physiol Endocrinol Metab, 2007. 292(3): p. E788-801.
312. Collier, J.J., et al., c-Myc and ChREBP regulate glucose-mediated expression of the L-type pyruvate kinase gene in INS-1-derived 832/13 cells. Am J Physiol Endocrinol Metab, 2007. 293(1): p. E48-56.
313. Trinh, K., et al., Adenovirus-mediated expression of the catalytic subunit of glucose-6- phosphatase in INS-1 cells. Effects on glucose cycling, glucose usage, and insulin secretion. J Biol Chem, 1997. 272(40): p. 24837-42.
314. Bain, J.R., et al., An adenovirus vector for efficient RNA interference-mediated suppression of target genes in insulinoma cells and pancreatic islets of langerhans. Diabetes, 2004. 53(9): p. 2190-4.
315. Lei, K.J., et al., Mutations in the glucose-6-phosphatase gene are associated with glycogen storage disease types 1a and 1aSP but not 1b and 1c. J Clin Invest, 1995. 95(1): p. 234-40.
316. Lei, K.J., et al., Glucose-6-phosphatase dependent substrate transport in the glycogen storage disease type-1a mouse. Nat Genet, 1996. 13(2): p. 203-9.
317. Pan, C.J., et al., Transmembrane topology of glucose-6-phosphatase. J Biol Chem, 1998. 273(11): p. 6144-8.
318. Chen, S.Y., et al., The glucose-6-phosphate transporter is a phosphate-linked antiporter deficient in glycogen storage disease type Ib and Ic. Faseb J, 2008. 22: p. 2206-13.
319. Ghosh, A., et al., The catalytic center of glucose-6-phosphatase. HIS176 is the nucleophile forming the phosphohistidine-enzyme intermediate during catalysis. J Biol Chem, 2002. 277(36): p. 32837-42.
320. Horikoshi, M., et al., Discovery and Fine-Mapping of Glycaemic and Obesity-Related Trait Loci Using High-Density Imputation. PLoS Genet, 2015. 11(7): p. e1005230.
321. Ghosh, A., et al., Histidine 167 is the phosphate acceptor in glucose-6-phosphatase-beta forming a phosphohistidine enzyme intermediate during catalysis. J Biol Chem, 2004. 279(13): p. 12479-83.
322. Banka, S., et al., Mutations in the G6PC3 gene cause Dursun syndrome. Am J Med Genet A, 2010. 152A(10): p. 2609-11.
323. Banka, S. and W.G. Newman, A clinical and molecular review of ubiquitous glucose-6-phosphatase deficiency caused by G6PC3 mutations. Orphanet J Rare Dis, 2013. 8: p. 84.
324. Denny, J.C., et al., PheWAS: demonstrating the feasibility of a phenome-wide scan to discover gene-disease associations. Bioinformatics, 2010. 26(9): p. 1205-10.
325. Denny, J.C., et al., Systematic comparison of phenome-wide association study of electronic medical record data and genome-wide association study data. Nat Biotechnol, 2013. 31(12): p. 1102-10.
326. Shameer, K., et al., A genome- and phenome-wide association study to identify genetic variants influencing platelet count and volume and their pleiotropic effects. Hum Genet, 2014. 133(1): p. 95-109.
327. Ritchie, M.D., et al., Genome- and phenome-wide analyses of cardiac conduction identifies markers of arrhythmia risk. Circulation, 2013. 127(13): p. 1377-85.
328. Denny, J.C., et al., Variants near FOXE1 are associated with hypothyroidism and other thyroid conditions: using electronic medical records for genome- and phenome-wide studies. Am J Hum Genet, 2011. 89(4): p. 529-42.
329. Wessel, J., et al., Low-frequency and rare exome chip variants associate with fasting glucose and type 2 diabetes susceptibility. Nat Commun, 2015. 6: p. 5897.
330. Morris, A.P., et al., Large-scale association analysis provides insights into the genetic architecture and pathophysiology of type 2 diabetes. Nat Genet, 2012. 44(9): p. 981-90.
331. Marmugi, A., et al., Sorcin Links Pancreatic beta-Cell Lipotoxicity to ER Ca2+ Stores. Diabetes, 2016. 65(4): p. 1009-21.

174
332. Speth, M. and H.U. Schulze, Is thermostability of glucose-6-phosphatase indeed dependent on a stabilizing protein? FEBS Lett, 1986. 202(1): p. 32-6.
333. Towle, H.C., Glucose as a regulator of eukaryotic gene transcription. Trends Endocrinol Metab, 2005. 16(10): p. 489-94.
334. Marciniak, S.J. and D. Ron, Endoplasmic reticulum stress signaling in disease. Physiol Rev, 2006. 86(4): p. 1133-49.
335. Wang, D., et al., Endoplasmic reticulum stress increases glucose-6-phosphatase and glucose cycling in liver cells. Endocrinology, 2006. 147(1): p. 350-8.
336. Shameli, A., et al., Endoplasmic reticulum stress caused by overexpression of islet-specific glucose-6-phosphatase catalytic subunit-related protein in pancreatic Beta-cells. Rev Diabet Stud, 2007. 4(1): p. 25-32.
337. McMahon, M., J. Gerich, and R. Rizza, Effects of glucocorticoids on carbohydrate metabolism. Diabetes Metab Rev, 1988. 4(1): p. 17-30.
338. De Paula, F.M., et al., Insulin signaling proteins in pancreatic islets of insulin-resistant rats induced by glucocorticoid. Biol Res, 2011. 44(3): p. 251-7.
339. Park, C. and S. Marqusee, Pulse proteolysis: a simple method for quantitative determination of protein stability and ligand binding. Nat Methods, 2005. 2(3): p. 207-12.
340. Butler, P., P. Bell, and R. Rizza, Choice and use of tracers. Horm Metab Res Suppl, 1990. 24: p. 20-5. 341. Bush, V.L., et al., Implantation of a slow release corticosterone pellet induces long-term alterations in
serotonergic neurochemistry in the rat brain. J Neuroendocrinol, 2003. 15(6): p. 607-13. 342. Demuyser, T., et al., Disruption of the HPA-axis through corticosterone-release pellets induces robust
depressive-like behavior and reduced BDNF levels in mice. Neurosci Lett, 2016. 626: p. 119-25. 343. Muller, C., et al., Effects of corticosterone pellets on baseline and stress-induced corticosterone and
corticosteroid-binding-globulin. Gen Comp Endocrinol, 2009. 160(1): p. 59-66. 344. Rees, S.L., et al., The effects of adrenalectomy and corticosterone replacement on maternal behavior
in the postpartum rat. Horm Behav, 2004. 46(4): p. 411-9. 345. Steffensen, C., et al., DIAGNOSIS OF ENDOCRINE DISEASE: Prevalence of hypercortisolism in Type 2
Diabetes patients: a systematic review and meta-analysis. Eur J Endocrinol, 2016. 346. Hutton, J.C. and G.S. Eisenbarth, A pancreatic beta-cell-specific homolog of glucose-6-phosphatase
emerges as a major target of cell-mediated autoimmunity in diabetes. Proc Natl Acad Sci U S A, 2003. 100(15): p. 8626-8.
347. Ku, G.M., et al., Research resource: RNA-Seq reveals unique features of the pancreatic beta-cell transcriptome. Mol Endocrinol, 2012. 26(10): p. 1783-92.
348. Muller, U., Ten years of gene targeting: targeted mouse mutants, from vector design to phenotype analysis. Mech Dev, 1999. 82(1-2): p. 3-21.
349. Benedetti, A., R. Fulceri, and M. Comporti, Calcium sequestration activity in rat liver microsomes. Evidence for a cooperation of calcium transport with glucose-6-phosphatase. Biochim Biophys Acta, 1985. 816(2): p. 267-77.
350. Cole, J.T., et al., Glucose-6-phosphate reduces calcium accumulation in rat brain endoplasmic reticulum. Front Mol Neurosci, 2012. 5: p. 51.
351. Fulceri, R., et al., MgATP-dependent accumulation of calcium ions and inorganic phosphate in a liver reticular pool. Biochem J, 1990. 272(2): p. 549-52.
352. Wolf, B.A., et al., Glucose 6-phosphate regulates Ca2+ steady state in endoplasmic reticulum of islets. A possible link in glucose-induced insulin secretion. J Biol Chem, 1986. 261(35): p. 16284-7.
353. Wolf, B.A., et al., Regulation of Ca2+ homeostasis by islet endoplasmic reticulum and its role in insulin secretion. Am J Physiol, 1988. 254(2 Pt 1): p. E121-36.
354. Tengholm, A., B. Hellman, and E. Gylfe, The endoplasmic reticulum is a glucose-modulated high-affinity sink for Ca2+ in mouse pancreatic beta-cells. J Physiol, 2001. 530(Pt 3): p. 533-40.

175
355. Marcolongo, P., et al., Multiple roles of glucose-6-phosphatases in pathophysiology: state of the art and future trends. Biochim Biophys Acta, 2013. 1830(3): p. 2608-18.