by Guido De Blasio - bancaditalia.it · Temi di discussione del Servizio Studi Does trade credit...
37
Temi di discussione del Servizio Studi Does trade credit substitute for bank credit? by Guido De Blasio Number 498 - June 2004
-
Upload
phamnguyet -
Category
Documents
-
view
218 -
download
4
Transcript of by Guido De Blasio - bancaditalia.it · Temi di discussione del Servizio Studi Does trade credit...
The purpose of the Temi di discussione series is to promote the circulation of workingpapers prepared within the Bank of Italy or presented in Bank seminars by outsideeconomists with the aim of stimulating comments and suggestions.
The views expressed in the articles are those of the authors and do not involve theresponsibility of the Bank.
Editorial Board:STEFANO SIVIERO, EMILIA BONACCORSI DI PATTI, FABIO BUSETTI, ANDREA LAMORGESE, MONICA
PAIELLA, FRANCESCO PATERNÒ, MARCELLO PERICOLI, ALFONSO ROSOLIA, STEFANIA ZOTTERI,
RAFFAELA BISCEGLIA (Editorial Assistant).
This paper is part of a research project on “Trade credit in Italy” carried out at theEconomic Research Department of the Bank of Italy. Like others that are part of the project,it was presented and discussed in a seminar.

DOES TRADE CREDIT SUBSTITUTE FOR BANK CREDIT?
by Guido de Blasio*
Abstract
The paper examines micro data on Italian manufacturing firms’ inventory behavior totest the Meltzer (1960) hypothesis according to which firms substitute trade credit for bankcredit during periods of monetary tightening. It finds that their inventory investment isconstrained by the availability of trade credit. As for the magnitude of the substitution effect,however, this study finds that it is not sizable. This is in line with the micro theories of tradecredit and the evidence on actual firm practices, according to which credit terms displaymodest variations over time.
JEL classification: E51, E52, E65.Keywords: trade credit, monetary policy, manufacturing firms.
Contents
1. Introduction.......................................................................................................................... 72. Relevant Literature .............................................................................................................. 93. Background Macroeconomic Facts ................................................................................... 114. Empirical Specification ..................................................................................................... 125. Data.................................................................................................................................... 146. Results................................................................................................................................ 157. Conclusions........................................................................................................................ 24Tables and figures................................................................................................................... 26References .............................................................................................................................. 32
(*) Bank of Italy, Economic Research Department.
1. Introduction1
Monetary policy affects the real economy by reducing the financial resources available
to firms. In particular, during a monetary contraction, financially constrained firms cut back
on their inventory holdings. The impact of a monetary restriction, however, may be softened
by the availability of trade credit (TC). Financially constrained firms may raise working
capital by taking on more TC (that is, further delaying payment of their bills) or extending
less TC (that is, reducing the delays in payment they allow to their customers). Thus, the net
impact of a monetary restriction depends on the extent to which the use of TC offsets banks’
and other financial institutions’ financing.
Italy represents an ideal setting for testing the TC-bank credit substitution hypothesis.
First, Italian firms display very high levels of TC in their balance sheets, either as
receivables or payables. The ratios of trade receivables and trade payables to assets amount,
respectively, to more than 35 and 25 percent. While the volume of TC exceeds by far the
volume of short-term bank credit in virtually all the developing and industrialized countries
(Demirgüc-Kunt and Maksimovic (2001), Marotta (1992), Omiccioli (2004), and Rajan and
Zingales (1995)), in Italy the amounts of TC both received and extended are the highest
among them. Second, aside from TC, alternative sources of finance are mostly unavailable to
both banks and firms: the development of the stock and bond markets is modest and the
commercial paper market is nearly absent. Moreover, Italy’s industrial structure is tilted
toward small firms. To the extent that credit to small firms is more likely to be rationed by
banks and other financial institutions, the role of a monetary policy tightening will be
magnified.
This paper provides an empirical investigation of the TC-bank credit substitution
hypothesis. It tests for a linkage between inventory investment and TC by estimating a
standard inventory investment model augmented by measures of internal resources, which
include both liquidity and TC. The data are taken from the 1982–1999 Company Accounts
1 The author thanks Giorgio Albareto, Luigi Cannari, Amanda Carmignani, Salvatore Chiri, EugenioGaiotti, Andrea Generale, Luigi Guiso, Inessa Love, Massimo Omiccioli, Carmelo Salleo, Luisa Zanforlin and

8
Data Service (Centrale dei bilanci) “accounting units” (unità contabili) files for
manufacturing firms. There are three methodological advantages in using these data. First,
with firm-level panel data, one can control for the many possible time-invariant determinants
of TC (and inventory investment) that differ across firms.2 Second, the panel is fairly
extended over the time dimension: it covers 18 years, a period over which five monetary-
restriction episodes took place. Thus, this study on the role of TC is not restricted to a single
episode. Third, the data cover a major fraction of the aggregate economy. The sample
accounts for almost one-half of aggregate manufacturing sales and valued added.
Accordingly, this extent of coverage makes it possible to draw macroeconomic as well as
microeconomic conclusions.
Turning to the study’s findings, the results show that the TC-bank credit substitution
hypothesis receives empirical support. The study finds that inventory investment of Italian
firms is constrained by the availability of TC to them and that the magnitude of this effect
more than doubles during monetary restrictions. Moreover, it shows that traditional measures
of liquidity seem to be less important than TC during periods of monetary tightening. The
study also tests some cross-sectional implications of the substitution hypotheses. We find
that small firms and firms not paying dividends are more likely to substitute TC for bank
credit during contractions. Moreover, firms with large shares of assets that cannot be used as
collateral seem to be both liquidity– and TC– constrained during monetary tightening. As for
the magnitude of the substitution effect, we find that it is not sizable. This is in line with the
micro theories of TC and the evidence on actual firm practices, according to which credit
terms display modest variations over time.
The remainder of the paper is structured as follows. Section II presents the relevant
literature. Section III discusses some background macroeconomic facts for the Italian
economy over the 1982–1999 period. Section IV provides the empirical model. Section V
describes the sample and data. In Section VI the baseline inventory specification is estimated
and then extensive robustness tests are performed. Section VII concludes.
two anonymous referee for their helpful comments, and Diego Caprara for invaluable research assistance. Theviews expressed herein are not necessarily those of the Bank of Italy.
2 In their seminal paper, Kashyap, Stein, and Wilcox (1993) suggested that pursuing the empiricalverification of the Meltzer (1960) hypothesis would have required firm-level data.

9
2. Relevant Literature
The TC-bank credit substitution hypothesis comes from Meltzer (1960). He found that
the conjecture by which credit rationing favors large firms was not established, since banks
and financial institutions were not the only source of credit for small firms. He showed that
during the mid–fifties money tightening in the U.S., firms with relatively large cash balances
increased the average length of time for which trade credit was extended, thus favoring the
firms against whom the credit restriction was said to discriminate. Meltzer’s (1960) idea was
soon followed by further empirical support: Brechling and Lipsey (1963), Jaffee and
Modigliani (1969), Jaffee (1971) and Herbst (1974), Duca (1986) who observed in one way
or another that credit constrained firms made larger use of TC when credit conditions were
tighter. The substitution hypothesis, however, did not remain long undisputed. Oliner and
Rudebush (1996) and Gertler and Gilchrist (1993) looked at the U.S. 1974-1991 period and
concluded that there was no support for the Meltzer’s idea. More recently, however, Nielsen
(2002) looked at a longer period and argued that the use of TC as a substitute to bank credit
was prominent in the U.S. for both small firms and large firms without access to open
market credit. Similarly, Fisman and Love (2002) find cross-country evidence consistent
with Meltzer’s suggestion. As for the Italian case, Bianchi, Frasca e Micossi (1976) and
Marotta (1997) provided some evidence according to which the substitution hypothesis
seemed to work, even though the direction of redistribution was at odds with Meltzer’s
original idea. In particular, Bianchi, Frasca e Micossi (1976) found that during the 1970 and
1974 monetary contractions, the substitution effect operated in favor of larger firms. This
was somewhat confirmed by Marotta (1997), who however failed to find any significant role
for monetary policy proxies over the period 1982-19933.
The substitution hypothesis relies on TC being an alternative to bank credit as a source
of finance. This idea however contrasts with the actual commercial practices that display
small variations across time. In a thorough survey on the U.S. interfirm trade, Ng, Smith and
Smith (1999) conclude that there is “wide variation across industries in credit terms, but little
3 It should be also emphasized that these papers consider the effects of monetary contractions on credit
aggregates and their composition, without dealing explicitly with a measure of firm’s real activity. This couldbe a problem since TC and measures of real activity, like inventory investment are most likely being jointlydetermined.

10
variation within industries; furthermore the data indicate that credit terms are stable over
time. (…) Firms generally do not respond to fluctuations in market demand by adjusting
trade-credit terms (…) and rarely alter credit terms in response to fluctuations in prevailing
interest rates. Similarly, in a recent survey on Italian manufacturing firms, Cannari, Chiri,
and Omiccioli (2004) confirm the high cross-section variability across industries and firms.
A limited time variability over time and high sector and firm heterogeneity would be
what the micro theories of TC would predict. In different ways, these theories stress the role
of time-invariant aspects of TC. Transaction cost theories (Ferris, 1981) suggest that TC
reduce the transaction costs of paying bills. Financing advantage theories (Petersen and
Rajan, 1997) emphasize that TC should be seen primarily as providing contractual solutions
to information problems concerning product quality and buyer creditworthiness. In this vein,
Smith (1987) suggests that delayed payment can facilitate exchange by allowing the buyer to
verify product quality before paying. Schwartz and Whitcomb (1979), Emery (1987), Freixas
(1993), Burkart and Ellingsen (2002) propose that the existence of TC is due to a monitoring
advantage that suppliers have over banks. Finally, Frank and Maksimovic (1998) hint that
the advantage for suppliers relies to salvaging value from existing assets.
The bottom line is that TC has both a finance and a transaction component. The former
represents a source of financing alternative to bank credit, which may vary over time
according to the conditions of the credit market. The latter serves to facilitate the exchange
of goods and represents time-invariant aspects of TC. This twofold feature of TC might have
complicated the empirical analysis of the substitution effect, which has been carried out so
far by aggregate and semi-aggregate data that cannot get rid of sector– and firm– level
heterogeneity. This is particularly relevant for the effects of monetary tightening, which are
highly heterogeneous across industries and firms (Guiso et al., 2000 and Dedola and Lippi,
2000)4.
4 Moreover, as for the Italian case, the use of TC is correlated to the effectiveness of the judiciary, which is
highly differentiated across areas (Carmignani, 2004). Again, asymmetric territorial effects of monetaryrestrictions would confuse the identification of the substitution effect in aggregate data.

11
3. Background Macroeconomic Facts
A prerequisite for our test is a good indicator of the stance of monetary policy for the
1982-1999 period under scrutiny. As the U.S. case displays, there is no consensus on this
topic and a whole host of different indicators have been proposed in the recent literature
(Bernake and Mihov, 1998; Christiano, Eichenbaum, Evans, 2000). The fact that we have
yearly data, also complicates the identification of money tightening, since we need to
characterize the “prevailing monetary stance” over the whole year. Fortunately, we can rely
on the chronology of stylized facts proposed by Gaiotti and Generale (2001), which provides
a yearly classification of both monetary and business cycle phases. This chronology is based
on the narrative accounts of the main monetary restrictions in Italy (Caranza and Fazio,
1983; Angeloni e Gaiotti, 1990; Gaiotti, 1999) while for the real side it relies, in turn, on the
Altissimo, Marchetti, and Onado (2000) analysis of the Italian business cycle.
According to the Gaiotti and Generale (2001) chronology (see Figure 1), over the
1982-1999 period there are five years in which the prevailing monetary condition can be
defined as restrictive: 1986, 1987, 1989, 1992, and 1995 (as well as three years in which the
business cycle phase can be classified as recessive: 1992, 1993, 1996). In particular, there
were two major episodes: i) the severe 1992 tightening, which was intended to countering
the turbulence in the European Monetary System and, after the devaluation of the lira in
September, the threat of imported inflation; ii) the 1995 contraction, which was implemented
to react to inflationary pressures and depreciating exchange rate. It should be noted that,
while there is no discussion about the prevailing monetary stance for the two major episodes
of the nineties, some doubts remain with reference to the 1989 and, to a lesser extent, to the
1986-87 episodes. In particular, Gaiotti and Generale (2001) argue that the “instances of
monetary tightening (…) in 1989 (…) are (…) less straightforward to interpret, often
representing only a temporary reaction to the dynamics of the exchange rate or money
growth”; in a similar vein, they argue that “the 1986-87 restriction was aimed at countering
tensions in the foreign exchange market. Despite a temporary tightening of liquidity
conditions and a rise in very short-term rates, however, bank lending rates continued to come
down through most of the 1987, reflecting the fall in inflation, the continued effect of the

12
lifting of credit controls in the early 1980s and the increased competition in the banking
market”5.
4. Empirical Specification
Our test is based on inventory accumulation. Its rationale goes as follows. In response
to a monetary contraction, inventories of bank-dependent firms with insufficient internal
resources – that is, liquidity and TC – are expected to fall more sharply than the inventories
of bank-dependent firms with plenty of internal resources.
The role of inventories during money tightness cannot be overemphasized (see
Hubbard, 1998). While all the components of investment should be affected by monetary
tightening, one would expect relatively liquid assets with low adjustment costs, such as
inventories, to bear the brunt of the adjustment. In particular, unlike largely irreversible
investments in R&D and fixed capital, inventories constitute a relatively flexible part of
firms’ assets, providing potential liquidity to offset shocks to external finance. The idea of
testing financial constrains in an inventory accumulation framework follows the original
intuition of Kashyap, Lamont, and Stein (1994) and Carpenter, Fazzari and Petersen (1994).
It has also been recently applied by Bagliano and Sembenelli (2001) to study financial
factors in the recession of the early ’90s in France, Italy, and the United Kingdom.
To identify the role of TC we proceed as follows.
We start from the Kashyap, Lamont, and Stein (1994) (hereinafter KLS) model of
inventory accumulation, which is based on the idea that what really matters during money
tightening for bank-dependent firms is the amount of liquidity (LIQ), internal cash reserves,
firms have. That is, the KLS model assumes implicitly that TC cannot be used to substitute
bank credit.
To test if TC can be assimilated to LIQ as a source of internal finance, we augment the
KLS model with a measure of net TC, defined as the difference between trade receivables
and trade payables. In our specification, both LIQ and TC are also interacted with a dummy
5 This is why the robustness of our empirical results will be checked also relatively to the inclusion of the

13
variable MPR, which takes on the value one in the “monetary policy restriction” years. The
intuition is that the LIQ and TC coefficient will capture the “average” degree of liquidity and
TC constraints6, while LIQ*MPR and TC*MPR will capture the added effects seen in a tight
money year. Our focus will be on the interaction terms.
This specification allows us a straightforward assessment of the substitution effect. We
distinguish four cases:
i) LIQ*MPR and TC*MPR do not enter with a positive coefficient: no evidence of
bank credit – rationing, at least in the KLS meaning.
ii) LIQ*MPR takes on a positive sign while TC*MPR does not: evidence contrary to
the substitution hypothesis, since bank-dependent firms appear LIQ-rationed but not TC-
rationed.
iii) LIQ*MPR and TC*MPR both enter with positive coefficients: evidence in favor
of the substitution hypothesis.
iv) TC*MPR takes on a positive value while LIQ*MPR does not: strong evidence in
favor of the substitution hypothesis, since what seems to count are only internal resources in
form of TC.
The KLS model augmented with TC provides our baseline specification. It can be
represented as follows.
(1)tititititi
tititititi
uMPRTCTCMPRLIQLIQSALESLogSALESLogSALESINVLogINVLog
,1,71,61,51,4
1,3,21,1,1,
**)()()()(
++++++∆+∆+=∆
−−−−
−−−
ααααααα
where the dependent variable is the first difference of (the log of) the end of period stock of
real inventories7. The right-hand-side variables include, the log of the inventory-sales ratio at
the beginning of the year, the change in the log of firm sales over both the current and the
preceding year, our financial variables LIQ (firm’s ratio of cash and marketable securities to
1989 and 1986-87 as a monetary contraction years.
6 The coefficients for LIQ and TC might also take positive values during easy money periods. That is, evenwhen bank lending is relatively unconstrained by monetary policy it may not be a perfect substitute for internalfinance.
7 Throughout the paper nominal variables are deflated with manufacturing producer prices.

14
total assets at the beginning of the period) and TC (firm’s ratio of net TC to total assets at the
beginning of the period8) as well as their interaction with MPR, and a idiosyncratic, serially
uncorrected component. The relationship between inventories and sales intends to control for
the nonfinancial determinants of inventories; its formalization in eq. (1) comes from the KLS
model.
5. Data
We use annual balance sheet data at the firm level for the 1982-1999 Company
Accounts Data Service (Centrale dei bilanci) “accounting units” (unità contabili) files. Data
are collected from a consortium of banks; the sample is not randomly drawn since firms
enter only by borrowing from one of the banks in the consortium. The account units refer to
firms whose balance sheets have been adjusted by the Company Accounts Data Service to
consider all the M&A operations that occurred during the sample period. A new firm
acquired by (born trough a breaking up from) a firm already in the sample is also aggregated
to the acquiring (divesting) firm for the years before (after) the incorporation. Moreover,
balance sheets are reclassified to ensure cross-section comparability (Centrale dei bilanci,
2001).
There are three main advantages in using these data. First, with firm-level panel data,
we can control for the many possible time-invariant determinants of TC and inventory
investment that differ across firms. Second, the long time extension of the panel allows us to
study the role of TC over five major contraction episodes. Third, the data cover a major
fraction of the aggregate economy (almost an half of aggregate manufacturing sales and
valued added). Accordingly, this extent of coverage enables us to draw conclusions relevant
to macroeconomics as well as microeconomics, notwithstanding the fixed effects model
would allow only inference with respect to the firms in the sample (that is, inference
conditional on the particular set of realizations of the individual effects).
8 Because of trade relationships between firms in the same control group might reflect within-group finance
redistribution needs, we exclude them in the definition of TC. However, within-group TC will be consideredlater.

15
There are however also a couple of drawbacks with these data. First, as discussed by
Guiso et al. (2000) the focus on the level of borrowing in the Company Accounts Data
Service skews the sample toward larger firms. Second, the accounting units file could be
affected by a survivorship bias since the firms in the sample have been continuously in
activity for 17 year9. All in all, the fact that our sample could be skewed towards larger and
older firms might indicate that our results could provide a conservative estimate of the
substitution effect, since typically larger and older firms are less likely to be credit-
rationed10.
From the original files, which include 5,249 firms belonging to the private sector, we
selected the sub-sample of manufacturing firms for a total of (3,877*18)=69,786
observations. This sub-sample covers all the 21 two-digit NACE-CLIO 1981 manufacturing
sectors. The estimation sample is constructed as follows. First, the two initial years were lost
by lagging the variables and constructing first differences. Next, we deleted firm-year data
with missing or negative (when implausible) numbers for our crucial variables (inventories,
sales, measures of liquidity, and TC). Finally, to correct for outliers we excluded firm-year
data that fell in the first and 99th percentile of the relevant variables. Thus, our estimation
sample is made up of 3,862 firms with an average time observations per firm of 14.5 and a
total number of observations equal to 55,832. Table 1 provides summary statistics.
6. Results
Baseline results are shown in Table 2. In order to control for the many possible time-
invariant determinants of TC and inventory investment that differ across firms, we use a
fixed-effects specification where time dummies have also been included. This is also the
preferred specification, as suggested by the Hausman (1978) test.
9 To mitigate this concern we have also used the Company Accounts Data Service “firms” file, which
provides a (very unbalanced) panel of firm-level data not adjusted for M&A. Results were virtually unchangedfrom the ones described below.
10 An additional note of caution is also warranted. The fact that our test is based on annual data could not bewithout consequences. Inventory investment is an high-frequency phenomenon and thus important cyclicalvariation could be missed with yearly data. This implies that our estimates should be taken only as suggestiveand indicative. However, high-frequency reliable data for a long period of time are not available.

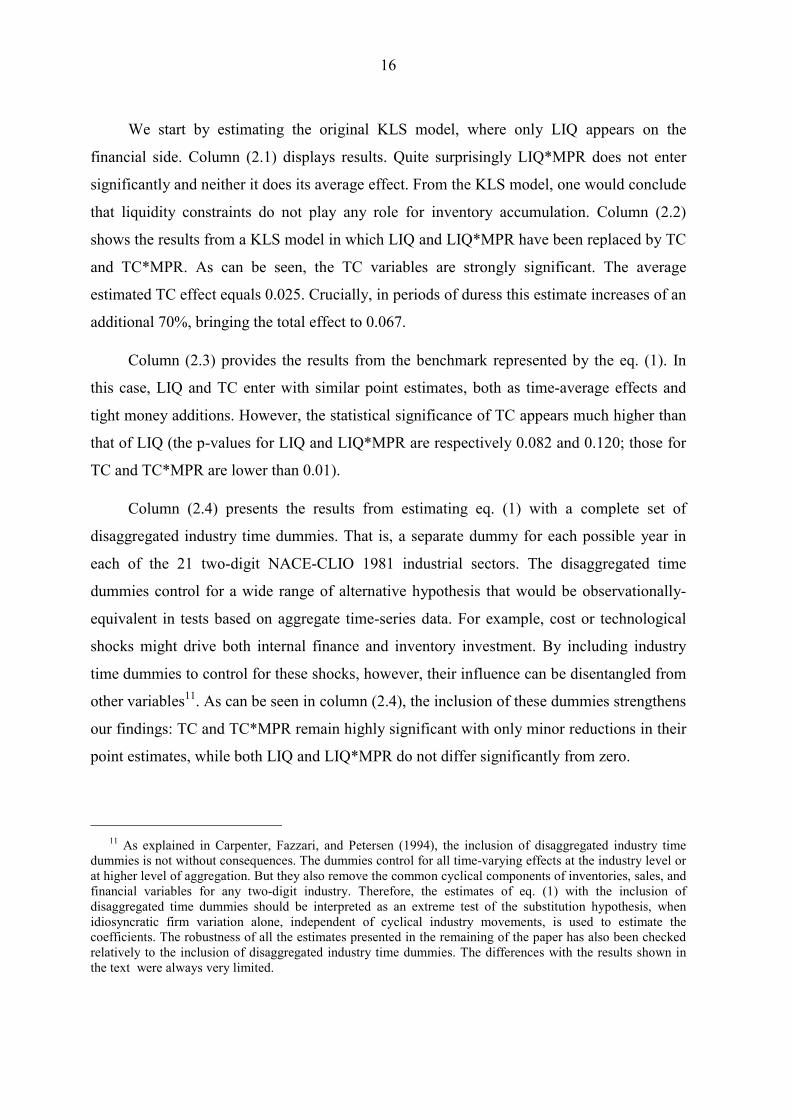
16
We start by estimating the original KLS model, where only LIQ appears on the
financial side. Column (2.1) displays results. Quite surprisingly LIQ*MPR does not enter
significantly and neither it does its average effect. From the KLS model, one would conclude
that liquidity constraints do not play any role for inventory accumulation. Column (2.2)
shows the results from a KLS model in which LIQ and LIQ*MPR have been replaced by TC
and TC*MPR. As can be seen, the TC variables are strongly significant. The average
estimated TC effect equals 0.025. Crucially, in periods of duress this estimate increases of an
additional 70%, bringing the total effect to 0.067.
Column (2.3) provides the results from the benchmark represented by the eq. (1). In
this case, LIQ and TC enter with similar point estimates, both as time-average effects and
tight money additions. However, the statistical significance of TC appears much higher than
that of LIQ (the p-values for LIQ and LIQ*MPR are respectively 0.082 and 0.120; those for
TC and TC*MPR are lower than 0.01).
Column (2.4) presents the results from estimating eq. (1) with a complete set of
disaggregated industry time dummies. That is, a separate dummy for each possible year in
each of the 21 two-digit NACE-CLIO 1981 industrial sectors. The disaggregated time
dummies control for a wide range of alternative hypothesis that would be observationally-
equivalent in tests based on aggregate time-series data. For example, cost or technological
shocks might drive both internal finance and inventory investment. By including industry
time dummies to control for these shocks, however, their influence can be disentangled from
other variables11. As can be seen in column (2.4), the inclusion of these dummies strengthens
our findings: TC and TC*MPR remain highly significant with only minor reductions in their
point estimates, while both LIQ and LIQ*MPR do not differ significantly from zero.
11 As explained in Carpenter, Fazzari, and Petersen (1994), the inclusion of disaggregated industry time
dummies is not without consequences. The dummies control for all time-varying effects at the industry level orat higher level of aggregation. But they also remove the common cyclical components of inventories, sales, andfinancial variables for any two-digit industry. Therefore, the estimates of eq. (1) with the inclusion ofdisaggregated time dummies should be interpreted as an extreme test of the substitution hypothesis, whenidiosyncratic firm variation alone, independent of cyclical industry movements, is used to estimate thecoefficients. The robustness of all the estimates presented in the remaining of the paper has also been checkedrelatively to the inclusion of disaggregated industry time dummies. The differences with the results shown inthe text were always very limited.
17
The results above make a point in favor of the Meltzer (1960) hypothesis. In particular,
in terms of the four cases discussed above the evidence in favor of the substitution
hypothesis seems to take its strongest form. However, while the TC and TC*MPR
coefficients are statistically significant, their magnitude is not that big. For comparison, in
the KLS model, the estimated coefficient for the LIQ variable is equal to 0.41. In our
estimate of column (2.3) if we add the LIQ and TC coefficients (as well as their interactions
with MPR, when they enter significantly) our total effect for internal resources barely
reaches 0.12. For the purpose of a back-of-the-envelop calculation it should be observed that
during monetary tightening, the median firm in our sample increases its real inventories by
5.2% while the median value of the TC variable is 9.3 per cent. Taking the (2.3), this means
that if we start with a typical firm that is increasing its inventories by 5.1 per cent and then
double its TC, we get an additional boost in inventories of only 0.7 per cent, admittedly not a
sizeable effect12.
The fact that the quantitative importance of the substitution effect is not that great, is
by no means surprising. As argued above, TC has a twofold role that encompasses both a
(time-varying) financial motive, represented by financial resources that can be used to offset
the effects of a monetary restriction, and a (time-invariant) transaction component, which
derives from the fact that TC provides contractual solutions to minimize transaction costs
and to overcome information problems concerning product quality and buyer
creditworthiness. The larger the transaction enhancing role the smaller the amount of TC left
to cushion against a money tightening.
We then turn to analyze the robustness of our estimates. We check the robustness with
respect to 5 main issues:
1. Endogeneity of financial variables.
2. Specification of the inventory-sales relationship.
3. Potential pitfalls of the monetary policy chronology.
4. Appropriateness of the balance sheet variables.
12 In our sample, the ratio of short-term bank debt over inventories for the median firm is equal to 0.58 and
0.54, respectively for easy and tight money periods. The ratio of TC over inventories remains approximatelyconstant over the two periods around 0.46.

18
5. Sensitivity to more restrictive definition of bank-dependent firms.
Endogeneity of financial variables. LIQ and TC might be endogenous and might be
proxying for other factors that could affect inventory behavior. For example, it could be that
LIQ and TC are proxies for innovations in firm profitability; i.e. firms that have a high value
of LIQ and TC might be firms that have recently become more profitable. If this is the case,
it would come to no surprise to see these firms devoting more resources to inventory
investment, regardless of whether or not they are LIQ– or TC– constrained. It could also be,
for example, that firms anticipate the money tightening and attempt to offset it by stockpiling
LIQ or TC13. To mitigate any endogeneity bias, we use firm’s lagged values of LIQ and TC
as instruments respectively for LIQ and TC.
IV estimates are shown in the first three columns of Table 3.
We start (3.1) by instrumenting only LIQ (and LIQ*MPR) in the (2.3) model. The LIQ
coefficient increases to 0.106 and becomes significant at the 5 per cent level. Its interaction
with the MPR dummy, remains however not statistically different from zero. TC variables
are only marginally affected.
We then (3.2) instrument only for TC (and TC*MPR). The results are very similar to
(2.3), with all coefficients for the financial variable increasing slightly.
Finally, we proceed (3.3) by treating both LIQ and TC variables as endogenous. In this
case, again the LIQ*MPR coefficient does not enter significantly. Taken at face value, the
specification (3.3) would suggest that the effect of LIQ is on average stronger than that of
TC (0.111 versus 0.048). However, during money tightening years the TC effect more than
doubles, while there is no additional effect for LIQ14.
IV estimates suggest that treating LIQ and TC as exogenous variables could
moderately bias downwards their estimated effects. They also underscore that the evidence
13 Endogeneity problems typically lead to an upward bias. However, this is not always the case: if those
firms that anticipate having the most severe financial constraints attempt to compensate for them byaccumulating more LIQ and TC, the estimated coefficients will be pushed towards zero.
14 We also tried instrumenting with twice-lagged LIQ and TC. Estimates differed only marginally.

19
on the substitution effect remain confirmed. The time-average effects seem to fall in case iii),
while case iv) still appears as a good characterization of monetary restrictions.
Specification of the inventory-sales relationship. We analyze now the sensitivity of our
results to alternative specification of the inventory-sales relationship. Inventory
accumulation modeling choices could be critical for our results. While in principle one
would like to control for all the fundamental firm-level determinants of inventories, there is
no unique way to do so since there is no agreement on which model of inventories is
preferable among the many proposed. Rather than try to come up with our ‘right’
specification, we follow the KLS sensitivity strategy and try a variety of alternative
specifications of the inventory-sales model within the KLS model. Subsequently, we leave
the KLS model altogether and try a specification in levels, which derives from a much more
structured model of inventory investment. The aim is to show that the evidence on the role of
TC during monetary contraction is relatively insensitive to how inventory accumulation is
modeled.
We start from (3.4), in which we use the change in the log of the inventory-to-sales
ratio as dependent variable and exclude all the sales term from the right-hand side of the
equation. This amounts to constrain the coefficient for the contemporaneous change in sales
to unity. This specification, which can be deemed as a poor representation of the real aspect
of inventory accumulation, has the effect of magnifying the average LIQ and TC
coefficients. The TC*MPR coefficient remains however roughly the same at 0.044 while the
LIQ*MPR coefficient continues to be not significantly different from zero.
Next, (3.5) we instrument for the contemporaneous change in sales with the lagged
change in inventories. This is supposed to matter if anticipated changes in sales influenced
inventories differently from unanticipated changes. While this modification makes the
average effect of LIQ and TC disappeared, there is only a minor impact on the LIQ*MPR
and TC*MPR coefficients.

20
Then, in (3.6) we add the lagged change in the log of inventories to the right-hand
side. While this variation increases a little bit the LIQ*MPR coefficient to 0.05, it has no
effect whatsoever on the TC*MPR coefficient15.
Finally, we move from a specification in differences to a specification in levels (3.7).
This replicates the exercise proposed for example by Carpenter, Fazzari, and Petersen (1994)
and Bagliano and Sembenelli (2001). In this specification (the log of) real inventories is
explained by its lagged value and contemporaneous and lagged values of (the log of) real
sales. In contrast with the relatively unstructured KLS model, this specification has more
structure since it assumes, on the one hand, that the desired level of inventories is a linear
function of the level of sales expected at the beginning of the period and, on the other, that
expected sales follow a first-order process16. What is relevant for our purposes, is that the
specification in levels produces only minor modification to our results17.
Our results seem not to rely on the way the inventory-sales relationship is modeled.
The TC*MPR coefficient always enters significantly with a modest magnitude. On the
contrary, the estimate for the LIQ*MPR coefficient is less robust, since it depends on the
way one specifies the inventory accumulation process. In terms of the four cases above, our
results keep oscillating between cases iii) and iv).
Potential pitfalls of the monetary policy chronology. The sensitivity of our results
should be checked with respect to two issues that come from the Gaiotti and Generale (2001)
chronology.
15 We also added the log of real assets to the right-hand side (results not shown). This modification had a
minimal impact on the TC coefficients. On the contrary, it made statistically insignificant, in addition toLIQ*MPR, also the average LIQ term. The sensitivity of our results to firm size will be investigated below.
16 This specification derives from the Blinder and Maccini (1991) model, in which the change in the (log of)real inventories is explained in terms of the adjustment of the actual inventory stock to a target level and a termrepresenting the buffer stock role of inventories. Then, the assumptions that - the desired level of inventories isa linear function of expected sales, and that – expected sales follow a first-order process, will deliver the modelestimated in the text.
17 Specification (3.6) and (3.7) contain a lagged dependent variable on the right-hand-side. In these cases,there could be a bias in the within estimator (Bond et al., (1997)) and a GMM estimator would be preferable.However, the inconsistency of the within estimator decreases as the number of periods becomes large, whiledepending on the instruments, GMM could lead to very large standard errors for the estimated coefficient. Hall,Mulkay and Mairesse (2000), for example, prefer the within estimator for a panel with 12 annual observationfor each firm, which they deem as a time span long enough to minimize the inconsistency problem. In any case,we also estimate specifications (3.6) and (3.7) by GMM, with no major implications for our results.

21
First, while there is no discussion about the prevailing monetary stance in 1992 and
1995, some doubts remain with reference to 1989 and, to a lesser extent, 1986-87. Our
concern here can be expressed as follows. Since it is debatable that these periods can be
defined as money tightening years, we want to be sure that their potential erroneous
inclusion into the tight money year sample does not affect the results. The first column of
Table 4 shows the result when we drop the 1989 in the definition of MPR. In the second
column we drop 1986, 1987 and 1989 altogether. The results are only marginally influenced.
Second, over the 1982-1999 period, two years are classified as recession years. In
particular, the 1992 represents a year characterized by both a monetary contraction and a
recession, while the 1996 is classified as a recession year with loose prevailing monetary
conditions. Disentangling the effects of a monetary restriction from those deriving from real
shocks is not an easy task, and it goes far beyond the scope of this paper. It could be
however interesting to verify to what extent our results are driven by recession years. In this
vein, we perform two experiments. Column (4.3) presents the estimate that leaves the 1992
out of the definition of the MPR dummy. That is, in this case MPR takes on the value of 1
only for the years: 1986, 1987, 1989, 1995. The results confirm the role of TC and its
economic significance. As for LIQ, however, we find now a larger (close to 7 per cent) and
statistically significant coefficient for LIQ*MPR, suggesting that the “credit
crunch/recession” year 1992 has much to do with the scant evidence on the LIQ effect. Next,
we add (4.4) two more interaction terms: LIQ*REC and TC*REC, where the REC variable
is now a dummy that takes on the value one in the 1992, 1993 and 1996. We find that the
two interaction terms do not enter significantly and do not affect our results.
The evidence on the substitution effect does not seem to depend either on the potential
erroneous classification of the 1989 and 1986-87 episodes or the effects of the 1992, 1993,
and 1996 recessions.
Appropriateness of the balance sheet variables. We next try to evaluate the robustness
of our estimates with respect to the balance sheet variables so far used.
First, TC has been defined so far as trade receivables less trade payables (over assets).
One could wonder which one of the two components is more accountable for the substituting
role of TC. This issue has received a lot of attention in the literature. For example, Nilsen

22
(2002) argues that what really matters are payables, while Marotta (1997) takes the view that
both payables and receivables should be accounted for the substitution hypothesis. In column
(4.5) we replicate (2.3) splitting the TC variable in its two components TR and TP (and,
similarly, we define two interaction terms TR*MPR and TP*MPR). The evidence suggests
that while the average degree of TC constraints is mainly explained in terms of payables,
during monetary restrictions firms are rationed by the availability of receivables. This would
suggests that in periods of duress they move predominantly receivables; that is, reducing
payment delays they allow to their customers would be an easier option than delaying
payments for their bills.
Second, our measure of TC did not take into account so far TC relationships with firms
belonging to the same control group. We left them out because trade relationships between
firms in the same control group might reflect within-group finance redistribution needs, and
might mask the underling TC determinants. We now consider also within-group TC and
include it into our TC measure (4.6). We find that this inclusion has minor implications for
our estimates.
Third, our proxy for LIQ so far has been the stock of cash and marketable securities, as
in the KLS model. Measures of cash flow, defined as net profits plus depreciation, are
alternatively used in the literature. We need to be sure that our results are not due to the
specific proxy LIQ chosen. In column (4.7) we replicate specification (2.3) replacing LIQ
with CF18. The results are invariant19.
Our results seem robust to alternative definitions of the key balance sheet variables.
Sensitivity to more restrictive definition for bank-dependent firms. As a final test we
verify some cross-sectional implications. In particular, we want to check what happens to
our results when we consider only sub-samples of firms that are likely to be characterized by
higher financial constraints. Following Gaiotti and Generale (2001), we consider the
following three groups.
18 In this regression CF is defined as net profits plus the difference between gross and net margins.19 We present here only a sub-sample of the sensitivity checks performed. Robustness has also been
checked with reference to the type of inventories (raw materials and finished goods), the accounting method for

23
First, we take only small firms. Small firms are traditionally considered more subject
to financial constraints, since they have weaker and more opaque balance sheet. They should
be more affected by a monetary tightening. In column (5.1) we reply the regression (2.3)
only for small firms (42,977 obs., 3,000 groups) defined by the Gaiotti and Generale (2001)
threshold, that is firms with fewer than 200 employees. The TC*MPR coefficient increases
from 0.046 to 0.057. Admittedly, however, this size threshold is somewhat too large for our
sample, in which the 75 percentile in the distribution of employees equals to 184. Thus, we
restrict the threshold to 90 employees (5.2), which represent the median value in the sample
(26,968 obs., 1,913 groups). In this case however the increase for the TR*MPR coefficient is
more limited. While surprising, this finding is consistent with the evidence provided by
Angeloni et al. (1995) and Ferri and Pittaluga (1997), according to which because of thither
bank-firm relationships, small firms are shielded from a monetary contraction by their banks.
Second, we consider the group of firms with a high proportion of intangible assets.
Intangible assets include R&D expenditures, patents, development and advertising costs and
the like. The idea is that firms in this group are more subject to financial constraints, since
intangible assets are relatively difficult to evaluate for an outside lender and cannot be used
as collateral. To define this group we take the same definition proposed by Gaiotti and
Generale (2001). Accordingly, we include only firms whose ratio of intangible assets to total
assets is higher than 75 per cent of the distribution in at least one year. For this group
(39.274 obs, 2,711 groups) we find (5.3) a slightly smaller TC*MPR coefficient (0.040)
along with a much higher LIQ*MPR coefficient (0.097). This type of firms appears severely
liquidity-constrained.
Third, we take only firms paying dividends. Again we take the Gaiotti and Generale
(2001) very conservative definition of firms with non-negative payout for the whole sample
period. This would minimize the scope for the endogenous dividend reshuffling across years.
Given the majority of unlisted firms in the Italian case, this group is intended to capture
firms with excess cash. Restricting the sample to firms paying dividends over the whole
sample period leaves us with only 784 observations (49 groups). The results (5.4) would
inventories (FIFO and LIFO), a more extensive definition of LIQ that includes cash and all short-term assets, amore narrow definition of CF that includes net profits plus fixed asset depreciation.

24
indicate that financial variables are jointly not significant. These results are confirmed when
we relax somewhat the criteria to include firms that distribute positive dividends for a
number of years lower than the whole sample period. For example, when we consider firms
that distribute dividends for 12 out of 16 periods (5.5), we still find that both TC*MPR and
LIQ*MPR do not enter significantly (with the only statistically significant variable being
TC).
Finally, as underscored by many (see, for example, Hubbard (1998)) it is doubtful that
a single proxy for higher financial constraints will do the job of identifying those firms more
likely to face capital-market imperfections. More appropriately, firms facing higher financial
constraints are those who score high according to a host of financial constraint indicators. In
this vein, in column (5.6) we restrict the sample to small (with less than 200 employees)
firms with an high ratio of intangible assets who did not distribute positive dividends
continuously for the whole sample period. Results show that the TC*MPR coefficient
increases marginally, while the LIQ*MPR coefficient rises substantially.
The evidence presented suggests that main cross-sectional implications appear to
receive empirical support20.
7. Conclusions
The existence of a TC-bank credit substitution effect has been under scrutiny for more
than four decades. This paper presents new evidence that, on the one hand, confirms
Meltzer’s (1960) intuition, according to which firms substitute trade credit for bank credit
during money tightening, and, on the other hand, shows that the magnitude of the
substitution effect is quite modest – that is, that the substitution of trade credit for bank credit
is unlikely to be very relevant in practice.21
20 The fact that our sample is likely to be skewed towards larger and older firms could make our data not the
best place where such implications could be verified. However, cross-sectional predictions have also beenchecked using the Company Accounts Data Service “firms” file (see footnote n. 9) with no modifications forthe results described in the text.
21 This conclusion has also implications for the debate on the potential asymmetric effects of the singlemonetary policy in the euro area.

25
Our empirical investigation is based on micro panel data of Italian manufacturing firms
covering an extended period. The importance of our conclusions relies on two facts. First,
Italy represents an ideal setting for testing the substitution hypothesis, because Italian firms
display very high levels of TC in their balance sheets; alternative sources of finance are
mostly unavailable; and the country’s industrial structure is tilted toward small firms.
Second, the structure of our data allows one to control for the many possible time-invariant
determinants of TC (and inventory investment) that differ across firms and to study the role
of TC over five monetary-restriction episodes.
Generally speaking, the study’s results would indicate that TC in Italy should be
mainly explained in terms of time-invariant factors. The limited variability over time (and
the high sector and firm heterogeneity) would suggest that the high levels of TC in Italy
should be seen primarily as consequences of information problems concerning product
quality and buyer creditworthiness and as ways of minimizing transaction costs. It is also
plausible that credit protection and other institutional factors might play a role.

Tables and figures
Fig.1GAIOTTI AND GENERALE (2001): CHRONOLOGY AND SELECTED
VARIABLES.
Restrictive Monetary Policy
Recession and Restrictive Monetary Policy
Recession
-0.04
-0.02
0
0.02
0.04
0.06
0.08
0.1
0.12
1984 1985 1986 1987 1988 1989 1990 1991 1992 1993 1994 1995 1996 1997 1998 19990
0.02
0.04
0.06
0.08
0.1
0.12
Change Log(INV) LIQ beginning of period TC beginning of period

Table 1
SUMMARY STATISTICS1984 1985 1986 1987 1988 1989 1990 1991 1992 1993 1994 1995 1996 1997 1998 1999
∆ Log(INV) mean 0.05 0.05 0.05 0.07 0.11 0.08 0.02 0.01 0.02 -0.03 0.08 0.07 -0.03 0.06 0.05 0.04 standard deviation 0.28 0.28 0.28 0.27 0.26 0.26 0.25 0.25 0.24 0.26 0.25 0.26 0.25 0.24 0.24 0.23
Log(INV/SALES) beginning of period mean -1.86 -1.90 -1.91 -1.94 -1.94 -1.93 -1.91 -1.90 -1.90 -1.90 -1.92 -1.94 -1.97 -1.97 -1.94 -1.9 standard deviation 0.71 0.70 0.71 0.71 0.69 0.68 0.69 0.70 0.72 0.73 0.72 0.72 0.73 0.75 0.75 0.76
∆ Log(SALES) mean 0.08 0.06 0.08 0.07 0.10 0.07 0.02 0.01 0.02 0.01 0.09 0.10 -0.02 0.02 0.03 0.00 standard deviation 0.15 0.15 0.15 0.14 0.14 0.13 0.14 0.15 0.14 0.15 0.15 0.15 0.14 0.13 0.13 0.14
LIQ beginning of period mean 0.06 0.06 0.06 0.07 0.07 0.07 0.06 0.06 0.06 0.06 0.06 0.06 0.05 0.05 0.05 0.05 standard deviation 0.07 0.08 0.08 0.08 0.08 0.08 0.07 0.07 0.07 0.07 0.07 0.07 0.07 0.07 0.07 0.07
TC beginning of period mean 0.07 0.08 0.08 0.09 0.10 0.09 0.09 0.09 0.10 0.11 0.11 0.10 0.09 0.11 0.10 0.10 standard deviation 0.16 0.16 0.16 0.16 0.16 0.16 0.16 0.15 0.15 0.15 0.15 0.15 0.15 0.15 0.15 0.15
MPR 0 0 1 1 0 1 0 0 1 0 0 1 0 0 0 0REC 0 0 0 0 0 0 0 0 1 1 0 0 1 0 0 0
N. Obs. 3,276 3,383 3,441 3,444 3,465 3,488 3,525 3,531 3,557 3,501 3,495 3,532 3,528 3,541 3,576 3,549Notes: The sample is selected following the procedure described in the text. MPR=1 denotes a year in which, according to the Gaiotti and Generale (2001) chronology, a monetarytightening occurred. REC=1 denotes a year in which a recession occurred, according to the same source.
-
-

Table 2
BASELINE SPECIFICATIONSDEPENDENT VARIABLE: ∆ LOG(INV)
(2.1) (2.2) (2.3) (2.4)
Log(INV/SALES)t-1 -0.266*** -0.265*** -0.263*** -0.265***(0.003) (0.003) (0.003) (0.003)
∆ Log(SALES) 0.201*** 0.203*** 0.203*** 0.193***(0.008) (0.008) (0.008) (0.008)
∆ Log(SALES)t-1 -0.075*** -0.074*** -0.073*** -0.068***
(0.007) (0.007) (0.007) (0.008)
LIQt-1 0.024 - 0.039* 0.034(0.022) - (0.022) (0.022)
LIQt-1*MPR 0.033 - 0.047 0.034(0.030) - (0.030) (0.030)
TCt-1 - 0.025** 0.031*** 0.026**- (0.012) (0.012) (0.012)
TCt-1*MPR - 0.042*** 0.046*** 0.043***- (0.014) (0.015) (0.015)
N. Obs. 55,832 55,832 55,832 55,832N. Groups 3,862 3,862 3,862 3.862R-sq (within) 0.15 0.15 0.15 0.16Hausman Test 7,514.37 7,618.22 7,528.10 6,866.60Notes: *** (**) (*) denotes 1% (5%) (10%) significance level. Standard errors in parenthesis. Year-effects included in (2.1), (2.2), and (2.3). Year by industry-effects included in (2.4)

Table 3
ROBUSTNESS CHECKS FOR ISSUES 1 AND 2(3.1) (3.2) (3.3) (3.4) (3.5) (3.6) (3.7)
Dependent variable: ∆ Log(INV) ∆ Log(INV) ∆ Log(INV) ∆ Log(INV/SALES) ∆ Log(INV) ∆ Log(INV) Log(INV)
Log(INV/SALES)t-1 -0.261*** -0.262*** -0.260*** - -0.332*** -0.256*** -(0.004) (0.003) (0.004) - (0.081) (0.003) -
∆ Log(SALES) 0.203*** 0.203*** 0.203*** - -0.227*** 0.208*** -(0.008) (0.008) (0.008) - (0.006) (0.008) -
∆ Log(SALES)t-1 -0.073*** -0.073*** -0.072*** - -0.064*** -0.069*** -(0.007) (0.008) (0.008) - (0.008) (0.008) -
∆ Log(INV)t-1 - - - - - -0.027*** -- - - - - (0.004) -
Log(INV)t-1 - - - - - - 0.725***- - - - - - (0.003)
Log(SALES) - - - - - - 0.156***- - - - - - (0.008)
Log(SALES)t-1 - - - - - - 0.017***- - - - - - (0.008)
LIQt-1 0.106** 0.044* 0.111** 0.564*** 0.035 0.038* 0.045**(0.048) (0.024) (0.046) (0.026) (0.023) (0.022) (0.022)
LIQt-1*MPR 0.024 0.051* 0.028 0.002 0.043 0.050* 0.050*(0.042) (0.030) (0.042) (0.036) (0.032) (0.030) (0.030)
TCt-1 0.039*** 0.043* 0.048** 0.325*** -0.003 0.024** 0.026**(0.013) (0.022) (0.022) (0.014) (0.013) (0.012) (0.012)
TCt-1*MPR 0.044*** 0.059*** 0.058*** 0.044** 0.050*** 0.046*** 0.054**(0.015) (0.018) (0.018) (0.017) (0.015) (0.015) (0.015)
Instrumented: LIQt-1 TCt-1 LIQt-1, TCt-1 - ∆ Log(SALES) - -Instruments: LIQt-2 TCt-2 LIQt-2, TCt-2 - ∆ Log(INV)t-1 - -
N. Obs. 55,832 55,832 55,832 55,832 55,832 55,832 55,832N. Groups 3,862 3,862 3,862 3,862 3,862 3,862 3,862R-sq (within) 0.15 0.15 0.15 0.03 0.07 0.15 0.70Hausman Test 7,563.17 7,532.64 7,575.00 789.93 n.a. 5,695.96 n.a.Notes: *** (**) (*) denotes 1% (5%) (10%) significance level. Standard errors in parenthesis. Year-effects included. TheHausman test is not available for (3.5) and (3.7) because the model failed to meet the asymptotic assumption of the test.

Table 4
ROBUSTNESS CHECKS FOR ISSUES 3 AND 4DEPENDENT VARIABLE: ∆ LOG(INV)
(4.1) (4.2) (4.3) (4.4) (4.5) (4.6) (4.7)
Log(INV/SALES)t-1 -0.263*** -0.263*** -0.263*** -0.263*** -0.271*** -0.263*** -0.262***(0.003) (0.003) (0.003) (0.003) (0.003) (0.003) (0.003)
∆ Log(SALES) 0.203*** 0.203*** 0.203*** 0.203*** 0.207*** 0.203*** 0.203***(0.008) (0.008) (0.008) (0.008) (0.008) (0.008) (0.008)
∆ Log(SALES)t-1 -0.074*** -0.074*** -0.073*** -0.073*** -0.062*** -0.073*** -0.077***(0.007) (0.007) (0.007) (0.007) (0.008) (0.007) (0.008)
LIQt-1 0.041* 0.058*** 0.035 0.042* 0.006 0.041* -(0.022) (0.020) (0.022) (0.023) (0.023) (0.022) -
LIQt-1*MPR 0.050 -0.028 0.069** 0.047 0.054* 0.048 -(0.032) (0.043) (0.032) (0.030) (0.030) (0.030) -
TCt-1 0.032*** 0.042*** 0.031*** 0.033*** - 0.034** 0.025**(0.012) (0.011) (0.012) (0.012) - (0.012) (0.012)
TCt-1*MPR 0.052*** 0.038* 0.054*** 0.046*** - 0.047*** 0.041***(0.016) (0.021) (0.016) (0.015) - (0.015) (0.014)
LIQt-1*REC - - - -0.022 - - -- - - (0.037) - - -
TCt-1*REC - - - -0.013 - - -- - - (0.018) - - -
TRt-1 - - - - -0.040*** - -- - - - (0.014) - -
TRt-1*MPR - - - - 0.065*** - -- - - - (0.017) - -
TPt-1 - - - - -0.139*** - -- - - - (0.017) - -
TPt-1*MPR - - - - -0.010 - -- - - - (0.019) - -
CFt-1 - - - - - - 0.075***- - - - - - (0.029)
CFt-1*MPR - - - - - - 0.037- - - - - - (0.038)
Action Taken: 1989 out ofMPR
1989 and1986-87
out ofMPR
1992 outof MPR
Dummiesfor
recessionyears
included
TCsplitted inTR and
TP
TCincludeswithin-groupcredits
CASHFLOW
replacesLIQ
N. Obs. 55,832 55,832 55,832 55,832 55,832 55,832 55,832N. Groups 3,862 3,862 3,862 3,862 3,862 3,862 3,862R-sq (within) 0.15 0.15 0.15 0.15 0.15 0.15 0.15Hausman Test 7,530.58 10,872.26 7,526.68 7,516.18 7,610.16 7,530.65 7,369.66Notes: *** (**) (*) denotes 1% (5%) (10%) significance level. Standard errors in parenthesis. Year-effectsincluded.

Table 5
ROBUSTNESS CHECKS FOR ISSUE 5DEPENDENT VARIABLE: ∆ LOG(INV)
(5.1) (5.2) (5.3) (5.4) (5.5) (5.6)
Log(INV/SALES)t-1 -0.263*** -0,261*** -0.259*** -0.327*** -0.294*** -0.256***(0.003) (0.05) (0.004) (0.028) (0.011) (0.004)
∆ Log(SALES) 0.164*** 0.143*** 0.208*** 0.404*** 0.337*** 0.162***(0.009) (0.011) (0.009) (0.062) (0.026) (0.010)
∆ Log(SALES)t-1 -0.083*** -0.082*** -0.067*** 0.005 -0.022 -0.077***(0.009) (0.011) (0.009) (0.061) (0.025) (0.010)
LIQt-1 0.032 0.085** 0.012 -0.002 0.067 0.007(0.026) (0.034) (0.027) (0.147) (0.057) (0.032)
LIQt-1*MPR 0.043 0.047 0.097*** 0.068 -0.021 0.122***(0.035) (0.046) (0.037) (0.181) (0.074) (0.045)
TCt-1 0.028** 0.045*** 0.018 0.056 0.090** 0.022(0.014) (0.017) (0.014) (0.100) (0.038) (0.016)
TCt-1*MPR 0.057*** 0.049** 0.040** 0.119 0.005 0.050**(0.017) (0.021) (0.018) (0.103) (0.046) (0.021)
Subsample of firms: with less than200
employees
with less than90 employees
with high ratioof intangible
assets
payingdividends for16 periods
payingdividends atleast for 12
periods
Intersection of(5.1), (5.3)and (5.4)-1
N. Obs. 42,977 26,968 39,274 784 5,084 29,335N. Groups 3,000 1,913 2,711 49 322 2,046R-sq (within) 0.15 0,15 0.15 0.25 0.18 0.14Hausman Test 5,270.80 3,598.03 4,481.87 101.55 859.04 1,663.64Notes: *** (**) (*) denotes 1% (5%) (10%) significance level. Standard errors in parenthesis. Year-effects included.

References
Altissimo, F., D. J. Marchetti and G. P. Onedo (2000), “The Italian Business Cycle:Coincident and Leading Indicators and Some Stylized Facts,” Banca d’Italia, Temi diDiscussione, No. 377.
Angeloni, I., L. Buttiglione, G. Ferri and E. Gaiotti (1995), “The Credit Channel ofMonetary Policy Across Heterogeneous Banks: The Case of Italy,” Banca d’Italia,Temi di Discussione, No. 256.
_________ and E. Gaiotti (1990), “Note sulla politica monetaria italiana negli anni ottanta,”Bank of Italy, Rome.
Bagliano, F. C. and A. Sembenelli (2001), “The Cyclical Behaviour of Inventories:European Cross-Country Evidence from the Early 1990s Recession,” Università diTorino, Quaderni del Dipartimento di Scienze Economiche e Finanziarie “G. Prato”,No. 53.
Bernanke, B. S. and I. Mihov (1998), “Measuring Monetary Policy,” Quarterly Journal ofEconomics, Vol. 113, 3, pp. 869-902.
Bianchi, B., F. M. Frasca and S. Micossi (1976), “Il credito commerciale nella gestioned’impresa. Rilevanza ai fini della politica monetaria,” Banca d’Italia, Contributi allaricerca economica.
Blinder, A. S. and L. J. Maccini (1991), “Taking Stock: A Critical Assessment of RecentResearch on Inventories,” Journal of Economic Perspectives, Vol. 5, 1, pp.73-96.
Bond, S. , J. Elston, J. Mairesse and B. Mulkay (1997), “Financial Factors and Investment inBelgium, France, Germany, and the UK: a Comparison using Company Panel Data,”NBER Working Paper No. 5900.
Brechling, F. and R. Lipsey (1963), “Trade Credit and Monetary Policy,” Economic Journal,Vol. 73, 4, pp. 618-641.
Burkart, M. and T. Ellingsen (2002), “In-Kind Finance,” CEPR Discussion Paper Series,No. 3536.
Cannari, L., S. Chiri, and M. Omiccioli (2004), “Condizioni del credito commerciale edifferenziazione della clientela,” Banca d’Italia, Temi di discussione, No. 496.
Caranza, C. and A. Fazio (1983), “Methods of Monetary Control in Italy, 1974-1983,” inD. R. Hodgman (ed.), The Political Economy of Monetary Policy: National andInternational Aspects, Boston.
33
Carmignani, A. (2004), “Funzionamento della giustizia civile e struttura finanziaria delleimprese: il ruolo del credito commerciale,” Banca d’Italia, Temi di discussione, No.498.
Carpenter, R. E., S. M. Fazzari and B. C. Petersen (1994), “Inventory Investment, Internal-Finance Fluctuations, and the Business Cycle,” Brookings Papers on EconomicActivity, 2, pp. 75-138.
Centrale dei bilanci (2001), Economia e finanza delle imprese italiane. Quattordicesimorapporto 1982-1999. Bancaria Editrice. Roma.
Christiano, L., M. Eichenbaum and C. Evans (2000), “Monetary Policy Shocks: What HaveWe Learned and to What End?” in J. Taylor and M. Woodford (eds.), Handbook ofMacroeconomics, North-Holland, Amsterdam.
Dedola, L. and F. Lippi (2000), “The Monetary Transmission Mechanism: Evidence fromthe Industries of Five OECD Countries,” Banca d'Italia, Temi di Discussione, No.389.
Demirgüc-Kunt, A. and V. Maksimovic (2001), “Firms as Financial Intermediaries:Evidence from Trade Credit Data,” World Bank. Washington, D. C.
Duca, J. (1986), “Trade Credit and Credit Rationing: A Theoretical Model,” Board ofGovernors of the Federal Reserve System, Washington, D. C.
Emery, G. (1987), “An Optimal Financial Response to Variable Demand,” Journal ofFinancial and Quantitative Analysis, Vol. 22, pp. 209-225.
Ferri, G. and G. B. Pittaluga (1997), “Il finanziamento delle imprese nelle fasi di restrizionemonetaria. Il caso del credito cooperativo,” in F. Cesarini, G. Ferri, and M. Giardino(eds.), Credito e sviluppo. Banche locali cooperative e imprese minori. Il Mulino.Bologna.
Ferris, J. S. (1981), “A Transaction Theory of Trade Credit Use,” Quarterly Journal ofEconomics, Vol. 94, 2, pp. 243-270.
Fisman, R. and I. Love (2002), “Trade Credit, Financial Intermediary Development andIndustry Growth,” NBER Working Paper No. 8960.
Frank, M. and V. Maksimovic (1998), “Trade Credit, Collateral and Adverse Selection,”mimeo.
Freixas, X. (1993), “Short-term Credit versus Account Receivable Financing,” UniversitatPompeu Fabra, Economics Working Paper, No. 27.
Gaiotti, E. (1999), “The Transmission of Monetary Policy Stocks in Italy, 1967-1997,”Banca d'Italia, Temi di Discussione, No. 363.

34
_________ and A. Generale (2001), “Does Monetary Policy Have Asymmetric Effects? ALook at the Investment Decision of Italian Firms,” Banca d'Italia, Temi diDiscussione, No. 429.
Gertler, M. and S. Gilchrist (1993), “The Role of Credit Market Imperfections in TheMonetary Transmission Mechanism: Arguments and Evidence,” ScandinavianJournal of Economics, Vol. 95, 1, pp. 43-64.
Guiso, L., A. K. Kashyap, F. Panetta and D. Terlizzese (2000), “Will a Common EuropeanMonetary Policy Have Asymmetric Effects?” Banca d’Italia, Temi di Discussione,No. 384.
Hall, B. H., B. Mulkay and J. Mairesse (2000), “Firm Level Investment and R&D in Franceand the United States: A Comparison,” NBER Working Paper No. 8038.
Hausman, J. (1978), “Specification Tests in Econometrics,” Econometrica, Vol. 46, 6, pp.1251-1271.
Herbst, A. F. (1974), “Some Empirical Evidence on the Determinants of Trade Credit at theIndustry Level of Aggregation,” Journal of Financial and Quantitative Analysis, Vol.9, 2, pp. 377-394.
Hubbard, R. G. (1998), “Capital-Market Imperfections and Investment,” Journal ofEconomic Literature, Vol. 36, 1, pp.193-225.
Jaffee, D. M. (1971), Credit Rationing and the Commercial Loan Market. New York, JohnWiley and Sons, Inc.
_________ and F. Modigliani (1969), “A Theory and Test of Credit Rationing,” AmericanEconomic Review, Vol. 59, 5, pp. 850-872.
Kashyap, A. K., O. A. Lamont and J. C. Stein (1994), “Credit Conditions and the CyclicalBehavior of Inventories,” Quarterly Journal of Economics, Vol. 109, 3, pp. 565-592.
Marotta, G. (1997), “Does Trade Credit Redistribution Thwart Monetary Policy? Evidencefrom Italy,” Applied Economics, 29, 12, pp.1619-1629.
_________ (1992), “L’allocazione del credito commerciale tra le imprese italiane,” PoliticaEconomica, Vol. 8, 3, pp. 245-275.
Meltzer, A. (1960), “Mercantile Credit, Monetary Policy, and the Size of Firms,” Review ofEconomics and Statistics, Vol. 42, 4, pp. 429-436.
Ng, C. H., J. K. Smith and R. L. Smith (1999), “Evidence on the Determinants of CreditTerms Used in Interfirm Trade,” Journal of Finance, Vol. 54, 3, pp. 1109-1129.
Nilsen, J. H. (2002), “Trade Credit and the Bank Lending Channel,” Journal of Money,Credit and Banking, Vol. 34, 1, pp. 226-253.

35
Omiccioli, M. (2004), “Il credito commerciale: problemi e teorie,” Banca d’Italia, Temi didiscussione, No. 495.
Oliner, S. and G. Rudebush (1996), “Monetary Policy and Credit Constraints: Evidence fromthe Composition of External Finance: Comment,” American Economic Review,Vol. 86, 1, pp. 300-309.
Petersen, M. A. and R. G. Rajan (1997), “Trade Credit: Theories and Evidence,” Review ofFinancial Studies, Vol. 10, 3, pp. 661-691.
Rajan, R. G. and L. Zingales (1995), “What Do We Know about Capital Structure? Evidencefrom International Data,” Journal of Finance, Vol. 50, 5, pp. 1421-1460.
Schwartz, R. A. and D. Withcomb (1979), “The Trade Credit Decision,” in J. Bicksler (ed.),Handbook of Financial Economics, North-Holland, Amsterdam.
Smith, J. (1987), “Trade Credit and Informational Asymmetry,” Journal of Finance, Vol. 42,4, pp. 863-869.

RECENTLY PUBLISHED “TEMI” (*)
No. 473 — Revisiting the implications of heterogeneity in financial market participation for theC-CAPM, by M. PAIELLA (June 2003).
No. 474 — Identifying the sources of local productivity growth, by F. CINGANO andF. SCHIVARDI (June 2003).
No. 475 — The Italian overnight market: microstructure effects, the martingale hypothesis andthe payment system, by E. BARUCCI, C. IMPENNA and R. RENÒ (June 2003).
No. 476 — Tests of seasonal integration and cointegration in multivariate unobservedcomponent models, by F. BUSETTI (June 2003).
No. 477 — La composizione familiare e l’imposta sul reddito delle persone fisiche: un’analisidegli effetti redistributivi e alcune considerazioni sul benessere sociale, byM.R. MARINO and C. RAPALLINI (June 2003).
No. 478 — Dealing with unexpected shocks to the budget, by E. GENNARI, R. GIORDANO andS. MOMIGLIANO (June 2003).
No. 479 — The effects of bank mergers on credit availability: evidence from corporate data,by E. BONACCORSI DI PATTI and G. GOBBI (June 2003).
No. 480 — Cost efficiency in the retail payment networks: first evidence from the Italian creditcard system, by G. ARDIZZI (June 2003).
No. 481 — Bank competition and firm creation, by E. BONACCORSI DI PATTI and G.
DELL’ARICCIA (June 2003).
No. 482 — La distribuzione del reddito e della ricchezza nelle regioni italiane, by L. CANNARI
and G. D’ALESSIO (June 2003).
No. 483 — Risk aversion, wealth and background risk, by L. GUISO and M. PAIELLA (September2003).
No. 484 — What is this thing called confidence? A comparative analysis of consumer indicesin eight major countries, by R. GOLINELLI and G. PARIGI (September 2003).
No. 485 — L’utilizzo degli indicatori compositi nell’analisi congiunturale territoriale:un’applicazione all’economia del Veneto, by P. CHIADES, M. GALLO and A.
VENTURINI (September 2003).
No. 486 — Bank capital and lending behaviour: empirical evidence for Italy, by L.
GAMBACORTA and P. E. MISTRULLI (September 2003).
No. 487 — A polarization of polarization? The distribution of inequality 1970-1996, byC. BIANCOTTI (March 2004).
No. 488 — Pitfalls of monetary policy under incomplete information: imprecise indicators andreal indeterminacy, by E. GAIOTTI (March 2004).
No. 489 — Information technology and productivity changes in the Italian banking industry,by L. CASOLARO and G. GOBBI (March 2004).
No. 490 — La bilancia dei pagamenti di parte corrente Nord-Sud (1998-2000), by L. CANNARI
and S. CHIRI (March 2004).
No. 491 — Investire in Italia? Risultati di una recente indagine empirica, by M. COMMITTERI
(March 2004).
No. 492 — Centralization of wage bargaining and the unemployment rate: revisiting thehump-shape hypothesis, by L. FORNI (June 2004).
No. 493 — Endogenous monetary policy with unobserved potential output, by A. CUKIERMAN
and F. LIPPI (June 2004).
No. 494 — Il credito commerciale: problemi e teorie, by M. OMICCIOLI (June 2004).
No. 495 — Condizioni di credito commerciale e differenziazione della clientela, by L.CANNARI, S. CHIRI and M. OMICCIOLI (June 2004).
No. 496 — Il debito commerciale in Italia: quanto contano le motivazioni finanziarie?, by P.FINALDI RUSSO and L. LEVA (June 2004).
No. 497 — Funzionamento della giustizia civile e struttura finanziaria delle imprese: il ruolodel credito commerciale, by A. CARMIGNANI (June 2004).
(*) Requests for copies should be sent to: Banca d’Italia – Servizio Studi – Divisione Biblioteca e pubblicazioni – Via Nazionale, 91 – 00184 Rome(fax 0039 06 47922059). They are available on the Internet at www.bancaditalia.it

"TEMI" LATER PUBLISHED ELSEWHERE
1999
L. GUISO and G. PARIGI, Investment and demand uncertainty, Quarterly Journal of Economics, Vol. 114(1), pp. 185-228, TD No. 289 (November 1996).
A. F. POZZOLO, Gli effetti della liberalizzazione valutaria sulle transazioni finanziarie dell’Italia conl’estero, Rivista di Politica Economica, Vol. 89 (3), pp. 45-76, TD No. 296 (February 1997).
A. CUKIERMAN and F. LIPPI, Central bank independence, centralization of wage bargaining, inflation andunemployment: theory and evidence, European Economic Review, Vol. 43 (7), pp. 1395-1434, TDNo. 332 (April 1998).
P. CASELLI and R. RINALDI, La politica fiscale nei paesi dell’Unione europea negli anni novanta, Studi enote di economia, (1), pp. 71-109, TD No. 334 (July 1998).
A. BRANDOLINI, The distribution of personal income in post-war Italy: Source description, data quality,and the time pattern of income inequality, Giornale degli economisti e Annali di economia, Vol. 58(2), pp. 183-239, TD No. 350 (April 1999).
L. GUISO, A. K. KASHYAP, F. PANETTA and D. TERLIZZESE, Will a common European monetary policyhave asymmetric effects?, Economic Perspectives, Federal Reserve Bank of Chicago, Vol. 23 (4),pp. 56-75, TD No. 384 (October 2000).
2000
P. ANGELINI, Are Banks Risk-Averse? Timing of the Operations in the Interbank Market, Journal ofMoney, Credit and Banking, Vol. 32 (1), pp. 54-73, TD No. 266 (April 1996)
F. DRUDI and R: GIORDANO, Default Risk and optimal debt management, Journal of Banking and Finance,Vol. 24 (6), pp. 861-892, TD No. 278 (September 1996).
F. DRUDI and R. GIORDANO, Wage indexation, employment and inflation, Scandinavian Journal ofEconomics, Vol. 102 (4), pp. 645-668, TD No. 292 (December 1996).
F. DRUDI and A. PRATI, Signaling fiscal regime sustainability, European Economic Review, Vol. 44 (10),pp. 1897-1930, TD No. 335 (September 1998).
F. FORNARI and R. VIOLI, The probability density function of interest rates implied in the price of options,in: R. Violi, (ed.) , Mercati dei derivati, controllo monetario e stabilità finanziaria, Il Mulino,Bologna, TD No. 339 (October 1998).
D. J. MARCHETTI and G. PARIGI, Energy consumption, survey data and the prediction of industrialproduction in Italy, Journal of Forecasting, Vol. 19 (5), pp. 419-440, TD No. 342 (December1998).
A. BAFFIGI, M. PAGNINI and F. QUINTILIANI, Localismo bancario e distretti industriali: assetto dei mercatidel credito e finanziamento degli investimenti, in: L.F. Signorini (ed.), Lo sviluppo locale:un'indagine della Banca d'Italia sui distretti industriali, Donzelli, TD No. 347 (March 1999).
A. SCALIA and V. VACCA, Does market transparency matter? A case study, in: Market Liquidity: ResearchFindings and Selected Policy Implications, Basel, Bank for International Settlements, TD No. 359(October 1999).
F. SCHIVARDI, Rigidità nel mercato del lavoro, disoccupazione e crescita, Giornale degli economisti eAnnali di economia, Vol. 59 (1), pp. 117-143, TD No. 364 (December 1999).
G. BODO, R. GOLINELLI and G. PARIGI, Forecasting industrial production in the euro area, EmpiricalEconomics, Vol. 25 (4), pp. 541-561, TD No. 370 (March 2000).
F. ALTISSIMO, D. J. MARCHETTI and G. P. ONETO, The Italian business cycle: Coincident and leadingindicators and some stylized facts, Giornale degli economisti e Annali di economia, Vol. 60 (2), pp.147-220, TD No. 377 (October 2000).
C. MICHELACCI and P. ZAFFARONI, (Fractional) Beta convergence, Journal of Monetary Economics, Vol.45, pp. 129-153, TD No. 383 (October 2000).

R. DE BONIS and A. FERRANDO, The Italian banking structure in the nineties: testing the multimarketcontact hypothesis, Economic Notes, Vol. 29 (2), pp. 215-241, TD No. 387 (October 2000).
2001
M. CARUSO, Stock prices and money velocity: A multi-country analysis, Empirical Economics, Vol. 26(4), pp. 651-72, TD No. 264 (February 1996).
P. CIPOLLONE and D. J. MARCHETTI, Bottlenecks and limits to growth: A multisectoral analysis of Italianindustry, Journal of Policy Modeling, Vol. 23 (6), pp. 601-620, TD No. 314 (August 1997).
P. CASELLI, Fiscal consolidations under fixed exchange rates, European Economic Review, Vol. 45 (3),pp. 425-450, TD No. 336 (October 1998).
F. ALTISSIMO and G. L. VIOLANTE, Nonlinear VAR: Some theory and an application to US GNP andunemployment, Journal of Applied Econometrics, Vol. 16 (4), pp. 461-486, TD No. 338 (October1998).
F. NUCCI and A. F. POZZOLO, Investment and the exchange rate, European Economic Review, Vol. 45 (2),pp. 259-283, TD No. 344 (December 1998).
L. GAMBACORTA, On the institutional design of the European monetary union: Conservatism, stabilitypact and economic shocks, Economic Notes, Vol. 30 (1), pp. 109-143, TD No. 356 (June 1999).
P. FINALDI RUSSO and P. ROSSI, Credit costraints in italian industrial districts, Applied Economics, Vol.33 (11), pp. 1469-1477, TD No. 360 (December 1999).
A. CUKIERMAN and F. LIPPI, Labor markets and monetary union: A strategic analysis, Economic Journal,Vol. 111 (473), pp. 541-565, TD No. 365 (February 2000).
G. PARIGI and S. SIVIERO, An investment-function-based measure of capacity utilisation, potential outputand utilised capacity in the Bank of Italy’s quarterly model, Economic Modelling, Vol. 18 (4), pp.525-550, TD No. 367 (February 2000).
F. BALASSONE and D. MONACELLI, Emu fiscal rules: Is there a gap?, in: M. Bordignon and D. Da Empoli(eds.), Politica fiscale, flessibilità dei mercati e crescita, Milano, Franco Angeli, TD No. 375 (July2000).
A. B. ATKINSON and A. BRANDOLINI, Promise and pitfalls in the use of “secondary" data-sets: Incomeinequality in OECD countries, Journal of Economic Literature, Vol. 39 (3), pp. 771-799, TD No.379 (October 2000).
D. FOCARELLI and A. F. POZZOLO, The determinants of cross-border bank shareholdings: An analysis withbank-level data from OECD countries, Journal of Banking and Finance, Vol. 25 (12), pp. 2305-2337, TD No. 381 (October 2000).
M. SBRACIA and A. ZAGHINI, Expectations and information in second generation currency crises models,Economic Modelling, Vol. 18 (2), pp. 203-222, TD No. 391 (December 2000).
F. FORNARI and A. MELE, Recovering the probability density function of asset prices using GARCH asdiffusion approximations, Journal of Empirical Finance, Vol. 8 (1), pp. 83-110, TD No. 396(February 2001).
P. CIPOLLONE, La convergenza dei salari manifatturieri in Europa, Politica economica, Vol. 17 (1), pp.97-125, TD No. 398 (February 2001).
E. BONACCORSI DI PATTI and G. GOBBI, The changing structure of local credit markets: Are smallbusinesses special?, Journal of Banking and Finance, Vol. 25 (12), pp. 2209-2237, TD No. 404(June 2001).
G. MESSINA, Decentramento fiscale e perequazione regionale. Efficienza e redistribuzione nel nuovosistema di finanziamento delle regioni a statuto ordinario, Studi economici, Vol. 56 (73), pp. 131-148, TD No. 416 (August 2001).

2002
R. CESARI and F. PANETTA, Style, fees and performance of Italian equity funds, Journal of Banking andFinance, Vol. 26 (1), TD No. 325 (January 1998).
C. GIANNINI, “Enemy of none but a common friend of all”? An international perspective on the lender-of-last-resort function, Essay in International Finance, Vol. 214, Princeton, N. J., Princeton UniversityPress, TD No. 341 (December 1998).
A. ZAGHINI, Fiscal adjustments and economic performing: A comparative study, Applied Economics, Vol.33 (5), pp. 613-624, TD No. 355 (June 1999).
F. ALTISSIMO, S. SIVIERO and D. TERLIZZESE, How deep are the deep parameters?, Annales d’Economie etde Statistique,.(67/68), pp. 207-226, TD No. 354 (June 1999).
F. FORNARI, C. MONTICELLI, M. PERICOLI and M. TIVEGNA, The impact of news on the exchange rate ofthe lira and long-term interest rates, Economic Modelling, Vol. 19 (4), pp. 611-639, TD No. 358(October 1999).
D. FOCARELLI, F. PANETTA and C. SALLEO, Why do banks merge?, Journal of Money, Credit and Banking,Vol. 34 (4), pp. 1047-1066, TD No. 361 (December 1999).
D. J. MARCHETTI, Markup and the business cycle: Evidence from Italian manufacturing branches, OpenEconomies Review, Vol. 13 (1), pp. 87-103, TD No. 362 (December 1999).
F. BUSETTI, Testing for stochastic trends in series with structural breaks, Journal of Forecasting, Vol. 21(2), pp. 81-105, TD No. 385 (October 2000).
F. LIPPI, Revisiting the Case for a Populist Central Banker, European Economic Review, Vol. 46 (3), pp.601-612, TD No. 386 (October 2000).
F. PANETTA, The stability of the relation between the stock market and macroeconomic forces, EconomicNotes, Vol. 31 (3), TD No. 393 (February 2001).
G. GRANDE and L. VENTURA, Labor income and risky assets under market incompleteness: Evidence fromItalian data, Journal of Banking and Finance, Vol. 26 (2-3), pp. 597-620, TD No. 399 (March2001).
A. BRANDOLINI, P. CIPOLLONE and P. SESTITO, Earnings dispersion, low pay and household poverty inItaly, 1977-1998, in D. Cohen, T. Piketty and G. Saint-Paul (eds.), The Economics of RisingInequalities, pp. 225-264, Oxford, Oxford University Press, TD No. 427 (November 2001).
L. CANNARI and G. D’ALESSIO, La distribuzione del reddito e della ricchezza nelle regioni italiane, RivistaEconomica del Mezzogiorno (Trimestrale della SVIMEZ), Vol. XVI(4), pp. 809-847, Il Mulino,TD No. 482 (June 2003).
2003
F. SCHIVARDI, Reallocation and learning over the business cycle, European Economic Review, , Vol. 47(1), pp. 95-111, TD No. 345 (December 1998).
P. CASELLI, P. PAGANO and F. SCHIVARDI, Uncertainty and slowdown of capital accumulation in Europe,Applied Economics, Vol. 35 (1), pp. 79-89, TD No. 372 (March 2000).
P. PAGANO and G. FERRAGUTO, Endogenous growth with intertemporally dependent preferences,Contribution to Macroeconomics, Vol. 3 (1), pp. 1-38, TD No. 382 (October 2000).
P. PAGANO and F. SCHIVARDI, Firm size distribution and growth, Scandinavian Journal of Economics, Vol.105(2), pp. 255-274, TD No. 394 (February 2001).
M. PERICOLI and M. SBRACIA, A Primer on Financial Contagion, Journal of Economic Surveys, TD No.407 (June 2001).
M. SBRACIA and A. ZAGHINI, The role of the banking system in the international transmission of shocks,World Economy, TD No. 409 (June 2001).
E. GAIOTTI and A. GENERALE, Does monetary policy have asymmetric effects? A look at the investmentdecisions of Italian firms, Giornale degli Economisti e Annali di Economia, Vol. 61 (1), pp. 29-59,

TD No. 429 (December 2001).
F. SPADAFORA, Financial crises, moral hazard and the speciality of the international market: furtherevidence from the pricing of syndicated bank loans to emerging markets, Emerging MarketsReview, Vol. 4 ( 2), pp. 167-198, TD No. 438 (March 2002).
D. FOCARELLI and F. PANETTA, Are mergers beneficial to consumers? Evidence from the market for bankdeposits, American Economic Review, Vol. 93 (4), pp. 1152-1172, TD No. 448 (July 2002).
E.VIVIANO, Un'analisi critica delle definizioni di disoccupazione e partecipazione in Italia, PoliticaEconomica, Vol. 19 (1), pp. 161-190, TD No. 450 (July 2002).
FORTHCOMING
A. F. POZZOLO, Research and development regional spillovers, and the localisation of economic activities,The Manchester School, TD No. 331 (March 1998).
L. GAMBACORTA, Asymmetric bank lending channels and ECB monetary policy, Economic Modelling, TDNo. 340 (October 1998).
F. LIPPI, Strategic monetary policy with non-atomistic wage-setters, Review of Economic Studies, TD No.374 (June 2000).
P. ANGELINI and N. CETORELLI, Bank competition and regulatory reform: The case of the Italian bankingindustry, Journal of Money, Credit and Banking, TD No. 380 (October 2000).
P. CHIADES and L. GAMBACORTA, The Bernanke and Blinder model in an open economy: The Italian case,German Economic Review, TD No. 388 (December 2000).
L. DEDOLA AND F. LIPPI, The Monetary Transmission Mechanism: Evidence from the industry Data of FiveOECD Countries, European Economic Review, TD No. 389 (December 2000).
D. J. MARCHETTI and F. NUCCI, Unobserved Factor Utilization, Technology Shocks and Business Cycles,Price Stickiness and the Contractionary Effects of Technology Shocks, TD No. 392 (February2001).
G. CORSETTI, M. PERICOLI and M. SBRACIA, Correlation analysis of financial contagion: what one shouldknow before running a test, Journal of International Money and Finance, TD No. 408 (June 2001).
L. GAMBACORTA, The Italian banking system and monetary policy transmission: Evidence from bank leveldata, in: I. Angeloni, A. Kashyap and B. Mojon (eds.), Monetary Policy Transmission in the EuroArea, Cambridge, Cambridge University Press, TD No. 430 (December 2001).
M. EHRMANN, L. GAMBACORTA, J. MARTÍNEZ PAGÉS, P. SEVESTRE and A. WORMS, Financial systems andthe role of banks in monetary policy transmission in the euro area, in: I. Angeloni, A. Kashyap andB. Mojon (eds.), Monetary Policy Transmission in the Euro Area, Cambridge, CambridgeUniversity Press. TD No. 432 (December 2001).
D. FOCARELLI, Bootstrap bias-correction procedure in estimating long-run relationships from dynamicpanels, with an application to money demand in the euro area, Economic Modelling, TD No. 440(March 2002).
A. BAFFIGI, R. GOLINELLI and G. PARIGI, Bridge models to forecast the euro area GDP, InternationalJournal of Forecasting, TD No. 456 (December 2002).
F. BUSETTI and A. M. ROBERT TAYLOR, Testing against stochastic trend and seasonality in the presence ofunattended breaks and unit roots, Journal of Econometrics, TD No. 470 (February 2003).
E. BARUCCI, C. IMPENNA and R. RENÒ, Monetary integration, markets and regulation, Research inBanking and Finance, TD NO. 475 (JUNE 2003).
G. ARDIZZI, Cost efficiency in the retail payment networks:first evidence from the Italian credit cardsystem, Rivista di Politica Economica, TD NO. 480 (JUNE 2003).