
by ALEC C. TEFERTILLER
150
YOUR FRIENDS LIKE OUR BRAND: SOCIAL IMPACT, CAPITAL, AND CONNECTIONS IN SOCIAL MEDIA ADVERTISING by ALEC C. TEFERTILLER A DISSERTATION Presented to the School of Journalism and Communication and the Graduate School of the University of Oregon in partial fulfillment of the requirements for the degree of Doctor of Philosophy September 2017
Transcript of by ALEC C. TEFERTILLER
YOUR FRIENDS LIKE OUR BRAND: SOCIAL IMPACT, CAPITAL, AND
CONNECTIONS IN SOCIAL MEDIA ADVERTISING
by
ALEC C. TEFERTILLER
A DISSERTATION
Presented to the School of Journalism and Communication
and the Graduate School of the University of Oregon in partial fulfillment of the requirements
for the degree of Doctor of Philosophy
September 2017

ii
DISSERTATION APPROVAL PAGE Student: Alec C. Tefertiller Title: Your Friends Like Our Brand: Social Impact, Capital, and Connections in Social Media Advertising This dissertation has been accepted and approved in partial fulfillment of the requirements for the Doctor of Philosophy degree in the School of Journalism and Communication by: Kim Sheehan Chairperson Nicole Dahmen Core Member Autumn Shafer Core Member Troy Campbell Institutional Representative and Sara D. Hodges Interim Vice Provost and Dean of the Graduate School Original approval signatures are on file with the University of Oregon Graduate School. Degree awarded September 2017

iii
© 2017 Alec C. Tefertiller
iv
DISSERTATION ABSTRACT Alec C. Tefertiller Doctor of Philosophy School of Journalism and Communication September 2017 Title: Your Friends Like Our Brand: Social Impact, Capital, and Connections in Social
Media Advertising
Social media networks such as Facebook enable advertisers to embed social
connection information within advertisements. The purpose of this study was to better
understand how social cues in social media advertising contribute to consumers’ brand
attitudes and purchase intentions. Two theoretical constructs guided the study: social
impact theory and social capital theory. Social impact theory suggests that the number,
relational strength, and immediacy of individuals exerting social influence determine its
effectiveness. Social capital theory posits that our social networks are a product of the
relational capital we have invested in them, with two forms of social capital: bonding and
bridging. Bonding is associated with our intimate, “strong ties,” and bridging is
associated with our larger circle of acquaintances, or “weak ties.” Using an experiment
(N = 211), it was determined that while social context cues included in social media
advertisements did influence brand attitudes, the strength and intensity of cues did not
have an effect. Furthermore, bridging, strong-tie social capital positively moderated the
relation between advertisement attitude and social media sharing of the advertisement as
well as the relation between brand attitude and purchase intentions.

v
CURRICULUM VITAE NAME OF AUTHOR: Alec C. Tefertiller GRADUATE AND UNDERGRADUATE SCHOOLS ATTENDED: University of Oregon, Eugene University of Houston Florida State University, Tallahassee DEGREES AWARDED: Doctor of Philosophy, Media Studies, 2017, University of Oregon Master of Arts, Communication – Mass Communication Studies, 2014, University of Houston Bachelor of Fine Arts, Motion Picture, Television, and Recording Arts, 2000, Florida State University AREAS OF SPECIAL INTEREST: New Media Technology Marketing and Social Psychology PROFESSIONAL EXPERIENCE: Graduate Employee, School of Journalism and Communication, University of Oregon, 2014-2017 Teaching Assistant, Jack J. Valenti School of Communication, University of Houston, 2012-2014 Sole Proprietor, Deep Dish Studios, 2010-2014 Strategic Partner, Acumen Web Solutions, 2011-2012 Director of Technology, SchoolHeart, Inc., 2007-2010 Summer Film Coordinator, Rocketown, 2006 Media and Resource Coordinator, Campus Renewal Ministries, 2004-2005

vi
Information Resource Coordinator and Admissions Officer, Office of Admissions and Records, Florida State University, 2000-2003 GRANTS, AWARDS, AND HONORS:
Guido Stempel Award, Top Student Paper, Graduate Student Interest Group, Association for Education in Journalism and Mass Communication, 2016
First Place Paper, Public Relations Teaching Division, Association for Education
in Journalism and Mass Communication, 2016 Second Place Faculty Paper, Mass Communication & Society Division,
Association for Education in Journalism and Mass Communication, 2016 Graduate Teaching Fellowship, School of Journalism and Communication,
University of Oregon, 2014-2017 Columbia Scholarship, School of Journalism and Communication, University of
Oregon, 2014-2017 Doctoral Student Teaching Fellowship, Jack J. Valenti School of Communication,
University of Houston, 2012-2014 Magna Cum Laude, School of Motion Picture, Television, and Recording Arts,
Florida State University, 2000 PUBLICATIONS:
Tefertiller, A.C. (in press). Media substitution in cable cord-cutting: The adoption of web-streaming television. Journal of Broadcasting & Electronic Media.
Tatone, J., Gallicano, T.D., & Tefertiller, A.C. (2017). I love tweeting in class,
but … A qualitative study of student perceptions of the impact of Twitter in large lecture classes. Journal of Public Relations Education, 3(1), 1-13.
Pittman, M. & Tefertiller, A.C. (2015). With or without you: Connected viewing
and co-viewing Twitter activity for traditional appointment and asynchronous broadcast models. First Monday, 20(7).

vii
ACKNOWLEDGMENTS It goes without saying that this dissertation would not be possible without the
contributions of my outstanding committee: Nicole Dahmen, Autumn Shafer, Troy
Campbell, and Kim Sheehan. Beyond asking tough questions and helping me come up
with great solutions to the particular challenges of this experiment, they kept me sane
throughout the process. Special thanks are in order for Troy Campbell for allowing me to
access the Marketing Research Pool, and to Autumn Shafer and Kyle McDaniel for
allowing me to access student participants in their classes. I am most grateful for the
mentorship, guidance, instruction, emotional support, and friendship of my advisor and
committee chair, Dr. Sheehan. I thank God every day that you were my guide for this
journey. It has been an honor.
None of this would have happened without the support of my family, especially
my parents, who are always good for needed advice, merry maid service, meals on
wheels, and some quality proofreading. Of course, the true hero is my wonderful wife,
Bethany. She was strong when I didn’t have anything left in the tank. I could not have
survived this journey – literally – without her by my side. I’ll save the biggest thank you
for McKenzie, who gets credit for being cute, curious, and courageous, and for being a
good sleeper at a time when sleep was a precious and valued commodity.
Finally, I must acknowledge the indirect assistance of Caffeine Free Diet Pepsi,
Netflix, the Villard Boys, and UNC.

viii
For Bethany and McKenzie

ix
TABLE OF CONTENTS
Chapter Page I. INTRODUCTION ................................................................................................... 1
II. REVIEW OF LITERATURE ................................................................................. 7
Social Influence, Social Norms, and Reciprocity ................................................. 7
Social Impact Theory ............................................................................................ 10
Social Impact in Online Networks .................................................................. 14
Social Capital ........................................................................................................ 19
Social Capital and Media Use ......................................................................... 21
Uses and Gratifications and Social Capital ............................................... 22
Social Capital in Online Networks ................................................................. 26
Facebook and Social Capital ..................................................................... 28
Attitudes, Advertising, and Brands ....................................................................... 31
Social Norms ................................................................................................... 34
Hypotheses and Research Questions .................................................................... 35
Conclusion ............................................................................................................ 38
III. METHODOLOGY ............................................................................................... 39
Participants ............................................................................................................ 40
Procedure .............................................................................................................. 42
Pretest .................................................................................................................... 44
Measures ............................................................................................................... 47
x
Chapter Page
Conclusion ............................................................................................................ 50
IV. RESULTS ............................................................................................................. 51
Data Analysis ........................................................................................................ 51
Sample ................................................................................................................... 52
Measures ............................................................................................................... 54
Social Impact ........................................................................................................ 56
Advertising, Brand, and Purchase Attitudes ......................................................... 59
Social Capital ........................................................................................................ 63
Conclusion ............................................................................................................ 65
V. DISCUSSION ........................................................................................................ 67
Theoretical Implications ....................................................................................... 67
Social Impact .................................................................................................. 67
Social Capital .................................................................................................. 72
Conclusion ............................................................................................................ 77
VI. CONCLUSION ..................................................................................................... 78
Implications for Practice ....................................................................................... 78
Implications for Facebook .............................................................................. 81
Limitations and Future Research .......................................................................... 82
Conclusion ............................................................................................................ 86

xi
Chapter Page
APPENDICES ............................................................................................................ 87
A. FIGURES ......................................................................................................... 87
B. TABLES ........................................................................................................... 99
C. STUDY MEASURES ...................................................................................... 119
REFERENCES CITED ............................................................................................... 123

xii
LIST OF FIGURES Figure Page 2.1. Conceptual model presenting hypothesized relations between exposure to social media advertising with social cues, brand attitude, social media sharing intention, and purchase intention. ........................................................................ 87
3.1. Sample of experimental stimulus with high tie strength, high number social context cue. .......................................................................................................... 88 3.2. Sample of experimental stimulus with high tie strength, low number social context cue. .......................................................................................................... 89 3.3. Sample of experimental stimulus with low tie strength, high number social context cue. .......................................................................................................... 90 3.4. Sample of experimental stimulus with low tie strength, low number social context cue. .......................................................................................................... 91 3.5. Sample of experimental stimulus control, which contains no social context cue. ....................................................................................................................... 92 4.1. Graph depicting the mean difference of brand attitude between those viewing a Facebook advertisement with a social context cue and those viewing a Facebook advertisement with no social context cue. ........................................... 93 4.2. Graph depicting the mean difference of brand attitude between each experimental condition including the control condition. ..................................... 94 4.3. Graph depicting the interaction between tie strength, tie number, and Facebook intensity predicting Brand Attitude. ..................................................................... 95 4.4. Graph depicting conditional effects of brand attitude on purchase intention at different levels of bridging social capital. ............................................................ 96 4.5. Graph depicting conditional effects of advertisement attitude on advertisement social sharing at different levels of bridging social capital. ................................. 97 4.6. Model presenting supported hypothesized relations between exposure to social media advertising with social cues, brand attitude, social media sharing intention, and purchase intention. ........................................................................ 98

xiii
LIST OF TABLES Table Page 3.1. Stimulus Videos from the Pretest ........................................................................ 99 3.2. Results of Social Sharing Scales for Pretest Stimulus Videos ............................. 101 4.1. Demographic Breakdown of Study Participants .................................................. 102 4.2. Univariate Outliers by Variable ........................................................................... 103 4.3. Descriptive Statistics for Measured Variables and Items .................................... 104 4.4. Factor Analysis for Advertisement Social Sharing Intention .............................. 106
4.5. Summary of Hierarchical Regression of Main and Interaction Effects of Social Impact Variables Predicting Brand Attitude ........................................................ 107 4.6. Pearson Correlations of Independent and Dependent Variables .......................... 108 4.7. Summary of Hierarchical Regression of Advertisement Attitude Predicting Brand Attitude ...................................................................................................... 109 4.8. Summary of Hierarchical Regression of Advertisement Attitude Predicting Advertisement Social Sharing .............................................................................. 110 4.9. Summary of Hierarchical Regression of Brand Attitude Predicting Purchase Intention ............................................................................................................... 111 4.10. Summary of Regression of Brand Attitude Predicting Purchase Intention Moderated by Bridging Social Capital .............................................................. 112 4.11. Conditional Effects of Brand Attitude on Purchase Intention Moderated by Bridging Social Capital ...................................................................................... 113 4.12. Summary of Regression of Advertisement Attitude Predicting Advertisement Social Sharing Moderated by Bridging Social Capital ...................................... 114 4.13. Conditional Effects of Advertisement Attitude on Advertisement Social Sharing Moderated by Bridging Social Capital ................................................. 115 4.14. Summary of Regression of Social Impact Predicting Brand Attitude Moderated by Bridging Social Capital .............................................................. 116
xiv
Table Page 4.15. Summary of Regression of Advertisement Attitude Predicting Brand Attitude Moderated by Bridging Social Capital .............................................................. 117 4.16. Hypotheses and Research Question Conclusions .............................................. 118

1
CHAPTER I
INTRODUCTION
By 2017 it is expected that advertising revenue through digital channels will
exceed advertising revenue generated by television (“Digital ad spending to surpass TV
next year,” 2016); digital advertising is expected to represent 38.4% of total ad revenue,
while television revenue is expected to represent 35.8% of revenue. By 2020, it is
expected that for the first time in the U.S., television revenue will constitute less than a
third of all advertising revenue. Key to the rise of digital advertising is the emergence of
social media advertising. It is estimated that social media generated over 32 billion
dollars in 2016, up from 17.85 billion in 2014 (“Social network ad revenues accelerate
worldwide,” 2015). Furthermore, the social network Facebook is estimated to have taken
64.8% of that revenue in 2015. In 2016, Facebook generated $26.88 billion in advertising
revenue, which represents a 57% increase in total annual revenue (Chandrasekhar, 2017).
Facebook’s display advertising revenue is expected to increase by 32.1% in 2017. Both
Facebook and Google are expected to combine to generate over $106 billion in
advertising revenue in 2017, which will equate to approximately 46.4% of all digital
advertising revenue in 2017 (Handley, 2017).
Founded as a college-exclusive social network in 2004, Facebook initially offered
advertising in the form of $10 to $40 “flyers” that campus groups or local businesses
could use to advertise events and deals to their campus community (Toner, 2013). While
certain corporations such as Apple, Victoria’s Secret, and Microsoft had marketing and
advertising deals with Facebook, it was not until the end of 2007 that Facebook
introduced their own advertising platform that was widely and freely accessible to

2
businesses and organizations across the United States. In November of 2007, Facebook
rolled out their advertising platform along with their new “Pages” feature. Pages allowed
businesses and organizations to create an online profile much like the profiles used by
individuals, with the promise of fueling online engagement and the viral spread of brand
content. Facebook’s hope was that participating brands would also utilize Facebook’s
advertising features (Toner, 2013). In 2009, Facebook made significant improvements to
their advertisement targeting, allowing marketers to target Facebook users by location
and social connections, in addition to allowing marketers to target audiences based on
demographic and interest information shared through individual profiles (Kessler, 2011).
The promise of Facebook’s network for advertisers and marketers is its ability to
provide rich data about brand customers as well as general insights about consumers. In
addition, it gives brands a direct channel of communication with customers who are able
to share brand content with their own social network, creating the potential for the viral
spread of content. While traditional media, such as television, magazines, and
newspapers, are limited in their ability to accurately define and segment their audience,
depending largely on probability methods and general purchase data, Facebook can
provide detailed information about its followers within the network, including supporters’
demographic data, interests, and social activity. In addition, Facebook users are able to
create content in support of brand messaging to share with their larger network. Facebook
users can click a “like” button that indicates their support of a Facebook message to their
network. They can also click a button to “share” the brand message with their network,
and they can interact with the content directly through comments. Facebook’s advertising

3
innovations have capitalized on the potential afforded by the data provided by its users as
well as their robust network of social connections.
However, helping brands create direct, consumer-to-consumer social sharing has
not been the only focus of Facebook’s advertising channel. In fact, Facebook has also
been interested in allowing brands to harvest consumer social activity itself, specifically
information about users who have “liked” or followed their brand, and use it to exert
social influence as a part of its brand advertisements. For instance, along with its Pages
feature, Facebook rolled out its “Beacons” feature in 2007. Beacons allowed brands to
post updates to users’ Facebook profile when users interacted with their brand website or
applications. The purpose of this feature was to allow brands to leverage the power of
social influence by generating word-of-mouth on behalf of consumers based on their
online behavior rather than a specific message created by the consumers, themselves.
However, this feature was discontinued in 2009 after a class action lawsuit was filed by
privacy advocates (Kessler, 2011).
After the end of Beacons, Facebook altered its course and rolled out its
“Sponsored Stories” feature in 2011. While Beacons allowed brands to post to users’
Facebook profiles when the user interacted with the brand’s external website or
application, Sponsored Stories allowed brands to turn a social action that took place
within Facebook’s network into an advertisement shared with a user’s network of
Facebook connection, known as Facebook “friends.” For instance, if a user “liked” a
brand page or status update, or posted a message on the brand’s Facebook newsfeed, the
brand could then post that action as an advertisement to be seen by the user’s Facebook
friends. As with Beacons, Sponsored Stories faced a similar legal challenge in 2013, and
4
it was discontinued by Facebook in early 2014 (Hendricks, 2014). However, while
Facebook no longer allowed brands to create stories based on user actions, it continued to
allow brands to include social context along with their advertisements. Facebook defines
social context as “stories about social actions your friends have taken, such as liking a
page or checking in to a restaurant” (“An update to Facebook ads,” 2014).
For example, a brand such as Nike has decided to advertise a new line of running
shoes. Using Facebook’s system, they target their ad to a particular age and gender
demographic, and they narrow their search to those who have expressed an interest in
outdoor activities and recreational running. They design an advertisement set to display
their new shoes on select users’ Facebook walls. In addition to the visual advertisement, a
button encouraging users to “like” the advertisement or get more information via an
external link is included. Finally, along the top of the advertisement is specific
information about which other Facebook users in the targeted user’s network have a
relation to Nike via a “like.” This is the social context element, and it is personalized for
each user. As a part of the advertisement, users are shown information, specific to them,
about who in their Facebook network likes the brand.
Facebook’s commitment to social context in advertising demonstrates its regard
for mediated social influence as a driver of advertising engagement. Facebook’s own
research suggests that increasing the number of social cues as well as the relational
strength of those cues leads to more advertising clicks and increased engagement with
brands through “likes” (Bakshy, Eckles, Yan, & Rosenn, 2012). However, there is a
dearth of research examining the specific forces that create social influence through
social context cues in social media advertising and how it relates to the perceived

5
relationships that constitute the interpersonal component of social media networks. In
addition, while Facebook’s field research suggests social cues impact Facebook specific
behaviors, such as clicks, it does not address how social influence manifested in social
media advertising impacts brand attitudes and brand behaviors, specifically purchase
intentions. It also fails to address how the strength of social networks, and the perceived
relationships that constitute the networks, impact social sharing and brand attitudes
associated with social advertisements. As such, more research is needed to better
understand how social impact is created through social context cues, and how the
perceived make-up of an individual’s social network determines the individual’s attitude
towards advertised brands and subsequent purchase intentions. As part of the promise of
Facebook for brands lies in its ability to facilitate the viral spread of brand messages, it is
also worth understanding how advertising attitudes and social forces determine the
sharing of brand messages.
One type of advertisement that has received particular attention for its ability to
generate positive consumer outcomes, as well as a high volume of social media sharing
activity, is the online viral video (e.g. Huang, Su, Zhou, & Liu, 2013). Unlike traditional
mass media video advertising, viral video content “is delivered in an interactive, Web-
based environment characterized by viewer pull and control rather than sponsor push”
(Huang et al., 2013, p. 36). According to the Web Video Marketing Council (2015), 73%
of businesses utilizing online video report video has positively impacted marketing
results, and 80% are using online video to increase brand awareness and engagement. In
regard to Facebook video, between April and November of 2015, the average daily views
of video doubled from 4 billion to 8 billion (Mawhinney, 2016).

6
The purpose of this dissertation is to better understand how social context cues in
Facebook advertisements – specifically viral video advertisements – influence brand
attitudes, social sharing, and purchase intentions. Two theoretical constructs that have
been utilized to better understand social processes are social impact theory (Latané, 1981)
and the concept of social capital (Bourdieu & Wacquant, 1992; Putnam, 2000). Utilizing
an experimental approach, this study seeks to understand how social cues in Facebook
advertisements exert normative social impact on brand attitudes and purchase intentions.
In addition, the impact of online social capital on brand attitudes and social sharing
intentions will be explored. This study will attempt to illuminate the relations between
specific forces of social impact and how they influence brand attitudes and behaviors. In
addition, this study will help clarify the role perceived social capital invested in
Facebook’s network plays in determining brand attitudes and behaviors, including social
sharing. For marketers and social media designers, it is of interest to understand not only
how social context cues influence consumer attitudes and behaviors, but also how the
make-up of their networks moderates these relations. This will help advertisers develop
more accurate, effective methods of social advertising using social context cues, for the
benefit of both advertisers and the consumers whose time and energy is invested in social
networks. Theoretically, this study will contribute to the body of literature devoted to
social influence manifested in social media networks. Specifically, this study will help
clarify how social capital is created and utilized in social media, and it will add to the
growing body of literature directed at understanding how social influence guides
behaviors in an online context.
7
CHAPTER II
REVIEW OF LITERATURE
The following review of literature will conceptualize social influence, normative
influence, and norms of reciprocity based on social psychology, sociological, marketing,
and economic literature, which will lead to a discussion of social impact theory, including
social impact in online contexts. Next, social capital theory will be introduced and
discussed, including an examination of social capital created and maintained in mediated
contexts. Following the discussion of social capital, research related to advertising
acceptance and brand attitudes will be explored, with implications for social cues and
social norms discussed. Finally, based on the literature, specific hypotheses and research
questions will be proposed.
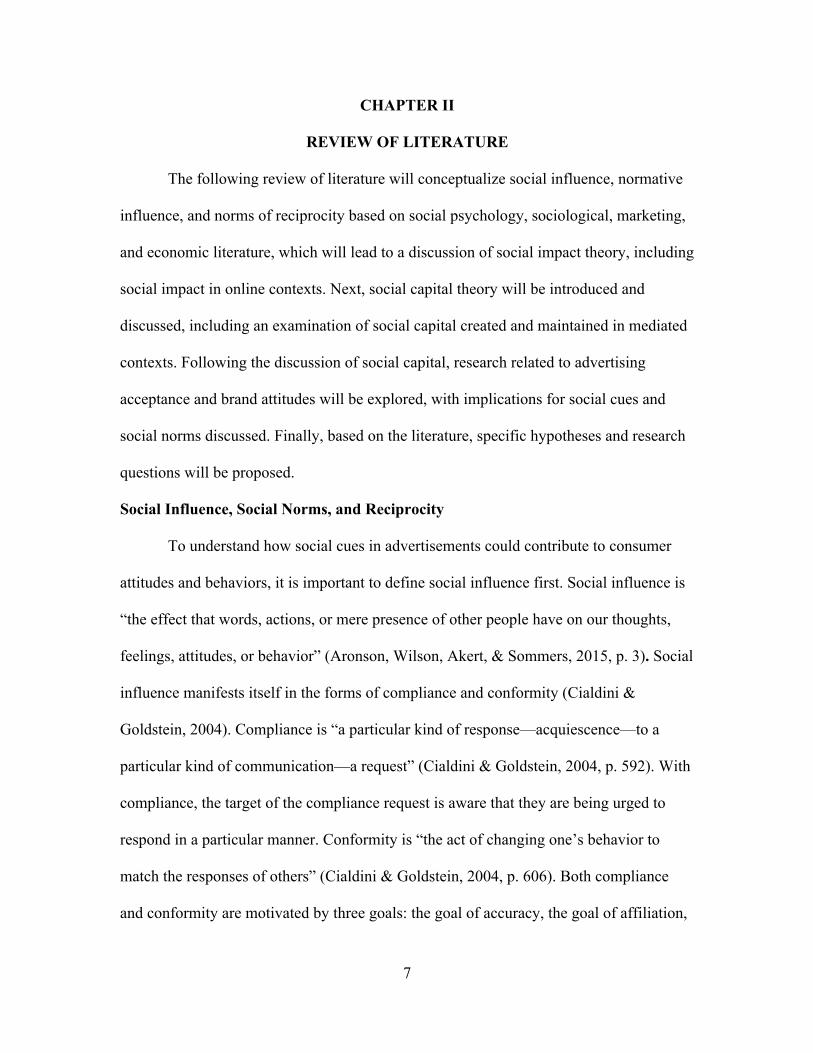
Social Influence, Social Norms, and Reciprocity
To understand how social cues in advertisements could contribute to consumer
attitudes and behaviors, it is important to define social influence first. Social influence is
“the effect that words, actions, or mere presence of other people have on our thoughts,
feelings, attitudes, or behavior” (Aronson, Wilson, Akert, & Sommers, 2015, p. 3). Social
influence manifests itself in the forms of compliance and conformity (Cialdini &
Goldstein, 2004). Compliance is “a particular kind of response—acquiescence—to a
particular kind of communication—a request” (Cialdini & Goldstein, 2004, p. 592). With
compliance, the target of the compliance request is aware that they are being urged to
respond in a particular manner. Conformity is “the act of changing one’s behavior to
match the responses of others” (Cialdini & Goldstein, 2004, p. 606). Both compliance
and conformity are motivated by three goals: the goal of accuracy, the goal of affiliation,

8
and the goal of maintaining a positive self-concept. Individuals seek to be accurate in
their actions, attaining goals in the most efficient and effective manor possible.
Individuals also seek affiliation by forming and maintaining relationships with others.
Finally, individuals seek to maintain a positive self-concept of themselves and their
behaviors.
A key social force that drives compliance and conformity by helping individuals
meet these goals is social normative influence (Cialdini & Trost, 1998). Social norms are
the “rules and standards that are understood by members of a group, and that guide and/or
constrain social behavior without the force of laws” (Cialdini & Trost, 1998, p. 152).
Normative social influence established within a group can be a powerful predictor of
behavior. New ideas and innovations are introduced to social groups only when a
bounded group within a larger group is able to accept and confirm the innovation, which
can then slowly spread to the larger group, suggesting the adoption of new ideas is still
susceptible to the influence of normative influence (Kincaid, 2004).
The complexity of an individual’s social identity may affect the normative
influence of brand decisions, as less socially complex individuals are more susceptible to
social influence in regards to brand decisions (Orth & Kahle, 2008). Normative influence
exerted within an individual’s economic or cultural group is also a predictor of consumer
animosity directed at products produced by a country or region that is perceived to be in
opposition to the consumer’s in-group (Y. Huang, Phau, & Lin, 2010). With respect to
advertising, research has specifically examined testimonials included as a part of
advertisements (Martin, Wentzel, & Tomczak, 2008). High social normative influence
consumers place a greater emphasis on the testimonials included in the advertisement

9
versus the source of the testimonial (either a typical person or a celebrity.) In addition to
consumer decisions, research suggests that social normative influence in online networks
can exert significant persuasive pressure (Waardenburg, Winkel, & Lamers, 2012;
Weiksner, Fogg, & Liu, 2008).
One key social norm that has been identified as fundamental to the success and
continued existence of social groups is the norm of reciprocity (Gouldner, 1960).
According to Gouldner, the norm of reciprocity creates stable societies in that individuals
who perform some action do so with the expectation that the there will be some sort of
reciprocal action or payment performed in return. Even if there is no physical reciprocity,
such as the case when there is a power imbalance, a sense of virtue, or direct coercion,
the idea that the individual receives something in return still leads to some level of
stability, depending on how the reciprocal action or value is perceived. The norm of
reciprocity is universal, and it dictates that “1) people should help those who have helped
them, and 2) people should not injure those who have helped them” (p. 171). The norm of
reciprocity has been applied in research examining government welfare (Kumlin &
Rothstein, 2005), income inequality and mortality (Kawachi, Kennedy, Lochner, &
Prothrow-Stith, 1997), the relationships between politicians and citizens in crafting voter
compliance (Lawson & Greene, 2014), as well as the role of caregivers in family units
(George, 1986). Research suggests that norms of reciprocity not only dictate interactions
between individuals, but they can dictate indirect effects, affecting individuals’
willingness to help others based on their perception of how the others have themselves
contributed help in social situations (Seinen & Schram, 2006). As such, the norm of

10
reciprocity is key to establishing other social norms within social groups, both large and
small.
Norms of reciprocity are key not only to establishing relationships, but building
strong communities in online networks (Mathwick, 2002). Those most engaged in online
networks report experiencing the highest extrinsic rewards, including increased relational
connection and perceived value, as well as the highest intrinsic rewards, including
enhanced escapism and entertainment, for their participation. Furthermore, increased
reciprocity in online communities leads to an increased desire to engage in online civic
interactions and discussions, serving as a lubricant to offline democracy (Kobayashi,
Ikeda, & Miyata, 2006). In respect to online consumer activity, norms of reciprocity
make key contributions to the use of virtual consumer communities, enhancing
community participants’ loyalty to the community and desire to co-shop with other
community members (Chan & Li, 2010). As Gouldner (1960) has argued, norms of
reciprocity are key to the development and maintenance of communities and cultures, and
this holds true for online communities, as well.
Social Impact Theory
Latané (1981) proposed social impact theory to describe a mechanism for how
normative social influence predicts behaviors and beliefs. Latané defines social impact as
“any of the great variety of changes in physiological states and subjective feelings,
motives and emotions, cognitions and beliefs, values and behavior, that occur in an
individual, human or animal, as a result of the real, implied, or imagined presence or
actions of other individuals” (p. 343). While Latané’s definition is admittedly broad, he
suggests there are three fundamental social forces that exert social influence on an

11
individual in much the same way that physical forces such as gravity exert physical
pressure on the individual. The three social forces are strength, immediacy, and number,
and the social impact experienced by an individual is a product of these three forces.
The strength of social impact is best described as the importance of the social
group to the individual being influenced. The social strength of an influencer will be
determined by their “status, age, socio-economic status, and prior relationship with, or
future power over, the target” (p. 344). The immediacy of social impact is determined by
how close the social influence is to the individual in time and space; the closer the
influencer is to the person being influenced in physical proximity, and the more urgent
the influence, the more impact will be experienced by the person being influenced. The
number simply refers to how many people are in the group, with greater numbers
exerting greater impact, though this force begins to level as numbers grow higher. In
essence, a large group of individuals important to the target in close proximity to the
target exert a high level of social impact.
Social impact theory has been used to understand a variety of social behaviors,
including social loafing, defined as the tendency for individuals to expend less effort
when working in a group versus working on their own (Karau & Williams, 1993); stage
fright (Jackson & Latané, 1981); mere social presence (Argo, Dahl, & Manchanda, 2012;
Kinard, Capella, & Kinard, 2009); contagion (Ni, Weng, & Zhang, 2011); and persuasive
communication (Wolf & Latané, 1983). In regards to persuasive communication, Nowak,
Szamrej, & Latané (1990) argue that social forces as defined by social impact theory
work as peripheral persuasive cues in congruence with Cacioppo & Petty's (1982)
elaboration likelihood model of persuasion. Cacioppo and Petty argue that when

12
arguments are important to an individual, they will give the arguments close scrutiny,
examining the arguments’ quality and relevance. Cacioppo and Petty label this process of
applying close attention and scrutiny as central processing. However, when the
individual’s involvement with the arguments is low, they will look at external factors,
such as the attractiveness of the presentation or speaker expertise. Cacioppo and Petty
label this peripheral processing. Nowak et al. argue social impact theory provides another
set of peripheral cues congruent with Cacioppo and Petty’s model:
With regard to peripheral persuasion, at least, the application of social impact
theory is relatively straightforward. To the extent that individuals are relatively
uninvolved in an issue, they should be influenced by the strength, immediacy, and
number of people advocating a contrary position. In this case, strength can be
represented by sources' credibility and attractiveness, immediacy by their physical
closeness, and number by how many there are. (p. 364)
While individual, micro-level patterns of influence in both benign social
situations and in the context of persuasive communication can be understood via social
impact theory’s conceptualization of social forces, these micro-level patterns of influence
can lead to larger, macro-level effects such as the polarization of public opinion and the
definition of minority viewpoints (Nowak et al., 1990). In fact, social impact helps
explain how the dynamic patterns of interconnectedness and social grouping present in
modern society allow for “consolidation (the tendency for diversity within the group to
be reduced as the proportion of people who hold the minority position decreases);
clustering (the propensity for group members to end up more similar to their neighbors
than to those at a greater distance); and continuing diversity, as minorities manage to

13
survive, rather than being eliminated” (Latané & L’Herrou, 1996, p. 1219). Thus, societal
level effects are derived from micro-level social impact working in small nodes of
individuals in the larger societal network.
Immediacy is an important determinant of social impact, especially for micro-
level social impact (that is, impact exerted in individual groups). According to Latané’s
(1981) original conception of social impact, immediacy is conceptualized not only as the
proximity of influence in time, but also the proximity of influence in space. Research
suggests that immediacy, as defined by physical space, is an important predictor of social
impact, with greater physical distance leading to decreasing impact. In fact, despite the
ability of modern communication technologies to increase social connection over great
distance – such as through telephones and internet-based communication – face-to-face
contact is still an important predictor of social impact (Latané, Liu, Nowak, Bonevento,
& Zheng, 1995), Latané et al.’s (1995) assessment was predicated on the idea that face-
to-face contact is needed to initiate and maintain relationships. Twenty years later, with
the ubiquity of online social networks and a robust and internationally connected Internet,
the implications of physical distance may be of less importance than the impact of
network distance. Network distance refers to how individuals are geometrically clustered
in their social networks, with more connections between individuals allowing faster and
easier flows of information which represents a closer network distance (Latané &
L’Herrou, 1996).
Specifically examining email communication, in which physical and temporal
proximity were absent, Latané and L’Herrou (1996) found that distance, as described by
network distance, was still an important predictor of social impact. In this particular case,
14
distance was formed via clusters of a predetermined – yet invisible to study participants –
social network in which participants were only aware of the responses of those tied to
them in the electronic network. In this manner, Latané and Herrou were able to
manipulate both strength and immediacy via network structures.
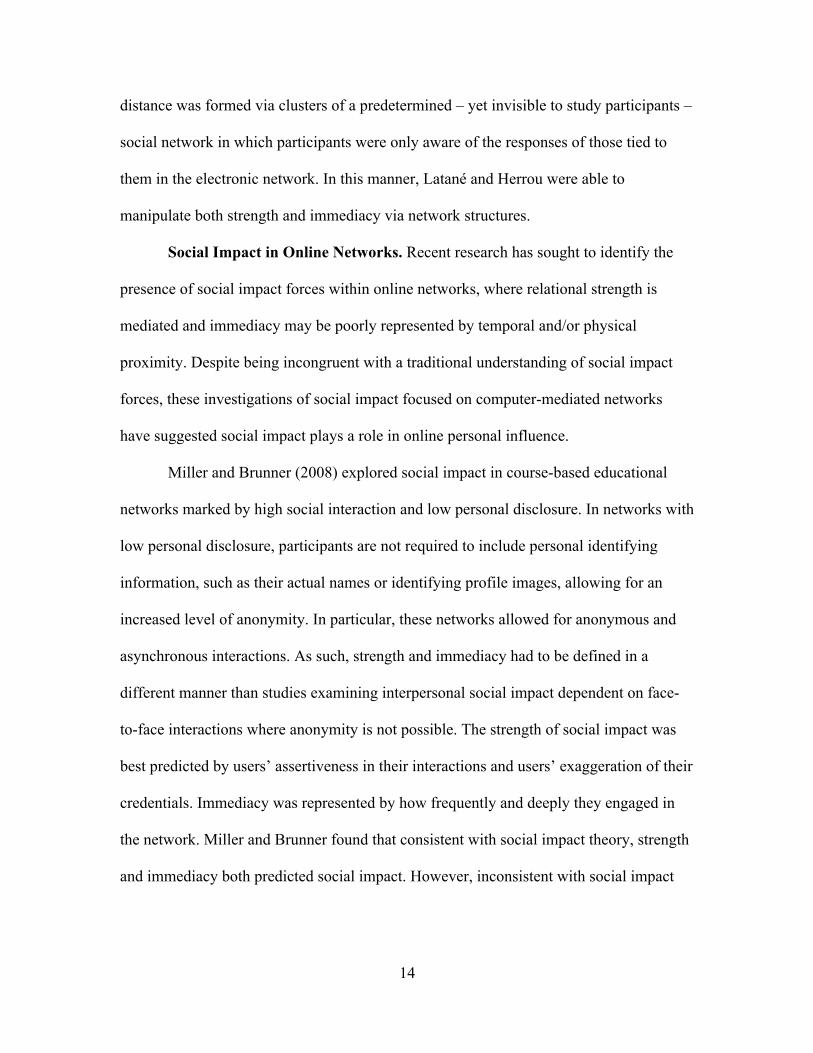
Social Impact in Online Networks. Recent research has sought to identify the
presence of social impact forces within online networks, where relational strength is
mediated and immediacy may be poorly represented by temporal and/or physical
proximity. Despite being incongruent with a traditional understanding of social impact
forces, these investigations of social impact focused on computer-mediated networks
have suggested social impact plays a role in online personal influence.
Miller and Brunner (2008) explored social impact in course-based educational
networks marked by high social interaction and low personal disclosure. In networks with
low personal disclosure, participants are not required to include personal identifying
information, such as their actual names or identifying profile images, allowing for an
increased level of anonymity. In particular, these networks allowed for anonymous and
asynchronous interactions. As such, strength and immediacy had to be defined in a
different manner than studies examining interpersonal social impact dependent on face-
to-face interactions where anonymity is not possible. The strength of social impact was
best predicted by users’ assertiveness in their interactions and users’ exaggeration of their
credentials. Immediacy was represented by how frequently and deeply they engaged in
the network. Miller and Brunner found that consistent with social impact theory, strength
and immediacy both predicted social impact. However, inconsistent with social impact
15
theory, participant number was not a consideration due to the fixed nature of the
networks.
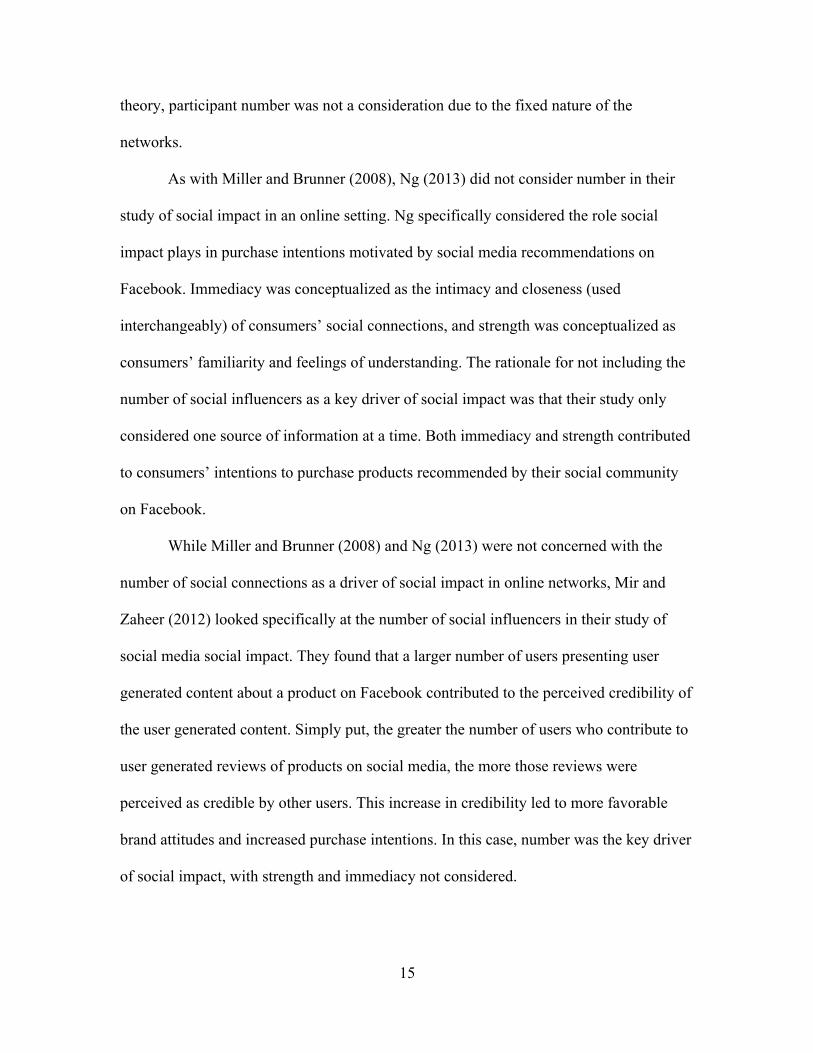
As with Miller and Brunner (2008), Ng (2013) did not consider number in their
study of social impact in an online setting. Ng specifically considered the role social
impact plays in purchase intentions motivated by social media recommendations on
Facebook. Immediacy was conceptualized as the intimacy and closeness (used
interchangeably) of consumers’ social connections, and strength was conceptualized as
consumers’ familiarity and feelings of understanding. The rationale for not including the
number of social influencers as a key driver of social impact was that their study only
considered one source of information at a time. Both immediacy and strength contributed
to consumers’ intentions to purchase products recommended by their social community
on Facebook.
While Miller and Brunner (2008) and Ng (2013) were not concerned with the
number of social connections as a driver of social impact in online networks, Mir and
Zaheer (2012) looked specifically at the number of social influencers in their study of
social media social impact. They found that a larger number of users presenting user
generated content about a product on Facebook contributed to the perceived credibility of
the user generated content. Simply put, the greater the number of users who contribute to
user generated reviews of products on social media, the more those reviews were
perceived as credible by other users. This increase in credibility led to more favorable
brand attitudes and increased purchase intentions. In this case, number was the key driver
of social impact, with strength and immediacy not considered.
16
It is clear from previous research utilizing social impact concepts in an online
environment (e.g. Miller & Brunner, 2008; Mir & Zaheer, 2012; Ng, 2013) that social
impact can be conceptualized in a variety ways, and social impact is not necessarily
dependent on all three key forces as described by Latané (1981). Research suggests that
social impact exists in online environments even when the specific forces are difficult to
identify (Naylor, Lamberton, & West, 2012). This is true for brands’ use of mere virtual
presence (MVP), which is the inclusion of social media supporter information on branded
websites and promotions. Naylor et al. found that including supporters who were either
similar or heterogeneous to their target audience was as effective as not including
supporters, but including dissimilar supporters had a negative effect. As such, it is not
advisable to include social supporter information in situations when the brand is
considered on its own; however, when individuals consider the brand along with other
brands, it is best to include similar supporter information versus remaining ambiguous.
While online MVP defies the conventional logic of social impact theory, in that the use of
supporters who merely were similar to the persuasive target is not analogous to a
traditional theoretical understanding of social strength, immediacy is difficult to
conceptualize in an online environment where individuals are always available and
always close, and number is irrelevant, social impact still appears to be at work. This
finding is consistent with other research that suggests social media messages and
relationships exert social impact and establish social norms, though the exact social
impact model may not be identified specifically (Utz & Kramer, 2004).
While Naylor et al.'s (2012) investigation determined that social impact could
exist despite an apparent lacking of Latané's (1981) social forces, the network structure of
17
social media allows for social influence to be studied based on the strength of a user’s ties
to their social connections. The idea that our network ties have different strengths was
introduced by Granovetter (1973). Granovetter argued that our ties to others in a network
can be strong, weak, or absent. Strong ties are a product of increased intimacy and trust,
and typically, individuals share a tight network of strong ties, as people are more likely to
be tied to others who share their strong connections. Weak ties join these tight clusters of
strongly tied individuals to other clusters, and they are marked by connections where
there is less intimacy. Granovetter suggests it is these weak tie connections that facilitate
the movement of new information, as they allow the flow of ideas from one strong-tie
micro-network to another. This conceptualization of network tie strength is relevant to
studying social impact, as models of social influence are improved by examining the
strength of connectivity of individuals’ social networks (Mason, Conrey, & Smith, 2007).
Such studies of online social media provide a network structure of differing numbers of
interconnected individuals.
Waardenburg et al. (2012) examined different levels of both strength and number
using social cues based on Facebook tie strength. A sample of Facebook users reviewed a
series of photographs in a Facebook application. Social cues were used to encourage
participants to continue with the experiment after a set period of participation. The study
varied both strength of participant’s network tie, manipulated by indicating how many of
their Facebook friends took action versus how many of other participants in the study
took action, and the number of influencers, manipulated by indicating either a low or high
percent of each strength category who took action. While Waardenburg et al.’s findings
suggested an overall main effect of social influence exerting pressure on behavior, they

18
did not find simple effects of number and strength on behavior. While greater numbers of
influencers and network strength impacted behavior – in this case, respondents were
influenced to continue participating in the study beyond the initial request – the
differences were not statistically significant. However, this could be due to relatively
small sample sizes in their factorial cells, which led to an underpowered experiment.
Despite lacking individual effects, social impact seemed to be exerted using mediated
social cues. An experiment with a larger sample might yield significant findings.
Facebook itself has conducted its own research concerned with social cues in its
advertisements (Bakshy et al., 2012). Using a field experiment, Facebook varied the
amount of an individual’s Facebook friends who like a brand as a part of a sponsored
story advertisement. They found that when more than one friend connection was
displayed and when the strength of the friend’s tie to the user was strong (conceptualized
by how many times the individual communicated with their friend in recent months),
users were more likely to click on the advertisement or engage with the brand through
likes. Bakshy et al.’s study provides evidence of social influence enacted through their
advertising system.
While the exact forces of social impact have been conceptualized using different
methods, with not all factors consistently examined, research consistently suggests that
social impact can be exerted in social networks (e.g. Miller & Brunner, 2008; Mir &
Zaheer, 2012; Naylor et al., 2012; Waardenburg et al., 2012). Furthermore, a key
component of understanding social impact in social media environments is the concept of
network ties (Granovetter, 1973). It is through this conception of network ties that a

19
connection between social impact can be made to another theoretical concept related to
social networks: social capital.
Social Capital
Bourdieu and Wacquant (1992) define social capital as “the sum of resources,
actual or virtual, that accrue to an individual or a group by virtue of possessing a durable
network of more or less institutionalized relationships of mutual acquaintance and
recognition” (p. 14). Bourdieu suggests that social capital is not unlike physical capital in
its usefulness and power for individuals. Like physical capital and human capital, social
capital can provide energy to human interaction. However, social capital is distinct from
human and physical capital in that it is less tangible than either. As Coleman (1988)
argues, while physical capital is completely tangible in the form of tools, materials, and
measurable resources, and human capital is less tangible in the form of measurable skills
and abilities, social capital is the least tangible as it exists in the form of relationships
between people within groups and networks.
Lin (1999) defines social capital as an “investment in social relations with
expected returns” (Lin, 1999, p. 30). Beyond a purely exchange-based definition, social
capital has also been described as a person’s network of trustworthy relationships marked
by norms of reciprocity (Putnam, 2000). Social capital can provide both a private and
public good, as it can benefit individuals in direct relationships privately, as well as
benefit the larger community which receives the positive effects of goodwill, even if they
do not directly contribute. A key component of social capital is the trust individuals have
in their network. Economists have identified trust – in individuals and groups – as a
common predictor and identifier of social capital (Anderson, Mellor, & Milyo, 2004;

20
Karlan, 2005). In addition, processes that create social capital among isolated, indigenous
individuals can lead to a greater level of normative social influence, empowering these
individuals and leading to higher levels of economic position and status (Sanyal, 2009).
Coleman (1988) defines three different types of social capital: social capital as
trustworthiness in the social structure, social capital as an information channel, and social
capital as a set of normative expectations.
Unlike physical capital, social capital cannot be transferred from one entity to
another, and it is difficult to measure how it appreciates as compared to physical capital;
however, like physical capital, increased social capital does appear to positively influence
economic and personal outcomes in the same way increased physical capital benefits
individuals and organizations (Sobel, 2002). Recent conceptualizations of social capital
have focused on the necessary conditions for its formation as well as its specific benefits.
Social capital depends on opportunity, in terms of the existence of social ties an
individual can use to build social capital; motivation, as in an individual’s desire to create
social capital; and ability, specifically the ability of the network to provide social capital
(Adler & Kwon, 2016). Furthermore, social capital is most useful in providing to
individuals information, power and influence, and solidarity.
Some communication scholarship has favored a social cohesion approach to
examining social capital, which “distinguishes social capital as an overarching structure
from more individual choices with respect to social networks and social supports,” versus
a social network approach, which examines social capital at the group and individual
level (C. Lee & Sohn, 2016, p. 730). As such, communication research has cited Putnam
(2000) more heavily, who was concerned with the decline of societal social capital at the

21
hands of television, than Bourdieu (1992). However, by adopting a social network
approach – specifically measuring social capital as an individual trait – social capital
becomes an important mediator or moderator of media effects by “directly capturing
resources embedded within their audiences’ social networks instead of just inquiring into
the frequency of conversations with others” (C. Lee & Sohn, 2016, pp. 742-743).
Social Capital and Media Use. To better understand how media could be used to
create and maintain social capital, it is important to understand the social utility of media.
Researchers in the psychology field posit that the social utility of an action “[specifies]
level of satisfaction as a function of outcome to self and other” (Loewenstein, Thompson,
& Bazerman, 1989, p. 427). In other words, an action’s social utility is desirable to an
individual when the individual perceives it is beneficial to both the individual taking the
action and those affected by the action. As such, media engagement has utility in its
ability to potentially facilitate social interaction, bonding, and positive social identity.
Online advertisements have social utility because they facilitate discussions
among peers, fostering group participation, understanding of meaning, and the creation of
ritualistic scripts based on the content of advertisements (Ritson & Elliot, 1999).
Furthermore, the content of advertisements can be utilized socially in a manner that
ignores or omits product associations. For instance, an individual might reference an
advertisement slogan or catch-phrase in a social setting without mentioning or
referencing the advertisement’s brand. Budweiser’s 1999 “Wassup” catch-phrase or
Wendy’s 1984 “Where’s the Beef?” slogan are good examples of advertising content that
was applied in social settings not necessarily connected to specific brand behaviors. In
addition, the taglines, slogans, and catchphrases presented in advertising are used in

22
social settings without acknowledgement or association with the advertised brand, and
meanings for advertisements are derived in social contexts free of the advertisement’s
brand affiliation (Mitchell, Macklin, & Paxman, 2007). This research suggests a social
utility for advertisements may exist that is distinct from advertised brands’ product
utility.
Uses and Gratifications and Social Capital. One theoretical framework that has
been consistently utilized to understand the utility of media is the uses and gratifications
framework. This framework is useful for understanding media’s social utility, and recent
work has drawn a connection between media social utility and social capital (Papacharissi
& Mendelson, 2011). This approach originally was conceived as researchers began to
understand the media as a means for entertainment rather than purely studying media as a
source of persuasion (Katz & Foulkes, 1962). Based on the uses and gratifications
approach, individuals use media to gratify certain needs, which lead to differing patterns
of media exposure (Katz, Blumler, & Gurevitch, 1974). Katz et al. provided the following
definition of uses and gratifications:
They are concerned with 1) the social and psychological origins of 2) needs,
which generate 3) expectations of 4) the mass media or other sources, which lead
to 5) differential patterns of media exposure (or engagement in other activities),
resulting in 6) need gratifications and 7) other consequences, perhaps mostly
unintended ones. (p. 20)
Katz, Haas, and Gurevitch (1973) identified a list of more than 30 needs which
individuals satisfy by using media. They broke this list of needs down into five broad
categories of need gratification: 1) cognitive needs, which are related to the acquisition of

23
information and knowledge, 2) affective needs, which are related to a emotional
experiences and appreciation of aesthetics, 3) integrative needs, which relate to
increasing individual status among peer groups, 4) integrative needs which relate to
enhancing and strengthening social contact, and 5) needs for tension-release and escape
(pp. 166-167). The two integrative needs are concerned with integration in social groups,
which supports the assertion that need gratification takes place in some type of
environment, and most needs as well as the methods used to meet them – whether those
needs are met through media or some other activity – typically have a social context
within that environment (Swank, 1979).
Recent uses and gratifications research has examined the needs gratified through
social media, with many studies identifying social interaction as a key gratification
sought and obtained through social media (Luqman, Cao, Ali, Masood, & Yu, 2017; N.
Park, Kee, & Valenzuela, 2009; Z. Wang, Tchernev, & Solloway, 2012; Whiting &
Williams, 2013). In addition, specific forms of social interaction have been identified,
including sharing social information about current activities and “what’s going on”
(Quan-Haase & Young, 2010) as well as making new friends and locating old friends
(Raacke & Bonds-Raacke, 2008). Examining social media through the lens of consumer
activity, Heinonen (2011) identified six types of social needs satisfied through consumer
uses of social media: 1) social surveillance, or “learning about friends and
acquaintances;” 2) collaborative experiencing, or “sharing and experiencing with others;”
3) belonging and bonding, or “connecting with people;” 4) being up-to-date, or “knowing
what is happening in one’s own community;” 5) staying in touch, or “keeping up

24
relationships within one’s own network;” and 6) social networking, or “creating and
managing a social network of friends and acquaintances” (p. 361).
In regard to consumer activity, research suggests that a brand website’s ability to
facilitate increased social interaction motivates consumers to stay engaged and ultimately
make purchasing decisions (Ko, Cho, & Roberts, 2005). Consumers use brand content on
social media for social interaction such as finding friends and building relationships,
social identity such as identifying with a particular brand to form strong connections, and
to help and get help from other social media users (Muntinga, Moorman, & Smit, 2011).
In addition, these interactions in an active brand community on social media add value to
the brand. Finally, the specific act of sharing on social media, i.e. posting specific content
to a social media site, is strongly associated with the socializing gratification (Lee & Ma,
2012). This research suggests that brand activity carried out on social media is not
confined to purely consumer action, but that it has social implications, as well.
Ruggiero (2000) suggested that in the new century, uses and gratifications
research should seek to reimagine the definitions of “audience activity” and “audiences,”
given that the line between media creators and media consumers has blurred. Online
channels give consumers the ability to offer feedback and create their own content that
can then be broadcast to a mass audience through internet-based media channels. In
addition, uses and gratifications research should seek to understand not only the social
deficits media addresses – a focus of much uses and gratifications research in the
twentieth century – but rather uses and gratifications research should emphasize the
social purposes of media utilized by consumers. Media is no longer a consumptive, need-

25
based act, but it is purposeful, and one of its crucial purposes is building and maintaining
social networks.
In this context, Papacharissi and Mendelson (2011) looked to the increasingly
social nature of media consumption facilitated by interactive media. They proposed a
model of uses and gratifications that incorporates the principles of social capital. Social
media use actively facilitates social capital, though its use is more ritualistic than
instrumental. In other words, people use social media habitually as a part of their
everyday lives, but in doing so social media actively supports social capital. As such,
Papacharissi and Mendelson proposed a model that suggests one cannot understand
media use in the new century without considering its social outcomes. Their model is
framed by five arguments:
1. Social behaviors, including media ones, are both purposeful and ritualistic.
2. Social and psychological factors mediate communication behaviors.
3. Individuals adopt convergent media to address psychological needs as well as
build and maintain social networks.
4. Media compete and converge with other forms of communication to fulfill both
social and psychological needs.
5. Media use has social outcomes, including differing levels of social capital.
For Papacharissi and Mendelson, the use of media, especially web-based social
media, has social outcomes, and those outcomes contribute to individual social capital.
Beyond merely fulfilling social needs, media use should be examined as an ongoing
social process. In a sense, the use of social media becomes an integral part of how people
build and maintain their social networks, with implications outside of pure individual,
26
momentary media utility to meet basic needs. Social capital becomes a key component in
understanding the decisions people make related to mediated communication.
Social Capital in Online Networks. To better understand how social capital is
created and utilized within social groups, it is important to understand network structures
(Sobel, 2002). Social capital has been useful in understanding how information flows in
networks, specifically corporate networks (Inkpen & Tsang, 2005; Steinfield, DiMicco,
Ellison, & Lampe, 2009) and professional virtual communities (Chiu, Hsu, & Wang,
2006). In much the same way that social impact researchers built upon Granovetter's
(1973) model of network tie strength to understand processes of social impact (e.g.
Waardenburg et al., 2012), Putnam (2000) uses network ties to conceptualize two forms
of social capital: bridging and bonding. Putnam conceptualizes Granovetter’s strong and
weak ties as bonding and bridging social capital. Putnam argues that we have bonding
social capital with our intimate friends, whom we depend upon to “get by,” and we have
bridging social capital with our larger network of weak ties, who through information
diffusion we can rely upon to “get ahead.”
Recent attention has turned to how both bonding and bridging social capital are
constructed and maintained via mediated communication networks, in particular online
social networks. Both online and offline interactions produce both forms of social capital,
which leads to a concept of social capital in four quadrants: online bonding, offline
bonding, online bridging, and offline bridging (Williams, 2006). In addition, three themes
have emerged in research examining social media based social capital: 1) the amount of
personal disclosure and activity a user contributes to their social network dictates the
level of benefits they receive; 2) social media creates both bonding and bridging social

27
capital, but particularly bridging social capital; and 3) social media networks support both
online and offline relationships (Steinfield, Ellison, Lampe, & Vitak, 2012), which is
consistent with the suggestion that both forms be considered in studying social media.
Indeed it would appear that online social capital can contribute to offline professional
reputation (Wasko & Faraj, 2005) as well as life satisfaction and civic participation
(Valenzuela, Park, & Kee, 2009). In addition, social media’s usefulness in building social
capital transcends cultural differences (Ji et al., 2010).
Seeking information via social networking sites is a positive predictor of
individual’s social capital (Gil de Zúñiga, Jung, & Valenzuela, 2012), as is increased
personal disclosure on social media (Trepte & Reinecke, 2012). Specifically, information
seeking and sharing on social networks, along with building social connections, have
been shown to be predictors of bridging social capital, while convenience is a significant
predictor of bonding social capital (Mo & Leung, 2015). In other words, while the
convenience of social media is most useful in maintaining intimate ties through bonding
social capital, the sharing and information seeking aspects of social media are most useful
in building bridging social capital. Indeed, bridging social capital best predicts
individuals’ intention to speak up on social media sites (Sheehan, 2015), and bridging
social capital is key to understanding how opinion leaders make recommendations in
social networks (Burt, 1999). In addition, bridging social capital predicts continued use of
social media and satisfaction with social media; however, bonding social capital does not
(Chang & Zhu, 2012). However, the nature of the social network itself is a contributor to
the type of social capital cultivated by the network. Snapchat, which emphasizes personal
interactions between individual users is best associated with bonding social capital, while

28
Twitter, which emphasizes widely-broadcasted messages, is best associated with bridging
social capital (Phua, Jin, & Kim, 2017).
Concerning social media, social capital, and consumer activity, Kwahk and Ge
(2012) determined that social capital conceptualized as the strength of interaction ties and
norms of reciprocity within the network contributes to increased intentions to make
online purchases. Social media social capital is also associated with higher performance
ratings for the consumption of media such as television (Oh & Yergeau, 2017). Kwahk
and Ge’s study borrowed their interpretation of social capital from Chiu et al. (2006),
who found interaction tie strength and norms of reciprocity were tied to increased
information sharing. Social network ties are also associated with an increased desire to
engage in the sharing of electronic word of mouth (eWOM) via social media sites (Chu &
Kim, 2011) as well as brand related messages (Fu, Wu, & Cho, 2017), and social capital
and self-disclosure motivate the use of branded e-stickers in social media messaging apps
(Y. C. Lee, 2017). Similarly, a consumer’s trust in their social network mediates the
relationship between social impact and consumer purchase intentions for products
recommended by friends on Facebook (Ng, 2013). As trustworthiness strongly relates to
social capital in social networks (Putnam, 2000), it is possible that within online social
networks, social capital may be a predictor of consumer behaviors in addition to sharing
behaviors.
Facebook and Social Capital. Much attention has been given to Facebook by
researchers examining online social capital, with results consistent with previous findings
related to social media and the creation of social capital. In general, research supports the
idea that, like social media in general, Facebook use contributes to building bonding
29
social capital, but is most useful for bridging social capital (Ellison, Steinfield, & Lampe,
2007; Johnston, Tanner, Lalla, & Kawalski, 2011). In addition, its benefits for bridging
social capital may be greater for those with lower self-esteem (Steinfield, Ellison, &
Lampe, 2008), suggesting Facebook may be particularly useful for those who lack social
confidence. While Facebook is most useful for facilitating bridging social capital,
research suggests that it can be useful for facilitating strong tie emotional support (Burke
& Kraut, 2013). However, while intense Facebook use itself is not associated with
bonding social capital, specific behaviors are predictive of bonding, especially
responding to a post from a Facebook friend who is seeking support and having family
members as Facebook friends (Vitak, Ellison, & Steinfield, 2011). Furthermore, research
suggests than there may be gender differences in how individuals utilize Facebook to
build relationships, with women focusing on building closer relationships and men
focusing on building a broader network (Krasnova, Veltri, Eling, & Buxmann, 2017).
In addition to examining Facebook’s overall contribution to social capital,
research has looked at the contribution of specific Facebook behaviors to the creation of
different types of social capital. Burke, Marlow, and Lento (2010) compared direct
communication, conceptualized as sending and receiving direct news feed posts or
messages, and passive consumption, conceptualized as users’ passive viewing of their
news feeds without direct interactions with friends. They determined that in general,
Facebook use predicted both social capital and decreased loneliness, though loneliness
was higher for those who only passively consumed news feeds rather than engaging in
direct communication. Similarly, Burke, Kraut, and Marlow (2011) examined three social
media behaviors: direct communication with friends in the form of messages and
30
comments, passive consumption of friend news feed posts, and broadcasting on
individuals’ own news feeds. They found that direct communication was best predictive
of social capital, in particular bridging social capital. Also, individuals with low
communication skills had higher bridging social capital as a result of both direct
communication and passive consumption, suggesting that perhaps passive consumption
provided communication context for those who would otherwise be hesitant to engage in
conversations.
While different types of Facebook communication behaviors are associated with
building different types of social capital, some specific types of sharing behaviors may
impact bridging and bonding social capital in different manners. The ability to share
personal opinions on Facebook motivates individual’s desire to engage in Facebook’s
communication practices; however, it has a negative relation with bridging social capital
(Su & Chan, 2017). This suggests that while individuals desire to share personal opinions
on Facebook, that ability may damage their weak-tie relationships via the sharing of
controversial or contrary opinions. However, opinion sharing does not appear to have an
effect on bonding social capital, suggesting opinion sharing may be an expected part of
relational connection and enhancement.
Patterns of Facebook use can have other social capital benefits for those seeking
information about their social connections. People are more likely to use Facebook to
seek information about social connections rather than to maintain or initiate social
connections (Ellison, Steinfield, & Lampe, 2010). In other words, Facebook is useful for
surveillance in interpersonal relationships, particularly those outside of an exclusively
online context. Furthermore, this relational information seeking process contributes to

31
both bridging and bonding social capital. In addition, people use relationship
maintenance behaviors – which are specific acts individuals take to build, maintain, and
repair relationships – on Facebook to build bridging social capital, suggesting Facebook
is particularly useful for maintaining often distant, weak-tie relationships (Ellison, Vitak,
Gray, & Lampe, 2014). Social media not only contributes to online bridging social
capital, but also offline bridging social capital.
Social capital built through Facebook not only contributes to offline social capital,
but it may contribute to other offline outcomes in specific contexts. Both bridging and
bonding social capital built with coworkers via Facebook may contribute to work
performance (L. V. Huang & Liu, 2017). Facebook bonding social capital with
coworkers, for example, contributes to increased job satisfaction, and Facebook bridging
social capital contributes to increased job performance. In addition, bonding social capital
mediates the relation between information utility and job satisfaction, suggesting the
strong tie relationships built via Facebook contribute to a sense of workplace community.
Though this study was specifically concerned with workplace outcomes, it does provide
compelling evidence of offline benefits for social capital built via Facebook.
Attitudes, Advertising, and Brands
To understand the roles social impact and social capital might play in Facebook
advertising, it is important to understand how advertising shapes brand attitudes and
subsequent consumer behaviors. One theory that has been utilized to understand how
attitudes shape behaviors is Fishbein and Ajzen’s expectancy-value theory, a component
of their larger theory of reasoned action (Fishbein, 1963; Fishbein & Ajzen, 1975).
Fishbein and Ajzen argue that a person’s behaviors are predicted by their intentions,

32
which are predicted by their attitudes towards the intended behavior. Attitudes are the
sum of the product of a person’s salient beliefs and evaluations of those beliefs. Working
from the uses and gratifications perspective, media researchers have utilized this
approach to understand how gratification-seeking attitudes lead to media exposure
behaviors (Palmgreen & Rayburn, 1982; Rayburn & Palmgreen, 1984). From a marketing
perspective, the theory of reasoned action has fueled research which explores how the
evaluation of brand attributes presented in marketing messages shape brand attitudes,
thus leading to purchase intentions and behaviors (i.e. Cohen, Fishbein, & Ahtola, 1972;
Lutz, 1977; Lutz & Bettman, 1977; Wilkie & Pessemier, 1973). Beyond examining brand
attributes, Mitchell and Olson (1981) suggested other factors may act as mediators
alongside the evaluation of brand attributes in determining brand attitudes. Beliefs about
the brand or product are not the only mediator of the relation between advertising
exposure and brand attitude. The attitude toward the advertisement itself is also an
important mediator of brand attitude, and – as suggested by the theory – brand attitude
ultimately may predict purchase intentions. As such, much attention has been given to
how individuals receive and evaluate advertisements, themselves.
Early research into the reception of advertising looked specifically at cognitive
evaluations (Wright, 1973) as well as opinions and judgments (Wells, Leavitt, &
McConville, 1971). However, Batra and Ray (1986) suggested that affective responses
should be studied along with cognitive responses as they have a significant impact on
brand attitudes. Three dimensions of feelings – upbeat, negative, and warm – can relate to
attitudes towards advertisements as well as attitudes towards the brand (Edell & Burke,
1987). In addition, brand familiarity moderates the relation between advertising emotion

33
and brand attitudes (Machleit & Wilson, 1988). In an effort to create a comprehensive
understanding of advertising acceptance, Feltham (1994) used Aristotle’s theory of
rhetoric and the related concepts of ethos, logos, and pathos to develop the Persuasive
Discourse Inventory (PDI). Based on Aristotle’s theory, Feltham developed a three-
dimension scale with items related to an advertisement’s source credibility (ethos),
evidence and information (logos), and emotional appeal (pathos). Research suggests that
attitudes towards a brand are indirectly impacted by feelings generated while viewing an
advertisement (Pham, Geuens, & De Pelsmacker, 2013); feelings positively relate to an
overall assessment of the ad, which in turn positively relates to an assessment of the
brand. Recent advertising acceptance research has examined advergames (Wise, Bolls,
Kim, Venkataraman, & Meyer, 2008), and in-game advertising (Lewis & Porter, 2010).
Huang, Su, Zhou, and Liu (2013) looked specifically at online, video
advertisements to understand how advertisement attitude might not only predict brand
attitudes and purchase behaviors, but also social sharing. Huang et al. based their model
of advertising acceptance on MacKenzie's, Lutz's, and Belch's (1986) mediating model of
advertising acceptance. MacKenzie et al. proposed four different models of advertising
acceptance in which advertising attitude mediated the relation between advertising
exposure and brand attitude. MacKenzie et al. determined that a dual mediation process
best explained the relationship. The dual mediation hypothesis suggests there is an
indirect flow of causation from the attitude towards the advertisement through brand
cognitions to brand attitude, which works in addition to the direct effect of advertisement
attitude on brand attitude. However, Huang et al. found Mackenzie et al.’s affect transfer
hypothesis was most predictive. In the affect transfer model, advertisement attitude

34
directly impacts brand attitude without affecting brand cognitions. As with Fishbein’s and
Ajzen’s (Fishbein, 1963; Fishbein & Ajzen, 1975) approach, brand attitude predicted
brand behavior. In addition, Huang et al. determined that attitude towards the
advertisement directly impacted social sharing intention, suggesting advertisements not
only impact brand attitudes, but they also have social utility.
Social Norms. Advertising research has focused on the attitudinal, expectancy-
value aspect of the theory of reasoned action to better understand how advertising
attitudes impact brand attitudes and behaviors. However, Ajzen and Fishbein (1975;
1980) argue that attitudes are only one predictor of behavioral intentions. In addition to
attitudes about a behavior, social norms related to the behavior also influence behavioral
intentions. As advertising research primarily has concerned itself with the mediating role
advertising attitude plays in shaping brand attitudes, it has ignored the social component.
However, given the ability of social media advertisements to imbed social cues within the
ad, it is worth considering how social norms work alongside other aspects of brand
attitude. While research suggests that attitudes are a much better predictor of behavioral
intentions than subjective norms, subjective norms exert more influence on intentions
when the behaviors are social in nature (Trafimow & Finlay, 1996). Social media
advertising takes place in a social environment with potential social outcomes through
social sharing, and as such, they provide an excellent opportunity to examine social
norms in the process of brand attitude formation. In this case, the social context cues
embedded in the ad are expected to influence the brand attitude, which in turn motivates
purchase intentions.

35
Hypotheses and Research Questions
Based on Latané's (1981) conception of social strength, research has suggested
that the strength of social ties in online networks contributes to overall social impact of
mediated messages (Bakshy et al., 2012; Miller & Brunner, 2008), which leads to
increased purchase intentions (Ng, 2013). In addition, the number of social connections
increases the social influence of brand messages in social media contexts, influencing
brand attitudes and subsequent purchase intentions (Bakshy et al., 2012; Mir & Zaheer,
2012). Finally, immediacy as conceptualized as intensity of engaging in the network also
contributes to the social impact of mediated messages (Miller & Brunner, 2008). While
Waardenburg et al.'s (2012) experimental design allowed both number and strength to be
manipulated at the same time, they did not examine any interactions between the two
concepts, perhaps due to a lack of experimental power. However, it is possible that such
effects exist. In addition, Waardenburg et al. did demonstrate that the mere presence of
social cues in Facebook messages positively related to specific behaviors. As such, the
following hypotheses and research question are proposed:
H1: The presence of social cues in Facebook advertisements leads to positive
brand attitudes.
H2: Stronger network ties in social context cues in Facebook advertisements
lead to more positive brand attitudes.
H3: Greater numbers in social context cues in Facebook advertisements lead to
more positive brand attitudes.
H4: Higher intensity Facebook users have more positive brand attitudes of
Facebook advertisements containing social cues.

36
RQ1: Is there an interaction between network tie strength, number, and intensity
exerting influence on brand attitudes in Facebook advertisements
containing social cues?
Based on the theory of reasoned action (Ajzen & Fishbein, 1980; Fishbein, 1963;
Fishbein & Ajzen, 1975), advertising researchers have suggested that attitudes towards
brand features as communicated in brand messaging positively predicts behavioral
intentions (e.g. Cohen et al., 1972; Wilkie & Pessemier, 1973). However, attitude
towards the advertisement itself is also a predictor of brand attitude (MacKenzie et al.,
1986; Mitchell & Olson, 1981). In addition, advertising attitude also predicts social
sharing of the advertisement (J. Huang et al., 2013). The following hypotheses are
proposed:
H5: Positive advertising attitude predicts positive brand attitude.
H6: Positive advertising attitude predicts social media sharing of the
advertisement.
H7: Positive brand attitude predicts purchase intention.
Research suggests social media use contributes to social capital, in particular
bridging social capital (Steinfield et al., 2012). Facebook is no exception, as research
suggests there is a relation between Facebook use and increased social capital (Ellison et
al., 2007; Johnston et al., 2011; Steinfield et al., 2008). In particular, bridging social
capital predicts Facebook sharing (Burke et al., 2011, 2010). As advertisements are useful
in their social utility, and regular engagement with social media increases social
outcomes, including social capital (Papacharissi & Mendelson, 2011), it is expected that
advertisements with a positive assessment will be more likely to be shared on social
37
networks due to their perceived social utility. In addition, social media social capital also
has positive implications for consumer activity, specifically purchase intentions, for ads
shared in social networks (Ng, 2013). As argued by Lee and Sohn (2016), social capital
might be best utilized in communication effect research as a behavioral and attitudinal
moderator. Therefore, it is possible that in addition to its role as a moderator predicting
social behaviors, it may have implications for attitude formation, as well. Thus, the
following hypotheses and research questions are proposed:
H8: Bridging social capital positively moderates the relation between brand
attitude and purchase intention for Facebook advertisements with social
cues.
H9: Bridging social capital positively moderates the relation between
advertising attitude and social sharing intention for Facebook
advertisements with social cues.
RQ2: Does bridging social capital moderate the relation between advertising
social impact and brand attitude for Facebook advertisements with social
cues?
RQ3: Does bridging social capital moderate the relation between advertising
attitude and brand attitude for Facebook advertisements with social cues?
Figure 2.1 presents a model of social media advertising based on the
aforementioned hypotheses. All figures are included in Appendix A. The model is
consistent with Mitchell's and Olson's (1981) advertising attitude meditational model
derived from an expectancy-value approach to understanding attitudes and behavioral

38
intentions (Fishbein, 1963; Fishbein & Ajzen, 1975); however, the model introduces
social impact as the normative component of Fishbein and Ajzen’s model.
Conclusion
Social norms and social influence are an important predictor of behaviors. The
strength of our connection with those exerting social influence, the number of influencers
present, and their closeness to us in time and space determine the overall amount of social
influence exerted in any given context. Research suggests this holds true in both online
and consumer contexts. In addition, the social capital an individual has invested in their
network determines an individual’s desire to engage in network behaviors. Based on
previous research, it was predicted that within a social media setting, advertisements that
contain social cues about how an individual’s social ties engage with the brand advertised
will have more favorable attitudes towards the brand, and will thus be more likely to
make favorable purchasing decisions. Furthermore, an individual’s bridging social capital
will moderate their social sharing and purchase decisions. To test the hypotheses and
research questions presented in this study, an experiment was preformed. The next
chapter presents the methodology for this experiment.

39
CHAPTER III
METHODOLOGY
To test the hypotheses and address the research questions proposed in this study, a
quantitative experiment was performed. Experiments are a form of quantitative
methodology designed to test clearly defined and limited concepts (Babbie, 2013). While
the need to clearly define concepts on a limited basis is a weakness of experimental
methods when compared to qualitative or correlation methods, such as focus groups or
surveys, experiments satisfy the requirements of causation; specifically, there must be a)
temporal priority, where the cause precedes the effect in time; b) spatiotemporal
contiguity, where the cause and effect are close to each other in time in space, and c)
constant conjunction, where the effect is consistent across different tests (M. Sobel,
2009). As such, experiments are unique in their ability to establish causation.
There are three key elements of experiments: 1) the manipulation of independent
variables, i.e. the situations, events, text, or other stimuli predicted to be the cause of
some effect; 2) the use of controls, such as random assignment, to determine that the
effect is the result of the manipulations and not some other factor; and 3) a measured
effect or response, known as the dependent variable (Kirk, 2009). It is the first two
elements that set experiments apart from other methods. Essentially, in an experiment,
you are manipulating some variable – in the case of the current study, the strength and
number of social media relationships in a social context cue – to determine if that
variable causes an effect – in this case, brand attitude will be impacted by exposure to the
social context cue. Compared to other methods, experiments are best suited to determine
causality.

40
The study utilized a 2x2 factorial design to manipulate the primary independent
variables: advertisement social cue tie strength of relationship (low versus high) and
number of people exerting influence (low versus high). As recommended by Thorson,
Wicks, and Leshner (2012) with respect to experimental designs in mass communication
research, more than one media stimuli was utilized to ensure that effects were not related
to a specific stimulus rather than controlled manipulations. Three different visual
advertisements were used along with the four different social cue manipulations and a
hard control. A between-subjects design allowed for maximum control of the influencer
number variable, as the same values for low and high numbers could be used across each
cell. The experiment presented respondents different viral video advertisements that
included social cues modeled after the types of advertisements presented on Facebook.
Participants were then asked to indicate their advertisement attitude, brand attitudes,
social sharing intentions, and purchase intentions for the advertisements. The remainder
of this chapter will discuss how and where study participants were recruited to take part
in the study, the specific procedure for the study, the results of a pretest used to determine
the stimulus videos used in the study, and a description of the scales and measures
utilized in the study.
Participants
Study participants were recruited from undergraduate communication and
marketing courses. As Huang et al. (2013) has argued, students are ideal candidates for
viral video and social media studies due to their active engagement with these mediums.
Students were offered credit in their courses in exchange for their participation. All
students were informed that the study would take approximately fifteen minutes to
41
complete, and that their course credit would be awarded at the end of the term. At the
time of the study, approximately 400 students in marketing courses had enrolled to
participate in the marketing pool, and thus were eligible to participate. There were
approximately 220 students enrolled in the communication classes who were invited to
participate. As such, approximately 620 students were aware of the study and eligible to
participate. 227 students elected to participate in the study, suggesting a response rate of
approximately 37%.
Students in marketing courses are required to participate in research studies
administered through a marketing pool. In exchange for their participation, students were
awarded credit points towards their marketing pool class requirement. Students were
recruited through an online portal that allows students to select studies in which they can
participate to satisfy their requirement. In the online portal, students viewed a brief
description of the study, and they could then select a timeslot in the late morning or
afternoon for their participation. They were then instructed to attend the study at their
appointed time in a research lab in the School of Business. Communication students were
recruited from a research methods course as well as a media history course. As the
communication classes do not include a required research pool, students were offered
extra credit in exchange for their participation, and they were entered into a drawing to
win a $100 Amazon.com gift card. Students in communication classes were recruited in-
person by the researcher as a class announcement, and they were sent an email through
the course website from their instructor. The email linked to a webform where students
could request participation and indicate their availability. Students then received an email
from the researcher confirming their participation times in the late morning or afternoon,

42
and they were instructed to attend a lab space in the school of journalism to complete the
study at their designated times.
Procedure
The study was completed in computer labs in both the business school and the
school of journalism. Before beginning the study, participants were asked to view an
informed consent statement, and participant information was collected separate from the
study instrument to protect the confidentiality of student responses. Students in marketing
courses provided an ID code which the researcher entered into the online marketing pool
system to award their course credit. For communication students, student names and
identification numbers were provided to their instructors so they could be awarded credit
in their courses.
The stimuli and study measures were provided using Qualtrics online survey
software. To reduce threats from demand characteristics and increase the believability of
the study manipulations, participants were given specific instructions on the nature and
method of the study. The first screen of the study informed participants that they were
participating in a nationwide study being conducted at universities and testing centers in
all fifty states, and researchers were specifically curious about their attitudes towards
video advertisements on Facebook. As the study involved Facebook, the screen included
a link to log in to Facebook’s network. No information was passed from Facebook to the
survey; participants were only asked to log in to the network to increase the believability
and validity of the experiment. The Qualtrics survey tracked which participants clicked
the log-in button, and presented a log-in success screen after participants followed the
link.

43
After logging in, participants completed a measure of their bridging social capital.
This measure was completed prior to viewing the experimental stimuli to reduce the
chance that the experiment might bias responses to the measure. Upon completion of the
social capital measure, participants were shown one of the Facebook viral video
advertisements with social context cue stimuli. Participants were randomly shown one of
the three stimulus videos (selected in a pretest; see below), and the social cue
manipulation was randomly assigned for each video for each participant.
The included social context cue was based on the larger Facebook network stated
as a percentage of all Facebook users (weak tie) or a participant’s own Facebook network
stated as a percentage of a participant’s Facebook friends (strong tie). For each tie, a
different percentage of users who liked the brand was shown, either low or high. In
accordance with Waardenburg et al. (2012), The social cue manipulations were as
follows:
1. High Strength, High Number: “86% of your Facebook friends who
participated in this study like [Brand Name].”
2. High Strength, Low Number: “14% of your Facebook friends who
participated in this study like [Brand Name].”
3. Low Strength, High Number: “86% of Facebook users who participated in
this study like [Brand Name].”
4. Low Strength, Low Number: “14% of Facebook users who participated in
this study like [Brand Name].”
In addition to the four social context cues included with the viral video
advertisement, one manipulation included no social context cue; this manipulation was
44
used as a hard control. The advertisement was identical to the other manipulations;
however, the area containing the social context cue was left blank. Figures 3.1.-3.5 depict
examples of the stimuli used in the final study.
After viewing the advertisement, participants were asked to respond to questions
in regards to their attitude towards the advertisement, the social utility of the
advertisement, their attitude towards the brand, their social sharing intentions, and their
product purchase intentions. Then, participants were asked to complete characteristic and
demographic measures, including their daily intensity of Facebook use, age, gender, and
ethnic origin. Upon completion of the survey, participants were asked to log out of
Facebook to complete the study. At the study’s conclusion, students who completed the
study in the communication lab were shown a screen with debrief information describing
the study manipulations and the Facebook log-in deception. In accordance with
established procedures for the marketing lab, the same text viewed by communication
students was sent to participants who completed the study in the marketing lab at the end
of the term.
Pretest
The stimuli utilized in the study consisted of a viral video advertisement
embedded in a Facebook-styled advertisement that included a social context cue. The
decision was made to use existing brand-oriented viral videos as stimuli in this
experiment. A viral video is one that “is delivered in an interactive, web-based
environment characterized by viewer pull and control rather than sponsor push” and has
“interesting video content and embedded brand information” (Huang et al., 2013, p.36).
A pretest was conducted to determine which videos to utilize in the final experiment.

45
The viral video advertising content utilized in the advertisement stimuli was
selected in a manner consistent with Huang et al. (2013), which includes a procedure for
finding potential viral video advertisements followed by a pretest to identify the videos
utilized in experimental stimuli. As the largest source of video content on the web
(“comScore releases February 2016 U.S. desktop online video rankings,” 2016),
Google’s YouTube website was searched for viral video advertisement content using the
search terms “funny,” “exciting,” “entertaining,” “good,” “advertisement,” and “ad.” In
addition, the researcher solicited ideas for good viral video advertisements from social
media connections via status updates posted to Facebook. Advertising Age’s weekly viral
video chart (http://adage.com/section/the-viral-video-chart/674), which includes a listing
of the top viral video advertisements each week, was also accessed to identify viral video
advertisements.
Consistent with Huang et al.’s (2013) procedure, after a list of 15 viral videos
were identified, the researcher, working with associates, subjectively recommended eight
videos that best met the criteria recommended by Huang et al.: 1) the videos were highly
rated with high view counts, 2) the videos contained product and brand information, and
3) the videos had to contain one complete story, have a running time of 5 minutes or less,
and have professional audio-visual quality. In addition, videos that were thirty seconds or
less were excluded to differentiate viral videos from television commercials, as
commercials created specifically for television are limited to a shorter run-time. The eight
videos were included in a pretest utilized to identify the videos used as a part of the
experimental stimuli. The smaller number of videos was desirable to eliminate survey
fatigue in the pretest. Video runtimes ranged from 1:15 to 5:16. Table 3.1. includes

46
information about each video, including an online link, summary, runtime, and video
views. All tables for this dissertation are included in Appendix B.
These eight videos were submitted to a sample of 56 student participants for
viewing. Students were offered extra credit in a communication class in exchange for
their participation. After watching each video, students were asked to assess the videos
using Huang et al.'s (2013) Facebook social conversation scale. In addition, respondent’s
likelihood that they would “like,” “share,” or send the video in a private message was
also measured. Responses were measured on a seven-point, Likert scale ranging from
“strongly disagree” to “strongly agree.” Table 3.2. presents mean scores for each scale for
the eight videos included in the pretest. Three videos’ mean scores on each social sharing
score were relatively close together across each of the sharing measures: the Temptations
“Keep Them Busy” video, the Reebok “25,915 Days” video, and the Sense “Meet Sense
with Voice” video. In addition, the runtimes for each of these videos ranged between 1:15
and 1:34. Consistent with recent trends in viral video sharing which has seen a steady
decrease in the average time for viral videos (Jones, 2014; Waterhouse, 2015), the shorter
runtimes for the three videos was desirable. The closeness in runtimes also controlled for
any variance that may have resulted from using videos with extreme differences in
length. As such, these three videos were selected as the stimulus videos for the study.
In addition, the pretest addressed the social context cue manipulation using a
separate viral video not included in the study as well as the Facebook log-in deception.
Pretest participants were asked to log-in to Facebook to connect the study to their own
Facebook account. They were then shown a viral video with one of the four social
context cues. They were then asked to evaluate studies that connect to Facebook in terms
47
of their right to privacy, and they were asked to recall the number percentage
manipulation and whether it represented a large or small amount of their network. Only
one participant indicated they did not believe they logged in to Facebook. Furthermore,
only three participants did not accurately remember the number manipulation outside of
ten percentage points, and no issues were identified in relation to their interpretation of
the number.
Measures
As outlined in the procedure, participants first completed a measure of bridging
social capital before viewing the advertisement stimulus. Upon viewing the
advertisement stimulus, participants completed measures of familiarity with the video,
social media advertisement privacy, advertisement attitude, brand attitude, purchase
intention, and advertisement sharing intention. These measures were identical for each
advertisement. Facebook intensity and demographic variables were measured after
participants viewed their stimulus and completed advertisement and brand scales. A
complete listing of measures and scale items is included in Appendix C.
The independent variable “bridging social capital” was measured using Williams's
(2006) scale of online social capital, adapted to Facebook use. The scale consisted of ten
items measured using seven-point, Likert scales. Sample items include, “Interacting with
people on Facebook makes me interested in what people unlike me are thinking,” and, “I
am willing to spend time to support general community activities on Facebook.”
As the videos drawn for the study were readily available through online media
channels, specifically YouTube, it was deemed necessary to measure participants’
familiarity with their video as a control in the study. No specific measure was identified
48
in the literature. As such a one-item measure was utilized. Respondents were asked how
many times they had seen the video on a four-point scale ranging from “never” to “many
times.” In addition, one survey question asked respondents how much respondents felt
the ad violated their privacy, given that respondents were led to believe the advertisement
included a social cue derived from their Facebook network. Previous research suggests
privacy concerns and concerns about the invasiveness of Facebook advertisements can
diminish attitudes and behavioral intentions (Jung, Shim, Jin, & Khang, 2016). An
adequate scale was not identified in the literature. As such, respondents were asked to
indicate the invasiveness of the advertisement on a seven-point semantic differential scale
ranging from “very invasive” to “not at all invasive.”
The dependent variable “attitude towards the advertisement” was measured using
Madden's, Allen's, and Twible's (1988) advertising evaluation scale. The measure
consisted of six items measured on seven-point, semantic differential scales. Respondents
were asked to indicate their feelings towards the advertisement on items such as
“unpleasant/pleasant” and “artless/artful.” The dependent variable “brand attitude” was
measured using Mitchell and Olson's (1981) scale. The measure consisted of four items
measured on seven-point, semantic differential scales. As with the advertisement attitude
measure, respondents were asked to indicate their feelings towards the advertised brand
on items such as “bad/good” and “poor quality/high quality.” The dependent variable
“purchase intention” was measured using Huang et al.'s (2013) approach, consisting of
two items measured on seven-point, semantic differential scales designed to measure
purchase likelihood as well as the perceived wisdom of making such a purchase.

49
The dependent variable “advertisement social sharing intention” was measured
using a scale from Huang et al. (2013), adapted to Facebook sharing, which includes
Brown, Bhadury, and Pope's (2010) probability of pass-along scale, probability of talking
about the advertisement, and probability of telling others. As this scale specifically
related to social media sharing regardless of network, the scale was expanded using
original items designed to address sharing behaviors specific to Facebook. Specifically,
respondents were asked their intentions respecting liking, sharing, or sending the video in
a private message. Respondents were asked the likelihood of engaging in each action,
measured on seven-point, Likert scales ranging from “strongly disagree” to “strongly
agree.” Sample statements from this scale include, “I am likely to pass-along this video to
others on Facebook,” and, “I am likely to share this video on Facebook.”
The independent variable “Facebook intensity” was measured using an approach
to measuring media usage utilized by Perse and Ferguson (1993). Participants were asked
to indicate how many hours they spent on Facebook yesterday and how many hours they
spent using Facebook on a typical day, with the resulting measure being the average of
the two. In addition, respondents were asked to indicate how many friends they have on
Facebook.
Demographic data related to gender identity, ethnic background, and age were
collected. At the conclusion of these measures, participants were asked to respond to an
open-ended prompt asking them their impression of the study. This was used to identify
any problem responses due to experimental awareness. No issues with the survey were
identified based on these open-ended responses.
50
Conclusion
This chapter outlined the experimental method utilized to address the hypotheses
and research questions introduced in chapter two. The chapter presented the sampling
procedure as well as the experimental procedure of the study, and it described the results
of a pretest designed to evaluate the study stimulus and determine the viral videos utilized
in the stimulus. Finally, study measures were introduced and described. The next chapter
will present the results of the experiment. Descriptive statistics of the study sample will
be presented along with statistics dealing with scale reliability. Then, correlation and
regression analyses will be utilized to address the study’s hypotheses and research
questions.
51
CHAPTER IV
RESULTS
This chapter presents the findings of statistical tests used to analyze the results of
the quantitative experiment and address the hypotheses and research questions. First,
descriptive statistics related to the sample are presented along with the results of
univariate outlier analyses and randomization checks. Second, scale reliability statistics,
descriptive statistics, and a factor analysis are presented. Third, the chapter presents
results of statistical tests designed to test the hypotheses and address the research
questions.
Data Analysis
A t-test and hierarchical regression were performed to address the first set of
hypotheses (H1-4) and the first Research Question (RQ1). H1 argued the presence of
social cues in Facebook advertisements leads to positive brand attitudes. H2 predicted
stronger network ties in social context cues in Facebook advertisements lead to more
positive brand attitudes. H3 predicted greater numbers in social context cues in Facebook
advertisements lead to more positive brand attitudes. H4 predicted higher intensity
Facebook users have more positive brand attitudes of Facebook advertisements
containing social cues. Finally, RQ1 asked if there was interaction between tie strength,
tie number, and Facebook intensity exerting influence on brand attitudes in Facebook
advertisements containing social cues.
Hierarchical regressions were utilized to test H5, which predicted positive
advertising attitude predicts positive brand attitude, H6, which suggested positive

52
advertising attitude predicts social media sharing of the advertisement, and H7, which
argued positive brand attitude predicts purchase intention.
Regressions were performed to test H8, which argued bridging social capital
positively moderates the relation between brand attitude and purchase intention for
Facebook advertisements with social cues, H9, which suggested bridging social capital
positively moderates the relation between advertising attitude and social sharing intention
for Facebook advertisements with social cues, RQ2, which asked if bridging social
capital moderates the relation between advertising social impact and brand attitude for
Facebook advertisements with social cues, and RQ3, which asked if bridging social
capital moderates the relation between advertising attitude and brand attitude for
Facebook advertisements with social cues.
Sample
A total of 227 students completed the study. At the conclusion of the study,
responses that had been flagged during the experiment as problematic were eliminated.
Four respondents were eliminated because they did not have a Facebook account, two
respondents were eliminated because the advertisement did not display correctly, three
respondents were eliminated because they did not proceed past the first question, two
respondents were eliminated because they did not proceed past the first scale to see the
advertisement, and two respondents were eliminated because they did not click to log in
to Facebook during the study. The resulting sample (N = 214) was predominantly white
(N = 135) and 55.6% female (N = 119). Complete demographics are presented in Table
4.1.

53
Univariate outlier analyses were conducted for the main dependent variables.
Cases were considered for omission from study analysis if they were a univariate outlier
on one or more dependent variables. The standard to determine if a variable was an
outlier was whether or not it was +/- 3.0 standard scores beyond the mean of the variable.
Decisions to omit any of the outlier cases were based on the frequency with which a case
appears as an outlier as well as the magnitude of deviation of the outlier, with the
retention of all cases as the default position. As only three cases were outliers in more
than one variable, and no cases were outliers in three or more variables, the default
position was maintained. Table 4.2. presents the outlier cases by variable.
As previously mentioned, individuals with concerns about the invasiveness of
Facebook advertisements are less likely to have positive brand attitudes or purchase
intentions (Jung et al., 2016). One question in the survey was designed to address
concerns with privacy; specifically, respondents were asked how invasive they felt the
advertisement was on a seven-point scale ranging from “very invasive” to “not at all
invasive.” On average, study respondents did not find the Facebook ad to be invasive (M
= 5.92, SD = 1.49); however, those who evaluated the advertisement as excessively
invasive were eliminated from analysis to control for possible bias towards the
experimental manipulation. As with the univariate outlier analyses, respondents who felt
the advertisement was invasive beyond -3 were eliminated from analysis. Three such
cases were identified and eliminated.
Checks of randomization were performed to reveal if there were any significant
differences between participants by each randomly assigned condition on the
demographic variables. Chi-squares were used to test the differences between each

54
condition, control, tie strength, and tie number, and both gender and race (white vs. non-
white participants.) There were no statistically significant differences in the presence of
men and women in either the tie strength (χ2 = 2.46, p > .05) or tie number (χ2 = 2.92, p >
.05) conditions. Likewise, there were no statistically significant differences in the
presence of non-white and white participants in either the tie strength (χ2 = 3.21, p > .05)
or tie number (χ2 = 1.76, p > .05) conditions. ANOVAs were used to the test the
differences between each condition and age. There were no statistically significant
differences in age for either the tie strength, F(2, 208) = 2.48, p > .05, or tie number, F(2,
208) = 1.64, p > .05, conditions.
Measures
To evaluate the reliability of survey measures, Cronbach’s alphas were utilized.
Cronbach’s alpha is used to measure the reliability of scale measures, and research
suggests alphas should be between .7 and .95 (Tavakol & Dennick, 2011), however, a
cut-off of closer to .8 is more desirable (Nunnally, 1978). Based on this criteria, measures
for “bridging social capital” (Williams, 2006), α = .85, “attitude towards the
advertisement” (Madden et al., 1988), α = .92, and “purchase intention” (J. Huang et al.,
2013), α = .79, were all reliable based on Travakol & Dennick (2011). Descriptive
statistics and Cronbach’s alphas for measured variables and measure items are presented
in Table 4.3.
When examining “brand attitude” (A. A. Mitchell & Olson, 1981), it was
determined at the experiment’s conclusion that one item had been reversed inconsistently
in contrast to the other three items included in the scale. The item asked participants to
rate the brand on a scale ranging from “pleasant” to “unpleasant,” while the other three

55
items in the scale listed the negative word first (i.e. “bad” to “good,” or “very dislikable”
to “very likable.”) Not only was this inconsistent with the brand attitude scale, but it was
also inconsistent with all of the items in the study. While the resulting scale with all four
items, including a recoded version of the improperly presented item, had marginal
reliability (α = .76), by removing the item, the reliability of the scale was improved (α =
.88). This improved alpha matched exactly the alpha from Mitchell and Olson’s study
that originated the scale. As such, the item was eliminated to improve the reliability of
the scale and address the problem with survey design and execution.
The dependent variable “advertisement social sharing intention” utilized both an
established scale (Brown et al., 2010; J. Huang et al., 2013) as well as three original items
developed to address sharing behaviors specific to Facebook’s interface. To determine
the six items’ association with the latent construct, “advertisement social sharing,” a
factor analysis was employed. Principal components analysis (PCA) was chosen as the
technique of factor analysis, given its ability to retain as much information as possible
from the chosen variables, thus reducing measured variables into a smaller set (Park,
Dailey, & Lemus, 2002). As such, PCA is useful for item reduction, which was desirable
to help eliminate any superfluous items from the expanded measure. In addition, the
oblimin rotation method was utilized since oblique rotation methods allow factors to
correlate, avoiding the often-misleading results produced by orthogonal methods (such as
varimax) when significant correlations are present (Fabrigar, Maccallum, Wegener, &
Strahan, 1999). As recommended by Hair et al. (2006) for a sample of 200, factor
loadings of .4 or greater were included in factor groupings. The six items were grouped

56
into one factor. See Table 4.4. for factor loadings. The resulting scale was reliable, α =
.92.
Facebook intensity was represented by respondents’ average daily Facebook use
(Perse & Ferguson, 1993) as well as by Facebook friend count. There was a statistically
significant correlation between average Facebook use and Facebook friend count, r = .23,
p < .01. While the relationship was significant, the correlation was relatively weak,
suggesting the uniqueness of each measure. As such, consistent with previous research
(Miller & Brunner, 2008), Facebook intensity was represented using the average
Facebook use measure.
Social Impact
The first hypothesis posited that the mere presence of a social context cue on a
Facebook advertisement would lead to a more positive brand attitude toward the brand
sponsoring the video. To test this hypothesis, an independent samples t-test was
employed to compare the means of brand attitudes between those in one of the four
experimental factors who saw a social context cue included with their Facebook
advertisement and those in one of the control groups who did not see a social context cue
included with their Facebook advertisement. There was homogeneity of variances, as
assessed by Levene’s (1960) test for equality of variances (p > .05). Based on the t-test (N
= 211), those who did not see a social context cue with their advertisement (n = 42, M =
4.84, SD = 1.26) had less positive brand attitudes than those who saw a social context cue
with their advertisement (n = 169, M = 5.43, SD = 1.03), a statistically significant
difference with a medium effect size, t(209) = -3.16, p < .01, d = .54. Figure 4.1.
represents the relation between the presence and absence of a context cue.

57
This relationship was further examined using a one-way ANOVA to compare the
means of brand attitudes of each experimental condition, including the control condition.
With the ANOVA, there was homogeneity of variances as assessed by Levene’s test for
equality of variances (p > .05). Based on the ANOVA, there were significant differences
in brand attitudes between the experimental conditions, F(4, 206) = 3.38, p < .05. LSD
post hoc analysis revealed participants in the control condition (n = 42, M = 4.84, SD =
1.26) had statistically significant, less positive brand attitudes than those in the low
strength, low number condition (n = 44, M = 5.56, SD = 1.00, p < .01); the low strength,
high number condition (n = 44, M = 5.42, SD = .94, p < .05); and the high strength, high
number condition (n = 42, M = 5.54, SD = 1.16, p < .01). While the control condition
was less positive than the high strength, low number condition (n = 39, M = 5.16, SD =
.98) the difference was not statistically significant (p > .05). There were no statistically
significant differences between any of the experimental conditions outside of the control
condition. Figure 4.2. presents the differences between each condition and the control.
Given the results of the t-test and the significant differences between all of the
experimental conditions and the control except for one, this hypothesis had strong
support.
H2 and H3 suggested that greater strength of social ties in social context cues in
Facebook advertisements and greater numbers of social ties in social context cues in
Facebook advertisements would produce more positive brand attitudes. H4 suggested
high intensity Facebook users would have more positive brand attitudes for Facebook
advertisements containing social cues. RQ1 asked if there was an interaction between tie
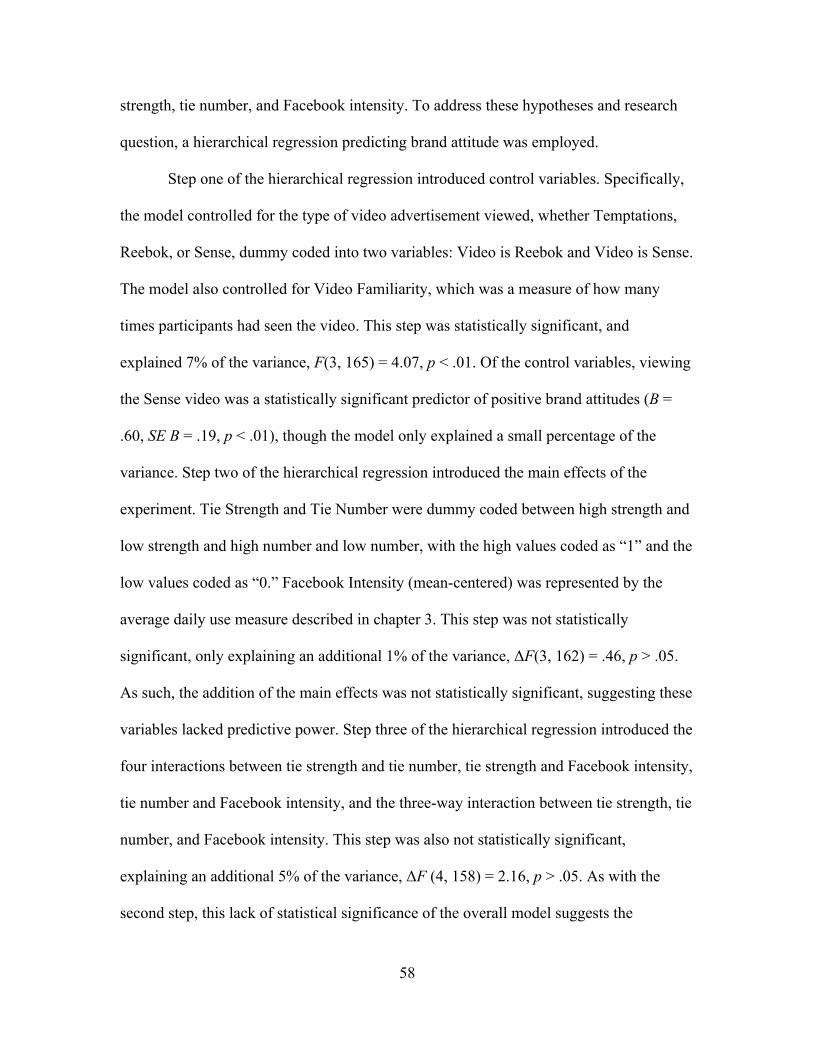
58
strength, tie number, and Facebook intensity. To address these hypotheses and research
question, a hierarchical regression predicting brand attitude was employed.
Step one of the hierarchical regression introduced control variables. Specifically,
the model controlled for the type of video advertisement viewed, whether Temptations,
Reebok, or Sense, dummy coded into two variables: Video is Reebok and Video is Sense.
The model also controlled for Video Familiarity, which was a measure of how many
times participants had seen the video. This step was statistically significant, and
explained 7% of the variance, F(3, 165) = 4.07, p < .01. Of the control variables, viewing
the Sense video was a statistically significant predictor of positive brand attitudes (B =
.60, SE B = .19, p < .01), though the model only explained a small percentage of the
variance. Step two of the hierarchical regression introduced the main effects of the
experiment. Tie Strength and Tie Number were dummy coded between high strength and
low strength and high number and low number, with the high values coded as “1” and the
low values coded as “0.” Facebook Intensity (mean-centered) was represented by the
average daily use measure described in chapter 3. This step was not statistically
significant, only explaining an additional 1% of the variance, ΔF(3, 162) = .46, p > .05.
As such, the addition of the main effects was not statistically significant, suggesting these
variables lacked predictive power. Step three of the hierarchical regression introduced the
four interactions between tie strength and tie number, tie strength and Facebook intensity,
tie number and Facebook intensity, and the three-way interaction between tie strength, tie
number, and Facebook intensity. This step was also not statistically significant,
explaining an additional 5% of the variance, ΔF (4, 158) = 2.16, p > .05. As with the
second step, this lack of statistical significance of the overall model suggests the

59
experimental variables were not predictive of positive brand attitudes. Table 4.5. presents
the results of this hierarchical regression.
In the final step of the regression, there were statistically significant relations
between the main effect of tie strength (B = -.45, SE B = .22, p < .05), the interaction
between strength and intensity (B = -.56, SE B = .28, p < .05), the interaction between
number and intensity (B = -.50, SE B = .24, p < .05), and the three-way interaction
between strength, number, and intensity (B = .79, SE B = .34, p < .05) and brand attitude.
Figure 4.3. presents the three-way interaction between strength, number, and intensity.
However, given that neither step two, which introduced the main effects, and step three
were statistically significant in the model, and the overall model explained only about
13% of the variance, the results of the regression do not support hypotheses two, three or
four, and the results suggest that there is not a significant interaction between the three
factors.
Advertising, Brand, and Purchase Attitudes
H5 posited that a positive attitude towards the advertisement would predict a
positive brand attitude. To test this hypothesis, a hierarchical regression was employed.
Step one of the regression introduced the control variables, specifically the video stimuli
viewed, dummy coded as “Video is Reebok” and “Video is Sense,” and video familiarity.
This step explained 6% of the variance and was statistically significant, F(3, 207) = 4.51,
p < .01. As with social impact, when controlling for the other control variables, viewing
the Sense video was a statistically significant predictor of brand attitudes (B = .60, SE B =
.18, p < .01). Step two of the regression introduced the other independent variables:
Facebook intensity of use, social impact – dummy coded as whether or not the social
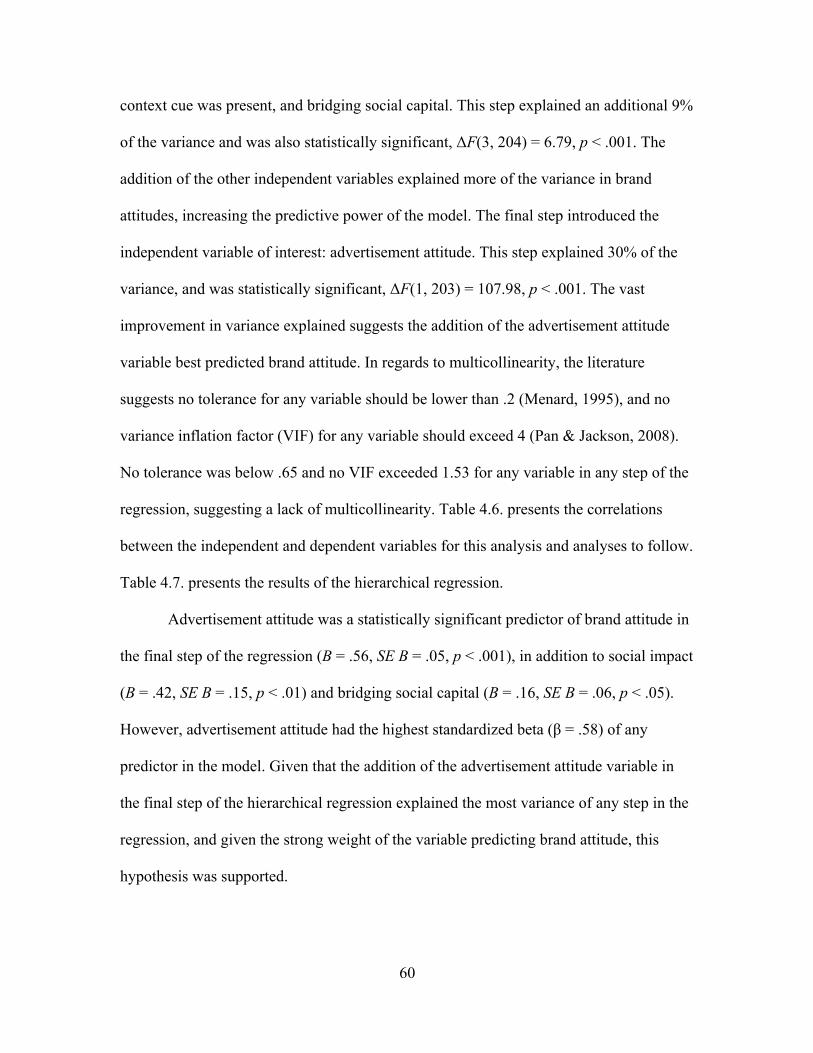
60
context cue was present, and bridging social capital. This step explained an additional 9%
of the variance and was also statistically significant, ΔF(3, 204) = 6.79, p < .001. The
addition of the other independent variables explained more of the variance in brand
attitudes, increasing the predictive power of the model. The final step introduced the
independent variable of interest: advertisement attitude. This step explained 30% of the
variance, and was statistically significant, ΔF(1, 203) = 107.98, p < .001. The vast
improvement in variance explained suggests the addition of the advertisement attitude
variable best predicted brand attitude. In regards to multicollinearity, the literature
suggests no tolerance for any variable should be lower than .2 (Menard, 1995), and no
variance inflation factor (VIF) for any variable should exceed 4 (Pan & Jackson, 2008).
No tolerance was below .65 and no VIF exceeded 1.53 for any variable in any step of the
regression, suggesting a lack of multicollinearity. Table 4.6. presents the correlations
between the independent and dependent variables for this analysis and analyses to follow.
Table 4.7. presents the results of the hierarchical regression.
Advertisement attitude was a statistically significant predictor of brand attitude in
the final step of the regression (B = .56, SE B = .05, p < .001), in addition to social impact
(B = .42, SE B = .15, p < .01) and bridging social capital (B = .16, SE B = .06, p < .05).
However, advertisement attitude had the highest standardized beta (β = .58) of any
predictor in the model. Given that the addition of the advertisement attitude variable in
the final step of the hierarchical regression explained the most variance of any step in the
regression, and given the strong weight of the variable predicting brand attitude, this
hypothesis was supported.

61
H6 suggested that a positive attitude towards the advertisement would predict
social media sharing of the advertisement. To test this hypothesis, a hierarchical
regression was performed. As with the testing of hypothesis five, step one of the
regression introduced the control variables: the video stimuli viewed and video
familiarity. The introduction of the control variables explained 2% of the variance and
was not statistically significant, F(3, 207) = 1.27, p > .05, suggesting the control variables
were not predictive of social sharing. Step two of the regression introduced the other
independent variables: Facebook intensity, social impact, and bridging social capital.
This step explained an additional 14% of the variance and was statistically significant,
ΔF(3, 204) = 11.53, p < .001. The addition of the other independent variables improved
the model and explained a modest level of variance. The third and final step introduced
the independent variable of interest: advertisement attitude. This step explained 26% of
the variance, and was statistically significant, ΔF(1, 203) = 92.65, p < .001. The addition
of the advertisement attitude variable greatly improved the variance explained,
suggesting this variable was the best predictor of social sharing. No tolerance was below
.65 and no variance inflation factor exceeded 1.53 for any variable in any step of the
regression, suggesting a lack of multicollinearity (Menard, 1995; Pan & Jackson, 2008).
Table 4.8. presents the results of the hierarchical regression.
Advertisement attitude was a statistically significant predictor of advertisement
social sharing in the final step of the regression (B = .74, SE B = .08, p < .001), as was
bridging social capital (B = .48, SE B = .09, p < .001). Advertisement attitude was the
best predictor as it had the highest standardized beta (β = .55) of any of the predictor
variables in the model. Also, the addition of the advertisement attitude variable in the

62
final step of the hierarchical regression explained the most variance of any step in the
regression. As such, this hypothesis was supported.
H7 posited that brand attitude would predict purchase intention of the advertised
product. This hypothesis was tested with a hierarchical regression. As with the testing of
hypotheses five and six, step one of the regression introduced the control variables: the
video stimuli viewed and video familiarity. Step one explained 5% of the variance and
was statistically significant, F(3, 207) = 3.36, p < .05. As with previous analyses, viewers
of the Sense video were more likely to have positive brand attitudes than the other
controls (B = .52, SE B = .22, p < .05). Step two of the regression introduced the other
independent variables: Facebook intensity, social impact, bridging social capital, and
advertisement attitude. This step explained an additional 16% of the variance and was
statistically significant, ΔF(4, 204) = 9.99, p < .001. Adding the other independent
variables improved the model, explaining more of the variance. The third and final step
introduced the independent variable of interest: brand attitude. The third step explained
18% of the variance, and was statistically significant, ΔF(1, 202) = 59.56, p < .001. The
addition of the independent variable of interest, brand attitude, best predicted purchase
intentions. No tolerance was below .56 and no variance inflation factor exceeded 1.80 for
any variable in any step of the regression, suggesting a lack of multicollinearity (Menard,
1995; Pan & Jackson, 2008). Table 4.9. presents the results of the hierarchical regression.
Brand attitude was a statistically significant predictor of advertisement social
sharing in the final step of the regression (B = .69, SE B = .09, p < .001), as was bridging
social capital (B = .23, SE B = .08, p < .01). Brand attitude was the best predictor in the
model as it had the highest standardized beta (β = .57) of any of the predictors. While

63
only a marginal improvement over step two, the addition of the brand attitude variable in
the final step of the hierarchical regression explained the most variance of any step in the
regression. As such, this hypothesis was supported.
Social Capital
H8 posited that bridging social capital would positively moderate the relation
between brand attitude and purchase intention for Facebook advertisements with social
cues. Using Model 1 of the PROCESS macro by Hayes (2013), it was determined that the
relation between brand attitude and purchase intention was moderated by bridging social
capital, as the interaction was statistically significant (β = .17, SE = .07, p < .05). Table
4.10. presents the results of the regression. The interaction is illustrated in Figure 4.4. The
interaction was probed by testing the conditional effects of brand attitude at three levels
of bridging social capital, one standard deviation below the mean, at the mean, and one
standard deviation above the mean. As shown in Table 4.11., brand attitude was
significantly related to purchase intention when bridging social capital was one standard
deviation below the mean (p < .001), when at the mean (p < .001), and one standard
deviation above the mean (p < .001). Using the Johnson-Neyman technique, it was
demonstrated that the relationship between brand attitude and purchase intention was
statistically significant when bridging social capital was above -2.11 standard deviations
below the mean. In other words, bridging social capital moderated the relationship
between brand attitude and purchase intention for individuals whose bridging social
capital was more than two standard deviations below the mean of bridging social capital
and higher. For those with bridging social capital well below the mean, it still exerted

64
influence on the relation between brand attitude and purchase intention. This hypothesis
was supported.
H9 suggested bridging social capital would positively moderate the relation
between advertisement attitude and social sharing intention for Facebook advertisements
with social cues. Using Model 1 of the PROCESS macro by Hayes (2013), it was
determined that the relation between advertisement attitude and advertisement social
sharing intention was moderated by bridging social capital, as the interaction was
statistically significant (β = .21, SE = .09, p < .05). Table 4.12. presents the results of the
regression. The interaction is illustrated in Figure 4.5. The interaction was probed by
testing the conditional effects of advertisement attitude at three levels of bridging social
capital, one standard deviation below the mean, at the mean, and one standard deviation
above the mean. As shown in Table 4.13., advertisement attitude was significantly related
to advertisement social sharing when bridging social capital was one standard deviation
below the mean (p < .001), when at the mean (p < .001), and one standard deviation
above the mean (p < .001). Using the Johnson-Neyman technique, it was demonstrated
that the relationship between advertisement attitude and advertisement social sharing was
statistically significant when bridging social capital was above -1.92 standard deviations
below the mean. Similar to the relation between brand attitude and purchase intention,
bridging social capital moderated the relationship between advertisement attitude and
advertisement social sharing for individuals whose bridging social capital was almost two
standard deviations below the mean of bridging social capital and higher. For those with
bridging social capital well below the mean, it exerted influence on the relation between

65
advertisement attitude and advertisement social sharing intention. This hypothesis was
supported.
RQ2 sought to determine if bridging social capital moderated the relation between
advertisement social impact and brand attitude for Facebook advertisements with social
cues. Using Model 1 of the PROCESS macro by Hayes (2013), it was determined that the
relation between advertisement social impact and brand attitude was not moderated by
bridging social capital, as the interaction was not statistically significant (β = -.11, SE =
.14, p > .05). Table 4.14. presents the results of the regression. RQ3 asked if bridging
social capital moderated the relation between advertisement attitude and brand attitude
for Facebook advertisements with social cues. Using Model 1 of the PROCESS macro by
Hayes (2013), it was determined that the relation between advertisement attitude and
brand attitude was not moderated by bridging social capital, as the interaction was not
statistically significant (β = .06, SE = .06, p > .05). Table 4.15. presents the results of the
regression.
Conclusion
This chapter detailed the results of the experiment described in chapter 3,
including demographic data and data related to the reliability of study measures. In
addition, the results of statistical tests designed to address the study’s hypotheses and
research questions were presented. Hypothesis testing suggests that there is support for
the presence of social impact in Facebook advertisement social context cues influencing
brand attitudes; however, the individual forces of social impact theory – tie strength, tie
number, and intensity – did not influence brand attitudes as conceptualized. As expected,
attitudes toward the advertisement predicted social sharing of the advertisement as well

66
as brand attitudes, and brand attitudes predicted purchase intentions. In addition, social
capital moderated the relation between brand attitude and purchase intentions as well as
the relation between advertisement attitudes and social sharing. Social capital did not
influence the relation between advertisement attitude and brand attitude nor the relation
between social impact and brand attitude. Table 4.16. presents the conclusions of the
hypotheses and research questions based on the results of this study. Figure 4.6. updates
the hypothetical model presented in chapter 2 to display the supported hypothetical
relations between advertisement attitude, social impact, social capital, social sharing,
brand attitude, and purchase intentions. The final chapter will address the findings
presented here, discuss the theoretical implications of these findings, address the
limitations of the current study, and suggest avenues for future research.

67
CHAPTER V
DISCUSSION
The purpose of this dissertation was to better understand how social cues in
Facebook advertisements exert social impact on brand attitudes and purchase intentions,
as well as to explore the impact of online social capital on brand attitudes, behaviors, and
social sharing intentions. Using an experiment performed with students in marketing and
communication classes at a major university in the Pacific Northwest, this study
determined that the presence of social context cues in Facebook advertisements predicts
positive brand attitudes, which lead to positive purchase intentions. However, varying the
strength and number, and differences in intensity of use, did not predict positive brand
attitudes. Furthermore, bridging social capital moderates the relation between brand
attitudes and purchase intentions as well as the relation between advertisement attitude
and social media sharing intentions, but it does not moderate the relation between
advertisement attitude and brand attitudes nor the relation between advertising social
impact and brand attitudes. This chapter will discuss the results of the study, specifically
addressing the theoretical implications of the study’s findings for social impact theory
and social capital theory.
Theoretical Implications
Social Impact. The findings of this study were consistent with previous research
examining social impact in a Facebook environment; specifically, it was determined that
social cues did, in fact, exert social influence (Waardenburg et al., 2012), but the relation
between the particular components of social impact and social influence were not clear.
While participants who were exposed to social context cues in the advertisement reported

68
higher brand attitudes than those who received no social context cues, there was no
evidence that different levels of tie strength, number, or intensity exerted influence on
brand attitudes in the social media advertising context. The results of the experiment did
not provide strong evidence for main or interaction effects for social context cues that
included strong versus weak network ties, large versus small numbers, and differing
levels of intensity measured as individuals’ daily use of the Facebook network. This is in
contrast to previous research which determined that the strength and immediacy of social
connections in online contexts (Miller & Brunner, 2008; Ng, 2013) as well as the number
of social connections (Mir & Zaheer, 2012) exerted social influence in mediated social
situations, including consumer situations.
This study utilized an approach to its experimental stimuli that was congruent
with Waardenburg et al. (2012). As with the Waardenburg et al. study, this study also did
not find statistically significant main effects of strength and number influencing
Facebook user behavior. Waardenburg et al. attributed this issue to their small sample
size and lack of statistical power. In fact, Waardenburg demonstrated mean differences in
favor of their hypotheses; specifically, those in the high tie strength and high tie number
conditions had larger means of their dependent measure than those in the low tie strength
and low tie number conditions. However, their results were not statistically significant. It
was suggested that a larger sample size with greater numbers in each cell would lead to
statistically significant findings in favor of the hypotheses. As such, because this study
employed a sample of over 200 participants with upwards of 40 subjects in each cell, it
was expected that the findings would support the study hypotheses. This was not the case.
Therefore, alternative explanations for the results must be examined. For instance,

69
Waardenburg et al. concluded that if their sample size was not responsible for their
findings, then perhaps their findings could be explained by the possibility that many who
saw the smaller number cue may have made a positive social comparison about their own
uniqueness, and those who saw the cue indicating the larger network may have assumed
the larger network included their Facebook friends, leading to misleading results.
This speaks to a larger issue about how individuals respond to social cues within
social network contexts, specifically Facebook. Research exploring the use of the
Facebook “like” button has suggested that it is more useful for acknowledging the
posting of other users than responding to group normative pressure (Levordashka, Utz, &
Ambros, 2016). Perhaps the social context cue information presented with advertisements
speaks less to establishing group norms than providing a sense of trends and individual
responses. In other words, individuals may see social context cues not as establishing
expectations of an individual’s brand attitudes or social sharing, but rather the social
context cues might indicate whether or not the content is worth the user’s attention. In
that sense, varying the strength and number of network ties might elicit different
responses depending on how individuals seek to identify with brands within their
networks. For instance, recent research suggests that the desire for uniqueness of a
consumer moderates the relation between social media communication and brand
attitudes, with those who scored higher in their need for uniqueness experiencing lower
brand attitudes based on social media communication (X. Wang, Yu, & Wei, 2012). High
number, high strength ties may elicit a different response in a mediated environment than
in an interpersonal environment, depending on the motivations and social identity needs
of the user.

70
The current study attempted to include all three aspects of social impact: strength
defined as connections between personal networks versus the larger network, number
defined by varying percentages of users at different levels, and intensity defined as
frequency of use of the network. However, previous research examining social impact in
online and social media environments has been inconsistent in regards to how social
impact is conceptualized. Prior research has yet to conceptualize the social forces that
constitute social impact theory in a consistent and universally coherent manner when
examining online communication, incorporating all three social impact forces within one
study. Miller’s and Brunner’s (2008) study explored social impact in an online education
forum, finding evidence of the presence of social impact despite the fact that tie-strength
was dependent upon the communication style of participants, as participants were
anonymous. This is in contrast to the social media setting of the current study, as
Facebook’s network requires personal disclosure. Exploring social impact in a social
media setting, Ng (2013) was able to consider tie-strength based on actual network ties,
finding evidence of social impact. However, both studies did not consider number as a
factor in their models, which was manipulated in the current study. However, Mir and
Zaheer (2012), in their study of social media recommendations, considered number
without considering tie strength. Unlike the current study, while each of these studies
found evidence of social impact in online mediated environments, they employed
different approaches to conceptualizing social impact’s key elements, omitting certain
elements.
Given the finding of this study that social impact was present, though the
individual forces of social impact did not appear to exert impact, themselves, it would
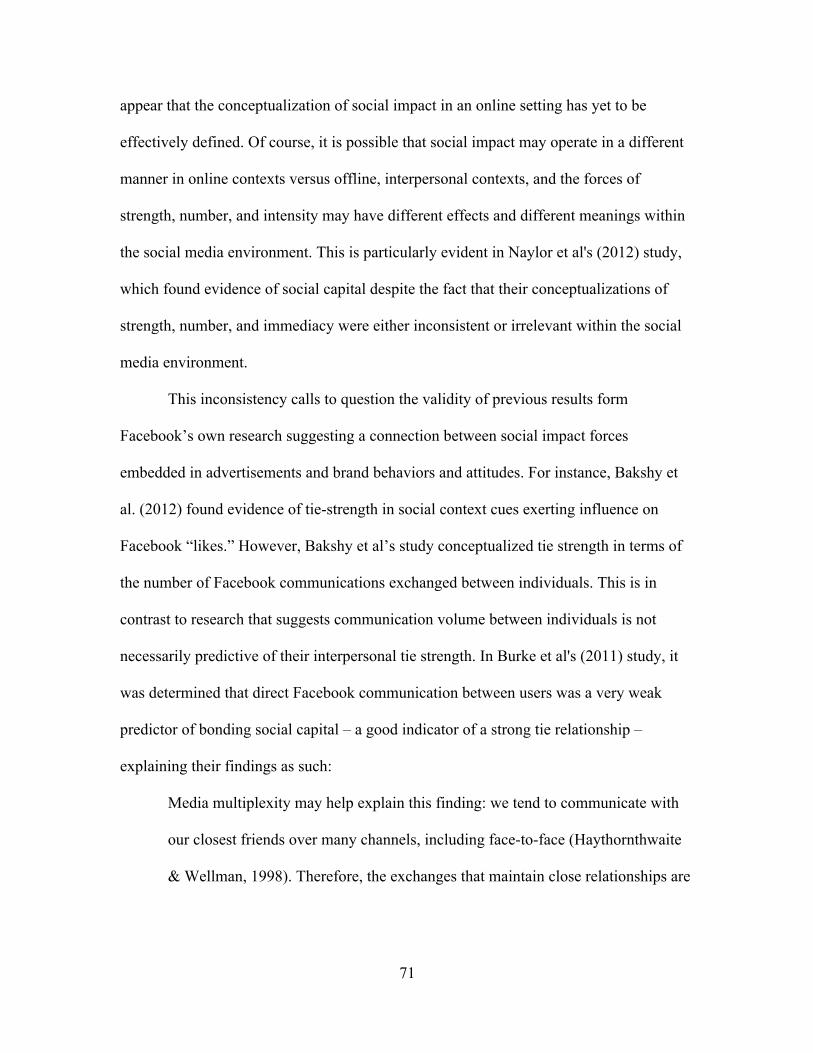
71
appear that the conceptualization of social impact in an online setting has yet to be
effectively defined. Of course, it is possible that social impact may operate in a different
manner in online contexts versus offline, interpersonal contexts, and the forces of
strength, number, and intensity may have different effects and different meanings within
the social media environment. This is particularly evident in Naylor et al's (2012) study,
which found evidence of social capital despite the fact that their conceptualizations of
strength, number, and immediacy were either inconsistent or irrelevant within the social
media environment.
This inconsistency calls to question the validity of previous results form
Facebook’s own research suggesting a connection between social impact forces
embedded in advertisements and brand behaviors and attitudes. For instance, Bakshy et
al. (2012) found evidence of tie-strength in social context cues exerting influence on
Facebook “likes.” However, Bakshy et al’s study conceptualized tie strength in terms of
the number of Facebook communications exchanged between individuals. This is in
contrast to research that suggests communication volume between individuals is not
necessarily predictive of their interpersonal tie strength. In Burke et al's (2011) study, it
was determined that direct Facebook communication between users was a very weak
predictor of bonding social capital – a good indicator of a strong tie relationship –
explaining their findings as such:
Media multiplexity may help explain this finding: we tend to communicate with
our closest friends over many channels, including face-to-face (Haythornthwaite
& Wellman, 1998). Therefore, the exchanges that maintain close relationships are
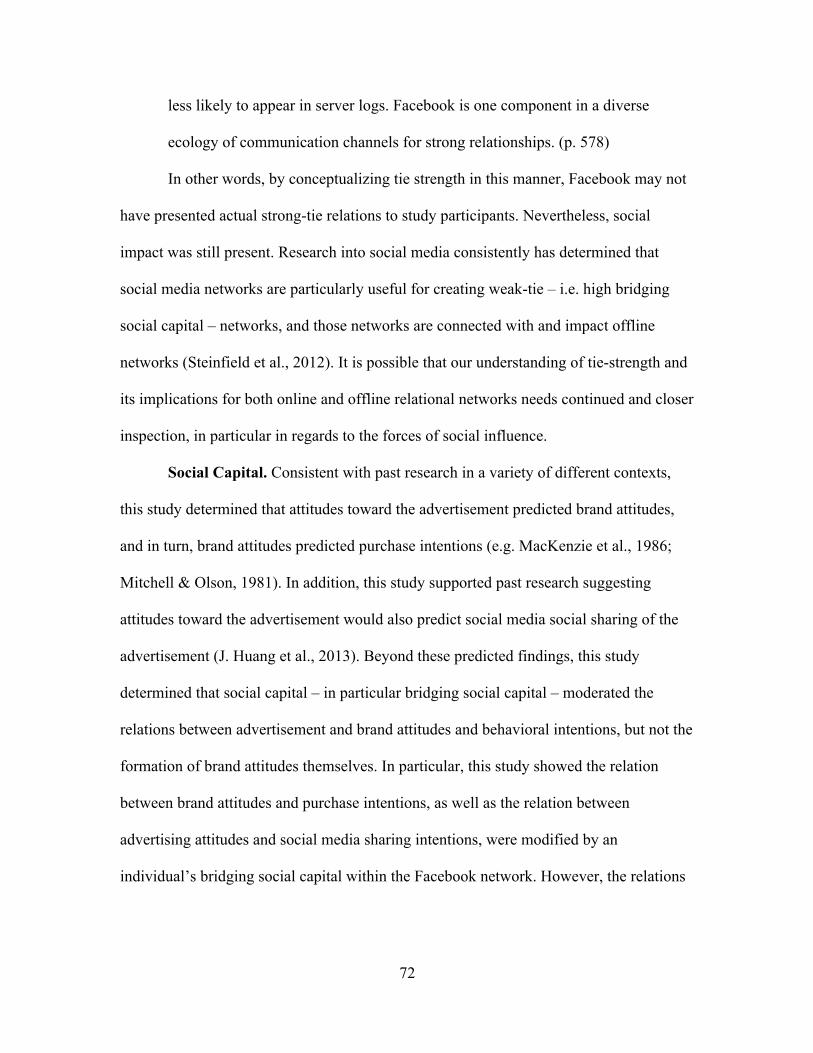
72
less likely to appear in server logs. Facebook is one component in a diverse
ecology of communication channels for strong relationships. (p. 578)
In other words, by conceptualizing tie strength in this manner, Facebook may not
have presented actual strong-tie relations to study participants. Nevertheless, social
impact was still present. Research into social media consistently has determined that
social media networks are particularly useful for creating weak-tie – i.e. high bridging
social capital – networks, and those networks are connected with and impact offline
networks (Steinfield et al., 2012). It is possible that our understanding of tie-strength and
its implications for both online and offline relational networks needs continued and closer
inspection, in particular in regards to the forces of social influence.
Social Capital. Consistent with past research in a variety of different contexts,
this study determined that attitudes toward the advertisement predicted brand attitudes,
and in turn, brand attitudes predicted purchase intentions (e.g. MacKenzie et al., 1986;
Mitchell & Olson, 1981). In addition, this study supported past research suggesting
attitudes toward the advertisement would also predict social media social sharing of the
advertisement (J. Huang et al., 2013). Beyond these predicted findings, this study
determined that social capital – in particular bridging social capital – moderated the
relations between advertisement and brand attitudes and behavioral intentions, but not the
formation of brand attitudes themselves. In particular, this study showed the relation
between brand attitudes and purchase intentions, as well as the relation between
advertising attitudes and social media sharing intentions, were modified by an
individual’s bridging social capital within the Facebook network. However, the relations

73
between advertisement attitude and brand attitude, and social impact and brand attitude,
were not moderated by bridging social capital.
As expected, bridging social capital was a significant moderator of the relation
between advertisement attitude and social media sharing of the advertisement. This is
consistent with prior research that has shown bridging social capital predicts intentions to
share controversial opinions online (Sheehan, 2015), and bridging social capital is an
important factor in opinion leader recommendations (Burt, 1999), as opinion leaders
depend on weak-tie connections with their broader network to share and disseminate
ideas and innovations. Furthermore, examining Facebook in particular, bridging social
capital was strongly associated with direct communication (Burke et al., 2011) and
relational maintenance (Ellison et al., 2014). This study provides further evidence for the
relation between social media sharing and the creation and maintenance of bridging
social capital. The larger a Facebook user’s network of weak-tie, distant connections, the
more motivated they would appear to be to share content that interests them via the social
network. As evidenced by this study, those who have a positive attitude towards an
advertisement will be most motivated to share the advertisement in their networks if they
have a generally favorable perception of the strength and trustworthiness of that network.
In accordance with Ng's (2013) findings, social capital was a predictor of
purchase intention, moderating the relation between brand attitude and purchase
intention. However, unlike Ng’s study, which examined purchase intention in an online
setting through a Facebook-based ecommerce site, purchase intentions in this study were
not specifically tied to an online act to make the purchase. The advertisements themselves
did not contain a link or connection to an external purchasing site, nor a direct call-to-

74
action directing participants to make a purchase within the social media or connected
framework. The influence of online, social-media-based social capital on purchase
behaviors that may not take place in an online, social media setting observed in this study
provides evidence for the strong connection between online social capital and offline
social capital suggested by Williams (2006). While it has been argued that media use has
social outcomes, especially the creation of social capital (Papacharissi & Mendelson,
2011), this finding suggests that online social capital has offline behavioral outcomes,
especially if the attitude that predicts the behavior was formed online.
To better understand the relation between online attitude formation and purchase
intentions that do not necessarily require an online context suggested by this study, it is
important to note that not all social sharing is driven by online content – applications
such as Instagram and Snapchat encourage users to share images and videos from their
everyday, “offline” lives. As such, individuals may be more inclined to engage in an
offline activity if they perceive it will have an online social benefit. In the case of this
study, purchase intentions may have been driven by the potential opportunity to engage in
social sharing and conversations driven by the purchase, as evidenced by the strong
moderation effect of social capital on brand attitudes predicting purchase intentions.
Subjects considered the social capital benefits of their purchasing intentions. In other
words, the decision to make purchases – and not just online purchases – could be
motivated by the potential for online social attention through social media sharing, thus
building and maintaining network social capital. Any behavior – not just media
consumption – can have mediated social benefits. Research suggests that the relation
between social influence and purchase intentions is moderated by the manner in which
75
the good is consumed, with publicly consumed goods predicting more positive purchase
intentions (Kulviwat, Bruner, & Al-Shuridah, 2009). Social media enables almost any
consumptive practice to become a public act. Not surprisingly, this study suggested that
participants with a robust, weak-tie Facebook network were more likely to purchase the
items about which they formed a positive attitude, as their purchase could potentially
provide opportunities for mediated social interaction.
Given that this study found social capital served as a moderator between attitudes
and behaviors, but did not predict the attitudes themselves, it provides insight into social
capital’s place in the larger conversation respecting social influence. Two concepts key to
understanding social influence are the ideas of private acceptance and public compliance
(Sherif, 1936). Private acceptance can be defined as “conforming to other people’s
behavior out of a genuine belief that what they are doing or saying is right,” while public
compliance is defined as “conforming to other people’s behavior publically without
necessarily believing in what the other people are doing or saying” (Aronson et al., 2015,
p. 232). Research has suggested that the more an individual feels accepted by a group, the
more likely they will both privately accept and publicly comply with normative pressure;
however, when an individual’s feelings of acceptance are marginal, they will publicly
comply to group norms without a high degree of private acceptance (Dittes & Kelley,
1956). Simply put, behavioral compliance is easier to come by than private acceptance in
social contexts when social influence is present. In addition, compliance is motivated by
both position within a group as well as the group’s position within larger networks of
groups (Branscombe, Spears, Ellemers, & Doosje, 2012), suggesting perceived network
ties may motivate individual compliance as well as acceptance.

76
As a predictor of behavioral intentions, both social media sharing and purchase
intentions, social capital may play a role in public compliance. However, social capital
did not appear to play a role in attitude formation, suggesting it may not play a role in
private acceptance. As evidenced by this study, social capital comes into play when
attitudes are translated into behaviors, but they do not appear to play a role when attitudes
are forming. Social capital was not considered when participants were crafting their
brand attitude after viewing the stimulus, but when it came time to consider purchase
intentions, social capital played a role. Likewise, social capital was considered when
participants considered sharing the advertisement within their social networks. This is
consistent with the theory of reasoned action (Fishbein, 1963; Fishbein & Ajzen, 1975),
where social norms work alongside attitudes to influence behavioral intentions. In this
case, social capital influences the behavior – the public output of brand attitudes – much
like social norms influence behavior in the reasoned action model.
With regard to social norms and beyond the norms of reciprocity generally
associated with the conceptualization of social capital (Putnam, 2000), it is possible that
increased social capital within a network can aid in the formation and support of social
norms (Adler & Kwon, 2016). A key benefit of social capital is solidarity, which can
facilitate the formation of social norms within networks, and the benefits of established
norms are significant for both weak-tie and strong-tie connections. In particular, social
capital facilitates group trust and cohesion and limits conflict between group members,
and it reduces the need for overt control and monitoring by group leadership. While
social norms, specifically norms of reciprocity, are considered to be a part of the
formation of social capital, it may be possible that social capital can facilitate the

77
formation of norms, themselves. Given this study’s finding that social capital plays a role
in motivating behaviors, it follows that it may indirectly influence the establishment of
group norms in both tight-knit and larger social networks.
Conclusion
Based on the results of this study, it would appear that social impact in social
media advertising social context cues does influence brand attitudes in social media
advertising; however, the accepted conceptualizations of social impact in terms of tie
strength, tie number, and immediacy do not appear to exert influence in a manner
consistent with a traditional understanding of social impact theory. This study also
demonstrated that social capital moderated the relation between attitudes and behavioral
intentions – both online, sharing intentions as well as purchasing intentions. Based on
these findings, it is clear that the nature of online social networks and the ties formed in
these networks have implications for social media advertising and their related brand
behaviors. The final chapter will discuss the implications of this study for the advertising
and media industries, and it will propose avenues for future research while discussing the
study’s limitations.

78
CHAPTER VI
CONCLUSION
As Facebook continues to grow and evolve as both a social network and a global
media channel, the manner in which it presents advertising to its users will have
important implications for the media industry and culture. Understanding the unique
nature of its social media context is important not just for advertisers who hope to better
target and influence target audiences, but also for people who use Facebook and wish to
build and interact with an online social network of friends and acquaintances. This study
found that social impact exerted through social context cues in Facebook advertisements
did influence brand attitudes, though how social impact has been conceptualized in past
research was unable to explain this influence. In addition, the study demonstrated that
social capital built in Facebook’s network moderated the relation between attitudes and
intentions in the social media consumer context, suggesting the trust and expectations of
reciprocity a Facebook user has built in their network plays an important role in how they
respond to advertisements in a social media setting. Based on these findings, this chapter
will discuss industry implications, study limitations, and avenues for future research.
Implications for Practice
For advertisers and social media designers, it is important to understand that social
media advertisements are viewed within an online, mediated social context. While the
advantages of including social context cues are apparent, exactly how that influence
manifests itself is not clear. In addition, how individuals are positioned in their network
in regards to their individual social capital investment is also an important consideration
when determining how social media advertising influences both social sharing action and

79
purchase intentions. While this study as well as past research (i.e. Williams, 2006)
suggests there is a connection between online and offline social capital, it is important to
note that social capital created in an online network is unique to that network, and social
influence exerted in online networks does not necessarily conform to an understanding of
social impact in offline social situations.
Regarding social impact theory specifically, this study’s findings suggest a
traditional understanding of the forces described by the theory may not be adequate to
describe how social context cues exert influence in social media advertising, and perhaps
within social media contexts in general. While Facebook’s research (Bakshy et al., 2012)
suggested that social context cues exerted influence in a manner consistent with the
theory, this study’s findings were not as conclusive. For social media developers and
advertisers, it is important for them to determine their audience’s interpretation of context
information. It may be possible that context cues do not constitute a form of direct
interpersonal persuasion, since the context information provided is done so by the
advertiser and not directly by the Facebook connection. In other words, it is possible that
consumers may not see the context cues as a form of interpersonal influence, but rather as
peripheral cues designed to enhance the persuasion from the advertiser. In a physical
interpersonal setting, the social connections exert direct influence; however, in a social
media advertising setting, the direct influence comes from the advertiser, and it is not
clear if the consumer sees the context cues as exerting direct social influence, or if those
cues play a different role.
For advertisers and social media designers, the exact role social context plays in
persuasive communication needs to be explored. As suggested in the previous chapter,
80
social context cues may simply provide evidence of trends or establish some sort of social
norm rather than exerting direct social influence. As such, varying numbers and tie-
strength my have unexpected results. Perhaps social context cues play a role in the
creation of the fear of missing out (FoMO). Recent research suggests that rather than
reflecting a desire to experience certain events, FoMO may play a mediating role between
social deficiencies, such as loneliness or a need to connect, and social media engagement
(Beyens, Frison, & Eggermont, 2016; Przybylski, Murayama, Dehaan, & Gladwell,
2013). As such, FoMO is less about missing the moment itself, and more about missing
the opportunity to connect with others. Perhaps social context is a reminder that brands
provide opportunities for social connection, and advertising is an important component of
that process.
One of the primary concerns with social media advertising, as well as online
advertising in general, is a concern with threats to privacy and the seemingly invasive
nature of using an individual’s social media data to promote products. This study
suggests the exact process of how social media cues manifest influence is perhaps not
understood in a theoretically coherent manner. As such, social media network managers
should be mindful of how they present social media connection data within advertising
settings, as a variety of factors can potentially influence how those cues are interpreted
and how they impact brand attitudes for advertisers.
Examining social influence in social media contexts is complex, because individual
differences may not be easily identifiable based on available metrics of social media
engagement. This study supported previous research that suggests bridging social capital
is an important predictor of behavioral intentions in social networks; however, using
81
social data alone, it is difficult to identify the strength of network ties due to differing
patterns of social engagement across multiple communication contexts. Social media
advertisers should be aware that social media networks are a part of a complex media and
interpersonal ecosystem, and that the data harvested through such networks may not
provide a complete and accurate picture of an individual’s broader social network. While
there are great opportunities for social media marketers to utilize social media social
influence to better target audiences and increase the effectiveness of their advertisements
via social context, care should be taken given the limits of these networks in projecting an
accurate, complete view of an individual’s preferences and social networks.
Implications for Facebook. Facebook’s commitment to the inclusion of social
context cues in their advertising despite legal challenges suggests the company believes
in the power of these cues to stimulate positive brand outcomes. While Facebook’s own
research (Bakshy et al., 2012) has focused on social context cues and their influence on
“likes” and advertisement clicks, Facebook’s advertising director has suggested that
Facebook’s focus is not on engagement and clicks alone, but rather on advertising
exposure and purchase behaviors (Empson, 2013). However, reports from social media
and digital marketing platforms have cited increases in click-through rates as the key
benefit of Facebook’s advertising (e.g. Ha, 2013). This study suggests that in fact, there is
a benefit to including social context in Facebook advertising for brand attitudes and
subsequent purchase behaviors; however, the influence of context cues on brand attitudes
may not operate in the same manner as Facebook’s researchers have observed when
examining engagement behaviors. If Facebook is concerned with broader brand benefits,
including brand attitudes and purchase intentions, then their current approach may not be
82
addressing these outcomes as their approach intends. Rather than creating social
influence, they may be creating social norms or social trends. The findings of this study
suggest something besides word-of-mouth influence may be at work, and Facebook’s
own approach – whose focus seems to vacillate between driving engagement and
stimulating purchase behaviors – may need further refinement.
Ultimately, Facebook’s vision is “that advertising must be re-organized around
people” (Ha, 2013, para. 4). As such, social context is intended to be something helpful to
its consumers, providing cues as to whom in their social network is engaging with a
brand. However, given this approach may not be operating as Facebook expects, it begs
the question as to just how that benefit is being interpreted. As this research suggests,
social context can lead to positive brand outcomes. However, it does not appear to be
operating as expected in comparison to other social settings. Its influence is unique. If
Facebook hopes to continue to benefit its advertisers and consumers, a better
understanding of exactly how social context cues work within Facebook’s network is
essential.
Limitations and Future Research
For data collection purposes, this study used an advertisement stimulus viewed
outside of the Facebook setting that contained social context cues that differed from the
actual social context provided by Facebook. While efforts were made to conform the
stimulus to the style of a typical Facebook advertisement, it was not possible – absent a
direct connection to Facebook through the Facebook API – to recreate an actual
Facebook experience that would be seamless to the user. As such, it is possible that the
weak findings related to the social impact of the social context cues imbedded in the
83
advertisements were a result of the rather weak external validity of the research design.
Future research should seek to more accurately recreate the actual Facebook experience.
In addition, while pre-testing suggested the manipulation was viewed and
understood by participants, specific manipulations checks were not employed in an effort
to avoid possible priming effects. It is possible that attention to the social cues may have
been a factor in the relative weak findings related to the influence of specific social
impact cues. Future research should utilize methods such as eye-tracking to determine if
attention to the social context cues plays a role in the influence exerted by the social cues.
Future research should also seek to replicate the study in other contexts with different
populations. Several participants made open-ended comments about how they used
Facebook less than other prominent social media applications, such as Twitter, Snapchat,
or Instagram. In addition, the current study’s college student population was drawn from
one university using business and mass communication students, whose social media use
may differ from other student populations. Perhaps repeating the study using a non-
college demographic, or a different college demographic, could result in more definitive
results.
Other social media advertising contexts should be explored to determine whether
the findings from this study reflect the realities of different platforms. While Twitter and
Snapchat are not known to employ social context cues in the same manner as Facebook,
it is possible that social impact is manifested in some other manner. Future research
should seek to better understand these advertising platforms and how social impact is
utilized within them.

84
While this study explored the relation between advertising attitude and social
media sharing intentions, it did not explore the possible relation between brand attitudes
and purchase intentions on social sharing. It is possible that brand attitude plays a
mediational role between advertising attitude and social sharing. In addition, purchase
intentions may be predictive of sharing intentions, as well, as purchase intentions may
suggest a willingness to engage in other brand-positive behaviors. As such, future
research should seek to better understand the role these concepts play in the social media
environment.
Future research should also seek to more carefully and completely define the
forces of social impact within online and social media contexts. As studies have
consistently found evidence of social impact within online environments, though the
conceptualizations of the individual forces have varied widely, it is apparent that how
social impact is manifested within online and social media contexts is not clear. Research
is needed to more effectively define and examine the individual forces of social impact in
online settings. Attention should be given to particular online contexts, such as social
media, online forums, and interactions with ecommerce sites.
Future research should continue to explore the role online social capital plays in
the formation of offline social capital, as well as the role offline actions play in the
formation of online social capital. This study seems to suggest Facebook social capital
predicted purchase intentions for products that did not necessarily need to be purchased
in an online environment. As such, the findings suggest online social capital, in particular
social media social capital, may play a predictive role in day-to-day decision making
outside of the online environment. For example, the purchase of a new garment or the

85
selection of a leisure activity might be as much motivated by the potential social capital
gained when that purchase or activity is shared on Facebook as other motivating factors
typically associated with purchase intentions. Future research should seek to understand
just how important the social utility of non-mediated activities is in motivating actions,
both consumer and non-consumer. It is not unreasonable to suggest that social media use
and online social capital would predict menu item selection, given the frequency with
which restaurant patrons produce mobile phones to snap pictures of their entrée at dining
establishments. Are there differences in the social value of different purchases and
different product categories? How much does social capital predict major purchases, such
as a vehicle or house, versus minor purchases, such as meals? Future research should
seek to answer these questions.
Future research should also seek to better understand the relation between social
capital and social norms. While social capital reflects social norms – in particular norms
of reciprocity – it is expected that the two concepts are independent constructs. However,
their relation, especially in terms of decision-making processes, should be explored.
While this study suggested social capital plays a moderating role between attitudes and
behavioral intentions, it did not explore the role of social capital in the relation between
social norms and behavioral intentions. It is not clear if social capital is interchangeable
with social norms in the reasoned action model, if social capital acts on social norms in a
similar manner to the relation between attitudes and behaviors, or if social capital is
another force in the reasoned action model, altogether. In addition, future research should
seek to understand if the role of social capital is context specific, paying particular
attention to online versus offline decision-making. As previously mentioned, the relation

86
between online and offline social capital merits further research. Efforts should be made
to better understand the distinction between both types of social capital in the reasoned
action model, as well as other models of decision-making and social influence.
Conclusion
As social media advertising continues to grow both in terms of overall advertising
revenue and as a cultural phenomenon, understanding how social media networks deploy
online advertising will become increasingly important. While the implications of using
social media data to more effectively target advertisements warrants close inspection, it is
also important to examine how social media data can influence the content of the
advertisements, themselves. The purpose of this dissertation was to better understand
how social context cues in Facebook influence brand attitudes and social sharing. This
study determined that while individual differences in the nature of social context cues –
specifically differences in the strength of social tie connections and the overall number of
connections – did not impact the social influence of the advertisement on brand attitudes
and subsequent purchase intentions, the mere presence of social context information did
influence brand attitudes. Furthermore, bridging social capital moderated the relations
between advertisement attitudes and social media sharing, and brand attitudes and
purchase intentions. Simply put, this study demonstrated that social context cues in social
media advertisements do exert social influence on brand attitudes, and an individual’s
trust in their network determines their intentions to take brand actions.

87
APPENDIX A
FIGURES
Figure 2.1. Conceptual model presenting hypothesized relations between exposure to social media advertising with social cues, brand attitude, social media sharing intention, and purchase intention.
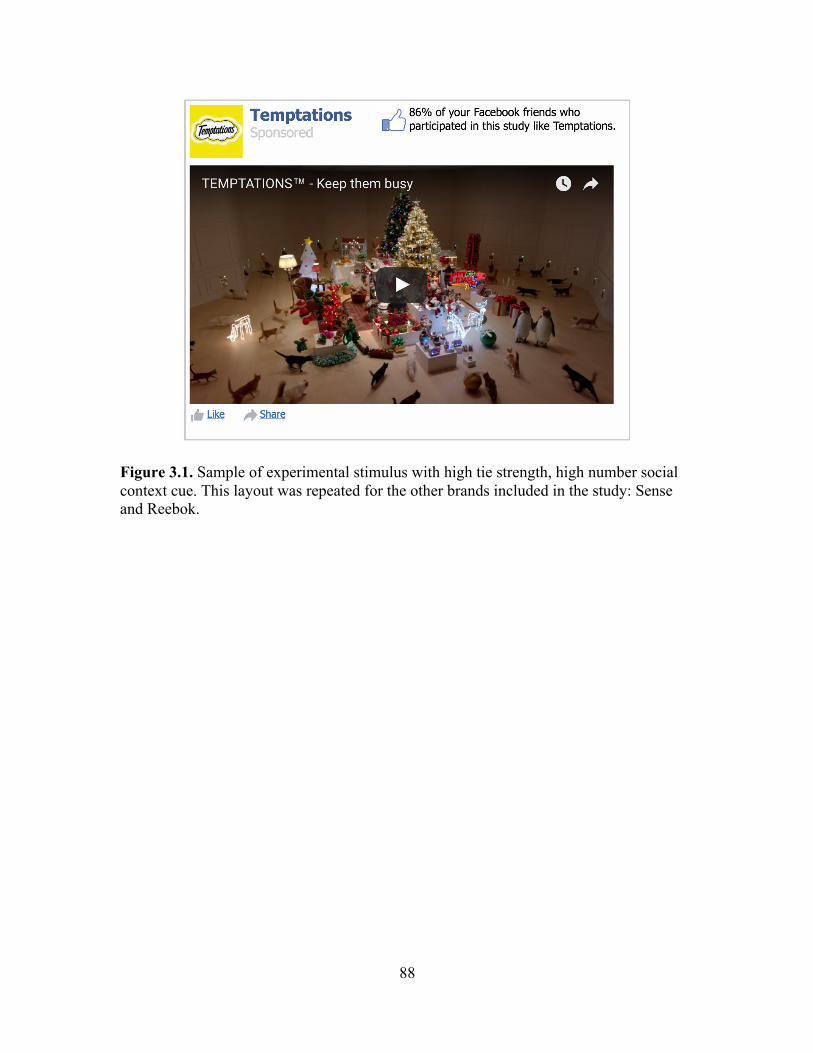
88
Figure 3.1. Sample of experimental stimulus with high tie strength, high number social context cue. This layout was repeated for the other brands included in the study: Sense and Reebok.

89
Figure 3.2. Sample of experimental stimulus with high tie strength, low number social context cue. This layout was repeated for the other brands included in the study: Sense and Temptations.

90
Figure 3.3. Sample of experimental stimulus with low tie strength, high number social context cue. This layout was repeated for the other brands included in the study: Temptations and Reebok.

91
Figure 3.4. Sample of experimental stimulus with low tie strength, low number social context cue. This layout was repeated for the other brands included in the study: Sense and Reebok.

92
Figure 3.5. Sample of experimental stimulus control, which contains no social context cue. This layout was repeated for the other brands included in the study: Sense and Temptations.

93
Figure 4.1. Graph depicting the mean difference of brand attitude between those viewing a Facebook advertisement with a social context cue and those viewing a Facebook advertisement with no social context cue.
3
3.5
4
4.5
5
5.5
6
Social Context Cue No Social Context Cue
Bra
nd A
ttitu
de

94
Figure 4.2. Graph depicting the mean difference of brand attitude between each experimental condition including the control condition.
3
3.5
4
4.5
5
5.5
6
Low Strength, Low Number
High Strength, Low Number
Low Strength, High Number
High Strength, High Number
Control (No Social Context)
Bra
nd A
ttitu
de
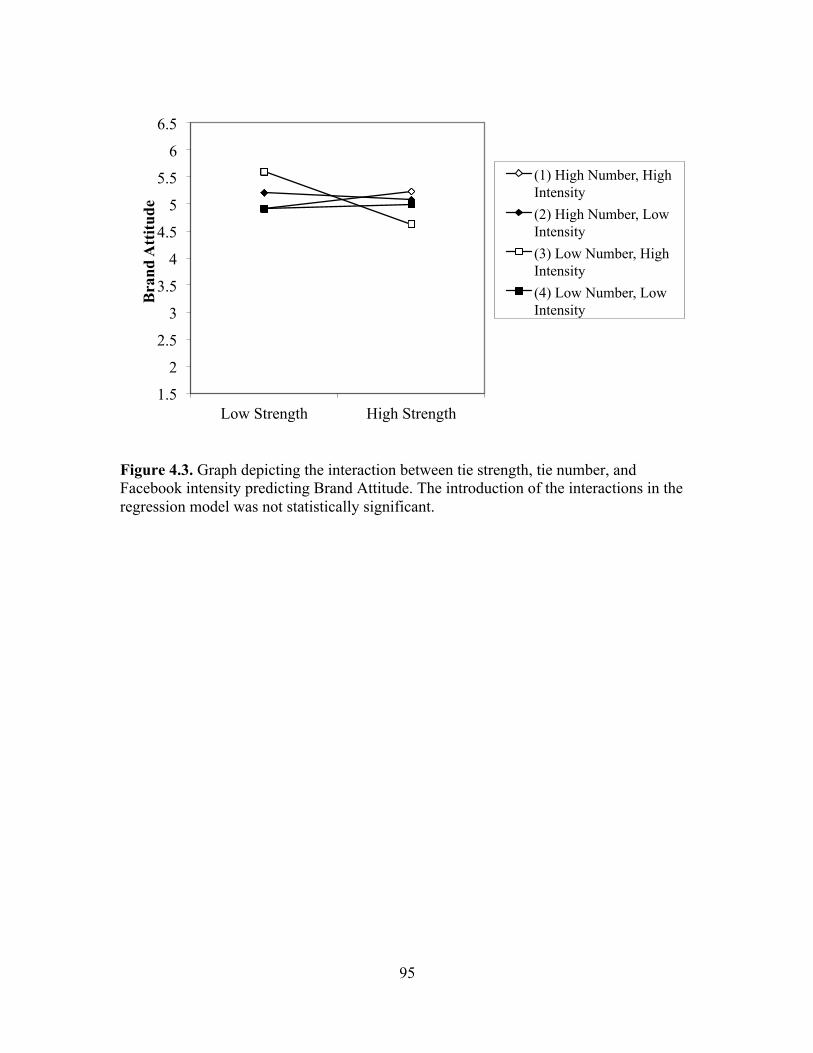
95
Figure 4.3. Graph depicting the interaction between tie strength, tie number, and Facebook intensity predicting Brand Attitude. The introduction of the interactions in the regression model was not statistically significant.
1.5
2
2.5
3
3.5
4
4.5
5
5.5
6
6.5
Low Strength High Strength
Bra
nd A
ttitu
de
(1) High Number, High Intensity (2) High Number, Low Intensity (3) Low Number, High Intensity (4) Low Number, Low Intensity

96
Figure 4.4. Graph depicting conditional effects of brand attitude on purchase intention at different levels of bridging social capital. Effects are depicted at one SD below the mean, at the mean, and one SD above the mean.
2.5
2.7
2.9
3.1
3.3
3.5
3.7
3.9
4.1
4.3
4.5
4 4.5 5 5.5 6 6.5 7
Purc
hase
Inte
ntio
n
Brand Attitude
-0.97
0
0.97
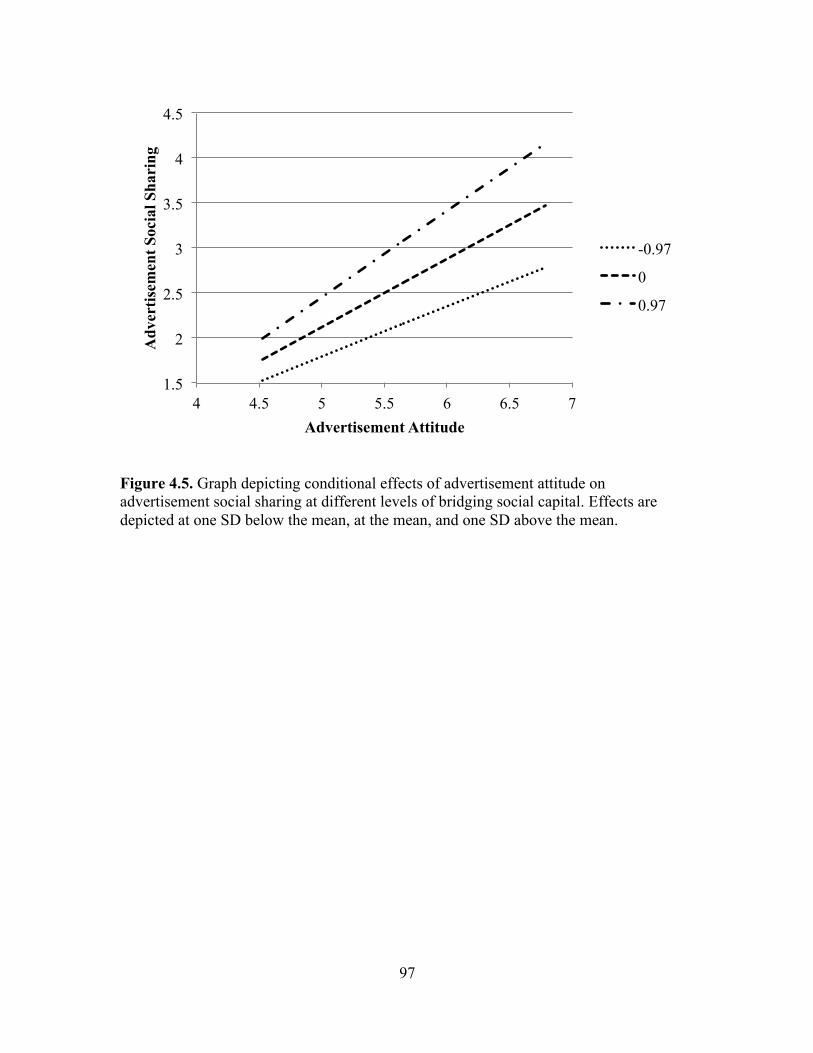
97
Figure 4.5. Graph depicting conditional effects of advertisement attitude on advertisement social sharing at different levels of bridging social capital. Effects are depicted at one SD below the mean, at the mean, and one SD above the mean.
1.5
2
2.5
3
3.5
4
4.5
4 4.5 5 5.5 6 6.5 7
Adv
ertis
emen
t Soc
ial S
hari
ng
Advertisement Attitude
-0.97
0
0.97

98
Figure 4.6. Model presenting supported hypothesized relations between exposure to social media advertising with social cues, brand attitude, social media sharing intention, and purchase intention.

99
APPENDIX B
TABLES Table 3.1. Stimulus Videos from the Pretest
Brand Video URL Duration Summary Approx. Views
Temptations* “Keep Them Busy”
https://www.youtube.com/ watch?v=WeZ9g4TXylk
1:15 Advertisement featuring domesticated cats destroying a Christmas scene, who are then distracted by cat treats. Includes the slogan, "Keep them busy this holiday season."
160 thousand
Reebok* “25,915 Days”
https://www.youtube.com/ watch?v=bcJGh32e2Mw
1:16 Advertisement depicting women engaged in physical activities at different ages and in different life stages. The advertisement is promoting athletic shoes.
1.4 million
Sense* “Meet Sense with Voice”
https://www.youtube.com/ watch?v=Ru1jZT5042M
1:34 Advertisement for a sleep monitor, depicting individuals struggling with the effects of sleep deprivation who then find more energy and success after using the sleep monitor.
3,200
DriFit “Lilly’s Story”
https://www.youtube.com/ watch?v=IBCrJEV-Fyg
1:36 Advertisement depicting a woman and her father at different life stages, with her father providing support as she needs protection provided by different hygienic products.
3.3 million
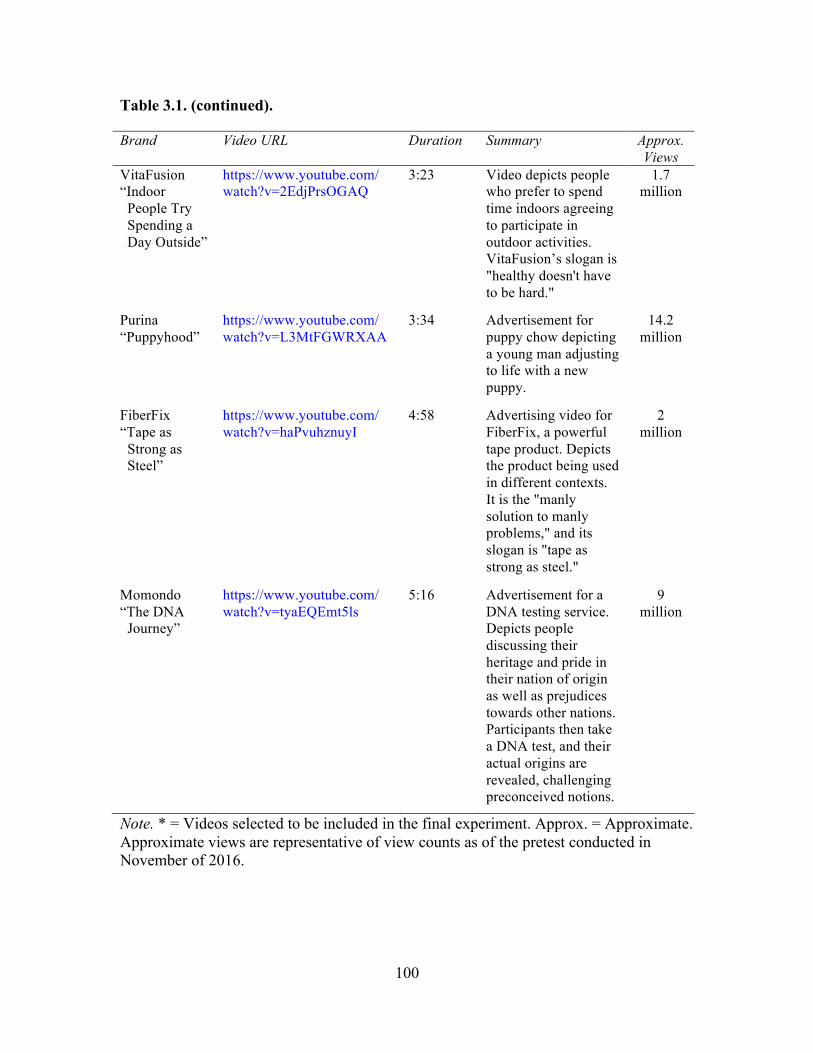
100
Table 3.1. (continued). Brand Video URL Duration Summary Approx.
Views VitaFusion “Indoor People Try Spending a Day Outside”
https://www.youtube.com/ watch?v=2EdjPrsOGAQ
3:23 Video depicts people who prefer to spend time indoors agreeing to participate in outdoor activities. VitaFusion’s slogan is "healthy doesn't have to be hard."
1.7 million
Purina “Puppyhood”
https://www.youtube.com/ watch?v=L3MtFGWRXAA
3:34 Advertisement for puppy chow depicting a young man adjusting to life with a new puppy.
14.2 million
FiberFix “Tape as Strong as Steel”
https://www.youtube.com/ watch?v=haPvuhznuyI
4:58 Advertising video for FiberFix, a powerful tape product. Depicts the product being used in different contexts. It is the "manly solution to manly problems," and its slogan is "tape as strong as steel."
2 million
Momondo “The DNA Journey”
https://www.youtube.com/ watch?v=tyaEQEmt5ls
5:16 Advertisement for a DNA testing service. Depicts people discussing their heritage and pride in their nation of origin as well as prejudices towards other nations. Participants then take a DNA test, and their actual origins are revealed, challenging preconceived notions.
9 million
Note. * = Videos selected to be included in the final experiment. Approx. = Approximate. Approximate views are representative of view counts as of the pretest conducted in November of 2016.

101
Table 3.2. Results of Social Sharing Scales for Pretest Stimulus Videos
Social Sharing Scale
Like on Facebook
Share on Facebook
Send in PM on Facebook
M SD M SD M SD M SD Temptations* 2.46 1.81 3.07 2.05 2.30 1.88 2.58 1.93 Reebok* 2.67 1.71 3.71 2.09 2.51 1.73 2.62 2.03 Sense* 2.52 1.67 3.18 2.18 2.20 1.77 2.52 1.84 DriFit 1.63 0.78 2.12 1.58 1.42 0.73 1.70 1.08 VitaFusion 1.96 1.21 2.55 1.76 1.77 1.12 1.82 1.19 Purina 3.40 2.02 4.44 2.22 3.33 2.28 3.47 2.24 FiberFix 1.84 1.19 2.18 1.90 1.60 1.01 1.98 1.57 Momondo 4.11 2.09 5.17 2.31 4.19 2.22 4.00 2.30
Note. * = Videos selected to be included in the final experiment.
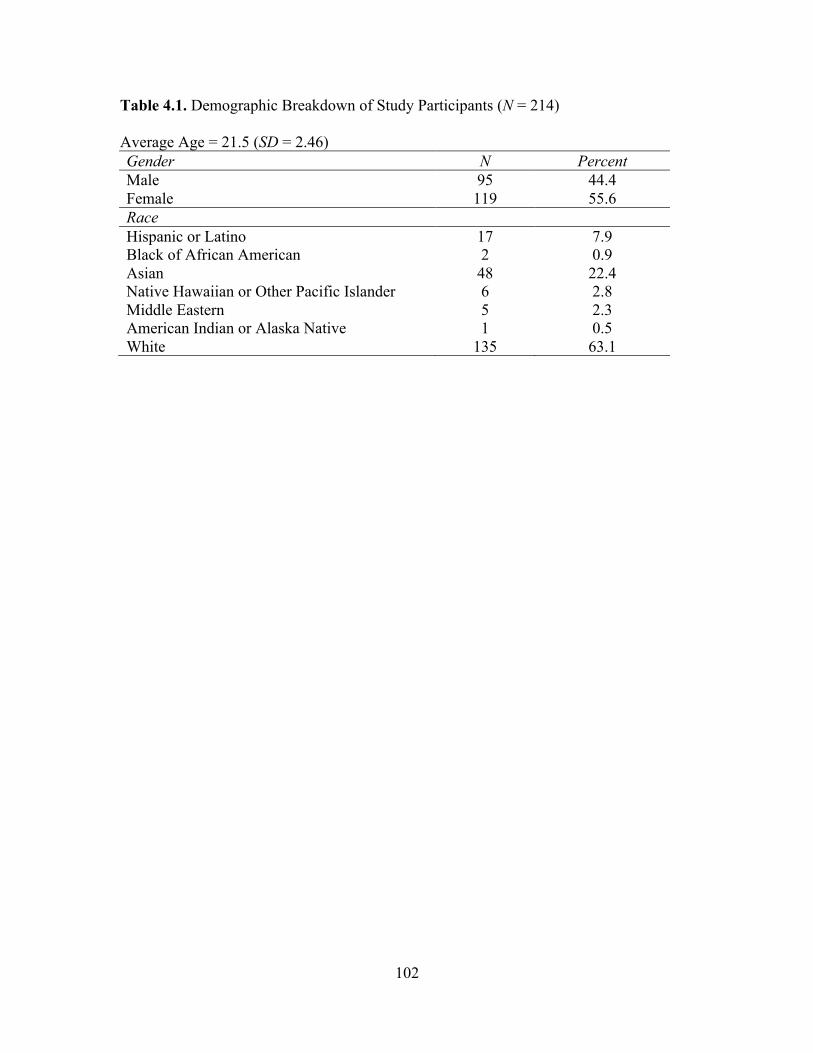
102
Table 4.1. Demographic Breakdown of Study Participants (N = 214) Average Age = 21.5 (SD = 2.46) Gender N Percent Male 95 44.4 Female 119 55.6 Race Hispanic or Latino 17 7.9 Black of African American 2 0.9 Asian 48 22.4 Native Hawaiian or Other Pacific Islander 6 2.8 Middle Eastern 5 2.3 American Indian or Alaska Native 1 0.5 White 135 63.1

103
Table 4.2. Univariate Outliers by Variable (N = 214) Variable Case # Z-Score Social Capital 174 -3.14 Advertisement Attitude 31 -3.81 Advertisement Attitude 115 -3.67 Brand Attitude 115 -3.62 Brand Sharing 42 3.93 Brand Sharing 179 3.93 Facebook Intensity 174 3.89 Facebook Intensity 42 5.75

104
Table 4.3. Descriptive Statistics for Measured Variables and Items (N = 211) Variable Item M SD α Social Capital - Bridging 4.12 .97 .85 Interacting with people on Facebook
makes me interested in things that happen outside of my town.
5.12 1.38
Interacting with people on Facebook makes me want to try new things.
4.28 1.53
Talking with people on Facebook makes me curious about other places in the world.
4.54 1.57
Interacting with people on Facebook makes me interested in what people unlike me are thinking.
4.21 1.61
Interacting with people on Facebook makes me feel like part of a larger community.
4.25 1.40
Interacting with people on Facebook makes me feel connected to the bigger picture.
4.17 1.52
Interacting with people on Facebook a reminds me that everyone in the world is connected.
4.93 1.44
I am willing to spend time to support general community activities on Facebook.
3.66 1.38
Interacting with people on Facebook gives me new people to talk to.
3.16 1.37
On Facebook, I come in contact with new people all the time.
2.92 1.46
Video Familiarity Prior to viewing the video during this study, about how many times have you seen this video before?
1.19 .55
Social Media Privacy Thinking about my privacy, I feel this advertisement was very invasive / not at all invasive.
5.92 1.49
Advertisement Attitude I feel this advertisement was … 5.65 1.13 .92 Unpleasant / Pleasant 5.96 1.19
Unlikeable / Likeable 5.96 1.21
Boring / Interesting 5.45 1.52

105
Table 4.3. (continued). Variable Item M SD α Advertisement Attitude (continued) Tasteless / Tasteful 5.49 1.40 Artless / Artful 5.37 1.38 Bad / Good 5.70 1.29 Brand Attitude I feel that [Brand] is … 5.31 1.10 .88 Bad / Good 5.45 1.24 Very Dislikeable / Very Likeable 5.31 1.18 Pleasant / Unpleasant+ 4.91 1.68 Poor Quality / High Quality 5.17 1.27 Purchase Intention 3.33 1.33 .79 Regarding [Brand] I am not likely to buy
/ very likely to buy. 2.79 1.66
To purchase [Brand] would be foolish / wise.
3.87 1.23
Advertisement Social Sharing
I am likely to … 2.64 1.53 .92
pass-along this video to others on Facebook.
2.66 1.79
tell others about this video on Facebook. 2.74 1.77 talk about this video on Facebook. 2.17 1.54
like this video on Facebook. 3.49 2.24 share this video on Facebook. 2.23 1.65 send this video in a private message on
Facebook. 2.56 1.77
Facebook Intensity 1.31 1.08 About how many hours did you spend on
Facebook yesterday? 1.21 1.09
About how many hours do you spend on Facebook on a typical day?
1.40 1.15
Facebook Friends How many friends do you have on Facebook?
844.73 552.80
Note. + = Item eliminated from final scale. α = Cronbach’s alpha.
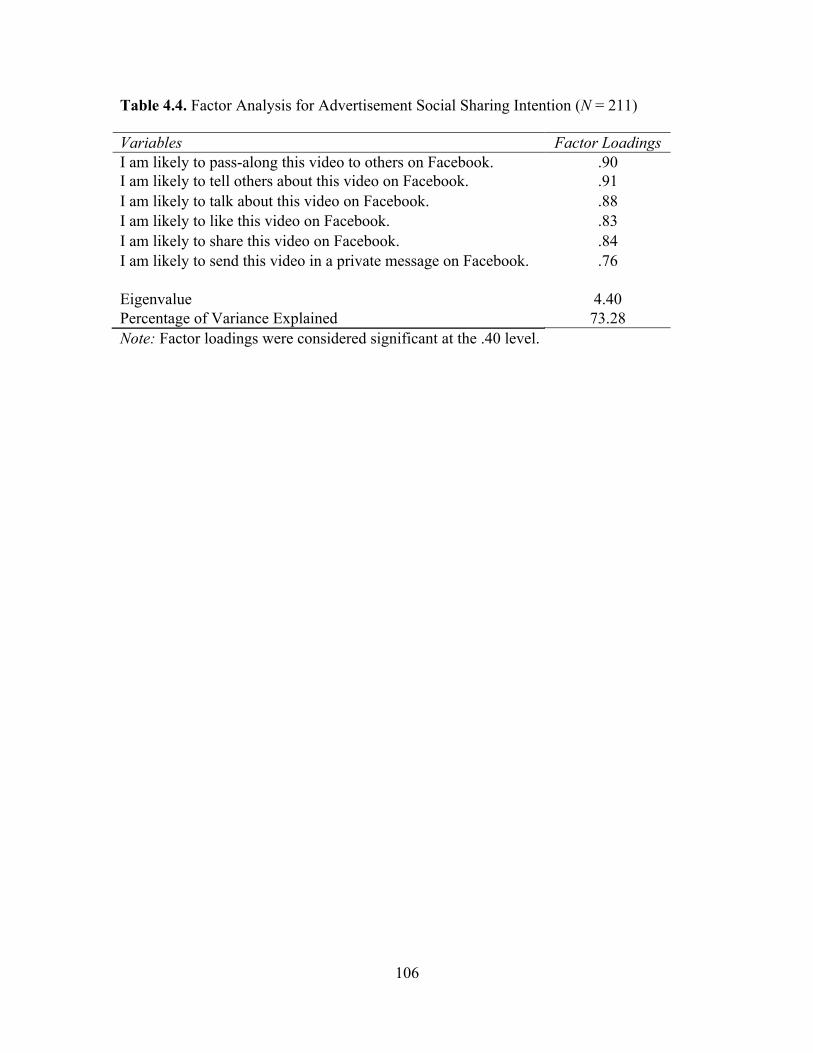
106
Table 4.4. Factor Analysis for Advertisement Social Sharing Intention (N = 211) Variables Factor Loadings I am likely to pass-along this video to others on Facebook. .90 I am likely to tell others about this video on Facebook. .91 I am likely to talk about this video on Facebook. .88 I am likely to like this video on Facebook. .83 I am likely to share this video on Facebook. .84 I am likely to send this video in a private message on Facebook. .76 Eigenvalue 4.40 Percentage of Variance Explained 73.28 Note: Factor loadings were considered significant at the .40 level.

107
Table 4.5. Summary of Hierarchical Regression of Main and Interaction Effects of Social Impact Variables Predicting Brand Attitude (N = 169) Step 1 Step 2 Step 3 Variables B SE B β B SE B β B SE B β Controls
Video is Reebok .07 .19 .03 .07 .19 .03 .09 .19 .04 Video is Sense .60 .19 .27** .60 .19 .28** .62 .19 .28** Video Familiarity .11 .13 .06 .10 .14 .06 .11 .14 .06 Main Effects Tie Strength
-.15 .16 -.07 -.45 .22 -.22*
Tie Number
.10 .16 .05 -.19 .21 -.09 Facebook Intensity .02 .08 .02 .36 .19 .33 Interactions Strength x Number
.54 .31 .23
Strength x Intensity
-.56 .28 -.36* Number x Intensity -.50 .24 -.37* Strength x Number x Intensity
.79 .34 .42*
Note. *p < .05, **p < .01 Step 1: R2 = .07, F (3, 165) = 4.07, p < .01. Step 2: ΔR2 = .01, ΔF (3, 162) = .46, p > .05. Step 3: ΔR2 = .05, ΔF (4, 158) = 2.16, p > .05.

108
Table 4.6. Pearson Correlations of Independent and Dependent Variables (N = 211) Variables 1. 2. 3. 4. 5. 6. 7. 8. 9. 1. Video is Reebok 1
2. Video is Sense -.51+
3. Video Familiarity -.14* -.04
4. Facebook Intensity .04 .01 .03
5. Social Impact .01 -.03 .09 -.13
6. Bridging Social Capital .02 -.01 .02 .31+ .00
7. Advertisement Attitude .21** .06 .03 .09 .11 .11
8. Advertisement Social Sharing -.01 .08 .09 .19** .03 .37+ .55+
9. Brand Attitude -.11 .24+ .05 .06 .21** .19** .58+ .43+
10. Purchase Intention -.14* .21** -.03 .05 .02 .26+ .31+ .46+ .58+
Note. *p < .05, **p < .01, +p < .001.
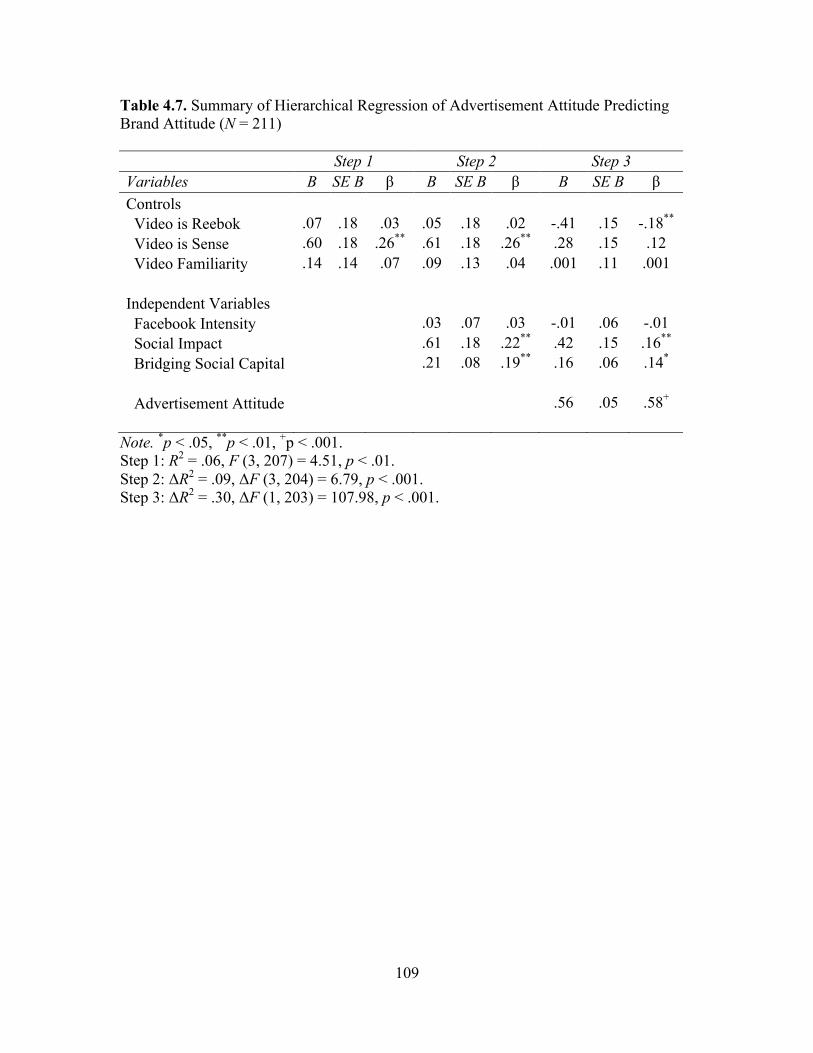
109
Table 4.7. Summary of Hierarchical Regression of Advertisement Attitude Predicting Brand Attitude (N = 211) Step 1 Step 2 Step 3 Variables B SE B β B SE B β B SE B β Controls
Video is Reebok .07 .18 .03 .05 .18 .02 -.41 .15 -.18** Video is Sense .60 .18 .26** .61 .18 .26** .28 .15 .12 Video Familiarity .14 .14 .07 .09 .13 .04 .001 .11 .001 Independent Variables Facebook Intensity
.03 .07 .03 -.01 .06 -.01
Social Impact
.61 .18 .22** .42 .15 .16** Bridging Social Capital .21 .08 .19** .16 .06 .14* Advertisement Attitude
.56 .05 .58+
Note. *p < .05, **p < .01, +p < .001. Step 1: R2 = .06, F (3, 207) = 4.51, p < .01. Step 2: ΔR2 = .09, ΔF (3, 204) = 6.79, p < .001. Step 3: ΔR2 = .30, ΔF (1, 203) = 107.98, p < .001.

110
Table 4.8. Summary of Hierarchical Regression of Advertisement Attitude Predicting Advertisement Social Sharing (N = 211) Step 1 Step 2 Step 3 Variables B SE B β B SE B β B SE B β Controls
Video is Reebok .22 .26 .07 .17 .24 .05 -.42 .21 -.13* Video is Sense .39 .26 .12 .38 .25 .12 -.05 .21 -.02 Video Familiarity .28 .19 .10 .24 .18 .09 .13 .15 .05 Independent Variables Facebook Intensity
.11 .10 .08 .06 .08 .04
Social Impact
.14 .25 .04 -.10 .21 -.03 Bridging Social Capital .55 .11 .35+ .48 .09 .30+ Advertisement Attitude
.74 .08 .55+
Note. *p < .05, +p < .001. Step 1: R2 = .02, F (3, 207) = 1.27, p > .05. Step 2: ΔR2 = .14, ΔF (3, 204) = 11.53, p < .001. Step 3: ΔR2 = .26, ΔF (1, 203) = 92.65, p < .001.
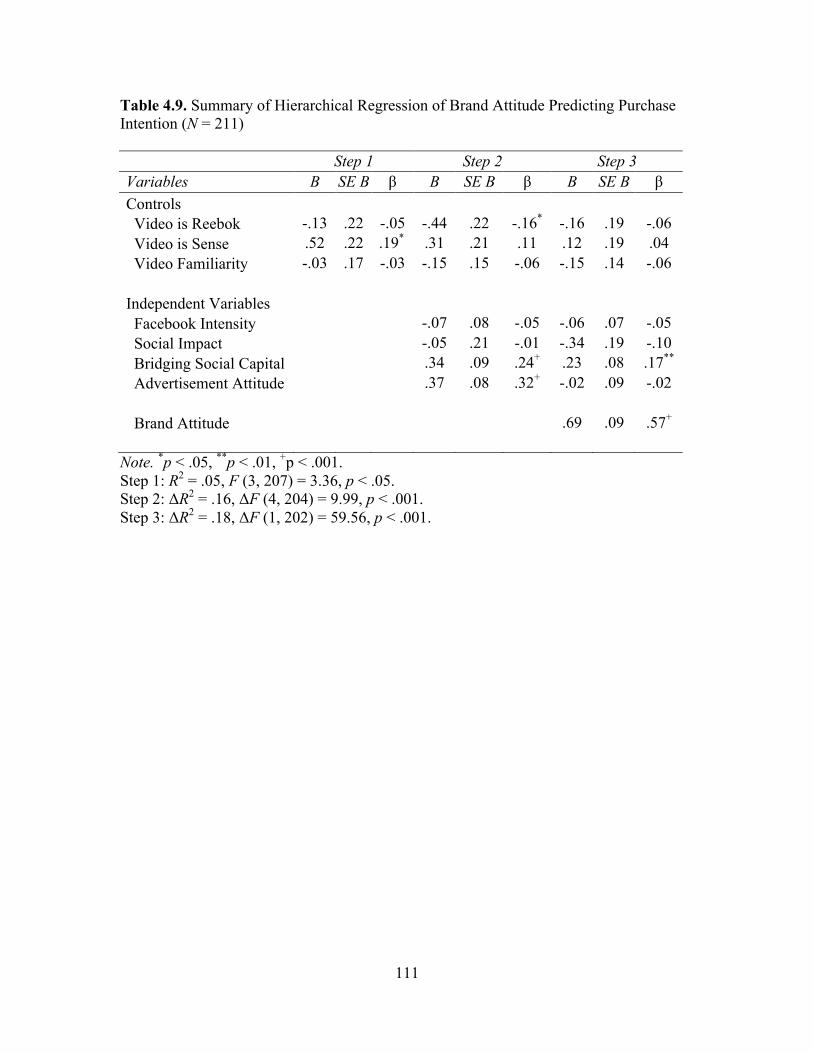
111
Table 4.9. Summary of Hierarchical Regression of Brand Attitude Predicting Purchase Intention (N = 211) Step 1 Step 2 Step 3 Variables B SE B β B SE B β B SE B β Controls
Video is Reebok -.13 .22 -.05 -.44 .22 -.16* -.16 .19 -.06 Video is Sense .52 .22 .19* .31 .21 .11 .12 .19 .04 Video Familiarity -.03 .17 -.03 -.15 .15 -.06 -.15 .14 -.06 Independent Variables Facebook Intensity
-.07 .08 -.05 -.06 .07 -.05
Social Impact
-.05 .21 -.01 -.34 .19 -.10 Bridging Social Capital .34 .09 .24+ .23 .08 .17** Advertisement Attitude .37 .08 .32+ -.02 .09 -.02
Brand Attitude .69 .09 .57+
Note. *p < .05, **p < .01, +p < .001. Step 1: R2 = .05, F (3, 207) = 3.36, p < .05. Step 2: ΔR2 = .16, ΔF (4, 204) = 9.99, p < .001. Step 3: ΔR2 = .18, ΔF (1, 202) = 59.56, p < .001.
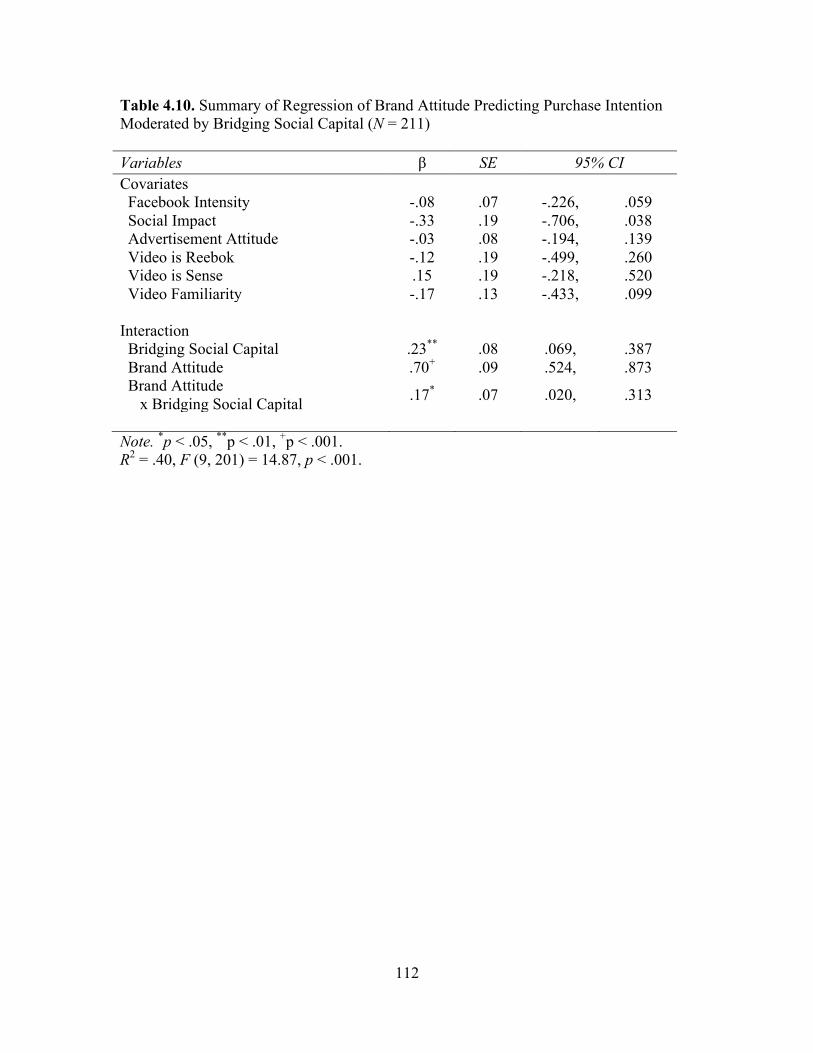
112
Table 4.10. Summary of Regression of Brand Attitude Predicting Purchase Intention Moderated by Bridging Social Capital (N = 211) Variables β SE 95% CI Covariates Facebook Intensity -.08 .07 -.226, .059 Social Impact -.33 .19 -.706, .038 Advertisement Attitude -.03 .08 -.194, .139 Video is Reebok -.12 .19 -.499, .260 Video is Sense .15 .19 -.218, .520 Video Familiarity -.17 .13 -.433, .099 Interaction Bridging Social Capital .23** .08 .069, .387 Brand Attitude .70+ .09 .524, .873 Brand Attitude x Bridging Social Capital .17* .07 .020, .313
Note. *p < .05, **p < .01, +p < .001. R2 = .40, F (9, 201) = 14.87, p < .001.
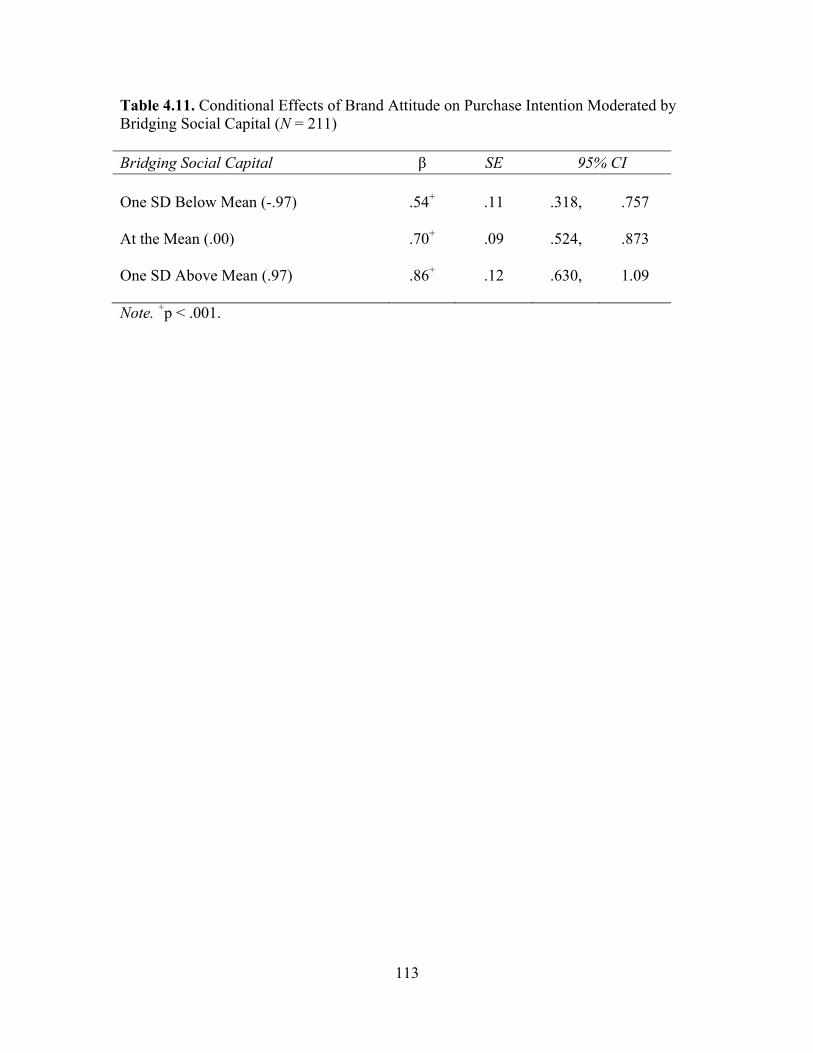
113
Table 4.11. Conditional Effects of Brand Attitude on Purchase Intention Moderated by Bridging Social Capital (N = 211) Bridging Social Capital β SE 95% CI One SD Below Mean (-.97) .54+ .11 .318, .757 At the Mean (.00) .70+ .09 .524, .873 One SD Above Mean (.97) .86+ .12 .630, 1.09 Note. +p < .001.

114
Table 4.12. Summary of Regression of Advertisement Attitude Predicting Advertisement Social Sharing Moderated by Bridging Social Capital (N = 211) Variables β SE 95% CI Covariates Facebook Intensity .03 .08 -.129, .188 Social Impact -.13 .21 -.540, .273 Video is Reebok -.44* .21 -.854, -.029 Video is Sense -.05 .21 -.458, .353 Video Familiarity .11 .15 -.188, .403 Interaction Bridging Social Capital .48+ .09 .303, .651 Advertisement Attitude .76+ .08 .606, .907 Advertisement Attitude x Bridging Social Capital .21* .09 .038, .384
Note. *p < .05, +p < .001. R2 = .44, F (8, 202) = 19.80, p < .001.

115
Table 4.13. Conditional Effects of Advertisement Attitude on Advertisement Social Sharing Moderated by Bridging Social Capital (N = 211) Bridging Social Capital β SE 95% CI One SD Below Mean (-.97) .55+ .11 .339, .766 At the Mean (.00) .76+ .08 .606, .907 One SD Above Mean (.97) .96+ .12 .725, 1.20 Note. +p < .001.
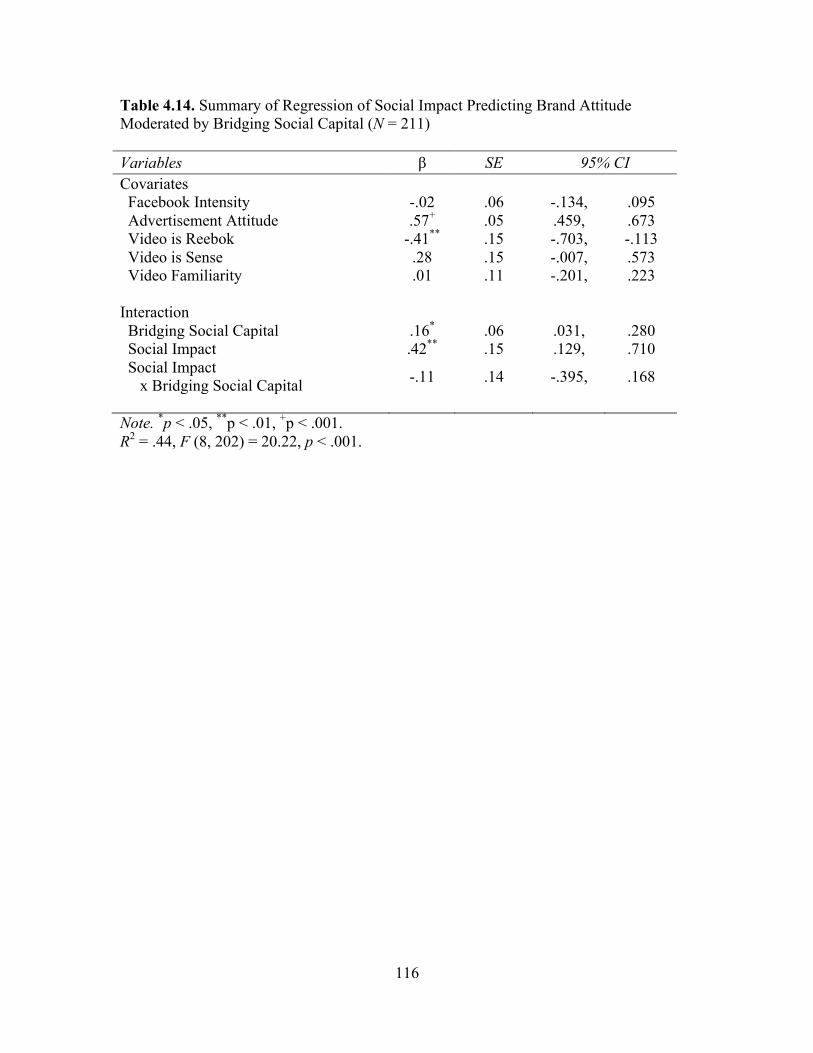
116
Table 4.14. Summary of Regression of Social Impact Predicting Brand Attitude Moderated by Bridging Social Capital (N = 211) Variables β SE 95% CI Covariates Facebook Intensity -.02 .06 -.134, .095 Advertisement Attitude .57+ .05 .459, .673 Video is Reebok -.41** .15 -.703, -.113 Video is Sense .28 .15 -.007, .573 Video Familiarity .01 .11 -.201, .223 Interaction Bridging Social Capital .16* .06 .031, .280 Social Impact .42** .15 .129, .710 Social Impact x Bridging Social Capital -.11 .14 -.395, .168
Note. *p < .05, **p < .01, +p < .001. R2 = .44, F (8, 202) = 20.22, p < .001.

117
Table 4.15. Summary of Regression of Advertisement Attitude Predicting Brand Attitude Moderated by Bridging Social Capital (N = 211) Variables β SE 95% CI Covariates Facebook Intensity -.02 .06 -.132, .095 Social Impact .41** .15 .124, .705 Video is Reebok -.41** .15 -.707, -.117 Video is Sense .28 .15 -.010, .569 Video Familiarity -.01 .11 -.216, .206 Interaction Bridging Social Capital .16* .06 .034, .282 Advertisement Attitude .57+ .05 .461, .675 Advertisement Attitude x Bridging Social Capital .06 .06 -.063, .184
Note. *p < .05, **p < .01, +p < .001. R2 = .45, F (8, 202) = 20.28, p < .001.
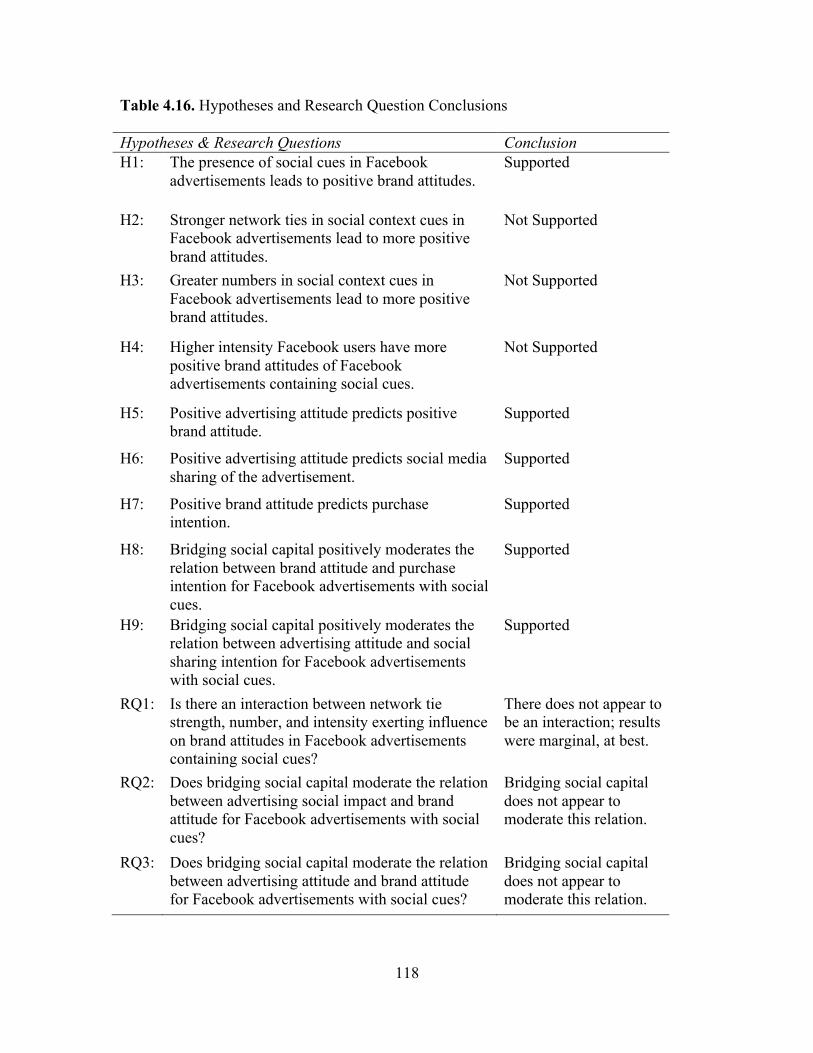
118
Table 4.16. Hypotheses and Research Question Conclusions Hypotheses & Research Questions Conclusion H1: The presence of social cues in Facebook
advertisements leads to positive brand attitudes. Supported
H2: Stronger network ties in social context cues in Facebook advertisements lead to more positive brand attitudes.
Not Supported
H3: Greater numbers in social context cues in Facebook advertisements lead to more positive brand attitudes.
Not Supported
H4: Higher intensity Facebook users have more positive brand attitudes of Facebook advertisements containing social cues.
Not Supported
H5: Positive advertising attitude predicts positive brand attitude.
Supported
H6: Positive advertising attitude predicts social media sharing of the advertisement.
Supported
H7: Positive brand attitude predicts purchase intention.
Supported
H8: Bridging social capital positively moderates the relation between brand attitude and purchase intention for Facebook advertisements with social cues.
Supported
H9: Bridging social capital positively moderates the relation between advertising attitude and social sharing intention for Facebook advertisements with social cues.
Supported
RQ1: Is there an interaction between network tie strength, number, and intensity exerting influence on brand attitudes in Facebook advertisements containing social cues?
There does not appear to be an interaction; results were marginal, at best.
RQ2: Does bridging social capital moderate the relation between advertising social impact and brand attitude for Facebook advertisements with social cues?
Bridging social capital does not appear to moderate this relation.
RQ3: Does bridging social capital moderate the relation between advertising attitude and brand attitude for Facebook advertisements with social cues?
Bridging social capital does not appear to moderate this relation.

119
APPENDIX C
STUDY MEASURES
Bridging Social Capital
Measured on seven-point, Likert scales ranging from “strongly disagree” to “strongly
agree.”
1. Interacting with people on Facebook makes me interested in things that happen
outside of my town.
2. Interacting with people on Facebook makes me want to try new things.
3. Interacting with people on Facebook makes me interested in what people unlike
me are thinking.
4. Talking with people on Facebook makes me curious about other places in the
world.
5. Interacting with people on Facebook makes me feel like part of a larger
community.
6. Interacting with people on Facebook makes me feel connected to the bigger
picture.
7. Interacting with people on Facebook a reminds me that everyone in the world is
connected.
8. I am willing to spend time to support general community activities on Facebook.
9. Interacting with people on Facebook gives me new people to talk to.
10. On Facebook, I come in contact with new people all the time.

120
Video Familiarity
Prior to viewing the video during this study, about how many times have you seen this
video before?
1. Never
2. Once
3. Several Times
4. Many Times
Privacy
Measured on a seven-point, semantic differential scale.
Thinking about my privacy, I feel this advertisement was …
1. very invasive / not at all invasive
Advertising Attitude
Measured on a seven-point, semantic differential scale.
I feel this advertisement was …
1. unpleasant / pleasant
2. unlikable / likeable
3. boring / interesting
4. tasteless / tasteful
5. artless / artful
6. bad / good

121
Brand Attitude
Measured on a seven-point, semantic differential scale.
I feel that [brand name] is …
1. bad / good
2. very dislikable / very likeable
3. pleasant / unpleasant *
4. poor quality / high quality
* Recoded for analysis
Purchase Intention
Measured on a seven-point, semantic differential scale.
1. Regarding [product name] I am … not likely to buy / very likely to buy.
2. To purchase [product name] would be … foolish / wise.
Sharing Intention
Measured on a seven-point, Likert scales ranging from “strongly disagree” to “strongly
agree.”
I am likely to …
1. pass-along this video to others on Facebook.
2. tell others about this video on Facebook.
3. talk about this video on Facebook.
4. like this video on Facebook.
5. share this video on Facebook.
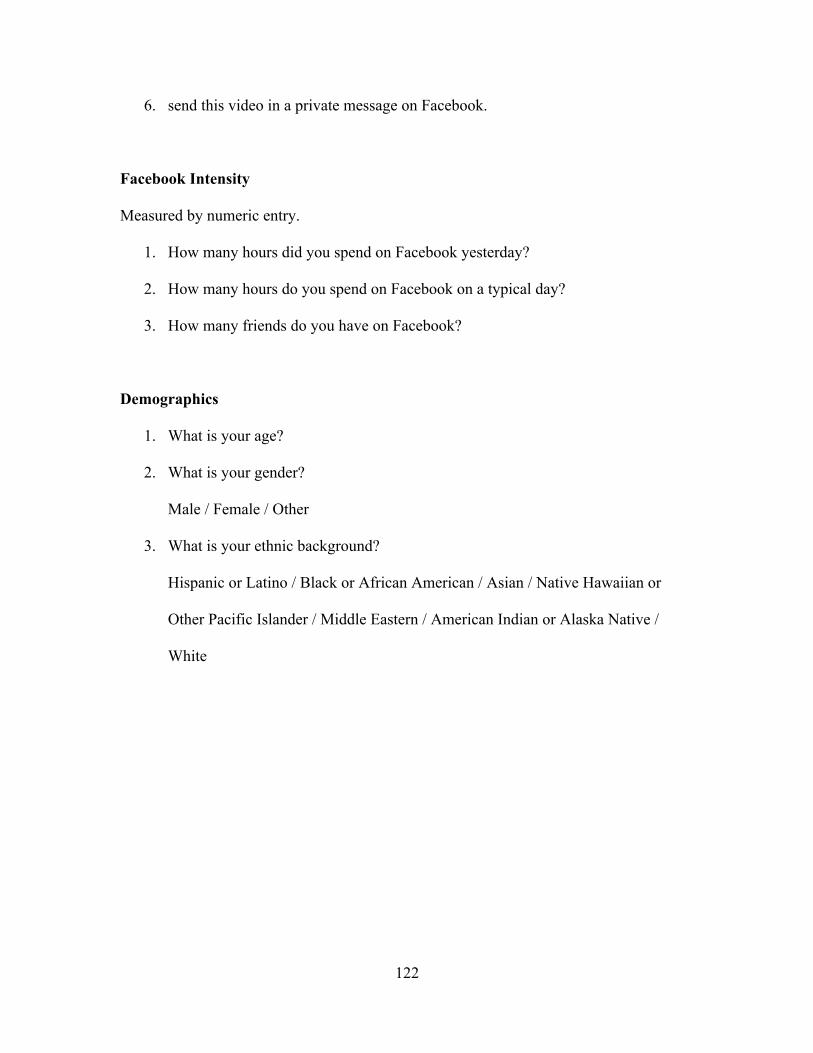
122
6. send this video in a private message on Facebook.
Facebook Intensity
Measured by numeric entry.
1. How many hours did you spend on Facebook yesterday?
2. How many hours do you spend on Facebook on a typical day?
3. How many friends do you have on Facebook?
Demographics
1. What is your age?
2. What is your gender?
Male / Female / Other
3. What is your ethnic background?
Hispanic or Latino / Black or African American / Asian / Native Hawaiian or
Other Pacific Islander / Middle Eastern / American Indian or Alaska Native /
White

123
REFERENCES CITED
Adler, P. S., & Kwon, S. (2016). Social capital: Prospects for a new concept. Academy of Management Review, 27(1), 17–40. doi:10.5465/AMR.2002.5922314
Ajzen, I., & Fishbein, M. (1980). Understanding attitudes and predicting social behavior.
New Jersey: Prentice-Hall. An update to Facebook ads. (2014, January 9). Retrieved from
https://www.facebook.com/notes/facebook-and-privacy/an-update-to-facebook-ads/643198592396693/
Anderson, B. L. R., Mellor, J. M., & Milyo, J. (2004). Social capital and contributions in
a public-goods experiment. The American Economic Review, 94(2), 373–376. Argo, J. J., Dahl, D. W., & Manchanda, R. V. (2012). The influence of a mere social
presence in a retail context. Journal of Consumer Research, 32(2), 207–212. doi:10.1086/432230
Aronson, E., Wilson, T. D., Akert, R. M., & Sommers, S. R. (2015). Social Psychology
(Ninth Edit.). Boston: Pearson. Babbie, E. (2013). The Practice of Social Research (13th ed.). Belmont, CA: Wadsworth. Bakshy, E., Eckles, D., Yan, R., & Rosenn, I. (2012). Social influence in social
advertising: evidence from field experiments. Proceedings of the 13th ACM Conference on Electronic Commerce, 1(212), 146–161. doi:10.1145/2229012.2229027
Batra, R., & Ray, M. L. (1986). Affective acceptance responses of mediating advertising.
Journal of Consumer Research, 13(2), 234–249. doi:10.1086/209063 Beyens, I., Frison, E., & Eggermont, S. (2016). “I don’t want to miss a thing”:
Adolescents’ fear of missing out and its relationship to adolescents’ social needs, Facebook use, and Facebook related stress. Computers in Human Behavior, 64, 1–8.
Bourdieu, P., & Wacquant, L. J. D. (1992). An invitation to reflexive sociology. Chicago:
University of Chicago Press. Branscombe, N. R., Spears, R., Ellemers, N., & Doosje, B. (2012). Intragroup and
Intergroup Evaluation Effects on Group Behavior. Personality & Social Psychology Bulletin, 28(6), 744–753. doi:10.1177/0146167202289004
Brown, M. R., Bhadury, R. K., & Pope, N. K. L. (2010). The Impact of Comedic
Violence on Viral Advertising Effectiveness. Journal of Advertising, 39(1), 49–66. doi:10.2753/JOA0091-3367390104

124
Burke, M., & Kraut, R. (2013). Using Facebook after losing a job: Differential benefits of strong and weak ties. Proceedings of the 2013 Conference on Computer Supported Cooperative Work, 1419–1430. doi:10.1145/2441776.2441936
Burke, M., Kraut, R., & Marlow, C. (2011). Social capital on Facebook: Differentiating
uses and users. In Proceedings of the SIGCHI conference on human factors in computing systems (pp. 571–580). doi:10.1145/1978942.1979023
Burke, M., Marlow, C., & Lento, T. (2010). Social network activity and social well-
being. Proceedings of the 28th International Conference on Human Factors in Computing Systems - CHI ’10, 1909–1912. doi:10.1145/1753326.1753613
Burt, R. S. (1999). The social capital of opinion leaders. Annals of the American
Academy of Political and Social Science, 566, 37. Cacioppo, J. T., & Petty, R. E. (1982). The need for cognition. Journal of Personality and
Social Psychology, 42(1), 116–131. Chan, K. W., & Li, S. Y. (2010). Understanding consumer-to-consumer interactions in
virtual communities: The salience of reciprocity. Journal of Business Research, 63(9–10), 1033–1040. doi:10.1016/j.jbusres.2008.08.009
Chandrasekhar, S. (2017, March 21). Is there no end to Google’s and Facebook’s ad
revenue growth momentum? Retrieved from http://1reddrop.com/2017/03/21/no-end-google-facebook-ad-revenue-growth-momentum/
Chang, Y. P., & Zhu, D. H. (2012). The role of perceived social capital and flow
experience in building users’ continuance intention to social networking sites in China. Computers in Human Behavior, 28(3), 995–1001. doi:10.1016/j.chb.2012.01.001
Chiu, C. M., Hsu, M. H., & Wang, E. T. G. (2006). Understanding knowledge sharing in
virtual communities: An integration of social capital and social cognitive theories. Decision Support Systems, 42(3), 1872–1888. doi:10.1016/j.dss.2006.04.001
Chu, S. C., & Kim, Y. (2011). Determinants of consumer engagement in electronic
Word-Of-Mouth (eWOM) in social networking sites. International Journal of Advertising, 30(1). doi:10.2501/IJA-30-1-047-075
Cialdini, R. B., & Goldstein, N. J. (2004). Social influence: compliance and conformity.
Annual Review of Psychology, 55(1974), 591–621. doi:10.1146/annurev.psych.55.090902.142015
Cialdini, R. B., & Trost, M. R. (1998). Social influence: Social norms, conformity and
compliance. The Handbook of Social Psychology, Vol. 2. doi:10.2307/2654253

125
Cohen, J. B., Fishbein, M., & Ahtola, O. T. (1972). The Nature and Uses of Expectancy-Value Models in Consumer Attitude Research. Journal of Marketing Research (JMR), 9(November), 456–460. doi:10.1016/0167-8116(85)90021-7
Coleman, J. S. (1988). Social capital in the creation of human capital. American Journal
of Sociology, 94(1988), S95–S120. doi:10.1086/228943 comScore releases February 2016 U.S. desktop online video rankings. (2016, March 21).
Retrieved from http://www.comscore.com/Insights/Rankings/comScore-Releases-February-2016-US-Desktop-Online-Video-Rankings
Digital ad spending to surpass TV next year. (2016, March 8). Retrieved from
http://www.emarketer.com/Article/Digital-Ad-Spending-Surpass-TV-Next-Year/1013671
Dittes, J. E., & Kelley, H. H. (1956). Effects of different conditions of acceptance upon
conformity to group norms. Journal of Abnormal Psychology, 53(1), 100–107. doi:10.1037/h0047855
Edell, J. A., & Burke, M. C. (1987). Power of feelings effects in understanding
advertising. Journal of Consumer Research, 14(3), 421–433. doi:10.1086/209124 Ellison, N. B., Steinfield, C., & Lampe, C. (2007). The benefits of facebook “friends:”
Social capital and college students’ use of online social network sites. Journal of Computer-Mediated Communication, 12(4), 1143–1168. doi:10.1111/j.1083-6101.2007.00367.x
Ellison, N. B., Steinfield, C., & Lampe, C. (2010). Connection Strategies: Social Capital
Implications of Facebook-enabled Communication Practices. New Media & Society, 13(6), 873–892. doi:10.1177/1461444810385389
Ellison, N. B., Vitak, J., Gray, R., & Lampe, C. (2014). Cultivating social resources on
social network sites: Facebook relationship maintenance behaviors and their role in social capital processes. Journal of Computer-Mediated Communication, 19(4), 855–870. doi:10.1111/jcc4.12078
Empson, R. (2013, April 30). Facebook, Google ad execs spar over the value of a click.
Retrieved from https://techcrunch.com/2013/04/30/facebook-google-ad-execs-spar-over-the-value-of-a-click/
Fabrigar, L. R., Maccallum, R. C., Wegener, D. T., & Strahan, E. J. (1999). Evaluating
the use of exploratory factor analysis in psychological research. Psychological Methods, 4(3), 272–299. doi:10.1037/1082-989X.4.3.272
126
Feltham, T. S. (1994). Assessing viewer judgement of advertisements and vehicles: Scale development and validation. In C. T. Allen & D. R. John (Eds.), Advances in Consumer Research (Vol. 21, pp. 531–535). Provo, UT: Association for Consumer Research.
Fishbein, M. (1963). An investigation of the relationships between beliefs about an object
and the attitude toward that object. Human Relations, 16(3), 233–239. doi:10.1177/001872676301600302
Fishbein, M., & Ajzen, I. (1975). Belief, attitude, intention, and behavior. Reading, MA:
Addison-Wesley. Fu, P. W., Wu, C. C., & Cho, Y. J. (2017). What makes users share content on facebook?
Compatibility among psychological incentive, social capital focus, and content type. Computers in Human Behavior, 67, 23–32. doi:10.1016/j.chb.2016.10.010
George, L. K. (1986). Caregiver burden: conflict between norms of reciprocity and
solidarity. New York: Auburn House. Gil de Zúñiga, H., Jung, N., & Valenzuela, S. (2012). Social media use for news and
individuals’ social capital, civic engagement and political participation. Journal of Computer-Mediated Communication, 17(3), 319–336. doi:10.1111/j.1083-6101.2012.01574.x
Gouldner, A. W. (1960). The norm of reciprocity : A preliminary statement. American
Sociological Review, 25(2), 161–178. Granovetter, M. S. (1973). The strength of weak ties. American Journal of Sociology,
78(6), 1360–1380. doi:10.1086/225469 Ha, A. (2013, June 11). Yep, Facebook ads are better with social context (according to a
Salesforce “benchmark” report). Retrieved from https://techcrunch.com/2013/06/11/salesforce-facebook-ads-benchmark/
Hair, J. F., Black, W. C., Babin, B. J., Anderson, R. E., & Tatham, R. L. (2006).
Multivariate data analysis (Vol. 6.). Upper Saddle River, NJ: Pearson Prentice Hall. Handley, L. (2017, March 21). Facebook and Google predicted to make $106 billion
from advertising in 2017, almost half of world’s digital ad spend. Retrieved from http://www.cnbc.com/2017/03/21/facebook-and-google-ad-youtube-make-advertising-in-2017.html
Hayes, A. F. (2013). Introduction to mediation, moderation, and conditional process
analysis: A regression-based approach. New York, NY: Guilford Press.

127
Haythornthwaite, C., & Wellman, B. (1998). Work, friendship, and media use for information exchange in a networked organization. Journal of the American Society for Information Science, 49(12), 1101–1114.
Heinonen, K. (2011). Consumer activity in social media: Managerial approaches to
consumers’ social media behavior. Journal of Consumer Behaviour, 10(6), 356–364. doi:10.1002/cb.376
Hendricks, D. (2014, January 16). Facebook to drop sponsored stories: What does this
mean for advertisers? Retrieved from http://www.forbes.com/sites/drewhendricks/2014/01/16/facebook-to-drop-sponsored-stories-what-does-this-mean-for-advertisers/#45e0ac996897
Huang, J., Su, S., Zhou, L., & Liu, X. (2013). Attitude toward the viral ad: Expanding
traditional advertising models to interactive advertising. Journal of Interactive Marketing, 27(1), 36–46. doi:10.1016/j.intmar.2012.06.001
Huang, L. V., & Liu, L. (2017). Ties that Work: Investigating the Relationships among
Coworker Connections, Work-related Facebook Utility, Online Social Capital, and Employee Outcomes. Computers in Human Behavior. doi:http://dx.doi.org/10.1016/j.chb.2017.02.054
Huang, Y., Phau, I., & Lin, C. (2010). Consumer animosity, economic hardship, and
normative influence. European Journal of Marketing, 44(7/8), 909–937. doi:10.1108/03090561011047463
Inkpen, A. C., & Tsang, E. W. K. (2005). Social capital, networks, and knowledge
transfer. The Academy of Management Review, 30(1), 146–165. doi:10.5465/AMR.2005.15281445
Jackson, J. M., & Latané, B. (1981). All alone in front of all those people: Stage fright as
a function of number and type of co-performers and audience. Journal of Personality and Social Psychology, 40(1), 73–85. doi:10.1037/0022-3514.40.1.73
Ji, Y. G., Hwangbo, H., Yi, J. S., Rau, P. L. P., Fang, X., & Ling, C. (2010). The
Influence of Cultural Differences on the Use of Social Network Services and the Formation of Social Capital. International Journal of Human-Computer Interaction, 26(11–12), 1100–1121. doi:10.1080/10447318.2010.516727
Johnston, K., Tanner, M., Lalla, N., & Kawalski, D. (2011). Social capital: The benefit of
Facebook friends. Behaviour & Information Technology, 32(1), 1–13. doi:10.1080/0144929X.2010.550063
Jones, S. (2014, June 17). The art and science of viral videos. Retrieved from
https://blog.hubspot.com/marketing/art-science-viral-videos#sm.00123hl217x5ewx10gx2rjeoerbex

128
Jung, J., Shim, S. W., Jin, H. S., & Khang, H. (2016). Factors affecting attitudes and behavioural intention towards social networking advertising: A case of facebook users in South Korea. International Journal of Advertising, 35(2), 248–265. doi:10.1080/02650487.2015.1014777
Karau, S. J., & Williams, K. D. (1993). Social Loafing: A Meta-Analytic Review and
Theoretical Integration. Interpersonal Relations and Group Processes, 65(4), 681–706. doi:10.1037/0022-3514.65.4.681
Karlan, D. S. (2005). Using experimental economics to measure social capital and predict
financial decisions. The American Economic Review, 95(5), 1688–1699. Katz, E., Blumler, J. G., & Gurevitch, M. (1974). Utilization of mass communication by
the individual. In J. G. Blumler & E. Katz (Eds.), The uses of mass communication (pp. 19–32). Beverly Hills, CA: Sage.
Katz, E., & Foulkes, D. (1962). On the use of the mass media as “escape”: Clarification
of a concept. The Public Opinion Quarterly, 26(3), 377–388. Katz, E., Haas, H., & Gurevitch, M. (1973). On the use of the mass media for important
things. American Sociological Review, 38(2), 164–181. doi:10.1086/267111 Kawachi, I., Kennedy, B. P., Lochner, K., & Prothrow-Stith, D. (1997). Social capital,
income inequality, and mortality. American Journal of Public Health, 87(9), 1491–1498. doi:10.1084/jem.176.3.719
Kessler, S. (2011, June 28). The history of advertising on Facebook. Retrieved from
http://mashable.com/2011/06/28/facebook-advertising-infographic/#cA5bJ6wpOkq4 Kinard, B. R., Capella, M. L., & Kinard, J. L. (2009). The Impact of Social Presence on
Technology Based Self-Service Use: The Role of Familiarity. Services Marketing Quarterly, 30(3), 303–314. doi:10.1080/15332960902993593
Kincaid, D. L. (2004). From innovation to social norm: Bounded normative influence.
Journal of Health Communication, 9(S1), 37–57. doi:10.1080/10810730490271511 Kirk, R. (2009). Experimental Design. In R. E. Millsap & A. Maydeu-Olivares (Eds.),
The SAGE handbook of quantitative methods in psychology2. Sage. Ko, H., Cho, C. H., & Roberts, M. S. (2005). Internet uses and gratifications: A structural
equation model of interactive advertising. Journal of Advertising, 34(March 2015), 57–70. doi:10.1080/00913367.2005.10639191
Kobayashi, T., Ikeda, K., & Miyata, K. (2006). Social capital online: Collective use of
the Internet and reciprocity as lubricants of democracy. Information, Community & Society, 9(5), 582–611. doi:10.1080/13691180600965575

129
Krasnova, H., Veltri, N. F., Eling, N., & Buxmann, P. (2017). Why men and women
continue to use social networking sites: The role of gender differences. The Journal of Strategic Information Systems. doi:http://dx.doi.org/10.1016/j.jsis.2017.01.004
Kulviwat, S., Bruner, G. C., & Al-Shuridah, O. (2009). The role of social influence on
adoption of high tech innovations: The moderating effect of public/private consumption. Journal of Business Research, 62(7), 706–712. doi:10.1016/j.jbusres.2007.04.014
Kumlin, S., & Rothstein, B. (2005). Making and breaking social capital. Comparative
Political Studies, 38(4), 339–365. doi:10.1177/0010414004273203 Kwahk, K.-Y., & Ge, X. (2012). The Effects of Social Media on E-Commerce: A
Perspective of Social Impact Theory. 2012 45th Hawaii International Conference on System Sciences, 1814–1823. doi:10.1109/HICSS.2012.564
Latané, B. (1981). The psychology of social impact. American Psychologist, 36(4), 343–
356. doi:10.1037/0003-066X.36.4.343 Latané, B., & L’Herrou, T. (1996). Spatial clustering in the conformity game: Dynamic
social impact in electronic groups. Journal of Personality and Social Psychology, 70(6), 1218–1230. doi:10.1037/0022-3514.70.6.1218
Latané, B., Liu, J. H., Nowak, A., Bonevento, M., & Zheng, L. (1995). Distance matters:
Physical space and social impact. Personality and Social Psychology Bulletin, 21(8), 795–805. doi:10.1177/0146167295218002
Lawson, C., & Greene, K. F. (2014). Making clientelism work: How norms of reciprocity
increase voter compliance. Comparative Politics, 47(1), 61–85. doi:10.5129/001041514813623173
Lee, C. S., & Ma, L. (2012). News sharing in social media: The effect of gratifications
and prior experience. Computers in Human Behavior, 28(2), 331–339. doi:10.1016/j.chb.2011.10.002
Lee, C., & Sohn, D. (2016). Mapping the social capital research in Communication: A
bibliometric analysis. Journalism & Mass Communication Quarterly, 93(4), 728–749. doi:10.1177/1077699015610074
Lee, Y. C. (2017). Effects of branded e-stickers on purchase intentions: The perspective
of social capital theory. Telematics and Informatics, 34(1), 397–411. doi:10.1016/j.tele.2016.06.005

130
Levene, H. (1960). Robust tests for equality of variances. In I. Olkin & H. Hotelling (Eds.), Contributions to probability and statistics (Vol. 1, pp. 278–292). Stanford University.
Levordashka, A., Utz, S., & Ambros, R. (2016). What’s in a like? Motivations for
pressing the like button. Proceedings of the Tenth International AAAI Conference on Web and Social Media (ICWSM 2016), (Icwsm), 623–626.
Lewis, B., & Porter, L. (2010). In-game advertising effects: Examining player
perceptions of advertising schema congruity in a massively multiplayer online role-playing game. Journal of Interactive Advertising, 10(2), 46–60. doi:10.1080/15252019.2010.10722169
Lin, N. (1999). Building a Network Theory of Social Capital. Connections, 22(1), 28–51.
doi:10.1108/14691930410550381 Loewenstein, G. F., Thompson, L., & Bazerman, M. H. (1989). Social utility and
decision making in interpersonal contexts. Journal of Personality and Social Psychology, 57(3), 426–441.
Luqman, A., Cao, X., Ali, A., Masood, A., & Yu, L. (2017). Do you get exhausted from
too much socializing? Empirical investigation of Facebook discontinues usage intentions based on SOR paradigm. Computers in Human Behavior. doi:10.1016/j.chb.2017.01.020
Lutz, R. J. (1977). An Experimental Investigation of Causal Relations among Cognitions,
Affect, and Behavioral Intention. Journal of Consumer Research, 3(4), 197. doi:10.1086/208668
Lutz, R. J., & Bettman, J. R. (1977). Multiattribute models in marketing: A bicentennial
review. Consumer and Industrial Buying Behavior, 137–149. Machleit, K. a., & Wilson, R. D. (1988). Emotional Feelings and Attitude toward the
Advertisement: The Roles of Brand Familarity and Repetition. Journal of Advertising, 17(3), 27–35. doi:10.1080/00913367.1988.10673121
MacKenzie, S. B., Lutz, R. J., & Belch, G. E. (1986). The Role of Attitude toward the Ad
as a Mediator of Advertising Effectiveness: A Test of Competing Explanations. Journal of Marketing Research, 23(2), 130–143. doi:10.2307/3151660
Madden, T. J., Allen, C. T., & Twible, J. L. (1988). Attitude toward the Ad : An
assessment of diverse measurement indices under different processing “Sets.” Journal of Advertising Research, 25(3), 242–252. doi:10.2307/3172527

131
Martin, B. A. S., Wentzel, D., & Tomczak, T. (2008). Effects of susceptibility to normative influence and type of testimonial on attitudes toward print advertising. Journal of Advertising, 37(1), 29–43. doi:10.2753/JOA0091-3367370103
Mason, W. A., Conrey, F. R., & Smith, E. R. (2007). Situating Social Influence
Processes: Dynamic, Multidirectional Flows of Influence Within Social Networks. Personality and Social Psychology Review, 11(3), 279–300. doi:10.1177/1088868307301032
Mathwick, C. (2002). Understanding the online consumer: A typology of online
relational norms and behavior. Journal of Interactive Marketing, 16(1), 40–55. doi:10.1002/dir.10003
Mawhinney, J. (2016, January 13). 37 visual content marketing statistics you should
know in 2016. Retrieved from http://blog.hubspot.com/marketing/visual-content-marketing-strategy#sm.00003e9c1c18bmfemqsc66rs5p11d
Menard, S. (1995). Applied logistic regression analysis: Sage university series on
quantitative applications in the social sciences. Thousand Oaks, CA: Sage. Miller, M. D., & Brunner, C. C. (2008). Social impact in technologically-mediated
communication: An examination of online influence. Computers in Human Behavior, 24(6), 2972–2991. doi:10.1016/j.chb.2008.05.004
Mir, I., & Zaheer, A. (2012). Verification of social impact theory claims in social media
context. Journal of Internet Banking and Commerce, 17(1), 1–15. Mitchell, A. A., & Olson, J. C. (1981). Are product attribute beliefs the only mediator of
advertising effects on brand attitude? Journal of Marketing Research, 18, 318–332. doi:10.1353/asr.2000.0010
Mitchell, V., Macklin, J. E., & Paxman, J. (2007). Social uses of advertising: An example
of young male adults. International Journal of Advertising, 26(2), 199–222. doi:10.1080/10803548.2007.11073007
Mo, R., & Leung, L. (2015). Exploring the roles of narcissism, uses of, and gratifications
from microblogs on affinity-seeking and social capital. Asian Journal of Social Psychology, 18(2), 152–162. doi:10.1111/ajsp.12087
Muntinga, D. G., Moorman, M., & Smit, E. G. (2011). Introducing COBRAs: Exploring
motivations for Brand-Related social media use. International Journal of Advertising, 30(1), 12–46. doi:10.2501/IJA-30-1-013-046

132
Naylor, R. W., Lamberton, C. P., & West, P. M. (2012). Beyond the “Like” Button: The Impact of Mere Virtual Presence on Brand Evaluations and Purchase Intentions in Social Media Settings. Journal of Marketing, 76(6), 105–120. doi:10.1509/jm.11.0105
Ng, C. S. P. (2013). Intention to purchase on social commerce websites across cultures: A
cross-regional study. Information and Management, 50(8), 609–620. doi:10.1016/j.im.2013.08.002
Ni, S., Weng, W., & Zhang, H. (2011). Modeling the effects of social impact on epidemic
spreading in complex networks. Physica A: Statistical Mechanics and Its Applications, 390(23–24), 4528–4534. doi:10.1016/j.physa.2011.07.042
Nowak, A., Szamrej, J., & Latané, B. (1990). From private attitude to public opinion: A
dynamic theory of social impact. Psychological Review, 97(3), 362–376. doi:10.1037/0033-295X.97.3.362
Nunnally, J. C. (1978). Assessment of reliability. In Psychometric theory (2nd ed., pp.
245–246). New York: McGraw-Hill. Oh, C., & Yergeau, S. (2017). Social capital, social media, and TV ratings. International
Journal of Business Information Systems, 24(2), 242–260. doi:10.1504/IJBIS.2017.081450
Orth, U. R., & Kahle, L. R. (2008). Intrapersonal variation in consumer susceptibility to
normative influence: toward a better understanding of brand choice decisions. The Journal of Social Psychology, 148(4), 423–447. doi:10.3200/SOCP.148.4.423-448
Palmgreen, P., & Rayburn, J. D. (1982). Gratifications sought and media exposure: An
expectancy value model. Communication Research, 9(4), 561–580. doi:10.1177/009365082009004004
Pan, Y., & Jackson, R. T. (2008). Ethnic difference in the relationship between acute
inflammation and serum ferritin in US adult males. Epidemiology and Infection, 136(3), 421–31. doi:10.1017/S095026880700831X
Papacharissi, Z., & Mendelson, A. (2011). Toward a New(er) Sociability: Uses,
Gratifications, and Social Capital on Facebook. In S. Papathanassopoulos (Ed.), Media Perspectives for the 21st Century (pp. 212–230). New York: Routledge.
Park, H. S., Dailey, R., & Lemus, D. (2002). The use of exploratory factor analysis and
principal components analysis in communication research. Human Communication Research. doi:10.1093/hcr/28.4.562

133
Park, N., Kee, K. F., & Valenzuela, S. (2009). Being immersed in social networking environment: Facebook groups, uses and gratifications, and social outcomes. Cyberpsychology & Behavior : The Impact of the Internet, Multimedia and Virtual Reality on Behavior and Society, 12(6), 729–733. doi:10.1089/cpb.2009.0003
Perse, E. M., & Ferguson, D. A. (1993). The impact of the newer television technologies
on television satisfaction. Journalism & Mass Communication Quarterly, 70(4), 843–853. doi:10.1177/107769909307000410
Pham, M. T., Geuens, M., & De Pelsmacker, P. (2013). The influence of ad-evoked
feelings on brand evaluations: Empirical generalizations from consumer responses to more than 1000 TV commercials. International Journal of Research in Marketing, 30(4), 383–394. doi:10.1016/j.ijresmar.2013.04.004
Phua, J., Jin, S. V., & Kim, J. J. (2017). Uses and Gratifications of Social Networking
Sites for Bridging and Bonding Social Capital: A Comparison of Facebook, Twitter, Instagram, and Snapchat. Computers in Human Behavior, 72(February), 115–122. doi:10.1016/j.chb.2017.02.041
Przybylski, A. K., Murayama, K., Dehaan, C. R., & Gladwell, V. (2013). Motivational,
emotional, and behavioral correlates of fear of missing out. Computers in Human Behavior, 29(4), 1841–1848. doi:10.1016/j.chb.2013.02.014
Putnam, R. D. (2000). Bowling alone: The collapse and revival of American community.
New York: Simon & Schuster. Quan-Haase, A., & Young, A. L. (2010). Uses and gratifications of social media: A
comparison of Facebook and instant messaging. Bulletin of Science, Technology & Society, 30, 350–361. doi:10.1177/0270467610380009
Raacke, J., & Bonds-Raacke, J. (2008). MySpace and Facebook: applying the uses and
gratifications theory to exploring friend-networking sites. Cyberpsychology & Behavior : The Impact of the Internet, Multimedia and Virtual Reality on Behavior and Society, 11(2), 169–74. doi:10.1089/cpb.2007.0056
Rayburn, J. D., & Palmgreen, P. (1984). Merging uses and gratifications and expectancy-
value theory. Communication Research, 11(4), 537–562. doi:10.1177/009365084011004005
Ritson, M., & Elliott, R. (1999). The Social Uses of Advertising: An Ethnographic Study
of Adolescent Advertising Audiences. Journal of Consumer Research, 26(3), 260–277. doi:10.1086/209562
Ruggiero, T. E. (2000). Uses and gratifications theory in the 21st century. Mass
Communication and Society, 3(1), 3–37. doi:10.1207/S15327825MCS0301_02

134
Sanyal, P. (2009). From credit to collective action: The role of microfinance in promoting women’s social capital and normative influence. American Sociological Review, 74(4), 529–550. doi:10.1177/000312240907400402
Seinen, I., & Schram, A. (2006). Social status and group norms: Indirect reciprocity in a
repeated helping experiment. European Economic Review, 50(3), 581–602. doi:10.1016/j.euroecorev.2004.10.005
Sheehan, K. B. (2015). A change in the climate: Online social capital and the spiral of
silence. First Monday, 20(5). doi:10.5210/fm.v20i5.5414 Sherif, M. (1936). The psychology of social norms. Oxford, England: Harper. Sobel, J. (2002). Can we trust social capital? Journal of Economic Literature, 40(1), 139–
154. Sobel, M. (2009). Causal inference in randomized and non-randomized studies. In R. E.
Millsap & A. Maydeu-Olivares (Eds.), The SAGE handbook of quantitative methods in psychology. Sage.
Social network ad revenues accelerate worldwide. (2015, September 23). Retrieved
October 13, 2016, from http://www.emarketer.com/Article/Social-Network-Ad-Revenues-Accelerate-Worldwide/1013015
Steinfield, C., DiMicco, J. M., Ellison, N. B., & Lampe, C. (2009). Bowling Online :
Social Networking and Social Capital within the Organization. Distribution, 245–254. doi:10.1145/1556460.1556496
Steinfield, C., Ellison, N. B., & Lampe, C. (2008). Social capital, self-esteem, and use of
online social network sites: A longitudinal analysis. Journal of Applied Developmental Psychology, 29(6), 434–445. doi:10.1016/j.appdev.2008.07.002
Steinfield, C., Ellison, N. B., Lampe, C., & Vitak, J. (2012). Online social network sites
and the concept of social capital. Frontiers in New Media Research, 115–131. doi:10.4324/9780203113417
Su, C. C., & Chan, N. K. (2017). Predicting social capital on Facebook: The implications
of use intensity, perceived content desirability, and Facebook-enabled communication practices. Computers in Human Behavior, 72, 259–268. doi:10.1016/j.chb.2017.02.058
Swank, C. (1979). Media uses and gratifications: Need salience and source dependence in
a sample of the elderly. American Behavioral Scientist, 23(1), 95–117. doi:10.1177/000276427902300106

135
Tavakol, M., & Dennick, R. (2011). Making sense of Cronbach’s alpha. In International Journal of Medical Education (Vol. 2, pp. 53–55). doi:10.5116/ijme.4dfb.8dfd
Thorson, E., Wicks, R., & Leshner, G. (2012). Experimental methodology in journalism
and mass communication research. Journalism & Mass Communication Quarterly, 89(1), 112–124. doi:10.1177/1077699011430066
Toner, L. (2013, September 26). The history of Facebook advertising. Retrieved from
http://blog.hubspot.com/marketing/history-facebook-adtips-slideshare#sm.00003e9c1c18bmfemqsc66rs5p11d
Trafimow, D., & Finlay, K. A. (1996). The importance of subjective norms for a minority
of people: Between-subjects and within-subjects analyses. Personality and Social Psychology Bulletin, 22, 820–828. doi:10.1177/0146167296228005
Trepte, S., & Reinecke, L. (2012). The reciprocal effects of social network site use and
the disposition for self-disclosure: A longitudinal study. Computers in Human Behavior, 29(3), 1102–1112. doi:10.1016/j.chb.2012.10.002
Utz, S., & Kramer, N. C. (2004). The privacy paradox on social network sites revisited:
The role of individual characteristics and group norms. Cyberpsychology: Journal of Psychosocial Research on Cyberspace, 3(2), 1.
Valenzuela, S., Park, N., & Kee, K. F. (2009). Is there social capital in a social network
site?: Facebook use and college student’s life satisfaction, trust, and participation. Journal of Computer-Mediated Communication, 14(4), 875–901. doi:10.1111/j.1083-6101.2009.01474.x
Vitak, J., Ellison, N. B., & Steinfield, C. (2011). The ties that bond: Re-examining the
relationship between Facebook use and bonding social capital. Proceedings of the Annual Hawaii International Conference on System Sciences, 1–10. doi:10.1109/HICSS.2011.435
Waardenburg, T., Winkel, R., & Lamers, M. H. (2012). Normative social influence in
persuasive technology: Intensity versus effectiveness. In International Conference on Persuasive Technology (pp. 145–156). Berlin Heidelberg: Springer. doi:10.1007/978-3-642-31037-9_13
Wang, X., Yu, C., & Wei, Y. (2012). Social media peer communication and impacts on
purchase intentions: A consumer socialization framework. Journal of Interactive Marketing, 26(4), 198–208. doi:10.1016/j.intmar.2011.11.004
Wang, Z., Tchernev, J. M., & Solloway, T. (2012). A dynamic longitudinal examination
of social media use, needs, and gratifications among college students. Computers in Human Behavior Journal, 28, 1829–1839. doi:10.1016/j.chb.2012.05.001

136
Wasko, M. M., & Faraj, S. (2005). Why should I share? Examining social capital and knowledge contribution in electronic networks of practice. MIS Quarterly, 29(1), 35–57.
Waterhouse, D. (2015, September 3). What is the ideal length of an online video ad?
Retrieved from https://unruly.co/blog/article/2015/03/09/what-is-the-ideal-length-for-an-online-video-ad/
Web Video Marketing Council, Flimp Media, & ReelSEO. (2015). 2015 B2B Video
Content Marketing Survey Results. Weiksner, G. M., Fogg, B. J., & Liu, X. (2008). Six patterns for persuasion in online
social networks. In International Conference on Persuasive Technology (pp. 151–163). doi:10.1007/978-3-540-68504-3_14
Wells, W. D., Leavitt, C., & McConville, M. (1971). A reaction profile for TV
commercials. Journal of Advertising Research, 22, 11–17. Whiting, A., & Williams, D. (2013). Why people use social media: A uses and
gratifications approach. Qualitative Market Research: An International Journal, 16(4), 362–369. doi:10.1108/QMR-06-2013-0041
Wilkie, W. L., & Pessemier, E. A. (1973). Issues in marketing’s use of multi-attribute
attitude models. Journal of Marketing Research, 10(4), 428–441. doi:10.2307/3149391
Williams, D. C. (2006). On and off the ’Net: Scales for social capital in an online era.
Journal of Computer-Mediated Communication, 11(2), 593–628. doi:10.1111/j.1083-6101.2006.00029.x
Wise, K., Bolls, P. D., Kim, H., Venkataraman, A., & Meyer, R. (2008). Enjoyment of
advergames and brand attitudes: The impact of thematic relevance. Journal of Interactive Advertising, 9(1), 27–36. doi:10.1080/15252019.2008.10722145
Wolf, S., & Latané, B. (1983). Majority and minority influence on restaurant preferences.
Journal of Personality and Social Psychology, 45(2), 282–292. doi:10.1037/0022-3514.45.2.282
Wright, P. L. (1973). The cognitive processes mediating acceptance of advertising.
Journal of Marketing Research, 10(1), 53–62. doi:10.2307/3149409