Buybacks Around the World - EFMA ANNUAL MEETINGS... · Buybacks Around the World ... short-term...
64
Buybacks Around the World Alberto Manconi Urs Peyer Theo Vermaelen* 12/02/2012 Abstract This paper documents that short-term returns around share repurchase announcements and long-run abnormal returns afterwards are following the same pattern in non-US firms as document by prior literature for U.S. firms. We test whether cross-country differences in corporate governance quality and regulatory differences can explain variation in the short- and long-run abnormal returns. We find positive announcement returns around the world, higher in better governed countries and firms, and where regulation allows the board rather than the shareholders to approve a buyback announcement. Long-run abnormal returns are also observed globally and they are related to an undervaluation index (Peyer and Vermaelen, 2009, RFS) consistent with the interpretation that managers are able to time the market by buying back their own shares at low prices. Governance quality is also related to returns. Firms with lower governance ratings outperform those with higher ratings in the long run consistent with the buyback signalling lower agency problems than expected by the market. Furthermore, long run abnormal returns are higher in board approval countries suggesting that board approval regimes make managers act more in the interest of long-term shareholders rather than using buybacks to manipulate share prices. *: Alberto Manconi: Finance Department, Tilburg University, CentER, PO Box 90153, 5000LE Tilburg, Netherlands, email: [email protected]. Urs Peyer: Finance Department, INSEAD, Bd de Constance, 77305 Fontainebleau Cedex, France, email: [email protected]. Theo Vermaelen: Finance Department, INSEAD, Bd de Constance, 77305 Fontainebleau Cedex, France, email: [email protected]. We thank Cornelia Schuette for excellent research assistance and Raquel F. Oliveira of the Central Bank of Brazil for help clarifying the Brazilian regulation. We also thank seminar participants at Tilburg University, “Payout Policy: Foundations and Trends” conference (2011, Wupperthal), and Exeter University.
-
Upload
hoangtuyen -
Category
Documents
-
view
217 -
download
1
Transcript of Buybacks Around the World - EFMA ANNUAL MEETINGS... · Buybacks Around the World ... short-term...

Buybacks Around the World
Alberto Manconi Urs Peyer Theo Vermaelen*
12/02/2012
Abstract
This paper documents that short-term returns around share repurchase announcements and long-run abnormal
returns afterwards are following the same pattern in non-US firms as document by prior literature for U.S.
firms. We test whether cross-country differences in corporate governance quality and regulatory differences can
explain variation in the short- and long-run abnormal returns. We find positive announcement returns around
the world, higher in better governed countries and firms, and where regulation allows the board rather than the
shareholders to approve a buyback announcement. Long-run abnormal returns are also observed globally and
they are related to an undervaluation index (Peyer and Vermaelen, 2009, RFS) consistent with the interpretation
that managers are able to time the market by buying back their own shares at low prices. Governance quality is
also related to returns. Firms with lower governance ratings outperform those with higher ratings in the long run
consistent with the buyback signalling lower agency problems than expected by the market. Furthermore, long
run abnormal returns are higher in board approval countries suggesting that board approval regimes make
managers act more in the interest of long-term shareholders rather than using buybacks to manipulate share
prices.
*: Alberto Manconi: Finance Department, Tilburg University, CentER, PO Box 90153, 5000LE Tilburg, Netherlands, email:
[email protected]. Urs Peyer: Finance Department, INSEAD, Bd de Constance, 77305 Fontainebleau Cedex, France,
email: [email protected]. Theo Vermaelen: Finance Department, INSEAD, Bd de Constance, 77305 Fontainebleau Cedex, France,
email: [email protected]. We thank Cornelia Schuette for excellent research assistance and Raquel F. Oliveira of the Central
Bank of Brazil for help clarifying the Brazilian regulation. We also thank seminar participants at Tilburg University, “Payout Policy:
Foundations and Trends” conference (2011, Wupperthal), and Exeter University.

2
1. Introduction
During the last decade share repurchases have become increasingly common around the world. For example, in
many European countries, regulation has drastically changed a firm’s ability to repurchase their own shares. As
a result, it is possible to test whether the conclusions of research based on U.S. data also hold up in an
international setting. Past research (e.g. Ikenberry, Lakonishok and Vermaelen (1995), Peyer and Vermaelen
(2009)) shows that in the U.S. open market share repurchase announcements are accompanied by a positive
short-term abnormal return of about 3% and long-run abnormal returns in the order of 30% over three to four
years. Research on short term announcement returns (e.g. Vermaelen (1981), Ikenberry et al (1995) and Grullon
and Michaely (2004)) shows that these returns are higher when the percentage of shares repurchased is larger,
when the firm has excess cash and is a value stock and when the management states “undervaluation” as a
motivation for the repurchase. On the other hand short term returns are negatively related to firm size and pre-
announcement returns. These results are consistent with a variety of non-mutually exclusive explanations for
the benefits from open market share buybacks: signaling, reduction in agency costs of equity and corporate tax
savings from increased leverage. The results on long term returns imply that the U.S. market systematically
underreacts to open market buyback announcements, especially for beaten up small firms, downgraded by
analysts prior to the buyback announcement (Peyer and Vermaelen (2009)). The implication is that, on average,
managers are able to time the market by taking advantage of market mistakes and buying back undervalued
stock. In other words, managers don’t want to signal, quite the opposite: they want to benefit long term
shareholders at the expense of overly pessimistic selling shareholders.
The interesting question is whether these findings hold in an international setting. Of particular interest
are whether differences in regulation and governance have an impact on stock returns. In some countries, like
the US, the board of directors has the power to decide on a buyback while in other countries (e.g., Germany) the
shareholders have to approve a buyback program. The European insistence on having shareholders approve
buybacks is supposed to protect shareholders against buybacks driven by non-shareholder value driven motives.
Whether this regulation is indeed effective is an empirical question. Furthermore, U.S. corporate governance
rankings are typically better than those of other countries (e.g., La Porta et al., 2000). We can thus test whether
short term and long run abnormal returns depend on the governance framework of a country and the firm. In

3
some countries, the objective of corporations is to maximize the wealth of the stakeholders, while in others,
especially the U.S. and the U.K., corporations are mostly run to maximize the wealth of shareholders (e.g.,
Allen et al., 2007; Loderer et al., 2010). Corporate governance could affect announcement returns in various
ways. Markets might interpret a buyback more positively in the presence of superior quality of corporate
governance in the country or at the firm level, as it is then more likely that the buyback is driven by concern for
long-term shareholder value. On the other hand, buybacks could be driven by attempts to manipulate short term
stock prices and earnings per share, perhaps at the expense of long term shareholder value. Alternatively, better
governance could be negatively related to announcement returns, if shareholders of firms with worse
governance are more positively surprised about the fact that the firm is willing to return excess cash to
shareholders. This would be especially the case if positive announcement returns can be explained by reductions
in agency costs of free cash flow.
In this paper we investigate the short-run and long-run stock market reactions to buyback
announcements using a global sample of 17,487 announcements from 32 countries between 1998 and 2008.
This global approach allows U.S. to test whether differences in short term and long-term returns are associated
with the quality of corporate governance and regulatory differences.
Around the announcement, we find that the 7,394 non-US buybacks generate a significant positive
average abnormal return. However, the magnitude of the announcement returns is only about half of that in the
U.S. (1.27 % versus 2.16%). We first test whether the differences in announcement returns are associated with
better governance.We find that governance quality, both at the country as well as the firm level, is positively
associated with announcement returns. We use three proxies of governance quality at the country level: the
quality of shareholder rights (the origin of law (La Porta et al., 1998)), the Governance Rating of
GovernanceMetrics International®, and the Loderer et al. (2010) index, which measures the percentage of firms
that mention “shareholder value” in their mission statement. We also use two proxies of governance quality at
the firm level: the ISS Corporate Governance Quotient, and information on whether the firm is also publicly
listed in the U.S. The relevance of corporate governance for announcement returns is confirmed when we run
firm-level cross-sectional regressions: announcement returns are positively related to the percentage of shares
sought and negatively related to pre-announcement returns (a finding reported by past research on the U.S.), but
are also significantly positively related to proxies for corporate governance quality.

4
Our findings complement the analysis of Ellis, Moeller, Schlingemann, and Stulz (2011) who find that
the quality of corporate governance is positively related to bidder returns around acquisition announcements.
They interpret their findings as being consistent with the hypothesis that better governance has a positive effect
on firm investment quality – or at least the extent to which any gains from investment accrue to the
shareholders. To the extent that a buyback is also an investment decision, our findings are consistent with the
conclusions of Ellis et al. (2011). Note that, as in the case of acquisitions, share buybacks can be driven by non-
value maximizing incentives such as fighting a takeover bid by repurchasing shares from “pessimistic”
shareholders, stabilizing the stock price by buying shares above “fair” value, manipulating earnings per share
(Chan, Ikenberry, and Lee (2007)), or acting in the interest of a majority stockholder at the expense of minority
shareholders. The latter argument is particularly important in European firms, where Faccio and Lang (2002)
find a minority of the publicly traded firms to be widely held. We conclude that when corporate governance
quality is high, markets do not expect that managers use buybacks to engage in these non-value maximizing
activities.
Our finding that corporate governance matters is consistent with other findings in the literature. Firms
with better governance are valued higher (e.g., Aggarwal, Erel, Stulz, and Williamson (2009)) and, at the
country level, the average firm is valued higher if country level governance variables indicate better governance
(e.g., La Porta et al, 1998, 2002). One possible reason for the valuation differences is that minority shareholders
in badly governed firms are more likely to get expropriated (e.g., Bertrand, Mehta, and Mullainathan, 2002;
Johnson et al., 2000; Cheung, Rau, and Stouraitis, 2006). Another reason for the observed differences in
valuation could simply be that managers are not acting in the interest of shareholders when making corporate
decisions, and such behavior destroys shareholder value (e.g., Jensen and Meckling, 1976; Jensen, 1986).
Next, we test whether regulatory differences affect the market reaction to buybacks. In our sample
period, 1998-2008, all countries in our sample allow share repurchases. Concerns of possible market
manipulation led before the (late) nineties to regulation in many countries that effectively prohibited buybacks,
except in very special circumstances, or exposed firms to possible legal actions if they traded in their own
shares. In the U.S., the SEC ruled in 1982 that a buyback decision taken by the firm falls under the safe harbor

5
Rule 10b-18 if certain provisions are followed.1 While this rule does not provide protection for companies that
are in possession of material undisclosed information, it sets out that trades as part of a buyback program would
fall under the safe harbor provision. Since at least about 1998, most countries in our sample introduced similar
regulation.2 However, there are regulatory differences that one could expect to impact announcement returns, in
particular with respect to who has the power to authorize a buyback. In some countries, like the U.S., the
management only has to ask the authorization of the board of directors. Specifically, board approval is sufficient
in Australia, Canada, India, Israel, New Zealand, Switzerland, Taiwan, and Thailand. However, in all other
countries, shareholder approval is required. Hence, announcement returns may be lower in shareholder approval
countries if the announcement simply reflects a routine request of the management to ask for shareholder
approval at the next shareholder meeting to buy back stock for the next 18 months or so. Such routine requests
make sense as it would be prohibitively expensive to call a special shareholders meeting, simply to approve a
buyback authorization. Moreover, as in board approval countries the management has to convince board
members that the buyback is in the best interest of the shareholders, we may expect a more positive share price
response than in shareholder approval countries. Especially, if board approved share buybacks are more timely
responses to specific company events such as a sudden stock price decline. In other words, board approval may
be associated with better governance. In addition, there are regulatory differences in terms of the quantity of
shares that firms are allowed to repurchase, and whether and when the announced buyback has to be completed.
One would expect a more positive shareholder response in countries where a buyback announcement is a firm
commitment to repurchase shares, not an option.
We find that the average announcement return is significantly higher in countries where board approval
is sufficient. Note that the differences we find between board and shareholder approval countries are after we
control for the average (assumed to be the expected) completion rate of buybacks in a country. Average
completion rates are positively related to announcement returns, consistent with the interpretation that the
markets value the option to repurchase higher if the option is more likely to be exercised. Other regulatory
differences do not seem to have a significant effect on announcement returns. To the extent that board approval
1 For details see e.g., Cook, Krigman, and Leach (2003). 2 The UK allowed buybacks in 1981, Hong Kong in 1991, Switzerland in 1992, Japan 1994. France and Germany made the condition
less restrictive in 1998. In the Netherlands a tax law revision in 2001 lowered the cost of a buyback. An overview of open market
buyback regulation in ten countries is given in Kim, Schremper, and Varaiya (2005).

6
encourages good governance, the results confirm that governance quality is a significant determinant of
announcement returns.
To further explore whether market timing is an important motivation for buyback announcements, we
perform long-run event studies, following the methodologies in Peyer and Vermaelen (2009). We find that open
market buybacks globally generate significant positive long-term excess returns. Using the calendar-time long
term event study methodology and using one, three and four factor models we find significant positive alphas
over all post-repurchase horizons (12 to 48 months). Moreover the non-US monthly alphas are generally larger
than the corresponding U.S. ones under three- and four-factor models. When focusing on individual countries,
we find that this result is not due to a few outliers. For example, we find that 19 out of the 31 non-U.S. countries
display significantly positive abnormal returns over 48 months, using the Fama-French three-factor model.
More importantly, regardless of the investment horizon or the factor model used, we find no country with
significant negative long run abnormal returns, except for Greece over a 12 month horizon. Is the absence of
positive abnormal returns in the long run in some countries an indication of more efficient capital market
reactions at the time of the announcement? One way to look at this is to compute the correlation between the
country average short term return and the country average long term abnormal return over 36 and 48 months.
Independent of the way we compute long run excess returns, we always find a negative correlation coefficients
between 3 % and 4 %, which is consistent with the hypothesis that some markets may react more efficiently to
the buyback announcement or that market timing is more difficult in some countries than others.
Finally, we explore various hypotheses to “explain” these long term abnormal returns. According to the
risk change hypothesis, repurchasing firms increase their leverage thus increasing systematic risk. To the extent
that benchmark models such as the calendar time portfolio approach (Fama, 1998) do not allow for the factor
loadings to change through time, the observed outperformance could simply be due to higher risk. In order to
test this hypothesis we re-compute abnormal returns with the IRATS method, which adjusts for risk-changes in
event time. We find cumulative abnormal returns after the buyback between 17.5 % and 36 % over 48 months,
depending on the factor model, using local currency and local factors. When the benchmarks are regional
factors (Fama-French, 2012) and when we measure returns in U.S. dollars, we find similar results: depending on
the factor model four year post-repurchase cumulative abnormal returns range from 20.5 % to 39 %. Hence, the
excess returns cannot be explained by an increase in risk.

7
A second hypothesis, the corporate governance hypothesis, argues that the excess returns reflect the
market’s underestimation of the importance of the buyback as a signal of good governance. Evidence that
markets only slowly adjust to governance quality is provide by Gompers et al (2003). We do find that low
Corporate Governance Quotient (CGQ) repurchasing firms outperform high CGQ repurchasing firms in the
long run, which is consistent with the argument that repurchasing firms are trying to signal that the quality of
their governance is underestimated. However, while this outperformance is statistically significant, the
economic significance is too small (between 3.7 % and 5.1 % over 48 months after the buyback) to explain the
long term excess returns. One additional test of the governance hypothesis is to test whether long run returns are
positively correlated with repurchase completion rates. This would be the case if we define good governance as
reducing agency costs of free cash flow. However, we find no such correlation. The evidence that excess returns
don’t seem to depend on whether the buyback is completed or not is more consistent with the market timing
hypothesis (see Ikenberry et al. (2000))
According to the market timing hypothesis, firms take advantage of an undervalued stock price for the
benefit of the long term shareholders (which will generally include insiders). To test the information hypothesis,
we follow the procedure proposed by Peyer and Vermaelen (2009), who construct an undervaluation index (U-
index) that is correlated with the probability that the buyback is driven by undervaluation. Consistent with the
U.S. evidence, high U-index firms tend to outperform low U-index firms over long horizons. As in the US, prior
to the buyback announcement, analysts lower EPS forecasts of high U-index firms, which is consistent with the
hypothesis that the buyback is triggered by analyst mistakes. A potential alternative source of information
asymmetry may well be that the management is aware of a potential takeover bid and that they repurchase
shares to be in a better negotiation position. However we find no evidence that buyback firms who are
subsequently taken over experience higher long term excess returns than buyback firms who are not. Finally, we
test whether the fact that the board has to approve a buyback makes a difference. Interestingly, we find evidence
that buybacks in board approval countries are followed by higher long term excess returns than in shareholder
approval countries. This is consistent with the interpretation that repurchase decisions approved by the board are
better than those who do not have to be approved by the board, suggesting that board approval is a proxy for
better governance. These first tests of the market timing hypotheses mostly focus on differences in opinions
about cash flows. Grullon and Michaely (2004) conclude that stock prices outperform after buybacks to the

8
extent that markets are slow to realize that buyback firms experience a significant drop in systematic risk as
they move from being growth companies to being more mature businesses. In our global dataset, we do not find
significant reductions in systematic risk, measured using one, three, and four factor models. Therefore, the long-
run abnormal returns, on average, cannot be explained predominantly by an underreaction to drops in risk. To
test whether the reduction in risk hypothesis can explain cross-sectional variation in the long-run abnormal
returns we split the buyback sample into firms where risk did go down, measured by a drop in beta from before
to after the buyback announcement, versus the rest. We find no significant differences in long-run abnormal
return between the two portfolios. The data suggests that unanticipated changes in risk after a buyback are not
the main reason for positive long-run abnormal returns in our global dataset.
We are left with the conclusion that companies around the world tend to buy back stock when their
shares are undervalued. Firms in board approval countries seem to be better at doing this, and beaten up small
cap value stocks (high U-index firms) have more reason to believe that they are undervalued than others.
Why does such an anomaly persist? It should be pointed out that the percentage of listed firms that
announce buybacks is relatively small (between 0.5 % in Israel and 6.5 % in Japan). Moreover we find that the
market is not more efficient in countries where buybacks are relatively popular. The problem with learning in
this setting is that the excess returns are realized over a long time period, which makes it difficult for investors
to attribute the excess returns to the buyback rather than to other company specific events.
This paper is organized as follows. In section 2 we describe our data. Section 3 describes the methodology
and results of our analysis of short-term announcement returns. Section 4 discusses our methodology and results
on long run returns. Section 5 concludes.
2. Data
We collect a sample of open-market share repurchase announcements from the SDC Mergers and Acquisitions
and Repurchase data bases. For announcing firms which are listed outside of the U.S. we use Datastream and
Worldscope as data source for stock price and accounting information. For U.S. firms we use CRSP and
Compustat. We restrict the sample to announcement dates in the period between 1998 and 2008. The year 1998
is the year were most countries in our sample have made buybacks legal and reduced tax and other obstacles
preventing firms from buying back their own shares. We focus on open-market share repurchases, as this is the

9
most common form of repurchases worldwide.3 We restrict the sample to announcements where the percentage
of shares sought for the buyback is less than 50%, in order to exclude going private transactions. We further
require that stock return data are available from Datastream for each of our sample firms.4 We focus on the 31
nations with at least 20 buyback announcements in the sample period. This results in a buyback sample of 7,394
announcements from the 31 non-U.S. countries, plus 10,093 announcements from U.S. firms.
Table I reports a breakdown of the sample by the country of the repurchasing firm. The country with the
largest number of announcements outside the U.S. is Japan (2,644), the one with the smallest number in our
sample is Singapore (19). Figure 1 provides an illustration of the geographical distribution of share repurchase
announcements in our sample. On average, firms outside the U.S. seek to buy back 7.4%, while U.S. firms
reportedly seek 9.3%. Country averages vary between 4.8% (Taiwan) and 12.7% (India) of their shares on
average. These average figures mask considerable variation among individual repurchase announcements, with
the percentage of shares sought being as low as 0.1% and as high as 50%.
One potential difference across countries could be the extent to which firms in different countries use
the option to have a buyback, but do not complete it. Thus, announcement returns could be lower to the extent
that shareholders do not expect the firm to exercise the option to repurchase. Table II reports completion rates
across the different countries. Completion rates are defined as the percentage of the announced buyback that is
actually completed (for details of the variable definition, please see the Appendix). Outside the US, we find that
the average completion rate after 1 (2) year(s) is 59% (71%). For U.S. firms, we find 75% and 85%,
respectively. So it seems that completion rates outside the U.S. are lower. This may be a consequence of the fact
that some buyback announcements are automatic requests to extend buyback authorisations at the next
shareholder’s meeting. There is also considerable variation across countries. Sweden and Japan have the lowest
completion rates after 1 year, with only 22% and 23%, respectively, completed. China and Israel have the
highest with 86% completed after 1 year.
3 Over the sample period, SDC reports only 635 non-open market repurchase announcement outside of the U.S. and Canada, of which
606 are privately negotiated repurchases, 24 are tender offers, and 5 take the form of Dutch auction. 4 For a number of announcements from the SDC Mergers and Acquisitions database, the Datastream code identifying the announcing
firm in Datastream is reported by SDC. For the remaining firms, we manually look for the corresponding record, if available, in
Datastream. Appendix C reports that the matching does not reduce the sample size of buybacks from SDC significantly. However, note
that SDC and Datastream do not cover all firms outside the U.S.. Both data providers apply size restrictions, concerning both the firms’
market capitalization (Datastream) and the buyback program size (SDC). Thus, our sample size might be smaller than that of prior
literature collecting information based on local news and stock exchange information.

10
As illustrated by Figure 2, there is also considerable variation in the number of repurchase
announcements over time, as well as across countries with different legal origin (La Porta et al., 1998). Our
sample includes years with relatively few repurchase announcements – 1998 with 452 announcements, or 2005
with 464 – as well as two “peak” years – 2003 with 1120 announcements, and 2008, with 1282. Following La
Porta et al. (1998), we consider four distinct legal origins: English common law, and French, German, and
Scandinavian civil law. A large fraction of the repurchase announcements outside the U.S. (44%) are from firms
from a German civil law country – mostly driven by Japan; around 43% are from English common law
countries; 10% from French civil law countries; and 3% from Scandinavian civil law countries.
3. Short term announcement returns
We start with an analysis of short-term stock market reactions to buyback announcements. Our main questions
are: first, whether shareholders view a buyback announcement as positive news consistent with U.S. evidence.
Second, whether the announcement returns are related to the quality of corporate governance and differences in
regulation.
3.1. Hypotheses
Many extant papers have documented stock market reactions to buyback announcements in various countries.
Our first question is whether variations in the average stock market reaction are related to differences in
corporate governance quality and differences in buyback regulation between countries. If better governance is
associated with fewer agency problems and a higher likelihood that firms maximize shareholder value, then
firms in countries with better governance should react more positively to a buyback announcement. On the
other hand, a negative relation could exist, if the fact that a firm returns excess funds to shareholders is a greater
surprise to the market in countries with inferior corporate governance quality.
One of the main differences in regulation across countries is who has the power to announce a buyback
program. If the board of directors has the decision power, management has to convince board members that
initiating a buyback program at a specific point in time is in the best interest of the shareholders, e.g. that the
stock is undervalued. When shareholder approval is required, the request to buy back stock is made at the
general assembly. We are not aware of any request that was ever denied by stockholders, which is not surprising
11
as these are requests to have an option to repurchase stock during the next 18 months. So, if board approval is a
better mechanism to ensure that a buyback is motivated by proper reasons, we expect stock prices to increase
more in board approval countries. On the other hand, if European regulators are right in insisting that
shareholder approval is the best method to protect shareholder interests, we expect the opposite result. In the
following we first document the average abnormal returns by country, and then test the hypotheses in cross-
country tests.
3.2 Methodology
We follow a standard methodology to estimate the announcement effects, or cumulative abnormal returns
around the stock repurchase announcement date. The cumulative abnormal returns are computed for 3-day (-
1,+1), 5-day (-2,+2), and 7-day (-3,+3) intervals around the announcement date. On a given day, the abnormal
return is estimated as a market-adjusted return, i.e., as the difference between the actual stock return and the
expected stock return, assumed equal to the market return. Market-adjusted returns are preferred to the more
common approach of estimating abnormal returns as the residuals from a market model regression, given that a
number of the markets where our sample firms are listed are much less liquid than the U.S. stock market, and
thin trading could lead to biased estimates of the market model parameters.5 The cumulative abnormal return
(CAR) is simply the sum of the abnormal returns on each day of a given interval.
We also report the significance levels of tests between a given country’s CAR with the respective U.S.
sample CAR. Given that the number of repurchase announcements for each nation in our sample is generally
smaller than the number of open-market repurchase announcements in the U.S. over the same period, any
difference between our estimates and the results obtained in the literature on buybacks in the U.S. could be
spurious, and an artefact of the smaller sample size. In order to explicitly control for this possibility, we resort to
a bootstrap procedure. The procedure is carried out as follows. For each nation in our sample having n
announcements, we randomly select a sample of n U.S. open-market repurchase announcements, and compute
the average cumulative abnormal return around the U.S. announcements.6 We repeat this procedure 1,000 times,
5 In unreported results, we also estimated the abnormal returns as the difference between the stock return and the predicted stock return
from a market model. The results are qualitatively similar to the ones reported. Additionally, we also repeated the exercise estimating the
parameters of the market model using the Scholes and Williams (1977) procedure to correct for thin trading, obtaining, again,
qualitatively similar results. 6 The sample of U.S. repurchase announcements used in the bootstrap procedure is collected from the SDC Mergers and Acquisitions
and Repurchases databases, with the same criteria as the sample of international share repurchase announcements. In other words, the

12
each time drawing a fresh sample of U.S. announcements. We then compare the non-U.S. average cumulative
abnormal return to the distribution of bootstrapped U.S. average cumulative abnormal return, to evaluate if any
differences are significant.
3.3 Results
Table III shows that the average abnormal announcement return of the overall sample of buybacks outside the
U.S. is 1.27% over the three-day (-1,+1) window, and 1.48% over the seven-day (-3,+3) window. These
averages are significantly different from zero. As such, globally, the average investor’s reaction goes in the
same direction, i.e., up, if firms announce a buyback. However, the average abnormal returns over the three
different windows are all significantly lower (with bootstrap p-values of 0.00) than for the average U.S. firm
with a CAR of 2.16% (2.01%). There are nine countries with average CAR (-1,+1) higher than the U.S..
However, none is statistically significantly different from the average U.S. announcement return. We find one
country (Indonesia) with a marginally significant negative CAR (-1,+1). Over any other window, no
significantly negative CAR is recorded.
These average announcement returns are consistent with the interpretation that buybacks outside the
U.S. are also viewed positively, but more often than not, investors react less positively than in the U.S.
benchmark case.
3.3.1. Country level analysis
In Table IV we test to what extent differences in the quality of governance at the country level can explain
country-average cross-sectional differences. Our first hypothesis predicts that governance solutions where
managers and shareholders’ interests are more aligned results in more positive abnormal announcement returns.
The alternative hypothesis is that announcement returns are higher in worse governed counties to the extent that
the share repurchase is a bigger surprise suggesting managers are less likely to waste shareholders money.
In Panel A of Table IV we show average CAR(-1,1) for firms in the four different legal origin countries.
Results are qualitatively similar whether we include or exclude the US. Including the US, we find the following
average CARs: The English common law country average is 2.05%, German (1.40%), Scandinavian (1.08%),
attention is restricted to open-market announcements by firms with complete return data from the CRSP data set, taking place over the
period 1998-2008. We also repeat the bootstrap procedure using a sample of U.S. open-market repurchase announcements from the
period 1991-2001 (this is the same period covered by Peyer and Vermaelen (2009)). The results are similar to the ones reported here, and
are thus omitted in the interest of brevity.

13
and French (0.37%) civil law are all lower. The French average is even insignificantly different from zero. To
the extent that French civil law countries also have the lowest governance ratings (e.g., La Porta et al, 1998),
these findings suggest that better governance is associated with higher abnormal announcement returns. To test
this hypothesis further, we run country-level cross-sectional regressions. In Panel B of Table IV, we show
regressions using various proxies for governance quality at the country level. In each regression we include
country-level average completion rates and the fraction of shares sought at the time of the announcement.
Regressions 1-4 exclude the US, 5-8 include the US. The results are qualitatively similar suggesting that the
U.S. is not solely driving the findings. Consistent with the univariate statistics in Panel A, we find that the
average announcement returns are significantly lower in French civil law countries compared to the English
legal origin countries. The completion rate is positively associated with the announcement return, although
statistically it is only weakly significant when the U.S. is included. This finding is consistent with the
interpretation that governance quality matters to some extent when shareholders react to a buyback
announcement. Furthermore, the higher the completion rate, on average, the more positive the shareholders
react to the announcement.
In column 2 and 6 we find that countries with a higher GovernanceMetrics International® Index (GMI)
display a higher announcement return. The index varies from zero to ten. Thus, an increase of the GMI of one
increases the country-average CAR(-1,+1) by 0.27%. Compared to the average CAR of about 1%, this seems
economically sizable. A GMI difference of about one exists between the UK (7.36) and New Zealand (6.42).
The difference in country GMI between the UK and the U.S. (7.18) is about 0.2. Similarly, using the Loderer et
al (2010) index we find a positive association with CAR. Loderer et al. (2010) assesses the shareholder value
maximization orientation of companies in various countries. The variable takes values between zero and one,
determined by the fraction of firms that have a shareholder-value orientation. For countries without the Loderer
Index, we include a missing-value indicator. We find a significantly positive coefficient on the Loderer et al.
(2010) Index, indicating that announcements in countries with a higher fraction of shareholder oriented firms
are more positively affecting the share price. A ten percentage point higher fraction of shareholder oriented
firms corresponds to a 0.36% higher country-average announcement return. Both findings suggest that the stock
price increases more for better governance countries and countries where firms are more likely to act in the
interest of shareholders. In regressions 4 and 8 we find that firms in board approval countries experience a

14
higher average CAR than firms in shareholder approval countries. The difference in CAR is estimated to be
about 1%, significant at the 1% level. Thus, regulatory differences are associated with the shareholder reaction
to the buyback announcement. The higher CAR for firms in board approval countries suggests that shareholders
have more trust in a buyback decision approved by the board than repurchases that don’t need board approval.
These findings are consistent with the hypothesis that buybacks are good news for shareholders,
possibly for a variety of reasons such as signalling and reduction in agency costs and corporate taxes.. However,
investors outside the U.S. seem to take into account the extent to which managers might have incentives to use
buybacks for other reasons, such as buybacks to provide stocks to executives who exercise stock options (or
other convertible security holders), price manipulation, price support, catering to large shareholders, among
others. Hence corporate governance quality matters when assessing the consequence of a corporate financial
decision such as a share repurchase.
3.3.2 Firm level analysis
In Table V we report results of firm-level regressions. Using firm level analysis allows U.S. to control for firm
level characteristics, such as size, market-to-book, prior stock return, and the percentage of shares sought7. We
can also use firm level proxies for the quality of governance. Regressions 1-4 show results excluding the U.S.
firms, 5-8 include U.S. firms. Given the large number of U.S. buyback firms, the significance of the variables is
usually higher including the U.S. firms.
In regression 1 and 5, we first show that the French legal origin variable is significantly negative even at
the firm level. The first firm-level index is the (log) ISS Corporate Governance Quotient (CGQ). The CGQ
index is available only for a subset of the repurchasing firms in our sample. The second set of firm-level proxies
for governance quality consists of two indicator variables related to cross-listing in the U.S.: the first, Cross
listed, equals 1 if the repurchasing firm is publicly listed in the U.S., while the second, ADR, equals 1 if the
repurchasing firm has American Depository Receipts (ADR) traded in the U.S. The underlying hypothesis is
that listing in the U.S. makes the firm adhere to superior governance standards, for example in the form of
7 Grullon and Michaely (2004) find that cash multiplied with the market-to-book ratio when the ratio is smaller than 1 is positively
related to announcement return. When we included this variable in our regressions we find also a positive coefficient but it is never
statistically significant.

15
increased disclosure and accounting standards (see Miller (1999), Reese and Weisbach (2002), and Stulz
(1999)).8
The results from the firm-level regressions are in line with those of the country-level ones. Better
governance at the firm level is associated with a more positive market reaction to the buyback announcement.
The CGQ index is a number between 0 and 1, corresponding to the firm’s governance quality ranking, i.e. a
CGQ index of 0.50 implies that 50% of all the firms in the country have worse governance than the firm. Thus,
a 10 percentage point increase in the CGQ index is associated with a 0.62% higher announcement return.
Announcements by firms which are cross-listed in the U.S. (ADR) are associated with a 2.17% (0.41%) higher
announcement return. Interestingly, announcements returns for cross-listed firms are significantly higher than
for firms that just have ADRs (p-value: 0.024). This finding is consistent with the notion that the more stringent
requirements on cross-listed firms signal superior quality of corporate governance.
To test whether regulatory differences affect shareholder reactions to the buyback announcement, we
compare the average CAR of firms in countries where board approval is sufficient. In a multivariate setting, we
find in Table V, regressions 4 and 8, a positive and highly significant association between board approval and
CAR. This finding is consistent with the interpretation that markets believe that buybacks create more value in
countries where boards can take the buyback decision. This could be because boards, as representatives of
shareholders, are more capable to judge whether the management announces a buyback for reasons consistent
with shareholder value maximization. Although in shareholder approval countries shareholders have to
authorize periodically buyback authorisations, management is more or less free to exercise this repurchase
option without board oversight during the authorisation period, which could take up to 18 months in many
countries. The economic effect associated with the regulation is important as well. Estimates in regression 4 and
8 suggest that firms in countries with board approval experience, on average, a 1.07%-1.56% higher CAR.
We find a strong negative association between the prior-return and CAR. Firms that experienced a
bigger drop in the share price in the six months prior to the buyback announcement display a higher CAR. This
is consistent with the hypothesis that managers respond to undervaluation by buying back stock, It is also
8 Cross-listed firms in the U.S., in general, have to fully meet the SEC’s accounting and disclosure requirements. We do not separately
account for Rule 144A shares, which impose less stringent requirements on the cross-listing firm.

16
consistent with the agency cost hypothesis, i.e. managers reacting to poor performance by distributing excess
cash to shareholders.
In sum, our analysis of the short-term market reaction to global buyback announcements suggests that
buybacks are mostly perceived to be value increasing. Buyback announcements increase share prices more in
countries with better governance, in countries where more firms state that they maximize shareholder value, in
countries where the board can approve buybacks, and when the stock has underperformed during the previous 6
months.
3.3.3 Country versus firm level analysis
In Table V, panel B we include both country and firm level governance proxies. This allows U.S. to ask the
question whether the announcement returns are more a reaction to country level or firm level governance
quality. Doidge, et al (2007) find in their analysis that country level governance matters more. Our findings are
more mixed. We find that the firm level ISS Corporate Governance Quotient (CGQ) loses its significance while
the cross-listed dummy retains its strong significance. The ADR proxy is significant in three out of four
regression specifications. The country level variables mostly retain their significance. GMI is always
significant while the Loderer et al. (2010) index is only significant in two out of four specifications. We
conclude that in the buyback announcement event both, firm as well as country level governance explains some
of the variation in CAR.
3.3.4 Inferences
Our findings complement the analysis of Ellis, Moeller, Schlingemann, and Stulz (2011) who find that the
quality of corporate governance is positively related to bidder returns around acquisition announcements. They
interpret their findings as being consistent with the hypothesis that better governance has a positive effect on
firm investment quality – or at least the extent to which any gains from investment accrue to the shareholders.
To the extent that a buyback is also an investment decision, our findings are consistent with the conclusions of
Ellis et al. (2011). Note that, as in the case of acquisitions, share buybacks can be driven by non-value
maximizing incentives such as fighting a takeover bid by repurchasing shares from “pessimistic” shareholders,
stabilizing the stock price by buying shares above “fair” value, manipulating earnings per share (Chan,
Ikenberry, and Lee (2007)), or acting in the interest of a majority stockholder at the expense of minority

17
shareholders. The latter argument is particularly important in European firms, where Faccio and Lang (2002)
find a minority of the publicly traded firms to be widely held. We conclude that when corporate governance
quality is high, markets do not expect that managers use buybacks to engage in these non-value maximizing
activities.
4. Long-run abnormal return: methodology and results
In this section we first test whether firms outside the U.S. exhibit similar positive abnormal return patterns after
buyback announcements as documented in Ikkenberry, Lakonishok, and Vermaelen (1995), and Peyer and
Vermaelen (2009). Finding that many countries exhibit a similar long run abnormal return pattern, we then ask
what the reason for such abnormal returns might be.
4.1 Hypotheses
According to the efficient market hypothesis, we should not expect any systematic long run abnormal returns
after a buyback announcement. Hence, any “explanations” of long term excess returns must be based on
behaviorial considerations or missing risk variables. Below we list three main hypotheses which could explain
the long run abnormal returns. Note the hypotheses are not always mutually exclusive but sometimes make
different predictions, helping U.S. to exclude one or the other hypothesis. The first hypothesis is the changing
risk hypothesis which suggests that the benchmark model used does not appropriately adjust for risk changes
after the buyback. We call the second hypothesis the governance hypothesis. It predicts long run returns to the
extent that the market does not fully appreciate the importance of good governance in monitoring agency issues.
The third set of hypotheses relate to market timing hypotheses. It predicts that managers time the market when
announcing a buyback.
Grullon and Michaely (2004) suggest that after buyback announcements firms that repurchase shares
experience an increase in risk in part because of leverage changes. As such, outperformance in the equity
market could be a reflection of the increase in risk which the factor model does not take into account because
standard long-run return methods (such as the calendar time method) hold the factor loadings constant. Thus,
according to the risk hypothesis the loadings are supposed to change after the repurchase. We test this

18
hypothesis by using the RATS method which allows the factor loadings to change each month after the
buyback, following Peyer and Vermaelen (2009).
According to the governance hypothesis, the importance of the quality of governance (agency
problems) might have been systematically underestimated. Gompers, Ishii, and Metrick (2003) find
outperformance of good governance firms. Thus, if buyback firms were, on average, better governance firms,
the outperformance could be because the market has underestimated the importance of good governance, as in
Gompers et al (2003). It is also possible that a buyback signals better quality of governance than the observable
governance metrics. This would again predict an outperformance, however, this time firms with lower,
measured governance quality should outperform. Finally, to the extent that a buyback (e.g., by reducing excess
cash) does lower agency problems we would expect that firms which repurchase shares quickly after the
announcement outperform those that do not in the long run. If the market revises the stock price only when the
firm actually buys back shares, we would expect to observe long run abnormal returns only if the firm actually
exercises the option to repurchase stock. Interestingly, the information hypothesis predicts the opposite. Firms
which quickly outperform should not buy back shares as their shares are no longer undervalued (Ikenberry,
Lakonishok and Vermaelen (2000)).
Firms could conclude that they are undervalued for some reason and try to take advantage of this
mispricing by announcing a share repurchase program. This hypothesis also requires that the signal is not
perfectly understood. The market timing hypotheses have several potential sources.
First, firms might have inside information about their likelihood of being taken over (or the premium
paid). This suggests that long run returns are higher for firms/countries where the takeover likelihood is higher
after buybacks. Billett and Xue (2007) find that open market repurchases are more likely if a firm has a higher
takeover probability. Furthermore, Bargeron, Bonaime, and Thomas, (2012) find that long run abnormal returns
are significantly due to firms which are taken over after the buyback using a U.S. sample. Thus, the takeover
hypothesis predicts firms that are acquired in the future to outperform.
Second, managers might disagree with the analysts and the market about the prospects of the firm. This
hypothesis is based on Peyer and Vermaelen (2009). This information hypothesis suggests that outperformance
can be predicted based on observables at the time of the buyback announcement. These predictable variables are
size, the book-to-market ratio, and the abnormal return six months prior to the buyback announcement.

19
Furthermore, firms that are more undervalued are more likely to have received downgrades by analysts prior to
the repurchase announcement.
Third, regulatory differences might affect how easy it is to time the market. In particular, in countries
were the board of directors can decide on the buyback versus the shareholders, one might expect firms to be
able to time the market more accurately as board members have to be convinced that the shares are
undervalued. However, to the extent that buyback announcements are routine requests to approve the option to
repurchase, the difference in regulation might not matter.
Forth, Grullon and Michaely (2004) conclude that stock prices outperform after buybacks in part
because markets are slow to realize that buyback firms experience a significant drop in systematic risk as they
move from being growth companies to being more mature businesses. Thus, repurchasing firms can buy back
stock cheaply given the discount rate applied in the market is too high. The reduction in risk hypothesis predict
outperformance because firms’ systematic risk is actually going down.
4.1 Methodology
Our sample spans 32 countries. In order to test whether shares of companies that have announced a buyback
outperform similarly as in the U.S. (e.g., Peyer and Vermaelen, 2009), we first have to decide on an appropriate
benchmark. Griffin (2002) compares factor models in the US, Canada, UK, and Japan and concludes that
country-specific factor model are better at explaining the time-series variation in returns and have lower pricing
errors than regional factors. Furthermore, a decomposition of the global factor into domestic and foreign
components shows that adding foreign factors to domestic models leads to less accurate in-sample and out-of-
sample pricing. Fama and French (2012) use ‘regional’ factor models (Asia Ex Japan, Europe, Japan, and North
America) to test whether asset pricing is integrated across these four regions. They conclude that these regions
are not well integrated in terms of asset pricing. Fama and French also remark that the use of ‘regional’ models
is fine as long as within a given region the markets are reasonably integrated. Based on these findings, we use
two different benchmark approaches. First, we use country-level factors and run the abnormal return analysis
using local currency. Second, we run long run tests using the regional factors of Fama-French (2012). The latter
analysis requires the conversion of all stock returns into US$.
4.1.1 Construction of the local Fama-French and momentum factors

20
For each nation in our sample, we construct local size and book-to-market (Fama-French) and momentum
factor-mimicking portfolios. The procedure used to construct the factor-mimicking portfolios closely follows
the one described in Fama and French (1993) and Kenneth French’s website, using Datastream data as the
inputs. Firm size in year t is the firm’s market value of equity as of June of year t. This is given by the
Datastream data item MV, equal to number of shares outstanding times the stock price. Book-to-market is the
inverse of the Datastream data item MTBV (equal to market value of the firm divided by its book value).
For each nation in our sample, each year, all stocks with available data are sorted to determine the size
and book-to-market breakpoints. The size breakpoint at year t is the median (50th percentile) size of June, year t.
The book-to-market breakpoints are the 30th and 70
th percentiles of the book-to-market distribution as of
December, year t – 1. The intersection of the size and book-to-market breakpoints determines six portfolios:
Small Value, Small Neutral, Small Growth, Big Value, Big Neutral, Big Growth. For each portfolio, a monthly
value-weighted return is computed. Next, the six portfolios are used to compute the returns on the size (SMB)
and book-to-market (HML) factor-mimicking portfolios, as:
( )
( ) (1)
and:
( )
( ) (2)
The momentum factor-mimicking portfolio is constructed as follows. For each nation in our sample and
each month, all stocks are sorted by size and by their prior return, defined as the return over the previous 12
calendar months, to determine size and prior return breakpoints. The size breakpoint is the median (50th
percentile). The prior return breakpoints are the 30th and 70
th percentiles of the prior return distribution. The
intersection of the size and prior return breakpoints determines four portfolios: Small Up, Big Up, Small Down,
Big Down. For each portfolio, a monthly value-weighted return is computed. Next, the portfolios are used to
compute the return on the momentum factor-mimicking portfolio (UMD) as:
( )
( ) (3)
The size, book-to-market, and momentum factor-mimicking portfolios thus constructed are used to
estimate the long-run performance of firms announcing a share repurchase in our sample.

21
4.1.2. Estimating long-run abnormal returns
We estimate long-run abnormal returns following the stock repurchase announcement using two complementary
methodologies: Fama (1998) calendar-time portfolios and Ibbotson’s (1975) Returns Across Time and
Securities (RATS).9 The RATS approach allows for changes in the risk by re-estimating the loadings on the
factors each month after the buyback. The drawback is that these changes are at the portfolio level, not at the
firm level.
In the calendar-time portfolio approach, for each nation in our sample a calendar-time portfolio of
repurchasing firms is formed, as follows. Each calendar month, an equally-weighted portfolio is formed,
including all the firms that made a repurchase announcement in the previous 12 months (24, 36, 48 months
depending on the horizon being considered). The composition of the portfolio is thus changed each month. The
average monthly abnormal return of the portfolio is then estimated, as the intercept from one of the following
one, three, and four-factor models:
( ) ( ) ( )
(4a)
( ) ( ) ( )
(4b)
( ) ( ) ( )
(4c)
where denotes the portfolio return in month t, SMB, HML, and UMD are the returns on the size, book-to-
market, and momentum factor-mimicking portfolios described above. Rmt is the stock market return. The
Datastream stock market indices TOTMK-country are used as proxies for Rm.10
Finally, Rft is the monthly risk-
free rate of return. As proxies for the risk-free rate of return, interbank rates are used. In consideration of the
growing integration of financial markets, at least by broad geographic areas, the interbank rates of Australia,
Germany, Japan, and the United Kingdom are used.11
9 An additional issue involved in estimating the long-run abnormal returns following the buyback announcement is that of the quality of
non-U.S. stock return data. A number of studies (e.g. Ince and Porter, 2006, Baker and Wurgler, 2010, Karoliy et al., 2009) have pointed
out that this is, in general, not comparable to the quality of CRSP data. In order to ensure that the stock return data used in our study are
not affected by coding errors, stale prices, etc., we apply a number of filters used by Ince and Porter (2006). These filters are described in
detail in the Appendix. 10 In unreported results, we used as an alternative the MSCI and FTSE country indices, obtaining qualitatively similar results. 11 The Australian interbank rate is used for the following nations: Australia, Indonesia, and New Zealand. The German interbank rate is
used for: Austria, Belgium, Denmark, Finland, France, Germany, Greece, Israel, Italy, Netherlands, Norway, Spain, Sweden, and
Switzerland. The Japanese interbank rate is used for: China, Hong Kong, India, Japan, Malaysia, Philippines, Singapore, South Korea,
Taiwan, and Thailand. The UK interbank rate is used for the United Kingdom. For Canada, Brazil, and Mexico, the U.S. risk-free rate of
return from Kenneth French’s website is used. In unreported results, the U.S. risk-free rate of return is used for every nation, yielding
qualitatively similar results.
22
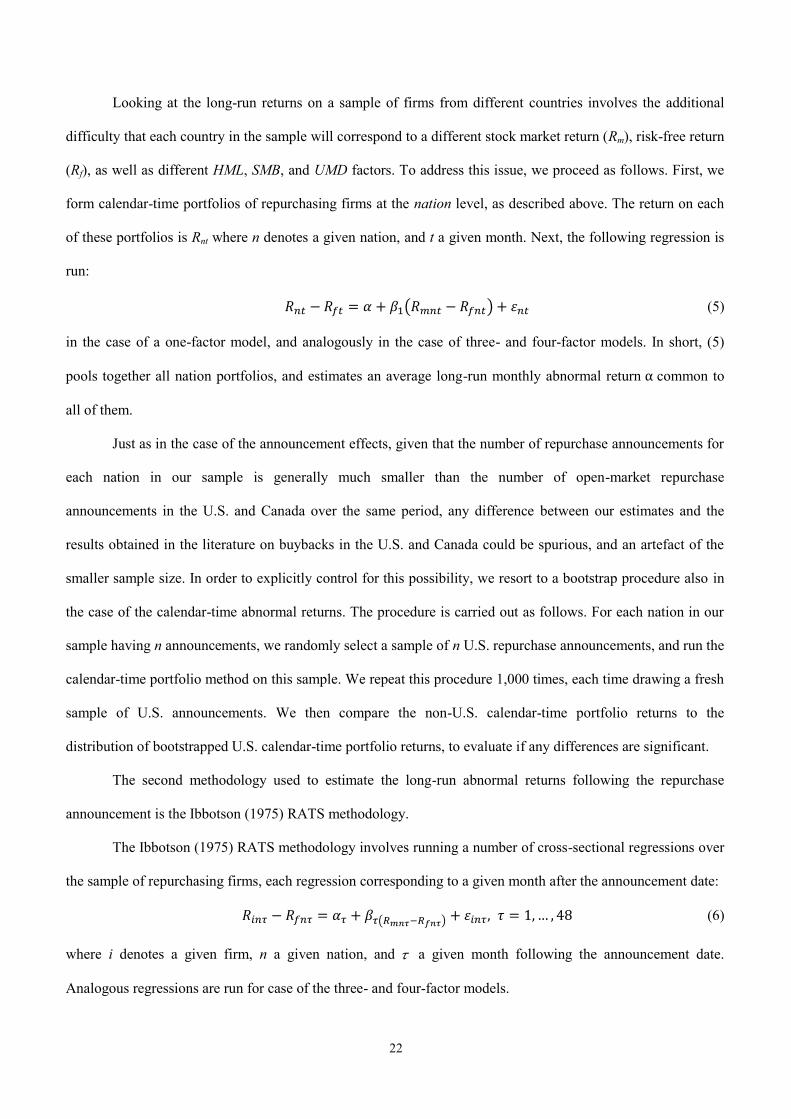
Looking at the long-run returns on a sample of firms from different countries involves the additional
difficulty that each country in the sample will correspond to a different stock market return (Rm), risk-free return
(Rf), as well as different HML, SMB, and UMD factors. To address this issue, we proceed as follows. First, we
form calendar-time portfolios of repurchasing firms at the nation level, as described above. The return on each
of these portfolios is Rnt where n denotes a given nation, and t a given month. Next, the following regression is
run:
( ) (5)
in the case of a one-factor model, and analogously in the case of three- and four-factor models. In short, (5)
pools together all nation portfolios, and estimates an average long-run monthly abnormal return common to
all of them.
Just as in the case of the announcement effects, given that the number of repurchase announcements for
each nation in our sample is generally much smaller than the number of open-market repurchase
announcements in the U.S. and Canada over the same period, any difference between our estimates and the
results obtained in the literature on buybacks in the U.S. and Canada could be spurious, and an artefact of the
smaller sample size. In order to explicitly control for this possibility, we resort to a bootstrap procedure also in
the case of the calendar-time abnormal returns. The procedure is carried out as follows. For each nation in our
sample having n announcements, we randomly select a sample of n U.S. repurchase announcements, and run the
calendar-time portfolio method on this sample. We repeat this procedure 1,000 times, each time drawing a fresh
sample of U.S. announcements. We then compare the non-U.S. calendar-time portfolio returns to the
distribution of bootstrapped U.S. calendar-time portfolio returns, to evaluate if any differences are significant.
The second methodology used to estimate the long-run abnormal returns following the repurchase
announcement is the Ibbotson (1975) RATS methodology.
The Ibbotson (1975) RATS methodology involves running a number of cross-sectional regressions over
the sample of repurchasing firms, each regression corresponding to a given month after the announcement date:
( ) (6)
where i denotes a given firm, n a given nation, and a given month following the announcement date.
Analogous regressions are run for case of the three- and four-factor models.

23
The advantage of this methodology is that changes in the riskiness of the equity from before to after the
repurchase, for example due to changes in leverage, are better accounted for. The reason is that month by
month, after the repurchase announcement, the factor loadings are allowed to change (although only in the
cross-sectional average, not for each repurchasing firm individually).
An additional advantage of the Ibbotson (1975) RATS methodology is that it allows to explicitly control
for correlation patterns in the data, by adjusting the standard errors. In short, the equations in (6) are jointly
estimated as a system of Seemingly Unrelated Regressions (SUR), with standard errors clustered around nation
(Petersen, 2009). We can then test the significance of the cumulative abnormal returns as a simple test on a
linear combination of the coefficients of the SUR model.12
4.2 Results
4.2.1 Long-run returns after buyback announcements
Table VI shows long-run abnormal returns following the repurchase announcements using the calendar-time
methodology. Panel A (B, C) shows the results with a one-factor (three-, four-factor) model. Comparing the
U.S. and non-U.S. sample, we find significant positive alphas over all horizons (12-48 months) and using either
one of the three factor models. For example, using the Fama-French three-factor model as a benchmark, we find
that stock returns of non-U.S. firms in the 12 (36) months following the buyback announcement generate an
average monthly alpha of 0.58% (0.48%). These alphas are statistically significantly different from zero at the
1% level. The corresponding alphas for the U.S. firm sample are 0.36% and 0.34%. Statistically, the non-U.S.
monthly alphas are generally larger than the corresponding U.S. ones under the three- and four-factor models.
There are several countries where firms display statistically significantly higher monthly alphas than in
the U.S.. Columns 3, 6, 9, and 12 in Table 6 show the percentile (between 0 and 1) of the country’s average
alpha relative to the distribution of the alphas among U.S. firms. For example, Japan with an average monthly
alpha of 1.08% (three-factor model; 12 months) falls in the 99.9th percentile. Thus, less than 0.1% of U.S.
bootstrap samples display a monthly alpha of 1.08% or more. We find 14 countries where the alpha, measured
over 12 months using a three-factor model, is significantly higher (at the 5% level or better) than the U.S.
12 Peyer and Vermaelen (2009) test the significance of the cumulative abnormal returns computed with the RATS method computing the
standard errors as the square root of the sum of the squares of the standard errors from the individual cross-sectional regressions. The
methodology employed here collapses to the approach of Peyer and Vermaelen (2009), if regular OLS standard errors are used.

24
average. There are only two countries (Greece and Taiwan), both with negative alphas, that have significantly
lower alphas over this time period. Importantly, none of the country average alphas are significantly negative
beyond the 12-months horizon while point estimates of about 3 countries indicate negative alphas even at the 36
to 48 months horizon. Interestingly, some countries do not show significant long run abnormal returns. The
question thus arises whether in such markets the initial reaction to the buyback announcement is more efficient,
i.e., larger. To test this, we compute the correlation between the country average short-run announcement return
(from Table III) and the country average long run abnormal returns over 36 and 48 months. Independent of the
way we compute long run returns, we always find negative correlation coefficients of between 3% and 4%. This
suggests that higher initial announcement reactions are indeed followed by lower long run abnormal returns.
Thus, while on average we find positive long run abnormal returns after buyback announcements even outside
the US, the negative correlation between short-run and long-run returns suggests that some markets might react
more efficiently to the buyback announcement leaving less abnormal returns in the long-run. However, to the
extent that the average long-run return is significantly positive, the question remains which hypotheses can
explain this anomaly.
4.2.2 Test of the risk hypothesis
To test the risk hypothesis which predicts that risk is increasing after the buyback and as such the abnormal
returns are simply manifestations of increased risk, we compute abnormal returns using the IRATS method.
This method allows the loading on each factor to change month-by-month after the buyback. Table VII, panel A
shows the findings using local currency and local factors. We find cumulative abnormal returns after the
buyback of between 17.5% and 36% over 48 months, depending on the factor model. Figure 4 shows the
cumulative abnormal returns for the 6 months prior to the 48 months after the buyback announcement using
IRATS and the four-factor model in local currency and local factors. Using U.S. dollar returns and regional
factors, the IRATS method produces qualitatively similar outperformance over all horizons, as shown in Table
VII, panel B. Quantitatively, the outperformance is even stronger at between 26% (three-factor model) and 39%
(one-factor model) over the 48 months following the buyback announcement.
We conclude from this first part of the analysis that, on average, buyback stocks exhibit similar
abnormal return patterns outside the U.S. as in the U.S. Furthermore, since the different methods we employ to

25
compute abnormal returns all show positive long run abnormal returns, we infer that changes in risk after the
buyback is unlikely the main cause of the observed abnormal returns.
4.2.3 Test of the governance hypothesis
Gompers et al (2003) find positive long run abnormal returns for good governance firms relative to bad
governance firms. If our buyback firms are, on average, better governance firms, the documented
outperformance could be due to the same underestimation of the importance of governance. We use the CQG
scores of all buyback firms and compare them to the CQG scores of the non-buyback firms in the same country.
The average CGQ is 46.21 for buyback firms, and 49.55 for non-buyback firms. The difference in means is
significant indicating that the buyback firms, overall, have worse governance if anything. Thus, it is unlikely
that the buyback sample is a self-selected group of good governance firms.
To test the hypothesis that buyback firms signal that they are better governance firms than their ranking
suggests, we run a long run return analysis for two portfolios splitting the sample at the median CQG level. The
long run returns are shown in Table VIII. Consistent with the hypothesis that firms might signal better than
measured or observable governance, the low CQG subsample of buyback firms outperforms the high CQG
subsample. Using local factors and local currency as well as regional factors and US$ benchmark models, we
find that low CQG buyback firms outperform high CQG by between 3.7% and 5.1% over 48 months after the
buyback announcement. Thus, we conclude that there is some evidence that signalling better governance than
measured might contribute to the long run abnormal return, however, the economic magnitude of the difference
is rather small.
Our third test of the governance hypothesis is based on the assumption that share prices go up because
shareholders observe that the firm is actually reducing the agency costs of free cash flow. This predicts that
firms which actually repurchase shares should outperform those that do not. In Table IX we find weak evidence
in favour of this hypothesis. In particular, using local factors and local currency benchmark models, we find that
the high completion rate subsample outperforms the low completion subsample in the first twelve months after
the buyback. The difference in abnormal returns is around 3% over 12 months. However, using regional factors
and US$ benchmark models, we find no significant differences. Furthermore, any of the 24-48 months horizon
abnormal return differences are insignificant across all specifications.

26
In sum, we conclude that there is some evidence that governance affects long run returns after buybacks
through signalling better than measured governance quality and reducing agency problems. However, the
magnitude of the governance effect over 36-48 months is relatively small, explaining only up to 5% differences
in abnormal returns leaving room for the market timing hypotheses.
4.2.4 Test of the market timing hypothesis
An alternative explanation for the long run abnormal returns is that buyback firms are able to time the market.
The takeover hypothesis predicts that managers know that they are a likely target and announce a buyback. To
the extent that this defence is not successful, the future takeover premium offered would lead to
outperformance. Note, that also for this hypothesis, the market is assumed to be somewhat inefficient. To test
the information hypothesis, we perform two analyses. The first is based on Peyer and Vermaelen’s (2009)
finding that firms with a high U-index, i.e., those more likely to be undervalued at the time of the buyback
announcement (based on small size, low book-to-market, and low prior six-months stock return) outperformed
the market most. Thus, buybacks are more likely a reaction to disagreements between the market and insiders
about the share price at the time of the buyback for firms where the stock price was beaten down significantly.
The second test is based on the assumption that regulation makes it more difficult to time the market in some
countries. Potentially, firms cannot react in a timely manner to stock prices being beaten up if they need
shareholder approval for a buyback. Thus, long-run returns could be expected to be larger in countries where
the board can decide on a buyback program. On the other hand, to the extent that prices only slowly correct,
there might not be a significant difference due to regulation.
To test the reduction in risk hypothesis, we first examine whether systematic risk levels change from
before to after the buyback using one, three, and four factor models. Then we split the sample into two groups
based on whether the firm decreases or increases measured risk and ask whether firms where realized risk goes
down outperform more. If so, the market might have underreacted to the change in risk at the time of the
announcement. Grullon and Michaely (2004) find evidence for this hypothesis in a U.S. setting.
Table X shows long run abnormal returns for firms separately depending on whether the buyback firm
has received a takeover offer in the 12 (24, 36) months following the buyback announcement. Takeover targets
are identified using SDC. Of our buyback sample firms, we classify 8.6% as targets. (See Appendix E for

27
details of the identification). The differences in long-run returns between takeover firms and non-takeover firms
are mostly insignificant using local factors and local currency as well as regional factors and US$ benchmark
models. The exception is when we use a one-factor model. In that case, we find that the takeover subsample
underperforms by up to 13% over 48 months after the buyback announcement. Surprisingly, this evidence
suggests that buyback firms which are successful at defending themselves against a takeover bid (in part by
using a buyback) appreciate more in the 48 months after – or at least do not underperform. The data is thus
inconsistent with the takeover hypothesis in that managers are less likely to time the repurchase to happen
before a takeover bid in order to increase value for the remaining shareholders. A buyback as a takeover
defence seems more consistent with the data but since both subsamples perform about equally well in the 48
months after the buyback announcement, we conclude that it is unlikely that takeovers are the major reason for
long run abnormal returns after buyback announcements.
Next, we test the predictions of the information hypothesis. Following Peyer and Vermaelen (2009) we
create an undervaluation index based on publicly available information. Peyer and Vermaelen (2009) show that
firms classified as highly undervalued outperform more over the 48 months after the buyback announcement.
Table VII, panel A (local factors and local currency) and panel B (regional factors and US$) show IRATS
abnormal returns for subsamples where the U-index is in the lowest tercile versus the highest tercile (more
undervalued firms).
We find that high U-index firms, which were beaten up more in the six months prior to the buyback
announcement, outperform more in the future 48 months. Economically the differences between the highest and
lowest tercile U-index abnormal returns over 48 months are 7%, significant at the 10% level (four-factor model,
panel A) and 21%, significant at the 1% level (one factor model, panel A). Using regional factors and US$, the
abnormal returns are between 13% and 17%, significant at the 1% level. Thus, the international evidence
supports the conclusions based on U.S. data that managers react to their stock prices being beaten up and
announce buybacks at a time when share prices are too low. Economically, the differences in the
outperformance after a buyback are important as well.
In order to further test whether firms react with announcing a buyback in response to being beaten up by
analysts, we compute the average earnings per share forecast for the fiscal year end in each of the six months
prior to the buyback announcement. Figure 6 shows how EPS forecasts change differently between the highest

28
and lowest tercile U-index firms. The EPS forecast drops significantly more for high U-index firms, in line with
findings for the U.S. in Peyer and Vermaelen (2009). This finding is consistent with the interpretation that
managers react to EPS revisions by analysts which depress the share price by announcing a buyback. Assuming
that analysts play an important role in producing information which is incorporated into the share price, we also
test whether firms with fewer analysts following exhibit larger long run abnormal returns. Table 7, panels A and
B show that firms with fewer analyst following significantly outperform those with more analysts over 48
months by between 7.7%% and 10% (panel A) and 10% to 13% (panel B). Note, however, that even high
analyst following firms significantly outperform in the long run. Thus, asymmetric information and lower
information production might explain some of the long run abnormal returns but by far not all of it as even
better covered firms outperform in the long run.
The information hypotheses did find some support in the data. Thus, the question is whether market
timing is easier to do in countries that allow the board to approve a buyback. Having the buyback approved by
the shareholders seems to be less timely if managers want to take advantage of repurchasing shares at a low
price.
In Table VII we show sample splits by whether the board or shareholder approval is necessary for a
buyback initiation. Using the one-, three-, and four-factor models, and the local currency, local factors (panel A)
versus regional factors and US$ (panel B) we find significantly positive abnormal returns for firms under both
types of regulations. The positive abnormal returns reject the hypothesis that managers primarily use buybacks
to manipulate the share price in the short run at the expense of the long run health of the company. However,
over 48 months we find that firms in board approval countries outperform more than firms in shareholder
approval countries. The differences are around 5%, although insignificant, over 48 months using local factors
and local currency. Using regional factors and US$, the differences are between 20% and 24%, significant at the
1% level. Panel A and B exclude the U.S. sample. However, to test whether board approval affects the long-run
returns, we also show the sample splits including the U.S. buyback firms in panels C and D. Long run abnormal
return differences between board and shareholder approval countries are between 5% (panel C) and 13% (panel
D). While both regulatory environments seem to allow managers to time the market by buying back shares
when they are undervalued, board approval countries potentially benefit from the fact that timing decisions are

29
better when management has to justify the decision to the board. So, indirectly, this finding supports the
importance of corporate governance in the successful execution of buyback programs.
We conclude that there is some indication that is consistent with the importance of regulation. Board
approval seems to allow for better market timing. However, regulation per se is not a significant deterrent to
firms that feel they are undervalued given that corrections take a long time.
To test the reduction in risk hypothesis we follow Grullon and Michaely (2004) closely in estimating
the change in the risk. For each buyback firm the following one-factor model is estimated:
( ) ( ) ( )( ) (7)
where is an indicator variable equal to 1 if calendar month precedes the buyback announcement month (i.e.
months -6 to -1 relative to the announcement month), 0 otherwise (i.e. months 0 to +48 relative to the
announcement month), and and are the market return and the risk-free rate of return. The coefficient
estimates for each buyback firm are then stored, and Table 8 describes their distribution. Our procedure differs
from Grullon and Michaely (2004) in that we only use the prior six months, rather than the prior three years for
data availability reasons. This is somewhat problematic since we have only 6 observations pre-buyback in order
to estimate two coefficients. While we also tabulate results based on three- and four-factor models for
completeness, these estimates are extremely noisy. For the one factor model we find an average (median)
market beta of 0.67 (0.57) before the buyback and 0.78 (0.65) after the buyback. If anything, it seems that firms
outside the U.S. experience a slight increase in risk as measured by the market beta around the buyback
announcement. In untabulated results, we also find that the beta after the buyback remains fairly stable over the
48 months after the buyback. While the means for the three- and four-factor models are strongly influenced by
outliers, the medians suggest a similar inference. The data suggest that risk in buyback firms does not go down
systematically for firms outside the US.13
Thus, the average long-run abnormal returns cannot be attributed to
markets underreacting to changes in risk after the buyback announcement. However, cross-sectional variation in
the long-run returns could still be associated with changes in risk. Table 9 reports long-run abnormal returns for
subsamples of buyback firms based on whether the measured market beta increased or decreased from the six
months before to the 48 months after the buyback. Over 36 and 48 months after the buyback announcement, we
13 It is possible that these buyback firms are significantly different from those announcing buybacks in the US. However, a further
analysis is outside the scope of our current paper.

30
find no significant differences in long run abnormal returns. In the 12 to 24 months, if anything, firms where
risk increases show a slightly higher outperformance, although the economic and statistical significance are
very weak.
Together these findings are consistent with the hypothesis that investors outside the U.S. also
underreact to buyback announcements. Similar to the finding in Peyer and Vermaelen (2009) managers seem to
use the prior return as a reference point to determine whether their stock price is undervalued. If so, managers
announce buybacks also outside the U.S. However, the ability to time the market successfully is, to some extent,
affected by regulation, and does seem to be more driven by disagreement about the value of the firm given
recent changes in earnings as opposed to changes in the risk and the associated changes in the discount rate.
5. Conclusions
To some extent the results on a global sample of buyback announcements from 31 foreign countries are similar
to the U.S. findings: on average share buybacks generate significant positive announcement returns as well as
long term excess returns. Long-term excess returns are an anomaly in an efficient market, so the fact that this
anomaly is a global anomaly makes it more likely that the U.S. findings are not a result of sample bias. On the
other hand, on average, short-term and long-term returns are smaller. Our results show that this may be the
result of the lower quality of corporate governance of non-U.S. firms. The Anglo-Saxon premise that the goal of
a firm is to maximize long-term shareholder value is not universally accepted, which means that buybacks are
often used for non-value maximizing reasons such as fighting takeovers and/or eliminating shareholders which
do not support the management. At the same time, the idea that a company should time the market by taking
advantage of short-term selling shareholders to the benefit of long-term shareholders may also be less consistent
with the corporate governance codes in many countries. One of the most interesting findings is the fact that
shareholders are better off when the board has to approve the buyback, confirming the importance of
governance in corporate decision making. The insistence of e.g. European regulators to have the buyback
approved by shareholders may have well unintended consequences as it reduces board oversight and gives
managers a free hand in pursuing buybacks for the wrong reasons.

31
References
Allen, F., E. Carletti, and R. Marquez, 2007, Stakeholder Capitalism, Corporate Governance and Firm Value,
Working Paper, University of Pennsylvania, Wharton School.
Aggarwal, R., I. Erel, R. Stulz, and R. Williamson, 2009, Differences in Governance Practices Between U.S.
and Foreign Firms: Measurement, Causes, and Consequences, Review of Financial Studies 22, 3131-3169.
Baker, M., and J. Wurgler, 2010, Dividends as Reference Points: A Behavioral Signaling Model, Working
Paper, Harvard Business School.
Bargeron, Leonce, Alice Bonaime, and Shawn Thomas, 2012, Returns Over the Life-Cycles of Open Market
Repurchase Programs, Working Paper.
Bertrand, M., P. Mehta, and S. Mullainathan, 2002, Ferreting Out Tunneling: An Application to Indian Business
Groups, Quarterly Journal of Economics 117, 121-148.
Billett, Matthew, and Hui, Xue, 2007, The Takeover Deterrent Effect of Open Market Share Repurchases, The Journal
of Finance 62, 1827-1850.
Carhart, Mark, M., 1997, On Persistence in Mutual Fund Performance, Journal of Finance 52, 57-82.
Chan, K., D.L. Ikenberry, and I. Lee, 2007, Do Managers Time the Market? Evidence from Open-Market Share
Repurchases, Journal of Banking and Finance 31, 2673-2694.
Cheung, Y.-L., P.R. Rau, and A. Stouraitis, 2006, Tunneling, Propping, and Expropriation: Evidence from
Connected Party Transactions in Hong Kong, Journal of Financial Economics 82, 343-386.
Cook, Douglas O., Laurie Krigman and J. Chris Leach, 2003, “An Analysis of SEC Guidelines for Executing
Open Market Repurchases”, The Journal of Business, 76, No. 2, 289-315.
Djankov, S., C. McLiesh, and A. Shleifer, 2007, Private Credit in 129 Countries, Working Paper 11078, NBER.
Craig Doidge, A. Karolyi, and René Stulz, 2007, “Why Do Countries Matter So Much for Corporate
Governance?” (with), Journal of Financial Economics 86(1), 1-39.
Ellis, J., S.B. Moeller, F.P. Schlingemann, and R.M. Stulz, 2011, Globalization, Governance, and the Returns to
Cross-Border Acquisitions, Working Paper, Ohio State University, Fisher College of Business.
Faccio, M., and L.H.P. Lang, 2002, The Ultimate Ownership of Western European Corporations, Journal of
Financial Economics 65, 365-395.
Fama, E.F., 1998, Market Efficiency, Long-Term Returns, and Behavioral Finance, Journal of Financial
Economics 49, 283-306.
Fama, E.F., and K.R. French, 1993, Common Risk Factors in the Cross-Section of Stocks and Bonds, Journal of
Financial Economics 33, 3-56.
Fama, E.F., and K.R. French, 2012, Size, Value, and Momentum in International Stock Returns,
Forthcoming Journal of Financial Economics.
Gompers, P., J. Ishii, and A. Metrick, 2003, Corporate Governance and Equity Prices, Quarterly Journal of
Economics 118, 107-155.
Grullon, Gustavo, and Roni, Michaely, 2204, The information content of share repurchase programs, The
Journal of Finance 59, 651-680.
Ibbotson, Roger, 1975, “Price Performance of Common Stock New Issues,” Journal of Financial Economics, 235-72.
Ikenberry, D., J. Lakonishok, and T. Vermaelen, 1995, Market Underreaction to Open Market Share
Repurchases, Journal of Financial Economics 39, 181-208.
Ikenberry, D., J. Lakonishok, and T. Vermaelen, 2000, Stock Repurchases in Canada: Performance and
Strategic Trading, Journal of Finance 55, 2373-2397.
Ince, O., and Porter, R.B., 2006, Individual Equity Return Data from Thomson DataStream: Handle with Care,
Journal of Financial Research 29, 463-479.
Jensen, M.C., 1986, Agency Costs of Free Cash Flow, Corporate Finance, and Takeovers, American Economic
Review 76, 323-329.
Jensen, M.C., and W.H. Meckling, 1976, Theory of the Firm: Managerial Behavior, Agency Costs and
Ownership Structure, Journal of Financial Economics 3, 305-360.
32
Johnson, S., R. La Porta, F. Lopez-de-Silanes, and A. Shleifer, 2000, Tunneling, American Economic Review
90, 22-27.
Karolyi, G.A., K.-H. Lee, and M.A. van Dijk, 2009, Commonality in Returns, Liquidity, and Turnover Around
the World, Working Paper, Fisher College of Business, Ohio State University.
Kim, J., R. Schremper, and N. Varaiya, 2005, Open Market Repurchase Regulations: A Cross-country
examination, Corporate Finance Review, 9, 29-38.
La Porta, R., F. Lopez-de-Silanes, and A. Shleifer, 1998, Law and Finance, Journal of Political Economy 106,
1113-1155.
La Porta, R., F. Lopez-de-Silanes, A. Shleifer, and R. Vishny , 2000, Investor Protection and Corporate Governance,
Journal of Financial Economics,
La Porta, R., F. Lopez-de-Silanes, A. Shleifer, and R. Vishny, 2002, Investor Protection and Corporate
Valuation, Journal of Finance 47, 1147-1170.
Loderer, C., L. Roth, U. Waelchli, and P. Joerg, 2010, Shareholder Value: Principles, Declarations, and Actions, Financial Management 39/1, Spring 2010, 5-32.
Miller, D., 1999, The Market Reaction to International Cross-Listing: Evidence from Depositary Receipts,
Journal of Financial Economics 51, 103-123.
Peyer, U., and T. Vermaelen, 2005, The Many Facets of Privately Negotiated Stock Repurchases, Journal of
Financial Economics 75, 361-395.
Peyer, U., and T. Vermaelen, 2009, The Nature and Persistence of Buyback Anomalies, Review of Financial
Studies 22, 1693-1745.
Petersen, M. A., 2009, Estimating Standard Errors in Finance Panel Data Sets: Comparing Approaches, Review
of Financial Studies 22, 435-480.
Reese, W., and Weisbach, M., 2002, Protection of Minority Shareholder Interests, Cross-Listing in the United
States, and Subsequent Equity Offerings, Journal of Financial Economics 66, 65-104.
Scholes, M., and J. Williams, 1977, Estimating Betas from Nonsynchronous Data, Journal of Financial
Economics 5, 309-327.
Siems, M.M., 2007, Legal Origins: Reconciling Law & Finance and Comparative Law, McGill Law Journal 52,
55-81.
Stulz, R.M., 1999, Globalization, Corporate Finance, and the Cost of Capital, Journal of Applied Corporate
Finance 12, 8-25.
Vermaelen, T., 1981, Common Stock Repurchases and Market Signalling: An Empirical Study, Journal of
Financial Economics 9, 139-183.

33
Appendix
A. Variable definitions
GovernanceMetrics International® Index
The overall country rating provided by GovernanceMetrics International® (GMI). The GMI rating criteria are
based on securities regulations, stock exchange listing requirements, and various corporate governance codes
and principles, such as the ones promulgated by the OECD, the Commonwealth Association for Corporate
Governance, the International Corporate Governance Network and the Business Roundtable. GMI combines
firm-level governance information, and determines an average score at the country level. The ratings are
available at the URL: http://www.gmiratings.com, and were retrieved as of September 2009. A GMI index is
not available for the Philippines, thus for buyback announcements from this country the value of the GMI index
for “Emerging Markets” is used as a replacement.
ISS Corporate Governance Quotient
The Corporate Governance Quotient (CGQ) is an index of the quality of corporate governance at the firm level,
released by the Institutional Shareholder Service (ISS) corporation. To generate a CGQ for each company, ISS
uses public disclosure documents to gather data on 61 different issues in the following eight categories: 1) board
of directors, 2) audit, 3) charter and bylaw provisions, 4) anti-takeover provisions, 5) executive and director
compensation, 6) progressive practices, 7) ownership, and 8) director education. Based on this information and
a scoring system developed by an external advisory panel and ISS, a CGQ is calculated for each company. Each
company’s CGQ is then compared to the CGQ of companies in the same country, obtaining a relative ranking.
The data on the ISS CGQ cover the period up to and including October 2007, for a subset of the repurchasing
firms examined in this paper. ISS starts coverage of different firms at different points in time, and in many cases
later than the repurchase announcement in our sample. To apply the same criterion to all announcements, the
value of the CGQ index as of the nearest date to the announcement date is assigned, and matched to the
repurchase announcement data based on the firm’s stock’s SEDOL code.
Loderer et al. (2010) Index
An index of the extent to which the firms of a given country want to maximize shareholder value. It is based on
the survey results of Loderer et al. (2010), and is equal to the fraction of firms in a given country that mention
“shareholder value” in their mission statement (Table III, column (1) of Loderer et al.’s paper).
ADR, Cross listed
ADR is an indicator variable equal to 1 if the firm has an ADR traded in U.S. stock markets. ADRs are
identified by the CRSP share codes “30” and “31”. Cross listed is an indicator variable equal to 1 if the firm has
stocks traded in U.S. stock markets, that are not ADR, i.e. with CRSP share code different from “30” and “31”.
In both cases, the CRSP data corresponding to the non-US repurchasing firms are identified by matching the
firm’s 6-digit CUSIP reported by the Security Data Corporation (SDC) to the CRSP historical CUSIP
(NCUSIP) and the repurchase announcement date.
French civil law, German civil law, Scandinavian civil law, English common law
Indicator variables denoting the legal origin of the repurchasing firm’s country. The legal origin classification is
the one adopted by La Porta et al. (1998), Djankov et al. (2007), and Siems (2007).
Board approval (Y/N)
Indicator variable equal to 1 if board approval is sufficient for the firm to announce a share buyback program, 0
if the shareholders’ approval is also required. The countries for which board approval is sufficient are:
Australia, Canada, India, Israel, New Zealand, Switzerland, Taiwan, and Thailand.
Cumulative raw return over prior 6 months
The cumulative raw stock return over the six months preceding the repurchase announcement.
Size

34
Firm size, equal to the natural logarithm of the firm’s total assets (Worldscope data item WC02999). Total
assets are expressed, for every firm, in U.S. dollars.
Market-to-Book
Market-to-Book ratio. It is given by Datastream’s MTBV variable. For robustness, this variable is winsorized at
the 1st and 99
th percentiles.
Percentage sought
Percentage of the outstanding shares that the firm intends to buy back. This variable is retrieved from the SDC
Mergers and Acquisitions and Repurchases data sets.
Completion rate
Fraction of the planned repurchase activity that actually takes place. For non-US firms, it is computed as
follows. For each repurchasing firm, the funds used to decrease outstanding shares (Worldscope data item
WC04751) is retrieved, as of the end of the year in which the announcement takes place, as well as four
subsequent years. For U.S. firms, this variable is obtained as the Compustat data item PRSTKC. The ratio
between this variable divided by the year-end stock price represents the estimated number of shares bought back
during a given year. Whenever this quantity is not available, it is approximated by the change in the number of
outstanding shares. The ratio of this number divided by the outstanding shares prior to the buyback
announcement is the percentage of shares actually bought back. The completion rate, at a given year, is equal to
the ratio of shares actually bought back up to that year, divided by the Percentage sought. If the completion rate
is above 100% at a given year, it is set equal to 100% for all subsequent years.
U-Index
“Undervaluation” index, in the spirit of Peyer and Vermaelen (2009). It is constructed as follows. All buyback
firms in the sample are assigned a score based on their cumulative raw return over the six-month period prior to
the buyback announcement, size, and book-to-market ratio relative to the distribution of prior returns, size, and
book-to-market ratios in their local market (when using local market returns and local factors) or their reference
Fama-French geographical area (Europe, Japan, Asia-Pacific Ex Japan, and North America, when using U.S.
dollar returns and regional factors). A given firm will receive a prior return “score” of 1 if its return prior to the
buyback announcement is above the 70th percentile, 2 if it is between the 30
th and the 70
th percentile, and 3 if it
is below the 30th percentile. Size and book-to-market scores are similarly assigned. The U-index is the sum of
the prior return, size, and book-to-market scores, and ranges from 3 (least likely undervalued) to 9 (most likely
undervalued).
B. Cleaning the stock return data from Datastream
A number of studies have pointed out that the quality of international stock return data from Datastream is
lower than that of the CRSP data (Ince and Porter, 2006, Karolyi et al., 2009, Baker and Wurgler, 2010). This
problem is especially serious in the case of the long-run return following the repurchase announcement, as well
as in the construction of the factor-mimicking portfolio returns. In order to clean up the monthly stock return
data used in our sample, we implement three filters, following Ince and Porter (2006; please refer to this paper
for a more detailed descriptions of the filters). First, in order to avoid using stale prices due to delisting, for
every stock we eliminate all zero returns starting from the most recent observation, until the last non-zero
return. Second, we control for ‘typos’ in the input of the data. We do so by setting any return above 300% that
is reversed within one month as missing. Third, as a last step for every month in the sample and every nation we
censor stock returns below the 1st and above the 99
th percentiles.

35
C. Sample selection details
The sources of open-market repurchase announcement data used in this paper are the Security Data
Corporation’s (SDC) Mergers and Acquisitions and Repurchases data bases. As explained in the text, in order to
perform the analysis the repurchase announcement data from the SDC data bases are merged with a number of
other sources: Datastream stock return data, Worldscope, GovernanceMetrics international, and the ISS
Corporate Governance Quotient data. All the results reported implicitly require that complete observations of all
the relevant variables are available. This implies that only a subset of the entire open-market repurchase
announcements from SDC are used in the analysis. The table below illustrates the coverage of the original SDC
data.
Nation SDC
Announcements
Announcements
used Nation
SDC
Announcements
Announcements
used
Japan 2730 2644 Austria 59 48
Canada 2304 1949 Thailand 48 48
Australia 545 484 Finland 61 41
France 402 346 Mexico 40 37
Malaysia 256 248 Sweden 40 36
Hong Kong 224 197 New Zealand 49 33
Germany 207 193 Denmark 41 33
South Korea 158 142 Spain 40 32
United Kingdom 183 134 Philippines 40 31
Brazil 148 107 Belgium 36 27
Switzerland 118 103 Norway 32 27
Taiwan 120 101 Greece 39 23
India 133 81 Israel 62 21
Italy 87 78 Indonesia 20 20
China 72 59 Singapore 25 19
Netherlands 67 52
D. Estimating buyback completion rates
While in some jurisdictions firms are required to disclose their actual share buyback activity to the financial
market authority, these disclosure requirements are heterogeneous and in any case do not apply to all the
countries in our sample. Therefore, we estimate actual buyback activity, following the indications of the
literature. Stephens and Weisbach (1998) consider three different methods to estimate the actual quantity of
shares bought back by the firm: (i) decreases in shares outstanding, (ii) dollars spent reacquiring securities, (iii)
increases in the dollar value of the firm’s treasury stock.
Given the limited availability of data on Worldscope, we focus on the first method. For each buyback firm
in our sample and each month subsequent to the announcement date, we obtain the number of
shares outstanding as the Datastream data item NOSH. We then consider monthly decreases in shares
outstanding, i.e. , as the actual shares bought back. As Stephens and Weisbach (1998), we
do not offset monthly decreases with monthly increases, i.e. if the number of shares has increases on a given
month, we assume the actual buyback activity to be 0. For U.S. buyback announcements, we replicate this
procedure using monthly changes in the CRSP number of shares outstanding (CRSP data item SHROUT). To
the extent that the firm both repurchases and distributes shares within a given month, this method provides a
lower bound for the actual buyback activity. We scale the cumulative decrease in shares outstanding by the
number of shares outstanding one month prior to the buyback announcement, obtaining the percentage of shares
bought back. The completion rate in a given month is then the ratio between this percentage and the percentage
of shares sought for repurchase. As Stephens and Weisbach (1998), whenever the completion rate exceeds
100%, we set it at 100% (this could happen, for instance, if there are overlaps with subsequent buyback
announcements).

36
Table 2 (Panel B) presents summary statistics about completion rates for the sample countries. On average,
the completion rate for buyback programs 1 year after the announcement date is 59%, increasing to 71%, 79%,
and 84%, 2, 3, and 4 years after the buyback announcement. In comparison, using the same method Stephens
and Weisbach (1998) find an average completion rate for U.S. buybacks of about 74% at 3 years after the
announcement date. Combining this estimate with the alternative methods available to them (but not to us),
Stephens and Weisback (1998) are able to “bound expected actual repurchases during the three years following
the announcement of the program at between 74 percent and 82 percent,” reasonably close to the estimates for
our international sample. Similarly to Stephens and Weisbach (1998), we also find a bimodal distribution for
actual buyback activity: while more than half of the sample firms repurchase at least complete the buyback
program within one year of the announcement date, about 10% do not appear to repurchase any shares within
four years (unreported for brevity).14
E. Identifying takeover targets among buyback firms
We retrieve all takeover announcements for firms from our sample countries (excluding the United States) over
the 1997-2009 period from the Security Data Corporation (SDC) Mergers and Acquisitions database. We then
match the identifying information for the target firms to the buyback firms in our sample, and we assign a given
buyback firm to the “takeover target” group if the buyback firm was the target of an acquisition over the period
from one month prior to the buyback announcement until three years (36 months) after the buyback
announcement. We supplement this information with delisting information from Datastream, obtained by
screening the “extended name” (ENAM) data item for all our sample firms, and consider as takeover targets
also the firms reported as delisted within the three-year window (the results are qualitatively similar if this
additional information is not included). Based on this approach, 8.6% of our sample firms are classified as
“takeover targets”.
14 In comparison, Stephens and Weisbach (1998) find that: “More than one-half of the firms complete their announced programs and
nearly one-third repurchase twice as many shares as they originally announced, but one-tenth of the firms repurchase less than 5 percent
of their announced intentions.”

37
Table I Summary Statistics The table reports summary statistics on open-market repurchase announcements, over the period 1998-2008. For each
country, the table reports the number of announcements and corresponding percentage of all publicly traded firms, and the
average, standard deviation, min and max percentage of the shares that the firms seek to repurchase The sample consists of
open-market repurchase announcements, over the period 1998-2008, by non-US firms, from the 31 countries with the largest
number of announcements over the sample period, plus open-market share announcements by U.S. firms over the same
period. Repurchase announcements are obtained from the SDC Mergers and Acquisitions and Repurchases datasets.
Nation Number of
announcements
Announcements
as % of traded
stocks
Percentage
sought in
the
repurchase
Percentage
sought - st.
dev.
Percentage
sought -
min
Percentage
sought -
max
Overall 7394 - 7.4 4.3 0.1 50.0
Japan 2644 6.6 6.7 4.3 0.1 47.6
Canada 1949 3.2 6.5 2.9 0.2 50.0
Australia 484 3.2 9.3 5.1 1.4 47.4
France 346 3.3 9.4 4.7 0.6 46.9
Malaysia 248 2.5 9.9 0.8 3.4 12.5
Hong Kong 197 2.4 9.6 2.5 0.1 22.0
Germany 193 1.8 9.3 4.3 0.3 50.0
South Korea 142 0.8 5.3 2.5 0.4 17.8
United Kingdom 134 0.6 11.9 8.0 0.3 50.0
Brazil 107 2.2 6.9 5.7 1.5 42.8
Switzerland 103 3.3 7.5 3.1 0.1 15.2
Taiwan 101 1.2 4.8 3.2 0.4 30.3
India 81 0.9 12.7 7.6 1.7 40.0
Italy 78 2.5 8.8 2.7 1.7 14.8
China 59 0.6 8.9 5.6 3.1 29.9
Netherlands 52 2.9 7.5 5.0 0.3 25.0
Austria 48 4.2 9.1 2.3 0.3 10.2
Thailand 48 1.3 8.5 3.0 1.0 20.0
Finland 41 2.7 5.0 2.0 0.8 10.8
Mexico 37 3.4 5.4 6.2 0.1 25.0
Sweden 36 1.1 9.4 3.8 2.8 20.0
Denmark 33 1.4 8.3 6.9 1.0 33.9
New Zealand 33 2.4 9.4 10.2 3.5 46.0
Spain 32 1.6 7.2 9.2 0.1 50.0
Philippines 31 1.3 10.5 8.0 0.5 28.8
Belgium 27 1.2 9.8 1.9 4.0 14.3
Norway 27 1.5 8.6 6.0 2.2 33.5
Greece 23 1.0 9.2 3.9 4.0 22.0
Israel 21 0.6 7.6 2.9 3.5 10.2
Indonesia 20 0.8 10.6 6.0 1.9 20.0
Singapore 19 0.7 10.0 0.3 9.1 10.3
United States 10093 9.3 8.2 0.0 50.0

38
Table II Completion Rates
Statistics on completion rates (percentage of the announced buyback that is actually completed) are reported, from the
announcement date up to four subsequent years. The sample consists of open-market repurchase announcements, over the
period 1998-2008, by non-US firms, from the 31 countries with the largest number of announcements over the sample
period, plus open-market share announcements by U.S. firms over the same period. Repurchase announcements are obtained
from the SDC Mergers and Acquisitions and Repurchases datasets.
Nation Year 1 Year 2 Year 3 Year 4
Overall 59 71 79 84
Japan 23 33 45 48
Canada 36 61 78 86
Australia 44 63 81 90
France 32 62 70 89
Malaysia 41 62 75 81
Hong Kong 59 72 82 88
Germany 44 58 70 77
South Korea 58 63 76 82
United Kingdom 59 67 78 91
Brazil 60 68 75 79
Switzerland 49 54 68 78
Taiwan 41 79 96 98
India 49 59 64 72
Italy 50 56 72 80
China 86 88 93 93
Netherlands 67 79 87 96
Austria 33 42 60 63
Thailand 42 52 73 81
Finland 37 56 66 90
Mexico 73 78 81 89
Sweden 22 28 36 42
Denmark 55 58 64 82
New Zealand 58 58 70 79
Spain 41 50 63 75
Philippines 61 68 71 71
Belgium 70 78 82 89
Norway 38 65 79 100
Greece 78 91 91 96
Israel 86 90 90 90
Indonesia 45 60 65 80
Singapore 63 74 79 95
United States 75 85 89 93

39
Table III Announcement Returns
The table reports the cumulative abnormal returns around the sample of open-market repurchase announcements. The
cumulative abnormal returns are computed by cumulating the daily abnormal returns over 3-day (-1,+1), 5-day (-2,+2), and
7-day (-3,+3) windows around the announcement date (columns (1), (4), and (7)), and corresponding t-statistics (columns (2),
(5), and (8)). The abnormal return on any given day is equal the difference between the actual return and the market return.
The columns labelled “US pctile” ((3), (6), and (9)) report the fraction of average announcement returns that are smaller than
the ones reported in the table, from the bootstrap based on U.S. repurchase announcements from the period 1998-2008 (the
bootstrap procedure is described in detail in the text). The sample consists of open-market repurchase announcements, over
the period 1998-2008, by non-US firms, from the 31 countries with the largest number of announcements over the sample
period, plus U.S. announcements over the same period. Repurchase announcements are obtained from the SDC Mergers and
Acquisitions and Repurchases datasets. Stock and market return data are obtained from Datastream for non-US firms, and
from CRSP for U.S. firms. The symbols *, **, and *** denote statistical significance at the 10%, 5%, and 1% level.
Nation
CAR
(-1,+1) t-stat US pctile
CAR
(-2,+2) t-stat US pctile
CAR
(-3,+3) t-stat US pctile
(1) (2) (3) (4) (5) (6) (7) (8) (9)
Overall 0.0127*** 15.53 0.00 0.0138*** 14.65 0.00 0.0148*** 13.68 0.00
Japan 0.0086*** 7.94 0.00 0.0105*** 7.81 0.00 0.0121*** 7.56 0.00
Canada 0.0190*** 9.52 0.05 0.0201*** 8.89 0.27 0.0223*** 8.71 0.84
Australia 0.0234*** 6.31 0.70 0.0218*** 5.63 0.55 0.0217*** 5.25 0.64
France -0.0009 -0.41 0.00 0.0025 0.75 0.00 0.0025 0.66 0.00
Malaysia -0.0017 -0.63 0.00 0.003 0.87 0.00 -0.0009 -0.23 0.00
Hong Kong -0.008 -1.27 0.00 -0.0056 -0.79 0.00 -0.0094 -1.13 0.00
Germany 0.0309*** 5.70 0.92 0.0299*** 5.15 0.89 0.0248*** 3.64 0.73
South Korea 0.0117* 1.72 0.07 0.0096 1.17 0.06 0.0091 0.98 0.09
United Kingdom 0.0083 1.64 0.03 0.0113* 1.75 0.12 0.0144** 2.05 0.26
Brazil 0.0025 0.50 0.01 0.0064 0.93 0.05 0.0151* 1.87 0.32
Switzerland 0.0074** 2.40 0.04 0.0085** 2.51 0.09 0.0116*** 2.76 0.19
Taiwan 0.0056 1.01 0.02 0.0043 0.63 0.03 0.0048 0.62 0.05
India 0.0254*** 3.31 0.65 0.0249*** 2.71 0.62 0.0184* 1.95 0.44
Italy 0.0059 1.40 0.04 0.0012 0.25 0.03 0.0061 1.11 0.12
China 0.0540*** 3.20 0.99 0.0203 1.35 0.49 0.0096 0.50 0.22
Netherlands 0.0154** 2.11 0.30 0.0202** 2.10 0.49 0.0178* 1.75 0.46
Austria 0.0131* 1.66 0.25 0.0154 1.55 0.35 0.0195* 1.96 0.48
Thailand 0.0362*** 3.92 0.89 0.0383*** 4.56 0.89 0.0362*** 3.01 0.86
Finland 0.0116 1.30 0.23 0.0039 0.39 0.10 0.0068 0.47 0.18
Mexico 0.0027 0.18 0.07 0.0072 0.40 0.19 0.015 0.79 0.38
Sweden 0.0113 1.04 0.23 0.0179 1.37 0.43 0.0191 1.48 0.48
Denmark 0.0244*** 3.00 0.59 0.0213** 2.42 0.49 0.0205** 2.41 0.51
New Zealand 0.0317*** 2.84 0.76 0.0382*** 2.77 0.86 0.0453** 2.57 0.92
Spain 0.0161** 2.45 0.36 0.0103 1.21 0.25 0.0065 0.55 0.22
Philippines 0.0255** 2.09 0.60 0.0383*** 2.79 0.86 0.0376*** 2.66 0.84
Belgium 0.0146** 2.10 0.31 0.0207*** 2.73 0.49 0.0251** 2.48 0.60
Norway 0.0083 0.84 0.18 0.0298*** 2.58 0.70 0.0393** 2.50 0.84
Greece 0.0048 0.32 0.14 0.0092 0.58 0.24 0.0095 0.50 0.28
Israel 0.0148 0.67 0.32 0.025 0.99 0.60 0.0188 0.77 0.49
Indonesia -0.0175* -1.73 0.01 -0.0079 -0.57 0.07 -0.0103 -0.54 0.09
Singapore 0.0385* 1.78 0.82 0.0261 1.17 0.59 0.0101 0.47 0.32
United States 0.0216*** 25.68 - 0.0211*** 22.24 - 0.0201*** 19.31 -

40
Table IV Announcement Returns – Country Level
In Panel A, the table reports the average announcement returns for buyback announcements taking place in countries with different legal origins, and F test statistics for the
differences among them. Columns (1)-(4) exclude the U.S. buyback announcements, columns (5)-(8) include them. In panel B, the table reports the estimates of a model:
where CAR is the average cumulative abnormal return around the announcement date, or announcement return, for all repurchasing firms belonging to the same nation. Each
observation in the sample is one nation. For a given firm, the abnormal return on a given date is the difference between the firm’s stock return and the return on the market
index. The firm-level announcement returns are then averaged to obtain a country-level announcement return. NationChar is a set of characteristics of the repurchasing firm’s
nation: legal origin (LaPorta et al., 1998, Djankov et al., 2007, Siems, 2007), as well as the average Completion Rate of repurchase programs in the country, the
GovernanceMetrics International® index, and the Loderer et al. (2010) index of the importance of shareholder value, the indicator variable for Board Approval (Y/N) of
repurchase programs in the country, and the average Percentage Sought. The announcement return is estimated over a 3-day (-1,+1) window around the announcement date.
In all panels, the regression is estimated using Weighted Least Squares (WLS), where the weights are the number of repurchase announcements in each country. The t-
statistics are based on heteroskedasticity-robust standard errors. The symbols *, **, and *** denote statistical significance at the 10%, 5%, and 1% levels.
Panel A. Sorts
Excluding U.S. sample Including U.S. sample
Legal origin
English
common law
French
civil law
Scandinavian
civil law
German
civil law
English
common law
French civil
law
Scandinavian
civil law
German
civil law
(1) (2) (3) (4) (5) (6) (7) (8)
CAR(-1,+1) 0.0166*** 0.0037 0.0108*** 0.0140** 0.0205*** 0.0037 0.0108*** 0.0140**
t-test 13.41 1.45 8.84 2.33 29.90 1.29 7.87 2.08
Difference from English common law 20.61*** 0.18 11.04*** 32.48*** 0.94 40.01***
p-value (0.00) (0.67) (0.00) (0.00) (0.33) (0.00)
Difference from French civil law 2.49 6.30** 1.97 4.99**
p-value 0.11 (0.01) (0.16) (0.03)
Difference from Scandinavian civil law 0.27 0.21
p-value (0.60) (0.65)
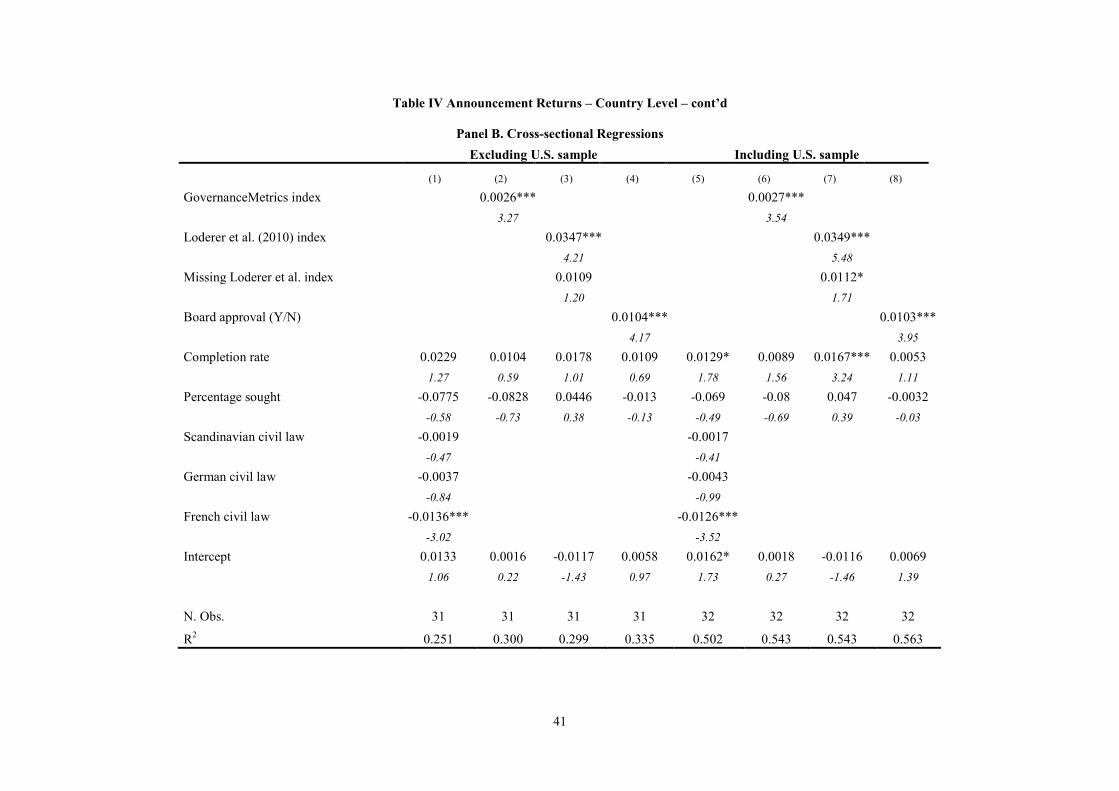
41
Table IV Announcement Returns – Country Level – cont’d
Panel B. Cross-sectional Regressions
Excluding U.S. sample Including U.S. sample
(1) (2) (3) (4) (5) (6) (7) (8)
GovernanceMetrics index 0.0026*** 0.0027***
3.27 3.54
Loderer et al. (2010) index 0.0347*** 0.0349***
4.21 5.48
Missing Loderer et al. index 0.0109 0.0112*
1.20 1.71
Board approval (Y/N) 0.0104*** 0.0103***
4.17 3.95
Completion rate 0.0229 0.0104 0.0178 0.0109 0.0129* 0.0089 0.0167*** 0.0053
1.27 0.59 1.01 0.69 1.78 1.56 3.24 1.11
Percentage sought -0.0775 -0.0828 0.0446 -0.013 -0.069 -0.08 0.047 -0.0032
-0.58 -0.73 0.38 -0.13 -0.49 -0.69 0.39 -0.03
Scandinavian civil law -0.0019 -0.0017
-0.47 -0.41
German civil law -0.0037 -0.0043
-0.84 -0.99
French civil law -0.0136*** -0.0126***
-3.02 -3.52
Intercept 0.0133 0.0016 -0.0117 0.0058 0.0162* 0.0018 -0.0116 0.0069
1.06 0.22 -1.43 0.97 1.73 0.27 -1.46 1.39
N. Obs. 31 31 31 31 32 32 32 32
R2 0.251 0.300 0.299 0.335 0.502 0.543 0.543 0.563

42
Table V Announcement Returns – Firm Level Cross-Sectional Regressions
The table reports the estimates of a model:
where CAR is the cumulative abnormal return around the announcement date. The abnormal return on a given date is the difference
between the firm’s stock return and the return on the market index. FirmChar is a set of characteristics of the repurchasing firm: the
ISS Corporate Governance Quotient (CGQ) the Cross Listed and ADR indicators, the cumulative raw return on the firm’s stocks over
the 6 months leading to the announcement month, market-to-book value, percentage of stocks sought for repurchase, and the buyback
program’s completion rate one year after the announcement. The row labelled “Cross listed = ADR” reports the F test statistic for the
difference between the coefficients on the Cross listed and ADR indicators. In Panel A., the model only includes firm-level proxies
for the quality of corporate governance. In Panel B., the country-level GovernanceMetrics Interanctional® index and Loderer et al.
(2010) index are added. In columns (1)-(4), the sample consists of open-market repurchase announcements, over the period 1998-
2008, by non-US firms, from the 31 countries with the largest number of announcements over the sample period. In columns (5)-(8),
the sample is extended to include U.S. buyback announcements. Repurchase announcements are obtained from the SDC Mergers and
Acquisitions and Repurchases datasets. In order to account for the potential correlation between observations corresponding to firms
from the same nation, in all specifications the standard errors are clustered at the nation level. The symbols *, **, and *** denote
statistical significance at the 10%, 5%, and 1% level.
Panel A. Firm-Level Corporate Governance Indexes
Excluding U.S. sample Including U.S. sample
(1) (2) (3) (4) (5) (6) (7) (8)
CGQ 0.0062* 0.002
2.01 0.84
Cross listed 0.0217*** 0.0329***
6.38 5.64
ADR 0.0041 0.0051*
1.54 1.85
Board approval (Y/N) 0.0107*** 0.0156***
3.20 3.11
Cum. raw return over
prior 6 months -0.0173** -0.0095 -0.0174** -0.0177** -0.0098 -0.0133 -0.0212*** -0.0118*
-2.60 -1.62 -2.54 -2.54 -1.44 -1.35 -3.03 -1.83
Size -0.0059*** -0.0016** -0.0071*** -0.0054*** -0.0058*** -0.0042*** -0.0065*** -0.0057***
-8.00 -2.52 -5.43 -5.11 -14.32 -7.73 -13.42 -11.43
Market-to-Book -0.0005 0.0005 -0.0009** -0.0009* -0.0016** -0.0022* -0.0018** -0.0020***
-1.31 1.05 -2.32 -1.97 -2.16 -1.73 -2.71 -2.82
Percentage sought 0.0324 0.0275 0.0321 0.0358 0.0359*** 0.0157*** 0.0337*** 0.0378***
1.36 1.24 1.19 1.53 5.60 6.38 4.68 5.80
One-year completion 0.0074 0.0046 0.0081 0.0051 0.0299*** 0.0394** 0.0127* 0.0249***
1.26 0.79 1.36 1.04 3.14 2.53 2.01 2.80
French legal origin -0.0139*** -0.0190***
-3.44 -4.90
German legal origin -0.0036 -0.0065*
-1.02 -1.74
Nordic legal origin -0.0034 -0.0064
-0.64 -1.23
Intercept 0.0397*** 0.0088** 0.0415*** 0.0315*** 0.0376*** 0.0232*** 0.0387*** 0.0286***
8.12 2.33 5.22 5.94 9.90 4.32 11.15 15.23
N. Obs. 6109 1307 6109 6109 10870 4449 10870 10870
R2 0.018 0.007 0.019 0.02 0.026 0.022 0.033 0.029
Cross listed = ADR 14.75*** 25.87***
p-value 0.001 0.00

43
Panel B. Firm-Level and Country-Level Corporate Governance Indexes
Excluding U.S. sample Including U.S. sample
(1) (2) (3) (4) (5) (6) (7) (8)
CGQ -0.0003 0.0042 -0.0008 0.0017
-0.09 1.34 -0.62 1.01
GovernanceMetrics
index 0.0033*** 0.0022* 0.0050*** 0.0022*
3.54 1.84 4.16 1.91
Cross listed 0.0157** 0.0166** 0.0289*** 0.0312***
2.52 2.73 5.49 5.51
ADR 0.0043 0.0057** 0.0052* 0.0059**
1.69 2.30 1.96 2.28
Loderer et al. (2010)
index 0.0420*** 0.0198 0.0369*** 0.0109
6.19 1.46 6.02 0.94
Missing Loderer et al.
index 0.0154*** 0.0049 0.0068 0.0002
5.83 0.63 1.36 0.02
Cum. raw return over
prior 6 months -0.0101 -0.0179** -0.0080 -0.0173** -0.0150 -0.0213*** -0.0125 -0.0208***
-1.57 -2.53 -1.33 -2.51 -1.58 -3.00 -1.18 -2.88
Size -0.0038*** -0.0062*** -0.0049*** -0.0065*** -0.0046*** -0.0063*** -0.0045*** -0.0064***
-4.03 -3.45 -6.49 -4.14 -21.25 -14.53 -28.17 -14.23
Market-to-Book 0.0000 -0.0012*** 0.0004 -0.0009** -0.0027** -0.0021*** -0.0024* -0.0019***
0.00 -2.77 0.89 -2.49 -2.47 -3.22 -1.93 -2.80
Percentage sought 0.0150 0.0296 0.0379 0.0414 0.0142*** 0.0329*** 0.0168*** 0.0351***
0.77 1.21 1.64 1.58 6.89 4.88 4.77 4.99
One-year completion 0.0000 0.0048 0.0057 0.0083 0.0273** 0.0101 0.0406** 0.0142**
-0.01 0.92 1.01 1.39 2.39 1.66 2.68 2.27
Intercept 0.0102** 0.0285** 0.0092*** 0.0301** 0.0054 0.0286*** 0.0098* 0.0338***
2.53 2.36 2.98 2.31 0.95 5.31 2.01 5.06
N. Obs. 1307 6109 1307 6109 4445 10873 4445 10873
R2 0.017 0.021 0.017 0.02 0.026 0.034 0.024 0.034

44
Table VI Long-Run Returns (Calendar-Time Method)
The table reports the monthly calendar-time alphas over 12-, 24-, 36-, and 48-month horizons following the
announcement date, based on one- (Panel A), three- (Panel B), and four-factor (Panel C) models (using local
currency returns and local factors), along with t-statistics based on heteroskedasticity-robust standard errors. The
sample consists of open-market repurchase announcements, over the period 1998-2008, by non-US firms, from
the 31 countries listed in the appendix, plus U.S. announcements over the same period. Repurchase
announcements are obtained from the SDC Mergers and Acquisitions and Repurchases datasets. The symbols *,
**, and *** denote statistical significance at the 10%, 5%, and 1% levels.
A. One-Factor Model
Nation
Alpha (12
months) t-stat
US
pctile
Alpha (24
months) t-stat
US
pctile
Alpha (36
months) t-stat
US
pctile
Alpha (48
months) t-stat
US
pctile
(1) (2) (3) (4) (5) (6) (7) (8) (9) (10) (11) (12)
Japan 0.0090*** 3.32 1.00 0.0083*** 3.13 1.00 0.0079*** 3.05 1.00 0.0079*** 3.09 1.00
Canada 0.0058** 2.34 0.19 0.0057** 2.41 0.03 0.0056** 2.40 0.03 0.0053** 2.27 0.03
Australia 0.0131*** 4.18 1.00 0.0110*** 3.87 1.00 0.0091*** 3.36 1.00 0.0089*** 3.36 1.00
France 0.0022 0.63 0.02 0.0015 0.64 0.00 0.0011 0.51 0.00 0.0021 1.00 0.00
Malaysia 0.0001 0.02 0.01 0.0000 0.00 0.00 0.0010 0.17 0.00 0.0009 0.15 0.00
Hong Kong 0.0181 0.88 1.00 0.0012 0.11 0.01 0.0101 1.08 0.99 0.0135 1.54 1.00
Germany -0.0005 -0.13 0.01 0.0002 0.07 0.00 0.0008 0.25 0.00 0.0011 0.35 0.00
South Korea 0.0031 0.38 0.16 0.0139 1.28 1.00 0.0091 0.92 0.92 0.0058 0.63 0.49
United Kingdom 0.0089* 1.81 0.75 0.0091*** 2.70 0.86 0.0068** 2.49 0.62 0.0057** 2.16 0.48
Brazil 0.0131** 1.97 0.95 0.0113** 2.02 0.97 0.0109** 2.31 0.97 0.0129*** 2.83 1.00
Switzerland 0.0059** 1.97 0.44 0.0028 1.13 0.10 0.0025 1.03 0.08 0.0029 1.27 0.10
Taiwan 0.0001 0.02 0.06 0.0055 1.14 0.35 0.0055 1.17 0.39 0.0043 0.94 0.25
India 0.0185** 2.54 0.99 0.0175*** 2.84 1.00 0.0152** 2.52 1.00 0.0139** 2.41 1.00
Italy 0.0024 0.65 0.22 0.0037 1.19 0.20 0.0010 0.40 0.04 0.0014 0.59 0.05
China -0.0036 -0.43 0.04 0.0004 0.06 0.05 0.0032 0.50 0.18 0.0041 0.73 0.27
Netherlands 0.0053 0.82 0.44 0.0072 1.59 0.58 0.0043 0.99 0.32 0.0078* 1.73 0.75
Austria 0.0093 1.68 0.70 0.0055 1.22 0.41 0.0061 1.45 0.50 0.0064 1.55 0.56
Thailand 0.0075 1.26 0.57 0.0105** 2.33 0.83 0.0092** 2.17 0.81 0.0096** 2.39 0.86
Finland -0.0064 -0.93 0.02 -0.0026 -0.50 0.02 0.0006 0.12 0.07 0.0028 0.60 0.19
Mexico 0.0109* 1.78 0.79 0.0085** 2.06 0.70 0.0053 1.46 0.44 0.0074** 2.08 0.68
New Zealand 0.0041 0.81 0.35 0.0071 1.64 0.52 0.0084** 2.35 0.69 0.0064* 1.81 0.54
Sweden 0.0193*** 3.07 0.96 0.0155*** 3.43 0.96 0.0117*** 3.51 0.90 0.0110*** 3.49 0.92
Denmark 0.0051 0.83 0.44 0.0070 1.43 0.56 0.0069 1.66 0.57 0.0058 1.50 0.46
Philippines 0.0088 0.87 0.63 0.0085 1.10 0.64 0.0076 1.13 0.62 0.0091 1.40 0.80
Israel 0.0161 1.30 0.89 0.0103 0.84 0.77 0.009 0.74 0.73 0.0104 0.86 0.88
Spain 0.0094 1.56 0.67 0.0068 1.54 0.52 0.0059 1.43 0.47 0.0065 1.60 0.55
Greece -0.0171** -2.16 0.00 -0.0034 -0.56 0.03 -0.0005 -0.11 0.07 -0.0013 -0.30 0.04
Norway -0.0048 -0.52 0.06 -0.0063 -0.99 0.02 -0.0055 -0.78 0.01 0.0011 0.21 0.10
Belgium 0.0134** 2.36 0.81 0.0077* 1.73 0.57 0.0050 1.19 0.40 0.0039 0.92 0.29
Indonesia 0.0097 1.06 0.66 0.0209** 2.35 0.98 0.0126 1.65 0.88 0.0111 1.61 0.86
Singapore -0.0024 -0.33 0.18 -0.004 -0.45 0.04 -0.0075 -1.11 0.00 -0.0051 -0.90 0.01
United States 0.0065*** 2.87 - 0.0069*** 3.31 - 0.0065*** 3.07 - 0.0061*** 2.89 -

45
Table VI Long-Run Returns (Calendar-Time Method) – cont’d
B. Three-Factor Model
Nation
Alpha (12
months) t-stat
US
pctile
Alpha (24
months) t-stat
US
pctile
Alpha (36
months) t-stat
US
pctile
Alpha (48
months) t-stat
US
pctile
(1) (2) (3) (4) (5) (6) (7) (8) (9) (10) (11) (12)
Japan 0.0108*** 5.98 1.00 0.0103*** 5.82 1.00 0.0101*** 5.82 1.00 0.0103*** 6.02 1.00
Canada 0.0051** 1.98 0.96 0.0049** 2.01 0.95 0.0048** 1.97 1.00 0.0045* 1.84 1.00
Australia 0.0149*** 3.79 1.00 0.0112*** 3.24 1.00 0.0092*** 2.82 1.00 0.0086*** 2.71 1.00
France 0.0036 1.00 0.51 0.0021 0.99 0.22 0.0024 1.28 0.37 0.0032* 1.92 0.69
Malaysia 0.0110 1.92 1.00 0.0122** 2.55 1.00 0.0139*** 3.21 1.00 0.0138*** 3.26 1.00
Hong Kong 0.0021 0.09 0.30 -0.0034 -0.28 0.00 0.0049 0.51 0.85 0.0088 0.96 1.00
Germany 0.0046 1.05 0.64 0.0054* 1.70 0.83 0.0061** 2.10 0.95 0.0066** 2.29 0.99
South Korea 0.0095 1.10 0.96 0.0126 1.03 1.00 0.0080 0.72 0.98 0.0061 0.60 0.95
United Kingdom 0.0134** 2.48 1.00 0.0141*** 4.30 1.00 0.0107*** 4.22 1.00 0.0090*** 3.88 1.00
Brazil 0.0106 1.49 0.96 0.0090 1.52 0.97 0.0097* 1.94 0.99 0.0116** 2.44 1.00
Switzerland 0.0075** 2.47 0.81 0.0046** 1.97 0.66 0.0048** 2.06 0.75 0.0055** 2.54 0.87
Taiwan -0.0060 -0.95 0.01 -0.0041 -0.86 0.01 -0.0048 -1.08 0.00 -0.0063 -1.57 0.00
India 0.0115 1.41 0.97 0.0114* 1.87 0.99 0.0089 1.56 0.97 0.0082 1.56 0.98
Italy 0.0015 0.43 0.35 0.0035 1.19 0.55 0.0007 0.31 0.24 0.0011 0.51 0.31
China 0.0141 1.23 0.97 0.0034 0.40 0.52 0.0061 0.84 0.82 0.0082 1.29 0.95
Netherlands 0.0033 0.49 0.49 0.0059 1.26 0.74 0.0028 0.63 0.50 0.0064 1.36 0.88
Austria 0.0138** 2.31 0.94 0.009* 1.82 0.91 0.0105** 2.37 0.97 0.0105** 2.39 0.99
Thailand 0.0105 1.66 0.87 0.0162*** 3.44 1.00 0.0150*** 3.47 1.00 0.0152*** 3.84 1.00
Finland -0.0013 -0.19 0.23 0.0010 0.19 0.31 0.0050 1.08 0.73 0.0077* 1.81 0.93
Mexico 0.0105 1.57 0.88 0.012*** 2.66 0.95 0.0081** 2.01 0.89 0.0097** 2.47 0.97
New Zealand 0.0049 0.96 0.56 0.0085* 1.94 0.83 0.0091*** 2.58 0.91 0.0069** 1.99 0.84
Sweden 0.0231*** 3.33 0.99 0.0200*** 4.11 1.00 0.0164*** 4.80 1.00 0.0161*** 4.98 1.00
Denmark 0.0128* 1.89 0.89 0.0103* 1.88 0.92 0.0095** 2.03 0.93 0.0087** 2.03 0.94
Philippines 0.0105 0.95 0.83 0.0032 0.38 0.48 0.0036 0.49 0.56 0.0042 0.61 0.66
Israel 0.0185 1.36 0.96 0.0143 1.08 0.97 0.0101 0.77 0.93 0.0124 0.94 0.98
Spain 0.016** 2.49 0.95 0.0112** 2.39 0.92 0.0107** 2.43 0.93 0.0120*** 2.80 0.97
Greece -0.0202** -2.32 0.00 0.0014 0.21 0.36 0.0036 0.71 0.56 0.0027 0.58 0.51
Norway 0.0007 0.07 0.34 -0.0031 -0.45 0.12 -0.0058 -0.72 0.04 -0.0002 -0.03 0.26
Belgium 0.0166*** 2.95 0.93 0.0090** 1.99 0.80 0.0082** 1.98 0.85 0.0075* 1.84 0.86
Indonesia 0.0201* 1.95 0.95 0.0225** 2.20 0.99 0.0171* 1.96 0.99 0.0165** 2.10 0.99
Singapore -0.0014 -0.17 0.30 0.0055 0.68 0.65 -0.0050 -0.72 0.08 -0.0061 -1.10 0.04
United States 0.0036** 2.20 - 0.0038*** 2.79 - 0.0034** 2.46 - 0.0029** 2.19 -

46
Table VI Long-Run Returns (Calendar-Time Method) – cont’d
C. Four-Factor Model
Nation
Alpha (12
months) t-stat
US
pctile
Alpha (24
months) t-stat
US
pctile
Alpha (36
months) t-stat
US
pctile
Alpha (48
months) t-stat
US
pctile
(1) (2) (3) (4) (5) (6) (7) (8) (9) (10) (11) (12)
Japan 0.0080*** 4.33 1.00 0.0070*** 3.98 1.00 0.0068*** 3.95 1.00 0.0071*** 4.19 1.00
Canada 0.0047* 1.82 0.46 0.0045* 1.83 0.30 0.0044* 1.79 0.56 0.0040 1.64 0.59
Australia 0.0169*** 4.37 1.00 0.0133*** 3.97 1.00 0.0113*** 3.59 1.00 0.0106*** 3.46 1.00
France 0.0026 0.70 0.15 0.0015 0.68 0.04 0.0018 0.91 0.06 0.0025 1.45 0.19
Malaysia 0.0031 0.58 0.27 0.0054 1.23 0.71 0.0070* 1.81 0.95 0.0068* 1.83 0.96
Hong Kong 0.0018 0.08 0.15 -0.0040 -0.34 0.00 0.0045 0.49 0.62 0.0084 0.96 0.99
Germany 0.0044 1.01 0.46 0.0053* 1.70 0.68 0.0061** 2.10 0.86 0.0066** 2.29 0.96
South Korea 0.0144* 1.70 1.00 0.0165 1.36 1.00 0.0122 1.12 1.00 0.0106 1.08 1.00
United Kingdom 0.0118* 1.95 0.98 0.0114*** 3.17 1.00 0.0076*** 2.79 0.94 0.0058** 2.34 0.84
Brazil 0.0008 0.11 0.16 0.0004 0.07 0.08 0.0027 0.53 0.30 0.0054 1.11 0.79
Switzerland 0.0085*** 2.64 0.81 0.0036 1.47 0.41 0.0034 1.40 0.41 0.0035 1.56 0.48
Taiwan -0.0030 -0.51 0.02 -0.0027 -0.60 0.02 -0.0033 -0.82 0.00 -0.0048 -1.35 0.00
India 0.0104 1.37 0.91 0.0101** 2.04 0.96 0.0078 1.60 0.91 0.0071 1.65 0.92
Italy -0.0011 -0.30 0.13 0.0013 0.41 0.19 -0.0016 -0.67 0.03 -0.0009 -0.41 0.05
China 0.0073 0.69 0.68 -0.0002 -0.03 0.11 0.0040 0.57 0.53 0.0073 1.21 0.89
Netherlands 0.0012 0.18 0.28 0.0036 0.80 0.44 0.0000 0.01 0.17 0.0037 0.84 0.53
Austria 0.0099 1.68 0.82 0.0055 1.14 0.62 0.0072 1.66 0.80 0.0064 1.55 0.81
Thailand 0.0068 1.13 0.63 0.0145*** 3.10 0.99 0.0133*** 3.12 0.99 0.0137*** 3.49 1.00
Finland 0.0029 0.39 0.41 0.0007 0.13 0.22 0.0046 0.92 0.59 0.0073 1.56 0.87
Mexico 0.0089 1.23 0.78 0.0115** 2.33 0.92 0.0078* 1.77 0.81 0.0093** 2.17 0.93
New Zealand 0.0027 0.49 0.37 0.0057 1.22 0.59 0.0068* 1.79 0.73 0.0043 1.16 0.57
Sweden 0.0216*** 3.09 0.98 0.0194*** 3.94 0.99 0.0159*** 4.58 0.99 0.0157*** 4.80 1.00
Denmark 0.0032 0.45 0.42 0.0023 0.41 0.35 0.0026 0.55 0.37 0.0026 0.60 0.39
Philippines 0.0011 0.10 0.31 0.0004 0.05 0.21 0.0010 0.13 0.25 0.0010 0.15 0.26
Israel 0.0105 0.75 0.79 0.0050 0.37 0.56 0.0008 0.06 0.26 0.0032 0.24 0.47
Spain 0.0094 1.48 0.74 0.0055 1.19 0.59 0.0047 1.09 0.57 0.0063 1.50 0.75
Greece -0.0204 -2.32 0.00 0.0012 0.19 0.29 0.0035 0.69 0.46 0.0029 0.61 0.44
Norway -0.0006 -0.06 0.22 -0.0036 -0.53 0.07 -0.0067 -0.84 0.01 -0.0008 -0.13 0.14
Belgium 0.0169*** 2.89 0.91 0.0092* 1.95 0.77 0.0082* 1.90 0.80 0.0072* 1.69 0.79
Indonesia 0.0163 1.60 0.88 0.0208** 2.01 0.98 0.0146 1.66 0.96 0.0138* 1.76 0.97
Singapore -0.0035 -0.42 0.19 0.0062 0.75 0.63 -0.0060 -0.84 0.03 -0.0069 -1.21 0.02
United States 0.0048*** 3.77 - 0.0048*** 4.47 - 0.0043*** 3.95 - 0.0039*** 3.66 -

47
Table VII Long-Run Returns – Ibbotson RATS Method
The table reports the cumulative long-run abnormal returns on portfolios of repurchasing firms, obtained using the Ibbotson (1975) Returns Across Time and Securities
(RATS) method. In panels A and B, the sample is restricted to share buybacks announced outside of the United States. In panels C and D, the sample is extended to include
share buybacks announced in the United States as well. In panels A and C, the results are based on local currency returns, and local factor models for the expected returns. In
panels B and D, the results are based on U.S. dollar returns, and the regional factors used in Fama and French (2012). All panels report estimates of the cumulative abnormal
returns over horizons spanning 12, 24, 36, and 48 months following the buyback announcement date, using one-, three-, and four-factor models. In all panels, the row labelled
“All buyback announcements” runs the RATS method on the entire sample of buyback announcements (excluding U.S. announcements in panels A and B). The rows labelled
“High U-index”, “Low U-index”, and “High – Low U-index” refer to a partition of the sample based on the U-index, which assigns each repurchasing firm a combined score
based on the raw return prior to the buyback announcement, the firm’s size, and the firm’s book-to-market ratio, as described in the appendix. A given firm belongs to the
“High U-index” (“Low U-index”) group if its U-index is above the 70th percentile (below the 30
th percentile) of the U-index distribution among all firms announcing a
buyback in a given year. The rows labelled “Board approval” and “Shareholder approval” refer to a partition of the sample based on whether board or shareholder approval is
required to announce a buyback program. The countries in which board approval is sufficient are: Australia, Canada, India, Israel, New Zealand, Switzerland, Taiwan, and
Thailand. The rows labelled “Low analyst coverage”, “High analyst coverage”, and “Low – High analyst coverage” refer to a partition of the sample based on the number of
analyst EPS forecast available for the buyback firm from the IBES database at the time of the buyback announcement. A firm belongs to the “Low analyst coverage” (“High
analyst coverage”) group if its analyst coverage is below the sample median. The cumulative abnormal returns reported in the “All buyback announcements” are based on a
direct application of the Ibbotson (1975) RATS method. The cumulative abnormal returns in the rows labelled “High U-index”, “Low U-index”, and “High – Low U-index”
are obtained by running the Ibbotson (1975) RATS method separately for buyback announcements in the “High U-index” and “Low U-index” groups, and then combining the
estimated monthly abnormal returns to obtain cumulative abnormal returns. The same approach is followed for the “Board approval”-“Shareholder approval” case, as well as
for the “Low analyst coverage”-“High analyst coverage” case. For each horizon, factor model, and sample partition, the table reports the estimate of the cumulative abnormal
return, as well as the associated chi-square test statistic. This test statistic corresponds to the one used by Peyer and Vermaelen (2009), with the difference that in this case the
standard errors account for clustering around buyback firm nation and announcement calendar month. The sample consists of open-market repurchase announcements, over
the period 1998-2008, by non-US firms, from the 31 countries listed in the appendix, plus U.S. announcements over the same period. Repurchase announcements are
obtained from the SDC Mergers and Acquisitions and Repurchases datasets. The symbols *, **, and *** denote statistical significance at the 10%, 5%, and 1% levels.

48
Table VII Long-Run Returns – Ibbotson RATS Method – cont’d
A. Local currency returns, local factors (excluding U.S. buybacks)
One-factor model Three-factor model Four-factor model
Months relative to ann. date (+1,+12) (+1,+24) (+1,+36) (+1,+48) (+1,+12) (+1,+24) (+1,+36) (+1,+48) (+1,+12) (+1,+24) (+1,+36) (+1,+48)
All buyback announcements 0.0974*** 0.2122*** 0.3041*** 0.3595*** 0.0563*** 0.1188*** 0.1672*** 0.1852*** 0.0538*** 0.1138*** 0.1589*** 0.1750***
40.54 89.24 164.85 314.99 29.14 70.98 100.63 94.10 26.95 65.83 90.30 85.50
High U-index 0.1429*** 0.2977*** 0.3912*** 0.4617*** 0.0695*** 0.1261*** 0.1752*** 0.2066*** 0.0580*** 0.1123*** 0.1585*** 0.1872***
32.12 57.35 78.88 131.21 18.53 28.66 35.43 32.79 13.44 23.39 29.94 28.88
Low U-index 0.0670*** 0.1648*** 0.2217*** 0.2550*** 0.0378*** 0.0997*** 0.1205*** 0.1274*** 0.0353*** 0.0949*** 0.1133*** 0.1194***
28.55 113.75 184.91 203.41 10.85 47.39 57.03 44.05 9.71 43.93 50.55 38.97
High – Low U-index 0.0759*** 0.1329*** 0.1695*** 0.2067*** 0.0317* 0.0264 0.0547* 0.0791** 0.0227 0.0174 0.0452 0.0678*
13.19 15.37 17.92 29.73 3.60 1.14 3.20 4.93 1.84 0.50 2.25 3.77
Board approval 0.0678*** 0.1842*** 0.3052*** 0.3761*** 0.0469*** 0.1286*** 0.2031*** 0.2290*** 0.0404** 0.1164*** 0.1827*** 0.2043***
14.53 50.45 112.17 155.93 27.68 49.74 60.71 49.51 5.82 23.28 50.32 52.08
Shareholder approval 0.1159*** 0.2300*** 0.3042*** 0.3512*** 0.0614*** 0.1088*** 0.1419*** 0.1645*** 0.0484*** 0.0945*** 0.1258*** 0.1574***
36.57 61.79 88.94 163.51 7.39 26.85 59.92 63.60 14.60 32.23 37.26 46.15
Board – Shareholder approval -0.0481 -0.0459 0.0010 0.0249 -0.0145 0.0198 0.0613 0.0645 -0.0080 0.0219 0.0569 0.0469
3.39 1.38 0.00 0.37 0.48 0.46 3.68 3.03 0.15 0.56 2.97 1.64
Low analyst coverage 0.1234*** 0.2574*** 0.3695*** 0.4305*** 0.0723*** 0.1406*** 0.2022*** 0.2245*** 0.0700*** 0.1365*** 0.1953*** 0.2143***
41.65 72.06 128.49 205.03 30.47 61.87 74.65 67.17 28.27 58.29 69.46 61.96
High analyst coverage 0.0665*** 0.1580*** 0.2274*** 0.2769*** 0.0385*** 0.0926*** 0.1285*** 0.1464*** 0.0354*** 0.0861*** 0.1182*** 0.1328***
21.39 89.42 169.25 238.44 9.27 34.60 61.27 60.43 8.09 30.80 52.41 50.85
Low – High analyst coverage 0.0569*** 0.0994*** 0.1420*** 0.1536*** 0.0338** 0.0481** 0.0737*** 0.0781*** 0.0346** 0.0504** 0.0771*** 0.0815***
11.07 14.72 24.56 26.03 4.95 6.04 9.09 7.41 5.14 6.64 9.99 8.07

49
Table VII Long-Run Returns – Ibbotson RATS Method – cont’d
B. U.S. dollar returns, regional factors (excluding U.S. buybacks)
One-factor model Three-factor model Four-factor model
Months relative to ann. date (+1,+12) (+1,+24) (+1,+36) (+1,+48) (+1,+12) (+1,+24) (+1,+36) (+1,+48) (+1,+12) (+1,+24) (+1,+36) (+1,+48)
All buyback announcements 0.1029*** 0.2240*** 0.3198*** 0.3896*** 0.0658*** 0.1441*** 0.2046*** 0.2620*** 0.0700*** 0.1509*** 0.2129*** 0.2692***
105.35 269.07 361.66 172.36 57.57 153.40 191.86 125.65 65.35 176.76 229.78 144.85
High U-index 0.1245*** 0.2767*** 0.4028*** 0.4630*** 0.0728*** 0.1753*** 0.2566*** 0.3125*** 0.0754*** 0.1826*** 0.2655*** 0.3184***
24.37 79.60 132.23 156.51 19.66 49.64 71.69 77.93 21.40 54.92 76.59 80.11
Low U-index 0.0715*** 0.1657*** 0.2357*** 0.2882*** 0.0411*** 0.0982*** 0.1434*** 0.1816*** 0.0428*** 0.1015*** 0.1482*** 0.1877***
156.51 141.60 144.87 114.25 18.76 50.25 63.08 64.68 21.41 55.68 72.38 74.12
High – Low U-index 0.0530** 0.1111*** 0.1671*** 0.1748*** 0.0317 0.0771*** 0.1132*** 0.1310*** 0.0325* 0.0810*** 0.1173*** 0.1307***
4.02 10.07 16.68 24.79 2.66 7.21 10.25 14.12 2.88 8.07 11.04 13.43
Board approval 0.1067*** 0.2552*** 0.4061*** 0.5152*** 0.0850*** 0.2002*** 0.3207*** 0.4144*** 0.0873*** 0.2029*** 0.3183*** 0.4084***
47.05 122.02 174.90 204.22 34.54 101.40 176.90 232.13 34.75 104.85 185.11 235.94
Shareholder approval 0.1002*** 0.2039*** 0.2677*** 0.3138*** 0.0524*** 0.1072*** 0.1354*** 0.1747*** 0.0562*** 0.1135*** 0.1469*** 0.1872***
57.75 125.92 182.95 89.56 25.38 63.70 76.83 56.07 235.94 72.43 90.30 60.33
Board – Shareholder approval 0.0065 0.0513* 0.1384*** 0.2014*** 0.0326* 0.0930*** 0.1853*** 0.2397*** 0.0311* 0.0894*** 0.1713*** 0.2212***
0.10 3.05 14.35 16.91 3.35 15.04 41.87 44.77 2.92 14.02 37.35 37.99
Low analyst coverage 0.1188*** 0.2526*** 0.3536*** 0.4272*** 0.0782*** 0.1671*** 0.2425*** 0.3130*** 0.0808*** 0.1728*** 0.2494*** 0.3155***
72.22 158.87 258.16 258.16 46.08 120.47 169.05 114.95 47.45 130.33 183.24 119.03
High analyst coverage 0.0851*** 0.1919*** 0.2847*** 0.3496*** 0.0533*** 0.1188*** 0.1662*** 0.2120*** 0.0601*** 0.1277*** 0.1752*** 0.2224***
60.27 174.93 153.21 143.89 24.19 67.45 79.31 83.37 32.07 78.85 96.08 98.47
Low – High analyst coverage 0.0338** 0.0607*** 0.0689** 0.0776** 0.0249* 0.0483*** 0.0763*** 0.1010*** 0.0207 0.0451** 0.0741*** 0.0932***
4.49 6.78 5.47 5.38 3.13 7.07 11.80 11.80 2.15 5.97 11.16 12.07

50
Table VII Long-Run Returns – Ibbotson RATS Method – cont’d
C. Local currency returns, local factors (including U.S. buybacks)
One-factor model Three-factor model Four-factor model
Months relative to ann. date (+1,+12) (+1,+24) (+1,+36) (+1,+48) (+1,+12) (+1,+24) (+1,+36) (+1,+48) (+1,+12) (+1,+24) (+1,+36) (+1,+48)
All buyback announcements 0.0779*** 0.2035*** 0.3214*** 0.3919*** 0.0423*** 0.1054*** 0.1654*** 0.1913*** 0.0414*** 0.1038*** 0.1626*** 0.1884***
48.76 151.52 324.08 334.29 30.89 92.39 142.31 131.46 29.87 90.09 137.44 127.48
High U-index 0.1354*** 0.3184*** 0.4478*** 0.5075*** 0.0710*** 0.1727*** 0.2519*** 0.2809*** 0.0743*** 0.1764*** 0.2569*** 0.2848***
48.34 142.11 202.34 152.81 19.15 61.59 79.53 74.89 21.26 63.12 82.31 76.05
Low U-index 0.0584*** 0.1535*** 0.2402*** 0.2875*** 0.0348*** 0.0842*** 0.1235*** 0.1395*** 0.0339*** 0.0826*** 0.1213*** 0.1386***
44.56 138.16 320.26 326.11 22.49 62.78 103.25 100.27 21.58 61.03 99.78 98.24
High – Low U-index 0.0771*** 0.1649*** 0.2076*** 0.2200*** 0.0361** 0.0885*** 0.1284*** 0.1414*** 0.0404** 0.0937*** 0.1357*** 0.1462***
19.39 44.51 52.59 40.02 4.75 15.34 22.40 21.29 6.01 16.88 24.89 22.39
Board approval 0.0639*** 0.1954*** 0.3356*** 0.4168*** 0.0377*** 0.1108*** 0.1855*** 0.2182*** 0.0365*** 0.1086*** 0.1818*** 0.2143***
24.53 94.27 212.13 237.31 17.87 66.79 117.23 125.47 16.90 64.48 112.17 120.54
Shareholder approval 0.1159*** 0.2300*** 0.3042*** 0.3512*** 0.0614*** 0.1088*** 0.1419*** 0.1645*** 0.0484*** 0.0945*** 0.1258*** 0.1574***
36.57 61.79 88.94 163.52 27.68 49.74 60.71 49.51 14.60 32.24 37.26 46.15
Board – Shareholder approval -0.0520** -0.0346 0.0314 0.0656* -0.0236 0.0021 0.0437* 0.0536* -0.0119 0.0141 0.0560** 0.0569*
5.06 0.95 0.63 2.90 2.59 0.01 3.05 3.11 0.59 0.43 4.36 3.53
Low analyst coverage 0.0949*** 0.2364*** 0.3712*** 0.4558*** 0.0517*** 0.1288*** 0.2087*** 0.2482*** 0.0505*** 0.1267*** 0.2050*** 0.2436***
47.53 140.64 308.39 348.50 32.52 93.38 146.48 131.28 31.10 90.56 141.20 125.99
High analyst coverage 0.0600*** 0.1679*** 0.2688*** 0.3254*** 0.0343*** 0.0876*** 0.1314*** 0.1468*** 0.0338*** 0.0863*** 0.1294*** 0.1456***
26.19 89.78 189.79 235.71 14.32 49.15 79.33 91.36 13.90 47.73 76.43 90.30
Low – High analyst coverage 0.0349*** 0.0685*** 0.1024*** 0.1304*** 0.0174* 0.0413*** 0.0772*** 0.1015*** 0.0167 0.0403*** 0.0756*** 0.0980***
6.83 12.27 24.35 47.01 2.79 8.25 19.41 26.17 2.57 7.85 18.61 24.42

51
Table VII Long-Run Returns – Ibbotson RATS Method – cont’d
D. U.S. dollar returns, regional factors (including U.S. buybacks)
One-factor model Three-factor model Four-factor model
Months relative to ann. date (+1,+12) (+1,+24) (+1,+36) (+1,+48) (+1,+12) (+1,+24) (+1,+36) (+1,+48) (+1,+12) (+1,+24) (+1,+36) (+1,+48)
All buyback announcements 0.0810*** 0.2113*** 0.3345*** 0.4127*** 0.0472*** 0.1179*** 0.1887*** 0.2330*** 0.0627*** 0.1378*** 0.2106*** 0.2586***
58.06 169.16 341.24 299.56 47.22 135.27 216.22 198.55 101.77 204.74 256.27 236.41
High U-index 0.1094*** 0.3226*** 0.4532*** 0.5443*** 0.0667*** 0.2091*** 0.3030*** 0.3695*** 0.0893*** 0.2366*** 0.3315*** 0.3976***
38.15 202.78 265.43 197.22 19.22 103.24 117.38 130.01 33.82 112.39 126.75 130.93
Low U-index 0.0641*** 0.1567*** 0.2591*** 0.3205*** 0.0395*** 0.0850*** 0.1399*** 0.1709*** 0.0480*** 0.0991*** 0.1557*** 0.1926***
30.08 72.92 178.89 203.77 22.68 44.82 95.96 114.51 39.50 74.13 130.54 153.62
High – Low U-index 0.0453** 0.1659*** 0.1942*** 0.2238*** 0.0272 0.1241*** 0.1631*** 0.1986*** 0.0413** 0.1375*** 0.1758*** 0.2051***
6.03 45.84 49.61 46.79 2.65 28.00 31.41 40.56 6.27 35.85 37.45 41.34
Board approval 0.0721*** 0.2115*** 0.3607*** 0.4534*** 0.0464*** 0.1264*** 0.2155*** 0.2660*** 0.0654*** 0.1497*** 0.2379*** 0.2926***
29.88 104.32 244.27 285.66 31.53 99.74 186.59 219.64 81.34 161.09 216.57 256.42
Shareholder approval 0.1002*** 0.2039*** 0.2677*** 0.3138*** 0.0524*** 0.1072*** 0.1354*** 0.1747*** 0.0562*** 0.1135*** 0.1469*** 0.1872***
57.76 125.93 182.97 89.56 25.38 63.71 76.83 56.07 27.89 72.43 90.30 60.33
Board – Shareholder approval -0.0281 0.0076 0.0930*** 0.1397*** -0.0059 0.0192 0.0801*** 0.0914*** 0.0092 0.0362** 0.091*** 0.1054***
2.27 0.08 9.35 10.72 0.20 1.09 13.17 9.64 0.51 4.14 16.56 12.15
Low analyst coverage 0.0955*** 0.2413*** 0.3765*** 0.4702*** 0.0556*** 0.1414*** 0.2332*** 0.2973*** 0.0673*** 0.1564*** 0.2496*** 0.3129***
60.87 184.81 382.54 265.67 43.81 141.36 232.73 187.41 73.77 180.40 253.88 196.96
High analyst coverage 0.0663*** 0.1798*** 0.2917*** 0.3523*** 0.0399*** 0.0976*** 0.1500*** 0.1763*** 0.0600*** 0.1230*** 0.1783*** 0.2120***
31.20 91.19 183.17 234.34 22.41 61.67 99.23 129.21 67.41 123.50 154.17 212.55
Low – High analyst coverage 0.0293** 0.0615*** 0.0848*** 0.1179*** 0.0157 0.0438*** 0.0832*** 0.121*** 0.0072 0.0334*** 0.0713*** 0.1009***
6.16 12.76 19.43 27.19 2.70 11.15 24.29 34.10 0.64 7.45 20.72 26.26

52
Table VIII Changes in Risk Exposure around the Buyback Announcement
The table reports the distribution of the estimates of the loadings on the market factor before and after the
buyback announcement, for each buyback firm. The estimates are obtained as follows. For each buyback firm , the following one-factor model is estimated:
( ) ( ) ( )( )
where is an indicator variable equal to 1 if calendar month precedes the buyback announcement month (i.e.
months -6 to -1 relative to the announcement month), 0 otherwise (i.e. months 0 to +48 relative to the
announcement month), and and are the market return and the riskfree rate of return. The coefficient
estimates for each buyback firm are then stored, and the table describes their distribution. The table reports the
distribution of the market beta estimates before (columns labelled “Before”) and after (columns labelled
“After”) the buyback announcement. All models are estimated on local currency returns, using local factor
models. The sample consists of open-market repurchase announcements, over the period 1998-2008, by non-US
firms, from the 31 countries listed in the appendix, plus U.S. announcements over the same period. Repurchase
announcements are obtained from the SDC Mergers and Acquisitions and Repurchases datasets.
One-Factor
Market beta
Before After
(1) (2)
Mean estimate 0.6688 0.7821
Standard deviation 4.5954 0.9639
Min -468.26 -12.778
Percentile 5 -1.7793 -0.1792
Median 0.5664 0.6539
Percentile 95 3.7509 2.2241
Max 52.379 45.037

53
Table IX Long-Run Returns and Changes in Risk Exposure Around the Buyback Announcement
The table reports the cumulative long-run abnormal returns on portfolios of repurchasing firms, obtained using the Ibbotson (1975) Returns Across Time and Securities (RATS) method. In panel
A, the results are based on local currency returns, and local factor models for the expected returns. In panel B, the results are based on U.S. dollar returns, and the regional factors used in Fama and
French (2012). Both panels report estimates of the cumulative abnormal returns over horizons spanning 12, 24, 36, and 48 months following the buyback announcement date, using one-, three-,
and four-factor models. The rows labelled “Beta increase”, “Beta decrease”, and “Beta increase – decrease” refer to a partition of the sample based on the change in market beta from the one-factor
model from before to after the buyback announcement. The distribution of the market beta estimates is described in Table VIII, Panel A (columns (1)-(2)). The cumulative abnormal returns in the
rows labelled “Beta increase”, “Beta decrease”, and “Beta increase – decrease” are obtained by running the Ibbotson (1975) RATS method separately for buyback announcements in the “Beta
increase” and “Beta decrease” groups, and then combining the estimated monthly abnormal returns to obtain cumulative abnormal returns. For each horizon, factor model, and sample partition, the
table reports the estimate of the cumulative abnormal return, as well as the associated chi-square test statistic. This test statistic corresponds to the one used by Peyer and Vermaelen (2009), with
the difference that in this case the standard errors account for clustering around buyback firm nation and announcement calendar month. In both panels, the sample consists of open-market
repurchase announcements, over the period 1998-2008, by non-US firms, from the 31 countries listed in the appendix, plus U.S. announcements over the same period. Repurchase announcements
are obtained from the SDC Mergers and Acquisitions and Repurchases datasets. The symbols *, **, and *** denote statistical significance at the 10%, 5%, and 1% levels.
A. Local currency returns, local factors
One-factor model Three-factor model Four-factor model
Months relative to ann. date (+1,+12) (+1,+24) (+1,+36) (+1,+48) (+1,+12) (+1,+24) (+1,+36) (+1,+48) (+1,+12) (+1,+24) (+1,+36) (+1,+48)
Beta increase 0.0957*** 0.2290*** 0.3343*** 0.3963*** 0.0553*** 0.1256*** 0.1806*** 0.2055*** 0.0542*** 0.1234*** 0.1777*** 0.2030***
55.74 147.14 245.99 205.54 29.14 70.88 82.00 71.20 28.10 68.81 79.54 69.62
Beta decrease 0.0606*** 0.1794*** 0.3039*** 0.3778*** 0.0316*** 0.0909*** 0.1520*** 0.1750*** 0.0309*** 0.0899*** 0.1496*** 0.1723***
24.47 100.45 279.93 346.69 11.95 50.80 115.33 127.99 11.53 49.83 111.64 124.15
Beta increase - decrease 0.0351*** 0.0496*** 0.0304* 0.0185 0.0237* 0.0347** 0.0286 0.0306 0.0233* 0.0336* 0.0281 0.0307
7.00 7.01 2.80 0.75 3.66 4.10 2.01 1.93 3.54 3.85 1.96 1.96
B. U.S. dollar returns, regional factors
One-factor model Three-factor model Four-factor model
(+1,+12) (+1,+24) (+1,+36) (+1,+48) (+1,+12) (+1,+24) (+1,+36) (+1,+48) (+1,+12) (+1,+24) (+1,+36) (+1,+48)
Beta increase 0.0990*** 0.2378*** 0.3390*** 0.4083*** 0.0598*** 0.1414*** 0.2060*** 0.2507*** 0.0712*** 0.1546*** 0.2249*** 0.2786***
72.95 193.73 254.53 185.93 41.10 109.91 114.73 107.63 57.21 126.76 132.60 131.12
Beta decrease 0.0633*** 0.1866*** 0.3276*** 0.4108*** 0.0364*** 0.1000*** 0.1755*** 0.2165*** 0.0560*** 0.1263*** 0.2006*** 0.2410***
22.69 88.93 274.54 340.41 15.55 53.65 140.20 178.52 49.10 115.30 193.06 230.39
Beta increase - decrease 0.0357** 0.0512*** 0.0114 -0.0025 0.0234* 0.0414** 0.0305 0.0342 0.0152 0.0283 0.0242 0.0376*
6.72 7.06 0.37 0.01 3.44 5.07 1.99 2.11 1.59 2.96 1.37 2.74

54
Table X Long-Run Returns and Quality of Corporate Governance
The table reports the cumulative long-run abnormal returns on portfolios of repurchasing firms, obtained using the Ibbotson (1975) Returns Across Time and Securities (RATS) method.
In panel A, the results are based on local currency returns, and local factor models for the expected returns. In panel B, the results are based on U.S. dollar returns, and the regional factors
used in Fama and French (2012). Both panels report estimates of the cumulative abnormal returns over horizons spanning 12, 24, 36, and 48 months following the buyback announcement
date, using one-, three-, and four-factor models. The rows labelled “High CGQ index”, “Low CGQ index”, and “High – Low index” refer to a partition of the sample based on the CGQ
index, described in the appendix. A given firm belongs to the “High CGQ index” (“Low CGQ index”) group if its CGQ index is above the 50th
percentile, or median (below the median)
of the CGQ index distribution among all firms announcing a buyback. The cumulative abnormal returns in the rows labelled “High CGQ index”, “Low CGQ index”, and “High – Low
CGQ index” are obtained by running the Ibbotson (1975) RATS method separately for buyback announcements in the “High CGQ index” and “Low CGQ index” groups, and then
combining the estimated monthly abnormal returns to obtain cumulative abnormal returns. For each horizon, factor model, and sample partition, the table reports the estimate of the
cumulative abnormal return, as well as the associated chi-square test statistic. This test statistic corresponds to the one used by Peyer and Vermaelen (2009), with the difference that in
this case the standard errors account for clustering around buyback firm nation and announcement calendar month. In both panels, the sample consists of open-market repurchase
announcements, over the period 1998-2008, by non-US firms, from the 31 countries listed in the appendix, plus U.S. announcements over the same period. Repurchase announcements
are obtained from the SDC Mergers and Acquisitions and Repurchases datasets. The symbols *, **, and *** denote statistical significance at the 10%, 5%, and 1% levels.
A. Local currency returns, local factors
One-factor model Three-factor model Four-factor model
Months relative to ann. date (+1,+12) (+1,+24) (+1,+36) (+1,+48) (+1,+12) (+1,+24) (+1,+36) (+1,+48) (+1,+12) (+1,+24) (+1,+36) (+1,+48)
High CGQ index 0.0554*** 0.1745*** 0.2786*** 0.3412*** 0.0296** 0.0913*** 0.1353*** 0.1576*** 0.0351*** 0.0985*** 0.1437*** 0.1695***
15.77 69.82 115.26 120.35 8.22 37.22 49.24 51.30 12.53 43.53 56.34 60.23
Low CGQ index 0.0811*** 0.1994*** 0.3156*** 0.3911*** 0.0490*** 0.1065*** 0.1634*** 0.2018*** 0.0590*** 0.1193*** 0.1785*** 0.2206***
37.61 88.30 134.05 142.00 19.81 41.65 56.68 67.56 30.07 50.39 67.04 78.73
High – Low index -0.0257** -0.0249* -0.0370** -0.0500*** -0.0193** -0.0152 -0.0281 -0.0442** -0.0239** -0.0208 -0.0348** -0.0511***
6.00 3.04 4.56 7.17 3.93 1.07 2.67 5.96 5.67 1.87 3.96 7.87
B. U.S. dollar returns, regional factors
One-factor model Three-factor model Four-factor model
Months relative to ann. date (+1,+12) (+1,+24) (+1,+36) (+1,+48) (+1,+12) (+1,+24) (+1,+36) (+1,+48) (+1,+12) (+1,+24) (+1,+36) (+1,+48)
High CGQ index 0.0566*** 0.1738*** 0.2774*** 0.3407*** 0.0316*** 0.0913*** 0.1369*** 0.1641*** 0.0485*** 0.1109*** 0.1580*** 0.1913***
16.90 67.89 111.33 116.08 11.09 42.76 55.76 60.70 34.34 69.34 77.76 84.45
Low CGQ index 0.0799*** 0.1965*** 0.3115*** 0.3848*** 0.0478*** 0.1054*** 0.1641*** 0.2015*** 0.0655*** 0.1266*** 0.1864*** 0.2304***
37.18 84.74 127.08 132.84 20.41 43.18 56.48 66.43 42.24 59.85 72.67 84.77
High – Low index -0.0234** -0.0227 -0.0341** -0.0441** -0.0162 -0.0141 -0.0272 -0.0374** -0.0170 -0.0158 -0.0284 -0.0391**
4.96 2.53 3.86 5.60 2.71 0.94 2.50 4.23 2.70 1.10 2.69 4.67

55
Table XI Long-Run Returns and Completion Rates
The table reports the cumulative long-run abnormal returns on portfolios of repurchasing firms, obtained using the Ibbotson (1975) Returns Across Time and Securities (RATS) method.
In panel A, the results are based on local currency returns, and local factor models for the expected returns. In panel B, the results are based on U.S. dollar returns, and the regional
factors used in Fama and French (2012). Both panels report estimates of the cumulative abnormal returns over horizons spanning 12, 24, 36, and 48 months following the buyback
announcement date, using one-, three-, and four-factor models. The rows labelled “High completion rate”, “Low completion rate”, and “High – Low completion rate” refer to a partition
of the sample based on the buyback announcement’s completion rate, estimated as described in the text. A given firm belongs to the “High completion rate” (“Low completion rate”)
group if its completion rate is above the 50th
percentile, or median (below the median) of the completion rate distribution among all firms announcing a buyback. The cumulative
abnormal returns in the rows labelled “High completion rate”, “Low completion rate”, and “High – Low completion rate” are obtained by running the Ibbotson (1975) RATS method
separately for buyback announcements in the “High completion rate” and “Low completion rate” groups, and then combining the estimated monthly abnormal returns to obtain
cumulative abnormal returns. For each horizon, factor model, and sample partition, the table reports the estimate of the cumulative abnormal return, as well as the associated chi-square
test statistic. This test statistic corresponds to the one used by Peyer and Vermaelen (2009), with the difference that in this case the standard errors account for clustering around buyback
firm nation and announcement calendar month. The sample consists of open-market repurchase announcements, over the period 1998-2008, by non-US firms, from the 31 countries
listed in the appendix. Repurchase announcements are obtained from the SDC Mergers and Acquisitions and Repurchases datasets. The symbols *, **, and *** denote statistical
significance at the 10%, 5%, and 1% levels.
A. Local currency returns, local factors
One-factor model Three-factor model Four-factor model
Months relative to ann. date (+1,+12) (+1,+24) (+1,+36) (+1,+48) (+1,+12) (+1,+24) (+1,+36) (+1,+48) (+1,+12) (+1,+24) (+1,+36) (+1,+48)
High completion rate 0.1236*** 0.2236*** 0.2916*** 0.3768*** 0.0834*** 0.1398*** 0.1594*** 0.2055*** 0.0799*** 0.1359*** 0.1523*** 0.1955***
35.97 67.06 81.68 139.82 18.36 31.90 31.63 42.98 17.06 30.65 28.99 38.92
Low completion rate 0.0837*** 0.2059*** 0.3115*** 0.3524*** 0.0443*** 0.1079*** 0.1724*** 0.1768*** 0.0424*** 0.1025*** 0.1639*** 0.1659***
26.09 68.18 157.77 236.04 21.39 57.87 110.63 78.76 19.54 52.48 99.80 71.51
High – Low completion rate 0.0399** 0.0177 -0.0199 0.0244 0.0391** 0.0319 -0.0130 0.0287 0.0376** 0.0334 -0.0116 0.0296
4.96 0.50 0.44 0.48 4.47 1.63 0.22 0.77 4.16 1.83 0.18 0.82
B. U.S. dollar returns, regional factors
One-factor model Three-factor model Four-factor model
Months relative to ann. date (+1,+12) (+1,+24) (+1,+36) (+1,+48) (+1,+12) (+1,+24) (+1,+36) (+1,+48) (+1,+12) (+1,+24) (+1,+36) (+1,+48)
High completion rate 0.0973*** 0.2082*** 0.2869*** 0.3807*** 0.0745*** 0.1540*** 0.2001*** 0.2762*** 0.0634*** 0.1405*** 0.2152*** 0.2603***
37.37 83.09 101.48 95.32 22.53 53.65 64.51 70.00 47.22 137.92 202.95 119.45
Low completion rate 0.1062*** 0.2308*** 0.3385*** 0.3966*** 0.0608*** 0.1370*** 0.2101*** 0.2584*** 0.0727*** 0.1648*** 0.2116*** 0.2872***
105.97 266.48 405.77 174.86 44.67 127.81 186.98 114.79 23.28 70.70 82.01 84.53
High – Low completion rate -0.0089 -0.0226 -0.0517* -0.0160 0.0136 0.0171 -0.0100 0.0178 0.0093 0.0243 -0.0035 0.0269
0.27 0.98 2.87 0.20 0.62 0.54 0.14 0.29 0.30 1.21 0.02 0.69

56
Table XII Long-Run Returns and Takeover Targets
The table reports the cumulative long-run abnormal returns on portfolios of repurchasing firms, obtained using the Ibbotson (1975) Returns Across Time and Securities (RATS) method.
In panel A, the results are based on local currency returns, and local factor models for the expected returns. In panel B, the results are based on U.S. dollar returns, and the regional
factors used in Fama and French (2012). Both panels report estimates of the cumulative abnormal returns over horizons spanning 12, 24, 36, and 48 months following the buyback
announcement date, using one-, three-, and four-factor models. The rows labelled “Takeover target”, “Not takeover target”, and “Target – Not target” refer to a partition of the sample
based on whether the buyback firm is the target of a takeover attempt, or delists, within three years from the buyback announcement. The cumulative abnormal returns in the rows
labelled “Takeover target”, “Not takeover target”, and “Target – Not target” are obtained by running the Ibbotson (1975) RATS method separately for buyback announcements in the
“High completion rate” and “Low completion rate” groups, and then combining the estimated monthly abnormal returns to obtain cumulative abnormal returns. For each horizon, factor
model, and sample partition, the table reports the estimate of the cumulative abnormal return, as well as the associated chi-square test statistic. This test statistic corresponds to the one
used by Peyer and Vermaelen (2009), with the difference that in this case the standard errors account for clustering around buyback firm nation and announcement calendar month. The
sample consists of open-market repurchase announcements, over the period 1998-2008, by non-US firms, from the 31 countries listed in the appendix. Repurchase announcements are
obtained from the SDC Mergers and Acquisitions and Repurchases datasets. The symbols *, **, and *** denote statistical significance at the 10%, 5%, and 1% levels.
A. Local currency returns, local factors
One-factor model Three-factor model Four-factor model
Months relative to ann. date (+1,+12) (+1,+24) (+1,+36) (+1,+48) (+1,+12) (+1,+24) (+1,+36) (+1,+48) (+1,+12) (+1,+24) (+1,+36) (+1,+48)
Takeover target 0.0489 0.1821*** 0.2120*** 0.2338*** 0.0220 0.1327*** 0.1545*** 0.2026*** 0.0150 0.1262** 0.1438* 0.1922***
2.20 15.32 12.42 11.85 0.51 8.42 6.88 8.54 0.24 7.54 5.84 8.33
Not takeover target 0.1010*** 0.2148*** 0.3096*** 0.3662*** 0.0593*** 0.1193*** 0.1687*** 0.1864*** 0.0567*** 0.1140*** 0.1599*** 0.1756***
44.59 90.44 175.11 318.87 31.35 70.17 104.00 91.01 29.05 64.69 93.09 82.58
Target – Not target -0.0521* -0.0327 -0.0975* -0.1324* -0.0373 0.0134 -0.0142 0.0161 -0.0418 0.0123 -0.0161 0.0165
3.15 0.56 2.96 3.74 1.49 0.09 0.06 0.05 1.89 0.07 0.08 0.06
B. U.S. dollar returns, regional factors
One-factor model Three-factor model Four-factor model
Months relative to ann. date (+1,+12) (+1,+24) (+1,+36) (+1,+48) (+1,+12) (+1,+24) (+1,+36) (+1,+48) (+1,+12) (+1,+24) (+1,+36) (+1,+48)
Takeover target 0.1062*** 0.2278*** 0.3279*** 0.3995*** 0.0693*** 0.1457*** 0.2087*** 0.2671*** 0.0735*** 0.1528*** 0.2179*** 0.2763***
107.13 267.36 350.27 163.03 58.00 143.51 181.25 118.42 64.85 164.58 217.53 138.12
Not takeover target 0.0589* 0.1778*** 0.2188*** 0.2600*** 0.0255 0.1321*** 0.1574*** 0.1991*** 0.0276 0.1341*** 0.1545*** 0.1846***
4.25 22.25 23.12 30.01 0.87 11.50 11.38 17.15 0.98 11.93 10.90 15.09
Target – Not target -0.0474 -0.0500 -0.1091** -0.1395*** -0.0438 -0.0136 -0.0512 -0.0680 -0.0459 -0.0186 -0.0634 -0.0918*
2.67 1.72 5.40 7.70 2.33 0.11 1.14 1.86 2.43 0.21 1.71 3.36
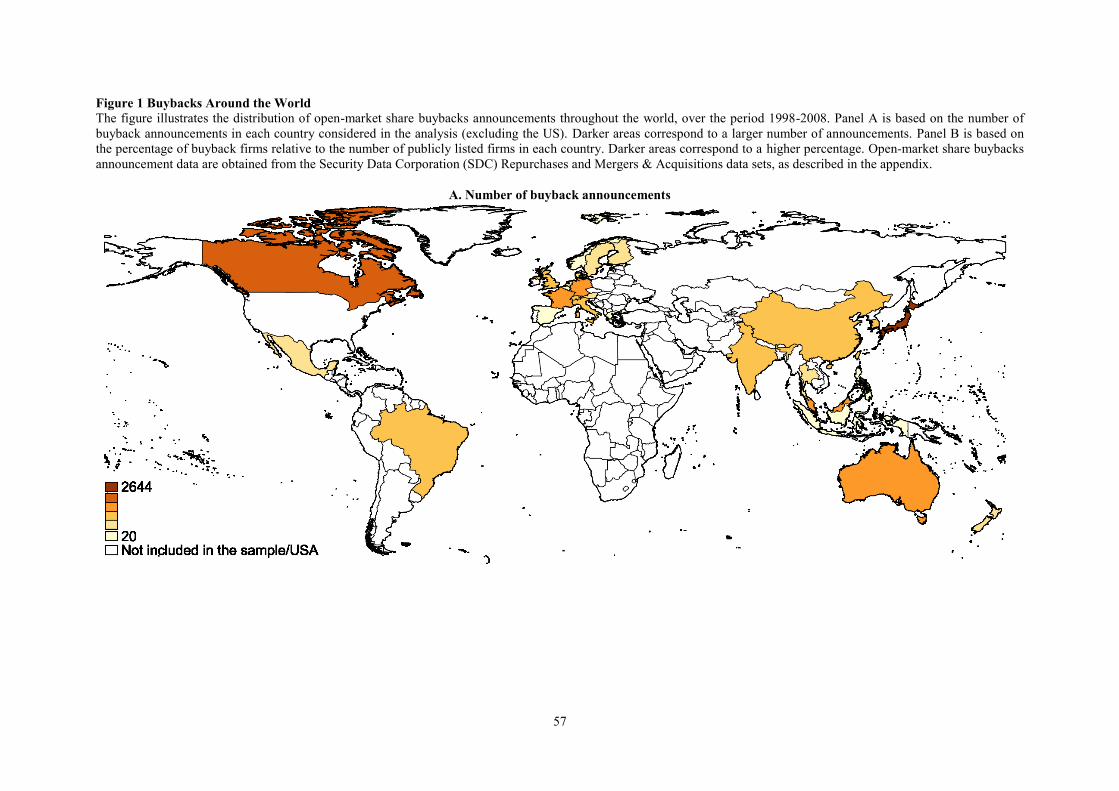
57
Figure 1 Buybacks Around the World
The figure illustrates the distribution of open-market share buybacks announcements throughout the world, over the period 1998-2008. Panel A is based on the number of
buyback announcements in each country considered in the analysis (excluding the US). Darker areas correspond to a larger number of announcements. Panel B is based on
the percentage of buyback firms relative to the number of publicly listed firms in each country. Darker areas correspond to a higher percentage. Open-market share buybacks
announcement data are obtained from the Security Data Corporation (SDC) Repurchases and Mergers & Acquisitions data sets, as described in the appendix.
A. Number of buyback announcements

58
Figure 1 Buybacks Around the World – cont’d
B. Buyback firms as a percentage of all publicly traded firms

59
Figure 2 Sample Breakdown by Legal Origin
The chart reports a breakdown of the sample by announcement year and legal origin. Each bar represents the
number of open-market repurchase announcements per year. Different colors are used for announcements by
firms from countries with different legal origin: French, German, and Scandinavian civil law, and English
Common law (LaPorta et al., 1998, Djankov et al., 2007, Siems, 2007). The numbers above each bar report the
total number of buyback announcements in the corresponding year. The sample consists of open-market
buyback announcements, over the period 1998-2008, by non-US firms from the 31 countries listed in the
appendix. Buyback announcements are obtained from the SDC Mergers and Acquisitions and Repurchases
datasets, as described above.
1998 1999 2000 2001 2002 2003 2004 2005 2006 2007 2008
Scandinavian Civil Law
German Civil Law
French Civil Law
English Common Law
452
590
521 494
786
1120
468 464
527
700
1282

60
Figure 3 Announcement Returns
The graph plots the cumulative average abnormal return around the buyback announcement date. On a given day and for a given buyback stock, the abnormal return is
defined as the difference between the stock return and the return on the market index. The sample consists of open-market buyback announcements, over the period 1998-
2008, by non-US firms, from the 31 countries listed in the appendix. Buyback announcements are obtained from the SDC Mergers and Acquisitions and Repurchases
datasets.
-0.015
-0.010
-0.005
0.000
0.005
0.010
0.015
0.020
-30 -20 -10 0 10 20 30
Cu
mu
lati
ve A
bn
orm
al R
etu
rn
Days Relative to the Announcement Date

61
Figure 4 Long-Run Returns – Ibbotson (1975) RATS method
The figure plots the cumulative abnormal return over the period (-6,+48) months relative to the announcement date. The monthly abnormal returns are obtained using
Ibbotson (1975) RATS, combined with the four-factor, based on local currency returns and local factors. The sample consists of open-market buyback announcements, over
the period 1998-2008, by non-US firms, from the 31 countries listed in the appendix. Buyback announcements are obtained from the SDC Mergers and Acquisitions and
Repurchases datasets.
0.00
0.05
0.10
0.15
0.20
-6 0 6 12 18 24 30 36 42 48
Cu
mu
lati
ve A
bn
orm
al R
etu
rn
Months Relative to the Announcement Date

62
Figure 5 Long-Run Returns, Buybacks with High/Low U-Index
The figure plots the cumulative abnormal return over the period (-6,+48) months relative to the announcement date. The monthly abnormal returns are obtained using
Ibbotson (1975) RATS, combined with the four-factor, and are estimated separately for buyback announcements in the “High U-index” and “Low U-index” groups, defined
above and in detail in the text. In panel A, the RATS method is based on local currency returns and local factors. In panel B, it is based on U.S. dollar returns and regional
factors. The sample consists of open-market buyback announcements, over the period 1998-2008, by non-US firms, from the 31 countries listed in the appendix. Buyback
announcements are obtained from the SDC Mergers and Acquisitions and Repurchases datasets.
A. Local currency returns and local factors
-0.05
0.00
0.05
0.10
0.15
0.20
0.25
-6 0 6 12 18 24 30 36 42 48
Cu
mu
lati
ve A
bn
orm
al R
etu
rn
Months Relative to the Announcement Date
Low U-index
High U-index
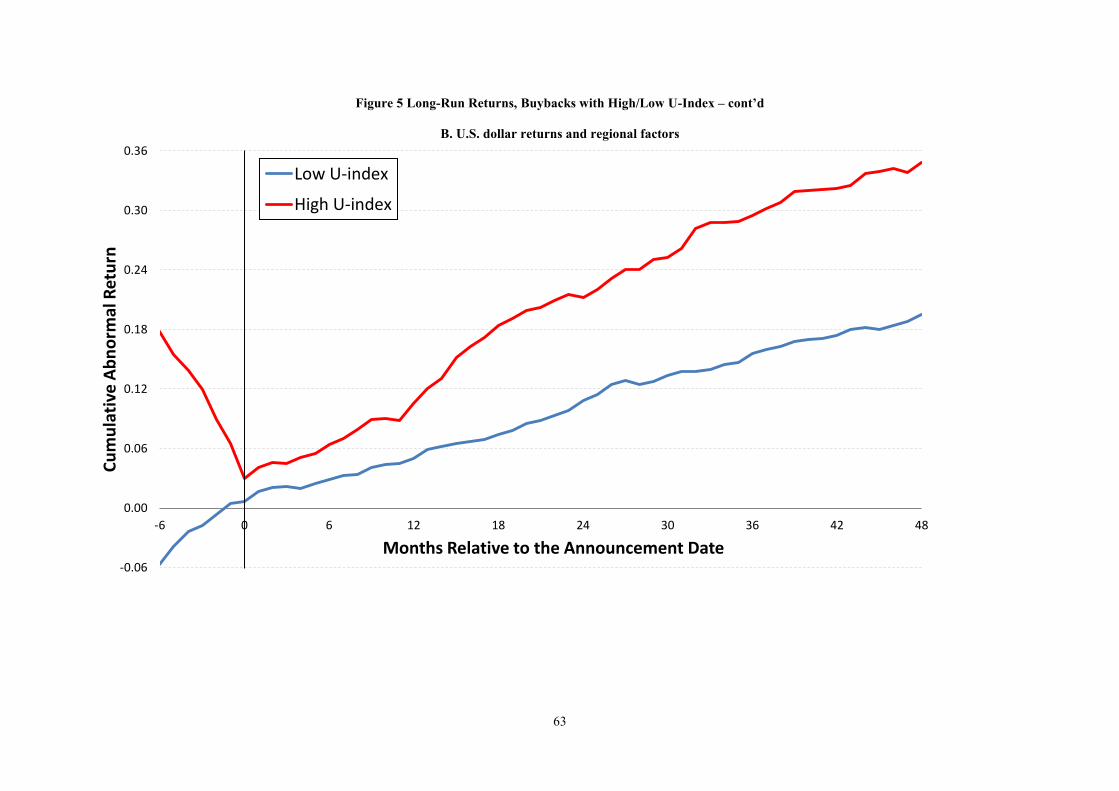
63
Figure 5 Long-Run Returns, Buybacks with High/Low U-Index – cont’d
B. U.S. dollar returns and regional factors
-0.06
0.00
0.06
0.12
0.18
0.24
0.30
0.36
-6 0 6 12 18 24 30 36 42 48
Cu
mu
lati
ve A
bn
orm
al R
etu
rn
Months Relative to the Announcement Date
Low U-index
High U-index

64
Figure 6 Analyst EPS Forecast Revisions Prior to the Buyback Announcement
The graph illustrates analyst EPS forecast revisions over the six-month period prior to the buyback announcements,
for buyback firms in the “High U-index” and “Low U-index groups” defined above and in the text. For each
buyback firm and month t relative to the announcement date, the analyst forecast revision ( ( ) ( ))
( ) is calculated, where EPS(t) the average one-year-ahead EPS forecast in a given month t relative to the
announcement month (t = 0 denotes the announcement month itself), and P(0) the stock price in the announcement
month. The graph plots the average forecast revision across firms with high/low U-index. Analyst EPS forecasts are
retrieved from the IBES international database.
-0.75%
0.00%
0.75%
1.50%
2.25%
3.00%
-6 -5 -4 -3 -2 -1
Months Relative to the Announcement Date
High U-index
Low U-index