Business Tax Reform and Economic Growth - … · Business Tax Reform and Economic Growth ... RICs...
20
Business Tax Reform and Economic Growth Jason Furman Chairman, Council of Economic Advisers September 22, 2014
Transcript of Business Tax Reform and Economic Growth - … · Business Tax Reform and Economic Growth ... RICs...

Business Tax Reform and Economic Growth
Jason Furman Chairman, Council of Economic Advisers
September 22, 2014

1
Economic Recovery and Economic Growth
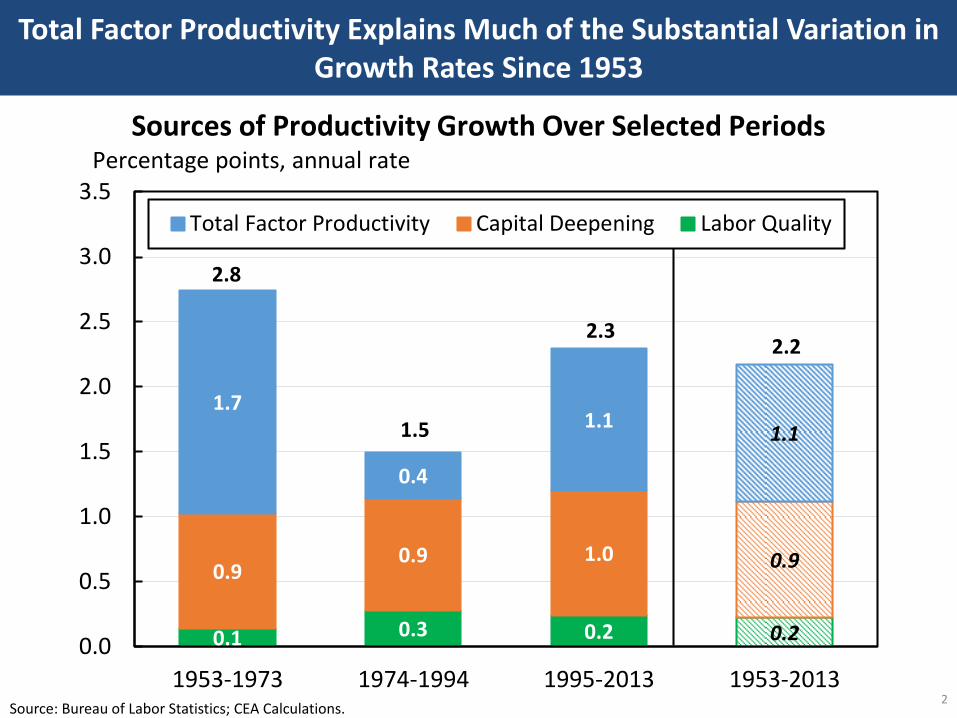
Total Factor Productivity Explains Much of the Substantial Variation in Growth Rates Since 1953
2
0.1 0.3 0.2 0.2
0.90.9 1.0 0.9
1.7
0.4
1.11.1
2.8
1.5
2.32.2
0.0
0.5
1.0
1.5
2.0
2.5
3.0
3.5
1953-1973 1974-1994 1995-2013 1953-2013
Total Factor Productivity Capital Deepening Labor Quality
Sources of Productivity Growth Over Selected PeriodsPercentage points, annual rate
Source: Bureau of Labor Statistics; CEA Calculations.
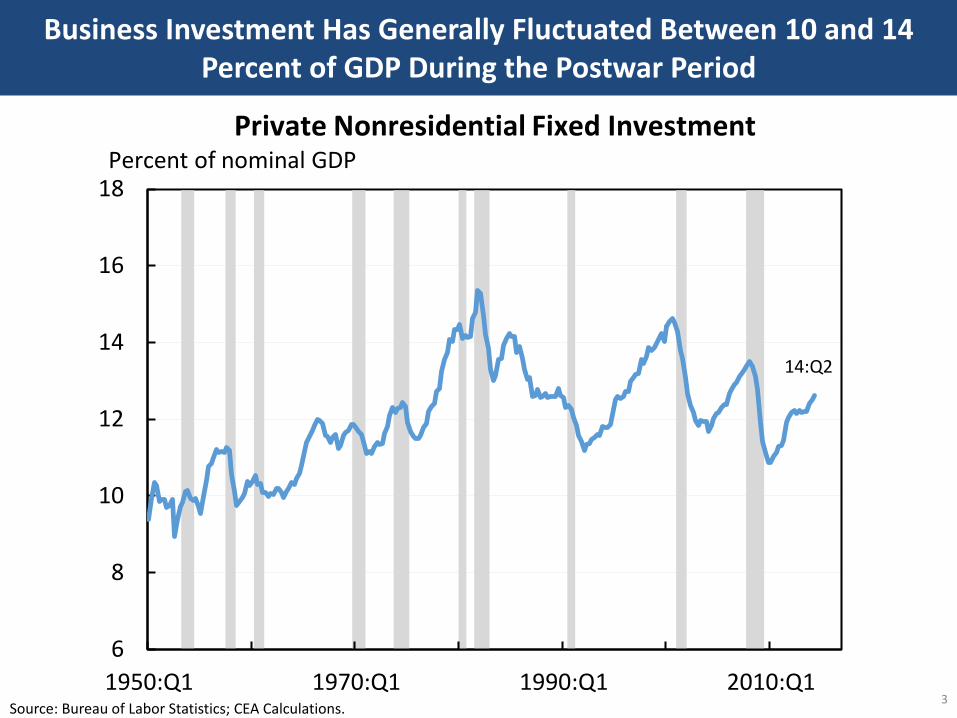
Business Investment Has Generally Fluctuated Between 10 and 14 Percent of GDP During the Postwar Period
3 Source: Bureau of Labor Statistics; CEA Calculations.
6
8
10
12
14
16
18
1950:Q1 1970:Q1 1990:Q1 2010:Q1
Private Nonresidential Fixed InvestmentPercent of nominal GDP
14:Q2
4
The Fundamental Underpinnings of Business Tax Reform

The Fundamental Underpinnings of Business Tax Reform
5
1.In general the tax system should strive for neutrality.
2. In carefully delineated specific cases, the tax system should deviate from neutrality to correct externalities.
3.The tax system should be simpler.

6
Shortcomings of the Current U.S. Business Tax System

The U.S. has Maintained a High Corporate Tax Rate Since the 1980s While Peer Countries Reduced Rates
7 Source: OECD.
25
30
35
40
45
50
55
1981 1985 1989 1993 1997 2001 2005 2009 2013
OECD Weighted Average (excluding U.S.)
United States
PercentStatutory Corporate Tax Rates in the U.S. and OECD

The U.S. has the Highest Corporate Tax Rate in the World
8
10
15
20
25
30
35
40
Irel
and
Slo
ven
ia
Cze
ch R
epu
blic
Hu
nga
ry
Po
lan
d
Ch
ile
Fin
lan
d
Icel
and
Turk
ey
Esto
nia
Un
ited
Kin
gdo
m
Swit
zerl
and
Slo
vak
Rep
ub
lic
Swed
en
Ko
rea
Den
mar
k
Au
stri
a
Net
her
lan
ds
Gre
ece
Can
ada
Isra
el
No
rway
Ital
y
New
Zea
lan
d
Luxe
mb
ou
rg
Au
stra
lia
Mex
ico
Spai
n
Ger
man
y
Po
rtu
gal
Bel
giu
m
Fran
ce
Jap
an
Un
ited
Sta
tes
Statutory Corporate Income Tax Rates, 2014Percent
OECD Weighted Average (excluding U.S.): 29.7
Source: OECD.
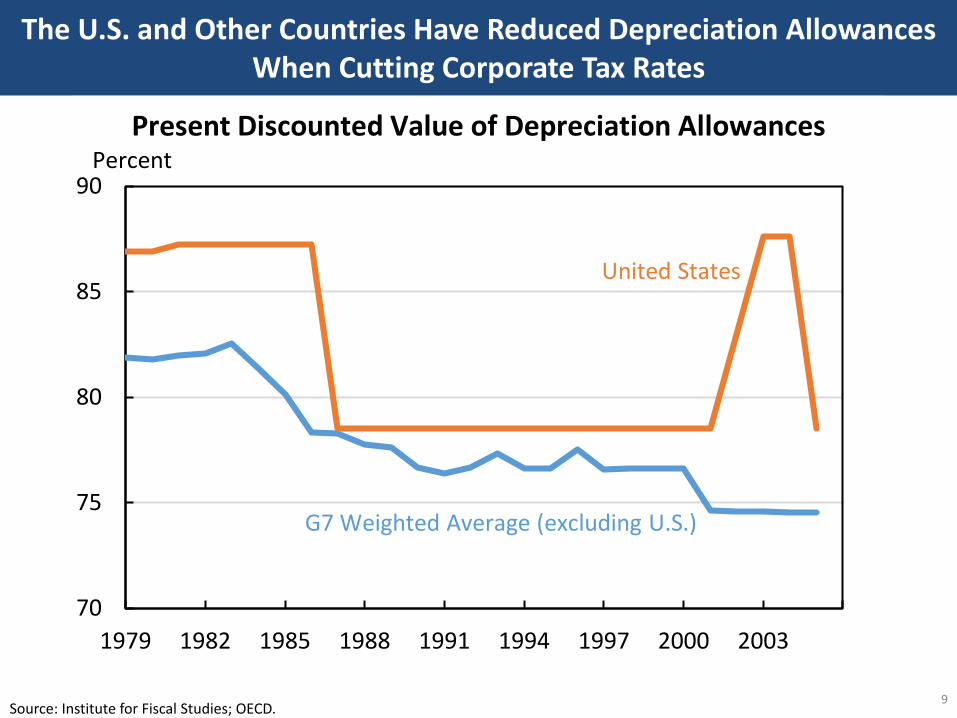
The U.S. and Other Countries Have Reduced Depreciation Allowances When Cutting Corporate Tax Rates
9
70
75
80
85
90
1979 1982 1985 1988 1991 1994 1997 2000 2003
Present Discounted Value of Depreciation AllowancesPercent
United States
G7 Weighted Average (excluding U.S.)
Source: Institute for Fiscal Studies; OECD.

U.S. Effective Marginal Tax Rates are in Line with Other G7 Countries
10 Source: U.S. Department of the Treasury; OECD.
2324
28 29
32 33
43
15
20
25
30
35
40
45
Germany Italy France UnitedStates
UnitedKingdom
Canada Japan
Effective Marginal Tax Rates, 2011
G7 Weighted Average(excluding U.S.):
31.7
Percent
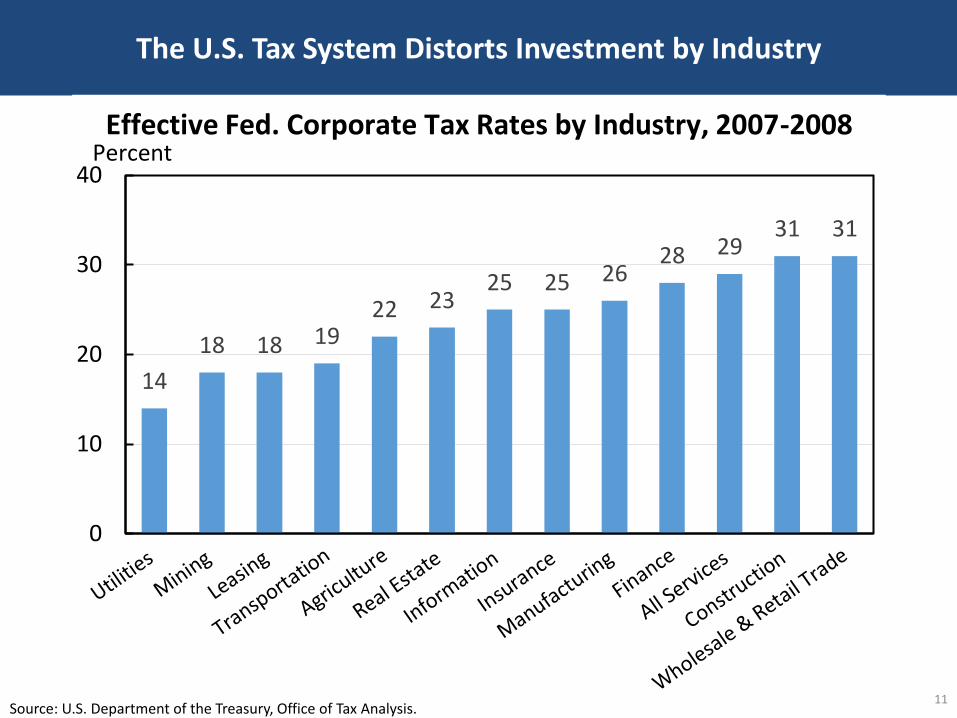
The U.S. Tax System Distorts Investment by Industry
11
14
18 18 1922 23
25 25 2628 29
31 31
0
10
20
30
40
Effective Fed. Corporate Tax Rates by Industry, 2007-2008Percent
Source: U.S. Department of the Treasury, Office of Tax Analysis.
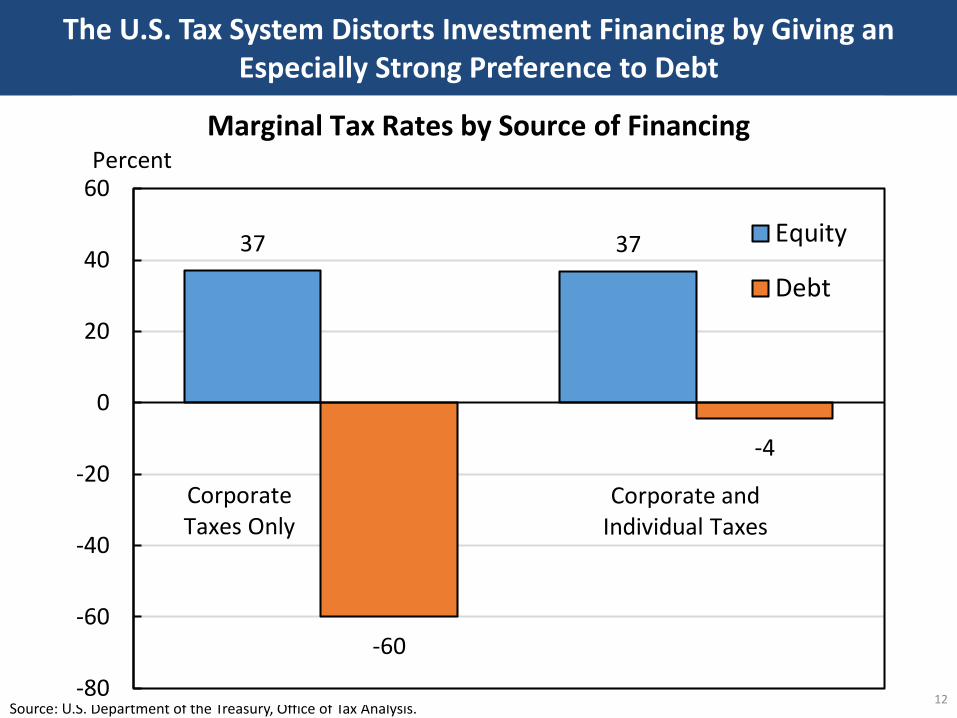
The U.S. Tax System Distorts Investment Financing by Giving an Especially Strong Preference to Debt
12 Source: U.S. Department of the Treasury, Office of Tax Analysis.
37 37
-60
-4
-80
-60
-40
-20
0
20
40
60
Equity
Debt
Marginal Tax Rates by Source of FinancingPercent
Corporate and Individual Taxes
CorporateTaxes Only

The U.S. Tax System Distorts the Form of Business by Disfavoring Large C Corporations
13
32
26
0
10
20
30
40
Effective Marginal Tax Rates on New Investment
Corporate Pass-through
Overall Business Tax Rate: 30.1
Percent
Source: U.S. Department of the Treasury, Office of Tax Analysis.

Business Receipts have Shifted Away from C Corporations
14
50
60
70
80
90
100
1980 1985 1990 1995 2000 2005 2010
C Corporation Share of Total Business ReceiptsPercent
Note: RICs and REITs excluded from both C corporation share and total. Source: IRS; CEA Calculations.

The U.S. Tax System Distorts the Location of Production and Profits
15 Source: IRS and United Nations; CEA Calculations.
Country
U.S. Controlled Foreign
Corporation Profits
Relative to GDP (2010)
Bahamas 104%
Bermuda 1,578%
British Virgin Islands 1,009%
Cayman Islands 1,430%
Cyprus 13%
Ireland 38%
Luxembourg 103%
Netherlands 15%
Netherlands Antilles 25%
16
The President’s Framework For Business Tax Reform

The President’s Framework For Business Tax Reform
17
• Cutting the corporate rate to 28 percent, paid for by closing loopholes and structural reforms.
• Making permanent, expanding and reforming key incentives.
• Establishing a hybrid international system with a minimum tax on the earnings of foreign subsidiaries.
• Simplifying and reducing taxes for small businesses.
• Funding immediate investments while being revenue neutral over the medium and long run.

18
Addressing Four Objections to the Approach to Tax Rates in the President’s
Framework For Business Tax Reform

The President’s Framework For Business Tax Reform: Addressing Four Objections
19
1. The Traditional Economist’s View: Tax Rate Reductions are a Windfall for Old Capital
2. The New Economist’s View: The Corporate Tax Rate Should be Zero
3. The Conservative View: The Top Individual Rate Needs to Be Cut with the Corporate Rate
4. The Progressive View: Corporate Loophole Closures Should Not Fund Rate Reductions