Business Plan Presentation - Simit Shop
35
Pamela Gutiérrez Daniela Uribe Eren Kongu Rafael González
-
Upload
eren-kongu -
Category
Small Business & Entrepreneurship
-
view
261 -
download
2
Transcript of Business Plan Presentation - Simit Shop

Pamela GutiérrezDaniela UribeEren Kongu
Rafael González

Modern
Warm
Fresh
Healthy
Service Experienc
e
Customization

Product
• What is a Simit?
• How do you prepare it?

SWOT Analysis
STRENGHTSNovelty ProductEasy to produce
Freshness. Prices
Culturally flexible.
WEAKNESSESNoveltyImage Culture
OPPORTUNITIESFirst mover advantage. Product transformation.
Expansion.
Franchising. Economic incentives.
THREATSSubstitute products.
Competition. Customer loyalty.

Target
Local
residents
Tourists
No gender discrimination
Only limited to infants
Medium and medium-high class, with medium and medium-high purchasing power

ADVERTISEMENT& PROMOTION
TASTING
SERVICE
Strategies

Marketing Expenses
Pop-up Banners Simit Tasting Flyers Total - €
500.00 €
1,000.00 €
1,500.00 €
2,000.00 €
2,500.00 €
3,000.00 €
3,500.00 €
Pop-up Banner
Simit Tasting Flyers Total
570.00 € 969.12 € 1,324.80 € 2,379.36 €
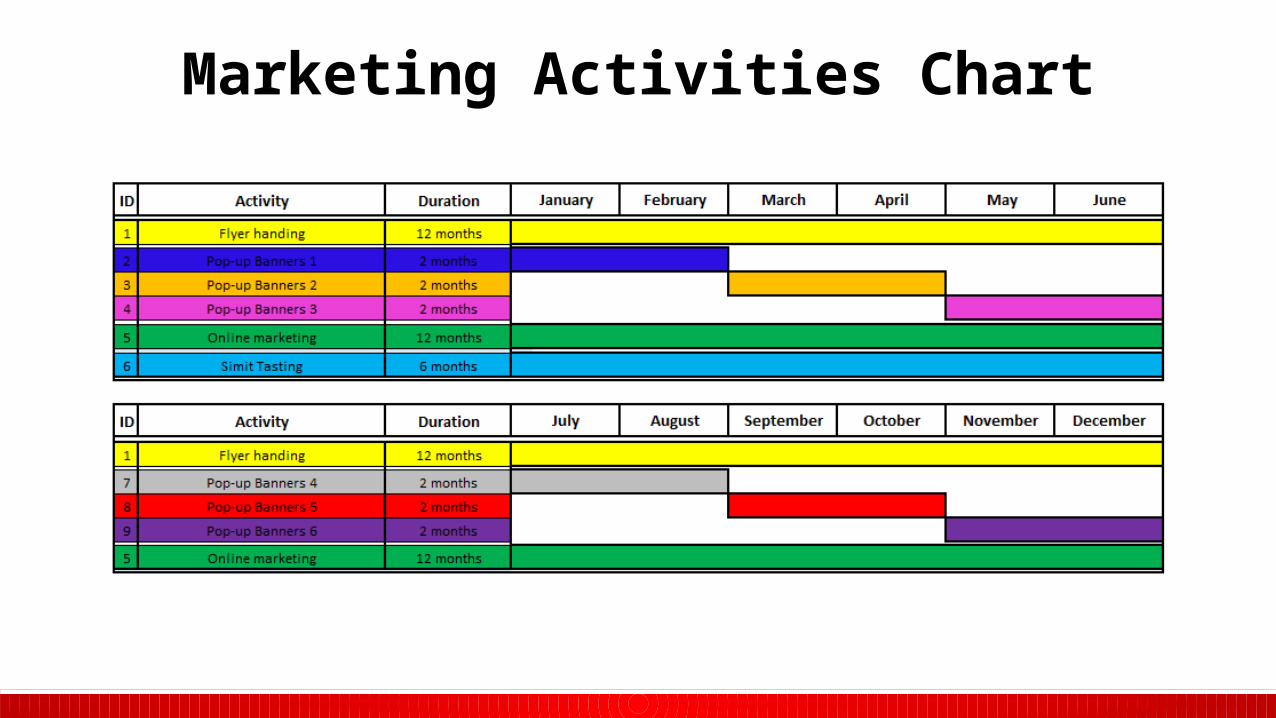
Marketing Activities Chart

Location

Distribution Plan
1-Ordering Area
2- Customization
3- Payment &Delivery
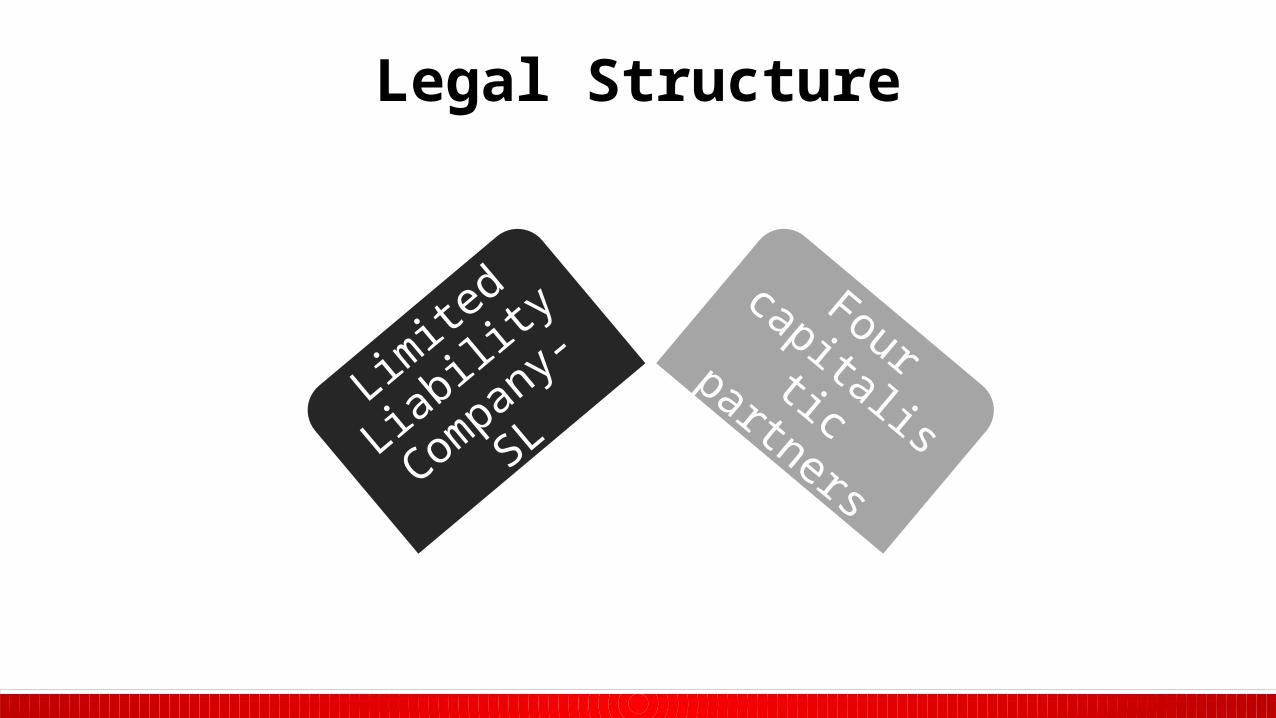
Legal Structure
Limite
d
Liabilit
y
Compan
y-
SL
Four
capitalistic
partners

Corporate Social Responsibility

Initial Investment
Equity Investment
Total start up capital expenditure
85,000 €
55,751 €

Projection Scenarios
Pessimistic 4%
Moderate 5%
Optimistic 6%

Food Consumption in Spain
100BN € were spent on food consumption in Spain, 2013.
32BN € were spent on “extradomestic” food consumption.
Average Ticket Price – 4.81 €
Simit Salty Simit
Sweet Simit
Coffee 1.5 cl
Beer 33cl
Soda 33cl
Water 33cl
2.00 € 4.00 € 3.00 € 1.20 € 1.50 € 2.00 € 1.00 €
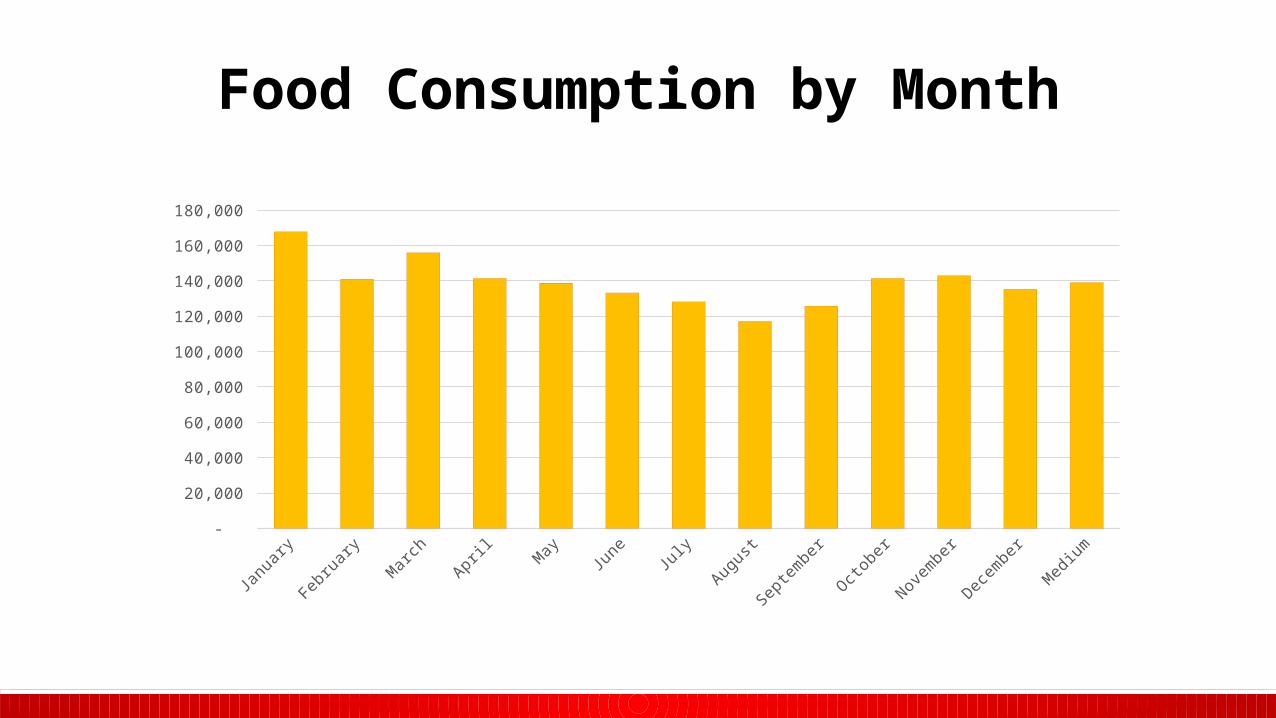
Food Consumption by Month
Janu
ary
Febr
uary
Mar
chApr
ilMay
June Ju
ly
Augus
t
Sept
embe
r
Octob
er
Novem
ber
Decem
ber
Med
ium
-
20,000
40,000
60,000
80,000
100,000
120,000
140,000
160,000
180,000

Traffic Calculation
100%
32%
9%
172k persons
55k persons
4.8k persons

Sales Projections – Moderate Scenario
2015 2016 2017 -
50,000
100,000
150,000
200,000
250,000
300,000
Units Sales
2015 Units Sold
2015 Sales
Revenue
2016 Units Sold
2016 Sales
Revenue
2017 Units Sold
2017 Sales
Revenue
92,706 200,445 € 106,256 241,230 € 111,569 265,956 €

Variable Costs – Simit Prodution
Ingredient 100 Units Price 45,935 Units Cost 52,649 Units Cost 55,281 Units CostFlour gr 7,142 12.50 € 3,280,701 5,741.23 € 3,760,221 6,711.99 € 3,948,232 7,259.02 €
Pekmez- Molasses ml 2,142 2.93 € 983,935 1,347.99 € 1,127,750 1,575.92 € 1,184,138 1,704.36 € Sunflower oil ml 28 0.01 € 12,862 4.12 € 14,742 4.81 € 15,479 5.20 €
Yeast gr 65 0.27 € 29,858 125.40 € 34,222 146.61 € 35,933 158.56 € Salt ml 7 0.44 € 3,215 200.97 € 3,685 234.95 € 3,870 254.10 €
16.15 € 7,419.70 € 8,674.28 € 9,381.23 €
2015 2016 2017
TOTAL
Cost per ingredient
Units sold Cost Units sold Cost Units sold Cost45,935 7,419.70 € 52,649 8,674.28 € 55,281 9,381.23 €
2015 2016 2017

Variable Costs – Simit Production
2015 2016 2017Units sold Cost Units sold Cost Units sold Cost
45,935 7,419.70 € 52,649 8,674.28 € 55,281 9,381.23 €
2015 2016 2017 -
10,000
20,000
30,000
40,000
50,000
60,000
Units Cost

Variable Costs – Customizations
Ingredient Weight Cost 15 gr 30 gr 100 grHam (Iberico) 7 kg 130.00 € 0.28 € 0.56 € 1.86 €
Chorizo (Iberico) 1 kg 12.40 € 0.19 € 0.37 € 1.24 € Salchichon (Iberico) 1 kg 10.70 € 0.16 € 0.32 € 1.07 €
Cheese (Burgos) 1kg 7.56 € 0.11 € 0.23 € 0.76 € Chocolate 550 gr 3.30 € 0.05 € 0.10 € 0.60 €
Units sold Cost Units sold Cost Units sold Cost30,902 19,696.49 € 35,419 23,026.91 € 37,190 24,178.25 €
* 3% cost increase in 2017* 2% cost increase in 2016
2015 2016 2017
Cost per Gram

Variable Costs - Customizations
2015 2016 2017 -
5,000
10,000
15,000
20,000
25,000
30,000
35,000
40,000
Units Cost

Variable Costs - Additionals
Vegetables Beverages Napkins & Bags0
20000
40000
60000
80000
100000
120000
2015 Units 2015 Costs 2016 Units 2016 Costs 2017 Units 2017 Costs

Total Variable Costs
2015 2016 2017Simit 7,419.70 € 8,674.28 € 9,381.23 €
Customizations 19,696.49 € 23,026.91 € 24,178.25 € Vegetables 462.50 € 540.71 € 584.77 € Beverages 7,256.11 € 8,483.03 € 9,174.39 €
Bags and Napkins 1,148.38 € 1,278.63 € 1,451.98 € Total 35,983.19 € 42,003.55 € 44,770.63 €
2015 2016 201735,983.19 € 42,003.55 € 44,770.63 €

Total Variable Costs
2015 2016 2017 - €
5,000.00 €
10,000.00 €
15,000.00 €
20,000.00 €
25,000.00 €
30,000.00 €
35,000.00 €
40,000.00 €
45,000.00 €
50,000.00 €
Units

Fixed Costs

Income StatementSALES REVENUE 2015 2016 2017
200.445 € 241.230€ 265.956 €
COST OF PURCHASE 2015 2016 2017
35.983 € 42.004 € 44.771 €
Gross Margin 160.453 € 194.402 € 215.866 € Returns to Vendor 4.009 € 4.825 € 5.319 €
Operating ExpensesTotal Marketing Expenses 4.303 € 2.921 € 3.009 €
Total General and Adminstrative Expenses 172.963 € 150.051 € 155.783 €
TOTAL OPERATING EXPENSE 177.266 €
152.972 € 158.792 €
EBITDA - 16.813 € 41.430 € 57.074 €
INTEREST € - € - € -
DEPRECIATION 3.251 € 3.251 € 3.251 € EBT - 20.064 € 38.179 € 53.823 €
Tax (%25) € - 4.529 € 13.456 €
Net Income - 20.064 € 33.650 € 40.367 €

Cash Flow Start-Up 2015 2016 2017
Cash In
Cash Sales 176.793 € 200.945 € 208.510 €
Collections from Accounts Receivables 17.548 € 33.638 € 49.761 €
Equity Received 85.000 € 85.000 €
Total Cash In 85.000 € 279.340 € 234.583 € 258.271 €
Total Cash Available 85.000 € 308.589 € 274.879 € 332.342 €
Total Cash Out 55.751 € 239.044 € 205.308 € 216.556 €
Yearly (cash in - cash out) 29.249 € 40.296 € 29.275 € 41.715 €
Beginning Cash Balance - - 40.296 € 69.571 €
Ending Cash Balance 29.249 € 40.296 € 69.571 € 111.286 €

Balance SheetASSETS 2015 2016 2017
Cash in hands 40,296.02 € 69,570.79 € 111,285.58 €
Accounts Receivables 1,702.97 € 2,816.28 € 4,139.93 €
Inventory 1,016.81 € 2,513.27 € 3,242.64 €
Security Deposits 4,000.00 € 4,000.00 € 4,000.00 €
CURRENT ASSETS 47,015.80 € 78,900.34 € 122,668.15 €
Offi ce Equipment 22,221.00 € 22,221.00 € 22,221.00 €
Accumulated Depreciation 3,250.62 € 6,501.24 € 9,751.86 €
NET FIXED ASSETS 18,970.38 € 15,719.76 € 12,469.14 €
TOTAL ASSETS 65,986.18 € 94,620.10 € 135,137.29 €
LIABILITIES Accounts Payables 1,050.00 € 1,050.00 € 1,200.00 €
Non Comercial creditors
CURRENT LIABILITIES 1,050.00 € 1,050.00 € 1,200.00 €
Long Term Debt
TOTAL LIABILITIES 1,050.00 € 1,050.00 € 1,200.00 €
OWNER`S EQUITYEren Kongu 45,050.00 € 45,050.00 € 45,050.00 €
Rafa Gonzalez 14,450.00 € 14,450.00 € 14,450.00 €
Pamela Gutierrez 12,750.00 € 12,750.00 € 12,750.00 €
Daniela Uribe 12,750.00 € 12,750.00 € 12,750.00 €
Retained Earnings 20,063.82 €- 8,570.10 € 48,937.29 €
Profit and Loss
TOTAL EQUITY 64,936.18 € 93,570.10 € 133,937.29 € TOTAL LIABILITIES 65,986.18 € 94,620.10 € 135,137.29 €

Break-Even Point
BREAK-EVEN ANALYSIS 2015 2016 2017
GENERAL
Average Selling price per unit 2.16 € 2.27 € 2.38 €
Average cost of each unit 0.32 € 0.33 € 0.34 €
Gross profit margin 0,85 0,86 0,86
Fixed Costs 144,577 € 148,750 € 154,005 €
Euro sales to break even 169,692 € 173,939 € 179,505 €
Number of Units Sales to break even 78,484 76,617 75,304

Break-Even Point
JAN FEB MAR APR MAY JUN JUL AUG SEP OCT NOV DEC0
50000
100000
150000
200000
250000
UNIT SALES (€)
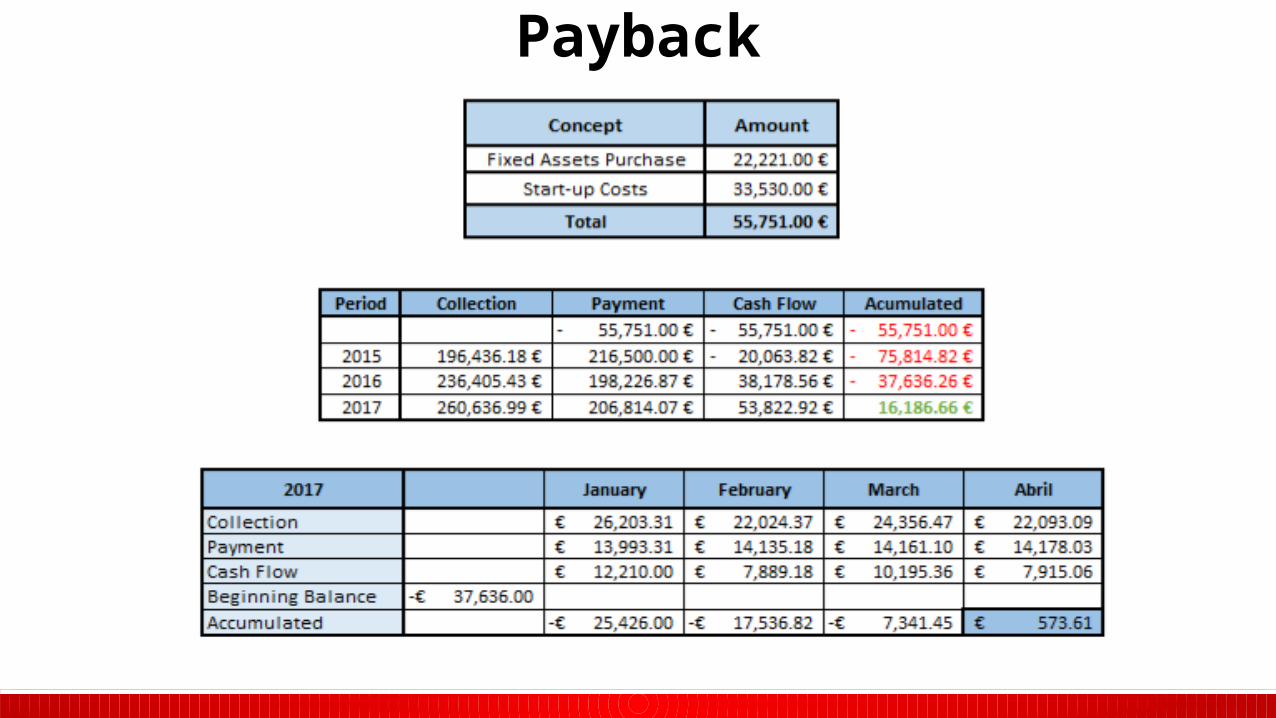
Payback

39,670.26 €NPV
20.98%IRR

Conclusions
• The Simit Shop is economically viable.
• The Simit Shop has a great growth potential.
• The city of Madrid is open to our products and taste.

¿