Burlington Public Schools
75
Burlington Burlington Public Schools Public Schools Instruction Report October 2008 October 2008
description
Burlington Public Schools. Instruction Report October 2008. Education is not the filling of a pail, but the lighting of a fire. --William Butler Yeats. The Why. “ You Earn What You Learn .” -- Federal Reserve Bank of Dallas, 2004 Annual Report. - PowerPoint PPT Presentation
Transcript of Burlington Public Schools

BurlingtonBurlington Public Schools Public Schools
Instruction ReportOctober 2008October 2008

2
Education is not the filling of a pail, but the lighting of a
fire.--William Butler Yeats

3
The Why . . .
“You Earn What You Learn.”
-- Federal Reserve Bank of Dallas, 2004 Annual Report

4
“Education is the best investment .”
--Excerpt from Speech
by Federal Reserve Chairman Ben BernankeBefore the U.S. Chamber of Commerce

5
Average Annual EarningsFederal Reserve of Dallas, 2004 Annual Report
Education Level Ages: 25-34
Experience Premium
25-34 to 55-64Less than 9th Grade $21,839 $4,846
High School Dropout 25,316 5,482
High School Graduate 31,565 7,237
Some College, no Degree 35,816 11,342
Associate’s Degree 38,512 9,266
Bachelor’s Degree 51,645 17,447
Master’s Degree 60,738 19,553
Doctorate 71,903 42,778
Professional Degree (Ex. Lawyer, Medical Doctor)
83,823 70,399

6
Federal Reserve Bank of Dallas2004 Annual Report
“We can never know enough in the modern workplace (p. 6).”
“A good education serves as the foundation for productive work (p. 6).”

7
Federal Reserve Bank of Dallas2004 Annual Report
“Unemployment data confirms the advantages of education and experience (p. 7).”
– Among 25-34 year-olds, only 3 percent of Americans with bachelor’s, master’s, doctoral and professional degrees were unemployed in 2003 (about half for the overall economy).
– Unemployment rises to nearly 12 percent for high school dropouts (p. 8).

8
Federal Reserve Bank of Dallas2004 Annual Report
Postindustrial nations are shifting workers to more sophisticated jobs that require analytical intelligence, imagination and creativity, and the ability to interact with others (p.13).

9
A Whole New Mindby Daniel Pink
We are moving from an economy and a society built on the logical, linear, computer-like capabilities of the Information Age to an economy and a society built on the inventive, empathetic, big-picture capabilities of what’s rising in its place, the Conceptual Age (p. 2).

10
The World is FlatThomas Friedman
How did we get from an agricultural-based society to an industrial-based society?
“ …on top of the high school movement of the early twentieth century, we added the GI Bill and the modern university system… (p. 289).”

11
The World is FlatThomas Friedman
“Tertiary education is more critical the flatter the world gets, because technology will be churning old jobs, and spawning new, more complex ones, much faster than during the transition from the agricultural economy to the industrial one (p. 289).”

12
More than Economics . . .
““Education is for Education is for improving the lives of improving the lives of others and for leaving others and for leaving your community and your community and world better than you world better than you found it.”found it.”
-- -- Marian Wright EdelmanMarian Wright Edelman

13
Take Home Message
Burlington graduates will be competing globally. A strong educational foundation for all students will set the stage for lifelong learning, greater employability, higher earnings, and a securer retirement.

14
Who We Are . . . Our Demographics

15
Diverse yet Stable There are now 19 different languages
used by students in the school system;
Of the 254 graduates of the Class of 2008, 231 attended BHS all four years.
The Class of 2008 had 276 members in middle school. Of this number, 260 students attended all three years.

16
Burlington Public SchoolsNCLB Ethnicity Subgroup Information
Hispanic2.43%
African American
3.15%
Native American
0.14%
White81.22%
Asian Pacific12.73%
Hawaiian0.31%
October 20063,529
October 20073,693
The 2008 October Report is not yet complete . BPS grew by 164 students October 2006 to October 2007.
Hispanic2.76%
African American3.28%
Native American0.14%
White79.26%
Asian Pacific13.48%
Hawaiian0.27%

17
Ethnicity Growth Trends from October 2004 to October 2007
79.25
13.312.6411.9210.97
85.09 80.6481.68
0
5
10
15
20
25
30
35
40
45
50
55
60
65
70
75
80
85
90
Oct. 2004 Oct. 2005 Oct. 2006 Oct. 2007
Perc
enta
ges
American Indian
Asian
African American
Hispanic
White
18
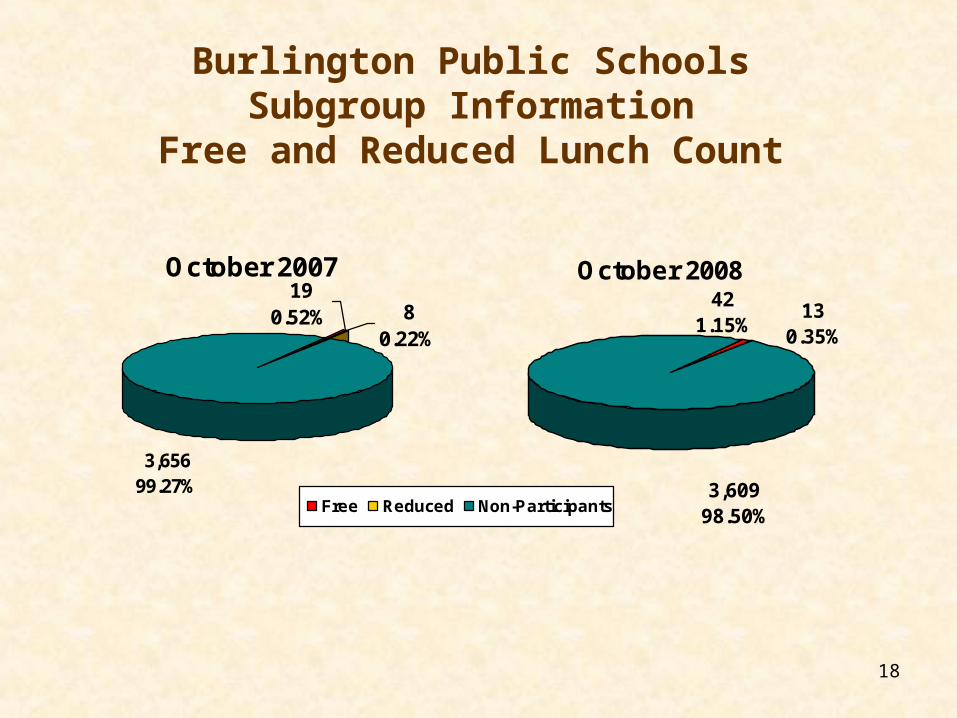
Burlington Public SchoolsSubgroup Information
Free and Reduced Lunch Count
October 2008
3,60998.50%
130.35%
421.15%
October 200719
0.52% 80.22%
3,65699.27%
Free Reduced Non-Participants

1919
Take Home MessageTake Home MessageBurlington is becoming more Burlington is becoming more diverse. We view diversity as diverse. We view diversity as an opportunity for students to an opportunity for students to experience experience locallylocally the global the global community that they will be community that they will be experiencing as adults.experiencing as adults.

20
The When . . .
““When planning for a When planning for a year, plant corn. When year, plant corn. When planning for a decade, planning for a decade, plant trees. When plant trees. When planning for life, train and planning for life, train and educate people.”educate people.”
--Chinese --Chinese ProverbProverb

21
When is Now . . .
“Planning is bringing the future into the present so that you can do something about it now.”
- Alan Lakein, writer

22
Take Home Messages
We need to stop planning for the 21st century as we are almost through its first decade.
THE WHEN IS NOW!

The What . . .
23

24
Accreditation

25
Adequate Yearly Progress(AYP)

26
Changes in AYP Benchmarks(Adequate Yearly Progress)
AYP is part of NCLB and is based on MCAS Scores;
The baseline increases from 85.4% to 90.2% in English; and
The baseline increases from 76.5% to 84.3% in Math for 2008-09.

27
ELA AYP State Performance Targets
Per
cent
School Years
70.7
75.6 75.680.5 80.5
85.4 85.4
90.2 90.295.1 95.1
100 100
0
10
20
30
40
50
60
70
80
90
100
2001-02 2002-03 2003-04 2004-05 2005-06 2006-07 2007-08 2008-09 2009-10 2010-2011 2011-12 20012-13 2013-14

28
Math AYP State Performance Targets
53
60.8 60.8
68.7 68.7
76.5 76.5
84.3 84.3
92.2 92.2100 100
0
10
20
30
40
50
60
70
80
90
100
2001-02 2002-03 2003-04 2004-05 2005-06 2006-07 2007-08 2008-09 2009-10 2010-2011 2011-12 20012-13 2013-14
Per
cent
School Years

29
The Nine AYP Subgroupsas Defined by the MA Regulations in response to the NCLB Act1. Aggregate (all students)2. African American/Black Students3. Hispanic Students4. White Students5. Limited English Proficient (LEP) Students6. Low Income7. Special Education8. Native American9. Asian or Pacific Islander
Note: The same student may fall within five of these subgroups and
be counted five times. If s/he does not pass an MCAS, it counts against the school and division all five times.
Subgroup populations over 40 contribute to AYP

30
Preliminary District English Language Arts (ELA) AYP 2008-09
(Based on 2007-08 MCAS Results)
Grade Spans
District and
School Levels
2007 2008
2008 Subgroups Not Making AYP
Grades 3-5 Aggregate Yes No White; Special Education; Low Income
All Subgroups
No No
Grades 6-8 Aggregate Yes Yes Special Education
All Subgroups
Yes No
Grades 9-12 Aggregate Yes Yes
All Subgroups
Yes Yes

31
Preliminary District Mathematics AYP 2008-09 (Based on 2007-08 MCAS Results)
Grade Spans
District and
School Levels
2007 2008
2008 Subgroups Not Making AYP
Grades 3-5 Aggregate Yes Yes Special Education; Low Income
All Subgroups
No No
Grades 6-8 Aggregate Yes Yes Special Education
All Subgroups
Yes No
Grades 9-12 Aggregate Yes Yes
All Subgroups
Yes Yes

32
Pass Rates (Proficient and Advanced) and Trends in Percentages by Grade Level and Subject Area
AYP Data (NCLB)

33
Percentage Passed by SubjectThird Grade
Grade 3
Math (290), 64.00
ELA (290), 67.00
62.50
63.00
63.50
64.00
64.50
65.00
65.50
66.00
66.50
67.00
ELA (290)
Math (290)

34
Percentage Passed by SubjectFourth Grade
ELA (300), 51.00 Math (300), 51.00
0.00
10.00
20.00
30.00
40.00
50.00
60.00
Grade 4
ELA (300)
Math (300)

35
Percentage Passed by SubjectFifth Grade
64.00
51.00
57.00
0.00
10.00
20.00
30.00
40.00
50.00
60.00
70.00
Grade 5
ELA (290) Math (290) Science (290)
36
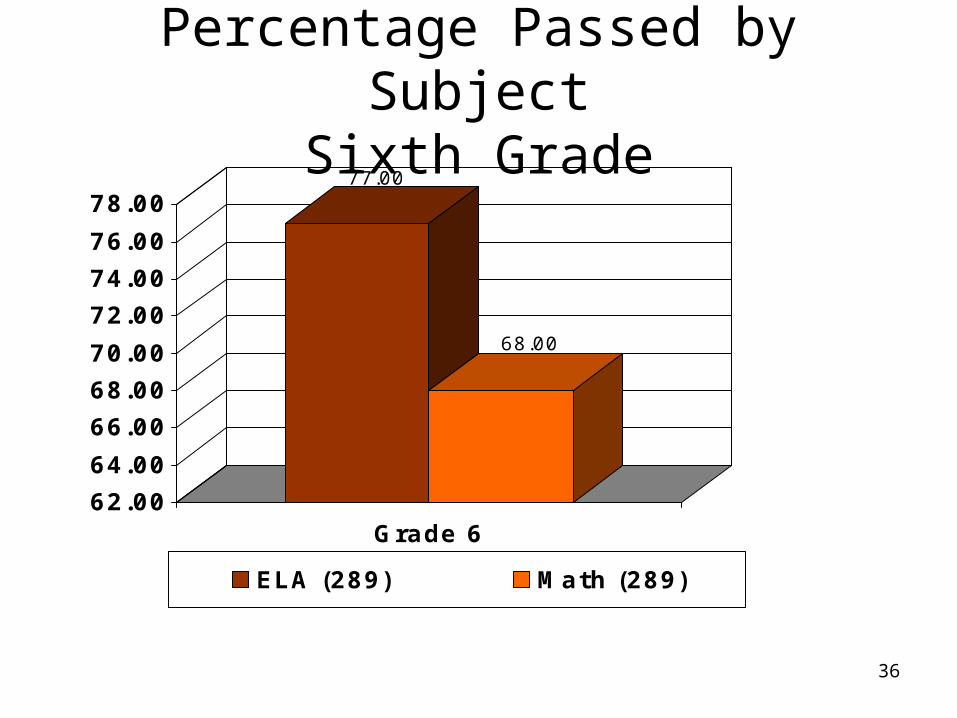
Percentage Passed by SubjectSixth Grade77.00
68.00
62.00
64.00
66.00
68.00
70.00
72.00
74.00
76.00
78.00
Grade 6
ELA (289) Math (289)

37
Percentage Passed by SubjectSeventh Grade
80.00%
63.00%
0%
10%
20%
30%
40%
50%
60%
70%
80%
Grade 7
ELA (282)
Math (282)

38
Percentage Passed by SubjectEighth Grade
86.00
68.00
57.00
0.00
20.00
40.00
60.00
80.00
100.00
Grade 8
ELA (270) Math (270) Science (290)

39
Percentage Passed by SubjectTenth Grade
93.00
87.00
89.00
84.00
80.00
82.00
84.00
86.00
88.00
90.00
End of Course
English Math History Sc ience

40
Percentage Passed in Englishby Ethnic Subgroups
89.0083.70 85.90
88.80
66.20
81.20
74.60
92.7
00.00
10.00
20.00
30.00
40.00
50.00
60.00
70.00
80.00
90.00
100.00
English
All African American HispanicWhite Students w/Dis. Disadv.LEP Asian Native Am.
85.4% was the AYP English Benchmark

41
Percentage Passed in Mathby Ethnic Subgroup
82.80
68.70
75.00
82.70
53.70
67.60 68.70
89.9
00.00
10.00
20.00
30.00
40.00
50.00
60.00
70.00
80.00
90.00
Math
All African American HispanicWhite Students w/Dis. Disadv.LEP Asian Native Am.
76.5% was the AYP Math Benchmark

42
Third Grade MCAS Trends2003-2008
0
10
20
30
40
50
60
70
80
90
100
2003 2004 2005 2006 2007 2008
EnglishMath
Per
cen
tag
e P
asse
d

43
Fourth Grade MCAS Trends2003-2008
0
10
20
30
40
50
60
70
80
90
100
2003 2004 2005 2006 2007 2008
EnglishMath
Per
cen
tag
e P
asse
d

44
Fifth Grade MCAS Trends2003-2008
0
10
20
30
40
50
60
70
80
90
2003 2004 2005 2006 2007 2008
English
Math
Science
Per
cen
tag
e P
asse
d

45
Sixth Grade MCAS Trends2003-2008
0
10
20
30
40
50
60
70
80
90
2003 2004 2005 2006 2007 2008
English
Math
Per
cen
tag
e P
asse
d

46
Seventh Grade MCAS Trends2003-2008
01020304050
60708090
100
2003 2004 2005 2006 2007 2008
English
Math
Per
cen
tag
e P
asse
d

47
Eighth Grade MCAS Trends2003-2008
01020304050
60708090
100
2003 2004 2005 2006 2007 2008
English
Math
Science
Per
cen
tag
e P
asse
d

48
Grade 10English MCAS Trends 2003-2008
0102030405060708090
100
2003 2004 2005 2006 2007 2008
ELA
Per
cen
tag
e P
asse
d

49
Grade 10 Math MCAS Trends 1998-2008
01020304050
60708090
100
2003 2004 2005 2006 2007 2008
Math
Per
cen
tag
e P
asse
d

50
Grade 10 Science MCAS Trends 2003-2008
55
60
65
70
75
80
2003 2004 2005 2006 2007 2008
Intro Physics
Biology*
Chemistry*
Sci Tech Engin

51
Other Academic Benchmarks Advanced Placement Tests Taken
Advance Placement Course Enrollment
Global Studies Certificate
College Courses Taken
Industry Certifications
PSAT/SAT Scores
Club Participation/Fine Arts/Athletics
Community Service
Random Acts of Kindness

52
Advanced Program DataProgram
Type2005-06
Count
2006-07 Count
2007-08 Count
Advanced Placement Tests Taken
Total Tests:
158
Total Tests:
176
Total Tests:
175
Advanced Placement Course Enrollment
Total Students: 86
Total Students: 117
Total Students: 116
Industry Certifications 0 0 0
College Courses Taken 0 0
16 BHS students participated in a Bay Path College course

53
SAT Results 2001-2008
YearNo.
Tested
Verbal/Critical Reading
Math Writing
2001 189 490 512
2002 214 497 527
2003 208 517 543
2004 199 504 532
2005 212 511 542
2006 225 516 551 520
2007 232 521 539 509
2008 241 526 545 527
YearNo.
Tested
Verbal/Critical
ReadingMath Writing
2001 55
2002 66
2003 61
2004 58 588 619
2005 64 608 633
2006 69 606 634 617
2007 48 624 639 603
2008 56 589 640 609
STUDENTS WITH SAT IMEAN SCORES
STUDENTS WITH BOTHSAT I AND II MEAN SCORES

54
Take Home Messages
In regards to MCAS, BPS need to focus on expecting more students to score in the proficient and advanced categories;
In regards to AYP, BPS need to focus on students in the following groups identified by NCLB:– Students who are Economically-
Disadvantaged; and– Students with Disabilities.
The Division’s journey to excellence in student achievement is mapped using more than test scores – other measures need to be purposeful and public.

The HowThe How
55
““Sharpening both the nation’s Sharpening both the nation’s educational system as well as the educational system as well as the skills of its work force should help skills of its work force should help
the country deal with future the country deal with future challenges, including the challenges, including the
retirement of the baby boom retirement of the baby boom generation, advancing technology generation, advancing technology
and increasing globalization.” and increasing globalization.”
-- Excerpt from Speech by Ben Bernanke-- Excerpt from Speech by Ben Bernanke Federal Reserve ChairmanFederal Reserve Chairman

56
Expanding Opportunities Now
Embedding Professional Development: Curriculum Specialists;
Common Standards/Expectations;– NEASC
– PK-12 Student Expectations
Response to Intervention (RTI); andClassroom Walk-throughs (CWT’s).

57
Concluding Take Home Message
Proficiency is NOT Excellence

NEASC Accreditation
All Burlington Public Schools are working through the New England Association of Schools and Colleges (NEASC) accreditation process.
Working with NEASC as a framework for school improvement will provide us with a common language elementary, middle, and high.
58

Commission on Public Elementary and Middle Schools
An Overview of the Accreditation Process

New England Association New England Association of Schools and Collegesof Schools and Colleges
NEASCNEASC
CPEMSCPEMS
CPSSCPSS
CIHECIHE
CISCIS
CTCICTCI
CAISACAISA
K-12 Private/K-12 Private/IndependentIndependent
Public Public SecondarySecondary
Career and Career and TechnicalTechnical
Overseas Overseas SchoolsSchools
Higher Higher EdEd
Public Elementary Public Elementary and Middleand Middle
EstablishedEstablished18851885
1900+ schools1900+ schools

NEASC serves more than 2,000 public and independent schools, colleges and universities in the six states of Connecticut, Maine, Massachusetts, New Hampshire, Rhode Island, Vermont, and American/international schools in more than 65 nations worldwide.

Why Accreditation?
“There is no power greater than a community discovering what it cares about. Be brave enough to start a conversation that matters. Our goal is to ask: ‘What’s possible?’ not ‘What’s wrong?’”.
-Margaret Wheatley

T e a c h ing a nd L e a r ning S t a nd a r d s
M iss ion & E x pe c t a t ions
C ur r ic ulum
I nst r uc t ion A sse ssme nt
L e a d e r sh ip & O r ga niz a t ion
S c h ool R e sour c e s f or L e a r ning
C ommunit y R e sour c e s f or L e a r ning
S uppor t S t a nd a r d s

Accreditation Process Goals School Improvement through Self Assessment
Is your school a good school?
How do you know?
How do you measure yourselves? Against what?
Do you have any documented proof?
So, how do you really know?

AccreditationA Three Phase Process
• Self Study
• Peer Review
• Follow-Up

The Process: Measuring Yourself Against the Standards
Do you meet the standard?
How well do you meet the standard?
Identify your strengths and needs in this area.
What do you need to do to meet the standard better?
Develop an action plan to meet the needs

The Self Study A Snapshot of Who You Are
Is school specific Is faculty driven Requires parental and
community input Requires reflection,
discussion, consensus and back-up
Tells the story of how and how well the school meets NEASC standards for good schooling

What Committees Will We Need?Mission
Curriculum
Instruction
Assessment
Leadership
School Resources
Community Resources
MeetingMeetingTodayToday
Lear
ning
Lear
ning
Areas
Areas

• Reads the self Reads the self
studystudy• Spends three and Spends three and
one half days one half days watching the watching the
school in actionschool in action• Meets and Meets and
discusses the self discusses the self study with study with
members of the members of the school’s school’s
communitycommunity
The Peer Review TeamThe Peer Review Team
Provides objective assessment of the conclusions of the self study
Determines the degree to which the school meets the standards
Develops the final report which includes perceptions, commendations and recommendations
Makes a recommendation about accreditation to CPEMS

The Follow UpThe Follow Up
Prioritize the recommendations found in the Visiting Committee Report
Identify the responsible people and develop action plan Establish a timeline Develop strategies, adopt and adapt them, and
assess the results Prepare appropriate reports:
Two Year ReportSpecial Progress ReportsFive Year Report
Celebrate the accomplishments

An Example From BHS 2004 Decennial Report
1. Instructional strategies shall be consistent with the school's mission statement and expectations for student learning.
Instructional strategies and practices are consistent with the school’s stated mission and expectations. In striving to foster a community of socially committed and morally responsible learners, Burlington High School uses strategies that encourage independent thinking and analysis…(From the 2004 Decennial Report)

Commendations and Recommendations
Commendations:
1. The instructional strategies and practices consistent with the school’sstated mission and expectations
2. The strong teacher-student relationships that promote personalizedinstruction
3. The varied instructional strategies utilized by the teaching staff
Recommendations:
5. Reassess the effectiveness of the current evaluation process in light of the fact that staff members are evaluated by their peers
7. Implement a plan to ensure that technological equipment to supportinstruction is adequately maintained

Accreditation CycleAccreditation Cycle
Self StudySelf Study12-18 12-18
monthsmonths
On-siteOn-sitePeer Review VisitPeer Review Visit
Two Year UpdateTwo Year Update
Special Special Progress Progress ReportsReportsFive Year Five Year
SummarySummary
Establish Establish Mission and Mission and ExpectationsExpectations
10 Year10 Year
CycleCycle
Visiting Visiting CommitteeCommittee
ReportReport

So, What Do We Get Out of This?
A Continuous Cycle of School Improvement
Upholding Standards Self Awareness
Self Evaluation Quality Control Public Accountability School Approval

Any Questions???