
Bureaucracy and EntrepreneurshipE.pdf · Sloan School of Management ... Finally, in a study of MBA...
43
Bureaucracy and Entrepreneurship • Jesper B. Sørensen Sloan School of Management Massachusetts Institute of Technology E52-581 Cambridge, MA 02142 [email protected] (617) 253 7945 DRAFT – November 2004 • Patricia Chang, John de Figueiredo, Roberto Fernandez, Bob Gibbons, Jason Greenberg, Mike Hannan, Rebecca Henderson, Petra Moser, Joel Podolny, Elaine Romanelli, Olav Sorenson, Birger Wernerfelt, and Ezra Zuckerman provided helpful comments, as did seminar participants at Georgetown University, Harvard University, MIT and the 2004 Meetings of the American Sociological Association. I am grateful to Niels Westergaard-Nielsen of the Center for Corporate Performance, Aarhus School of Business, for helping to secure access to the data. Søren Leth-Sørensen, Jørn Schmidt Hansen, and other Statistics Denmark employees were also incredibly helpful. The Sloan School provided generous funding. All errors remain my own.
Transcript of Bureaucracy and EntrepreneurshipE.pdf · Sloan School of Management ... Finally, in a study of MBA...
Bureaucracy and Entrepreneurship•
Jesper B. Sørensen Sloan School of Management
Massachusetts Institute of Technology E52-581
Cambridge, MA 02142 [email protected]
(617) 253 7945
DRAFT – November 2004
• Patricia Chang, John de Figueiredo, Roberto Fernandez, Bob Gibbons, Jason Greenberg, Mike Hannan, Rebecca Henderson, Petra Moser, Joel Podolny, Elaine Romanelli, Olav Sorenson, Birger Wernerfelt, and Ezra Zuckerman provided helpful comments, as did seminar participants at Georgetown University, Harvard University, MIT and the 2004 Meetings of the American Sociological Association. I am grateful to Niels Westergaard-Nielsen of the Center for Corporate Performance, Aarhus School of Business, for helping to secure access to the data. Søren Leth-Sørensen, Jørn Schmidt Hansen, and other Statistics Denmark employees were also incredibly helpful. The Sloan School provided generous funding. All errors remain my own.
Abstract
This paper examines whether bureaucracies encourage or hinder entrepreneurial activity. Two streams of argument suggest different expectations for the relationship between bureaucracy and entrepreneurship. From one standpoint, bureaucracies make people more likely to become entrepreneurs because they are unwilling or unable to pursue the entrepreneurial opportunities identified by their employees. A different stream of argument holds that conditions of work in bureaucratic firms are inimical to the development of entrepreneurial skills and ambitions, which are more likely to be developed in less bureaucratic environments. This suggests a negative relationship between bureaucracy and individual rates of entrepreneurship. Analyses of transitions to entrepreneurship lend support to the latter view: bureaucracy lowers the individual rate of entrepreneurship.
1
It is well established in organizational research that as organizations evolve, they
grow increasingly bureaucratic: characterized by a more fine-grained and
institutionalized division of labor within the firm (Bendix 1956; Blau and Schoenherr
1971) and an increasing reliance on established routines (March 1991; Sørensen and
Stuart 2000). These developmental tendencies have been widely implicated as an
important driver of industry dynamics, as established firms find themselves unwilling or
unable to respond to new opportunities and thereby cede valuable opportunities to
entrepreneurial firms (Abernathy and Utterback 1978; Tushman and Anderson 1986;
Hannan and Freeman 1989; Henderson 1993). Furthermore, casual empiricism suggests
that some of the most successful entrepreneurial ventures emerge from large, established
firms: 3COM and Adobe Systems were founded by employees of the Xerox Corporation
(Hiltzik 1999); Real Networks was founded by a Microsoft executive; dissatisfied
Fairchild Semiconductor executives founded Intel. Indeed, large, established firms are
prolific producers of entrepreneurial ventures: Gompers, Lerner and Scharfstein (2003)
estimate that employees of IBM founded 70 venture capital backed ventures between
1986 and 1999 (see also Burton, Sørensen and Beckman 2000).
In light of such evidence, it is natural to suspect that bureaucratic firms may
encourage their employees to become entrepreneurs, however inadvertently. As Freeman
(1986: 50) argues, the characteristics of bureaucratic organizations may “create
frustration, political disruption and lost opportunity. These factors generate

2
entrepreneurs.” Other arguments, however, suggest that bureaucratic firms may be less
likely to produce entrepreneurs and that entrepreneurial firms are instead incubators of
further entrepreneurship. Employees of entrepreneurial firms are presumed to be exposed
to more entrepreneurial opportunities and to be in a position to acquire more
entrepreneurially relevant skills. As a result, they are in a stronger position to identify
and take advantage of entrepreneurial opportunities. Saxenian (1994), for example,
attributes the differences in entrepreneurial activity between Silicon Valley and Boston’s
Route 128 to differences in the size distribution of high technology firms in the two
regions. In Saxenian’s account, the dominance of Route 128 by large, bureaucratic firms
such as Digital Equipment Corporation meant that employees of these firms were overly
insulated from entrepreneurial experiences and opportunities. Similarly, Gompers,
Lerner and Scharfstein (2003: 35) argue that exposure to the entrepreneurial process is an
important determinant of the propensity of employees to enter entrepreneurship: “It is in
these environments that employees learn from their co-workers about what it takes to
start a new firm and are exposed to a network of suppliers and customers who are used to
dealing with start-up companies.”
These contradictory arguments highlight an important unresolved question: Does
the existence of bureaucratic firms act as a complement to entrepreneurial activity, or do
bureaucracies crowd out entrepreneurship? Systematic evidence on this question is
important for several reasons. First, the nature of the relationship between bureaucracy
and rates of entrepreneurship has implications for our understanding of industry and
regional dynamics. Much theoretical and empirical work, for example, is concerned with
understanding why rates of entrepreneurship differ markedly across regions (e.g.,

3
Saxenian 1994; Sorenson and Audia 2000; Gromb and Scharfstein 2003). Many of these
explanations focus on differences in the institutional features of local labor and capital
markets (e.g., the legal enforcement of non-compete clauses, or the density of venture
capital firms) (Sorenson and Stuart 2003; Hellman 2003) or prevailing attitudes toward
entrepreneurial failure (Gromb and Scharfstein 2003; Landier 2002). If organizational
characteristics are systematically related to rates of entrepreneurial activity, it suggests
that the demographic distribution of organizations in a particular region or industry
(Carroll and Hannan 2000) is an important determinant of the entrepreneurial activity. A
systematic relationship between firm size and individual rates of entrepreneurship, for
example, would imply that two regions with equally sized labor markets but differing
organizational size distributions would have different rates of entrepreneurial activity.
Furthermore, an understanding of the effects of organizational characteristics on
entrepreneurship promises to help answer one of the basic questions about
entrepreneurship: What makes people more likely to become entrepreneurs? While there
has been extensive research concerning how individual characteristics, such as family
background (Dunn and Holtz-Eakin 2000; Sørensen 2004) and wealth (Hurst and
Lussardi 2004), affect the propensity to engage in entrepreneurial activity, the literature is
largely silent on the role of work experiences in established firms. This is somewhat
surprising, in light of the fact that the vast majority of individuals who enter
entrepreneurship do so following a period of employment with established firms.
Although precise data are scarce, estimates suggest that at least nine in ten entrepreneurs
work for established employers before launching their ventures. For example, in a study
of Silicon Valley start-ups, Burton, Sørensen and Beckman (2002) were able to identify

4
(from publicly available data) prior employers for all but 7% of the founding team
members.1 Existing firms therefore play a potentially important role in structuring the
exposure of individuals to entrepreneurial opportunities, and in shaping their desire and
willingness to engage in entrepreneurship.
Given that the nature of the relationship between bureaucracy and
entrepreneurship is important to a number of different streams of research, it is striking
that plausible theoretical accounts can paint bureaucracy as both an incubator and an
inhibitor of entrepreneurial activity. Ironically, these divergent expectations are both
rooted in widespread assumptions about the pathologies of bureaucratic organizations.
The idea that bureaucracies should encourage entrepreneurship rests on an image of
bureaucratic organizations as resistant to change and sluggish in the face of opportunity,
while the notion that they should retard entrepreneurial activity emphasizes the routine,
circumscribed character of most jobs in bureaucratic organizations. Yet as the co-
existence of such divergent arguments suggest, fundamental questions about the
relationship between bureaucracy and entrepreneurship remain unresolved.
At the most basic level, there is little systematic evidence concerning the nature of
the relationship: we simply do not know whether individual rates of entrepreneurship are
higher or lower in more bureaucratic firms. The primary aim of this paper is to shed light
on the nature of this empirical relationship. Doing so, however, poses substantial
challenges. The first challenge lies in the scope of the problem. Bureaucracy may
1 Similarly, Gompers, Lerner and Scharfstein (2003) were able to identify a prior employer for approximately 90% of venture-capital funded entrepreneurs in 1999. Finally, in a study of MBA alumnae, Burt (2000) found that approximately 89% of those women who became entrepreneurs were employed for some period before starting a new venture.

5
plausibly influence entrepreneurship in two general ways: by affecting the likelihood that
individuals will choose to enter into entrepreneurship, and by influencing their success as
entrepreneurs. In principle, bureaucracy could have opposing effects on these two
processes; for example, the employees of bureaucratic firms might be less likely to
launch new ventures, but their ventures might be more likely to succeed and survive
relative to those launched by the employees of less bureaucratic firms. If the latter effect
is sufficiently strong, the presence of bureaucratic firms might on balance be more
conducive to the emergence of entrepreneurial firms than their absence, despite a
negative impact on individual rates of entrepreneurship.2 Because of this potential
complexity, this paper only considers the impact of bureaucracy on individual rates of
entrepreneurship. The impact of bureaucracy on subsequent entrepreneurial performance
is examined in a companion paper (Sørensen and Phillips 2004).
An additional issue related to problem scope concerns the definition and
measurement of entrepreneurship. Most generally, entrepreneurship can be defined as
the act of organizing, operating and assuming the risk for a business venture. Yet this
definition covers a wide range of potential entrepreneurial activities, ranging from
individuals who enter into self-employment (e.g., as independent consultants), to the
owners of small companies with limited growth ambitions (e.g., the proprietor of the
corner store), to the founders of growth companies based on new technologies or service
ideas (e.g., the founders of a venture-capital backed company). Differentiating
empirically between these different types of entrepreneurship ex ante is difficult to do in
2 This possibility highlights the dangers of trying to study the relationship between bureaucracy and entrepreneurship at an aggregated level, as ecological inference problems might mask the true nature of the underlying processes.
6
a general way, absent any reliable insight into the motivation of the entrepreneurs prior to
entry.3 The low rate at which individuals transition to entrepreneurship makes collecting
such data difficult if not impossible, particularly if these data should be representative of
both individuals and organizations. I focus instead on modeling the transition to
entrepreneurship broadly defined. This limits the conclusions that can be drawn
concerning the impact of bureaucracy on entrepreneurially driven innovation and
technical change in markets. Yet this focus is nonetheless useful and important, since all
entrepreneurial ventures, from the most mundane to the most innovative, start with an
individual’s decision to forego the relative security and limited responsibility of
employment with established firms and assume the risk and responsibility of a new
venture. It is important to establish how bureaucratization affects this decision prior to
considering the more complex question of its joint impact on innovation and
entrepreneurship.
An important reason for the lack of empirical insight into the relationship between
bureaucracy and entrepreneurship is the lack of suitable data. The ideal dataset should be
representative of both individuals and employers, and should include all individuals at
risk of entering entrepreneurship, whether or not they eventually did so. Much of the
existing research on the effects of firm characteristics on entrepreneurship rely on
samples of specialized populations, such as public corporations (Gompers, Lerner and
Scharfstein 2003) or business school graduates (Dobrev and Barnett 2002). A further
3 Perhaps the most common way to capture those ventures that are more growth oriented and focused on new technologies is to focus on firms that are backed by venture capital. This strategy is limited, however, in that it necessarily misses those companies that did not secure venture capital.
7
major challenge is to mitigate, to the extent possible, the potentially confounding effects
of unobserved heterogeneity. The chief concern is that individuals with entrepreneurial
inclinations self-select into particular types of organizations, and thereby generate a
spurious correlation between bureaucratization and entrepreneurship. It seems
particularly plausible to suspect that people who have a preference for entrepreneurship
would also have a preference for working for less bureaucratic firms. Much of the data
used in prior research contain little (Wagner 2004) or no (Gompers, Lerner and
Scharfstein 2003) information on individual characteristics, and their designs make it
difficult to address concerns about unobserved individual heterogeneity.
I examine the relationship between bureaucracy and entrepreneurship using a
uniquely rich and comprehensive data set characterizing the Danish labor market. This
data set allows me to make a number of key advances relative to the limited body of
existing research. A key advantage of the data set is that, unlike previous studies, it is
representative of both the population of individuals in the Danish labor market as well as
the population of employers. This mitigates any concerns about potential sample
selection bias. A further advantage of the data set is that individuals can be followed
over time as their careers evolve. The longitudinal nature of the data therefore allows me
to address concerns about the impact of unobserved individual heterogeneity.
Empirically, I focus on the effects of firm size and firm age on the rate of
entrepreneurship. These measures have two primary advantages. First, they are easily
and reliably observable characteristics of firms that have all been extensively studied by
organizational researchers. Moreover, they have straightforward associations with
bureaucratization: large firms are generally more bureaucratic than small firms (Blau and

8
Schoenherr 1971), while old firms are generally more routinized than young firms
(Stinchcombe 1965; Sørensen and Stuart 2000). In the next section of the paper, I draw
on existing organizational theory to identify the primary conceptual features that
characterize bureaucracies and show how differing assumptions about their impact on the
entrepreneurial process lead to contradictory predictions concerning the relationship
between these measures and rates of entrepreneurship.
Bureaucracy and Entrepreneurship
In considering the potential impact of bureaucracy for entrepreneurial activity, it
is useful to distinguish between two distinct facets of the bureaucratization process: role
specialization and routinization. First, a defining characteristic of bureaucracy is the
formal elaboration of a division of labor, where organizational members assume narrowly
defined roles within the organization. Bendix (1956), for example, argued that the
process of bureaucratization involved “the increasing subdivision of the functions which
the owner-manager of the early enterprises had performed personally in the course of
their daily routines.” Thus bureaucratization implies increasing role differentiation and
specialization within the firm, and the emergence of specialized roles devoted to
coordination and administration (e.g., Blau and Schoenherr 1971). Entrepreneurial firms,
by contrast, are generally characterized by a flexible division of labor, where employees
are expected to perform a wide variety of tasks. This is in part a consequence of the lack
of routinization, which makes it difficult to develop stable role definitions (Stinchcombe
1965).
A second essential part of the bureaucratization process is the increasing
routinization of activities within the firm. A long line of argument suggests that

9
organizational processes improve with experience, and that one of the reasons for this is
the development of standard operating procedures that codify the lessons from the firm’s
learning-by-doing experiences (Stinchcombe 1965; March 1991; Hannan 1998).
Bureaucratization, in the form of routinization, therefore enhances performance, in the
sense that it leads to the more efficient execution of established routines (Sørensen and
Stuart 2000). However, the routinization of activities within the firm also means that
bureaucratic organizations tend to be more committed to their established activities and
less willing to pursue risky ventures.
The starkly contrasting images of bureaucracies as either incubators or inhibitors
of entrepreneurial activity rest on differing expectations about where in the
entrepreneurial process the impact of bureaucracy is greatest. The expectation that
bureaucracies should encourage entrepreneurship rests in large part on the assumption
that bureaucratic organizations resist or are unable to pursue new ventures. In the face of
this inertia, employees with entrepreneurial ideas and the ability to pursue them are
forced to pursue them outside the boundaries of the firm. The expectation that
bureaucracies should inhibit entrepreneurship, by contrast, derives from a focus on the
consequences of bureaucratic work conditions for the likelihood that individuals will be
in a position to become entrepreneurs. Thus bureaucracies may hinder entrepreneurship
by affecting the likelihood that their employees will develop entrepreneurial skills and
ambitions, or they may limit the exposure of their employees to entrepreneurial
opportunities.
The expectation that bureaucratic firms should have higher rates of
entrepreneurship echoes the wide-spread argument in organizational research that
10
bureaucratic firms are slow to change and respond to new opportunities. Firms with high
levels of routinization and role specialization should be less likely to pursue their
employees’ entrepreneurial ideas. In many cases, the unwillingness of a firm to pursue
such ideas may be functional and confer survival advantages (Hannan and Freeman
1984). Firms that are engaged in metal tooling would generally be wise to forego the
opportunity to invest in an employee’s desire to open an advertising agency. If the
employees’ ideas are far removed from the organization’s established capabilities, the
changes needed to pursue such ideas would likely be very disruptive to existing
organizational processes. In such situations, the firm’s managers not only lack the
knowledge needed to develop effective organizational routines for the new project, but
also face the challenge of managing disruptions in existing formal and informal
relationships within the firm.
In other cases, the firm’s lack of responsiveness may reflect a failure to recognize
opportunities from which it could have profited. For example, a formal division of labor
with specialized roles can make decision-making more cumbersome, particularly
regarding non-routine issues. Resistance to entrepreneurial proposals may be greater if
the task demands of the new venture do not correspond well to the established role
structure in the firm. Routinization makes it more difficult for organizations to
incorporate and react to non-standard forms of information, including possible
entrepreneurial opportunities (Cyert and March 1963; Nelson and Winter 1982). Even if
entrepreneurial opportunities are identified, bureaucratic firms may be unlikely to pursue
them if the opportunities are surrounded by great uncertainty about the likelihood of
11
success, and if they require highly uncertain investments in new organizational
capabilities (Henderson 1993; Scharfstein and Stein 2000).
As this discussion suggests, the prediction that the inertia of bureaucratic firms
should lead to higher individual rates of entrepreneurship rests on an image of
entrepreneurship as an act of frustration with a recalcitrant bureaucracy (Freeman 1986).
In this imagery, the employees of bureaucratic and non-bureaucratic firms have the same
entrepreneurial potential; higher rates of entrepreneurship among the employees of
bureaucratic firms reflect a failure on the part of bureaucracies to take full advantage of
their employees’ entrepreneurial potential. The expectation that bureaucracies should
have lower individual rates of entrepreneurship, by contrast, derives from the assumption
that the experience of working in a bureaucratic setting has a detrimental impact on the
entrepreneurial potential of a firm’s employees. The basis for this prediction can be seen
by considering how role specialization and routinization might impact entrepreneurial
abilities, as well as the likelihood of being exposed to entrepreneurial opportunities.
Employees who undertake a narrow range of tasks should be less likely to become
entrepreneurs for two reasons (Dobrev and Barnett 2002; Gompers, Lerner and
Scharfstein 2003; Wagner 2004). First, the role differentiation and specialization of
bureaucratic firms should generally lead to lower entrepreneurial abilities. Successful
entrepreneurship requires the mastery of a wide variety of roles. This suggests that
experience solving the wide variety of problems faced by organizations can lead to
increases in entrepreneurial skills (Lazear 2001). While employees of bureaucratic firms
may on occasion rotate through different functional responsibilities, however, the
prototypical job ladder within an internal labor market typically rewards depth of skills as
12
opposed to breadth. The average diversity of work experiences should therefore be
higher among workers in firms without an elaborate division of labor. Greater
entrepreneurial ability in turn makes more projects viable and therefore leads us to expect
that rates of entrepreneurship should be higher in less bureaucratic firms.
Employees with broader role definitions are not only likely to have a broader set
of skills, but are also more likely to acquire a broad knowledge of the firm’s external
environment, compared to employees specialized in particular tasks (Saxenian 1994).
This puts them in a better position to identify entrepreneurial opportunities, and places
them in a network of buyers and suppliers. By contrast, as the division of labor within
the firm grows more fine-grained, administrative functions devoted to coordination and
control become more important. Workers in more bureaucratic firms are therefore
generally more inwardly focused on average and less likely to understand the
entrepreneurial landscape. This again suggests that a more fine-grained division of labor
should lead to lower rates of entrepreneurship.
The routinization of activities within the firm also has implications for the work
experiences of the firm’s employees. Routinization implies that the average worker
exercises relatively little discretion in his or her daily activities, which instead largely
consist of adhering to established policies and procedures. To the extent that the firm is
engaged in little exploratory learning, its employees are exposed to few opportunities to
engage in exploratory learning themselves. The ability to adapt flexibly to new situations
is an important entrepreneurial skill. The consequences of this for entrepreneurial
activity may be similar to the expected consequences of increased role specialization: the

13
average worker has less diverse work experiences, and should therefore be less likely to
enter entrepreneurship.
Prior Research
There are few empirical studies of the relationship between firm bureaucratization
and entrepreneurship. However, these studies generally suggests that rates of
entrepreneurship are lower in more bureaucratic firms. Wagner (2004), using a cross-
sectional survey of the German population, found that people working for young and
small firms were more likely to self-identify as being in the process of launching an
entrepreneurial venture. However, this result may be generated by a self-selection
process: people who are predisposed to become entrepreneurs may choose to work for
small, young firms before entering entrepreneurship, either because they have a
preference for employment in less bureaucratic settings, or because they are trying to
acquire relevant entrepreneurial experiences. Figure 1 presents evidence consistent with
such a sorting process by considering the distribution of parental self-employment by
employer size. Children of self-employed parents are substantially more likely to
become self-employed themselves (Aldrich, Renzulli and Langton 1998; Dunn and
Holtz-Eakin 2000; Sørensen 2004), and research suggests that this at least in part due to
the impact of parental self-employment on their children’s aspirations and job values
(Halaby 2003; Sørensen 2004). Figure 1 shows that children of the self-employed are
over-represented in small firms; similarly, individuals with prior self-employment
experience are more likely to work for small firms (not shown). (A similar pattern exists
for firm age.) This suggests that any observed correlation between firm size or age and
14
rates of entrepreneurship may plausibly be attributed to a sorting process. The cross-
sectional nature of Wagner’s (2004) data makes it impossible to address this possibility.
Dobrev and Barnett (2002) looked at the effect of firm size and age on the
likelihood of entrepreneurial entry in a sample of graduates from the Stanford University
Graduate School of Business. While their study was designed to investigate how
different work experiences within and between firms affected entrepreneurship, they
found evidence that the entry rate was lower in large and old firms. However, their study
did not address the extent to which these patterns might be due to unobserved individual
characteristics. Furthermore, the specialized nature of their sample makes it difficult to
draw inferences about processes in the general population; in particular, the unobserved
selection process into business school may potentially lead to biased estimates.
Finally, Gompers, Lerner and Scharfstein (2003) investigated how firm
characteristics (including such measures of bureaucratization as firm size, age and
diversification) affected the rate at which existing firms “spawn” new ventures. Their
analyses also suggest that rates of entrepreneurship are higher in less bureaucratic firms.
However, the design of the Gompers, Lerner and Scharftsein (2003) study has a number
of limitations. First, the sample of existing firms is limited to publicly traded firms. This
results in a truncated age and size distribution, and raises concerns that the sample is
biased toward more successful firms on average. Furthermore, their measure of
entrepreneurship is limited to those ventures that successfully secured venture capital
funding, which confounds entrepreneurial entry with success in acquiring venture capital
funding. The results may therefore reflect the impact of employer characteristics on the
ability of entrepreneurs to secure venture capital (Burton, Sørensen and Beckman 2002).
15
Finally, Gompers, Lerner and Scharfstein (2003) use firms, as opposed to individuals, as
the unit of observation by performing analyses of the number of new ventures that
emerge from existing firms. This again raises questions about the extent to which there is
an unmeasured correlation between individual characteristics (observed or unobserved)
and the firm characteristics of interest.
Empirical Procedure
As this discussion suggests, establishing the empirical relationship between
bureaucracy is not straightforward. One major source of complications is the potential
presence of unobserved heterogeneity at both the individual and the organizational levels.
To help identify an empirical strategy, it is helpful to consider first the (fictitious) ideal
data for establishing a causal effect of bureaucratization on entrepreneurship. The
thought experiment involves assigning two otherwise identical individuals to two
otherwise identical organizations. The ‘experimental manipulation’ then consists in
assigning a higher level of bureaucracy to one organization. If rates of entrepreneurship
are higher (lower) in the firm with higher bureaucracy, we would conclude that
bureaucracy has a positive (negative) effect on entrepreneurship.
This thought experiment is fanciful, since it is impossible to meet the conditions
outside (and perhaps inside) a laboratory, yet it helps identify the sources of inferential
challenges in a field study of the relationship between entrepreneurship and bureaucracy.
The first and arguably most important challenge arises from unobserved individual
heterogeneity, and reflects the fact that individuals are not randomly assigned to
employers with different levels of bureaucratization. Instead, in most cases people have
substantial discretion over the types of firms they work for. As noted earlier, perhaps the

16
most plausible scenario is that employees with a taste for entrepreneurship may choose to
work for firms with low levels of bureaucratization, either because they prefer less
bureaucratic work environments or because they anticipate becoming entrepreneurs
themselves and are seeking to acquire relevant skills. Since such individuals are more
likely to enter into entrepreneurship, this type of sorting would generate a spurious
negative relationship between bureaucratization and entrepreneurship.
If one assumes that the unobserved individual characteristics correlated with
entrepreneurship are fixed over time, a solution to this problem is to estimate fixed-effect
models of the transition to entrepreneurship. A fixed-effects model focuses on the effect
of within-career variation in the level of bureaucratization of an individual’s employers
on the transition rate. As such, the fixed effects strategy asks whether individuals are
more or less likely to enter entrepreneurship if they are working for a firm that is more
bureaucratic than other firms during their career. Such a model can be estimated using
conditional logistic regression as a fixed-effects discrete time model (Allison and
Christakis 2000). The analysis is limited to individuals who eventually entered into
entrepreneurship because estimation of a fixed-effects model requires variation in the
dependent variable within individuals.
While attractive, this analytic strategy suffers from a number of limitations. First,
the use of a fixed-effects estimator only addresses the issue of fixed unobserved
heterogeneity among individuals. It leaves open the possibility that people’s preferences
for entrepreneurship may vary in unobserved, time-varying ways that also impact the
17
choice of employer prior to entrepreneurial entry.4 One might imagine, for example, that
unobserved life events might increase an individual’s entrepreneurial aspirations, and that
as a result of these changes, the individual seeks out employment opportunities in more
entrepreneurial settings. Absent a strong theory of the emergence of entrepreneurial
opportunities, however, it is difficult to address this possibility.
Second, the nature of the conditional fixed-effects estimator in a hazard rate
context limits the range of time-varying individual characteristics that can be controlled
for. In particular, the conditional fixed effects estimator will lead to biased estimates of
any variables that are correlated with time (Allison and Christakis 2000). This is a
consequence of the fact that when studying a non-repeatable event, such as the first
transition to entrepreneurship, the event necessarily occurs at the end of the observation
period. Duration at risk is therefore a perfect predictor of the event, and any variable that
is correlated with duration at risk will appear to be correlated with the hazard rate, even if
the true correlation is zero. This fact rules out a wide range of variables plausibly related
to the decision to enter entrepreneurship, including such factors as income and wealth,
since they tend to increase with time.5
4 One way to address this problem is to identify particular events that make it more likely that someone will become an entrepreneur, and then see whether people who experience these events are more likely to switch to less bureaucratic firms prior to entering entrepreneurship themselves. One possible such event is windfall gains (e.g., winning the lottery) as this has been shown to increase the likelihood of entering entrepreneurship. I leave this for future research.
5 One way to address this shortcoming would be to treat the entrepreneurial transition as a repeatable event, and include observations for individuals after they end their first entrepreneurial venture (if they do). This raises a whole host of complicated selectivity issues, however.
18
Third, the sampling scheme necessitated by the conditional fixed effects estimator
creates complications in estimating the effects of organizational characteristics. As noted
earlier, individuals are only included in the sample if they transition to entrepreneurship
at some time during the observation period. Because a large organization has more
employees at risk of transitioning to entrepreneurship than a small organization, a
transition to entrepreneurship from a large organization is more likely to be included in
the sample than a transition from a small organization. In other words, transitions to
entrepreneurship (and hence individual career histories) are sampled proportional to the
size of the employing organization, even if organizational size is uncorrelated with the
transition rate. This oversampling of transitions from large firms will impart an upward
bias to the estimates of the effects of organizational characteristics correlated with size.
To account for this, I weight each individual’s contribution to the likelihood function by
the inverse probability of the organization’s inclusion in the sample.6
Finally, within-person models rely on a between-firm variation in levels of
bureaucracy. This between-firm variation may be correlated with other, unobserved firm
characteristics that affect the rate of entrepreneurship (such as a particular corporate
culture, or firm promotion policies). Unobserved organizational heterogeneity could
therefore generate a spurious within-person correlation between bureaucracy and
entrepreneurship. It is tempting to address this problem by including firm-level fixed
effects in addition to individual fixed effects. However, firm fixed effects are not
6 This probability is estimated by estimating a linear regression of the number of entrepreneurial transitions from a firm on the number of employees, the number of establishments, and whether or not the firm is diversified. The parameter estimates from this regression are used to compute the weight associated with the firm that a sampled individual worked for when they transitioned to entrepreneurship.

19
identified when individual fixed effects are included and the event is non-repeatable, as is
the case here. The conditional fixed effects estimator requires variation on the dependent
variable (i.e., the transition to entrepreneurship). As noted earlier, this means that
individual effects restrict the sample to those individuals who enter entrepreneurship.
The further inclusion of firm fixed effects would restrict the sample to the period when
the individual worked for the firm that he or she eventually left in order to enter
entrepreneurship. In short, each individual’s history would be restricted to their
attachment to a single firm. In this case, the individual and firm fixed effects cannot be
separately identified.
This constraint forces a choice between individual and firm fixed effects. A
within-firm estimation strategy that compares the transition rates of individuals hired at
different stages of the bureaucratization process effectively addresses the potentially
confounding effects of fixed unobserved firm characteristics. However, this approach is
vulnerable to unobserved heterogeneity among the individuals, since there is no random
assignment of individuals. Differences among individuals who join the organization at
different points may reflect self-selection. In light of the evidence in Figure 1 that such
sorting processes may be substantial, I focus on estimating models that address the
possible effects of unobserved heterogeneity at the individual level.
Data and Measures
I analyze data characterizing the Danish labor market from a database called the
Integrated Database for Labor Market Research (known by its Danish acronym, IDA).
IDA is a longitudinal database constructed from governmental registers and maintained
by Statistics Denmark for research purposes. It contains a wealth of demographic

20
information characterizing the entire population of Denmark, as well as information on
employment status and income. Most importantly for present purposes, IDA is a
matched employer-employee database, so employees can be linked to their employers.
IDA also contains information on people who are not employed, which means that
transitions to self-employment status can be observed.
The data for analysis come from a special extract from IDA I commissioned for a
broader project on a variety of issues in the analysis entrepreneurship. (For
confidentiality reasons, Statistics Denmark does not allow direct access to IDA and
requires researchers to request and use specified subsets of the database.) This extract
covers all people residing legally in Denmark in 1994 who were between the ages of 15
and 74. These individuals are tracked back in time until the first year of IDA data, 1980.
These individuals are also tracked forward in time until 1997. One consequence of this
sample construction is that individuals who were either not residing in Denmark in 1994,
or not between the ages of 15 and 74 at that time, are not included in the sample. For
labor market data, this means that some individuals who were in the labor force in earlier
years (say 1980) will not be included in the sample (for example, people who were 75 in
1994 but still in the labor force at age 61 in 1980). This issue primarily affects older
individuals, especially those over the age of 60 in 1980. As discussed below, I restrict
the sample for the multivariate analyses to individuals who were between the ages of 16
and 40 in 1990; this age group is less likely to have suffered much non-random attrition.
However, the attrition from the sample does mean that there is some downward
measurement bias associated with measures like a firm’s number of employees as one
moves away from 1994.
21
The construction of the sample for analysis was guided by two major principles.
First, since the dynamics of serial entrepreneurship are likely different from the initial
transition into entrepreneurship, I excluded individuals with a prior history of
entrepreneurial activity from the risk set. Second, the transition to entrepreneurship is a
form of job turnover that depends on duration in the job (Sørensen 2004). This suggests
that employees should be observed from when they first become at risk of leaving a
particular employer for entrepreneurship, in order to avoid the biases introduced by left-
censoring (Tuma and Hannan 1984).
These principles led me to impose a set of restrictions on the IDA data.
Specifically, the sample is limited to those individuals who a) were employed in 1990; b)
were newly hired by their employer in 1990 (i.e., zero firm tenure); c) had no prior self-
employment experience between 1980 and 1990; d) were between the ages of 16 and 40
in 1990; and e) were not employed in the primary sector (agriculture and extractive
industries) or in industries dominated by the public sector. The decision to focus on
people employed in 1990 reflected an attempt to balance the tradeoffs created by the left-
censoring of all IDA data in 1980 and the right-censoring of observations in 1997. The
left-censoring of IDA data in 1980 means that any prior labor force history is unknown
for people in the labor market in 1980. By focusing on individuals in the labor force in
1990, I employ the IDA data from 1980 and 1990 to identify and exclude individuals
with any self-employment history between 1980 and 1990. In combination with the age
restriction, this should capture the vast majority of people with prior entrepreneurial
experience. Similarly, the restriction to individuals newly hired in 1990 ensures that
individuals are followed from when they first become at risk of leaving their employer to
22
enter entrepreneurship. 7 Finally, I exclude individuals in the primary sector and in
industries dominated by the public sector because the dynamics of entrepreneurial
activity may be substantially different in these sectors. In particular, Denmark has a very
large public sector, with the state accounting for a large share of employment. People
who work for the state therefore work for very large employers. Public sector employees
may have lower transition rates for reasons that are unrelated to firm size.
Transitions to entrepreneurial activity from employment are measured using the
occupational classification scheme employed by Statistics Denmark. This classification
scheme differentiates between a wide variety of labor force attachments, including
employment with established firms (sub-divided into seven broad, hierarchical
categories), unemployment, schooling, not in the labor force, and self-employment.
Statistics Denmark employs two primary categories for self-employment. The first
captures individuals who are unincorporated proprietors with employees; the second
captures self-employed individuals with no employees. There are two major limitations
associated with measuring transitions to entrepreneurship in this way. First, due to
limitations in the government registers upon which IDA is based, the founders of
incorporated ventures cannot be identified and linked to the other registers which provide
the primary labor market data. Founders of incorporated ventures appear as employees of
the new employers, but there is no direct means of identifying the founders. This means
that these transitions cannot be measured directly. Second, the group of individuals who
are self-employed without any employees is potentially very heterogeneous. This
category includes individuals whose entrepreneurial ventures are in the early stages but
7 People remain in the sample if they change employers.

23
may subsequently grow to include employees. However, it likely also includes many
people that might better be characterized as independent contractors, as well as
individuals with more marginal labor force attachments who turn to self-employment as a
last resort. There is no reliable means of differentiating between these different groups.
Instead, I present analyses that differentiate between the two types of self-employment in
addition to pooled analyses.
Entry into entrepreneurship can be a response to poor employment prospects as
well as a reaction to the presence of entrepreneurial opportunities. In order to limit the
extent to which the observed transitions might be due to such push factors of various
types, I treat transitions to entrepreneurship as censored if the individuals in question
experienced a period of unemployment between their observed employment in one year
and their subsequent self-employment the next year. Similarly, I censor transitions to
entrepreneurship that occur simultaneously with the failure of the individual’s employer.8
Turning now to measures of organizational characteristics, it should be noted that
studying the relationship between bureaucracy and entrepreneurship is complicated by
the fact that an organization’s degree of bureaucratization is an unobservable construct.
Moreover, constructing and collecting specialized measures of role specialization and
routinization in the type of large scale sample needed to capture transitions to
entrepreneurship is prohibitively difficult. Instead, I focus on three easily observable
organizational characteristics – firm size, age and industrial diversification – and examine
how they affect individual rates of entrepreneurial activity.
8 As might be expected, this has dramatic consequences for the estimated effects of firm size and firm age, since small and young firms have higher failure rates.
24
Organizational size is a classic variable in organizational research, and is of
interest because it has implications for both the degree of role specialization and
routinization of activities. A long line of research suggests that large firms generally
have a more fine-grained division of labor and more elaborate organizational hierarchies
(e.g., Blau and Schoenherr 1971). Furthermore, the coordination challenges faced by
large firms also leads to a greater reliance on standard operating procedures and less
exploratory learning. Organizational size is therefore a key measure of how bureaucratic
a firm is. I measure firm size as the (log of) the number of employees in a given year. I
account for the fact that organizational size distributions differ across industries by using
a standardized measure that adjusts for the mean and standard deviation of firm size in
the firm’s industry.
Along with organizational size, the effects of organizational age have been
extensively studied, particularly by organizational ecologists (e.g., Freeman, Carroll and
Hannan 1983; Hannan 1998; Sørensen and Stuart 2000). Holding size constant, the
primary impact of organizational aging is to increase routinization (Stinchcombe 1965).
For example, Sørensen and Stuart (2000) found that, holding size constant, older
organizations were less likely to engage in exploratory innovation, and instead more
likely to exploit established competencies. Firm age is measured as the number of years
since the founding of the firm. However, the founding date of firms can only be
determined for employers founded after 1981, since it is inferred from the appearance of
the firm in the IDA registers. The ages of firms founded in 1980 or earlier cannot be
determined. For this reasons, I use dummy variables to differentiate between different
age groups. Because a firm’s routines are likely to be established relatively early in its

25
life, I settled on four age groups: zero years old, one to two years old, three to nine years
old, and ten or more years old. I separate out newly founded firms because the
employees of are more likely to be founders of those new ventures.
The primary disadvantage of these measures of bureaucratization lies in their
generality, which makes it difficult to adjudicate between different explanations for the
observed associations. While the empirical analyses can adjudicate between conflicting
predictions regarding the effects of firm size, for example, there is no shortage of
potential competing explanations for an observed negative relationship between firm size
and entrepreneurship. Adjudicating between such competing explanations for the same
observed association is beyond the scope of this paper. Instead, the primary goal of the
paper is to establish the major contours of the empirical phenomenon as a guide to future
theoretical development. The absence of careful studies hinders the development of our
theoretical understanding of bureaucracy and entrepreneurship: with few empirical facts
available to discipline theoretical speculation, it is difficult to make progress on
establishing the social mechanisms that might cause an association between bureaucracy
and entrepreneurship.
Results
Figure 2 presents descriptive evidence of the relationship between the rate of
entrepreneurship and firm size. These estimates are based on the sample and event
definition described above. The sample consists of 306,189 new hires in 1990 observed
for a total of 1,354,792 person-years at risk. The overall rate of entry into
entrepreneurship is 0.51%, meaning that we observe five transitions to entrepreneurship
for every 1,000 person-years at risk. This rate is somewhat low by international
26
standards, although it is important to note that this estimate pools across a very large and
heterogeneous population. Furthermore, this measure somewhat under-estimates the
annual transition rate due to IDA’s measurement practices, which capture an individual’s
labor force status once a year in the 48th week. Some individuals may have entered and
exited entrepreneurship between measurement intervals. However, the comparatively low
rate of entrepreneurship likely also reflects the strong social safety net which lowers the
extent to which people enter entrepreneurship due to “push” factors such as poor
employment prospects (Carrasco and Ejernæs 2003).
Figure 2 contains separate estimates of the transition rate for individuals with and
without self-employed parents, since these groups have different baseline propensities to
enter entrepreneurship. Parents are coded as self-employed if they were self-employed at
any time before 1980 and 1990. For both groups, the pattern is clear: the rate of
entrepreneurship declines, in a roughly logarithmic fashion, with the size of the current
employer. The fact that the pattern is largely identical for people with and without self-
employed parents suggests that the relationship between firm size and entrepreneurship
cannot simply be attributed to the sorting observed in Figure 1. Nonetheless, the
relationship between firm size and entrepreneurship may reflect the sorting of individuals
along other dimensions, suggesting the need for multivariate analyses.
Table 1 presents estimates from discrete-time event history models of the
transition to entrepreneurship, estimated using logistic regression. In these models, I
control for a host of individual characteristics that may be related to the propensity to
enter entrepreneurship. Not included in Table 1 are dummy variables for the broad
occupational category of employment (e.g., upper white collar, lower blue collar), highest

27
level of education completed, and educational major coded in a fourteen category
scheme. Most demographic and labor market variables in Table 1 are self-explanatory.
All monetary values, such as income, assets and debts, are deflated to 1980 values. For
individuals already in the labor force in 1980, I measured labor force experience by
imputing the expected years of labor force experience based on age and educational
attainment, and then added the number of years employed between 1980 and 1990.
The first model in Table 1 shows that the rate of entrepreneurship is strongly
influenced by the size of an individual’s current employer (relative to other employers in
the same industry): people in large firms are substantially less likely to become
entrepreneurs. A one unit change in the standardized firm size variable corresponds to a
one standard deviation increase in firm size relative to the size distribution of the firm’s
industry. The point estimate in the first model of Table 1 suggests, for example, that such
an increase in firm size lowers the rate of entrepreneurship by approximately 14%.
Model 2 adds the measures of firm age. The estimates for the second model suggest that
the firm size effect does not simply reflect the fact that many small firms are also young.
The estimates also indicate that individuals working for young firms are more likely to
enter entrepreneurship.
In Model 3, I introduce controls for the employer’s industrial diversification.
While diversification is positively correlated with firm age and size, firms of the same
age and size may differ in the extent to which workers are employed in different
industries. Holding size and age constant, diversified firms may be more bureaucratic,
since they typically face more complex coordination tasks. However, because diversified
firms operate in more heterogeneous environments than focused firms, employees of
28
diversified firms may be in a better position to identify entrepreneurial opportunities that
stand at the intersection of different markets and knowledge arenas. Diversification is
measured using the industry codes assigned by Statistics Denmark to workplaces.9
Because industry is measured at the workplace level, only firms that have multiple
workplaces can be diversified. In order to avoid confounding a diversification effect with
a potential effect due to the number of workplaces, I therefore also control for the number
of workplaces.
The estimates in the third model indicate that rates of entrepreneurship are lower
in diversified firms, but the effect is only marginally significant. Moreover, the estimates
show that the lower entrepreneurship rate in large firms is not due to the fact that large
firms are more likely to have multiple workplaces and be diversified. The estimates of
firm age are also largely unaffected.
Finally, the fourth model of Table 1 includes industry fixed effects, which capture
differences across industries in the rate of entrepreneurship due to unobserved factors that
might be correlated with firm characteristics. While the effects of firm size are not very
sensitive to the inclusion of industry fixed effects (in part because the size variable is
standardized by industry), the estimates for firm age and diversification are more
sensitive. In general, the inclusion of the industry fixed effects attenuates the impact of
firm age and diversification, which reflects the fact that the distributions of these
variables vary systematically with the rate of entrepreneurship. The estimates for firm
9 Firms may have multiple workplaces, each of which is assigned a standard industry code based on their primary activity. (Statistics Denmark uses a standard (ISIC rev. 2) 111-category industry classification scheme.) I treat a firm as diversified if it has workplaces in more than one industry.
29
age in the final column of Table 1 suggest that people are especially likely to enter into
entrepreneurship if they are working for very young firms between one and two years
old. (It is important to recall here that the measurement of transitions to entrepreneurship
excludes transitions due to the failure of the employer, so this result cannot be attributed
to higher failure rates among young firms.) This result is consistent with the argument
that the relative lack of routinization and a formal division of labor in young firms puts
employees of these firms in a position to acquire the skills and knowledge necessary to
become entrepreneurs. It is also consistent with the notion that young firms expose their
employees to more entrepreneurial opportunities. By contrast, there is no evidence in
Table 1 that diversification either encourages or retards entrepreneurship once industry
fixed effects are taken into account.
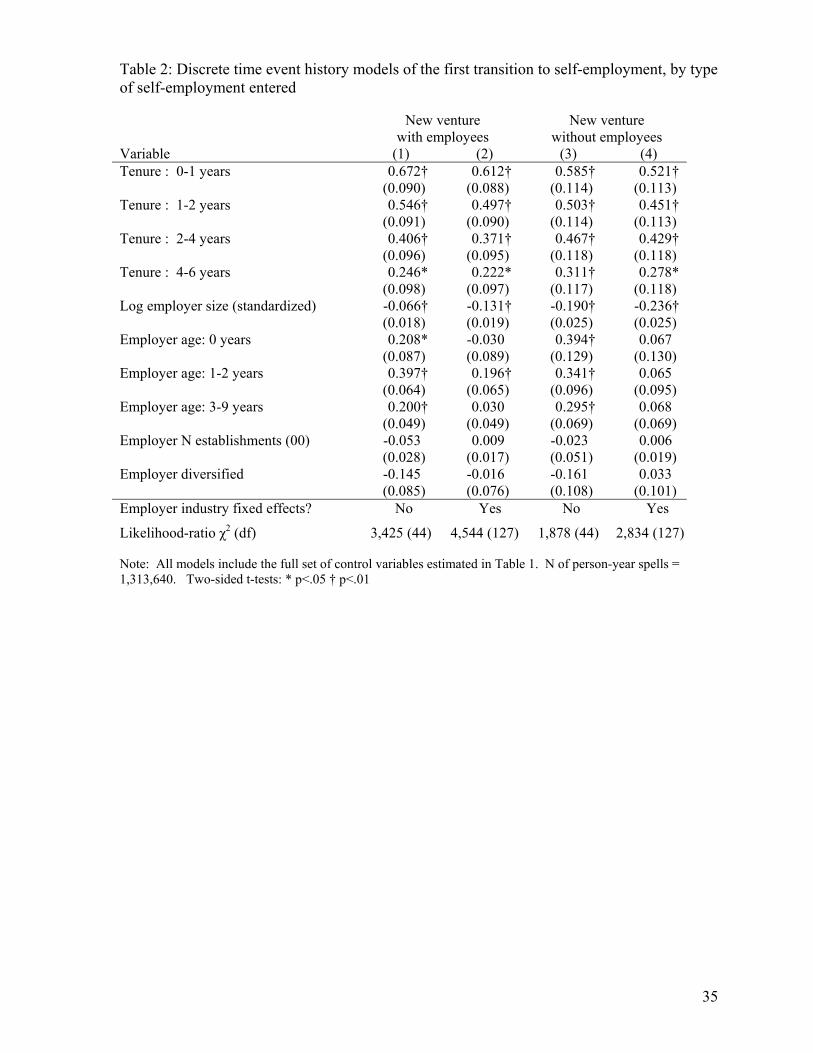
The analyses in Table 1 treat all transitions to self-employment equally. As noted
earlier, it can be argued that some of these transitions may be better characterized as entry
into independent contractor status, or as responses to marginal labor force attachments.
Table 2 therefore re-estimates the full models in Table 1 for the two different types of
transitions that can be observed, namely the creation of new ventures with and without
employees, respectively. Unlike independent contractors, people who found ventures
with employees create new firms. The estimates in Table 2 generally support the same
conclusions as the pooled estimates in Table 1, both with and without industry fixed
effects. Firm size lowers the likelihood of both types of transitions. However, it is
interesting to note that the negative effect of firm size is approximately twice as large for
people who transition to new ventures with no employees. People who work for firms
between one and two years of age are more likely to found firms with employees, but

30
firm age has no impact on transitions to independent contractor status once industry fixed
effects are included. Diversification again has no significant effect on the rate of
entrepreneurship.
The estimates in Tables 1 and 2 indicate that bureaucratic firms inhibit the
development of entrepreneurial activity among their employees. These results are
consistent with the argument that the specialized roles and routinization of bureaucratic
organizations makes it less likely that their employees will develop entrepreneurial skills
and be in a position to recognize entrepreneurial opportunities. However, the observed
effects of firm size and age are both subject to an alternative interpretation, which would
argue that these measures capture the attractiveness of the entrepreneurial opportunities
in the employer’s industry. Rates of entrepreneurship may be lower among employees of
large firms, for example, because the prospect of competing with a large firm is
unattractive. Similarly, employees of relatively young firms may interpret their
employer’s survival as an indicator of the value of the entrepreneurial opportunities in the
employer’s industry.
I investigate this issue in Table 3 by distinguishing between two types of
entrepreneurial transitions, namely transitions where the new venture is located in the
same industry as the entrepreneur’s former employer, and transitions to a different
industry. The estimates in Table 3 indicate that firm size has a substantially more
retarding effect on the rate of entering the same industry as the parent firm than on the
rate of entering a different industry. This is consistent with the idea that entering the
same industry as a large employer is unattractive. However, firm size is still a significant
predictor of entrepreneurial transitions that do not put the entrepreneur into direct

31
competition with his or her former employer. This is consistent with the argument that
large firms have a negative impact on the development of entrepreneurial activity among
their employees.
An important objection to the analyses presented so far is that the estimates are
potentially biased by the presence of unobserved individual characteristics related to the
propensity to enter entrepreneurship. To address this possibility, Table 4 presents
estimates from conditional fixed effects logit models of the transition to entrepreneurship.
By the nature of the estimator, these models are restricted to those individuals in the
sample who entered into entrepreneurship between 1990 and 1997.10 These models are
estimated on samples that include workplace attachments prior to 1990. This creates
complications for the measurement of organizational age, since age is unknown for all
firms founded prior to 1980. To address this, I restrict the sample to workplace
attachments after 1983 and drop the dummy variable for firm age between three and nine
years. As before, I estimate models with and without industry fixed effects.
Several things stand out in Table 4. First, the estimates in the first and second
columns indicate that people are more likely to enter into entrepreneurship when they
work for small firms than when they work for large firms. Second, the primary effect of
organizational age appears to be that individuals are less likely to transition to
entrepreneurship if they are working for a firm that has just been founded. Since these
individuals may well be part of the original founding team, this is not surprising. Finally,
while diversification had no significant effect in the models without individual fixed
10 For these individuals, I include all prior workplace attachments prior to 1990 in the models.
32
effects, diversification has a positive effect once individual fixed effects are included.
This is consistent with the notion that the greater environmental heterogeneity faced by
diversified firms exposes their employees to more entrepreneurial opportunities. It is also
consistent with the notion that diversified firms are less able to respond to entrepreneurial
opportunities than focused firms of equal size. These results should, however, be treated
with caution, since the effects of diversification are inconsistent across estimation
methods.11
One possible objection to the fixed-effects results is that they cannot account for
the possibility that people develop entrepreneurial aspirations as a consequence of
exogenous events in their lives, and that they then decide to move to smaller firms in
order to develop entrepreneurial skills. Such a scenario seems unlikely for two reasons.
First, the diversification effect implies that for this scenario to play out, people who
develop entrepreneurial ambitions would have to decide to work for more diversified
firms. This is in contradiction to a decision to work for smaller firms, since diversified
firms are large. Second, in the final two columns of Table 4, I include interaction effects
between an indicator for parental self-employment and the firm characteristics of interest.
As before, I use parental self-employment as an indicator of individuals who are more
likely to aspire to being self-employed. If the effect of firm size, for example, is a
11 It is interesting to note that both the null and the positive observed effects of diversification contradict the findings of Gompers, Lerner and Scharfstein (2003), who found that focused firms were more likely to spawn entrepreneurs than diversified firms. Other things being equal, the results presented here arguably deserve greater weight, since they are performed at the correct level of analysis (the individual), use a more general measure of entrepreneurship that does not confound the acquisition of venture capital with the entrepreneurial decision, and includes a population of employers that is not truncated. However, it is also possible that the difference reflects difference between the Danish and American contexts, particularly in the dynamics of entrepreneurship.

33
spurious consequence of exogenous changes in entrepreneurial aspirations, we would
expect the effect of firm size to be attenuated among people with more entrepreneurial
ambitions. There is some evidence, in the last two columns of Table 4, consistent with
this argument: the positive interaction effect between parental self-employment and firm
size suggests that people with entrepreneurial aspirations are less sensitive to firm size.
The magnitude of this interaction effect is small, however, relative to the effect of firm
size; even among children of the self-employed, the rate of entrepreneurship is
substantially higher when they work for small firms.
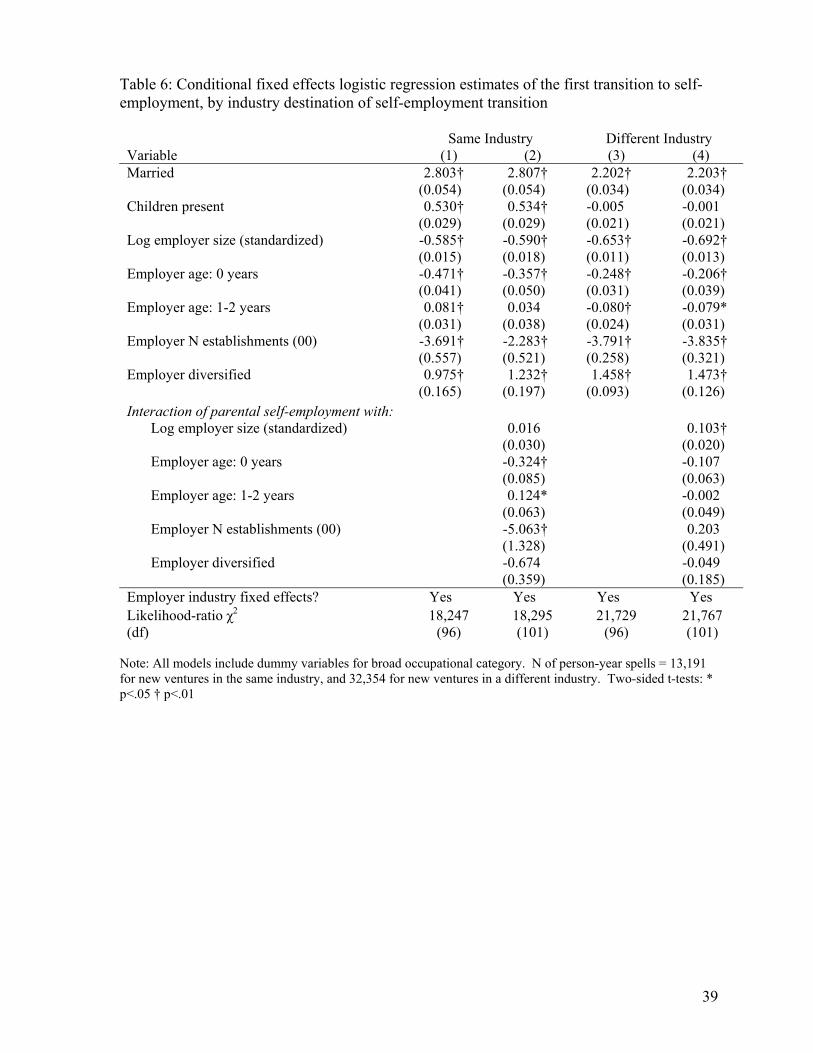
Tables 5 and 6 repeat the analyses in Table 4, but distinguish between the two
different types of entrepreneurial transitions (Table 5) and industry destination (Table 6).
The results in these tables parallel the earlier results, suggesting that the observed effects
are not due to the pooling of the different types of entrepreneurial transitions.
Discussion and Conclusion
This paper provides the first systematic, large-scale evidence on the effects of
organizational bureaucracy on entrepreneurship. There is little evidence here to support
the argument that the frustrations of working for bureaucratic organizations lead to
entrepreneurial activity.
[....]

34
Table 1: Discrete time event history models of the first transition to self-employment Variable (1) (2) (3) (4) Tenure : 0-1 years 0.677† 0.627† 0.609† 0.546† (0.074) (0.073) (0.073) (0.071) Tenure : 1-2 years 0.561† 0.521† 0.504† 0.451† (0.073) (0.073) (0.073) (0.071) Tenure : 2-4 years 0.447† 0.421† 0.406† 0.370† (0.076) (0.076) (0.076) (0.074) Tenure : 4-6 years 0.271† 0.262† 0.259† 0.233† (0.076) (0.076) (0.076) (0.076) Female -1.003† -1.008† -1.004† -1.095† (0.037) (0.037) (0.037) (0.037) Danish born -0.747† -0.731† -0.730† -0.620† (0.074) (0.074) (0.074) (0.074) Age 0.222† 0.217† 0.215† 0.213† (0.024) (0.024) (0.024) (0.024) Age squared -0.003† -0.003† -0.003† -0.003† (0.000) (0.000) (0.000) (0.000) Married 0.125† 0.128† 0.127† 0.127† (0.037) (0.037) (0.037) (0.037) Children present -0.057 -0.057 -0.057 -0.032 (0.035) (0.035) (0.035) (0.035) Log labor force experience 0.625† 0.630† 0.634† 0.608† (0.047) (0.047) (0.047) (0.047) Log salary income -0.256† -0.257† -0.258† -0.237† (0.019) (0.018) (0.018) (0.020) Non-salary income 0.294† 0.288† 0.288† 0.277† (0.059) (0.058) (0.058) (0.060) Log debts 0.034† 0.034† 0.034† 0.034† (0.004) (0.004) (0.004) (0.004) Log assets 0.032† 0.032† 0.032† 0.039† (0.006) (0.006) (0.006) (0.006) Parents self-employed before 1990 0.358† 0.357† 0.356† 0.341† (0.028) (0.028) (0.028) (0.028) Log employer size (standardized) -0.141† -0.108† -0.100† -0.158† (0.016) (0.016) (0.016) (0.015) Employer age: 0 years 0.275† 0.263† 0.001 (0.073) (0.073) (0.074) Employer age: 1-2 years 0.396† 0.381† 0.160† (0.055) (0.054) (0.054) Employer age: 3-9 years 0.248† 0.230† 0.043 (0.041) (0.040) (0.040) Employer N establishments (00) -0.043 0.007 (0.035) (0.013) Employer diversified -0.154* -0.009 (0.074) (0.062) Employer industry fixed effects? No No No Yes
Likelihood-ratio χ2 (df) 4,102 (39) 4,251 (42) 4,261 (44) 5,828 (127) Note: All models include dummy variables for highest educational level achieved, educational major, and broad occupational categories. See text for details. N of person-year spells = 1,313,640. Two-sided t-tests: * p<.05 † p<.01
35
Table 2: Discrete time event history models of the first transition to self-employment, by type of self-employment entered New venture
with employees New venture
without employees Variable (1) (2) (3) (4) Tenure : 0-1 years 0.672† 0.612† 0.585† 0.521† (0.090) (0.088) (0.114) (0.113) Tenure : 1-2 years 0.546† 0.497† 0.503† 0.451† (0.091) (0.090) (0.114) (0.113) Tenure : 2-4 years 0.406† 0.371† 0.467† 0.429† (0.096) (0.095) (0.118) (0.118) Tenure : 4-6 years 0.246* 0.222* 0.311† 0.278* (0.098) (0.097) (0.117) (0.118) Log employer size (standardized) -0.066† -0.131† -0.190† -0.236† (0.018) (0.019) (0.025) (0.025) Employer age: 0 years 0.208* -0.030 0.394† 0.067 (0.087) (0.089) (0.129) (0.130) Employer age: 1-2 years 0.397† 0.196† 0.341† 0.065 (0.064) (0.065) (0.096) (0.095) Employer age: 3-9 years 0.200† 0.030 0.295† 0.068 (0.049) (0.049) (0.069) (0.069) Employer N establishments (00) -0.053 0.009 -0.023 0.006 (0.028) (0.017) (0.051) (0.019) Employer diversified -0.145 -0.016 -0.161 0.033 (0.085) (0.076) (0.108) (0.101) Employer industry fixed effects? No Yes No Yes
Likelihood-ratio χ2 (df) 3,425 (44) 4,544 (127) 1,878 (44) 2,834 (127) Note: All models include the full set of control variables estimated in Table 1. N of person-year spells = 1,313,640. Two-sided t-tests: * p<.05 † p<.01

36
Table 3: Discrete time event history models of the first transition to self-employment, by industry destination of self-employment transition Same industry Different industry Variable (1) (2) (3) (4) Tenure : 0-1 years 0.366† 0.257* 0.694† 0.657† (0.130) (0.129) (0.085) (0.083) Tenure : 1-2 years 0.411† 0.332* 0.534† 0.498† (0.132) (0.131) (0.085) (0.084) Tenure : 2-4 years 0.429† 0.371† 0.388† 0.366† (0.136) (0.136) (0.090) (0.089) Tenure : 4-6 years 0.283* 0.219 0.243† 0.235† (0.136) (0.136) (0.091) (0.091) Log employer size (standardized) -0.212† -0.346† -0.063† -0.077† (0.031) (0.027) (0.017) (0.018) Employer age: 0 years 0.651† 0.058 0.099 0.008 (0.130) (0.130) (0.088) (0.090) Employer age: 1-2 years 0.774† 0.254† 0.194† 0.117 (0.091) (0.090) (0.066) (0.067) Employer age: 3-9 years 0.510† 0.061 0.104* 0.041 (0.074) (0.073) (0.047) (0.048) Employer N establishments (00) -0.507 -0.112* -0.014 0.010 (0.279) (0.046) (0.027) (0.014) Employer diversified -0.767† -0.033 -0.016 -0.020 (0.195) (0.175) (0.075) (0.067) Employer industry fixed effects? No Yes No Yes
Likelihood-ratio χ2 (df) 1,684 (44) 3,078 (127) 3,517 (44) 4,227 (127) Note: All models include the full set of control variables estimated in Table 1. N of person-year spells = 1,313,640. Two-sided t-tests: * p<.05 † p<.01

37
Table 4: Conditional fixed effects logistic regression estimates of the first transition to self-employment Variable (1) (2) (3) (4) Married 2.452† 2.416† 2.453† 2.418† (0.028) (0.028) (0.028) (0.028) Children present 0.101† 0.163† 0.103† 0.165† (0.016) (0.016) (0.016) (0.016) Log employer size (standardized) -0.494† -0.637† -0.517† -0.665† (0.008) (0.008) (0.010) (0.011) Employer age: 0 years -0.064† -0.289† -0.017 -0.238† (0.023) (0.024) (0.029) (0.030) Employer age: 1-2 years 0.155† -0.003 0.153† -0.009 (0.018) (0.019) (0.023) (0.024) Employer N establishments (00) -7.837† -3.825† -7.700† -3.794† (0.280) (0.231) (0.343) (0.282) Employer diversified 1.336† 1.394† 1.329† 1.462† (0.078) (0.080) (0.102) (0.105) Interaction of parental self-employment with:
Log employer size (standardized) 0.061† 0.073† (0.016) (0.016) Employer age: 0 years -0.122† -0.134†
(0.047) (0.049) Employer age: 1-2 years 0.008 0.020 (0.037) (0.038) Employer N establishments (00) -0.341 0.012 (0.591) (0.457) Employer diversified 0.021 -0.160
(0.159) (0.163) Employer industry fixed effects? No Yes No Yes Likelihood-ratio χ2 (df)
26,914 (13)
35,211 (96)
26,942 (18)
35,248 (101)
Note: All models include dummy variables for broad occupational category. N of person-year spells = 45,545. Two-sided t-tests: * p<.05 † p<.01

38
Table 5: Conditional fixed effects logistic regression estimates of the first transition to self-employment, by type of self-employment entered New venture
with employees New venture
without employees Variable (1) (2) (3) (4) Married 2.570† 2.573† 2.384† 2.386† (0.052) (0.052) (0.035) (0.035) Children present 0.476† 0.476† 0.015 0.017 (0.029) (0.029) (0.020) (0.020) Log employer size (standardized) -0.650† -0.684† -0.632† -0.663† (0.015) (0.019) (0.010) (0.013) Employer age: 0 years -0.263† -0.132† -0.326† -0.342† (0.041) (0.050) (0.030) (0.038) Employer age: 1-2 years 0.002 0.005 -0.005 -0.031 (0.033) (0.042) (0.023) (0.029) Employer N establishments (00) -3.409† -2.489† -4.239† -4.702† (0.333) (0.380) (0.310) (0.394) Employer diversified 1.447† 1.374† 1.351† 1.503† (0.133) (0.166) (0.102) (0.139) Interaction of parental self-employment with:
Log employer size (standardized) 0.086† 0.083† (0.030) (0.020) Employer age: 0 years -0.400† 0.042
(0.088) (0.060) Employer age: 1-2 years 0.000 0.072 (0.066) (0.047) Employer N establishments (00) -2.530† 1.371* (0.730) (0.584) Employer diversified 0.341 -0.338
(0.278) (0.204) Employer industry fixed effects? Yes Yes Yes Yes Likelihood-ratio χ2 (df)
13,364 (96)
13,410 (101)
23,101 (96)
23,132 (101)
Note: All models include dummy variables for broad occupational category. N of person-year spells = 15,843 for new ventures with employees, and 29,702 for new ventures without employees. Two-sided t-tests: * p<.05 † p<.01
39
Table 6: Conditional fixed effects logistic regression estimates of the first transition to self-employment, by industry destination of self-employment transition Same Industry Different Industry Variable (1) (2) (3) (4) Married 2.803† 2.807† 2.202† 2.203† (0.054) (0.054) (0.034) (0.034) Children present 0.530† 0.534† -0.005 -0.001 (0.029) (0.029) (0.021) (0.021) Log employer size (standardized) -0.585† -0.590† -0.653† -0.692† (0.015) (0.018) (0.011) (0.013) Employer age: 0 years -0.471† -0.357† -0.248† -0.206† (0.041) (0.050) (0.031) (0.039) Employer age: 1-2 years 0.081† 0.034 -0.080† -0.079* (0.031) (0.038) (0.024) (0.031) Employer N establishments (00) -3.691† -2.283† -3.791† -3.835† (0.557) (0.521) (0.258) (0.321) Employer diversified 0.975† 1.232† 1.458† 1.473† (0.165) (0.197) (0.093) (0.126) Interaction of parental self-employment with:
Log employer size (standardized) 0.016 0.103† (0.030) (0.020) Employer age: 0 years -0.324† -0.107
(0.085) (0.063) Employer age: 1-2 years 0.124* -0.002 (0.063) (0.049) Employer N establishments (00) -5.063† 0.203 (1.328) (0.491) Employer diversified -0.674 -0.049
(0.359) (0.185) Employer industry fixed effects? Yes Yes Yes Yes Likelihood-ratio χ2 (df)
18,247 (96)
18,295 (101)
21,729 (96)
21,767 (101)
Note: All models include dummy variables for broad occupational category. N of person-year spells = 13,191 for new ventures in the same industry, and 32,354 for new ventures in a different industry. Two-sided t-tests: * p<.05 † p<.01

Number of employees
010
2030
Perc
ent
1-2 3-4 5-9 10-19 20-49 50-99 100-249 250-999 1,000+
Workers with self-employed parents, by firm size
Figure 1

Number of employees
02
46
810
Rate
per
1,0
00 p
erso
n-ye
ars
1-2 3-4 5-9 10-19 20-49 50-99 100-249 250-999 1,000+
Entry into self-employment by size of prior employerSelf-employed parent
No self-employed parents
Figure 2