Bulkley Valley Pasture Fertilization Demonstration Trials
58
2011 Submitted to: Smithers Farmers’ Institute 17970 Quick East Road, Telkwa, BC V0J 2X2 Submitted by: D’Arcy Consulting Services 18085 Grantham Road, Telkwa, BC V0J 2X2 December 31, 2011 Bulkley Valley Pasture Fertilization Demonstration Trials
Transcript of Bulkley Valley Pasture Fertilization Demonstration Trials

2011
Submitted to:
Smithers Farmers’ Institute 17970 Quick East Road, Telkwa, BC V0J 2X2 Submitted by:
D’Arcy Consulting Services 18085 Grantham Road, Telkwa, BC V0J 2X2 December 31, 2011
Bulkley Valley Pasture Fertilization Demonstration Trials

i
ACKNOWLEDGEMENTS This project was funded in part by the Investment Agriculture Foundation of BC through Agriculture and
Agri‐Food Canada’s Advancing Canadian Agriculture and Agri‐Food (ACAAF) program. The BC Ministry of
Agriculture was another important partner in this project. This project was sponsored and funded by
the Smithers Farmers’ Institute. Other funding support came from the Bulkley Valley Cattlemen’s
Association, the Pleasant Valley Cattlemen’s Association and the Northern Saddle Club. This project
would not have been possible without the generous in-kind contributions of Al and Rosalie Brandsma
and Rene and Joyce Dieleman, Paul Davidson, Matthew Taylor, Norm Dueck, Smithers Feed, Mark Perry
and Jane Lloyd-Smith, and Chris Hassell. Finally, thank you to Eileen Ewald for helping with the field
portion of this trial.
Agriculture and Agri‐Food Canada, the BC Ministry of Agriculture and the Investment Agriculture
Foundation of BC, are pleased to participate in the delivery of this project. They are committed to
working with their industry partners to address issues of importance to the agriculture and agri‐food
industry in British Columbia. Opinions expressed in this report are those of the author, and not
necessarily those of the above-mentioned agencies or organizations.

ii
TABLE OF CONTENTS Acknowledgements ........................................................................................................................................ i
Table of Contents .......................................................................................................................................... ii
1.0 Introduction ............................................................................................................................................ 1
2.0 Background Information ......................................................................................................................... 1
2.1 Forage Species Composition ............................................................................................................... 2
2.2 Timing of Fertilizer Application ........................................................................................................... 3
2.3 Nitrogen, Phosphorous & Potassium .................................................................................................. 3
2.4 Livestock Manure as Fertilizer ............................................................................................................ 4
2.5 Environmental Considerations ............................................................................................................ 6
3.0 Methods .................................................................................................................................................. 7
4.0 Results and Discussion .......................................................................................................................... 11
4.1 Clipping Data Results ........................................................................................................................ 13
4.2 Soil Analyses Results ......................................................................................................................... 15
4.3 Field Day ............................................................................................................................................ 16
5.0 Conclusions and Recommendations ..................................................................................................... 16
6.0 References ............................................................................................................................................ 19
6.1 Websites............................................................................................................................................ 20
Appendix I. Application Methods for Liquid and Solid Manure (as reproduced from BC MAL Nutrient
Management Factsheet No. 6). .................................................................................................................. 21
Appendix II. Pasture Fertilization Trial layout diagrams for both the Brandsma and Dieleman sites. ....... 22
Appendix III. BV Pasture Fertilization Demonstration Trials Brochure. ...................................................... 24
Appendix IV. Soil analyses results. Site 1A and 1B are the two replications at the Brandsma site. Site 2A
is the Dieleman site. .................................................................................................................................... 26

Bulkley Valley Pasture Fertilization Trials 1
1.0 INTRODUCTION Despite good intentions, it is common for well-used, older hay fields and pastures to get nutritionally
depleted over time. Producers in the Bulkley Valley maximize their forage growth over the relatively
short growing season by adding soil nutrients through the application of chemical fertilizer and/or
livestock manure. Many of the local producers are managing multiple parcels of land, however, making
it difficult for them to economically rejuvenate their soils. Chemical fertilizer costs have fluctuated
significantly over the last few years; often the price is high enough to be cost-prohibitive for many
producers. As a result, local producers have expressed an interest in determining the effectiveness of
manure applications for maintaining or enhancing forage productivity on older pastures. The primary
purpose of this demonstration trial was therefore to see if there is a visible difference in pasture
productivity when commercial fertilizer blends are compared with horse and cattle manure applications.
This trial focused on cattle (semi-solid and solid) and horse manure however, many of the same
principles apply for the application of other livestock manures such as sheep, goat, poultry and hog.
In addition to investigating how to best maintain productive pastures, this demonstration trial was
initiated to examine the efficacy of manure use, including ways to reduce environmental risk and weed
infestation, and to compare the timing of fertilizer applications between spring and fall.
2.0 BACKGROUND INFORMATION Throughout the Bulkley Valley, solid horse and cattle manures are often piled each year and left to
mature prior to spreading. These piles are then used to resuscitate well-used or nutrient-poor beef
cattle and horse pastures. Many of the local dairy farmers also have liquid manure spreaders. Although
some producers – particularly those in the dairy business – regularly test their soil, the purchase and use
of custom blend fertilizer is generally less prevalent than that of the nitrogen based fertilizer (34-0-0-11).
Managing pastures to maximize soil health and optimize forage yields means that producers need to
obtain detailed knowledge about the nutrient composition of their soil and soil additives, particularly
fertilizer. An inventory of the pasture species composition also provides essential information about
plant nutrient requirements.
In contrast to crop fields, it is not always economically efficient to maximize the productivity of pasture
forage. Money spent on maximizing forage growth is only well-spent if the increase in productivity is
properly utilized (e.g., if the stocking rates on a particular pasture are sufficient to take advantage of the
increased available forage). Management considerations for maximizing the economic efficiency of
fertilizing pastures include:
Grazing management: how many animals per acre? Are the animals rotationally grazed, or do
they have access to the whole pasture? Rotational grazing is preferred as it more evenly
distributes the return of nutrients to the soil through urine and manure deposition (Kelling
1999).
Species composition: are there legumes in the pasture? Which are the dominant grass species?

Bulkley Valley Pasture Fertilization Trials 2
Timing: when does fertilizing make sense to maximize forage productivity?
2.1 Forage Species Composition Observing pasture species composition and distribution is an important component of fertilizer
management plans, as the anticipated nutrient requirement and response to fertilizer varies between
different forage species. Cool season grasses such as orchardgrass and tall fescue can take up 120 lb of
nitrogen per acre (Swinker 2009). Species-specific information enables producers to determine how
much nutrition will be removed from the soil each year, thus avoiding environmental and cost issues
associated with over-fertilization.
Typically, the most productive grass species in the pasture benefit the most from straight nitrogen
applications (Cuomo 2000). Generally in mixed grass-legume pastures, productive grasses will tend to
out-compete the legumes such as alfalfa, clover and vetch with respect to uptake of both nitrogen and
phosphorus (Kelling 1999; Cuomo 2000).
Legumes are able to increase their available nitrogen through symbiotic, or mutually beneficial,
relationships with Rhizobium bacteria1. The plants respond to the bacteria in its root hairs and cortical
cells by forming nodules, where nitrogen is fixed and is then available for plant uptake (Figure 1). The
rate of nitrogen fixation is influenced by soil chemistry and climate (Brady 1990). The rate of nitrogen
fixation is reduced if nitrogen fertilizer is added to the soil (Brady 1990; Lindemann and Glover 2003).
Thus it is not necessarily recommended to fertilize with nitrogen if the proportion of legumes in the
pasture exceeds 30 percent (Kelling 1999). Although the host plant utilizes much of the nitrogen fixed
by the Rhizobium spp., nitrogen is returned to the soil for uptake by other forage species through the
death and decomposition of legume leaves, stems and roots (Lindemann and Glover 2003).
Figure 1. Alsike clover (Trifolium hybridum) with groups of nitrogen-fixing nodules evident throughout root system.
1 Rhizobium bacteria are quite species specific – Rhizobium meliloti is the species that inoculates the alfalfa group (Melilotus spp., Medicago
spp. and Trigonella spp.). The clovers (Trifolium spp.) are inoculated by R. trifolii (Brady 1990).
Photo credit: Megan D’Arcy

Bulkley Valley Pasture Fertilization Trials 3
2.2 Timing of Fertilizer Application Split fertilizer applications have been shown to improve pasture productivity more evenly over the
grazing season. Generally, an application in late fall or early spring, one in early June and then another
in early August will provide nutrients as they are required over the growing season. It may not be
necessary to fertilize pastures in the spring if forage productivity is sufficient for the anticipated grazing
pressure. Sufficient moisture and cool temperatures are required for mid-summer applications to be
effective as nitrogen volatizes at high ambient temperatures; often the growth rate of most pasture
species slows down during the summer months (Kelling 1999). In situations where the pasture has been
seeded with forage species that typically exhibit good re-growth, fertilizing mid-summer if conditions
permit may extend the grazing season.
One methodology for applying split applications is to divide the total amount of fertilizer to be applied
(ideally derived from the results of soil testing for each pasture) into 50 lbs per acre applications. For
example, if the pasture requirements are 100 lbs of nitrogen per year, then two applications of 50 lbs
per acre, one in early spring and the other in late summer/early fall is recommended (Cuomo 2000). If
more than two applications are required, another approach is to more heavily weight the spring and late
summer/early fall applications to take advantage of higher soil moisture conditions. Thus if the
recommended total is 200 lb of N/acre, 60lbs could be applied in the early spring and again in the fall,
and the remaining 80 lb N/acre could be split into two summer applications. Ideally, split application
timing and rates should be based on the soil and climate conditions, forage potential, and the grazing
management practiced by each producer (McKenzie 2005).
2.3 Nitrogen, Phosphorous & Potassium Nitrogen (N) is quite mobile through the soil, particularly in areas characterized by periods of heavy rain
or snowmelt. An abundance of empirical evidence indicates significant increases in crop productivity
when nitrogen is applied to the soil. Nitrogen has the greatest impact on the growth of the green,
vegetative parts of the plant. This is most evident when chemical fertilizers are used, as the nitrogen is
in an inorganic form that plants can take up immediately. Nitrogen in different livestock manures is
present as ammonium nitrogen (NH4-N) and organic nitrogen (NO3-N); only the ammonium form of
nitrogen is available for immediate uptake by plants (SAF 2006). In solid cattle manure, typically only
10% to 20% of the nitrogen is available right away, the rest is present as organic nitrogen (Schoenau et
al. 2006).
Optimal levels of available phosphorus (P) and potassium (K) are also critical to plant growth and
longevity. In legumes, adequate soil phosphorus and potassium promote winter hardiness and
increased disease resistance (Barnhart et al. 1997). Phosphorus is a key component of energy
transformation, genetic inheritance, and protein synthesis in plants; it is instrumental in processes such
as photosynthesis, root growth, flowering and fruiting, and nitrogen fixation (Brady 1990). Potassium is
an enzyme activator; it is very mobile within plants, and is integral to transpiration and photosynthesis,
as well as other essential plant functions (Brady 1990). Soils deficient in both phosphorus and
potassium will not respond as vigourously to additional nitrogen (Cuomo 2000). This is less of a concern
in pasture situations, as approximately 85% of the phosphorous and potassium removed through

Bulkley Valley Pasture Fertilization Trials 4
grazing is returned as manure and urine (Kelling 1999). Over time, however, pastures that are
continually grazed (and not fertilized) may become deficient in all essential nutrients, particularly
nitrogen and phosphorus (Barnhart et al. 1997). Legume-dominated pastures utilize much higher
proportions of soil phosphorus and potassium than grass-dominated pastures.
2.4 Livestock Manure as Fertilizer Using livestock manure as fertilizer can be one way of turning ‘waste’ material into a valuable resource
while simultaneously reducing chemical fertilizer expenditures. Manure is generally categorized as
being either liquid (>90%), semi-solid (80-90%) or solid (<80%) based on moisture content (Schoenau et
al. 2006). Most nutrients and micronutrients essential to plant growth are found in the various livestock
manures, including: nitrogen, phosphorus, potassium, sulphur, copper, manganese, zinc, boron, calcium,
magnesium and iron (Schoenau et al. 2006). Although some of these nutrients and minerals are in a
form that may be taken up by plants immediately, a large proportion are present in an organic form that
only become available over time through the process of mineralization. Soil organisms synthesize
organic matter through an enzymatic process that results in the formation of inorganic nutrients which
are then available to be taken up by plants (Brady 1990). The organic component of manures is higher
in solid and semi-solid manures. Organic matter promotes soil health and conserves soil moisture, as
well as acting as a long-term nutrient source. Soils with a higher proportion of organic matter have
increased aggregate stability, and are thus less likely to be compacted when wet or during tilling (Brady
1990).
The nutrient composition of livestock manures is highly variable, both between species and within the
same species type. It is dependent on individual farming protocols, manure storage systems, livestock
diets, and climate conditions (SAF 2006). Analyzing the nutrient content of manure prior to spreading is
the only way to ensure optimal soil health, forage productivity and economic efficiency. General points
about nutrient composition of livestock manure are as follows:
nitrogen is the most abundant nutrient, a portion of which is available in a readily usable form
as ammonium,
the rate of available nitrogen is hard to predict in manures with higher organic nitrogen. The
mineralization rate is based on soil temperature, climate, the ratio of bedding to manure, the
type of bedding (wood shavings can tie up nitrogen as it breaks down) and degree of manure
decomposition prior to spreading (McKenzie 2005; Schoenau et al. 2006),
approximately 50% of the phosphorus in manure is available for uptake by plants immediately
upon application (Poon and Schmidt 2010), although the amount of available phosphorus can
vary with the proportion of solids in the manure (Schoenau et al. 2006),
manure analyses from dairy, beef and swine productions in Saskatchewan showed that
phosphorus, sulphur, calcium and magnesium decrease as moisture content increases (SAF
2006),
thoroughly mixing liquid manures prior to spreading is important as about 75% of the
potassium can be contained in the liquid portion (SAF 2006), and

Bulkley Valley Pasture Fertilization Trials 5
the majority of potassium in manure is immediately available for plant uptake (Schoenau et al.
2006).
Although the nutrient composition for livestock manures is highly variable, documented manure test
results for dairy, beef cattle, poultry, swine, horse and sheep manure are listed in Table 1.
Table 1. Documented nutrient values for various livestock manures in imperial units (Schmidt and Poon 2011; SAF 2006; MAFRI 2009; Lawseth 2008).
Dairy (liquid) lb per 1000 gal
Beef cattle (solid) lb per ton
Poultry (solid) lb per ton
Swine (solid) lb per ton
Horse (solid) lb per ton
Sheep (solid) lb per ton
Nitrogen 28* 8.4 43.2 17 19 28 Phosphorus 6 4.2 25.6 9 6 9.6 Potassium 25 13.6 21.6 22 30 24 Sulphur 4 3 6 6 n/a n/a *BC data are given when available. Sheep, swine (solid) and horse data are taken from work done in Saskatchewan, Manitoba
and Colorado.
Similar to most agriculture management systems, there are benefits and risks associated with manure
storage and use. The benefits, as outlined above, include the extensive list of nutrients contained in
manure that maintain plant health and increase productivity when manure is applied to the soil. Prior
to mineralization, the organic component of manure acts as a soil conditioner, aiding in the reduction of
moisture loss and increasing soil aggregate stability.
The risks or potential disadvantages of spreading livestock manure are listed below.
1. Low nutrient value – manures low in nutrients (as a result of improper storage or livestock diet)
reduce the economic efficiency of spreading and need to be spread on fields close to the
manure source;
2. Leaching and/or runoff of manure into natural or manmade waterbodies – this is an
environmental hazard created when manure is applied too heavily, if manure application is
followed by heavy rainfall events, or if manure is spread on frozen or snow-covered ground;
3. Nitrogen volatilization creating gas emissions of ammonia and nitrous oxide, leading to odour
issues and increased greenhouse gas emissions. Volatilization can be reduced by using
spreading methods that integrate the manure into the soil as quickly as possible, and by
avoiding spreading manure in hot, arid climate conditions;
4. Accumulation of phosphorus – excess phosphorus is an issue when there is potential for it to
move into a fresh body of water through the means of soil erosion, runoff or leaching. High
levels of phosphorus entering freshwater systems aids in the trigger of the eutrophication2
process (Poon and Schmidt 2010).
2 Eutrophication (also known as cultural eutrophication) is the resulting process from the addition of excessive amounts of nutrients –
particularly nitrogen and phosphorus – into fresh water courses. Algal species use the nutrients to rapidly multiply; as the bottom layers of the algal mat die back, they fall to the bottom and start to decay. Bacteria and fungi that aid in the decomposition of the algae subsequently use all the oxygen, compromising all of the other species living in the waterbody (Primack 1993). The end result is usually high fish mortality, which then compromises the water quality for domestic use.

Bulkley Valley Pasture Fertilization Trials 6
Pollution of water courses with phosphorus can be avoided by:
a. Testing manure and soils regularly to monitor phosphorus levels, and reducing the
manure application rate when necessary to avoid excess accumulation,
b. Focusing manure applications on fields furthest away from any bodies of fresh water or
surface water, and
c. Maintaining a vegetated buffer of 30 m or 100 ft between edge of fields and fresh water
sources or surface water (Poon and Schmidt 2010); and,
5. Accumulation of potassium – similar to nitrogen, potassium is taken up by crop and forage
species in proportion to the amount that is available. High levels of soil potassium therefore
result in high levels of potassium in crop and forage species. Cattle ingesting forage with greater
than 3.5 percent potassium are at a higher risk with respect to milk fever, displaced abomasums,
and calving issues (Schmidt and Hughes-Games 2010).
The latter points – accumulation of phosphorus and potassium – are listed as issues with manure
spreading as these two nutrients often accumulate in the soil when the manure application rate is based
on the nitrogen target. Similar problems would occur, however, when using chemical fertilizer without
first soil testing to ensure that the correct nutrient levels are being applied.
2.5 Environmental Considerations There is potential for pollution with the application of both chemical fertilizers and manure. Application
on snow, frozen or flooded ground, or application prior to heavy rainfall events can result in the
nutrients polluting ground and/or surface water by movement through the soil (leaching) or over the
soil (runoff). Over-application of nutrients may have similar consequences, as well as increasing the risk
of nitrate poisoning or excessive potassium uptake in livestock.
Less obvious sources of pollution are becoming more of a concern as farms are surrounded by
residential developments, and with the increased public awareness of global climate change. Air
pollution includes unacceptable emission levels of particulates (i.e., excessive dust), odour, and
greenhouse gases, particularly carbon dioxide and volatilized nitrogen (ammonia). Avoiding the
application of manure or chemical fertilizer during hot, dry periods can minimize this type of pollution.
Carbon dioxide is released from the soil when fields are tilled; managing soil health and considering
alternatives to tilling (e.g., no-till practices) help reduce the carbon footprint associated with crop and
forage production.
Air emissions may also be reduced by upgrading manure spreading equipment (Figure 2). The BC
Ministry of Agriculture has published a Nutrient Management Factsheet entitled ‘Choosing and
Calibrating Manure Application Equipment’ (2005). Considerations include: type of manure (i.e.,
moisture content), uniformity of application, level of soil disturbance and compaction, potential crop
damage and cost of equipment. The tables from this Factsheet have been reproduced in Appendix I for
reference.
Bulkley Valley Pasture Fertilization Trials 7
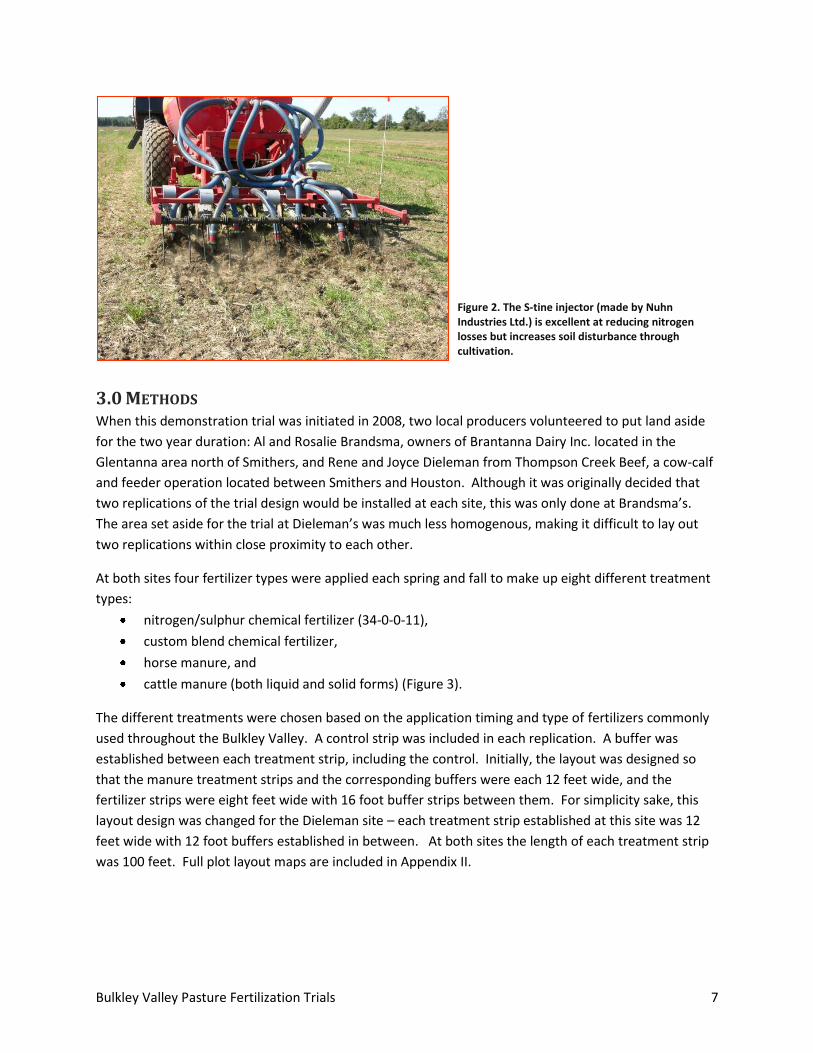
3.0 METHODS When this demonstration trial was initiated in 2008, two local producers volunteered to put land aside
for the two year duration: Al and Rosalie Brandsma, owners of Brantanna Dairy Inc. located in the
Glentanna area north of Smithers, and Rene and Joyce Dieleman from Thompson Creek Beef, a cow-calf
and feeder operation located between Smithers and Houston. Although it was originally decided that
two replications of the trial design would be installed at each site, this was only done at Brandsma’s.
The area set aside for the trial at Dieleman’s was much less homogenous, making it difficult to lay out
two replications within close proximity to each other.
At both sites four fertilizer types were applied each spring and fall to make up eight different treatment
types:
nitrogen/sulphur chemical fertilizer (34-0-0-11),
custom blend chemical fertilizer,
horse manure, and
cattle manure (both liquid and solid forms) (Figure 3).
The different treatments were chosen based on the application timing and type of fertilizers commonly
used throughout the Bulkley Valley. A control strip was included in each replication. A buffer was
established between each treatment strip, including the control. Initially, the layout was designed so
that the manure treatment strips and the corresponding buffers were each 12 feet wide, and the
fertilizer strips were eight feet wide with 16 foot buffer strips between them. For simplicity sake, this
layout design was changed for the Dieleman site – each treatment strip established at this site was 12
feet wide with 12 foot buffers established in between. At both sites the length of each treatment strip
was 100 feet. Full plot layout maps are included in Appendix II.
Figure 2. The S-tine injector (made by Nuhn Industries Ltd.) is excellent at reducing nitrogen losses but increases soil disturbance through cultivation.

Bulkley Valley Pasture Fertilization Trials 8
Figure 3. Map of layout for Replication #1 at Brandsma site – eight treatment types were applied for two consecutive years. Buffers are indicated by black vertical stripes.
The demonstration trial at the Brandsma site was in an old hay field that is now used for pasture; the
field is rotationally grazed. It receives liquid manure every year as it is close to the house and therefore
very accessible. Orchardgrass is the dominant forage, with some occurrence of brome, timothy, fescue,
alfalfa and clover. The alfalfa is patchy and grows primarily on the west side of the demonstration trial
area. There is a small draw running through the west side of both replications; the resulting higher soil
moisture alters the vegetation composition as there is a much higher proportion of brome, clover and
alfalfa in this part of the trial area.
In contrast, the demonstration trial at the Dieleman site was established in a pasture which has been
seeded, but not for a very long time. This site has not been fertilized within recent memory, except
from the manure and urine from grazing animals. The site is dominated by fescue, with some timothy,
clover, vetch and orchardgrass occurring throughout. Rene Dieleman constructed a fence in the first
year to exclude their cattle from the trial area.
After the layout was completed, two composite soil samples were taken for each replication. In each
case the composite was derived from samples taken to a depth of 6 inches (or 15 cm) using a random,
zigzag pattern. A soil probe was used to collect these baseline data. The samples were sent to Exova, a
laboratory out of Edmonton, Alberta. A basic soil nutrient test was conducted for each sample (N-P-K-S,
pH and EC). Phosphorus and potassium were analysed using the modified Kelowna method.
Manure was sourced for the first fall application – although the cattle manure was available on-site for
both locations, horse manure had to be transported to the site from neighbouring farms. Due to the
nature of each of the producer operations, liquid cattle manure was spread at the Brandsma site, and
solid cattle manure at the Dieleman site. Manure samples were collected in 2008 and sent to the lab for
analysis. These samples were unfortunately mistaken for soil samples at the lab, however. As the
samples could not be tested properly, and additional samples were unavailable due to the onset of
winter, no nutrient data were available for this report. Book values for the three different livestock
manures have been used instead.
The results of the soil sample analyses, including the lab fertilizer recommendations, were sent to Norm
Dueck (Certified Crop Advisor) from Glen Dale Agra Services Ltd. in Vanderhoof. Mr. Dueck formulated
10
0 ft

Bulkley Valley Pasture Fertilization Trials 9
Figure 4. Leah Sheffield clipping the 34-0-0-11 Fall strip at the Dieleman site on August 3, 2009.
two custom blend fertilizers for each of the sites based on these results – an optimal blend and a less-
optimal but more affordable blend. The latter was chosen as the goal of this demonstration trial was to
be as realistic as possible. Fertilization application rates were then calculated for the custom and the
34-0-0-11 fertilizer (Table 2). The application rate for the 34-0-0-11 fertilizer was determined by
matching the nitrogen application rate as recommended by Mr. Dueck for the custom blend.
Table 2. Chemical fertilizer application rates per strip for both plot sites.
Treatment Type Area (acres) Rate (lbs/acre)
Brandsma Site Custom 0.018 180 34-0-0-11 0.018 132 Dieleman Site Custom 0.0275 200 34-0-0-11 0.0275 147
The first set of chemical fertilizer and manure treatments were applied to the fall trial strips on both
sites in October of 2008. The solid manure was applied with a box spreader in 2008; in subsequent
years, the solid manure at the Dieleman site was spread by shovel (out of the box of a pickup).
Work commenced again early next spring – fertilizer applications to the spring strips were completed in
May as soon as the ground was dry enough to avoid soil compaction. Clippings were taken from each
strip once during the growing season. Frames made of rebar measuring one square foot were made by
Northern Metals in Smithers. The frame was randomly placed in the strip, and all vegetation within the
frame clipped to about 3-4 inches above the ground to simulate grazing. Clippings were taken from the
Brandsma site on June 26, 2009; the Dieleman site was
clipped on August 3, 2009 (Figure 4).
Clippings were removed from the bags and spread out
to air dry. They were then re-bagged and weighed.
Subsequent to clipping the Brandsma site was cut, and
all of the forage baled. Finding a mower capable of
negotiating the rocky and hummocky ground at the
Dieleman site proved to be difficult; unfortunately that
site was not mowed in 2009. Three sets of photos were
taken for each replication throughout the 2009 growing
season; one in May/June, one in August and the last in
October.
The fall commercial fertilizer applications were applied
on October 28, 2009. Manure was also applied in
October. Sourcing horse manure for the Dieleman site
was problematic as the neighbour that had supplied it
in the spring was unavailable. Although several other
people were contacted, they were either unavailable or

Bulkley Valley Pasture Fertilization Trials 10
they did not have a sufficient supply of horse manure stockpiled. As a result, only the cow manure was
spread at this site in the fall of 2009.
Although a tentative field day was planned for 2009, lack of precipitation limited the re-growth at the
Brandsma site after the strips were mowed. As a result the field day was postponed until 2010.
Background information and preliminary results for the trial were presented at the Annual General
Meetings of both the Bulkley Valley Cattlemen’s Association in January of 2010 and the Smithers
Farmers’ Institute in April of the same year.
Fertilizer spreading went more smoothly in the spring of 2010. Manure was spread at both sites in May;
chemical fertilizer was applied at the Brandsma site later in the season. At this point in the trial, both
the spring and fall trial strips had received two applications of each type of fertilizer.
Similar to the previous year, clippings were taken from each strip, dried and weighed. The Brandsma
site was clipped on July 14, 2010; the Dieleman site was clipped on July 16, 2010. Dry matter weight
was recorded. Photos were taken of each strip just prior to clipping.
Both sites were cut or mowed in 2010. The forage was baled at the Brandsma site; the Dieleman site
was cut with a weed-wacker. The clippings at the Dieleman site were left on the strips to dry and
decompose as there was no practical way to remove them.
Unfortunately although a field day was again tentatively planned for 2010 growing season, the following
difficulties were encountered:
lack of consistency between the two sites with respect to visibility of results,
the narrow window of opportunity in the spring to see the difference in growth between strips,
and
growing conditions in the summer of 2010 were very hot and dry; there was very little re-growth
after the two sites were mowed.
The field day, tentatively planned for the late summer/early fall of 2010, was again postponed until
June of 2011. Despite this set-back, progress and results to date were summarized and presented at the
Smithers Farmers’ Institute in April, 2011.
In June of 2011, soil samples were taken for each strip using the shovel method and analyzed by Exova
in Alberta. Photos of each strip were also taken at this time. The long-awaited field day was held on
June 16, 2011 – it was advertised well in advance to all of the stakeholder groups, and to the public
through the newspaper, email and posters at the local Feed Store. Approximately 15 people attended –
the Brandsma site was visited first, and then the Dieleman site. Further extension efforts include the
development of a brochure (Appendix III) that will be circulated to the main agriculture groups in the
Bulkley Valley as opportunities arise (e.g., workshops/seminars, Annual General Meetings, through the
information booth at the Bulkley Valley Farmers’ Market).

Bulkley Valley Pasture Fertilization Trials 11
4.0 RESULTS AND DISCUSSION Early in the trial, there was a noticeable difference in the visual results between the two sites. In the
spring of 2009, the treatment strips that showed the most visual response at the Brandsma site were
the two where chemical fertilizer had been applied the previous fall, especially the 34-0-0-11 fertilizer
blend. Baseline soil data for the Brandsma site indicated that all soil nutrients except nitrogen were at
optimal or near optimal levels at the start of the trial. The nitrogen deficiency was likely due to: 1) the
regular movement of nitrogen in the soil during fall rain and spring melt events and 2) the removal of
nitrogen by grazing animals. Although there would have been some soil movement of the nitrogen
applied in the fall of 2008, there was clearly enough still available the following growing season to make
a difference to the vegetation in these treatment strips.
Overall, the difference between the treatment strips in the spring of 2009 was more evident at the
Dieleman site. This response was not surprising as baseline soil testing showed that this pasture was
very nutrient deficient. Vegetation in the strips treated with chemical fertilizer the previous fall was lush
and darker green than the control strip at this site. The visual increase in productivity and overall health
of the forage in the strips treated with manure was even more noticeable. This was particularly true in
the strip where the horse manure had been applied – fescue in this strip was not only greener, the
plants were also thicker and more robust (Figure 5).
Figure 5. Photos of strips with horse manure (spring strip on the left and fall strip on the right) at the Dieleman site. Photos were taken on May 25, 2009, prior to spreading of spring manures. The grass in the fall strip is already showing improved productivity with only one application of manure.
The high organic matter in horse manure assists in maintaining soil moisture. In addition, horse manure
can be relatively high in both nitrogen and potassium. One book value for horse manure reports it to
have 19 lb N/ton and 36 lb K2O/ton (Lawseth 2008). It was interesting to note that although
macronutrients in manure are not all available immediately, the vegetation response in this trial was
evident by the next growing season.
As the 2009 growing season progressed, the weather turned hot and dry relative to the normal climate
conditions for the Smithers area. Table 3 below outlines the climate conditions for July and August of
both 2009 and 2010, as well as the climate normals for the Smithers area.

Bulkley Valley Pasture Fertilization Trials 12
Table 3. Climate data for Station Smithers A including normals and historical data for July and August of 2009 and 2010 (Environment Canada 2011).
Normals 2009 2010
July August July August July August
Daily Average ( C) 15 14.6 18.0 15.7 16.0 15.7 Standard Deviation 1.3 1.2 n/a n/a n/a n/a Daily Max ( C) 21.6 21.2 25.7 22.8 23.1 22.9 Daily Min ( C) 8.4 7.9 10.2 8.5 8.9 8.5 Extreme Max ( C) 34.6 35.2 36.0 32.3 32.2 32.7 Days with Max Temp
> 20 C 17.8 16.8 26 22 22 17
Days with Max Temp
> 30 C 1.4 1.2 6 2 3 6
Days with Max Temp
> 35 C 0 0.03 3 0 0 0
Rainfall (mm) 45.2 42.9 26.6 13.2 10.0 24.4* *Number is based on incomplete data (August 28, 2010 record of rainfall is missing).
Prior to spreading in the fall of 2009, the spring applications of the custom fertilizer and manure were
showing the best response at the Brandsma site (Figure 6). The 2008 fall manure application results at
the Dieleman site were comparable to the fall and spring chemical fertilizer applications. By the end of
the 2009 growing season, however, there was little visual result of the 2009 spring manure applications
at the Dieleman site. The low moisture content of the manures, combined with low soil moisture may
have resulted in increased nitrogen volatilization and low organic matter mineralization rates.
The spring of 2010 was quite wet and the vegetation growth at both sites was very productive. Similar
to the previous year, the summer of 2010 was
relatively hot and dry. Subsequently there was not
much re-growth observed after the sites were
clipped and mowed. Overall, however, the
vegetation in the strips with manure treatments
showed a much greater growth response when
compared to 2009. This result is likely due to
cumulative nutrient availability as the
mineralization of the organic matter portion of the
manure applied the previous year meant these
nutrients were now available to the plants in the
2010 growing season.
At the Dieleman site, the spring applications of the
custom and 34-0-0-11 fertilizers were evident by
the dark green colour of these strips when the trial
photos were taken in July of 2010. In general,
however, the fall applications of all treatment
types appeared to have the greatest impact on Figure 6. Photo taken on June 12, 2009 showing the effect of custom fertilizer applied in the spring.

Bulkley Valley Pasture Fertilization Trials 13
forage productivity (based on visual results).
4.1 Clipping Data Results The clipping data for 2009 and 2010 have been summarized for the two sites in Figures 7 and 8. As this
trial was intended for demonstration purposes, only one set of clipping data was collected each year.
The bar graphs that follow should therefore be interpreted broadly as they are based on limited data.
Variability introduced through differences in soil nutrient composition, soil moisture and/or vegetation
throughout the site is difficult to differentiate from the effects of each fertilizer regime. In addition,
some variability was introduced into the clipping data as the plots were not clipped on the same day
each year. The Brandsma site was clipped two weeks later in the second growing season (2010); the
Dieleman site was clipped approximately two weeks earlier.
Observations noted from the clipping data results are summarized below.
Brandsma Site
In both replications, the fall horse and cattle manure treatment strips were the most productive,
particularly in the second year.
The clipping data for the control strips was quite variable–soil analyses data for these two strips
is much more comparable. The variability observed in the clipping data may therefore be a
result of other factors such as soil moisture and plant composition.
The data variability observed in the control strips was consistent to varying degrees throughout
the entire site.
The clipping data results for the fall cattle strip correlate with the visual results noted at the
Field Day held in the spring of 2011.
Dieleman Site
The overall biomass production at the Dieleman site was much lower than at the Brandsma site.
Fescue, the dominant forage species at the Dieleman site, would not be expected to yield high
dry matter weights when compared with forage species such as orchardgrass and brome.
With the exception of some spring applications, the majority of the fertilizer regimes increased
forage productivity (i.e., forage biomass was higher than in the control strip).
Forage biomass appeared to increase the most in the treatment strips with the fall applications
of cattle manure, horse manure, and custom blend fertilizer.
The spring horse treatment strips showed the least improvement in overall productivity.

Bulkley Valley Pasture Fertilization Trials 14
0
2000
4000
6000
8000
10000
12000
Fall Spring Fall Spring Fall Spring Fall Spring
Cattle Cattle Horse Horse Control Custom Custom 34-0-0-11 34-0-0-11
DM Weightkg/Ha
Treatment
Rep. 1 - 2009 Rep. 1 - 2010 Rep. 2 - 2009 Rep. 2 - 2010
Figure 7. Clipping data for two replications of the pasture fertilization demonstration trial located at the Brandsma site. The first set of data was collected on June 26, 2009; clipping was done on July 14, 2010 in the second year.
0
2000
4000
6000
8000
10000
12000
Fall Spring Fall Spring Fall Spring Fall Spring
Cattle Cattle Horse Horse Control Custom Custom 34-0-0-11 34-0-0-11
DM Weightkg/Ha
Treatment
2009 2010
Figure 8. Clipping data for the pasture fertilization demonstration trial at the Dieleman site. The 2009 data were collected on August 3
rd; the 2010 data were collected on July 16, 2010.

Bulkley Valley Pasture Fertilization Trials 15
4.2 Soil Analyses Results Baseline and 2011 soil analyses results are summarized in Table 4. All of the treatment strips were
nitrogen deficient at the start and in 2011 after the end of the trial. This was anticipated at the
Brandsma site, as the vegetation was removed each year of the trial after the site was mowed. The total
lb/acre of nitrogen for both control strips at the Brandsma site was reduced by at least half from 2008
when the baseline data were collected. In contrast, at the Dieleman site the nitrogen in the forage
vegetation had the opportunity to be incorporated back into the soil both years of the trial. Although
still nitrogen deficient, most treatment strips at the Dieleman site (with the exception of the control and
the two with horse manure applied) showed a slight increase in soil nitrogen by 2011.
Other points of interest in the final soil results for this trial are summarized below.
Brandsma Site
There are several instances where the 2011 results for the individual treatment strips are
noticeably different from the baseline data taken collected in 2008. As there is little correlation
between the two replications (i.e., the results are not consistent within the same treatment
type), this is likely due to natural variation in soil nutrients and differences in vegetation
composition.
The exception to the above point is the result for sulphur in the cattle manure treatment strips;
the data results indicate that the soil is being depleted of this nutrient. A similar result was
observed for the control strip in each replication. Analyzing the cattle manure would aid in
determining how to manage this deficiency – if the manure is low in sulphur, this issue could be
resolved with the addition of chemical fertilizer. Another consideration is the proportion of
alfalfa in the field – alfalfa can utilize twice the amount of soil sulphur as other forage species
(Saskatchewan MoA 2009 as taken from CFI 2001).
Some of the treatment strips at this site have soils nearing excessive levels of phosphorus
(greater than 60 ppm); the repeated manure applications on this pasture have resulted in the
soil being well-supplied with this nutrient. It is recommended to monitor this field through
regular soil testing, and reduce the manure applied to this field if the level of potassium
continues to increase (Poon and Schmidt 2010).
As expected, the control strips were lower in all soil nutrients by the end of the trial.
Dieleman Site
The 2011 soil results indicated that this site remains very phosphorus deficient, even on the
strips where horse and cattle manure were applied.
The spring applications of the custom blend and cattle manure increased soil potassium so that
both treatment strips were in the optimum range by the end of the trial.
Almost all treatments either maintained or increased the level of sulphur in the soil.
Differences observed between the 2011 result for the control and the baseline data are likely
due to natural variation and the fact that during the trial the site was not grazed or harvested
for more than two years.

Bulkley Valley Pasture Fertilization Trials 16
4.3 Field Day The field day for this demonstration trial was held on June 15, 2011. After quite a wet spring, the
vegetation at both sites was very vigourous, making it difficult to differentiate between the treatment
strips. Despite this, at the Brandsma site there was an obvious increase in forage productivity for the fall
cattle and horse manure strips. Increased productivity was also observed (but to a slightly lesser extent)
for the fall treatment of the custom blend fertilizer. At the Dieleman site the fescue was much thicker
and darker green overall — the most visible results at this site were in the strips where the fall and
spring cattle manure had been applied. Brome and orchardgrass in these treatment strips were starting
to become more prevalent than was observed at the beginning of the trial.
The Field Day was a success – several of the producers that had been observing the progress of the trial
over the last three years attended and were very interested in the final outcome. Several of the local
dairy producers were also able to attend.
5.0 CONCLUSIONS AND RECOMMENDATIONS The goals and objectives established for this demonstration trial were realized by the end. At both sites
the productivity from the strips where cattle and horse manure were applied was equal or greater to the
chemically fertilized strips. Although the vegetation in the treatment strips with 34-0-0-11 fertilizer
performed well, particularly in the first year, it was not as productive as the vegetation in the custom
fertilized strips. In the fall 34-0-0-11 treatment strip at the Brandsma site, soil sulphur levels increased
almost to the point of excess.
The results of the demonstration trial were definitely impacted by the weather. Both 2009 and 2010
growing seasons were relatively hot and dry, limiting re-growth of the forage vegetation. This restricted
the ability to take more than one set of clippings; additional data would have aided in further
interpretation of the visual results.
At the end of the trial, both sites were still very nitrogen deficient; the Dieleman site was also very
deficient in phosphorus. If both sites are going to be used extensively then additional fertilizer is
required to get optimal pasture productivity. More options are available at the Brandsma site as this
pasture is close to the house and readily accessible. It is likely that this pasture would benefit from both
custom blend and manure fertilizer – if manure was applied every other year it would help keep the
phosphorus from building up to excessive levels in the soil. Soil testing and applying a custom fertilizer
in the years between manure applications would help maintain soil nitrogen levels.
The Dieleman site is much more remote than the Brandsma site. In addition, the area that was used for
this trial is just a small area of a much bigger pasture. It is clearly not economically viable to put
chemical fertilizer on this pasture. The stocking rate on this pasture is generally quite low. Rotational
grazing may be one way of ensuring a more consistent deposition of manure and urine. Future
considerations for this pasture may include seeding more productive forage species that have better re-
growth potential. The addition of legumes would also help maintain soil nitrogen levels.

Bulkley Valley Pasture Fertilization Trials 17
The producers that attended the field day were very interested to see the different results. Although
many of them spread manure as part of their farm management, this is done largely to reduce manure
stockpiling in concentrated livestock areas, rather than as part of a concrete nutrient management plan.
The fact that the manure had such a positive effect on the forage vegetation really emphasized that
using manure as a fertilizer can be one of the strategies they use to increase the productivity of their
farms, and ultimately improve their overall economic viability.

Bulkley Valley Pasture Fertilization Trials 18
Table 4. Baseline and final soil analyses results for both the Brandsma site (Sites 1A and 1B) and the Dieleman site (Site 2A). Soil tests were conducted by EXOVA lab in Alberta. Cells highlighted in red indicate near excess levels. Cells highlighted in yellow indicate noticeable differences from baseline data collected in 2008. Lab results for both baseline data and 2011 data are included in Appendix IV.
Site Nutrient Treatment
1A Baseline Custom Fall Custom Spring 34-0-0-11 Fall 34-0-0-11 Spring Cattle Fall Cattle Spring Horse Fall Horse Spring Control
N Deficient Deficient Deficient Deficient Deficient Deficient Deficient Deficient Deficient Deficient
P Optimum (H) Marginal (H) Marginal Optimum Optimum (H) Optimum Optimum Optimum (H) Optimum (H) Optimum
K Marginal (H) Deficient (H) Marginal (L) Optimum (L) Marginal Marginal Marginal Optimum Optimum Marginal (L)
S Optimum (L) Marginal Optimum (L) Optimum (H) Optimum (L) Marginal Marginal Marginal Marginal Marginal
1B Baseline Custom Fall Custom Spring 34-0-0-11 Fall 34-0-0-11 Spring Cattle Fall Cattle Spring Horse Fall Horse Spring Control
N Deficient Deficient Deficient Deficient Deficient Deficient Deficient Deficient Deficient Deficient
P Optimum (H) Optimum (H) Optimum (H) Optimum Optimum Optimum (L) Optimum (L) Optimum Optimum Optimum
K Marginal (H) Marginal (H) Marginal Deficient Deficient Marginal (L) Marginal (L) Marginal (L) Marginal (L) Marginal
S Optimum (L) Marginal (H) Marginal (H) Marginal (H) Optimum (L) Marginal Marginal Marginal (H) Marginal (H) Marginal
2A Baseline Custom Fall Custom Spring 34-0-0-11 Fall 34-0-0-11 Spring Cattle Fall Cattle Spring Horse Fall Horse Spring Control
N Deficient Deficient Deficient Deficient Deficient Deficient Deficient Deficient Deficient Deficient
P Deficient Deficient Deficient Deficient Deficient Deficient Deficient Deficient Deficient Deficient
K Marginal Marginal (H) Optimum (L) Marginal Marginal (H) Marginal (H) Optimum (L) Marginal (L) Marginal Marginal (H)
S Marginal Marginal (H) Optimum (L) Optimum (L) Optimum (L) Optimum (L) Marginal Marginal (H) Optimum (H) Marginal (H)

Bulkley Valley Pasture Fertilization Trials 19
6.0 REFERENCES Brady, N.C. 1990. The Nature and Properties of Soils, 10th Edition. Macmillan Publishing Company. New
York, New York. 621 pp.
Cuomo, G. 2000. Nitrogen Management for Grass Pastures. 2000 Wisconsin Forage Council Proceedings.
Website: http://www.uwex.edu/ces/forage/wfc/proceedings2000/cuomo.htm.
Kelling, K.A. 1999. Pasture Fertilization. University of Wisconsin–Extension. Website:
http://www.uwex.edu/ces/forage/wfc/KELLING.htm.
Lawseth, A. 2008. Land Management Guide for Horse Owners and Small-Lot Farmers. Langley
Environmental Partners Society, Langley, BC.
Lindemann, W.C. and C.R. Glover. 2003. Nitrogen Fixation by Legumes. Guide A-129. Cooperative
Extension Service, New Mexico State University, NM.
Manitoba Agriculture, Food and Rural Initiatives. 2009. Manure Nutrients and their Behaviour in Soil.
Manitoba Agriculture, Food and Rural Initiatives Growing Opportunities Centre, Manitoba.
McKenzie, R. H. 2005. Fertilizing Grass for Hay and Pasture. Alberta Agriculture, Food and Rural
Development, Lethbridge, Alberta.
Poon, D. and O. Schmidt. 2010. Phosphorus Considerations for Nutrient Management. Nutrient
Management Factsheet – No. 6 in Series. BC Ministry of Agriculture, Abbotsford, BC.
Primack, R. B. 1993. Essentials of Conservation Biology. Sinauer Associates, Inc., Sunderland,
Massachusetts, USA.
Saskatchewan Agriculture and Food (SAF). 2006. Nutrient Values of Manure. Website:
http://www.agriculture.gov.sk.ca/Default.aspx?DN=66288945-781d-401a-bd3c-309c3876bfd6.
Saskatchewan Ministry of Agriculture. 2009. Sulphur Fertilization in Crop Production. Website:
http://www.agriculture.gov.sk.ca/Default.aspx?DN=1910208b-760e-4582-ac32-56ed8980b5a6
Schmidt, O. and G. Hughes-Games. 2010. Potassium Considerations for Nutrient Management. Nutrient
Management Factsheet – No. 7 in Series. BC Ministry of Agriculture, Abbotsford, BC.
Schmidt, O. and G. Hughes-Games. 2005. Choosing and Calibrating Manure Application Equipment.
Nutrient Management Factsheet – No. 6 in Series. BC Ministry of Agriculture, Abbotsford, BC.
Schoenau, J.J., Bolton, K. and K. Panchuk. 2006. Managing Manure as a Fertilizer. Government of
Saskatchewan. Website: http://www.agriculture.gov.sk.ca/Default.aspx?DN=3a8c4fbe-e1ed-48f3-ae85-
9340b45d1a39.
Swinker, A. 2009. Horse Pasture Fertilization. Cooperative Extension System. Website:
http://www.extension.org/pages/Horse_Pasture_Fertilization.

Bulkley Valley Pasture Fertilization Trials 20
6.1 Websites Sheep 201: Nutrient Management on a Sheep Farm: http://www.sheep101.info/201/nutrientmgt.html
Nuhn Industries Ltd.: http://www.nuhn.ca/

Bulkley Valley Pasture Fertilization Trials 21
APPENDIX I. APPLICATION METHODS FOR LIQUID AND SOLID MANURE (AS REPRODUCED
FROM BC MAL NUTRIENT MANAGEMENT FACTSHEET NO. 6).

Bulkley Valley Pasture Fertilization Trials 22
APPENDIX II. PASTURE FERTILIZATION TRIAL LAYOUT DIAGRAMS FOR BOTH THE
BRANDSMA AND DIELEMAN SITES.

Bulkley Valley Pasture Fertilization Trials 23

Bulkley Valley Pasture Fertilization Trials 24
APPENDIX III. BV PASTURE FERTILIZATION DEMONSTRATION TRIALS BROCHURE.

Bulkley Valley Pasture Fertilization Trials 25

Bulkley Valley Pasture Fertilization Trials 26
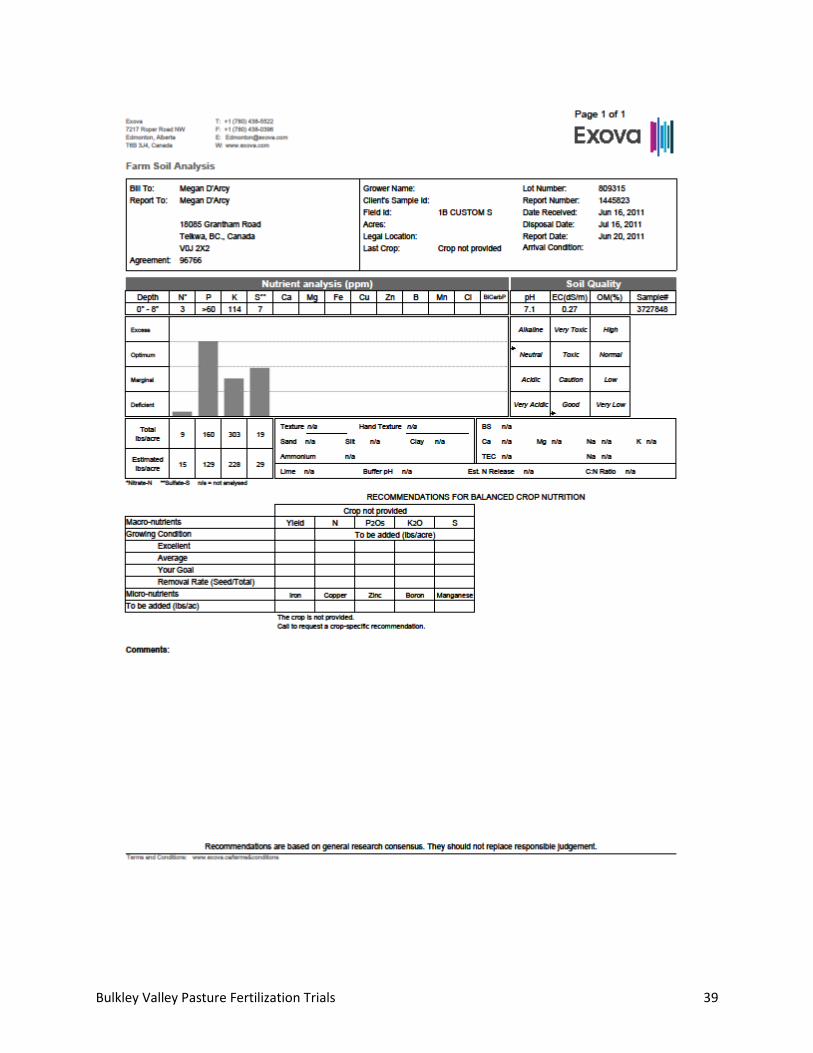
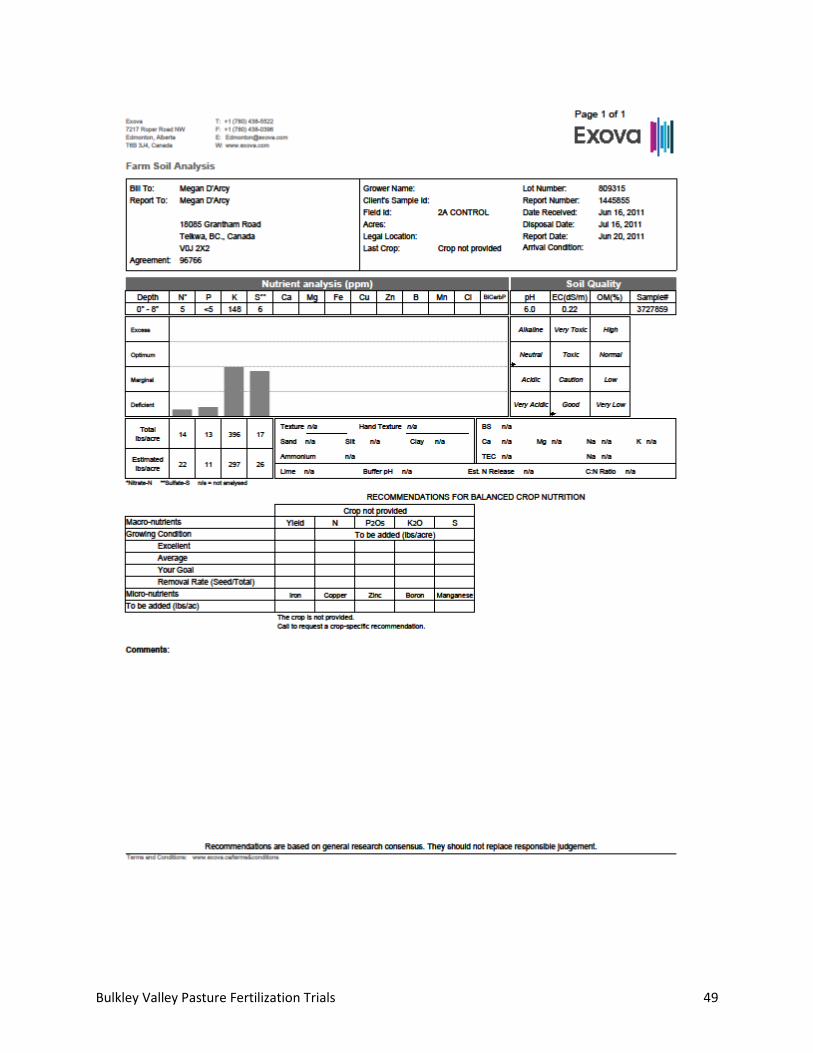
APPENDIX IV. SOIL ANALYSES RESULTS. SITE 1A AND 1B ARE THE TWO REPLICATIONS
AT THE BRANDSMA SITE. SITE 2A IS THE DIELEMAN SITE.
Baseline data

Bulkley Valley Pasture Fertilization Trials 27
Baseline data

Bulkley Valley Pasture Fertilization Trials 28
Baseline data

Bulkley Valley Pasture Fertilization Trials 29

Bulkley Valley Pasture Fertilization Trials 30

Bulkley Valley Pasture Fertilization Trials 31

Bulkley Valley Pasture Fertilization Trials 32

Bulkley Valley Pasture Fertilization Trials 33

Bulkley Valley Pasture Fertilization Trials 34
Mislabelled at lab – this sheet is the results for 1A Custom Fall treatment strip

Bulkley Valley Pasture Fertilization Trials 35
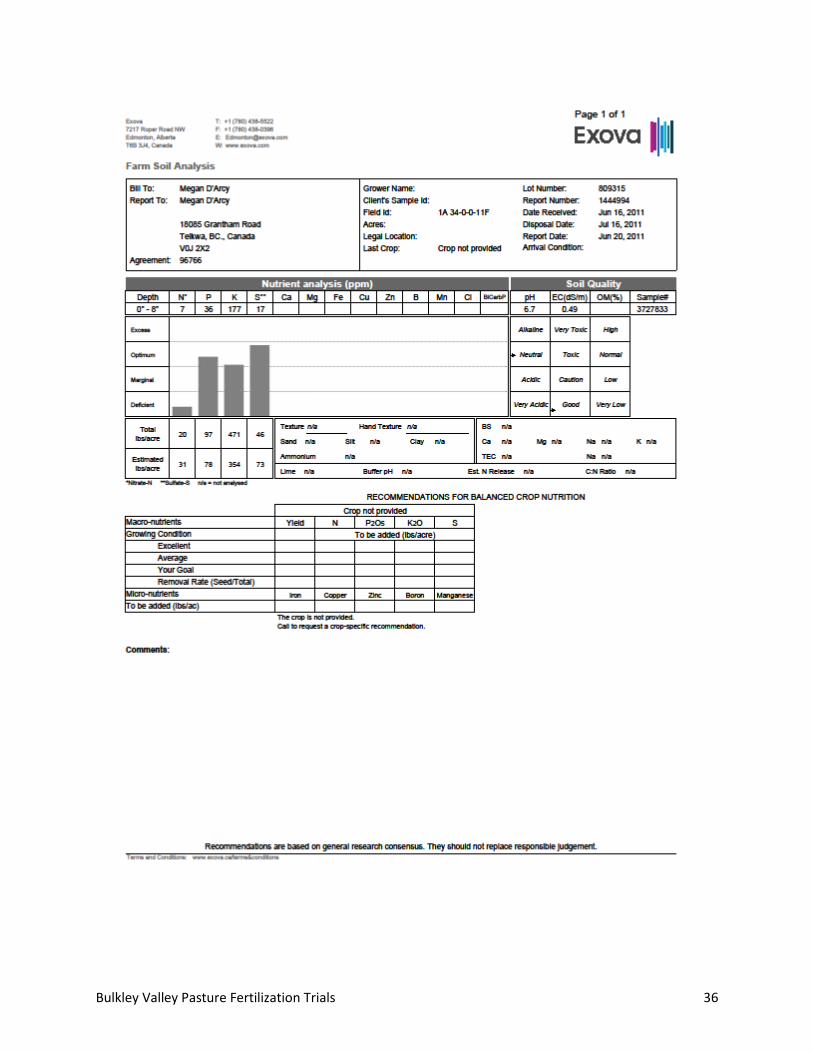
Bulkley Valley Pasture Fertilization Trials 36

Bulkley Valley Pasture Fertilization Trials 37

Bulkley Valley Pasture Fertilization Trials 38
Bulkley Valley Pasture Fertilization Trials 39

Bulkley Valley Pasture Fertilization Trials 40

Bulkley Valley Pasture Fertilization Trials 41

Bulkley Valley Pasture Fertilization Trials 42

Bulkley Valley Pasture Fertilization Trials 43

Bulkley Valley Pasture Fertilization Trials 44

Bulkley Valley Pasture Fertilization Trials 45

Bulkley Valley Pasture Fertilization Trials 46

Bulkley Valley Pasture Fertilization Trials 47

Bulkley Valley Pasture Fertilization Trials 48
Bulkley Valley Pasture Fertilization Trials 49

Bulkley Valley Pasture Fertilization Trials 50

Bulkley Valley Pasture Fertilization Trials 51

Bulkley Valley Pasture Fertilization Trials 52

Bulkley Valley Pasture Fertilization Trials 53

Bulkley Valley Pasture Fertilization Trials 54

Bulkley Valley Pasture Fertilization Trials 55