BUILD A SOLID STRATEGY - keihanshin.co.jp · and non-structural aspects. ... “office...
26
BUILD A SOLID STRATEGY ANNUAL REPORT 2 0 1 5 For the fiscal year ended March 31, 2015
Transcript of BUILD A SOLID STRATEGY - keihanshin.co.jp · and non-structural aspects. ... “office...

BUILD A SOLID
STRATEGY
A N N U A L R E P O R T 2 0 1 5For the f isca l year ended March 31, 2015

Office Buildings
31.6%
Datacenter Buildings
36.8%
WINS Buildings
24.3%
Commercial Buildings and Logistics Warehouses
5.4%
Others
1.9%
FY 2014
FY 2001
FY 1987
FY 1975
FY 1956
Office Buildings
(% of net sales by segment)
Datacenter Buildings
WINS Buildings
Commercial Buildings and Logistics Warehouses
Others
Condominiums
We acquired four office buildings,
and three datacenter buildings /
sold two office buildings, and 14
commercial buildings and logistics
warehouses.
Our first datacenter building, Shinmachi 1
Building, is completed in Osaka City.
We started a business for commercial
buildings and logistics warehouses.
Our first office building, Kawaramachi
Building, is completed in Osaka City.
Breakdown of revenue from operations
History of the Company and
business development
1 At a Glance 2 Our Strengths 4 Consolidated Financial Highlights 5 To Our Stakeholders 6 Message from the President 8 Business Information 9 Major Properties 12 Corporate Governance, Compliance, and Risk Management
14 Relations with Society and People 15 Topics 16 Management’s Discussion and Analysis 18 Consolidated Financial Statements 25 Notes to Consolidated Financial Statements 45 Independent Auditor’s Report46 Corporate/Stock Information47 History
Contents
¥14,852 million ¥4,966 million
FY 2014
Revenue from operations Operating income
Rating Information (as of March 31, 2015)
Rating Agency
Rating and Investment Information, Inc. (R&I)
Long-term Credit Rating
A–
At a Glance
We operate our business in the four mainstay lines:
“office buildings,” “datacenter buildings,” “WINS
buildings (off-track betting parlor),” and
“commercial buildings and logistics warehouses,”
in Osaka, Tokyo and many other cities in Japan.
We put top priority on safety and security of
users starting from the design stage of buildings
and facilities. For example, we actively introduce
the base isolation system for new buildings. We are
committed to always providing buildings and
facilities that are user-oriented both in structural
and non-structural aspects.
We are determined to continue providing high-
quality building management while swiftly meeting
our customers’ needs.
Forward-Looking Statements
Statements made in this annual report with respect to Keihanshin Building’s current plans, estimates, strategies and beliefs and other statements that are not historical facts are forward-looking statements about the future performance of Keihanshin Building. These statements are based on management’s assumptions and beliefs in light of the information currently available to it and therefore readers should not place undue reliance on them. Keihanshin Building cautions that a number of important factors, such as general economic conditions and exchange rates, could cause actual results to differ materially from those discussed in the forward-looking statements.
Our Business Lines
We offer safe and comfortable office
buildings equipped with advanced
functions in Osaka centering on the top-
rated business quarters, Yodoyabashi and
Honmachi areas. We continue to provide
“office hospitality” with basic features of
“safety,” “comfort,” and “the environment”
while adapting to changes in users’
demands as well as constantly enhancing
the basic functions of the buildings.
Office Buildings
Our urban-type datacenter buildings
feature state-of-the-art specifications
including high resistance to disasters,
reliable power supply with a large
emergency power generator, and
advanced security systems. Our
maintenance service based on our
abundant experience of datacenter
building leasing is highly commended.
Datacenter Buildings
We have rented off-track betting parlors,
popularly called WINS, to the Japan
Racing Association for over half a century.
We always come up with ideas to beautify
these facilities and improve their utilities so
that horse racing fans can use them safely,
conveniently and comfortably.
WINS Buildings
We rent commercial buildings to meet the
specific needs of communities or each
locational characteristic to support the
lives of local people. Our logistics
warehouses located in suburban areas of
big cities serve as valuable logistic bases
for our customers.
Commercial Buildings and Logistics Warehouses
Profile
We provide safe and comfortable business space under our fine-tuned building management.
1Keihanshin Building Co., Ltd.

WINS BuildingsCommercial Buildings andLogistics Warehouses
Since Keihanshin Building was founded, it has carefully
gathered information on society’s needs and evolved its
business accordingly. Each of our three largest business lines—
office buildings, datacenter buildings, and WINS buildings—
generates about 30% of our revenue. Our portfolio is thus well
balanced for earnings growth and risk diversification.
Our next steps are to invest aggressively in the central Tokyo
area and core regional cities (Nagoya, Fukuoka, Hiroshima), and
to develop a fifth business line as a new pillar of earnings.
To maintain our sound financial balance, we make it a
management goal to keep net interest-bearing debt at
about 10 times EBITDA. Our sound financial administration
and stable earning power have won favorable attention.
Rating & Investment Information, Inc. has given Keihanshin
Building an A– rating for 19 consecutive years.
Our business extends beyond office rental to datacenter
buildings and WINS buildings. With this varied lineup, we
have achieved a lower vacancy rate than the average in the
business districts of Tokyo and Osaka.
In setting the Company’s dividend, we consider earnings,
the business environment, and future prospects. We
maintain a stable dividend for our shareholders while
strengthening our financial position with ample internal
reserves and boosting our overall and long-term
corporate value.
(%)
2
43 Solid financial base and high credit rating
Lower vacancy rate than the industry average
Stable dividend
Construction of a balanced portfolio suited to the times
(Yen)
Revenue by Business Line
Commercial buildings and logistics warehouses
5.4%
WINS buildings
24.3%FY 2014
Others
1.9%
Office buildings
31.6%
Datacenter buildings
36.8%
19th consecutive year
A-
Our Strength in Each Business Line
Annual dividend per share and consolidated dividend payout ratio
Annual dividend per shareConsolidated dividend payout ratio
15 50
12 40
9 30
6 20
3 10
0 0
2013 20142006 20072005 2008 2009 2010 2011 2012
30.4
24.019.3 21.1
35.929.1 30.4 31.0
27.0
14
29.6
15
10 1011
12 12 12 12
14
FY
Osaka business area
Keihanshin Building
14
12
10
8
6
4
2
0
2013 20142006 20072005FY 2008 2009 2010 2011 2012
11.3
6.6
5.0
5.1
8.0
11.0
12.4
10.3
8.6
3.4
2.7 2.9
8.7 9.1 9.0
8.0
0.6
6.5
3.7
6.4
4.9
8.9
Tokyo business area
6.0
3.1
9.5
6.7
4.9
8.7
5.3
3.2
We manage office buildings from a long-term viewpoint, offering business spaces with an emphasis on safety, comfort, and the environment.
We maintain and operate high-quality facilities in conjunction with the Japan Racing Association (JRA) and the local community.
We provide high-value-added facilities that support their communities and promote the flow of goods and services.
Our urban-type datacenter buildings are based on more than 25 years of experience in the leasing market.
Our holdings consist of three office buildings in Tokyo, four in Osaka, and one elsewhere, for a total of eight. All of our office buildings enjoy convenient access to public transportation.
There are about 40 off-track betting parlors (WINS) throughout Japan, where tickets can be purchased for horse races held by the JRA. Since Keihanshin Building was established, it has leased five WINS buildings in the Kyoto-Osaka-Kobe area to the JRA for some 50 years. This has provided a stable revenue source.
We are continually fine-tuning these facilities so that horse race fans can use them safely, conveniently, and comfortably.
We advanced into the commercial building and logistic warehouse leasing business in 1976. By offering a variety of high-value-added commercial facilities that match the needs of their regions and locations, we help to enrich the lives of surrounding communities. Our logistics warehouses in suburban parts of the Kansai area contribute to the regional economy as important distribution centers for the companies that use them.
The Keihanshin Nishishinsaibashi Building, our newest building, employs the most advanced seismic isolation devices based on the most recent earthquake data. It is built to withstand a class 7 earthquake on the Japanese seismic intensity scale and maintain the functions of a datacenter.
Precautions have also been taken against other kinds of damage. For example, the entrances to each datacenter building are outfitted with flood-control panels to protect from the torrential downpours that have become more common in recent years, as well as other water damage.
Safety, comfort, and the environment are keywords in building construction. We refuse to compromise on user-friendliness and always provide secure, pleasant office spaces.
In new buildings, we employ the expertise in seismic isolation devices and emergency generators that we have gained over many years of operating datacenter buildings. In this way, we respond to the rising need for business continuity plans (BCPs).
In principle, each datacenter building is connected to three high-capacity, high-voltage electrical cables. If one is severed, the other two will still provide sufficient power for normal operations.
In the event of a blackout, the combination of an uninterruptible power supply (UPS) device and a large emergency-use generator can maintain the power supply in a datacenter building for up to 48 hours until electricity is restored.
We equip buildings with heat-deflecting glass (Low-E glass) and green spaces on their roofs and walls to lessen their impact on the environment.
The entrances of datacenter buildings are equipped with security gates using contactless smart cards. Security personnel are always on duty, and visitors are received in person.
Specialist technicians are permanently on call in the central monitoring center of each datacenter building, and building interiors are kept under watch 24 hours a day, 365 days a year.
1Office Buildings Datacenter Buildings
Prime locationAdvantage Advanced disaster-prevention featuresAdvantage
High-capacity electrical equipmentAdvantage
Security measuresAdvantage
High-value-added facilitiesAdvantage
High-grade featuresAdvantage
Respect for the environmentAdvantage
Stable revenueAdvantage
(%)
2 Keihanshin Building Co., Ltd. 3Keihanshin Building Co., Ltd.
Our Strengths

ROEROA
Net income per shareDividends per share
15,000
12,500
10,000
7,500
5,000
2.500
0
201320122010 2011
14,03113,133 13,291 13,679
5,000
4,000
2,000
3,000
1,000
0
201320122010 2011
4,4634,997
4,404 4,6343,000
2,500
2,000
1,500
1,000
500
0
201320122010 2011
2,369
1,773 1,740
2,331
120,000
100,000
80,000
60,000
40,000
20,000
0
201320122010 2011
115,015104,441
110,671 114,577
48,250
14,852 4,9662,732
115,243
51,850
37,570 38,792 41,733
8.0
6.0
4.0
2.0
0
201320122010 2011
60.0
40.0
20.0
0
2013
2014 2014 2014
2014 2014 201420122010 2011
Net assetsTotal assets
4.8 4.6
5.85.3
1.7 1.62.1 2.1
5.5
2.4
39.4
51.846.1
12.0 12.0 14.0 14.0
50.6
15.0
38.7
FY
FY
FY
FY
FY
FY
In fiscal 2014 (ended March 31, 2015), the real estate leasing industry was supported by demand
from companies relocating for more space or requesting more space in their current buildings.
Vacancy rates trended downward, and rent levels improved in some cases. Keihanshin Building
carried out planned maintenance to raise the value of its existing properties and actively solicited
tenants while maximizing the effect of new investment by taking geographic allocation into account.
As a result, the Company’s consolidated revenue, ordinary income, and net income all reached
record highs.
Listed companies are public institutions, and the mission of corporate managers is to ensure the
continued existence and growth of their companies into the distant future. With this view, as a
manager I will carry out my duties fairly and strategically. Backed by Keihanshin Building’s
corporate strengths, which include sound finances and trusting relationships with clients cultivated
over many years, we aim to provide the utmost in building management and offer our tenants high-
quality business spaces. We thank our shareholders and investors for their understanding of our
management principles and business strategy, and we hope for their continued firm support.
Kenjiro Nakano, President
(Millions of yen)
FY 2010 FY 2011 FY 2012 FY 2013 FY 2014
Revenue from operations 13,133 13,291 13,679 14,031 14,852
Operating income 4,997 4,404 4,634 4,463 4,966
Ordinary income 4,123 3,448 3,800 3,699 4,457
Net income 1,773 1,740 2,331 2,369 2,732
Capital expenditure 3,571 5,054 751 472 9,572
Depreciation and amortization 2,347 2,438 2,663 2,612 2,738
Interest-bearing debt (A) 57,550 60,940 63,440 56,750 51,286
Shareholders’ equity (B) 40,638 41,838 43,630 50,015 51,992
Net assets (B’) 37,570 38,792 41,733 48,250 51,850
Common stock 7,688 7,688 7,688 9,827 9,827
Total assets (C) 104,441 110,671 114,577 115,015 115,243
Shareholders’ equity / Total assets (B)/(C) (%) 38.9 37.8 38.1 43.5 45.1
Net assets / Total assets (B´)/(C) (%) 36.0 35.1 36.4 42.0 45.0
Dividends per share (Yen) 12.0 12.0 14.0 14.0 15.0
Net income per share (Yen) 39.4 38.7 51.8 46.1 50.6
Shareholders’ equity per share (Yen) 835.4 862.5 927.9 893.9 960.6
Return on equity (ROE) (%) 4.8 4.6 5.8 5.3 5.5
Return on assets (ROA) (%) 1.7 1.6 2.1 2.1 2.4
Cash flows from operating activities (D) 5,862 3,676 6,091 4,607 7,086
Interest-bearing debt / Cash flows from operating activities (A)/(D)
(Times) 9.8 16.6 10.4 12.3 7.2
Number of employees (Persons) 38 36 35 38 39
(Note) The rating for our long-term debt: A– (by Rating and Investment Infomation, Inc. Japan)
Total assets / Net assets ROE / ROA Net income per share / Dividends per share
Net incomeOperating incomeRevenue from operations(Millions of yen)
(Millions of yen)
(Millions of yen)
(%)
(Millions of yen)
(Yen)
Keihanshin Building Co., Ltd. and Its Consolidated SubsidiariesYears ended March 31, 2011, 2012, 2013, 2014 and 2015
We will achieve
continued growth by
investing effectively
for the medium to
long term and
raising the value of
existing properties.
4 Keihanshin Building Co., Ltd. 5Keihanshin Building Co., Ltd.
To Our StakeholdersConsolidated Financial Highlights

Interest-bearing debt Net interest-bearing debt / EBITDA RatioD/E ratio
EBITDA: Operationg income + Dapreciation and amortization
D/E ratio: Operating Interest-bearing debt / Equity
80,000 20
60,000 15
40,000 10
20,000 5
0 0
FY 2013FY 2012FY 2010 FY 2011
56,75057,550 60,940 63,440
1.5 1.6 1.5 1.2
7.7 8.2 7.3 6.3
FY 2014
51,286
1.0
6.2
Osaka area
91.0%
Osaka area
70.0%
Tokyo area
6.9%
Tokyo area, etc.
30.0%
Others
2.1%
FY 2014The target for10 years later
Dividends policy
Maintenance of a healthy financial base
Revenue and income reach record highs in fiscal 2014
In fiscal 2014 (ended March 31, 2015), Keihanshin Building’s
business environment was generally solid due to the Japanese
economy’s recovery. Amid favorable conditions, we poured our
efforts into tenant solicitation while carrying out planned
maintenance work on existing properties and allocating
management resources to new investments in the Tokyo
metropolitan area. These initiatives led to improvement in our
vacancy rate, from 4.9% in fiscal 2013 to 3.2% in fiscal 2014.
The acquisition of an office building in Fuchu, Tokyo, increased
our real estate lease income.
As a result, fiscal 2014 consolidated revenue was ¥14,852
million (+5.9%), ordinary income was ¥4,457 million (+20.5%),
and net income was ¥2,732 million (+15.3%). All of these
indicators reached record highs in fiscal 2014. This was a
meaningful year in which policies aimed at raising the Company’s
earning power made a clear and significant difference.
New investment targeting regional allocation achieved geographic diversity in earnings
In May 2014, we acquired the Fuchu Building in the city of
Fuchu, Tokyo, for lease to the NEC Group. Our next acquisition,
in April 2015, was a building in Tokyo’s Shibuya Ward, which we
leased to Issei Miyake. With these two investments, we have
expanded our leasing business in the Tokyo area’s office market
and increased the geographic diversity of our portfolio.
Against the current background of historically low interest
rates, real estate prices are showing signs of rising in the Tokyo
and Kansai areas. For Keihanshin Building, which takes a buy-
and-hold stance in real estate investment and holds assets for
an average of more than 20 years, this is not an ideal
environment for new investment. While keeping geographic
allocation in mind, we intend to secure long-term stable income
by cautiously timing our investments and considering each one
on its merits before proceeding.
Building a strategic business portfolio by deepening our four core businesses and creating a fifth mainstay
Keihanshin Building conducts business in four main lines—office
buildings, datacenter buildings, WINS buildings (off-track betting
parlors), and commercial buildings and logistics warehouses—
a combination that provides resilience in the face of economic
trends and the market environment. In office buildings, we are
looking at possible acquisitions in the Tokyo metropolitan area
and outlying cities, always with an eye to geographic
diversification of our earnings. In datacenter buildings, we are
proceeding with new investment while considering that
advances in information infrastructure might make independent
buildings obsolete, so conversion to other uses might be
advisable. In commercial buildings and logistics warehouses, we
have been disposing of low-revenue roadside commercial
facilities for the past few years. We plan to acquire urban-type
commercial buildings near terminal stations and warehouses
that are built to suit specific tenants.
To construct a fifth mainstay that can stand with our other
four business lines, we are using our advanced information-
gathering capacity to look at opportunities in new fields such as
large hospitals. Such opportunities will support our medium- to
long-term income growth.
Diversity in fund procurement, and reduction of procurement cost
Large amounts of funds are needed to acquire real estate or to
renovate and repair existing properties, so diversifying fund
procurement methods and reducing the procurement cost are
important management issues for Keihanshin Building. Until I
was appointed president in 2010, the Company relied 100% on
indirect financing (bank loans), but in that year we switched to a
policy of procuring one-third of funds through direct financing. In
July 2013, we raised capital through a public offering and
disposed of treasury stock, raising approximately ¥4,800 million
through equity financing. The average interest rate on funds
procured in fiscal 2009 was 1.72%, and this declined each year
to 1.23% in fiscal 2014. With retained earnings at a high
¥32,388 million in fiscal 2014, the Company has adequate
reserves for necessary investment. As we further shore up our
financial soundness, we will continue to seek stable funding at
low interest rates by balancing indirect and direct financing.
Planned maintenance to raise the value of existing properties
Lease properties such as office and datacenter buildings can
quickly deteriorate if they are not properly maintained in
painstaking detail. We conduct planned and effective
maintenance to preserve and raise the value of our properties.
This is one way of reinforcing the trust between us and our client
companies. We have hired numerous highly skilled specialists
with work experience at major construction companies to
improve the quality of our maintenance work, and we enjoy
close cooperative relationships with companies that carry out
specialized work on electricity supply, air conditioning, seismic
isolation, and other systems.
Effective maintenance and superior building management are
a unique strength of Keihanshin Building that cannot be
duplicated by REITs or other funds. This strength gives us the
ability to set ourselves apart from the pack. We will continue our
close dialogue with client companies and maintain the value of
existing properties.
Aiming for a corporate structure that combines profitability and soundness
Continuity is the most important thing in corporate management,
and we believe the most important task of managers is to
construct a management system and business promotion
system that continually generate income. Based on this
concept, we make new investments from a medium- to long-
term viewpoint and structure the Company so that it has a good
balance in terms of both geography and lines of business. In this
way, we reduce and disperse risk. By emphasizing the operating
profit margin and ratio of interest-bearing debt to cash flow in
our management, we aim to establish a corporate structure that
combines both profitability and soundness. Regarding the return
of profits to shareholders and investors, we aim for a stable
dividend payout ratio of around 30%. At the same time, we
keep our eyes on the future and seek to retain sufficient
earnings to sustain growth and thus boost shareholder value.
Keihanshin Building will keep contributing to the economy and
society by providing valuable business spaces while fulfilling its
duties as a corporate citizen through detailed information
disclosure and compliance, as well as a range of CSR activities.
The Company will provide unique value to all types of
stakeholders. As we rise to new challenges, please expect the
best from us.
We will strive to make a dividend payment on a continuing basis with a view to maintaining the dividend payout ratio at 30%. In deciding on the amount of dividend, we will follow the basic policy of paying to our shareholders a dividend in an amount to be determined in keeping with the business results, management environment, and future business prospects. We will pay dividends while strengthening our financial position by building internal reserves and striving to improve the overall and long-term corporate value.
Our target is to keep our net interest-bearing debt within 10 times the EBITDA.
Financial indicators
(Times)(Millions of yen)
From the standpoint of spreading risks, we will invest in office and urban-style commercial buildings sited in areas adjacent to railway and subway stations in the metropolitan area that are heavily used by passengers.
Review of existing facilities
We will continuously review the profitability of roadside-style commercial facilities.
New investment
Revenue from operations (composition by area)
6 Keihanshin Building Co., Ltd.
Message from the President
7Keihanshin Building Co., Ltd.

15,000
12,000
9,000
6,000
3,000
0
14,031
2013
14,852
2014
13,679
2012
13,291
2011
13,133
2010
12,488
2009
13,220
2008
11,919
2007
11,101
2006
10,865
2005FY
Office Buildings Datacenter Buildings WINS Buildings OthersCommercial Buildings and Logistics Warehouses
F
G
Revenue from Operations by Business Line
(Millions of yen)
Office Buildings
¥4,697 million
(UP 20.8% from the previous fiscal year)
Datacenter Buildings
¥5,457 million
(UP 4.7% from the previous fiscal year)
WINS Buildings ¥3,613 million
(DOWN 1.0% from the previous fiscal year)
Commercial Buildings and Logistics Warehouses
¥803 million
(DOWN 5.8% from the previous fiscal year)
Office Buildings
We offer safe, comfortable, hospitable office buildings in superior locations. To maintain building value over the long term
and further raise tenant satisfaction, we work on everything from development to management, maintenance, and
renovations as a single, comprehensive business.
A
D
B
E
C
Location : Sumiyoshicho, Fuchu-shi, Tokyo
Total Land Area : 18,460 m2 Total Floor Area : 35,907 m2
Structure : 6F Acquired : May 2014
Keihanshin Fuchu BuildingF
Keihanshin Midosuji Building
Location : Chuo-ku, Osaka-shi, Osaka
Total Land Area : 2,033 m2 Total Floor Area : 19,872 m2
Structure : B1/14F Completed : Apr. 2007
Location : Chuo-ku, Osaka-shi, Osaka
Total Land Area : 1,818 m2 Total Floor Area : 16,520 m2
Structure : B3/9F Completed : Apr. 1962
Location : Chuo-ku, Osaka-shi, Osaka
Total Land Area : 1,790 m2 Total Floor Area : 12,136 m2
Structure : B1/11F Completed : Mar. 2001
Location : Chuo-ku, Osaka-shi, Osaka
Total Land Area : 590 m2 Total Floor Area : 3,505 m2
Structure : B1/7F Completed : Mar. 1964
A
Keihanshin Kawaramachi BuildingB
Keihanshin Yodoyabashi BuildingC
Keihanshin Azuchimachi BuildingD
Location : Minato-ku, Tokyo
Total Land Area : 551 m2 Total Floor Area : 3,885 m2
Structure : B1/9F Completed : Apr. 2009
Keihanshin Onarimon BuildingE
Location : Shibuya-ku, Tokyo
Total Land Area : 1,318 m2 Total Floor Area : 5,079 m2
Structure : B1/6F Acquired : Apr. 2015
Keihanshin Yoyogi-koen BuildingG
Business Line Revenue from OperationsAction PlanImplementation of Strategic New Investment
To geographically diversify our portfolio, we will focus our investment on central Tokyo and core regional cities.
We will purchase relatively new buildings with a good balance of location and earnings potential.
Tapping into upstream information, we will propose corporate real estate projects to companies with land holdings.
Our newest datacenter building, the Keihanshin Nishishinsaibashi Building, is almost fully occupied after a smooth tenant solicitation process. In response to consistent demand, we are now considering the construction of another datacenter building in Osaka.
In the interest of stable, long-term operations, we follow a detailed regime to beautify our buildings and improve facilities.
In a tie-up with a major retailer, we will acquire urban-type commercial buildings near terminal stations in the shopping districts of the Tokyo metropolitan area and core regional cities.
Working with a logistics company, we will acquire a built-to-suit warehouse (for specified corporates) with facilities and functions meeting the needs of a specific client.
8 Keihanshin Building Co., Ltd. 9Keihanshin Building Co., Ltd.
Major PropertiesBusiness Information

F
G
Datacenter Buildings WINS Buildings
Commercial Buildings and Logistics Warehouses
Logistics Warehouses
Datacenter buildings are conveniently located in
urban cores and incorporate advanced disaster-
prevention features, including earthquake-resistant
design, reliable power supply with large emergency
generators, high-speed and high-capacity optic
fiber cables, and advanced security systems. Our
datacenter buildings support business activities in
the IT age, as well as enrichment of people’s lives.
Drawing on our half-century of experience, we work hand-in-hand with the
Japan Racing Association (JRA) to beautify facilities and improve utilities of
our off-track betting parlors, popularly called WINS, so that horserace fans
can use them safely and comfortably. With the cooperation of surrounding
communities, we aim to make WINS even more attractive in the future.
We operate a variety of commercial facilities that match the specific needs of communities and each locational characteristic.
Each one is occupied by influential companies and helps to enrich the surrounding communities. Our logistics warehouses in
the suburban Kansai area are efficient, high-value-added distribution centers for the companies that use them.
A B
E
C
Keihanshin Nishishinsaibashi Building
Location : Nishi-ku, Osaka-shi, Osaka
Total Land Area : 2,119 m2 Total Floor Area : 18,061 m2
Structure : B1/10F Completed : Feb. 2012
A
Keihanshin Kitahorie Building
Location : Nishi-ku, Osaka-shi, Osaka
Total Land Area : 2,171 m2 Total Floor Area : 14,456 m2
Structure : B1/7F Completed : Jan. 2007
B
Keihanshin Shinmachi 1 Building
Location : Nishi-ku, Osaka-shi, Osaka
Total Land Area : 1,818 m2 Total Floor Area : 16,162 m2
Structure : B1/9F Completed : Mar. 1988
C
Keihanshin Shinmachi 2 Building
Location : Nishi-ku, Osaka-shi, Osaka
Total Land Area : 2,187 m2 Total Floor Area : 14,646 m2
Structure : B1/7F Completed : Jun. 2002
D
Keihanshin Shin-Esaka Building
Location : Suita-shi, Osaka
Total Land Area : 1,831 m2 Total Floor Area : 11,970 m2
Structure : B1/7F Completed : Jun. 1991
E
Keihanshin Toyosaki Building
Location : Kita-ku, Osaka-shi, Osaka
Total Land Area : 838 m2 Total Floor Area : 3,365 m2
Structure : 6F Completed : Jan. 1999
F
Keihanshin Nakatsu Building
Location : Kita-ku, Osaka-shi, Osaka
Total Land Area : 661 m2 Total Floor Area : 4,010 m2
Structure : 8F Completed : Mar. 2000
G
D
Hirakata Warehouse
Location : Hirakata-shi, Osaka Total Land Area : 8,604 m2
Total Floor Area : 11,123 m2 Completed : Mar. 1983
D
Toyahama Warehouse
Location : Hyogo-ku, Kobe-shi, Hyogo Total Land Area : 5,271 m2
Total Floor Area : 9,016 m2 Completed : Jan. 1989
E
Nagano Shopping Facility
Location : Nagano-shi, Nagano Total Land Area : 12,198 m2
Total Floor Area : 34,381 m2 Acquired : Oct. 1998
A
Asahikawa Shopping Facility
Location : Asahikawa-shi, Hokkaido Total Land Area : 10,006 m2
Total Floor Area : 7,162 m2 Completed : Aug. 1994
B
Shijo-Kawaramachi Building
Location : Nakagyo-ku, Kyoto-shi, Kyoto Total Land Area : 751 m2
Total Floor Area : 4,968 m2 Acquired : Apr. 1996
C
WINS Umeda A and B Building
WINS Kyoto Building
WINS Kobe B and C Building
In Namba Parks (for WINS Namba)
Location : Kita-ku, Osaka-shi, Osaka
Total Land Area : 842 m2 (A), 1,889 m2 (B)
Total Floor Area : 5,037 m2 (A), 8,425 m2 (B)
Structure : B1/7F (A), B1/6F (B)
Completed : May 1982 (A), Mar. 2010 (B) (rebuilt)
Location : Higashiyama-ku, Kyoto-shi, Kyoto
Total Land Area : 1,640 m2
Total Floor Area : 2,517 m2
Structure : B1/3F
Completed : Apr. 1990 (rebuilt)
Location : Chuo-ku, Kobe-shi, Hyogo
Total Land Area : 769 m2
Total Floor Area : 4,720 m2
Structure : B3/7F
Completed : Aug. 1991 (rebuilt)
Location : Chuo-ku, Osaka-shi, Osaka
Total Land Area : —
Total Floor Area : 20,531 m2
Structure : —
Completed : Aug. 2002 (rebuilt)
A
C
B
D
A B
C D
A
B
C
D E
Commercial Buildings
10 Keihanshin Building Co., Ltd.
Major Properties
11Keihanshin Building Co., Ltd.

Basic Concept
It is crucial for Keihanshin Building to improve soundness and management efficiency by establishing a transparent and fair management
structure, accelerating the decision-making process on important management issues, and strengthening its oversight of business
execution. We are well aware that it is the duty of the Company’s directors and employees to put these ideas into practice, as well as to
comply with the law and maintain discipline, heed the social environment, and conduct our business fairly, openly, and reasonably in an
atmosphere of free competition. In this way, we show shareholders that we value the trust they place in us.
Outline of the Corporate Governance System
1. In principle, the Board of Directors meets monthly to decide on important managerial issues. The Board also receives regular reports
on business execution, which it uses to supervise the situation. Keihanshin Building appoints Directors with extensive experience or a
high degree of specialized knowledge and skill, and this helps the Company to conduct its corporate activities transparently and fairly.
2. Business is executed through Management Meetings, which are held monthly, in principle. Directors and the Chairman of the meeting
indicate who will attend. Based on basic policies passed by the Board of Directors, participants at Management Meetings discuss and
report on business execution policies and plans, the state of their execution, and their results. Items on the Board of Directors agenda
are discussed in advance. Audit & Supervisory Board members attend Management Meetings and may express their opinions.
3. In principle, a Director and Department Head Meeting, attended by directors and department heads, is held weekly to promote
information sharing and various contacts among departments. Audit & Supervisory Board members attend Director and Department
Head Meetings, which provide an opportunity to make requests and express their opinions to each department.
4. An Audit Department has been established to accommodate the Audit & Supervisory Board, accounting auditors, and the Internal
Audit Department.
5. Keihanshin Building has concluded a contract with a legal office, and when necessary, consults the office on relevant business matters.
6. To reinforce its compliance system and risk management system, the Company has established a Compliance Committee and Risk
Management Committee, which regularly report to the Management Meeting. The activities of these committee members are subject
to auditing.
7. In principle, the Audit & Supervisory Board meets monthly. Board members report in detail to external auditors on happenings at the
Management Meeting, the content of proposals made at Board of Directors Meetings, the content of audits implemented by
accounting auditors and the Audit Department, as well as improvements made. These meetings are intended to help the Audit &
Supervisory Board form opinions. The opinions of external auditors are properly heard at various meetings and are reflected in the
Company’s operations.
8. Audit & Supervisory Board members play a central role in exchanging information with accounting auditors and the Audit Department
on a day-to-day basis. The results of internal audits are used in the Board’s audits, making them more efficient and effective.
9. When auditors carry out their duties, the General Affairs Department acts on their instructions.
10. Keihanshin Building has concluded a contract with the audit firm Gravitas Audit Corporation for accounting audits. Keihanshin Building
obeys items in the Financial Instruments and Exchange Act pertaining to internal control and is audited in line with an annual audit plan.
Composition of audit assistants: three certified public accountants.
We rank the observance of legal and other social norms, as well as the observance of our Articles of Incorporation and other in-house
standards, as one of the most important topics in managing Keihanshin Building. Accordingly, we have drafted Compliance Regulations, as
well as a Code of Conduct and Standards of Conduct, which clarify guidelines and standards for directors and employees. Directors
manage the compliance system mainly through the Compliance Committee established within the Company. Directors report activities of
the committee periodically to the President and, when necessary, to the Management Meeting or the Board of Directors. Moreover,
Directors report periodically to the President operations of an in-house reporting system that has been established, so that compliance
infractions can be reported and discussed.
Keihanshin Building responds quickly and accurately to changes in the social environment through compliance seminars attended
by all directors and employees. We are developing a corporate culture that values compliance consciousness in business dealings.
The head of the Audit Department conducts appropriate compliance audits and reports the findings to the President and Compliance
Committee and, if necessary, to the Board of Directors.
Keihanshin Building has drafted Risk Management Regulations and is committed to controlling and preventing the risks that attend
business in each of its departments. To consolidate these risks and control them on a companywide basis, we have established a Risk
Management Committee. Directors make use of the Committee and report periodically to the President on matters under its jurisdiction,
such as (1) identification of risk and comprehensive management of its assessment, (2) drafting and review of risk management policies
and plans, and (3) summarization of the risk management situation. If necessary, these matters are also reported to the Management
Meeting or the Board of Directors.
In preparation for an event or emergency with serious consequences, we have devised a business continuity plan (BCP) to enable a
speedy, appropriate companywide response. We are publicizing the plan throughout the Company.
The head of the Audit Department conducts appropriate risk management audits and reports the findings to the President and Risk
Management Committee and, if necessary, to the Board of Directors.
Compliance System
Risk Management System
Shareholders’ Meeting
President
Audit & Supervisory Board3 Audit & Supervisory Board members
(of whom 2 are outside Audit & Supervisory Board members)
Management meeting(Discussion of important matters)
Full-time executives, etc.
President
Each department, subsidiary
Employees
Employees
Each division, subsidiary
Independent AccountingAuditor
Selection, release
Exchange of opinions
Audit
Oversight
Report
Report
Report
Report
Report, consultation
Plan notification
Education
Investigation, verification
Internal audit
Internal memoReport
Control
Directives
Report
Report
Agreement on auditor candidates
Judgment on reasonableness of audit
Compliance CommitteeAudit Department
Risk Management Committee
General Affairs Department
Control and directives Report Report
Election, dismissalElection, dismissal Election, dismissal
Information dispersal
Education
Investigation, verification
Internal auditReport Notification
Consultation
Report
Consultation
Report
Consultation
Report
Report
Report
Compliance Committee
Notification
Consultation
Audit DepartmentCompliance Committee members
Board of Directors8 Board members
(of whom 1 is an outside director)
Corporate Governance System
Corporate Governance Diagram
12 Keihanshin Building Co., Ltd. 13Keihanshin Building Co., Ltd.
Corporate Governance, Compliance, and Risk Management

The safety and security of building and facility users is foremost in our thoughts from the design stage. We strive to make both
the hardware and software aspects of our buildings user friendly by, for example, employing high-performance air-conditioning
and lighting fixtures, and by making rooms and common spaces more inviting.
While taking measures to extend the lifespan of buildings, we also give a high priority to energy efficiency in choosing
equipment. We were an early adopter of heat-deflecting eco-glass and other environmentally friendly products, which we have
steadily adopted in our buildings.
Moreover, to combat the heat-island effect of large cities, we promote the use of green spaces on our building roofs and
walls, enhancing the urban environment.
In May 2014, we acquired the large-scale Fuchu Building in the Tokyo suburb of
Fuchu City to expand our building lease business in the Tokyo metropolitan area and
diversify our regional portfolio.
This property continues to be occupied by the NEC Nakagawahara Technology Center.
In November 2014, renovation work accompanying a
tenant change at our Shijo-Kawaramachi Building was
completed and the building was reopened. The
building contains the Scandinavian fashion retailer
H&M’s first store in Kyoto and one of its largest stores
in Japan. Well located on Kawaramachi Street only
three minutes on foot from Hankyu Kawaramachi
Station, this building has a white exterior, which adds
to the area’s dynamism.
We will continue to make the vicinities of our
buildings safer, more beautiful, and livelier by
constructing facilities that harmonize with their
surroundings and raise neighborhood values.
To expand its operating area and diversify its asset portfolio, Keihanshin Building has
considered making significant new investments centered in the Tokyo metropolitan area.
In July 2014 we opened a Tokyo office, which we will use to strengthen our information-
gathering capacity in the Tokyo metropolitan area and to boost relationships with major
clients in the area.
The real estate leasing business advances in tandem with the local community. Keihanshin Building quickly and accurately
grasps community needs and contributes to community development as a local entity.
The buildings we construct are social capital and constitute the face of their neighborhoods for many years. While
harmonizing with the historical context and cityscape of each neighborhood, our buildings contribute to land values, hence
to the safety, beauty, and liveliness of their surroundings.
In cooperation with our neighbors, we promote the local economy, participate in events to enliven our communities, and
actively take part in local clean-up efforts, tree- and flower-planting, and cultural activities.
Social Contribution
Consideration for the Environment Acquisition of the Fuchu Building, Our Eighth Office Building
Notice of the Shijo-Kawaramachi Building’s Renovation
Opening of the Tokyo Office
Greenery in front of the Onarimon Building
Presentation of a support contribution list for bunraku (Japanese puppet theater)
The outdoor air conditioner units are misted.
The Osaka Classic (in the Midosuji Building’s first-floor lobby)
Outline
Outline
Outline
Location : 5-22-5 Sumiyoshicho, Fuchu-shi,
Tokyo
Total Land Area : 18,460 m2
Total Floor Area : 35,907 m2
Structure : S; 6F
Acquisition Date : May 2014
Location : 354 Shimoosakacho, Kawaramachi-
dori Shijo Agaru, Nakagyo-ku, Kyoto
Total Land Area : 751 m2
Total Floor Area : 4,968 m2
Structure : S; B1/7F
Opening Day : November 2014
Location : Kyodo Bldg. 8F, 2-2 Kanda Jimbocho,
Chiyoda-ku, Tokyo
Opening Day : July 2014
Tama River
Nakagawara St.
Kam
akur
a-ka
ido
Keio Line
Fuchukeijikai Hospital
Fuchu Building
Kyoto Takashimaya
KAWARAMACHI OPA
Shijo-KawaramachiBuilding
Tokyo Office
Bank of Tokyo-Mitsubishi
UFJ JimbochoBranch
Kyoto MARUI
Kawaramachi St.
Jimbocho St.
Hankyu Kyoto Line
Toei Shinjuku Line
Tokyo Metro Hanzomon Line
Yasukuni Dori
Kam
o R
iver
Gio
n S
hijo
St.
Toei
Mita
Lin
e
Hak
usan
Dor
i
14 Keihanshin Building Co., Ltd. 15Keihanshin Building Co., Ltd.
TopicsRelations with Society and People

Ordinary income
5,000
4,000
3,000
2,000
1,000
0
201320122010FY 2011
3,6994,123
3,4483,800
2,369
2014
201320122010FY 2011 2014
201320122010FY 2011 2014
201320122010FY 2011 2014
4,457
2,732
1,773 1,740
2,331
Net income
Interest-bearing debt Interest-bearing debt to total assets
75,000 75
60,000 60
45,000 45
30,000
15,000
30
15
0 0
56,75057,55060,940 63,440
55.1 55.1 55.449.3
51,286
44.5
50
40
30
20
10
0
36.0 35.1 36.4
42.045.0
Cash flows from operating activities
10,000
5,000
0
–5,000
–10,000
128
–5,733
–2,922 –2,644
4,6075,862
3,676
6,091
–2,633
–9,644
7,086
–6,148
–445
2,833 1,961
Cash flows from investing activitiesCash flows from financing activities
Review of Fiscal 2014
In fiscal 2014 (ended March 31, 2015), the Japanese
economy showed signs of recovery as corporate
earnings improved and the Bank of Japan maintained its
loose monetary policy. On the other hand, private
consumption stalled after the consumption tax rate hike
and the international situation was unstable, so the
outlook remained unclear.
In the real estate leasing market, the office vacancy
rate for prime properties in central Tokyo trended
downward owing to corporate demand for more space
through relocation or expansion at current locations.
Rent levels improved for some types of properties.
In this environment, Keihanshin Building’s efforts to
solicit tenants led to a decline in its vacancy rate from
4.9% (end of fiscal 2013) to 3.2%. The Company
acquired the Fuchu Building as a new investment, and
worked to strengthen its earnings and expand its
business area.
Leases with new tenants and the acquisition of the
Fuchu Building helped to raise fiscal 2014 consolidated
revenue from operations to ¥14,852 million, a year-on-
year increase of ¥821 million (5.9%).
Gross profit rose ¥586 million (10.8%) to ¥5,996
million, while operating income climbed ¥503 million
(11.3%) to ¥4,966 million. Ordinary income rose ¥758
million (20.5%) to ¥4,457 million, helped by a decline in
interest payments. Net income rose ¥363 million (15.3%)
to ¥2,732 million.
Earnings by segment (operating income prior to
adjustment for consolidation) were as follows.
Building Lease
Due to higher occupancy rates in existing buildings and
the acquisition of the Fuchu Building, revenue was
¥14,571 million (up ¥970 million, or 7.1%). Operating
income was ¥5,451 million (up ¥557 million, or 11.4%).
Other
Contract construction orders declined, so revenue was
¥280 million (down ¥149 million, or 34.7%). Operating
income was ¥6 million (down ¥29 million, or 82.9%).
Financial Position
Assets, Liabilities and Net Assets
Assets
At the end of fiscal 2014, total assets stood at ¥115,243
million, a year-on-year increase of ¥227 million (0.2%).
Although cash and cash equivalents declined ¥8,706
million due to the acquisition of a new office building,
property, plant and equipment increased ¥6,789 million,
and the rise of stock markets added ¥2,355 million to
the Company’s investment securities.
Liabilities
Total liabilities were ¥63,392 million, a decline of ¥3,372
million (5.1%). Income taxes payable expanded by ¥783
million and deferred tax liabilities by ¥721 million,
but interest-bearing liabilities declined ¥5,463 million
through repayment.
Net Assets
Total net assets amounted to ¥51,850 million, an
increase of ¥3,600 million (7.5%). The main factors were
a ¥1,977 million increase in retained earnings and a
¥1,752 million increase in unrealized gains on securities.
Cash Flows
On a consolidated basis, cash and cash equivalents at
the end of fiscal 2014 decreased ¥8,706 million year on
year, to ¥3,576 million. Major cash flows and the factors
behind them were as follows.
Cash Flows from Operating Activities
Net cash provided by operating activities was ¥7,086
million, up ¥2,478 million. The main factors were an
increase of ¥540 million in income before income taxes
to ¥4,386 million; an increase of ¥617 million in
operating debt, largely owing to lease deposits
from tenants; and a decline of ¥441 million in income
taxes paid.
Cash Flows from Investing Activities
Net cash used in investing activities totaled ¥9,644
million, up ¥9,773 million. The purchase of property,
plant and equipment accounted for expenditures of
¥9,528 million, an increase of ¥8,710 million. Proceeds
from sales of property, plant and equipment declined
¥1,028 million.
Cash Flows from Financing Activities
Net cash used in financing activities amounted to ¥6,148
million, up ¥3,514 million. In the previous fiscal year, the
Company obtained ¥4,754 million through stock
issuance and sales of treasury stock, but in fiscal 2014 it
did not obtain any funds in this way.
Ordinary income / Net income(Millions of yen)
Shareholders’ equity ratio(%)
Interest-bearing debt / Interest-bearing debt to total assets(%)(Millions of yen)
Cash flows(Millions of yen)
16 Keihanshin Building Co., Ltd. 17Keihanshin Building Co., Ltd.
Management’s Discussion and Analysis
(Thousands of yen)
Notes Fiscal 2013 Fiscal 2014
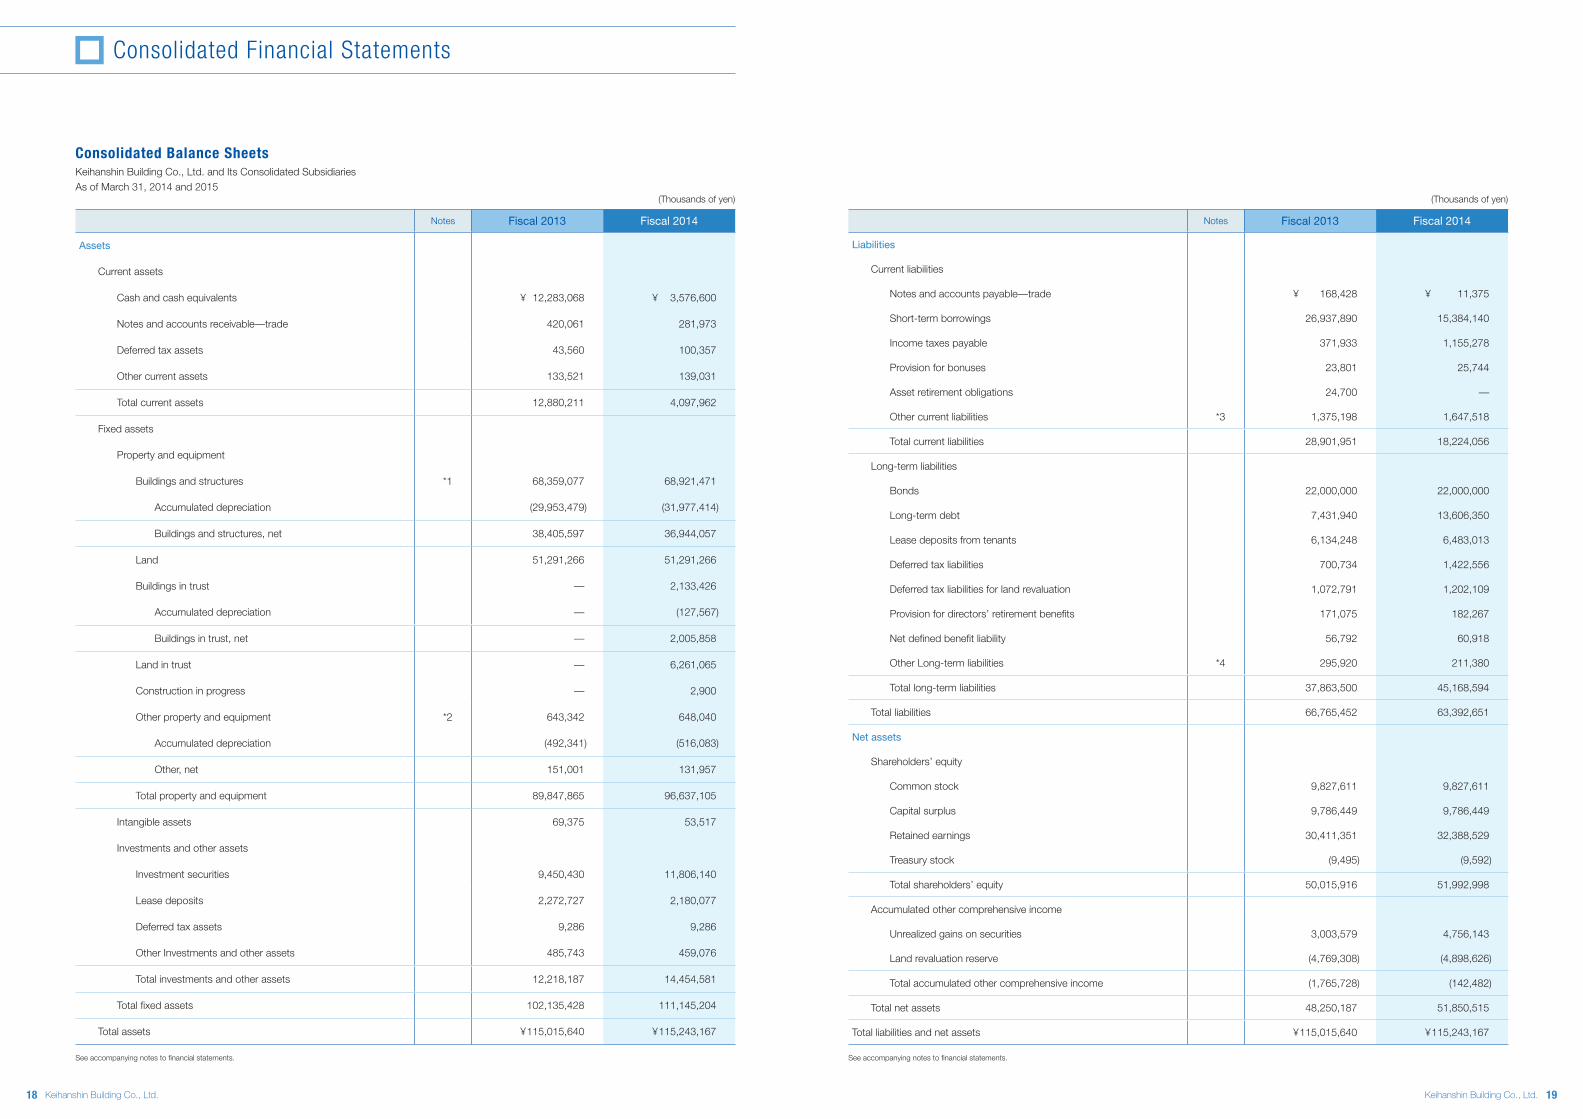
Liabilities
Current liabilities
Notes and accounts payable—trade ¥ 168,428 ¥ 11,375
Short-term borrowings 26,937,890 15,384,140
Income taxes payable 371,933 1,155,278
Provision for bonuses 23,801 25,744
Asset retirement obligations 24,700 —
Other current liabilities *3 1,375,198 1,647,518
Total current liabilities 28,901,951 18,224,056
Long-term liabilities
Bonds 22,000,000 22,000,000
Long-term debt 7,431,940 13,606,350
Lease deposits from tenants 6,134,248 6,483,013
Deferred tax liabilities 700,734 1,422,556
Deferred tax liabilities for land revaluation 1,072,791 1,202,109
Provision for directors’ retirement benefits 171,075 182,267
Net defined benefit liability 56,792 60,918
Other Long-term liabilities *4 295,920 211,380
Total long-term liabilities 37,863,500 45,168,594
Total liabilities 66,765,452 63,392,651
Net assets
Shareholders’ equity
Common stock 9,827,611 9,827,611
Capital surplus 9,786,449 9,786,449
Retained earnings 30,411,351 32,388,529
Treasury stock (9,495) (9,592)
Total shareholders’ equity 50,015,916 51,992,998
Accumulated other comprehensive income
Unrealized gains on securities 3,003,579 4,756,143
Land revaluation reserve (4,769,308) (4,898,626)
Total accumulated other comprehensive income (1,765,728) (142,482)
Total net assets 48,250,187 51,850,515
Total liabilities and net assets ¥ 115,015,640 ¥ 115,243,167
See accompanying notes to financial statements.
(Thousands of yen)
Notes Fiscal 2013 Fiscal 2014
Assets
Current assets
Cash and cash equivalents ¥ 12,283,068 ¥ 3,576,600
Notes and accounts receivable—trade 420,061 281,973
Deferred tax assets 43,560 100,357
Other current assets 133,521 139,031
Total current assets 12,880,211 4,097,962
Fixed assets
Property and equipment
Buildings and structures *1 68,359,077 68,921,471
Accumulated depreciation (29,953,479) (31,977,414)
Buildings and structures, net 38,405,597 36,944,057
Land 51,291,266 51,291,266
Buildings in trust — 2,133,426
Accumulated depreciation — (127,567)
Buildings in trust, net — 2,005,858
Land in trust — 6,261,065
Construction in progress — 2,900
Other property and equipment *2 643,342 648,040
Accumulated depreciation (492,341) (516,083)
Other, net 151,001 131,957
Total property and equipment 89,847,865 96,637,105
Intangible assets 69,375 53,517
Investments and other assets
Investment securities 9,450,430 11,806,140
Lease deposits 2,272,727 2,180,077
Deferred tax assets 9,286 9,286
Other Investments and other assets 485,743 459,076
Total investments and other assets 12,218,187 14,454,581
Total fixed assets 102,135,428 111,145,204
Total assets ¥ 115,015,640 ¥ 115,243,167
See accompanying notes to financial statements.
Consolidated Balance SheetsKeihanshin Building Co., Ltd. and Its Consolidated SubsidiariesAs of March 31, 2014 and 2015
18 Keihanshin Building Co., Ltd. 19Keihanshin Building Co., Ltd.
Consolidated Financial Statements

(Thousands of yen)
Notes Fiscal 2013 Fiscal 2014
Income before minority interests ¥ 2,369,458 ¥ 2,732,830
Other comprehensive income
Unrealized gains on securities 1,236,887 1,752,564
Land revaluation reserve (1,106,266) (129,317)
Total other comprehensive income * 130,620 1,623,246
Comprehensive income ¥ 2,500,079 ¥ 4,356,076
Comprehensive income attributable to
Owners of parent 2,500,079 4,356,076
Minority interests — —
See accompanying notes to financial statements.
Consolidated Statements of Comprehensive IncomeKeihanshin Building Co., Ltd. and Its Consolidated SubsidiariesYears ended March 31, 2014 and 2015
(Thousands of yen)
Notes Fiscal 2013 Fiscal 2014
Revenue from operations ¥ 14,031,098 ¥ 14,852,697
Cost of revenue from operations 8,621,079 8,855,779
Gross profit 5,410,018 5,996,918
Selling, general and administrative expenses *1 946,392 1,030,123
Operating income 4,463,625 4,966,794
Non-operating income
Interest income 3,775 2,282
Dividend income 151,208 176,286
Other non-operating income 17,914 15,949
Total non-operating income 172,898 194,518
Non-operating expenses
Interest expense 610,677 440,774
Interest on corporate bonds 226,235 222,400
Common stock issuance cost 30,686 —
Amortization of long-term prepaid expenses 60,000 30,000
Commission for syndicate loan 2,000 1,000
Other non-operating expenses 7,551 9,202
Total non-operating expenses 937,150 703,377
Ordinary income 3,699,373 4,457,935
Extraordinary income
Gain on sales of fixed assets *2 170,864 4,810
Gain on sales of investment securities 13,118 —
Compensation income *3 2,500 —
Total extraordinary income 186,482 4,810
Extraordinary loss
Loss on sales of fixed assets *4 128 —
Loss related to retirement of fixed assets *5 7,307 76,485
Impairment loss *6 32,356 —
Real estate acquisition tax and registration license tax *7 7 —
Total extraordinary loss 39,799 76,485
Income before income taxes 3,846,056 4,386,260
Income taxes 972,477 1,591,549
Deferred income taxes 504,120 61,880
Total income taxes 1,476,597 1,653,429
Income before minority interests 2,369,458 2,732,830
Net income ¥ 2,369,458 ¥ 2,732,830
See accompanying notes to financial statements.
Consolidated Statements of IncomeKeihanshin Building Co., Ltd. and Its Consolidated SubsidiariesYears ended March 31, 2014 and 2015
20 Keihanshin Building Co., Ltd. 21Keihanshin Building Co., Ltd.
Consolidated Financial Statements

Consolidated Statements of Changes in Net Assets
(Thousands of yen)
Shareholders’ equity
Common stock Capital surplusRetained earnings
Treasury stockTotal
shareholders’ equity
Balance at beginning of current period ¥ 9,827,611 ¥ 9,786,449 ¥ 30,411,351 ¥ (9,495) ¥ 50,015,916
Changes of items during period
Dividends of retained earnings (755,651) (755,651)
Net income 2,732,830 2,732,830
Purchase of treasury stock (96) (96)
Net changes of items other than shareholders’ equity
Total changes of items during period — — 1,977,178 (96) 1,977,081
Balance at end of current period ¥ 9,827,611 ¥ 9,786,449 ¥ 32,388,529 ¥ (9,592) ¥ 51,992,998
Accumulated other comprehensive income
Total net assetsUnrealized gains
on securitiesLand revaluation
reserve
Total accumulated
other comprehensive
income
Balance at beginning of current period ¥ 3,003,579 ¥ (4,769,308) ¥ (1,765,728) ¥ 48,250,187
Changes of items during period
Dividends of retained earnings (755,651)
Net income 2,732,830
Purchase of treasury stock (96)
Net changes of items other than shareholders’ equity 1,752,564 (129,317) 1,623,246 1,623,246
Total changes of items during period 1,752,564 (129,317) 1,623,246 3,600,328
Balance at end of current period ¥ 4,756,143 ¥ (4,898,626) ¥ (142,482) ¥ 51,850,515
Keihanshin Building Co., Ltd. and Its Consolidated SubsidiariesYear ended March 31, 2015
(Thousands of yen)
Shareholders’ equity
Common stock Capital surplusRetained earnings
Treasury stockTotal
shareholders’ equity
Balance at beginning of current period ¥ 7,688,158 ¥ 7,529,369 ¥ 28,779,526 ¥ (367,035) ¥ 43,630,018
Changes of items during period
Issuance of new shares 2,139,453 2,139,453 4,278,906
Dividends of retained earnings (737,633) (737,633)
Net income 2,369,458 2,369,458
Purchase of treasury stock (395) (395)
Disposal of treasury stock 117,626 357,935 475,562
Net changes of items other than shareholders’ equity
Total changes of items during period 2,139,453 2,257,079 1,631,825 357,539 6,385,897
Balance at end of current period ¥ 9,827,611 ¥ 9,786,449 ¥ 30,411,351 ¥ (9,495) ¥ 50,015,916
Accumulated other comprehensive income
Total net assetsUnrealized gains
on securitiesLand revaluation
reserve
Total accumulated
other comprehensive
income
Balance at beginning of current period ¥ 1,766,691 ¥ (3,663,041) ¥ (1,896,349) ¥ 41,733,668
Changes of items during period
Issuance of new shares 4,278,906
Dividends of retained earnings (737,633)
Net income 2,369,458
Purchase of treasury stock (395)
Disposal of treasury stock 475,562
Net changes of items other than shareholders’ equity 1,236,887 (1,106,266) 130,620 130,620
Total changes of items during period 1,236,887 (1,106,266) 130,620 6,516,518
Balance at end of current period ¥ 3,003,579 ¥ (4,769,308) ¥ (1,765,728) ¥ 48,250,187
Keihanshin Building Co., Ltd. and Its Consolidated SubsidiariesYear ended March 31, 2014
22 Keihanshin Building Co., Ltd. 23Keihanshin Building Co., Ltd.
Consolidated Financial Statements
(Thousands of yen)
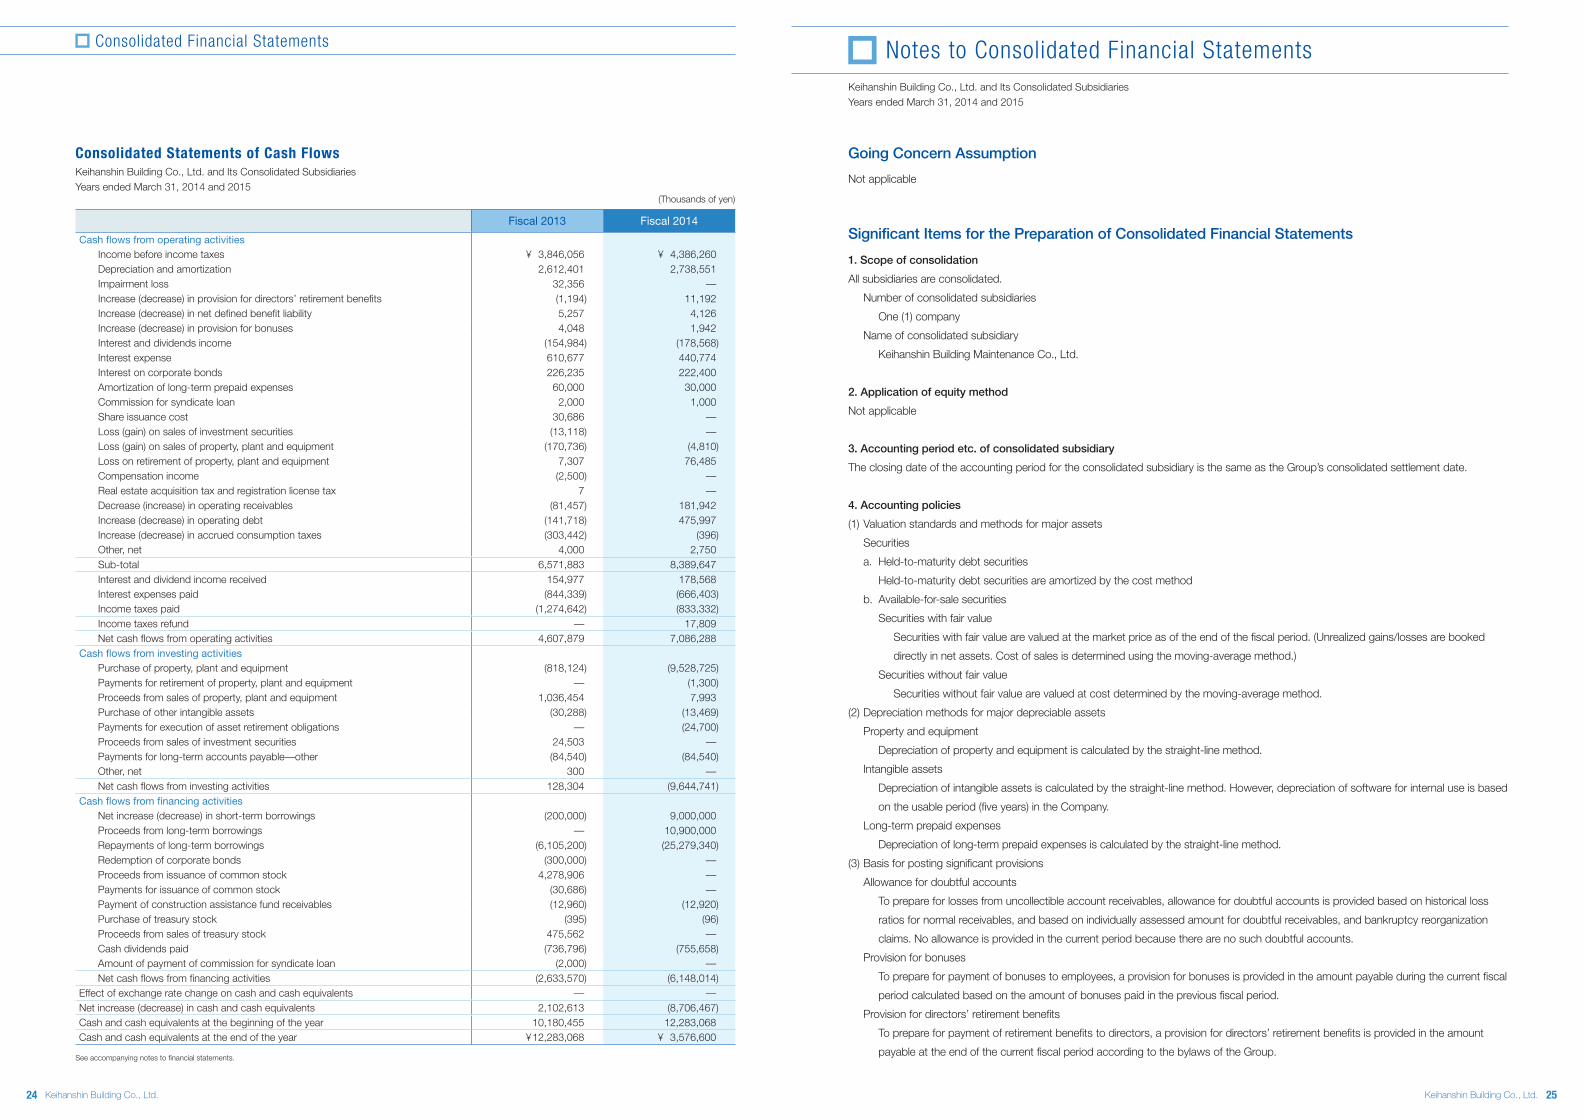
Fiscal 2013 Fiscal 2014
Cash flows from operating activitiesIncome before income taxes ¥ 3,846,056 ¥ 4,386,260Depreciation and amortization 2,612,401 2,738,551Impairment loss 32,356 —Increase (decrease) in provision for directors’ retirement benefits (1,194) 11,192 Increase (decrease) in net defined benefit liability 5,257 4,126 Increase (decrease) in provision for bonuses 4,048 1,942 Interest and dividends income (154,984) (178,568)Interest expense 610,677 440,774 Interest on corporate bonds 226,235 222,400 Amortization of long-term prepaid expenses 60,000 30,000 Commission for syndicate loan 2,000 1,000Share issuance cost 30,686 —Loss (gain) on sales of investment securities (13,118) —Loss (gain) on sales of property, plant and equipment (170,736) (4,810)Loss on retirement of property, plant and equipment 7,307 76,485 Compensation income (2,500) —Real estate acquisition tax and registration license tax 7 —Decrease (increase) in operating receivables (81,457) 181,942 Increase (decrease) in operating debt (141,718) 475,997 Increase (decrease) in accrued consumption taxes (303,442) (396)Other, net 4,000 2,750 Sub-total 6,571,883 8,389,647 Interest and dividend income received 154,977 178,568 Interest expenses paid (844,339) (666,403)Income taxes paid (1,274,642) (833,332)Income taxes refund — 17,809Net cash flows from operating activities 4,607,879 7,086,288
Cash flows from investing activitiesPurchase of property, plant and equipment (818,124) (9,528,725)Payments for retirement of property, plant and equipment — (1,300)Proceeds from sales of property, plant and equipment 1,036,454 7,993 Purchase of other intangible assets (30,288) (13,469)Payments for execution of asset retirement obligations — (24,700)Proceeds from sales of investment securities 24,503 —Payments for long-term accounts payable—other (84,540) (84,540)Other, net 300 —Net cash flows from investing activities 128,304 (9,644,741)
Cash flows from financing activitiesNet increase (decrease) in short-term borrowings (200,000) 9,000,000 Proceeds from long-term borrowings — 10,900,000 Repayments of long-term borrowings (6,105,200) (25,279,340)Redemption of corporate bonds (300,000) —Proceeds from issuance of common stock 4,278,906 —Payments for issuance of common stock (30,686) —Payment of construction assistance fund receivables (12,960) (12,920)Purchase of treasury stock (395) (96)Proceeds from sales of treasury stock 475,562 —Cash dividends paid (736,796) (755,658)Amount of payment of commission for syndicate loan (2,000) —Net cash flows from financing activities (2,633,570) (6,148,014)
Effect of exchange rate change on cash and cash equivalents — —Net increase (decrease) in cash and cash equivalents 2,102,613 (8,706,467)Cash and cash equivalents at the beginning of the year 10,180,455 12,283,068Cash and cash equivalents at the end of the year ¥ 12,283,068 ¥ 3,576,600
See accompanying notes to financial statements.
Consolidated Statements of Cash FlowsKeihanshin Building Co., Ltd. and Its Consolidated SubsidiariesYears ended March 31, 2014 and 2015
Keihanshin Building Co., Ltd. and Its Consolidated SubsidiariesYears ended March 31, 2014 and 2015
Going Concern Assumption
Not applicable
Significant Items for the Preparation of Consolidated Financial Statements
1. Scope of consolidation
All subsidiaries are consolidated.
Number of consolidated subsidiaries
One (1) company
Name of consolidated subsidiary
Keihanshin Building Maintenance Co., Ltd.
2. Application of equity method
Not applicable
3. Accounting period etc. of consolidated subsidiary
The closing date of the accounting period for the consolidated subsidiary is the same as the Group’s consolidated settlement date.
4. Accounting policies
(1) Valuation standards and methods for major assets
Securities
a. Held-to-maturity debt securities
Held-to-maturity debt securities are amortized by the cost method
b. Available-for-sale securities
Securities with fair value
Securities with fair value are valued at the market price as of the end of the fiscal period. (Unrealized gains/losses are booked
directly in net assets. Cost of sales is determined using the moving-average method.)
Securities without fair value
Securities without fair value are valued at cost determined by the moving-average method.
(2) Depreciation methods for major depreciable assets
Property and equipment
Depreciation of property and equipment is calculated by the straight-line method.
Intangible assets
Depreciation of intangible assets is calculated by the straight-line method. However, depreciation of software for internal use is based
on the usable period (five years) in the Company.
Long-term prepaid expenses
Depreciation of long-term prepaid expenses is calculated by the straight-line method.
(3) Basis for posting significant provisions
Allowance for doubtful accounts
To prepare for losses from uncollectible account receivables, allowance for doubtful accounts is provided based on historical loss
ratios for normal receivables, and based on individually assessed amount for doubtful receivables, and bankruptcy reorganization
claims. No allowance is provided in the current period because there are no such doubtful accounts.
Provision for bonuses
To prepare for payment of bonuses to employees, a provision for bonuses is provided in the amount payable during the current fiscal
period calculated based on the amount of bonuses paid in the previous fiscal period.
Provision for directors’ retirement benefits
To prepare for payment of retirement benefits to directors, a provision for directors’ retirement benefits is provided in the amount
payable at the end of the current fiscal period according to the bylaws of the Group.
24 Keihanshin Building Co., Ltd. 25Keihanshin Building Co., Ltd.
Notes to Consolidated Financial StatementsConsolidated Financial Statements

(4) Accounting policies for retirement benefits
To calculate liabilities for retirement benefits and retirement benefit expenses, the Group uses the simplified method, which assumes the
retirement benefit obligation to be equal to the benefits payable for voluntary retirement at the fiscal period-end.
(5) Basis for posting significant revenues and expenses
Basis for posting revenues and costs of construction contracts
The percentage-of-completion method has been applied to construction contracts if the outcome of the construction activity is
deemed certain at the end of the current fiscal period (the estimated percentage of completion shall be based on the ratio of the
cost incurred to the estimated total cost). The completed-contract method is applied to other construction contracts.
(6) Significant hedge accounting method
Not applicable
(7) Amortization of goodwill and amortization period
Not applicable
(8) Scope of cash and cash equivalents in the consolidated statements of cash flows
Cash and cash equivalents in the consolidated statements of cash flows are comprised of cash in hand, demand deposits, and short-
term investments with maturities of three months or less from the date of acquisition, that are liquid, readily convertible into cash and are
subject to minimum risk of price fluctuation.
(9) Other significant items as a basis for preparing financial statements
Accounting for consumption taxes
Transactions subject to consumption taxes are recorded as amounts exclusive of consumption taxes. Consumption taxes not
subject to deduction are treated as expenses for the current fiscal period.
Consolidated Balance Sheets
Among *1 and *2, the assets pledged as collateral are as follows.
(Thousands of yen)
Fiscal 2013(As of March 31, 2014)
Fiscal 2014(As of March 31, 2015)
Buildings and structures ¥ 682,781 ¥ 648,275
Other 0 0
Total ¥ 682,781 ¥ 648,275
Among *3 and *4, secured debts are as follows.
(Thousands of yen)
Fiscal 2013(As of March 31, 2014)
Fiscal 2014(As of March 31, 2015)
Long-term accounts payable—other (including payment in less than one year)
¥ 380,460 ¥ 295,920
5. Revaluation of land
The Company revaluated its land held for business use, in accordance with the Act on Revaluation of Land (Act No. 34 of March 31, 1998)
and Partial Revision of the Act on Revaluation of Land (Act No.19 of March 31, 2001) on March 31, 2002.
In accordance with Partial Revision of the Act on Revaluation of Land (Act No.24 of March 31, 1999), the Company recorded the amount
corresponding to taxes on the differences in land revaluation as Deferred tax liabilities for land revaluation in the liabilities segment and
posted the amount minus this as Revaluation reserve for land in the net assets segment.
Method of Revaluation
Revaluation was made by reasonably adjusting fixed asset-tax-assessment values in accordance with the provision of Article 2,
Paragraph 3 of the Ordinance for Enforcement of the Act on Revaluation of Land (Ordinance No.119 of March 31, 1998).
Date of Revaluation
March 31, 2002
(Thousands of yen)
Fiscal 2013(As of March 31, 2014)
Fiscal 2014(As of March 31, 2015)
Differences between the fair value of the revalued land at the end of fiscal period and its carrying amount after revaluation ¥ (1,207,249) ¥ (828,424)
(of which differences related to lease properties) (1,207,249) (828,424)
Consolidated Statements of Income
*1. Major items included in the selling, general and administrative expenses segment are as follows:
(Thousands of yen)
Fiscal 2013(April 1, 2013 to March 31, 2014)
Fiscal 2014(April 1, 2014 to March 31, 2015)
Directors’ compensation ¥ 182,040 ¥ 168,190
Employees’ salaries and bonuses 314,567 351,483
Provision for bonuses 23,801 25,744
Entertainment expenses 26,857 31,689
Retirement benefit expenses 9,566 16,506
Provision for directors’ retirement benefits 41,606 36,192
Business consignment expenses 91,176 90,573
*2. Details of gain on sales of fixed assets
(Thousands of yen)
Fiscal 2013(April 1, 2013 to March 31, 2014)
Fiscal 2014(April 1, 2014 to March 31, 2015)
Building and structures ¥ — ¥ 4,810
Land 170,864 —
Total ¥ 170,864 ¥ 4,810
*3. Compensation income
Fiscal 2013 (April 1, 2013 to March 31, 2014)
Compensation by a customer in relation to the removal of assets for lease in response to the customer’s request
*4. Details of loss on sales of fixed assets
(Thousands of yen)
Fiscal 2013(April 1, 2013 to March 31, 2014)
Fiscal 2014(April 1, 2014 to March 31, 2015)
Other ¥ 128 ¥ —
Total ¥ 128 ¥ —
*5. Details of loss related to retirement of fixed assets
(Thousands of yen)
Fiscal 2013(April 1, 2013 to March 31, 2014)
Fiscal 2014(April 1, 2014 to March 31, 2015)
Building and structures ¥ 6,793 ¥ 76,279
Other 513 206
Total ¥ 7,307 ¥ 76,485
26 Keihanshin Building Co., Ltd. 27Keihanshin Building Co., Ltd.
Notes to Consolidated Financial Statements

*6. Impairment loss
Fiscal 2013 (April 1, 2013 to March 31, 2014)
In fiscal 2013, the Group recorded an impairment loss for the following assets.
Purpose Type Location
Lease properties BuildingsKoriyama City, Fukushima
Prefecture
The Group categorizes its assets into groups according to the minimum units that generate cash flows, which are by and large
independent from the cash flows of other assets or asset groups.
The Group decided to withdraw business in the abovementioned facilities. Consequently, as the Group was obliged to return the land to
its owner as a vacant lot after demolishing the buildings, etc., on it, it posted an impairment loss of ¥32,356 thousand, the carrying amount
of the said assets, as an extraordinary loss. The amount included ¥24,700 thousand that the Group posted due to a change in accounting
estimate relating to asset retirement obligations.
*7. Details of real estate acquisition tax and registration license tax
(Thousands of yen)
Fiscal 2013(April 1, 2013 to March 31, 2014)
Fiscal 2014(April 1, 2014 to March 31, 2015)
Real estate acquisition tax ¥ 7 ¥ —
Total ¥ 7 ¥ —
Consolidated Statements of Comprehensive Income
*Reclassification adjustments and tax effects relating to other comprehensive income
(Thousands of yen)
Fiscal 2013(April 1, 2013 to March 31, 2014)
Fiscal 2014(April 1, 2014 to March 31, 2015)
Unrealized gains on available-for-sale securities
Unrealized gains arising during the current year ¥ 1,894,032 ¥ 2,355,709
Reclassification adjustments (13,118) —
Before tax effect adjustment 1,880,913 2,355,709
Tax effects (644,026) (603,145)
Unrealized gains on available-for-sale securities 1,236,887 1,752,564
Land revaluation reserve
Tax effects (1,106,266) (129,317)
Total other comprehensive income ¥ 130,620 ¥ 1,623,246
Consolidated Statements of Changes in Shareholders’ Equity
Fiscal 2013 (April 1, 2013 to March 31, 2014)
1. Outstanding shares
Type of sharesNumber of shares at
beginning of current periodNumber of shares
increased during periodNumber of shares
decreased during periodNumber of shares at end of current period
Common stock 45,898,798 8,100,000 — 53,998,798
(Summary of Reasons for the Change)
The details of the number of shares increased during the current fiscal period are as follows:
Increase due to the issuance of new shares through public offering 7,200,000 shares
Increase due to the issuance of new shares through a third-party allotment 900,000 shares
2. Treasury stock
Type of sharesNumber of shares at
beginning of current periodNumber of shares
increased during periodNumber of shares
decreased during periodNumber of shares at end of current period
Common stock 923,145 710 900,217 23,638
(Summary of Reasons for the Change)
The details of the number of shares increased during the current fiscal period are as follows:
Increase due to the buyback of shares of less than one unit 710 shares
The details of the number of shares decreased during the current fiscal period are as follows:
Decrease due to the disposal of treasury stock 900,000 shares
Decrease due to the sale of shares of less than one unit 217 shares
3. Subscription rights to shares
Not applicable
4. Dividends
(1) Dividend payment
Resolution Type of sharesTotal dividends
(thousands of yen)Dividend per share (yen)
Record date Effective date
Ordinary shareholders’ meeting on June 20, 2013 Common stock ¥ 359,805 ¥ 8.00 March 31, 2013 June 21, 2013
The Board Meeting on October 25, 2013 Common stock ¥ 377,828 ¥ 7.00 September 30, 2013 December 5, 2013
(2) Dividends whose record date is within the current fiscal period but are to be effective in the following fiscal period
ResolutionType of shares
Source of dividends
Total dividends (thousands of yen)
Dividend per share (yen)
Record date Effective date
Ordinary shareholders’ meeting on June 19, 2014 Common stock Retained earnings ¥ 377,826 ¥ 7.00 March 31, 2014 June 20, 2014
Fiscal 2014 (April 1, 2014 to March 31, 2015)
1. Outstanding shares
Type of sharesNumber of shares at
beginning of current periodNumber of shares
increased during periodNumber of shares
decreased during periodNumber of shares at end of current period
Common stock 53,998,798 — — 53,998,798
2. Treasury stock
Type of sharesNumber of shares at
beginning of current periodNumber of shares
increased during periodNumber of shares
decreased during periodNumber of shares at end of current period
Common stock 23,638 159 — 23,797
28 Keihanshin Building Co., Ltd. 29Keihanshin Building Co., Ltd.
Notes to Consolidated Financial Statements

(Summary of Reasons for the Change)
The details of the number of shares increased during the current fiscal period are as follows:
Increase due to the buyback of shares of less than one unit 159 shares
3. Subscription rights to shares
Not applicable
4. Dividends
(1) Dividend payment
Resolution Type of sharesTotal dividends
(thousands of yen)Dividend per share (yen)
Record date Effective date
Ordinary shareholders’ meeting on June 19, 2014 Common stock ¥ 377,826 ¥ 7.00 March 31, 2014 June 20, 2014
The Board Meeting on October 28, 2014 Common stock ¥ 377,825 ¥ 7.00 September 30, 2014 December 5, 2014
(2) Dividends whose record date is within the current fiscal period but are to be effective in the following fiscal period
ResolutionType of shares
Source of dividends
Total dividends (thousands of yen)
Dividend per share (yen)
Record date Effective date
Ordinary shareholders’ meeting on June 18, 2015 Common stock Retained earnings ¥ 431,800 ¥ 8.00 March 31, 2015 June 19, 2015
Consolidated Statements of Cash Flows
Reconciliation of cash and cash equivalents at the year-end and the accounts reported in the consolidated balance sheets
(Thousands of yen)
Fiscal 2013(April 1, 2013 to March 31, 2014)
Fiscal 2014(April 1, 2014 to March 31, 2015)
Cash and cash equivalents ¥ 12,283,068 ¥ 3,576,600
Cash and cash equivalents ¥ 12,283,068 ¥ 3,576,600
Lease Transactions
1. Finance lease transactions that do not transfer ownership
Finance lease transactions that do not transfer ownership and whose start date is March 31, 2008 or earlier are recorded according to the
accounting treatment similar to that used for ordinary lease transactions. However, the description is omitted since their importance is
minimal.
2. Operating lease transactions
Future minimum lease payment relating to non-cancelable operating lease transactions
(Lessor)
(Thousands of yen)
Fiscal 2013(As of March 31, 2014)
Fiscal 2014(As of March 31, 2015)
Less than one year ¥ 252,512 ¥ 1,849,418
One year or longer 767,703 8,943,525
Total ¥ 1,020,215 ¥ 10,792,944
Financial Instruments
Fiscal 2013 (April 1, 2013 to March 31, 2014)
1. Overview of financial instruments
(1) Policy on the handling of financial instruments
The Group limits its fund management activities to short-term deposits, etc., and raises funds through borrowings from financial
institutions and the issuance of bonds. The Group adheres to a policy under which derivatives are used only to hedge the fluctuation
risk of interest payable for some long-term debt, but not for speculative purposes.
(2) Details of financial instruments and risks and risk management
As trade notes and accounts receivable, which are operating receivables, are exposed to customer credit risks, the Group manages
account due dates by customer. Meanwhile, in the building lease business, its mainstay business, the Group receives the rent for the
following month in advance by the end of the preceding month from most of its customers, due to the nature of the business. It also
receives lease and guarantee deposits equivalent to a few months’ rent from its customers. Trade notes and accounts receivable, which
are operating receivables, are secured to this extent.
Investment securities consist mainly of listed stocks, which are exposed to the risk of market price fluctuation. These are stocks of
companies with which the Group has business relations, and the Board Meeting periodically receives a report on the fair value of
these stocks.
Trade accounts payable, which are operating debt, are all due within one year.
The Group issues bonds to raise funds mainly used for capital expenditure, and their maturity periods are five and seven years.
The Group raises funds through short-term borrowings mainly to use for business transactions and funds through long-term debt
(repayment periods range from five to 15 years) mainly to finance capital expenditure. In principle, the long-term debt has fixed interest
rates. However, as some long-term debt with variable interest rates is exposed to interest rate fluctuation risk, the Group uses a
derivative transaction (interest rate swap transaction) for each contract to hedge the fluctuation risk of interest payable for such long-
term debt. The assessment of the hedge effectiveness is omitted because the interest rate swap contracts fulfill the requirements for
the special accounting method. In using derivative transactions, the Group executes derivative transactions after obtaining approval
from the Board Meeting for each transaction in accordance with the internal approval procedures. In addition, it enters into derivative
contracts only with financial institutions in Japan with high credit ratings to mitigate possible credit risk.
(3) Supplementary explanation about the fair value, etc. of financial instruments
The contract amount, etc., of derivative transactions described in Notes to Derivative Transactions does not refer to market risk relating
to derivative transactions.
2. Fair value, etc., of financial instruments
Carrying amount recorded on the consolidated balance sheets, fair value, and their difference as of March 31, 2014 are as follows.
Financial instruments whose fair value is difficult to assess are not included in the following table. (Refer to Note 2.)
(Thousands of yen)
Carrying amount Fair value Difference
(1) Cash and cash equivalents ¥ 12,283,068 ¥ 12,283,068 ¥ —
(2) Notes and accounts receivable—trade 420,061 420,061 —
(3) Investment securities
Available-for-sale securities 9,207,339 9,207,339 —
Total assets ¥ 21,910,469 ¥ 21,910,469 ¥ —
(4) Accounts payable—trade ¥ 168,428 ¥ 168,428 ¥ —
(5) Short-term borrowings 2,500,000 2,500,000 —
(6) Bonds 22,000,000 22,077,975 77,975
(7) Long-term debt (including the current portion) 31,869,830 31,904,269 34,439
Total liabilities ¥ 56,538,258 ¥ 56,650,672 ¥ 112,414
(8) Derivatives transactions ¥ — ¥ — ¥ —
30 Keihanshin Building Co., Ltd. 31Keihanshin Building Co., Ltd.
Notes to Consolidated Financial Statements

(Notes)
1. Method for calculating the fair value of financial instruments and information about securities and derivative transactions
(1) Cash and cash equivalents, and (2) Notes and accounts receivable—trade
Cash and cash equivalents and trade notes and accounts receivable are recorded at the carrying amount because the fair value
approximates the carrying amount, since they are settled within a short period.
(3) Investment securities
The relevant market price is used to determine the fair value of these securities, and the share price on the financial instruments
exchange is used to determine the fair value of stocks. Regarding difference between the carrying amount and the acquisition cost of
other securities, please refer to Notes to Consolidated Financial Statements, etc. (Securities).
(4) Accounts payable—trade and (5) Short-term borrowings
Trade accounts payable and short-term borrowings are recorded at the carrying amount because the fair value approximates the
carrying amount, since they are settled within a short period.
(6) Bonds and (7) Long-term debt (including the current portion)
The fair value of bonds and long-term debt is calculated by discounting the sum of principal and interest using the estimated interest
rates payable for a new bond issue and new borrowing, respectively.
The fair value of long-term debt with variable interest rates is calculated by discounting the sum of principal and interest, which are
accounted for together with the interest rate swap, using interest rates reasonably estimated and possibly available for similar
borrowings, since long-term debt with variable interest rates are subject to the special accounting method.
(8) Derivatives transactions
Please refer to Notes to Derivative Transactions.
2. Financial instruments whose fair value is difficult to assess
Unlisted stocks (carrying amount ¥243,091 thousand) are not included in (3) Investment securities because it is difficult to assess their fair
value, since market prices are not available, and it is impossible to estimate the future cash flows.
The Group finds it is difficult to assess the fair value of lease deposits, which are operating receivables (carrying amount ¥2,272,727
thousand), and lease deposits from tenants, which are operating debt (carrying amount ¥6,134,248 thousand), because neither the
collection date nor the repayment date are fixed, and it is impossible to estimate the future cash flows.
3. Scheduled redemption amount of monetary claims after the consolidated settlement date
(Thousands of yen)
Less than one yearOne year to less than
five yearsFive years to less
than 10 years10 years or longer
Cash and cash equivalents ¥ 12,283,068 ¥ — ¥ — ¥ —
Notes and accounts receivable—trade ¥ 420,061 ¥ — ¥ — ¥ —
4. Scheduled repayment amount of bonds, long-term debt and other interest-bearing debt after the consolidated settlement date
(Thousands of yen)
Less than one year
One year to less than two years
Two years to less than three years
Three years to less than four years
Four years to less than five years
Five years or longer
Bonds ¥ — ¥ — ¥ 7,000,000 ¥ 5,000,000 ¥ 5,000,000 ¥ 5,000,000
Long-term debt 24,437,890 2,201,240 1,291,100 945,600 761,500 2,232,500
Other interest-bearing debt
Long-term accounts payable—other 84,540 84,540 84,540 84,540 42,300 —
Total ¥ 24,522,430 ¥ 2,285,780 ¥ 8,375,640 ¥ 6,030,140 ¥ 5,803,800 ¥ 7,232,500
Fiscal 2014 (April 1, 2014 to March 31, 2015)
1. Overview of financial instruments
(1) Policy on the handling of financial instruments
The Group limits its fund management activities to short-term deposits, etc., and raises funds through borrowings from financial
institutions and the issuance of bonds. The Group adheres to a policy under which derivatives are used only to hedge the fluctuation
risk of interest payable for some long-term debt, but not for speculative purposes.
(2) Details of financial instruments and risks and risk management
As trade notes and accounts receivable, which are operating receivables, are exposed to customer credit risks, the Group manages
account due dates by customer. Meanwhile, in the building lease business, its mainstay business, the Group receives the rent for the
following month in advance by the end of the preceding month from most of its customers, due to the nature of the business. It also
receives lease and guarantee deposits equivalent to a few months’ rent from its customers. Trade notes and accounts receivable, which
are operating receivables, are secured to this extent.
Investment securities consist mainly of listed stocks, which are exposed to the risk of market price fluctuation. These are stocks of
companies with which the Group has business relations, and the Board Meeting periodically receives a report on the fair value of
these stocks.
Trade accounts payable, which are operating debt, are all due within one year.
The Group issues bonds to raise funds mainly used for capital expenditure, and their maturity periods are five and seven years.
The Group raises funds through short-term borrowings mainly to use for business transactions and funds through long-term debt
(repayment periods range from five to 15 years) mainly to finance capital expenditure. In principle, the long-term debt has fixed
interest rates.
2. Fair value, etc. of financial instruments
Carrying amount recorded on the consolidated balance sheets, fair value, and their difference as of March 31, 2015 are as follows.
Financial instruments whose fair value is difficult to assess are not included in the following table. (Refer to Note 2.)
(Thousands of yen)
Carrying amount Fair value Difference
(1) Cash and cash equivalents ¥ 3,576,600 ¥ 3,576,600 ¥ —
(2) Notes and accounts receivable—trade 281,973 281,973 —
(3) Investment securities
Available-for-sale securities 11,563,048 11,563,048 —
Total assets ¥ 15,421,622 ¥ 15,421,622 ¥ —
(4) Accounts payable—trade ¥ 11,375 ¥ 11,375 ¥ —
(5) Short-term borrowings 11,500,000 11,500,000 —
(6) Bonds 22,000,000 22,302,842 302,842
(7) Long-term debt (including the current portion) 17,490,490 17,596,094 105,604
Total liabilities ¥ 51,001,865 ¥ 51,410,312 ¥ 408,446
(Notes)
1. Method for calculating the fair value of financial instruments and information about securities
(1) Cash and cash equivalents, and (2) Notes and accounts receivable—trade
Cash and cash equivalents and trade notes and accounts receivable are recorded at the carrying amount because the fair value
approximates the carrying amount, since they are settled within a short period.
(3) Investment securities
The relevant market price is used to determine the fair value of these securities, and the share price on the financial instruments
exchange is used to determine the fair value of stocks. Regarding difference between the carrying amount and the acquisition cost of
other securities, please refer to Notes to Consolidated Financial Statements, etc. (Securities).
(4) Accounts payable—trade and (5) Short-term borrowings
Trade accounts payable and short-term borrowings are recorded at the carrying amount because the fair value approximates the
carrying amount, since they are settled within a short period.
32 Keihanshin Building Co., Ltd. 33Keihanshin Building Co., Ltd.
Notes to Consolidated Financial Statements

(6) Bonds and (7) Long-term debt (including the current portion)
The fair value of bonds and long-term debt is calculated by discounting the sum of principal and interest using estimated interest rates
payable for a new bond issue and new borrowing, respectively.
2. Financial instruments whose fair value is difficult to assess
Unlisted stocks (carrying amount ¥243,091 thousand) are not included in (3) Investment securities because it is difficult to assess their fair
value, since no market prices are available, and it is impossible to estimate the future cash flows.
The Group finds it is difficult to assess the fair value of lease deposits, which are operating receivables (carrying amount ¥2,180,077
thousand), and lease deposits from tenants, which are operating debt (carrying amount ¥6,483,013 thousand), because neither the
collection date nor the repayment date are fixed, and it is impossible to estimate the future cash flows.
3 Scheduled redemption amount of monetary claims after the consolidated settlement date(Thousands of yen)
Less than one yearOne year to less than
five yearsFive years to less
than 10 years10 years or longer
Cash and cash equivalents ¥ 3,576,600 ¥ — ¥ — ¥ —
Notes and accounts receivable—trade ¥ 281,973 ¥ — ¥ — ¥ —
4. Scheduled repayment amount of bonds, long-term debt and other interest-bearing debt after the consolidated settlement date
(Thousands of yen)
Less than one year
One year to less than two years
Two years to less than three years
Three years to less than four years
Four years to less than five years
Five years or longer
Bonds ¥ — ¥ 7,000,000 ¥ 5,000,000 ¥ 5,000,000 ¥ 5,000,000 ¥ —
Long-term debt 3,884,140 3,048,000 2,687,500 2,518,400 1,820,900 3,531,550
Other interest-bearing debt
Long-term accounts payable—other 84,540 84,540 84,540 42,300 — —
Total ¥ 3,968,680 ¥ 10,132,540 ¥ 7,772,040 ¥ 7,560,700 ¥ 6,820,900 ¥ 3,531,550
Securities
Fiscal 2013 (April 1, 2013 to March 31, 2014)
1. Securities with fair value
(Thousands of yen)
Available-for-sale securities Carrying amount Acquisition cost Difference
Carrying amount exceed acquisition cost
Equity ¥ 8,626,114 ¥ 3,875,878 ¥ 4,750,236
Subtotal ¥ 8,626,114 ¥ 3,875,878 ¥ 4,750,236
Carrying amount does not exceed acquisition cost
Equity ¥ 581,224 ¥ 707,640 ¥ (126,415)
Subtotal ¥ 581,224 ¥ 707,640 ¥ (126,415)
Total ¥ 9,207,339 ¥ 4,583,518 ¥ 4,623,820
2. Available-for-sale securities sold during fiscal 2013 (April 1, 2013 to March 31, 2014)
(Thousands of yen)
Classification Sale amount Gain on sale Loss on sale
Equity ¥ 24,503 ¥ 13,118 ¥ —
Debenture — — —
Other — — —
Total ¥ 24,503 ¥ 13,118 ¥ —
3. Securities written down during fiscal 2013 (April 1, 2013 to March 31, 2014)
In fiscal 2013, the Group did not write down any securities.
Meanwhile, in accordance with the internal rules, the Group writes down securities when their fair value declines more than 30% below
their acquisition cost. In addition, it writes down securities with no fair value to the extent deemed necessary when their real price declines
more than 30% below their acquisition cost.
Fiscal 2014 (April 1, 2014 to March 31, 2015)
1. Securities with fair value
(Thousands of yen)
Available-for-sale securities Carrying amount Acquisition cost Difference
Carrying amount exceed acquisition cost
Equity ¥ 11,292,708 ¥ 4,271,273 ¥ 7,021,435
Subtotal ¥ 11,292,708 ¥ 4,271,273 ¥ 7,021,435
Carrying amount does not exceed acquisition cost
Equity ¥ 270,340 ¥ 312,245 ¥ (41,905)
Subtotal ¥ 270,340 ¥ 312,245 ¥ (41,905)
Total ¥ 11,563,048 ¥ 4,583,518 ¥ 6,979,529
2. Available-for-sale securities sold during fiscal 2014 (April 1, 2014 to March 31, 2015)
Not applicable
3. Securities written down during fiscal 2014 (April 1, 2014 to March 31, 2015)
In fiscal 2014, the Group did not write down any securities.
Meanwhile, in accordance with the internal rules, the Group writes down securities when their fair value declines more than 30% below
their acquisition cost. In addition, it writes down securities with no fair value to the extent deemed necessary when their real price declines
more than 30% below their acquisition cost.
Derivative Transactions
Fiscal 2013 (April 1, 2013 to March 31, 2014)
Hedge accounting is applied to all derivative transactions.
Derivative transactions to which hedge accounting is applied are as follows:
(Thousands of yen)
Method of hedge accounting
Type, etc. of derivative transaction
Main hedged itemsContract amount, etc.
Fair valueOne year or longer
Special accounting of interest rate swap
Interest rate swap transactionsFixed rate of interest payable and variable rate of interest
receivable
Long-term debt ¥ 20,700,000 ¥ — (Note)
(Note) As interest rate swaps subject to the special accounting method are accounted for together with long-term debt, which are hedged
items, their fair value is included in long-term debt.
Fiscal 2014 (April 1, 2014 to March 31, 2015)
Not applicable
34 Keihanshin Building Co., Ltd. 35Keihanshin Building Co., Ltd.
Notes to Consolidated Financial Statements

Retirement Benefits
Fiscal 2013 (April 1, 2013 to March 31, 2014)
1. Summary of retirement benefit plan
The Company has adopted a defined benefit corporate pension plan.
Meanwhile, the Company has also prepared a retirement lump-sum payment plan, under which it pays designated retirement allowance
to retired persons and persons with two years or longer of service who retire before the retirement age.
Under the Company’s defined benefit corporate pension plan and retirement lump-sum payment plan, retirement benefit obligations and
retirement benefit expenses are calculated using the simplified method.
2. Defined benefit plan
(1) Reconciliation of net defined benefit liability at the beginning of the current fiscal period and at the end of the current fiscal period under
the system using the simplified method
(Thousands of yen)
Net defined benefit liability at beginning of current period ¥ 51,534
Retirement benefit expenses 9,566
Retirement benefit payment (120)
Contribution to the plan (4,189)
Net defined benefit liability at end of current period ¥ 56,792
(2) Reconciliation of balance of retirement benefit obligations and pension assets at the end of the current period and net defined liability
and net defined benefit asset on the consolidated balance sheets
(Thousands of yen)
Retirement benefit obligation under accumulation plan ¥ 110,314
Pension assets (53,522)
¥ 56,792
Retirement benefit obligation under non-accumulation plan —
Net defined liability (asset) on consolidated balance sheet ¥ 56,792
Net defined benefit liability 56,792
Net defined liability (asset) on consolidated balance sheet ¥ 56,792
(3) Retirement benefit cost
(Thousands of yen)
Retirement benefit expenses calculated using the simplified method ¥ 9,566
Fiscal 2014 (April 1, 2014 to March 31, 2015)
1. Summary of retirement benefit plan
The Company has adopted a defined benefit corporate pension plan.
Meanwhile, the Company has also prepared a retirement lump-sum payment plan, under which it pays designated retirement allowance
to retired persons and persons with two years or longer of service who retire before the retirement age.
Under the Company’s defined benefit corporate pension plan and retirement lump-sum payment plan, retirement benefit obligations and
retirement benefit expenses are calculated using the simplified method.
2. Defined benefit plan
(1) Reconciliation of net defined benefit liability at the beginning of the current fiscal period and at the end of the current fiscal period under
the system using the simplified method
(Thousands of yen)
Net defined benefit liability at beginning of current period ¥ 56,792
Retirement benefit expenses 16,506
Retirement benefit payment (7,831)
Contribution to the plan (4,549)
Net defined benefit liability at end of current period ¥ 60,918
(2) Reconciliation of balance of retirement benefit obligations and pension assets at the end of the current period and net defined liability
and net defined benefit asset on the consolidated balance sheets
(Thousands of yen)
Retirement benefit obligation under accumulation plan ¥ 119,865
Pension assets (58,946)
¥ 60,918
Retirement benefit obligation under non-accumulation plan —
Net defined liability (asset) on consolidated balance sheet ¥ 60,918
Net defined benefit liability 60,918
Net defined liability (asset) on consolidated balance sheet ¥ 60,918
(3) Retirement benefit cost
(Thousands of yen)
Retirement benefit expenses calculated using the simplified method ¥ 16,506
Stock Options, etc.
Not applicable
36 Keihanshin Building Co., Ltd. 37Keihanshin Building Co., Ltd.
Notes to Consolidated Financial Statements

Tax Effect Accounting
1. Details of deferred tax assets and liabilities by major causes
(Thousands of yen)
Fiscal 2013(As of March 31, 2014)
Fiscal 2014(As of March 31, 2015)
(Deferred tax assets)
Depreciation ¥ 35,380 ¥ 29,523
Impairment loss (buildings and structures) 254,115 190,262
Impairment loss (long-term prepaid expenses) 613,577 561,110
Net defined benefit liability 20,218 19,615
Provision for directors’ retirement benefits 60,902 58,689
Loss on valuation of investment securities 29,149 2,186
Enterprise taxes payable 33,172 89,968
Golf club membership 24,633 22,280
Other 20,373 20,446
Subtotal deferred tax assets ¥ 1,091,523 ¥ 994,082
Valuation allowance (53,783) (24,467)
Total deferred tax assets ¥ 1,037,740 ¥ 969,615
(Deferred tax liabilities)
Reserve for advanced depreciation of fixed assets ¥ (65,386) ¥ (59,141)
Unrealized gains on securities (1,620,240) (2,223,385)
Total deferred tax liabilities (1,685,627) (2,282,527)
Net deferred tax liabilities (647,886) (1,312,912)
(Deferred tax assets for land revaluation)
Land revaluation reserve 1,714,045 2,468,325
Valuation allowance (1,373,840) (2,392,387)
Total deferred tax assets for land revaluation ¥ 340,204 ¥ 75,937
(Deferred tax liabilities for land revaluation)
Land revaluation reserve ¥ (1,412,996) ¥ (1,278,047)
Total deferred tax liabilities for land revaluation (1,412,996) (1,278,047)
Net deferred tax liabilities for land revaluation (1,072,791) (1,202,109)
(Note) Net deferred tax assets or net deferred tax liabilities for fiscal 2013 and fiscal 2014 are included in the following items in the
consolidated balance sheets.
(Thousands of yen)
Fiscal 2013(As of March 31, 2014)
Fiscal 2014(As of March 31, 2015)
Current assets—Deferred tax assets ¥ 43,560 ¥ 100,357
Fixed assets—Deferred tax assets ¥ 9,286 ¥ 9,286
Long-term liabilities—Deferred tax liabilities ¥ (700,734) ¥ (1,422,556)
2. Details of main items that caused the difference between the statutory effective tax rate and the corporate tax rate after
applying tax effect accounting
(Thousands of yen)
Fiscal 2013(As of March 31, 2014)
Fiscal 2014(As of March 31, 2015)
Statutory effective tax rate
(Adjustments) — 35.6%
Entertainment expenses and other items that are permanently non-deductible — 0.3%
Dividends and other items that are permanently non-taxable — (0.6)%
Directors’ bonuses — 0.3%
Per capita inhabitants tax — 0.1%
Reduction of deferred tax assets and deferred tax liabilities at the end of the period due to the tax rate change — 2.1%
Other — (0.1)%
Corporate tax rate after tax effect accounting — 37.7%
(Note) Since the difference between the statutory effective tax rate and the corporate tax rate after applying tax effect accounting was less
than 5/100th of the statutory effective tax rate in fiscal 2013, notes were omitted.
3. Recalculation of deferred tax assets and deferred tax liabilities due to a change in income tax rates
Following the promulgation of the Act for Partial Amendment of the Income Tax Act and Act on Partial Revision of the Local Tax Act on
March 31, 2015, the statutory effective tax rate used to calculate deferred tax assets and deferred tax liabilities for the current consolidated
fiscal period (provided that it is limited to those to be settled in the consolidated fiscal period starting on April 1, 2015) has been changed
from the previous consolidated fiscal period’s rate of 35.6% to 33.0% for those which are anticipated to be collected or paid during the
period between April 1, 2015 to March 31, 2016 and 32.2% for those which are anticipated to be collected or paid on and after April 1,
2016.
Accordingly, deferred tax liabilities (after deducting deferred tax assets) and deferred tax liabilities for land revaluation (after deducting
deferred tax assets for land revaluation) decreased by ¥142,656 thousand and ¥126,930 thousand, respectively, while deferred income
taxes, valuation difference on available-for-sale securities, and revaluation reserve for land increased by ¥92,111 thousand, ¥234,767
thousand, and ¥126,930 thousand, respectively.
Business Combination
Not applicable.
Asset Retirement Obligations
1. Asset retirement obligations recorded on the consolidated balance sheets are as follows:
In fiscal 2013, the Company posted asset retirement obligations of \24,700 thousand in relation to its obligation to restore the business
facilities site in Koriyama City to its original condition due to the cancellation of the real estate rental contract. Since the Company
completed the retirement of the said assets in fiscal 2014, it reversed all asset retirement obligations.
2. Asset retirement obligations for those other than recorded on the consolidated balance sheets
The Group assumes liabilities to restore the site to its original condition at the time of evacuation as provided in the real estate lease
contract for the leased land. However, it is impossible to make a reasonable estimate on asset retirement obligations, since the use period
of the leased assets related to the said liabilities is not clear and the Group does not currently have any plans to evacuate in the future.
Consequently, the Group does not recognize asset retirement obligations to match the said liabilities.
38 Keihanshin Building Co., Ltd. 39Keihanshin Building Co., Ltd.
Notes to Consolidated Financial Statements

Real Estate for Lease
Fiscal 2013 (April 1, 2013 to March 31, 2014)
The Group owns office buildings and datacenter buildings for lease in Osaka and other regions. In fiscal 2013, it earned ¥6,079,483
thousand in the building lease business (rent revenue is recorded as revenue from operations, while rent expenses are recorded as cost of
revenue from operations).
The carrying amount of real estate for lease, major changes during fiscal 2013, fair value on the consolidated settlement date, and the
method for calculating the fair value is as follows:
(Thousands of yen)
Carrying amount Fair value on the consolidated settlement
dateBalance at beginning of
current fiscal periodChanges during period
Balance at end of current fiscal period
¥ 92,791,504 ¥ (3,001,484) ¥ 89,790,020 ¥ 133,333,000
(Notes) 1. The carrying amount represents the amount that is gained after deducting accumulated depreciation from the acquisition cost.
2. Property and equipment relating to the head office of the Company are not included in the above table.
3. Among changes in the carrying amount during fiscal 2013, the main factors for the increase include the acquisition of facilities
(¥439,756 thousand), and the main factors for the decrease include depreciation (¥2,557,870 thousand) and sale of facilities
(¥865,384 thousand).
4. The fair value on the consolidated settlement date is calculated by an external real estate appraiser mainly based on the real
estate appraisal standards.
Fiscal 2014 (April 1, 2014 to March 31, 2015)
The Group owns office buildings and datacenter buildings for lease in Osaka and other regions. In fiscal 2014, it earned ¥6,736,695
thousand in the building lease business (rent revenue is recorded as revenue from operations, while rent expenses are recorded as cost of
revenue from operations).
The carrying amount of real estate for lease, major changes during fiscal 2014, fair value on the consolidated settlement date, and the
method for calculating the fair value is as follows:
(Thousands of yen)
Carrying amount Fair value on the consolidated settlement
dateBalance at beginning of
current fiscal periodChanges during period
Balance at end of current fiscal period
¥ 89,790,020 ¥ 6,777,149 ¥ 96,567,169 ¥ 144,269,000
(Notes) 1. The carrying amount represents an amount that is gained after deducting accumulated depreciation from the acquisition cost.
2. Property and equipment relating to the head office of the Company are not included in the above table.
3. Among changes in the carrying amount during fiscal 2014, the main factors for the increase include the acquisition of facilities
(¥9,536,972 thousand), and the main factors for the decrease include depreciation (¥2,685,314 thousand).
4. The fair value on the consolidated settlement date is calculated by an external real estate appraiser mainly based on the real
estate appraisal standards.
Segment Information, etc.
(Segment Information)
1. Summary of reportable segments
Keihanshin Building’s reportable segments are components of the Company for which separate financial information is available. These
segments are subject to regular reviews by the Board of Directors to decide the distribution of managerial resources and evaluate
business results.
Since the Company is mainly engaged in the building lease business, it owns real estate for lease in Osaka Prefecture and other regions.
Therefore, the Company’s reportable segment is the Building Lease Business.
The Building Lease Business primarily consists of leasing of land and buildings, maintenance and management of buildings and
machinery, and janitorial services.
2. Methods to calculate the amount of revenue from operations, profit or loss, assets, liabilities, and other items by reportable segment
Methods of accounting treatment of reported business segments are almost the same as those stated in Significant Items for the
Preparation of Consolidated Financial Statements.
Incomes by reportable segment are calculated based on operating income.
3. Information on the amount of revenue from operations, profit or loss, assets, liabilities, and other items by reportable segment
Fiscal 2013 (April 1, 2013 to March 31, 2014)
(Thousands of yen)
Reportable segment Other
(Note 1)Total
Adjustment(Note 2)
Amounts posted in the consolidated
statements of income(Note 3)
Building lease
Revenue from operations
Revenue from operations to outside customers ¥ 13,600,774 ¥ 430,323 ¥ 14,031,098 ¥ — ¥ 14,031,098
Inter-segment sales or transfer — — — — —
Total ¥ 13,600,774 ¥ 430,323 ¥ 14,031,098 ¥ — ¥ 14,031,098
Segment income ¥ 4,893,334 ¥ 35,614 ¥ 4,928,948 ¥ (465,322) ¥ 4,463,625
Segment assets ¥ 92,918,718 ¥ 182,576 ¥ 93,101,295 ¥ 21,914,344 ¥ 115,015,640
Other items
Depreciation and amortization ¥ 2,594,838 ¥ 773 ¥ 2,595,612 ¥ 16,789 ¥ 2,612,401
Impairment loss ¥ 32,356 ¥ — ¥ 32,356 ¥ — ¥ 32,356
Increase in property and equipment and intangible assets ¥ 451,880 ¥ 531 ¥ 452,412 ¥ 19,594 ¥ 472,007
(Notes) 1. The “Other” segment is not included in the reportable segments and includes the Construction Contracting Business.
2. Adjustments of ¥(465,322) thousand for segment income are corporate expenses that are not allocated to any reportable
segment. Corporate expenses mainly refer to general and administrative expenses that are not attributable to any reportable
segment. Adjustments of ¥21,914,344 thousand for segment assets are corporate assets that are not allocated to any
reportable segment. Corporate assets mainly consist of surplus funds (deposits), long-term investment funds (investment
securities), and assets of the Administration Division.
3. Segment income is adjusted operating income stated in the consolidated statements of income.
40 Keihanshin Building Co., Ltd. 41Keihanshin Building Co., Ltd.
Notes to Consolidated Financial Statements

Fiscal 2014 (April 1, 2014 to March 31, 2015)
(Thousands of yen)
Reportable segment Other
(Note 1)Total
Adjustment(Note 2)
Amounts posted in the consolidated
statements of income(Note 3)
Building lease
Revenue from operations
Revenue from operations to outside customers ¥ 14,571,744 ¥ 280,953 ¥ 14,852,697 ¥ — ¥ 14,852,697
Inter-segment sales or transfer — — — — —
Total ¥ 14,571,744 ¥ 280,953 ¥ 14,852,697 ¥ — ¥ 14,852,697
Segment income ¥ 5,451,228 ¥ 6,084 ¥ 5,457,313 ¥ (490,519) ¥ 4,966,794
Segment assets ¥ 99,644,905 ¥ 12,505 ¥ 99,657,410 ¥ 15,585,756 ¥ 115,243,167
Other items
Depreciation and amortization ¥ 2,721,683 ¥ 688 ¥ 2,722,372 ¥ 16,179 ¥ 2,738,551
Increase in property and equipment and intangible assets ¥ 9,557,020 ¥ 819 ¥ 9,557,839 ¥ 14,717 ¥ 9,572,557
(Notes) 1. The “Other” segment is not included in the reportable segments and includes the Construction Contracting Business.
2. Adjustments of ¥(490,519) thousand for segment income are corporate expenses that are not allocated to any reportable
segment. Corporate expenses mainly refer to general and administrative expenses that are not attributable to any reportable
segment. Adjustments of ¥15,585,756 thousand for segment assets are corporate assets that are not allocated to any
reportable segment. Corporate assets mainly consist of surplus funds (deposits), long-term investment funds (investment
securities), and assets of the Administration Division.
3. Segment income is adjusted operating income stated in the consolidated statements of income.
(Related Information)
Fiscal 2013 (April 1, 2013 to March 31, 2014)
1. Information by product and service
The description is omitted since the same information is disclosed as segment information.
2. Information by area
(1) Revenue from operations
There is no applicable information because the Company only has customers and sales in Japan.
(2) Property and equipment
There is no applicable information because the Company only has property and equipment in Japan.
3. Information by major customer
(Thousands of yen)
Name of customerRevenue from
operationsRelated segment
Japan Racing Association ¥ 3,587,197 Building lease business
SoftBank Mobile Corp. ¥ 1,652,029 Building lease business
Kansai Urban Banking Corporation ¥ 1,697,992 Building lease business
Fiscal 2014 (April 1, 2014 to March 31, 2015)
1. Information by product and service
The description is omitted since the same information is disclosed as segment information.
2. Information by area
(1) Revenue from operations
There is no applicable information because the Company only has customers and sales in Japan.
(2) Property and equipment
There is no applicable information because the Company only has property and equipment in Japan.
3. Information by major customer
(Thousands of yen)
Name of customerRevenue from
operationsRelated segment
Japan Racing Association ¥ 3,557,094 Building lease business
SoftBank Mobile Corp. ¥ 1,764,919 Building lease business
Kansai Urban Banking Corporation ¥ 1,652,029 Building lease business
(Information on Impairment Loss for Fixed Assets by Reportable Segment)
Fiscal 2013 (April 1, 2013 to March 31, 2014)
The description is omitted because the same information is disclosed as segment information.
Fiscal 2014 (April 1, 2014 to March 31, 2015)
Not applicable
(Information on Amortization of Goodwill and Balance of Unamortized Goodwill by Reportable Segment)
Not applicable
(Information on Gain on Negative Goodwill by Reportable Segment)
Not applicable
(Information on Related Parties)
Not applicable
42 Keihanshin Building Co., Ltd. 43Keihanshin Building Co., Ltd.
Notes to Consolidated Financial Statements

Per Share Information
The basis for the calculation of net assets per share and net income per share is as follows. Information on net income per share after full
dilution is omitted because there is no potential common stock.
ItemFiscal 2013
(As of March 31, 2014)Fiscal 2014
(As of March 31, 2015)
(1) Net assets per share (yen) ¥ 893.93 ¥ 960.64
(Basis for calculation)
Total net assets in the consolidated balance sheets (thousands of yen) ¥ 48,250,187 ¥ 51,850,515
Net assets attributable to common stock (thousands of yen) ¥ 48,250,187 ¥ 51,850,515
Number of shares of common stock issued and outstanding (thousand shares) 53,998 53,998
Number of shares of treasury stock 23 23
Number of shares of common stock used to calculate net assets per share (thousand shares) 53,975 53,975
ItemFiscal 2013
(April 1, 2013 to March 31, 2014)Fiscal 2014
(April 1, 2014 to March 31, 2015)
(2) Net income per share (yen) ¥ 46.08 ¥ 50.63
(Basis for calculation)
Net income in the consolidated statements of income (thousands of yen) ¥ 2,369,458 ¥ 2,732,830
Net income attributable to common stock (thousands of yen) ¥ 2,369,458 ¥ 2,732,830
Average number of shares of common stock during the period (thousand shares) 51,416 53,975
Significant Subsequent Events
In accordance with a resolution by the Board of Directors on May 8, 2015, the Company issued an unsecured straight bond as follows.
The 5th unsecured straight bond (10-year bond)
Total amount ¥5,000 million
Coupon rate 0.865% per annum
Paid amount ¥100 per face value of ¥100
Last payment date June 4, 2015
Redemption date June 4, 2025
Method of redemption Bullet redemption at maturity
Coupon date June 4 and December 4, each year
Fund utilization Repayment of loans payable
44 Keihanshin Building Co., Ltd. 45Keihanshin Building Co., Ltd.
Independent Auditor’s ReportNotes to Consolidated Financial Statements

Foreign investors(13.9%)
Individuals/Others(18.3%)
Financial institutions(29.1%)
Securities companies(0.9%)
Other institutions(37.8%)
1,000 or more(35.2%)
500 or more(16.1%)
Less than 1(1.5%)
1 or more(5.8%)
100 or more(28.5%)
10 or more(6.3%)
50 or more(3.5%)
5 or more(3.1%)
By Type of Shareholder
By Number of Shares Owned (Thousands)
Company Name Keihanshin Building Co., Ltd.
Address Head Office2-14 Kawaramachi 4-chome, Chuo-ku, Osaka-City 541-0048, JapanTel: +81-6-6202-7331 Fax: +81-6-6202-7329
Tokyo Office2-2 Kanda-Jimbocho, Chiyoda-ku, Tokyo 101-0051, JapanTel: +81-3-5212-8311 Fax: +81-3-3556-6611
URL http://www.keihanshin.co.jp/english/
Founded December 24, 1948
Business Lines •Lease of office buildings, datacenter buildings, commercial buildings and logistics warehouses and off-track betting parlors (WINS).
•Buildingmaintenance•Subcontracting construction work for lease facilities
Capital ¥9,827 million
Number of Employees 39 (as of March 31, 2015)
Directors and Corporate Auditors
ChairmanPresidentSenior Managing DirectorDirectorDirectorDirectorDirectorDirectorAudit & Supervisory Board Member (Standing)Audit & Supervisory Board MemberAudit & Supervisory Board Member
Takeharu NagataKenjiro NakanoYasutaka InoueShinji YamamotoMasumi SaitoMasakazu TaniguchiShigeru NishidaJyunichi YatsuoKenji KounoTomoyuki NishideHiromichi Miyauchi
(as of June 19, 2015)
Corporate Data
Fiscal Year From April 1 to March 31 of the following year
Annual General Meeting of Shareholders
Latter part of June of each year
Record Date for Divident Payment
Year-end dividend: March 31Interim dividend: September 30Other publicly announced date, if any
Trading Unit 100 shares
Stock Transfer Agent Sumitomo Mitsui Trust Bank, Limited4-1, Marunouchi 1-chome, Chiyoda-ku, Tokyo
Agent’s Office Sumitomo Mitsui Trust Bank, Limited. Stock Transfer Agency Dept.5-33, Kitahama 4-chome, Chuo-ku, Osaka
Stock Listing First section of the Tokyo Stock Exchange
Information for Shareholders
Number of common stock authorized to issue 80,000,000 shares
Number of common stock issued and outstanding 53,998,798 shares
Number of shareholders 6,950
Stock Data (as of March 31, 2015) Breakdown of Shareholders (as of March 31, 2015)
NameNumber of shares
owned (thousand)
Stockholdingratio (%)
GINSEN Co., Ltd. 6,440 11.9
Japan Trustee Services Bank, Ltd.(trust account) 3,303 6.1
Sumitomo Mitsui Banking Corporation 2,133 4.0
Daikin Industries, Ltd. 1,568 2.9
Kanehide Yoneyama 1,500 2.8
KINDEN CORPORATION 1,393 2.6
KAJIMA CORPORATION 1,376 2.5
The Mie Bank, Ltd. 1,287 2.4
The Hyakujushi Bank, Ltd. 891 1.7
The Ashikaga Bank, Ltd. 862 1.6
(Note) The Company holds 23,797 shares of treasury stock. The stockholding ratio is calculated by subtracting treasury stock.
Major Shareholders (as of March 31, 2015)
HistoryOur company was founded in 1948, soon after the end of World War II, for the purpose of constructing the Hanshin Racetrack for the development
of horse racing, backed by the strong desire of major horse owners in the Kansai area and the local business community for the revival of a horse
racing track in the Hanshin area, a plan that was also supported by the Ministry of Agriculture and Forestry (now the Ministry of Agriculture, Forestry
and Fisheries). The Company, therefore, was named Keihanshin Horse Racing Co., Ltd. when it was first incorporated. After many difficulties, Hanshin
Racetrack was completed in Nigawa, Takarazuka City, Hyogo Prefecture in 1949. It was first leased to the Ministry of Agriculture and Forestry, but
later was transferred to the newly established Japan Racing Association in 1955.
We took this opportunity to change our corporate name to Keihanshin Real Estate Co., Ltd., and entered the business of general real estate. In
addition to the leasing of off-track betting parlors (WINS), which had been one of our core businesses since our incorporation, we launched the office
building leasing business in 1962 by constructing our first office building, the Kawaramachi Building on Midosuji street in Chuo-ku, Osaka.
Today, we are developing by concentrating management resources on the business of leasing commercial space. Therefore, to clarify our future
direction, changed our corporate name to Keihanshin Building on October 1, 2011.
History of the Company History of business development
1948 Keihanshin Horse Racing Co., Ltd. was founded.
1949 Listed on the Osaka Securities Exchange.
The Hanshin Racetrack (located in Takarazuka City, Hyogo Pref.) completed.
WINS WINS Umeda B Building and WINS Namba completed in Kita and Minami wards in Osaka.
1951 WINS WINS Kyoto Building completed in Kyoto.
1953 WINS WINS Kobe B Building completed in Kobe.
1955 The Hanshin Race Track was sold to the Japan Racing Association (JRA).
1956 The corporate name was changed to Keihanshin Real Estate Co., Ltd.
1962 Office Our first office building, Kawaramachi Building, completed in Osaka.
1964 Office Azuchimachi Building completed in Osaka.
1969 Office Sakasegawa Building completed in Takarazuka City.
1982 WINS WINS Umeda A Building completed in Osaka.
1983 Logistics Hirakata Warehouse completed in Hirakata City.
1988 DC Our first datacenter building, Shinmachi 1 Building, completed in Osaka.
1989 Logistics Toyahama Warehouse completed in Kobe.
1990 WINS WINS Kyoto Building completed (rebuilt) in Kyoto.
1991 DC
WINS
Shin Esaka Building completed in Suita City, Osaka.
WINS Kobe B and C Buildings completed (rebuilt) in Kobe.
1994 Logistics Asahikawa Shopping Facility completed in Asahikawa City, Hokkaido.
1996 Logistics Shijo Kawaramachi Building in Kyoto acquired.
1998 50th anniversary of the Company’s foundation Logistics Nagano Shopping Facility in Nagano City acquired.
1999 DC Toyosaki Building completed in Osaka.
2000 DC Nakatsu Building completed in Osaka.
2001 Office Yodoyabashi Building completed in Osaka.
2002 DC
WINS
Shinmachi 2 Building completed in Osaka.
WINS Namba completed (rebuilt) in Osaka.
2003 Listed on the First Section of the Tokyo Stock Exchange.
2007 DC
Office
Kitahorie Building in Osaka acquired.
Midosuji Building completed in Osaka.
2009 Office Onarimon Building completed in Minato Ward,Tokyo.
2010 WINS WINS Umeda B Building completed (rebuilt) in Osaka.
2011 Corporate name changed to the present one.
2012 DC Keihanshin Nishishinsaibashi Building completed in Osaka.
2014 Establishment of the Tokyo Office. Office Fuchu Building in Fuchu acquired.
2015 Office Keihanshin Yoyogi-koen Building in Shibuya Ward, Tokyo acquired.
Office BuildingsOffice Datacenter BuildingsDC WINS BuildingsWINS Commercial Buildings and Logistics WarehousesLogistics
46 Keihanshin Building Co., Ltd. 47Keihanshin Building Co., Ltd.
Corporate/Stock Information

Printed in Japan
2-14 Kawaramachi 4-chome, Chuo-ku, Osaka City 541-0048, JapanTel: +81-6-6202-7331 Fax: +81-6-6202-7329URL: http://www.keihanshin.co.jp/english/