Budget Q &A
58
PRINCE GEORGE’S COUNTY PUBLIC SCHOOLS | 14201 School Lane, Upper Marlboro, MD 20772 Questions from the Board of Education Montessori Achievement Data FY 2022 Chief Executive Officer’s PROPOSED Budget Q & A Business Management Services Michael Herbstman Chief Financial Officer Lisa Howell, Director Budget & Management Services
Transcript of Budget Q &A

PRINCE GEORGE’S COUNTY PUBLIC SCHOOLS | 14201 School Lane, Upper Marlboro, MD 20772
Questions from the Board of Education
Montessori Achievement Data
FY 2022 Chief Executive Officer’s PROPOSED Budget Q & A
Business Management Services Michael Herbstman Chief Financial Officer Lisa Howell, Director Budget & Management Services

Prince George’s County Public Schools Business Management Services
FY 2022 Proposed Operating Budget
Page 2 Montessori Data Request
1. Provide achievement data for the district’s three Montessori schools for SY 2020 and SY 2021.
Please see data attached.

February 18, 2021
Data Request for Montessori Schools

SY21 Assessments Administered Thus Far Mathematics
Test Grade Levels Month(s)
Bridging Diagnostic Assessments (BDAs)
3 - 8 Sept
Benchmark #1 3 - 8 Nov/Dec
Benchmark #2 * K - 8 Jan/Feb
RELA
Test Grade Levels Month(s)
iReady 3 - 5 Sept
Bridging Diagnostic Assessments (BDAs)
6 - 8 Sept
Benchmark #1 3 - 8 Nov/Dec
Benchmark #2 * 3 - 8 Jan/Feb
MAP Fluency Fall K - 2 Oct/Nov
MAP Fluency Winter K - 2 Jan/Feb
Science
Test Grade Levels Month(s)
Bridging Diagnostic Assessments (BDAs)
3 - 8 Sept
FAST #1 5, 8 Nov/Dec
FAST #2 * 5, 8 Jan/Feb
Social Studies
Test Grade Levels Month(s)
Bridging Diagnostic Assessments (BDAs)
6 - 8 Sept* = test window actively open, data may not be complete/included

SY20 Historical Assessment Data IncludedMathematics
Test Grade Levels Month(s)
Benchmark #1 1 - 8 Nov
Benchmark #2 K - 8 Jan/Feb
Science
Test Grade Levels Month(s)
FAST #1 5, 8 Nov
FAST #2 5, 8 Jan/Feb
RELA
Test Grade Levels Month(s)
MAP Growth Fall 2-8 Sept
MAP Growth Winter 2-8 Jan

Benchmark #2 Data
The test administration window for Benchmark #2 is currently open and will close on 2/19/21, with hand scoring by teachers to be completed by 2/26/21. Since this is an active test administration, data is not yet available for the Benchmark #2 administration.

Student Participation
Historically, student participation on assessments is usually high at all three Montessori schools. On average, there is usually at least a 90-95% participation rate for any assessment administered to students. Therefore, data presented is relatively complete accounting for a majority of the students enrolled at the time the assessment was administered.

John Hanson Montessori School

SY21 Data


BDAs were not administered in Pearson Access for students enrolled in RELA 3 - 5. Students in these grade levels completed an iReady assessment instead. Data for this assessment can be found on the next slide.

i‑Ready Diagnostic is an adaptive assessment that pinpoints student ability level, identifies the specific skills students need to learn to accelerate their growth, and charts a personalized learning path for each student.

For the fall administration of the MAP Fluency assessment, all students were routed to take the Foundational Skills portion of the MAP Fluency test. This chart shows performance results by subscore for all test takers in Grades K - 2.

The MAP Fluency is an adaptive assessment where students are routed to one of two tests based on their results from a basic comprehension skills check - Foundational Skill (lower level) or Oral Reading (higher level).

This is an adaptive test where not all students are routed to take the Foundational Skills assessment. Instead, some students are routed to an Oral Reading test instead, which is a higher skill level test. These students are accounted for in the orange ‘not eligible for this portion of the test’ band of the chart above.

This is an adaptive test where not all students are routed to take the Oral Reading assessment. Instead, some students are routed to a Foundational Skills test instead, which is a lower skill level test. These students are accounted for in the orange ‘not eligible for this portion of the test’ band of the chart above.

FAST #1 and #2 assessments are being administered in Grades 5 and 8 only for Science.
While the FAST #2 assessment window is currently open, most students at this school have completed the test (roughly 86%); therefore, this data is included in this presentation. However, the data is still subject to change as the test window comes to a close on 2/19.

FAST #1 and #2 assessments are not being administered in Social Studies for any students in Grades K - 8.

Number of Test Takers - Math and RELAMATH
Test Name BDAs Benchmark 1
Math 3 58 47Math 4 42 51Math 5 37 35Math 6 21 33Math 7 25 34
Math 8---
(no students enrolled)15
Accelerated Math 1 24 0Accelerated Math 2 25 0Foundations for Algebra
19 0
Algebra 1 39 15
RELA
Test Name BDAs Benchmark 1RELA 3 --- 38RELA 4 --- 32RELA 5 --- 35RELA 6 54 36RELA 7 56 36RELA 8 68 62
RELA
Test Name Fall 2020 Winter 2021iReady (Grades 3 - 5) 129 125MAP Fluency (Grades K - 2) 156 155

Number of Test Takers - Science and Social Studies
Science
Test Name BDAs FAST #1 FAST #2
Science 3 69 --- ---Science 4 55 --- ---Science 5 45 48 55Science 6 49 --- ---Science 7 60 --- ---Science 8 71 58 50
Social Studies
Test Name BDAs
World Culture/Geog 1 (Grade 6)
35
World Culture/Geog 2 (Grade 7)
33
United States History 8 (Grade 8)
43

SY20 Data


Percentile scores are used to compare students’ performance to that of a larger group. Percentile means the students scored as well as or better than that percent of other students taking the test in that grade.

Judith P. Hoyer Montessori School

SY21 Data


BDAs were not administered in Pearson Access for students enrolled in RELA 3 - 5. Students in these grade levels completed an iReady assessment instead. Data for this assessment can be found on the next slide.

i‑Ready Diagnostic is an adaptive assessment that pinpoints student ability level, identifies the specific skills students need to learn to accelerate their growth, and charts a personalized learning path for each student.

For the fall administration of the MAP Fluency assessment, all students were routed to take the Foundational Skills portion of the MAP Fluency test. This chart shows performance results by subscore for all test takers in Grades K - 2.

The MAP Fluency is an adaptive assessment where students are routed to one of two tests based on their results from a basic comprehension skills check - Foundational Skill (lower level) or Oral Reading (higher level).

This is an adaptive test where not all students are routed to take the Foundational Skills assessment. Instead, some students are routed to an Oral Reading test instead, which is a higher skill level test. These students are accounted for in the orange ‘not eligible for this portion of the test’ band of the chart above.

This is an adaptive test where not all students are routed to take the Oral Reading assessment. Instead, some students are routed to a Foundational Skills test instead, which is a lower skill level test. These students are accounted for in the orange ‘not eligible for this portion of the test’ band of the chart above.

FAST #1 and #2 assessments are being administered in Grades 5 and 8 only for Science.
While the FAST #2 assessment window is currently open, almost all students at this school have completed the test (roughly 98%); therefore, this data is included in this presentation. However, the data is still subject to change as the test window comes to a close on 2/19.

FAST #1 and #2 assessments are not being administered in Social Studies for any students in Grades K - 8.

Number of Test Takers - Math and RELAMATH
Test Name BDAs Benchmark 1Math 3 30 37Math 4 35 35Math 5 28 28Math 6 11 11Math 7 12 13Math 8 7 7Accelerated Math 1 12 13Accelerated Math 2 9 9Foundations for Algebra 4 4Algebra 1 8 8
RELA
Test Name BDAs Benchmark 1RELA 3 --- 36RELA 4 --- 35RELA 5 --- 28RELA 6 24 24RELA 7 22 22RELA 8 19 19
RELA
Test Name Fall 2020 Winter 2021iReady (Grades 3 - 5) 94 100MAP Fluency (Grades K - 2) 130 113

Number of Test Takers - Science and Social Studies
Science
Test Name BDAs FAST #1 FAST #2
Science 3 18 --- ---Science 4 35 --- ---Science 5 28 28 27Science 6 22 --- ---Science 7 21 --- ---Science 8 19 19 19
Social Studies
Test Name BDAs
World Culture/Geog 1 (Grade 6)
18
World Culture/Geog 2 (Grade 7)
7
United States History 8 (Grade 8)
19

SY20 Data


Percentile scores are used to compare students’ performance to that of a larger group. Percentile means the students scored as well as or better than that percent of other students taking the test in that grade.

Robert GoddardMontessori School

SY21 Data


BDAs were not administered in Pearson Access for students enrolled in RELA 3 - 5. Students in these grade levels completed an iReady assessment instead. Data for this assessment can be found on the next slide.

i‑Ready Diagnostic is an adaptive assessment that pinpoints student ability level, identifies the specific skills students need to learn to accelerate their growth, and charts a personalized learning path for each student.

For the fall administration of the MAP Fluency assessment, all students were routed to take the Foundational Skills portion of the MAP Fluency test. This chart shows performance results by subscore for all test takers in Grades K - 2.

The MAP Fluency is an adaptive assessment where students are routed to one of two tests based on their results from a basic comprehension skills check - Foundational Skill (lower level) or Oral Reading (higher level).

This is an adaptive test where not all students are routed to take the Foundational Skills assessment. Instead, some students are routed to an Oral Reading test instead, which is a higher skill level test. These students are accounted for in the orange ‘not eligible for this portion of the test’ band of the chart above.

This is an adaptive test where not all students are routed to take the Oral Reading assessment. Instead, some students are routed to a Foundational Skills test instead, which is a lower skill level test. These students are accounted for in the orange ‘not eligible for this portion of the test’ band of the chart above.

FAST #1 and #2 assessments are being administered in Grades 5 and 8 only for Science.
While the FAST #2 assessment window is currently open, most students at this school have completed the test (roughly 86%); therefore, this data is included in this presentation. However, the data is still subject to change as the test window comes to a close on 2/19.
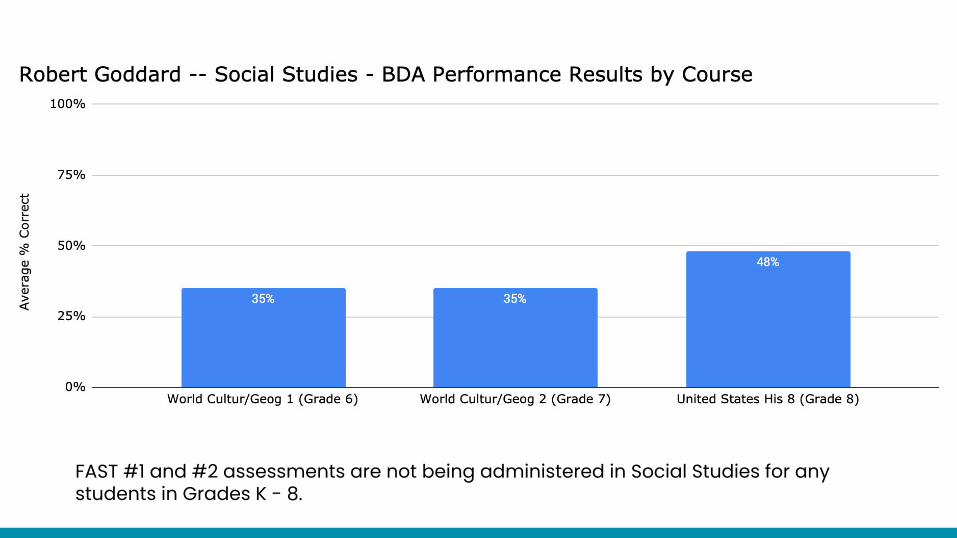
FAST #1 and #2 assessments are not being administered in Social Studies for any students in Grades K - 8.

Number of Test Takers - Math and RELAMATH
Test Name BDAs Benchmark 1Math 3 46 47Math 4 39 39Math 5 42 42Math 6 18 18Math 7 21 16Math 8 18 18Accelerated Math 1 14 14Accelerated Math 2 9 9Foundations for Algebra 17 15Algebra 1 46 47
RELA
Test Name BDAs Benchmark 1RELA 3 --- 46RELA 4 --- 39RELA 5 --- 45RELA 6 24 33RELA 7 22 28RELA 8 19 29
RELA
Test Name Fall 2020 Winter 2021iReady (Grades 3 - 5) 131 131MAP Fluency (Grades K - 2) 150 146

Number of Test Takers - Science and Social Studies
Science
Test Name BDAs FAST #1 FAST #2
Science 3 45 --- ---Science 4 39 --- ---Science 5 45 44 45Science 6 33 --- ---Science 7 28 --- ---Science 8 18 28 27
Social Studies
Test Name BDAs
World Culture/Geog 1 (Grade 6)
32
World Culture/Geog 2 (Grade 7)
28
United States History 8 (Grade 8)
29

SY20 Data


Percentile scores are used to compare students’ performance to that of a larger group. Percentile means the students scored as well as or better than that percent of other students taking the test in that grade.