
BSP1005 Lecture 6 - Competitive Markets
31
ANALYSIS OF COMPETITIVE MARKETS Managerial Economics, Lecture 6 Dr. YANG, Nan Partly Based on the Notes Prepared by Fernando Quijano
-
Upload
kennerve123 -
Category
Documents
-
view
18 -
download
3
description
wwww
Transcript of BSP1005 Lecture 6 - Competitive Markets

ANALYSIS OF COMPETITIVE MARKETS
Managerial Economics, Lecture 6
Dr. YANG, Nan
Partly Based on the Notes Prepared by Fernando Quijano

Outline• 4.4 Consumer Surplus• 8.6 Producer Surplus• 9.2 The Efficiency of Competitive Markets• 9.3 Minimum Prices• 9.4 Price Supports and Production Quotas• 9.5 Import Quotas and Tariffs• 9.6 The Impact of a Tax or Subsidy

● consumer surplus Difference between what a consumer is willing to pay for a good and the amount actually paid.
Consumer Surplus and Demand
Consumer surplus is the total benefit from the consumption of a product, less the total cost of purchasing it.
Here, the consumer surplus associated with six concert tickets (purchased at $14 per ticket) is given by the yellow-shaded area:
$6 + $5 + $4 + $3 + $2 + $1 = $21
CONSUMER SURPLUSFIGURE 4.14

CONSUMER SURPLUS GENERALIZED
FIGURE 4.15
For the market as a whole, consumer surplus is measured by the area under the demand curve and above the line representing the purchase price of the good.
Here, the consumer surplus is given by the yellow-shaded triangle and is equal to 1/2 x 6500 x ($20 − $14) = $19,500.
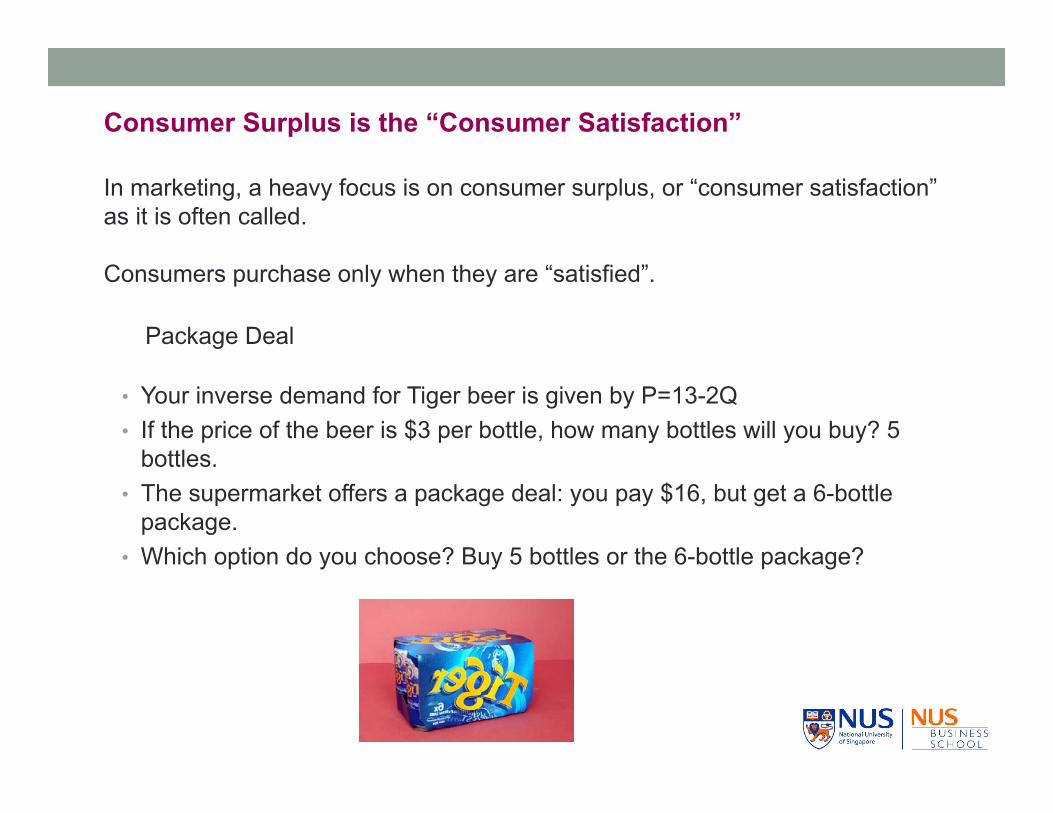
Consumer Surplus is the “Consumer Satisfaction”
In marketing, a heavy focus is on consumer surplus, or “consumer satisfaction” as it is often called.
Consumers purchase only when they are “satisfied”.
• Your inverse demand for Tiger beer is given by P=13-2Q• If the price of the beer is $3 per bottle, how many bottles will you buy? 5
bottles. • The supermarket offers a package deal: you pay $16, but get a 6-bottle
package.• Which option do you choose? Buy 5 bottles or the 6-bottle package?
Package Deal
Q
P
13
6.5
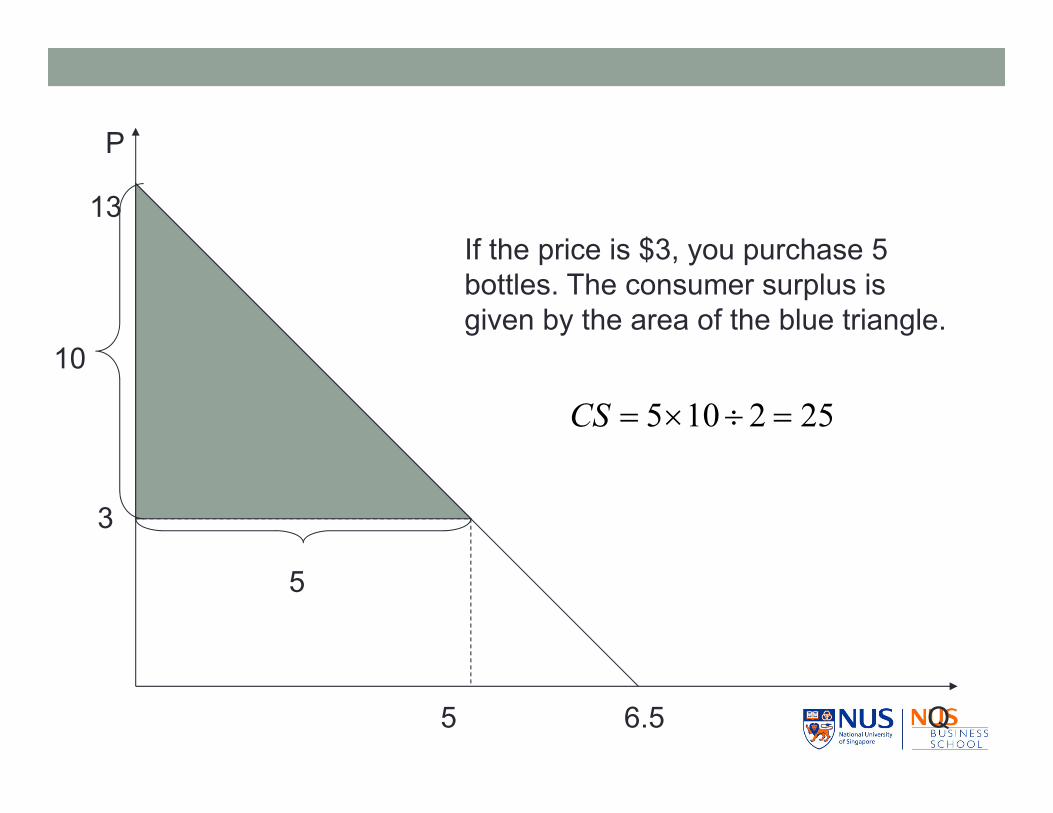
If the price is $3, you purchase 5 bottles. The consumer surplus is given by the area of the blue triangle.
3
5
10
5
252105 CS

Q
P
13
6.5
For the 6th bottle, you are willing to pay 1 dollar.
6
4226)131( TB
1
13
6
Having 6 bottles, you receive a total benefit
On the other hand, you pay 16 dollars, so your consumer surplus will be 42-16=26.
The package deal gives you more surplus, more satisfaction.
If the package is priced at $17.5 (a lower per-bottle price), you won’t buy.

Producer Surplus● producer surplus Sum over all units produced by a firm ofdifferences between the market price of a good and the marginal cost of production.
PRODUCER SURPLUS FOR A FIRM
FIGURE 8.11
The producer surplus for a firm is measured by the yellow area below the market price and above the marginal cost curve, between outputs 0 and q*, the profit-maximizing output. Alternatively, it is equal to rectangle ABCD because the sum of all marginal costs up to q* is equal to the variable costs of producing q*.
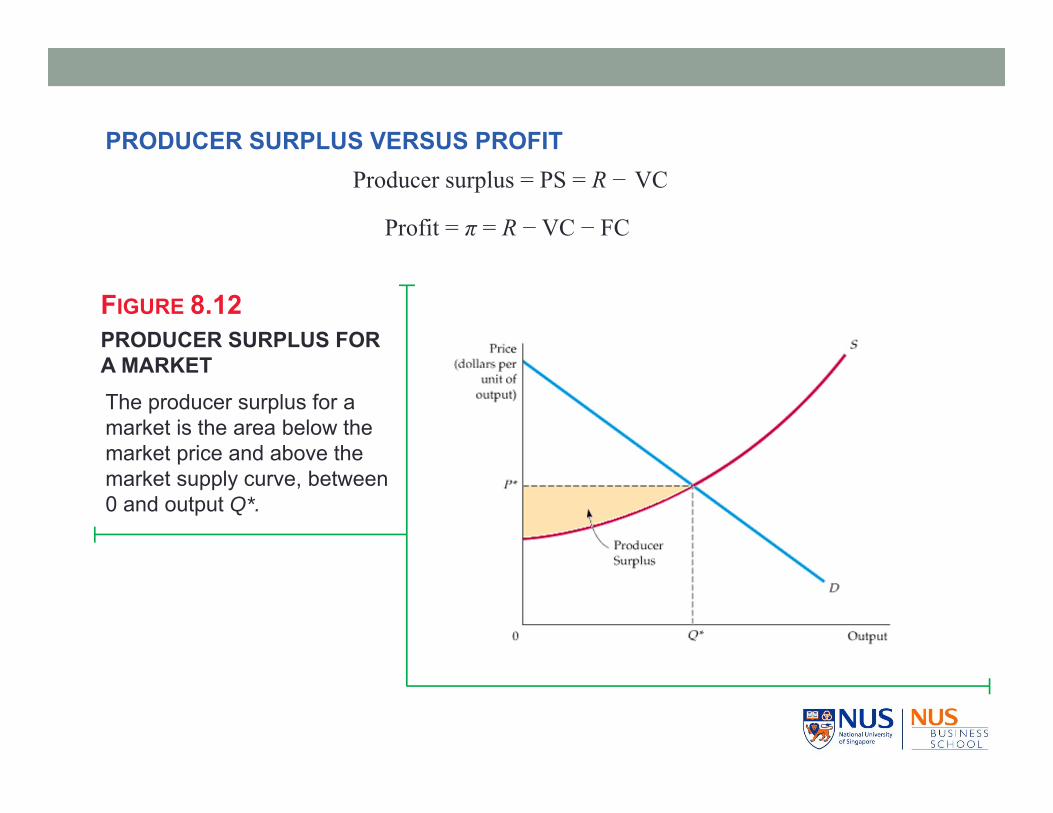
PRODUCER SURPLUS VERSUS PROFIT
PRODUCER SURPLUS FOR A MARKET
FIGURE 8.12
Producer surplus = PS = R − VC
Profit = π = R − VC − FC
The producer surplus for a market is the area below the market price and above the market supply curve, between 0 and output Q*.

CONSUMER AND PRODUCER SURPLUS
FIGURE 9.1
Together, consumer and producer surplus measure the welfare benefit of a competitive market (or any other market).

Application of Consumer and Producer Surplus
CHANGE IN CONSUMER AND PRODUCER SURPLUS FROM PRICE CONTROLS
FIGURE 9.2
● welfare effects Gains and losses to consumers and producers.
The price of a good has been regulated to be no higher than Pmax, which is below the market-clearing price P0.
The gain to consumers is the difference between rectangle A and triangle B.
The loss to producers is the sum of rectangle A and triangle C.
Triangles B and C together measure the deadweight loss from price controls.
● deadweight loss Net loss of total (consumer plus producer) surplus.

Application of Consumer and Producer Surplus
EFFECT OF PRICE CONTROLS WHEN DEMAND IS INELASTIC
FIGURE 9.3
If demand is sufficiently inelastic, triangle B can be larger than rectangle A. In this case, consumers suffer a net loss from price controls.

The Efficiency of a Competitive Market9.2
MARKET FAILURE
● economic efficiency Maximization of aggregate consumer and producer surplus.
● market failure Situation in which an unregulated competitive market is inefficient because prices fail to provide proper signals to consumers and producers.

THE MARKET FOR KIDNEYS AND THE EFFECT OF THE NATIONAL ORGAN TRANSPLANTATION ACT
FIGURE 9.6
EXAMPLE 8.2 THE MARKET FOR HUMAN KIDNEYS
Economics, the dismal science, shows us that human organs have economic value that cannot be ignored, and prohibiting their sale imposes a cost on society that must be weighed against the benefits.
The market-clearing price is $20,000; at this price, about 24,000 kidneys per year would be supplied.
The law effectively makes the price zero. About 16,000 kidneys per year are still donated; this constrained supply is shown as S’.
The loss to suppliers is given by rectangle A and triangle C.
If consumers received kidneys at no cost, their gain would be given by rectangle A less triangle B.
Even at a price of zero (the effective price under law), donors supply about 16,000 kidneys per year.

PRICE MINIMUMFIGURE 9.7
Minimum Prices9.3
The total change in consumer surplus is: CS = −A − BThe total change in producer surplus is: PS = A − C − D
Price is regulated to be no lower than Pmin.
Producers would like to supply Q2,
but consumers will buy only Q3.
If producers indeed produce Q2, the amount Q2 − Q3 will go unsold and the change in producer surplus will be A − C − D. In this case, producers as a group may be worse off.
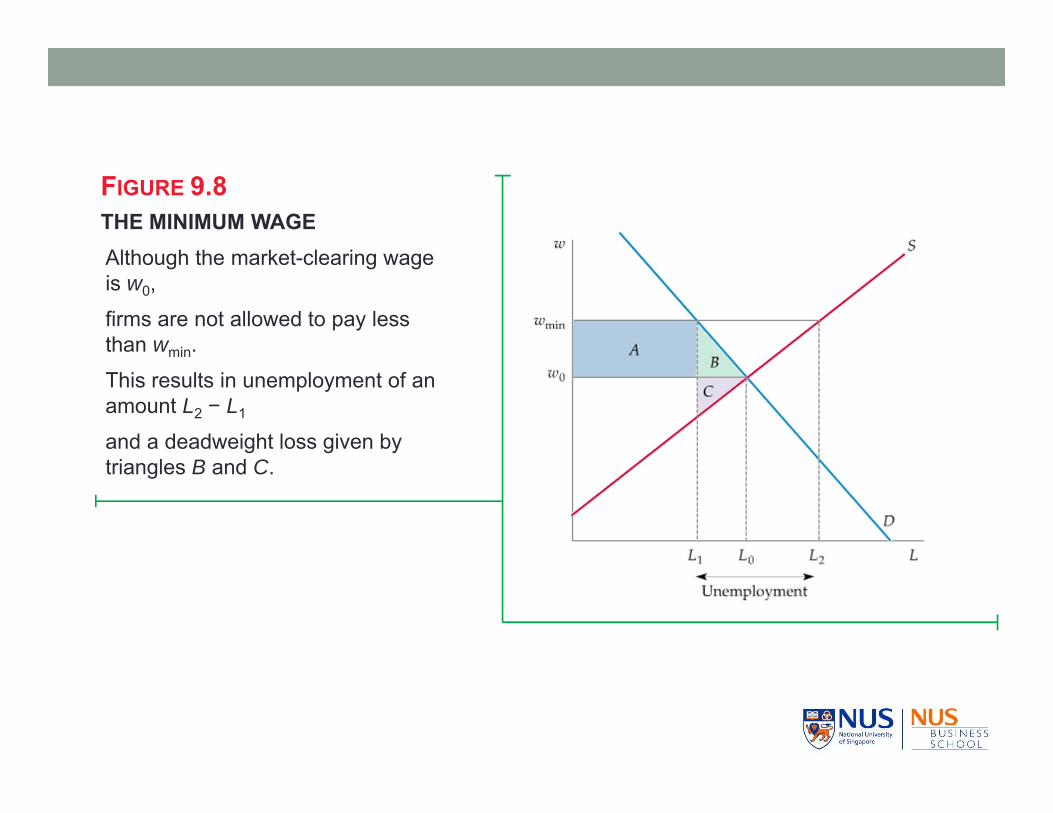
THE MINIMUM WAGEFIGURE 9.8
Although the market-clearing wage is w0,
firms are not allowed to pay less than wmin.
This results in unemployment of an amount L2 − L1
and a deadweight loss given by triangles B and C.

No minimum wage in Singapore
Parliamentary debate in 2001, asiaone.com.sg
The MP for Bishan-Toa Payoh, Ms Josephine Teo, pointed out that to be meaningful, a minimum wage must force some employers to pay more than the market rate.
“Companies that do not wish to engage in the illegal practice (of paying below minimum wage) and find it too costly to operate in Singapore will close shop or relocate,” she said.

EFFECT OF AIRLINE REGULATION BY THE CIVIL AERONAUTICS BOARD
FIGURE 9.9
EXAMPLE 8.2 AIRLINE REGULATION
Airline deregulation in 1981 led to major changes in the industry. Some airlines merged or went out of business as new ones entered. Although prices fell considerably (to the benefit of consumers), profits overall did not fall much.
At price Pmin, airlines would like to supply Q2, well above the quantity Q1 that consumers will buy.
Here they supply Q3. Trapezoid D is the cost of unsold output.
Airline profits may have been lower as a result of regulation because triangle C and trapezoid D can together exceed rectangle A.
In addition, consumers lose A + B.

EXAMPLE 8.2 AIRLINE REGULATION
Because airlines have no control over oil prices, itis more informative to examine a “corrected” realcost index which removes the effects of changingfuel costs.
TABLE 9.1 AIRLINE INDUSTRY DATA
1975 1980 1990 2000 2010
Number of U.S. carriers 36 63 70 94 63
Passenger Load Factor (%) 54.0 58.0 62.4 72.1 82.1
Passenger-Mile Rate (constant 1995 dollars) 0.218 0.210 0.149 0.118 0.094
Real Cost Index (1995 = 100) 101 145 119 89 148
Real Fuel Cost Index (1995 = 100) 249 300 163 125 342
Real Cost Index w/o Fuel Cost Increases (1995 = 100) 71 87 104 85 76

Civil Aviation Administration of China’s idiotic regulatory policy
From May 1, 1998, CAAC forbid any discounts of ticket price beyond the 20 percent limit for all routes.
“Price floor to be set for air tickets”, China.org.cn
Li Aiqing, a researcher with the CATA, …, saying it is part of the CAAC's measures to prevent "malicious competition". "Airlines use low prices to attract the necessary numbers of passengers to stop their routes from being canceled by the CAAC," Li said.
"At the moment, it's cheaper to fly home than it is to go by train. I can't see why such a good thing has to be taken away," Beijinger Xu Lan said.

Price Supports and Production Quotas9.4Price Supports
● price support Price set by government above free-market level and maintained by governmental purchases of excess supply.
PRICE SUPPORTSFIGURE 9.10
To maintain a price Ps above the market-clearing price P0, the government buys a quantity Qg.
The gain to producers is A + B + D. The loss to consumers is A + B.
The cost to the government is the speckled rectangle, the area of which is Ps(Q2 − Q1).

CONSUMERS
Let’s examine the resulting gains and losses to consumers, producers, and the government in Figure 9.10.
Some consumers pay a higher price, while others no longer buy the good.
∆CS
PRODUCERS
Producers are now selling a larger quantity Q2 instead of Q0, and at a higher price Ps.
∆PS
THE GOVERNMENT
The cost to the government (which is ultimately a cost to consumers) is
The total change in welfare is
∆CS ∆PS CosttoGovt.

Production Quotas
SUPPLY RESTRICTIONSFIGURE 9.11
To maintain a price Ps above the market-clearing price P0, the government can restrict supply to Q1, either by imposing production quotas or by giving producers a financial incentive to reduce output.
For an incentive to work, it must be at least as large as B + C + D, which would be the additional profit earned by producing, given the higher price Ps. The cost to the government is therefore at least B + C + D.
Q1

INCENTIVE PROGRAMS
In U.S. agricultural policy, output is reduced by incentives rather than by outright quotas. Acreage limitation programs give farmers financial incentives to leave some of their acreage idle. Figure 9.11 also shows the welfare effects of reducing supply in this way.
As with direct production quotas, the change in consumer surplus is
∆CS
Farmers receive a higher price, produce less, and receive an incentive to reduce production. Thus, the change in producer surplus is now
∆PS Payments for not producing
The cost to the government is at least B + C + D, and the total change in producer surplus is
∆PS
An acreage-limitation program is more costly to society than simplyhanding the farmers money. The total change in welfare
∆Welfare

Import Quotas and Tariffs9.5● import quota Limit on the quantity of a good that can be imported.
IMPORT TARIFF OR QUOTA THAT ELIMINATES IMPORTS
FIGURE 9.14
● tariff Tax on an imported good.
In a free market, the domestic price equals the world price Pw.
A total Qd is consumed, of which Qs is supplied domestically and the rest imported.
When imports are eliminated, the price is increased to P0.
The gain to producers is trapezoid A.
The loss to consumers is A + B + C, so the deadweight loss is B + C.

IMPORT TARIFF OR QUOTA (GENERAL CASE)
FIGURE 9.15
When imports are reduced, the domestic price is increased from Pw to P*. This can be achieved by a quota, or by a tariff T = P* − Pw.
Trapezoid A is again the gain to domestic producers.
The loss to consumers is A + B + C + D.
If a tariff is used, the government gains D, the revenue from the tariff. The net domestic loss is B + C.
If a quota is used instead, rectangle D becomes part of the profits of foreign producers, and the net domestic loss is B + C + D.

The Impact of a Tax or Subsidy9.6
INCIDENCE OF A TAXFIGURE 9.17
● specific tax Tax of a certain amount of money per unit sold.
Pb is the price (including the tax) paid by buyers. Ps is the price that sellers receive, less the tax.
Here the burden of the tax is split evenly between buyers and sellers.
Buyers lose A + B.
Sellers lose D + C.
The government earns A + D in revenue.
The deadweight loss is B + C.
Market clearing requires four conditions to be satisfied after the tax is in place:QD = QD(Pb) (9.1a)QS = QS(Ps) (9.1b)QD = QS (9.1c)Pb − Ps = t (9.1d)
THE EFFECTS OF A SPECIFIC TAX

EXAMPLE 9.7 A TAX ON GASOLINE
150 − 25Pb = 60 + 20Ps
Pb = Ps + 1.00
150 − 25Pb = 60 + 20Ps
20Ps + 25Ps = 150 – 25 – 60
45Ps = 65, or Ps = 1.44
QD = 150 – (25)(2.44) = 150 – 61, or Q = 89 bg/yr
Annual revenue from the tax tQ = (1.00)(89) = $89 billion per year
Deadweight loss: (1/2) x ($1.00/gallon) x (11 billion gallons/year = $5.5 billion per year
QD = 150 – 25Pb (Demand)QS = 60 + 20Ps (Supply)
QD = QS (Supply must equal demand)Pb – Ps = 1.00 (Government must receive $1.00/gallon)

EXAMPLE 9.7 A TAX ON GASOLINE
IMPACT OF $1 GASOLINE TAX
FIGURE 9.20
The price of gasoline at the pump increases from $2.00 per gallon to $2.44, and the quantity sold falls from 100 to 89 bg/yr.
Annual revenue from the tax is (1.00)(89) = $89 billion (areas A + D).
The two triangles show the deadweight loss of $5.5 billion per year.
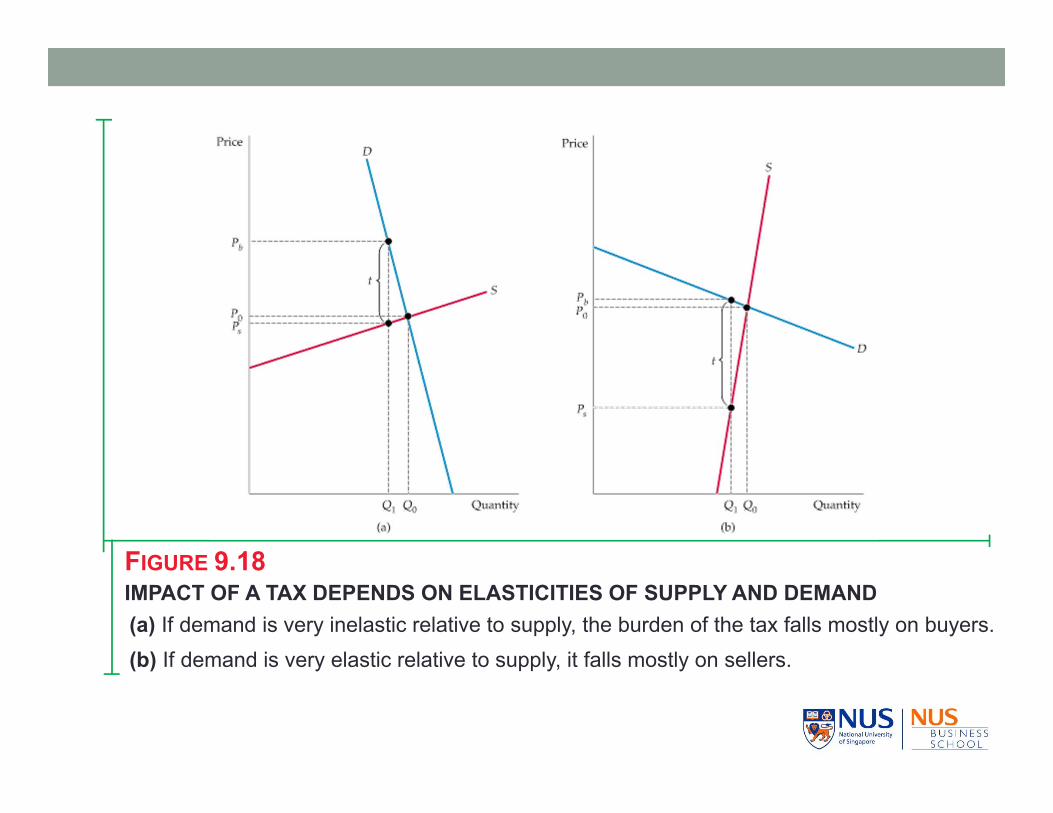
IMPACT OF A TAX DEPENDS ON ELASTICITIES OF SUPPLY AND DEMANDFIGURE 9.18
(a) If demand is very inelastic relative to supply, the burden of the tax falls mostly on buyers.(b) If demand is very elastic relative to supply, it falls mostly on sellers.
The Effects of a Subsidy
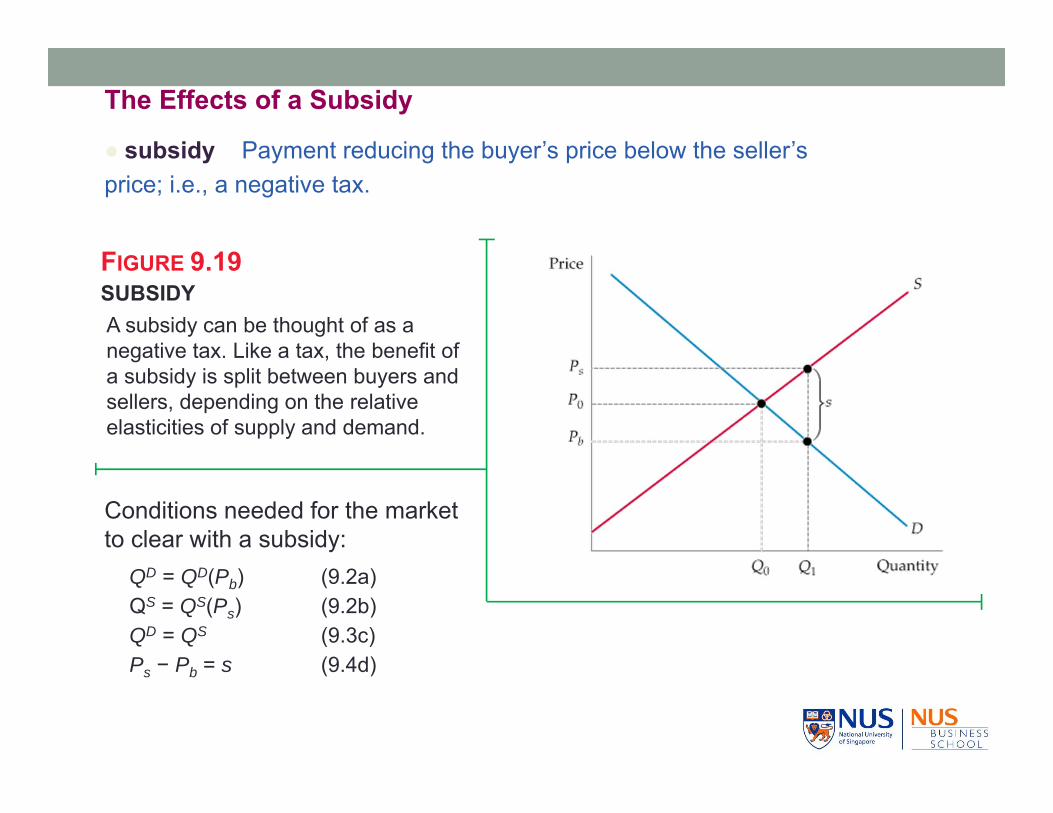
SUBSIDYFIGURE 9.19
A subsidy can be thought of as a negative tax. Like a tax, the benefit of a subsidy is split between buyers and sellers, depending on the relative elasticities of supply and demand.
Conditions needed for the market to clear with a subsidy:
QD = QD(Pb) (9.2a)QS = QS(Ps) (9.2b)QD = QS (9.3c)Ps − Pb = s (9.4d)
● subsidy Payment reducing the buyer’s price below the seller’sprice; i.e., a negative tax.