
BRUTO-DOMA[EN PROIZVOD, 20083.4.10.01 649 BRUTO-DOMA[EN PROIZVOD, 2008 REPUBLIKA MAKEDONIJA DR@AVEN...
80
3.4.10.01 649 BRUTO-DOMA[EN PROIZVOD, 2008 REPUBLIKA MAKEDONIJA DR@AVEN ZAVOD ZA STATISTIKA REPUBLIC OF MACEDONIA STATE STATISTICAL OFFICE GROSS DOMESTIC PRODUCT, 2008 Skopje, maj 2010 / Skopje, May 2010 STATISTI^KI PREGLED: Nacionalna ekonomija i finansii STATISTICAL REVIEW: National Economy and Finances
Transcript of BRUTO-DOMA[EN PROIZVOD, 20083.4.10.01 649 BRUTO-DOMA[EN PROIZVOD, 2008 REPUBLIKA MAKEDONIJA DR@AVEN...
3.4.10.01649
BRUTO-DOMA[EN PROIZVOD, 2008
REPUBLIKA MAKEDONIJADR@AVEN ZAVOD ZA STATISTIKA
REPUBLIC OF MACEDONIASTATE STATISTICAL OFFICE
GROSS DOMESTIC PRODUCT, 2008
Skopje, maj 2010 / Skopje, May 2010
STATISTI^KI PREGLED: Nacionalna ekonomija i finansii
STATISTICAL REVIEW: National Economy and Finances
Izdava~:DR@AVEN ZAVOD ZA STATISTIKA NA REPUBLIKA MAKEDONIJA,
ul. "Dame Gruev" br.4, Skopje
Publisher:STATE STATISTICAL OFFICE OF THE REPUBLIC OF MACEDONIA, "Dame Gruev"- 4, Skopje
Telefon/Phone: +389/02/3295-600Faks/Fax: +389/02/3111-336
WEB-stranica/WEB site: http://www.stat.gov.mk
Odgovara:m-r Blagica Novkovska, direktor
Person responsible:M.Sc Blagica Novkovska, Director
VE MOLIME PRI KORISTEWETO NA OVAA PUBLIKACIJA, NAVEDETE GO IZVOROTWHEN USING DATA CONTAINED HERE, PLEASE CITE THE SOURCE
CIP - Katalogizacija vo publikacijaNacionalna i univerzitetska biblioteka "Sv. Kliment Ohridski",Skopje
31:330.55(497.7)"2008"330.55(497.7)"2008"(083.41)
BRUTO-doma{en proizvod, 2008 = Gross domestic product, 2008. -Skopje: Dr`aven zavod za statistika na Republika Makedonija =Skopje: State statistical office of the Republic of Macedonia,2010. - 79 str.: tabeli; 29 sm. - (Statisti~ki pregled / Dr`avenzavod za statistika na Republika Makedonija. Nacionalna ekonomijai finansii = Statistical review / State statistical office of the Republic ofMacedonia, ISSN 0580-454X. National economy andfinances, ISSN 1409-7036; 3.4.10.01(649))
Tekst naporedno na mak. i angl. jazik
ISBN 978-9989-197-92-5
a) Bruto-doma{en proizvod - Makedonija - 2008 - StatistikaCOBISS.MK-ID 83841802
PREDGOVOR
Ovoj Statisti~ki pregled e redovno godi{no izdanie na Sektorot za nacionalni smetki od 2000godina.Toj sodr`i golem broj tabeli so podatoci klasificirani po dejnosti, vo soglasnost soNacionalnata klasifikacija na dejnostite, po institucionalni sektori, i spored goleminata nadelovnite subjekti, kako i podatoci za rashodnite komponenti na bruto-doma{niot proizvod po tekovnii po postojani ceni.
Tabelite se obele`ani so soodvetna oznaka i se podeleni vo pet tematski delovi: Serija M -Makroekonomski tabeli vo koi se prezentirani makroekonomski podatoci; Serija P - Proizvodstvo nastoki i na uslugi, koja sodr`i podatoci za BDP presmetan spored proizvodniot metod; Serija U -Upotreba na stoki i na uslugi vo koja se prika`ani podatoci za tro{o~nite komponenti na BDP presmetanspored rashodniot metod; Serija S - Volumenski indeksi i implicitni deflatori, koja sodr`i podatociza BDP presmetan po postojani ceni; Serija E - Postignuvawe na seopfatnost na BDP, vo koja seprezentirani podatoci koi se odnesuvaat na u~estvoto na neopfatenata (siva) ekonomija vo BDP.
Vo ovaa publikacija, vo najgolem broj od tabelite se prezentirani podatoci za bruto-doma{niotproizvod za 2008 godina.
Sakame da gi informirame korisnicite deka pri presmetkata na podatocite za bruto-doma{niotproizvod za 2006, 2007 i 2008 godina napraveni se metodolo{ki promeni i se razlikuvaat vo sporedbaso prethodno publikuvanite za navedenite godini. Glavna pri~ina za promenata na vrednostite emetodolo{koto usoglasuvawe so Regulativa na Komisijata br.1889/2002 za implementirawe naRegulativata na Sovetot br. 448/98 za kompletirawe i izmenuvawe na Regulativata na Sovetotbr.2226/96 vo odnos na alokacijata na finansiskite uslugi indirektno mereni i Regulativa naKomisijata br.1722/ 2005 vo odnos na principite za presmetuvawe na imputiranite stanarini, a zapotrebite na Regulativata na Sovetot 1287/2003 za harmonizirawe na bruto-nacionalniot dohod popazarni ceni.
Godi{nite podatoci so ovaa metodolo{ka promena }e bidat podgotveni kako serija i }e bidatobjaveni vo posebno soop{tenie za koe korisnicite }e bidat navremeno informirani.
Site zabele{ki i predlozi vo funkcija na podobruvawe na sodr`inata na publikacijata }ebidat prifateni so zadovolstvo.
Skopje, maj 2010 godina
Rakovoditel na sektorot m-r Verka Panova
PREFACE
This publication is a regular annual issue of the Sector of National Accounts. It contains a large number oftables with data classified by activities according to the National classification of economic activities, by institutionalsectors and size of economic units and data on expenditure components of GDP at current and constant prices.
The tables are marked with appropriate signs in five thematic parts: Series M-Macroeconomic tables, inwhich macroeconomic data on GDP are presented; Series P- Goods and services production, which contains dataon GDP calculated by production approach; Series U- Use of goods and services, in which the data on expenditurecomponents of GDP calculated by expenditure approach are shown; Series C-Volume indices and implicit deflators,which contains data on GDP calculated at constant prices; Series E-Achieving exhaustiveness of GDP, in whichdata concerning the share of the non-observed (grey) economy are shown.
In this publication, most of the tables contain data on the Gross Domestic Product for 2008.We would like to inform the users that in the preparation of the GDP data for 2008, 2007 and 2006 certain
methodological changes were made and data differ in comparison with the published data for those years. Themain reason for the changes is the methodological harmonization with Commission Regulation (EC) No 1889/2002 on the implementation of Council Regulation (EC) No 448/98 completing and amending Regulation (EC) No2223/96 with respect to the allocation of financial intermediation services indirectly measured (FISIM) and withCommission Regulation (EC) No 1722/2005 on the principles for estimating dwelling services for the purpose ofCouncil Regulation (EC, Euratom) No 1287/2003 on the harmonisation of gross national income at market prices.
With these methodological changes annual data will be prepared as a series and published in a specialrelease, of which the users will be informed in a timely manner.
All remarks and suggestions aimed at improving the contents of this review would be greatly appreciated.
Skopje, May 2010
Head of Sector M.Sc Verka Panova
4 Statisti~ki pregled 3.4.10.01/649
S O D R @ I N A
Stranica
Predgovor .......................................................................................................................... 3
Voved .................................................................................................................................. 5
Metodolo{ki objasnuvawa .............................................................................................. 9
Bruto-doma{en proizvod (proizvoden metod) ............................................................... 9
Bruto-doma{en proizvod (rashoden metod) .................................................................. 12
SERIJA M - Makroekonomski tabeli ............................................................................ 23
SERIJA P - Proizvodstvo na stoki i na uslugi ........................................................... 27
SERIJA U - Upotreba na stoki i na uslugi ................................................................... 52
SERIJA S - Volumenski indeksi i implicitni deflatori ....................................... 61
SERIJA E - Postignuvawe na seopfatnost na BDP ..................................................... 75
C O N T E N T
Preface ................................................................................................................................ 3
Introduction ........................................................................................................................... 7
Notes on methodology ........................................................................................................ 15
Gross domestic product (production approach) .................................................................. 15
Gross domestic product (expenditure approach) ................................................................ 18
SERIES M - Macroeconomic tables ................................................................................... 23
SERIES P - Goods and services production ....................................................................... 27
SERIES U - Use of goods and services.............................................................................. 52
SERIES C - Volume indicies and implicit deflators ............................................................. 61
SERIES E - Achieving the exhaustiveness of GDP ............................................................ 75
5Statistical review 3.4.10.01/649
VOVED
Vo Dr`avniot zavod za statistika, vo tekot na 2000 godina e napravena pogolema revizija napodatocite za presmetka na bruto-doma{niot proizvod za periodot od 1997 do 1999 godina soposoodvetno implementirawe na principite na Sistemot na ekonomski smetki, ESA 1995 na Eurostat.Taa revizija se odnesuva{e na:
- metodolo{ki podobruvawa na presmetkata na proizvodnata i rashodnata strana na BDP;- metodolo{ki podobruvawa za procena na neopfatenata (siva) ekonomija;- primena na novi re{enija za presmetka na volumenskite indeksi i cenovnite deflatori;- integrirawe na podatocite od Anketata za rabotnata sila vo presmetkata na BDP so {to se
postignuva pogolem opfat na neregistriranite ekonomski aktivnosti;- novi standardi pri analizata na podatocite;- primena na Nacionalnata klasifikacija na dejnostite koja e celosno harmonizirana so
klasifikacijata na EU, NACE Rev.1.So implementacijata na novite podobreni metodolo{ki re{enija vo tekot na 2000 godina i
na~inot na prika`uvawe na podatocite, se ovozmo`uva pogolema me|unarodna sporedlivost pri analizana podatocite.
Od 2005 godina, pri presmetkata na bruto-doma{niot proizvod, promenata na zalihite sepresmetuva na na~in koj ovozmo`uva eliminirawe na vlijanieto na cenite.
Vo 2010 godina e izvr{ena revizija na podatocite za bruto-doma{niot proizvod za 2006, 2007 i2008 poradi implementiraweto na:
- Regulativa na Komisijata br.1889/2002 za implementirawe na Regulativata na Sovetotbr. 448/98 za kompletirawe i izmenuvawe na Regulativata na Sovetot br.2226/96 vo odnos na alokacijatana finansiskite uslugi indirektno mereni;
- Regulativa na Komisijata br.1722/ 2005 vo odnos na principite za presmetuvawe na imputiranitestanarini, a za potrebite na Regulativata na Sovetot 1287/2003 za harmonizirawe na bruto-nacionalniot dohod po pazarni ceni;
- usoglasuvaweto so revidiranite podatocite vo platniot bilans;- metodolo{kite podobruvawa na presmetkite na BDP po postojani ceni i- koristeweto na mese~ni podatoci od platniot bilans za: izvozot na stoki i na uslugi i uvozot
na stoki i na uslugi, mese~ni podatoci za devizniot kurs na dolarot za dobivawe na godi{nite podatoci.Del od bankarskite uslugi se pla}aat direktno, no del od finansiskite uslugi se vr{at bez
eksplicitno pla}awe. Toj del na uslugite se vrednuva indirektno. Vo nacionalnite smetki tie sepoznati kako finansiski uslugi mereni indirektno (FISIM). Bankite pla}aat poniski stapki na kamatiotkolku vo slu~aj koga tie na nekogo mu pozajmuvaat pari i napla}aat povisoki stapki na kreditite koitie im gi odobruvaat.
Vo dosega{nite presmetki ovie uslugi bea presmetuvani kako razlika pome|u primenata iplatenata kamata. Ne be{e napravena alokacija po sektori i po korisnici na ovie uslugi i tie seiska`uvaa kako me|ufazna potro{uva~ka na nivo na vkupnata ekonomija.
So cel podobruvawe vo nacionalnite smetki vo soglasnost so Regulativata na Komisijatabr. 1889/2002 (Commission Regulation (EC) No 1889/2002), od site zemji-~lenki na EU se bara{e danapravat presmetki i alokacija na finansiskite uslugi mereni indirektno pome|u sektorite - korisnicina ovie uslugi, so upotreba na referentna stapka definirana kako "metod 1" vo to~kata1(b) od Aneksot3 na Regulativata na Sovetot br. 448/98 (Council Regulation (EC) No 448/98). Spored novite presmetki,ovie uslugi po korisnici ne se iska`uvaat samo kako me|ufazna potro{uva~ka, tuku mo`at da bidatfinalna potro{uva~ka i izvoz (uvoz).
Kako rezultat na sorabotkata so NBRM, vrz osnova na raspolo`livite podatoci od NBRM, voDr`avniot zavod za statistika se napraveni presmetki i alokacija na finansiskite uslugi mereniindirektno, po sektori i po korisnici, vo soglasnost so navedenite regulativi na EU. Presmetkite seodnesuvaat za 2008 godina, a podatocite za 2006 i 2007 godina se revidirani spored novite presmetki.
Presmetkite na FISIM se vrz osnova na slednite glavni podatoci: referentna kamatna stapka(interna i eksterna referentna stapka); prose~na sostojba na depoziti i krediti i presmeta na kamatnastapka po sektori - korisnici na ovie uslugi.
Alokacijata na delot od FISIM, kako me|ufazna potro{uva~ka po aktivnosti, e napravena sporedstrukturata na bruto-vrednosta na proizvodstvoto.
Vlijanieto na alociraniot FISIM vo bruto-doma{niot proizvod e 1,07% vo 2006, 1,11% vo 2007i 1,25% vo 2008 godina.
6 Statisti~ki pregled 3.4.10.01/649
Presmetkite na FISIM ne se odnesuvaat na Narodnata Banka na RM. Bruto-vrednosta naproizvodstvoto na NBRM od 2006 godina se presmetuva kako suma na tro{ocite (sredstva na vrabotenite,amortizacija, me|ufazna potro{uva~ka, drugi danoci na proizvodstvoto minus drugi subvencii naproizvodstvoto). Spored konvencijata, bruto-vrednosta na proizvodstvoto na NBRM e alocirana vome|ufaznata potro{uva~ka na bankite.
Podatocite za finalnata potro{uva~ka na doma}instvata se revidirani kako rezultat, predsé, na primenata na Regulativa na Komisijata br.1889/2002 za implementirawe na Regulativata naSovetot br. 448/98 za kompletirawe i izmenuvawe na Regulativata na Sovetot br.2226/96 vo odnos naalokacijata na finansiskite uslugi mereni indirektno i Regulativa na Komisijata br.1722/ 2005 voodnos na principite za presmetuvawe na imputiranite stanarini, a za potrebite na Regulativata naSovetot 1287/2003 za harmonizirawe na bruto-nacionalniot dohod po pazarni ceni.
Del od vkupniot FISIM za prvpat e alociran vo finalnata potro{uva~ka na doma}instvata, voCOICOP, podgrupa 12.6 Finansiski uslugi, a negovoto u~estvo vo BDP e 0.89% vo 2006, 0.87% vo 2007 i0.99% vo 2008 godina.
Alokacijata na finansiskite uslugi mereni indirektno vo neprofitnite institucii {to imslu`at na doma}instvata i vo finalnata javna potro{uva~ka ima{e implikacija na vrednosta nafinalnata potro{uva~ka.
Metodolo{kite podobruvawa za presmetkite na imputiranite stanarini proizlegoa od primenatai na pogore spomenatite regulativi.
Vlijanieto na alokacijata na FISIM vo imputiranite stanarini ima implikacija vrz promenatana me|ufaznata potro{uva~ka i, soodvetno, vrz bruto-rentata koja se presmetuva spored metodot "usercost".
So metodolo{kite podobruvawa za imputiranite stanarini, se primeni godi{na stapka od 2,5%na neto-vrednosta na stanbeniot fond na stanovite po tekovni ceni. So toa se promeni podatokot zaneto-delovniot vi{ok pri presmetkite na imputiranite stanarini.
Ovie metodolo{ki usoglasuvawa so me|unarodnite standardi vlijaeja na revidiraweto napodatocite za finalnata potro{uva~ka na doma}instvata impliciraj}i promena na podatocite voCOICOP, podgrupa 4.2 Imputirani stanarini.
7Statistical review 3.4.10.01/649
INTRODUCTION
In the State Statistical Office, in 2000, an extensive revision was made to the data for calculation of GDP forthe period from 1997 to 1999, by implementing more appropriately the principles of the European System ofAccounts, ESA95, of EUROSTAT. This revision referred to:
- Methodological improvements to the calculations by production and expenditure approach of GDP;- Methodological improvements to the estimations of exhaustiveness in the economy;- Applying new methods for calculation of volume indicesand price deflators;- Integration of data from the Labour Force Survey in the calculation of GDP, thereby achieving greater
coverage of unreported economic activities;- New standards in data analyzing;- Applying the National Classification of Economic Activities that is fully harmonized with NACE, Rev.1
classification of the EU.The implementation of the new improved methodological solutions in 2000 and the way of presenting the
data enable greater international comparability when analyzing the data.Since 2005, when estimating GDP, the calculation of changes in inventories is made in a manner that
enables the elimination of holding gains/losses.In 2010 a revision was made to the data for 2006, 2007 and 2008 due to the implementation of:- Commission Regulation (EC) No 1889/2002 on the implementation of Council Regulation (EC) No 448/98
completing and amending Regulation (EC) No 2223/96 with respect to the allocation of financial intermediationservices indirectly measured (FISIM);
- Commission Regulation (EC) No 1722/2005 on the principles for estimating dwelling services for thepurpose of Council Regulation (EC, Euratom) No 1287/2003 on the harmonisation of gross national income atmarket prices;
- Harmonization with revised BoP data;- Methodological improvements for calculations of GDP at constant prices;- Using monthly data from the Balance of Payments for: export of goods and services and import of goods
and services, as well as monthly data on the exchange rate of the US$ to obtain annual data.Some of the banking services are paid directly, but part of the financial intermediation services are performed
without explicit payment. That part of services is evaluated indirectly. These services in the National Accounts areknown as Financial Intermediation Services Indirectly Measured (FISIM). The banks pay lower interest rates thanin the case when they borrowed money and charge higher interest rates for the loans they approve.
Up to now, these services had been calculated as a difference between interest receivable and interestpayable. These services were not allocated by sectors and users, and they were shown as an intermediateconsumption at the level of total economy.
In order to improve the National Accounts in accordance with Commission Regulation No.1889/2002 all EUMember States are required to calculate and allocate the Financial Intermediation Services Indirectly Measuredamong user sectors, using the reference rate defined as "method 1" in point 1(b) of Annex III of the CouncilRegulation No.448/98. According to the new calculations these services can be shown not only as intermediateconsumption by users, but also as final consumption and export (import)
As a result of the cooperation with NBRM, and on the basis of the available data provided by NBRM, thefinancial intermediation services indirectly measured have been calculated and allocated to sectors and users, inaccordance with the EU Regulations that were mentioned above. The calculation refers to 2008, while the data for2007 and 2006 have been revised according to the new calculation.
The calculation of FISIM is based on the following main items: the reference interest rate (Internal andExternal Reference Rate); the average stock of deposits and loans and the accrued interest rate by sectors andusers of those services.
The allocation of the part of FISIM as an intermediate consumption by activities has been done according tothe structure of gross output.
8 Statisti~ki pregled 3.4.10.01/649
The effect of the allocated FISIM in the Gross Domestic Product was 1,07% in 2006, 1,11% in 2007 and1,25% in 2008.
The calculation of FISIM does not refer to NBRM. Since 2006, the Gross output of NBRM has been calculatedas a sum of costs (Compensation of employees, Depreciation, Intermediate consumption, Other taxes on productionminus Other Subsidies on production). According to the Convention, the Gross output of NBRM has been allocatedin the intermediate consumption of the banks.
Final household consumption data are revised first of all as a result of the implementation of CommissionRegulation (EC) No 1889/2002 on the implementation of Council Regulation (EC) No 448/98 completing andamending Regulation (EC) No 2223/96 with respect to the allocation of financial intermediation services indirectlymeasured (FISIM) and with Commission Regulation (EC) No 1722/2005 on the principles for estimating dwellingservices for the purpose of Council Regulation (EC, Euratom) No 1287/2003 on the harmonisation of gross nationalincome at market prices.
A part of the total FISIM is for the first time allocated in Final household consumption, in COICOP, sub-group12.6 Financial services, having a 0.89% share in GDP in 2006, 0.87% in 2007 and 0.99% in 2008.
The allocation of FISIM in NPISHs and General government final consumption had an implication to thevalue of Final consumption.
The methodological improvements for calculating the imputed rents derived from the implementation of theRegulations mentioned above.
The impact of the FISIM allocation in imputed rents has implications to the changes of intermediateconsumption and also to the gross rent which is calculated by applying the user-cost method.
With the methodological improvements for imputed rents the annual rate of return of 2,5% was applied to thenet value of the stock of owner-occupied dwellings at current prices. As result of this improvement the data on netoperating surplus were changed when calculating imputed rents.
These methodological adjustments in accordance with the international standards affected the revision ofdata on Final household consumption, implicating changes of COICOP data, sub-group 4.2 Imputed rentals forhousing.
9Statistical review 3.4.10.01/649
METODOLO[KI OBJASNUVAWA
BRUTO-DOMA[EN PROIZVOD (PROIZVODEN METOD)Izvori na podatociteZa presmetkite na bruto-doma{niot proizvod se koristeni podatocite od godi{nite smetki {to
se prezemaat od Centralniot registar, podatocite od godi{nite statisti~ki istra`uvawa, odMinisterstvoto za finansii, od Upravata za javni prihodi i od drugi izvori.
Prika`uvawe na podatocite vo tabelitePodatocite za izvorite na dodadenata vrednost i tro{o~nata struktura na bruto-doma{niot
proizvod po proizvoden metod, po tekovni ceni, vo tabelite se prika`ani po sektori i po potsektori,spored klasifikacijata NKD Rev.1. Tie se presmetani na nivo na vkupna ekonomija, na nivo nainstitucionalni sektori i potsektori i spored goleminata na delovnite subjekti.
Podatocite po institucionalni sektori i po potsektori se definirani spored preporakite naSistemot na nacionalni smetki (SNS 93) i Evropskiot sistem na smetki (ESS 95 ), vo zavisnost odvidot na proizvodstvoto na institucionalnite edinici i vo zavisnost od nivnata glavna dejnost ifunkciite koi gi izvr{uvaat, a koi se zemaat kako pokazateli na nivnoto ekonomsko odnesuvawe, istotaka, zemaj}i go predvid i na~inot na upravuvawe.
Poradi zapazuvawe na principot na doverlivost na podatocite, vo tabelite kade {to tie seprika`uvaat po institucionalni sektori i po potsektori, za Finansiskiot sektor se dadeni podatocisamo na nivo na sektor. Za sektorot S.14 Doma}instva ne e napravena potsektorizacija bidej}i ne seraspolaga so dovolno podatoci za da se definiraat potsektorite. Spored ESS '95, za sektorot S.15Neprofitni institucii koi im slu`at na doma}instvata, ne se vr{i ras~lenuvawe na potsektori.
Raspredeluvawe na delovnite subjekti spored goleminataRaspredeluvaweto na delovnite subjekti na golemi, sredni, mali i mikro e izvr{eno vo
soglasnost so kriteriumite od ~len 469 stav 4 i ~len 470 od Zakonot za trgovski dru{tva ("Sl. vesnikna RM" br. 50/2001, 84/2005).
Mikro subjekt se smeta subjektot koj vo sekoja od poslednite dve presmetkovni godini, odnosnovo prvata godina od raboteweto, gi zadovolil slednite dva kriteriuma:
- prose~niot broj na vrabotenite, vrz osnova na ~asovi na rabota, da e do 10 rabotnici;- bruto-prihodot {to go ostvaril subjektot od koj bilo izvor da ne nadminuva 50.000 evra vo
denarska protivvrednost.Mal subjekt se smeta subjektot koj vo sekoja od poslednite dve presmetkovni godini, odnosno vo
prvata godina od raboteweto, zadovolil najmalku dva od mo`nite tri sledni kriteriumi:- prose~niot broj na vrabotenite, vrz osnova na ~asovi na rabota, da e do 50 rabotnici;- godi{niot prihod da e pomal od 2.000.000 evra vo denarska protivvrednost, a vkupniot obrt da
e pomal od 2.000.000 evra vo denarska protivvrednost;- prose~nata vrednost (na po~etokot i na krajot na presmetkovnata godina) na vkupnite sredstva
vo aktivata da e pomala od 2.000.000 evra vo denarska protivvrednost.Sreden subjekt se smeta subjektot koj vo sekoja od poslednite dve presmetkovni godini, odnosno
vo prvata godina od raboteweto, zadovolil najmalku dva od mo`nite tri sledni kriteriumi:- prose~niot broj na vraboteni, vrz osnova na ~asovi na rabota, da e do 250 rabotnici;- godi{niot prihod da e pomal od 10.000.000 evra vo denarska protivvrednost;- prose~nata vrednost (na po~etokot i na krajot na presmetkovnata godina) na vkupnite sredstva
vo aktivata da e pomala od 11.000.000 evra vo denarska protivvrednost.Subjektite koi ne se raspredeluvaat vo mali ili sredni subjekti, steknuvaat status na golemi
subjekti.
Golemi subjekti, bez ogled na kriteriumite od ovoj ~len, se: Narodnata banka na RepublikaMakedonija, bankite i drugite finansiski organizacii, osiguritelnite i reosiguritelnite organizacii,dr`avnite organi i organizacii i fondovite i subjektite koi sostavuvaat konsolidirani godi{nismetki.
Definicii na osnovnite kategoriiBruto-doma{en proizvodBruto-doma{niot proizvod (BDP) po pazarni ceni e finalen proizvod na proizvodnata aktivnost
na rezidentnite proizvodni edinici i e zbir na bruto-dodadenata vrednost od oddelnite
10 Statisti~ki pregled 3.4.10.01/649
institucionalni sektori ili oddelnite dejnosti, po osnovni ceni, plus danokot na dodadena vrednosti carinite, minus subvenciite na proizvodi ({to ne se raspredeleni po dejnosti).
Dodadena vrednostBruto-dodadenata vrednost po osnovni ceni pretstavuva osnovna kategorija na bruto-doma{niot
proizvod i se definira kako razlika me|u bruto-vrednosta na proizvodstvoto i me|ufaznatapotro{uva~ka.
Bruto-vrednost na proizvodstvotoBruto-vrednost na proizvodstvoto pretstavuva vrednost na proizvedenite stoki i izvr{enite
uslugi vo tekot na edna godina, nezavisno dali tie vo celost se prodadeni ili del od niv e staven nazalihi.
Vrednosta na proizvodstvoto se sostoi od tri vida na proizvodstvo: pazarno proizvodstvo,proizvodstvo nameneto za sopstvena finalna upotreba i nepazarno proizvodstvo. Poradi specifi~niotkarakter na odredeni dejnosti, bruto-vrednosta na proizvodstvoto se definira na razli~en na~in.
Taka, na primer, vo trgovijata, bruto-vrednosta na proizvodstvoto pretstavuva razlika pome|uproda`nata i nabavnata vrednost na prodadenata trgovska stoka, odnosno bruto-vrednosta naproizvodstvoto e ednakva na bruto-mar`ata vo ovaa dejnost.
Kaj bankarsko-finansiskite institucii, bruto-vrednosta na proizvodstvoto e ednakva na zbirotod prihodite na bankata dobieni od vr{ewe na bankarski uslugi i presmetanata vrednost naimputiranite bankarski uslugi koi se dobieni kako razlika pome|u primenite i platenite kamati.
Kaj osiguritelnite dru{tva, bruto-vrednosta na proizvodstvoto e ednakva na vrednosta napresmetanite osiguritelni uslugi {to se presmetuvaat kako razlika pome|u prihodite od premii zaosiguruvawe i ostanatite nadomestoci za {teti od osiguruvaweto.
Kaj proizvoditelite na dr`avni uslugi i drugite nepazarni i neprofitni institucii, bruto-vrednosta na proizvodstvoto se presmetuva kako zbir na me|ufaznata potro{uva~ka, amortizacijata,sredstvata na vrabotenite i danocite na proizvodstvo. Poradi celta na nivnoto postoewe idejstvuvawe, proizvoditelite na nepazarni uslugi ne ostvaruvaat profit poradi {to, po definicija,neto-delovniot vi{ok e ednakov na nula.
Me|ufazna potro{uva~kaMe|ufaznata potro{uva~ka pretstavuva vrednost na proizvodite i pazarnite uslugi {to gi
upotrebuva proizvoditelot kako inputi vo procesot na proizvodstvo, isklu~uvaj}i ja potro{uva~katana fiksen kapital, t.e. amortizacijata, so cel da se proizvedat drugi proizvodi i uslugi. Ovaakategorija ja vklu~uva potro{uva~kata od tekovnite nabavki, potro{uva~kata od zalihite, kako ipotro{uva~kata na sopstvenite proizvodi i uslugi vo tekot na proizvodstveniot proces. Kajproizvoditelite na nepazarni uslugi, po definicija, vrednosta na me|ufaznata potro{uva~ka e ednakvana vrednosta na tekovnite nabavki. Me|ufaznata potro{uva~ka se sostoi od potro{uva~ka na surovini,materijali i energija, siten inventar, rabotna obleka i rezervni delovi, tro{oci za transport navrabotenite, avtorski honorari, dnevnici, tro{oci za odvoen `ivot i razni drugi pogodnosti {to gidobivaat vrabotenite, a koi se povrzani so vr{eweto na redovnata dejnost.
Sredstva na vraboteniteSredstvata na vrabotenite se definirani kako vkupen iznos na nadomestocite vo pari ili vo
natura, isplateni od strana na pretprijatieto na vrabotenite kako nadomestok za izvr{enata rabotavo tekot na presmetkovniot period. Tie vklu~uvaat neto-plata, personalen danok od plata, pridonesiod plata, nadomestoci za hrana, prevoz, terenski dodatok, regres za godi{en odmor i sli~ninadomestoci na vrabotenite.
Deloven vi{okDelovniot vi{ok e rezidualna golemina na dodadenata vrednost i se dobiva koga dodadenata
vrednost }e se namali za amortizacijata, sredstvata na vrabotenite i danocite na proizvodstvo.Delovniot vi{ok mo`e da se presmeta vo bruto-iznos, dokolku ja sodr`i amortizacijata, i kako neto-iznos, dokolku e isklu~ena amortizacijata.
Delovniot vi{ok (dohodot na samostojnite vr{iteli na dejnost i individualnite zemjodelskiproizvoditeli) pretstavuva razlika pome|u dodadenata vrednost i neto-indirektnite danoci isredstvata na vrabotenite vo sektorot Doma}instva. Bidej}i kaj samostojnite vr{iteli na dejnost iindividualnite zemjodelski proizvoditeli postojat pote{kotii vo razgrani~uvaweto na platite nasopstvenikot i ~lenovite na negovoto semejstvo od ostvareniot vi{ok, ovaa kategorija, za razlika oddelovniot vi{ok na pretprijatijata, gi sodr`i i platite na sopstvenicite.
Amortizacija - potro{uva~ka na fiksen kapitalPotro{uva~kata na fiksniot kapital vo eden presmetkoven period se definira kako opa|awe
na tekovnata vrednost na osnovnite sredstva na proizvoditelite, predizvikano od fizi~ko tro{ewe,normalno zastaruvawe i o{tetuvawe vo nesre}ni slu~ai. Pri presmetkata na bruto-doma{niot
11Statistical review 3.4.10.01/649
proizvod, vrednosta na amortizacijata e presmetana vrz osnova na podatocite od godi{nite presmetkina pravnite subjekti, a za sektorot Doma}instva, vrednosta na amortizacijata e proceneta.
Vraboteni i samovraboteniVkupnata vrabotenost e izrazena spored konceptot na SNS 93 i ESS 95 i gi opfa}a site lica,
i vraboteni i samovraboteni, anga`irani vo oddelni proizvodni aktivnosti koi pripa|aat naproizvodnata granica na sistemot.
Vo kategorijata vraboteni vleguvaat site lica koi vrz osnova na dogovor rabotat za drugarezidentna institucionalna edinica i dobivaat nadomest registriran vo nacionalnite smetki kakosredstva na vrabotenite. Vrz osnova na ovaa definicija, vkupniot broj na vraboteni vo nacionalnitesmetki gi vklu~uva vrabotenite spored godi{nite presmetki na site registrirani pravni lica, iodreden broj na lica koi ne se registrirani, a nivniot broj e procenet vrz osnova na Anketata zarabotnata sila.
Samovrabotenite se definirani kako lica koi se samostojni sopstvenici ili partnerivo nekorporativni pretprijatija.
Vrz osnova na ovaa definicija, vo kategorijata samovraboteni se vklu~eni: procenetiot brojsamostojni vr{iteli na dejnost, dobien vrz osnova na godi{nite presmetki, vrz osnova na podatociteod Upravata za javni prihodi, brojot na individualnite zemjodelski proizvoditeli koi pla}aatpridones za penzisko osiguruvawe, spored podatocite na Fondot za penzisko i invalidsko osiguruvawe,kako i odreden broj na lica koi nemaat oficijalno registrirana dejnost, a se proceneti vrz osnova naAnketata za rabotnata sila.
Definicii na institucionalnite sektoriSektorot Nefinansiski pretprijatija (S.11) go so~inuvaat site institucionalni edinici koi
postojat kako nezavisni pravni lica koi se pazarni proizvoditeli i ~ija osnovna dejnost e proizvodstvona stoki i nefinansiski uslugi nameneti za pazar.
Sektorot Finansiski pretprijatija (S.12) go so~inuvaat site pretprijatija koi glavno sezanimavaat so finansisko posreduvawe ili so dopolnitelni finansiski aktivnosti koi se povrzaniso finansisko posreduvawe.
Sektorot Dr`ava (S.13) gi vklu~uva site institucionalni edinici koi se nepazarniproizvoditeli, ~ie proizvodstvo e nameneto za individualna i kolektivna potro{uva~ka i vo najgolemdel se finansiraat od zadol`itelni javni dava~ki od institucionalnite edinici od drugite sektori.Dokolku pove}e od 50% od tro{ocite na proizvodstvoto se pokrivaat so prihodite od proda`ba, ainstitucionalnata edinica se kontrolira i finansira od strana na organite na centralnata ili nalokalnata vlast, toga{ institucionalnata edinica e nepazaren proizvoditel i pripa|a na sektorotDr`ava.
Sektorot Doma}instva (S.14) se sostoi od site rezidentni doma}instva definirani kakoinstitucionalni edinici. Ovoj Sektor gi vklu~uva neinkorporiranite pretprijatija i individualnitezemjodelski proizvoditeli koi se javuvaat i vo funkcija na proizvoditel i vo funkcija na potro{uva~.
Sektorot Neprofitni institucii koi im slu`at na doma}instvata (S15) gi vklu~uva rezidentniteinstitucionalni edinici koi obezbeduvaat stoki i uslugi za nivnite ~lenovi i za ~lenovite na drugidoma}instva, besplatno ili po ceni koi ne se so ekonomsko zna~ewe.
Nivni glavni izvori na finansirawe se dobrovolnite pridonesi, ~lenarinite, transferite oddr`avniot buxet i dohodot od sopstvenost.
Korekcii za postignuvawe na seopfatnost na BDPPri presmetkata na BDP po proizvoden metod se vr{at korekcii na podatocite dobieni od razni
izvori so cel opfa}awe na del od neopfatenata ekonomija. Terminot “neopfatena ekonomija“ seodnesuva na aktivnosti koi vo soglasnost so metodologijata ESS 95 se vo proizvodstvenata granica,no koi delumno ili celosno ne se vklu~eni vo presmetkite na BDP zatoa {to tie se nerealno prika`aniili ne se opfateni so statisti~ki ili administrativni izvori na koi se baziraat nacionalnite smetki.
Mereweto na neopfatenata ekonomija vklu~uva identifikuvawe na pri~inite za neopfatnost,poradi {to se prezemaat dopolnitelni analizi so cel podobruvawe na seopfatnosta na procenite zaBDP. Identifikuvaweto i kvantificiraweto na razli~nite vidovi ili pri~ini za neopfatnost eizvr{eno vo soglasnost so Prira~nikot na OECD za neopfatenata ekonomija i tabelarniot priodrazvien od Evropskata statistika (Eurostat Tabular Approach).
Standardnite metodi za postignuvawe na seopfatnosta se primeneti za serijata na podatoci zaperiodot 1997-2007 godina so koristewe na prethodnite T1-T8 tabeli spored tabelarniot priod naEurostat (Pilot-proekt za seopfatnost 1998-2000).
Procenite za seopfatnosta za 2007 i 2008 godina se napraveni vrz osnova na revidiraniottabelaren priod na Eurostat, tabeli N1-N7 (Pilot-proekt za seopfatnost 2002-2003), za slednitetipovi na neopfatenata ekonomija:
12 Statisti~ki pregled 3.4.10.01/649
N1 Subjekti vklu~eni vo legalni aktivnosti koi izbegnuvaat da se registriraat za da giizbegnat zadol`itelnite pla}awa na danocite i socijalnite pridonesi;
N2 Subjekti koi izbegnuvaat da se registriraat bidej}i se vklu~eni vo ilegalni aktivnosti;N3 Subjekti koi ne se obvrzani da se registriraat bidej}i nemaat pazarno proizvodstvo. Toa se
nepazarni doma}instva, proizvoditeli na stoki za sopstvena potro{uva~ka ili za sopstvenainvesticija za izgradba i rekonstrukcija na stanovi;
N4 Registrirani legalni entiteti koi ne se vklu~eni vo statistikata poradi razli~ni pri~ini(na primer, nea`uriran statisti~ki registar ili procedurata za a`urirawe e nesoodvetna);
N5 Registrirani fizi~ki lica koi ne mora da se vklu~eni vo statistikata poradi pove}e pri~ini(na primer, registriranite fizi~ki lica dobieni od administrativnite izvori ne mora sekoga{ dabidat vklu~eni vo statisti~kiot deloven registar);
N6 Nerealno prika`uvawe na podatocite vo godi{nite smetki so cel izbegnuvawe na pla}awetona danokot na dobivka, DDV ili socijalnite pridonesi. Nerealnoto prika`uvawe voobi~aeno vklu~uvapostoewe na dva seta na godi{ni smetki, pla}awe na plati vo gotovo koi se iska`uvaat vo me|ufaznatapotro{uva~ka, izbegnuvawe na pla}aweto na DDV i sl.
N7 Statisti~ki nedostatok na podatoci.Pri presmetkite na bruto-doma{niot proizvod izvr{eni se korekcii za slednite tipovi na
neopfatenata ekonomija i toa: N, N3, N5, N6 i N7.Korekciite se napraveni poradi prikrivawe na vrednosta na proda`bata, precenuvawe na
me|ufaznata potro{uva~ka, prikrivawe na vistinskata vrednost na isplatenite plati poradi evazijana danokot na dodadena vrednost, danokot na dobivka, personalniot danok i pridonesite za socijalnoosiguruvawe. Za procena na nerealno prika`anite plati se sporeduvaat podatocite za neto-platiteod godi{nite smetki so podatocite od istra`uvaweto za prose~nite plati i vrabotenosta
Zaradi izbegnuvawe na danokot na dodadena vrednost, trgovskite pretprijatija izbegnuvaat dagi registriraat proda`bite vo smetkovodstvoto. Poradi toa, registriranata proda`ba vo godi{nitesmetki e nerealno prika`ana. Korekcijata na proda`bata na trgovskite stoki se bazira na vkupnataponuda i upotreba na stoki koi pominuvaat niz trgovskite kanali. Na vrednosta na proda`bite seprimenuva soodvetna trgovska mar`a. Razlikata pome|u dobienata bruto-vrednost za trgovijata ipresmetanata od godi{nite smetki e vrednost na korekcijata.
Procenata na vrednosta na proizvodstvoto koe se odnesuva na gradeweto na ku}i i drugi objektivo privatna sopstvenost, se vr{i vrz baza na podatocite od Oddelenieto za grade`ni{tvo.
Korekcijata za neregistriranite vraboteni se vr{i vrz osnova na sporedbata na podatocite zaregistriraniot broj na vraboteni od godi{nite smetki so onie dobieni od Anketata za rabotnata sila.
Procenata na neregistriranite samovraboteni i vraboteni lica e vrz osnova na analizata nadobienite relevantni podatoci za sektorot Doma}instva, od razni izvori, i analizata na podatocite{to proizleguvaat od Anketata za rabotnata sila, koi se smetaat za porelevantni na povisoko nivo.
Kako rezultat na korigiraniot broj na vrabotenite, bruto-vrednosta na proizvodstvoto ikorekciite na ma|ufaznata potro{uva~ka, se vr{at korekcii na dodadenata vrednost.
Procenite za postignuvawe na seopfatnost na BDP se vr{at na delovnite subjekti od sektorotNefinansiski pretprijatija, sektorot Doma}instva i sektorot Dr`ava.
Godi{na presmetka na BDP spored proizvodniot metod, po postojani ceniPri presmetkite na BDP po postojani ceni, sekoja godina se menuva baznata godina, odnosno
sekoja prethodna godina se koristi kako bazna godina.Vo ramkite na presmetkite na BDP po postojani ceni, vo osnova se koristat slednite metodi:
metodot na edine~na ekstrapolacija, metodot na dvojna ekstrapolacija i metodot na edine~nadeflacija.
Kaj metodite na edine~na i dvojna ekstrapolacija, del od indeksite na fizi~kiot obem koi sekoristat se presmetani od baznite statistiki, dodeka eden del od niv se presmetuvaat vo soodvetnotooddelenie vo Sektorot za nacionalni smetki.
Pri koristewe na metodot na deflacija se koristat soodvetnite indeksi na ceni.Vo nekoi od ekonomskite aktivnosti se koristi indeksot na vrabotenite kako indikator za tie
dejnosti.
BRUTO-DOMA[EN PROIZVOD (RASHODEN METOD)
Presmetka na BDP spored rashodniot metod, po tekovni ceniIzvori i metodi za pribirawe na podatocite
13Statistical review 3.4.10.01/649
Glavnite izvori na podatoci koi se koristat za presmetka na tro{o~nite agregati na BDP, mo`eda se klasificiraat vo slednite grupi:
- statisti~ki istra`uvawa koi gi sproveduva Dr`avniot zavod za statistika;- administrativni izvori na podatoci;- podatoci od Narodnata banka na Republika Makedonija;- podatoci od Ministerstvoto za finansii.Definicii na osnovnite kategoriiBruto-doma{niot proizvod spored rashodniot metod ja prika`uva finalnata upotreba, t.e.
potro{uva~kata na finalni proizvodi i uslugi proizvedeni vo doma{nata ekonomija za finalnapotro{uva~ka, bruto-investiciite i neto-izvozot na stoki i na uslugi.
Bruto-doma{en proizvod = Finalna potro{uva~ka + bruto-investicii + izvoz - uvoz.Tro{oci za finalna potro{uva~kaTro{ocite za finalna potro{uva~ka se sostaveni od tro{oci koi gi pravat rezidentnite
institucionalni edinici za stoki i za uslugi koi se upotrebuvaat za direktno zadovoluvawe na li~nitepotrebi ili ̀ elbi, kako i na kolektivnite potrebi na ~lenovite na zaednicata. Tro{ocite za finalnapotro{uva~ka mo`e da se napravat na doma{na teritorija ili vo stranstvo.
Finalna potro{uva~ka= Finalna potro{uva~ka na doma}instvata + finalna potro{uva~ka na NPISD + finalna
potro{uva~ka na dr`avata.Tro{ocite za finalna potro{uva~ka na doma}instvata pretstavuvaat nabavka ili steknuvawe
na stoki i na uslugi od strana na doma}instvoto za zadovoluvawe na potrebite na ~lenovite na toadoma}instvo. Finalnata potro{uva~ka na doma}instvata e presmetana za rezidentnite doma}instvai pretstavuva finalna potro{uva~ka na doma}instvata spored nacionalniot koncept, prilagodenakon direktnite nabavki na rezidentnite doma}instva vo stranstvo i direktnite nabavki nanerezidentnite doma}instva na doma{niot pazar.
Pri presmetkite na finalnata potro{uva~ka na doma}instvata se koristi Me|unarodnataklasifikacija na proizvodi i na uslugi COICOP - Klasifikacija na individualnata potro{uva~kaspored namenata.
Kako izvori na podatocite pri presmetkata se koristat podatocite od statisti~kotoistra`uvawe Anketa za potro{uva~kata na doma}instvata, od godi{nite finansiski smetki naproizvoditelite na uslugi od oblasta na obrazovanieto, zdravstvoto, socijalnata za{tita, podatociod Narodnata banka na Republika Makedonija, od drugi statisti~ki istra`uvawa {to se sproveduvaatvo Dr`avniot zavod za statistika, od interni dokumentacii na golem broj pretprijatija i sl.
Tro{ocite za finalna potro{uva~ka na dr`avata se sostaveni od tro{oci, vklu~uvaj}i giimputiranite tro{oci na dr`avata vkupno, i toa kako za individualnata potro{uva~ka na proizvodii na uslugi, taka i za zaedni~kata potro{uva~ka na uslugi.
Ovie tro{oci mo`e da se podelat na:- tro{oci na dr`avata za individualna finalna potro{uva~ka na stoki i na uslugi;- tro{oci na dr`avata za zaedni~ka potro{uva~ka na uslugi.Tro{ocite za individualna potro{uva~ka na stoki i na uslugi gi sodr`at pla}awata za
nepazarnite dr`avni uslugi (obrazovanie, zdravstvo, socijalna za{tita i sl.) i pazarnite proizvodii uslugi (farmacevtski i terapevtski proizvodi i sl.).
Tro{ocite na dr`avata za zaedni~ka potro{uva~ka na uslugi gi sodr`at tro{ocite zaadministracija, odbrana, ekonomski, razvojno-istra`uva~ki i drugi nepazarni dr`avni uslugi.
Tro{ocite za finalna potro{uva~ka na neprofitnite institucii koi im slu`at nadoma}instvata se sostaveni od tro{oci, vklu~uvaj}i gi imputiranite tro{oci na rezidentnite NPISDza individualna potro{uva~ka na proizvodi i na uslugi.
Bruto-investicii
Investicii vo osnovni sredstvaInvesticiite vo osnovni sredstva se merat preku vkupnata vrednost na nabavenite minus
otu|enite osnovni sredstva od proizvoditelot vo tekot na presmetkovniot period, plus nekoiunapreduvawa na vrednosta na neproizvedenite sredstva realizirani preku proizvodnata aktivnostna institucionalnata edinica.
Za presmetka na investiciite vo ma{ini i oprema se upotrebuva metodot na stokovni tekovi.Ovoj metod koristi podatoci od nadvore{nata trgovija (uvozot i izvozot na ma{ini i na oprema) ipodatoci od doma{noto industrisko proizvodstvo. Podatocite za investiciite od grade`ni{tvoto,
14 Statisti~ki pregled 3.4.10.01/649
kako i podatocite za drugi investicii koi gi opfa}aat investiciite {to imaat nematerijalen karakter,se prezemeni od statisti~koto istra`uvawe {to go sproveduva Dr`avniot zavod za statistika.
Promena na zalihitePromenata na zalihite pretstavuva vrednost na vlezot na site obrtni sredstva vo zalihi minus
vrednosta na izlezot na tie sredstva i vrednosta na site periodi~ni zagubi na stoki {to se ~uvaat vozalihi. Proizvodite koi se vnesuvaat i iznesuvaat od zalihite implicitno se tretiraat kako da seprodadeni ili nabaveni od zalihi i se vrednuvaat spored istite ceni kako i fakti~kite proda`biili nabavki {to se pravat vo istoto toa vreme.
Izvoz na stoki i na uslugiIzvozot na stoki i na uslugi pretstavuva proda`ba, barter ili podaroci na stoki i na uslugi
od rezidenti na nerezidenti.Uvoz na stoki i na uslugiUvozot na stoki i na uslugi pretstavuva nabavka, barter ili podaroci na stoki i na uslugi na
rezidenti od nerezidenti.Izvozot i uvozot na stoki se vrednuvani po principot FOB.Nabavki na nerezidentite vo zemjataNabavkite na nerezidentite vo zemjata gi opfa}aat nabavkite od strana na me|unarodnite
organizacii, ambasadite i diplomatskite pretstavni{tva, kako i turisti~kite nabavki od strana nanerezidentite. Nerezidentnata potro{uva~ka se presmetuva vrz baza na Anketata za nerezidentnatapotro{uva~ka {to ja sproveduva Dr`avniot zavod za statistika. Vrednosta ja pretstavuva razlikatame|u uslugite od prilivot na turizmot vo bilansot na pla}awe i presmetkite napraveni vo Dr`avniotzavod za statistika.
Presmetka na BDP spored rashodniot metod, po postojani ceniPresmetkite za agregatite na upotrebata na bruto-doma{niot proizvod (finalna potro{uva~ka,
bruto-investicii, izvoz i uvoz na stoki i na uslugi), po postojani ceni, se napraveni so metod nadeflacija i pritoa se koristeni soodvetni deflatori (cenovni indeksi) za sekoj od agregatite naupotrebata na bruto-doma{niot proizvod.
So cel da se usoglasat presmetkite na javnata potro{uva~ka po postojani ceni so del od oddelitekoi vleguvaat vo presmetkite na BDP spored proizvodniot metod, po postojani ceni, kaj presmetkatana javnata potro{uva~ka, pokraj metodot na deflacija, se koristi i metodot na ekstrapolacija.
Od taka deflacioniranite vrednosti na agregatite na upotrebata na BDP, presmetani sporedrashodniot metod, se presmetuvaat volumenskite indeksi koi se koristat za ekstrapolacija navrednostite na tro{o~nite agregati od soodvetnata referentna godina.
15Statistical review 3.4.10.01/649
NOTES ON METHODOLOGY
GROSS DOMESTIC PRODUCT (PRODUCTION APPROACH)Data sourceData sources used for GDP calculations are the annual financial reports from the Central Register, data
from the annual statistical surveys, data from the Ministry of Finance, the Public Revenue Office and other sources.
Data presentationData for the sources of Value Added and the cost structure of the GDP by production approach and at
current prices are shown in the tables by sections and subsections according to the NACE Rev.1 classification.Calculations are made at the level of the whole economy, at the level of institutional sectors and subsectors andby the size of the enterprises.
Institutional sectors and subsectors are defined according to the recommendations in SNA’93 and ESA’95,depending on the kind of production, on their main activity and their functions, which are an indicator of theireconomic behavior, keeping also in mind the manner of managing the enterprises.
Because of data confidentiality, the data for the Financial Sector in the tables by institutional sectors andsubsectors are shown only at the sector level. Subsectorization for the Sector S.14 Households is not madebecause the subsectors cannot be defined due to lack of data. Sector S.15 Non-profit Institutions ServingHouseholds, according to ESA’95, cannot be divided into subsectors.
Classification of enterprises according to their sizeThe enterprises, according to the criteria laid down in article 469 paragraph 4 and article 470 of the Trade
Company Law, are classified into large, medium, small-scale and micro enterprises.Micro-sized enterprise is the enterprise which has met the following two criteria in each of the last two
accounting years or in the first year of business activity:- The average number of employees, based on the working hours, is not more than 10 employees;- The annual revenue is less than 50000 Euros in Denar counter-value;Small-sized enterprise is the enterprise which has met at least two of the following three criteria in each of
the last two accounting years or in the first year of business activity:- The average number of employees, based on the working hours, is not more than 50 employees;- The annual revenue is less than 2 million Euros in Denar counter-value, and the total turnover is less than
2 million Euros in Denar counter-value;- The average value (at the beginning and at the end of the accounting year) of the total fixed assets is less
than 2 million Euros in Denar counter-value.Medium-sized enterprise is the enterprise which has met at least two of the following three criteria in each
of the last two accounting years or in the first year of business activity:- The average number of employees, based on the working hours, is not more than 250 employees;- The annual revenue is less than 10 million Euros in Denar counter-value;- The average value (at the beginning and at the end of the accounting year) of the total fixed assets is less
than 11 million Euros in Denar counter-value.The enterprises, which are not classified as small and medium-sized enterprises, acquire the status of
large-sized enterprises.Large enterprises, regardless of the criteria from this article, are also: The National Bank of the Republic
of Macedonia, banks and other financial enterprises and insurance companies, state bodies and organizationsand funds and enterprises which compile consolidated annual accounts.
Definitions of the basic categoriesGross domestic productGross domestic product (GDP) at market prices is the final result of the production activity of the resident
producer units and it is the sum of gross value added of the various institutional sectors or the various activities atbasic prices plus value added, import duties less subsidies on products (which are not allocated to sectors andactivities).
Value addedGross Value added at basic prices is the basic category of GDP. It represents the balance between gross
output and intermediate consumption.Gross outputGross output is considered to be the value of goods and services produced in the course of one year,
regardless of whether or not the whole quantity is sold or partially added to stocks. It consists of three kinds of
16 Statisti~ki pregled 3.4.10.01/649
output: market output, market output for own use and non-market output. Due to the specifics of some activities,various definitions of gross output exist.
For example, in trade, gross output is defined as a balance between sales value and purchase value ofmerchandise sold i.e. the gross output value is equal to trade gross margin.
Concerning banks and other financial institutions, gross output is considered to be the sum of bankingincome earned by performing banking services and calculated value of imputed banking services, computed onthe other hand as a balance between interest receivable and payable.
Insurance companies calculate gross output as a balance between income of insurance premiums andother damage compensations i.e. it is equal to the value of calculated insurance services.
For the Government and other non-market and non-profit istitutions, gross output is calculated as a sum ofintermediate consumption, depreciation, compensations to employees and taxes on production. Because theseorganizations and institutions do not make profit, their net operating surplus is always zero.
Intermediate consumptionIntermediate consumption is considered to be the value of products and market services, which the producer
uses as inputs in the production process, excluding fixed capital consumption i.e. depreciation, in order to produceother products and services. This category includes consumption of current purchases, stock consumption aswell as consumption of own products and services in the production process. For non-market service producers,the value of intermediate consumption is equal to the value of current purchases. Therefore, intermediateconsumption includes the use of raw materials, energy, office supplies, spare parts, transport costs of employees,daily allowances, separate life, contract payments and other benefits received by the employees, and which areconnected with the performing of a regular economic activity.
Compensations of employeesCompensations of employees are defined as total amount of compensations paid out in cash or in kind
from enterprise to employees for the work done during the year.This amount includes wages and salaries, allowances added to salaries, social contributions, taxes on
salaries as well as all compensations for food, transport, accommodation, vacation, etc.
Operating surplusOperating surplus is the residual component of the value added. It represents value added reduced for the
amount of depreciation, compensations of employees and taxes on production. Operating surplus can be calculatedin gross value if it includes depreciation or as net value if the depreciation is excluded.
Operating surplus for the household sector (mixed income) is obtained by subtracting net indirect taxesand compensations of the value added. Because it is difficult to separate salaries of self-employed persons,individual agricultural producers and members of their family from the surplus achieved, this category containsthe owner’s salaries too.
Depreciation-consumption of fixed capitalConsumption of fixed capital during the accounting period is defined as a decrease of current value of
producer’s fixed assets due to the physical use, obsolescence and accidental damages. When calculating GDP,the depreciation value is calculated based on the data from the annual reports of legal entities. For the calculationof gross rents and value added of unincorporated enterprises, the value of depreciation is estimated.
Employees and self-employedTotal employment in accordance with the SNA93 and ESA95 methodologies covers all persons - both
employees and self-employed - engaged in some productive activity that falls within the production boundary ofthe system.
Employees - are defined as all persons who, by agreement, work for another resident institutional unit andreceive remuneration.
In accordance with the National Accounts concepts the total number of employees covers the number ofemployees from the annual financial reports, and the adjusted number of non-registered employees using LabourForce Survey data.
Self-employed are defined as persons who are the sole owners, or joint owners, of the unincorporatedenterprises where they work. In accordance with the National Accounts concepts, the total number of self-employedpersons covers the adjusted number of self-employed from the annual financial reports, the number of self-
17Statistical review 3.4.10.01/649
employed obtained from the Public Revenue Office, the number of individual agricultural producers that paycontributions to the Pension and Disability Insurance Fund and the adjusted number of non-registered employeesusing Labour Force Survey data.
Definitions of the institutional sectorsThe sector Non-Financial Corporations (S.11) consists of institutional units which are market producers
and whose principal activity is the production of goods and non-financial services.The sector Financial Corporations (S.12) consists of all corporations which are principally engaged in
financial intermediation and /or in auxiliary financial activities.The sector General Government (S.13) includes all institutional units, which are other non-market producers,
whose output is intended for individual or collective consumption, and mainly financed by compulsory paymentsmade by units belonging to other sectors. The institutional unit also belongs to the Government sector eventhough the income covers more then 50% of costs of production but the institutional unit is controlled by generalor local government.
The Household sector (S.14) consists of all resident households that are defined as institutional units. Thissector includes unincorporated enterprises and individual agricultural producers that are producers and consumersat the same time.
The sector Non-Profit Institutions Serving Households (S.15) consists of non-profit institutional units thatserve households free of charge or at prices that are not economically significant. Their principal resources arevoluntary contributions, membership fees, payments as a transfer made by general government, and from propertyincome.
GDP exhaustiveness adjustments When calculating GDP by production method, exhaustiveness adjustments are made to the data obtained
from various sources in order a part of the non-observed economy to be covered. The term “non-observedeconomy” refers to activities that are within the production boundary defined by the ESA 95 but which are omitted,either partially or completely, from the estimates of GDP because they are under-reported or not covered by thestatistical surveys or administrative records from which the national accounts are constructed.
Measuring the non-observed economy also involves identifying the cause of non-measurement so thatremedial action can be taken to improve the exhaustiveness of the GDP estimates. Identifying and quantifying thevarious types – or causes - of non-exhaustiveness is done in accordance with the OECD Handbook for measuringthe non-observed economy and Eurostat’s tabular approach to exhaustiveness.
Standard methods for achieving exhaustiveness are applied for the series of data from 1997 to 2007 usingthe previous T1-T8 tables according to Eurostat’s tabular approach to exhaustiveness (Pilot project onexhaustiveness, 1998-2000).
The estimations for exhaustiveness for 2007 and 2008 are made on the basis of the revised Eurostattabular approach to exhaustiveness, tables from N1 to N7 (Pilot project on exhaustiveness, 2002-2003), for thefollowing types of non-observed economy:
N1 - Producer deliberately non - registering activities;Producers engaged in legal activities that fail to register in order to avoid tax and social security obligations.
N2 - Producer deliberately not registering - illegal;Producers who avoid registration because they are engaged in illegal activities
N3 - Producer not required to register;Producers not required to register because they have no market output. Typically, these are non-market
household producers involved in: production of goods for own consumption or for own fixed capital formationand construction of and repairs to dwellings.
N4 - Legal persons not surveyed;Registered legal entities may not be included in the statistics for a variety of reasons. For example, the
business register is out-of-date or updating procedures are inadequate;N5 - Registered entrepreneurs not surveyed;
Registered entrepreneurs may not be included in the statistics for a number of reasons. For example,the administrative sources registering entrepreneurs may not always pass on complete or up-to-date lists tothe statistical office.
N6 - Producers deliberately misreporting;Mis-reporting invariably means that gross output is under-reported and intermediate consumption is
over-reported in order to evade (or reduce) income tax, value added tax or social security contributions.Mis-reporting often involves: the maintenance of two sets of books; payments of wages and salaries in
cash, which are recorded as intermediate consumption; payments in cash without receipts; and VAT fraud.
18 Statisti~ki pregled 3.4.10.01/649
N7 - Other statistical deficiencies;N7a - data that is incomplete, not collected or not directly collectable, andN7b - data that is incorrectly handled, processed or compiled by statisticians.
In GDP calculations adjustments are made for the following types of non-observed economy: N1, N2, N3,N5, N6 and N7.
The adjustments are made due to hiding the real value of sale, overestimating of the intermediateconsumption, hiding the real value of allowed pays in order to avoid payment of turnover tax, import duties,personal taxes and employers’ social contributions. For assessment of the underreported wages, we comparethe data on net wages from the annual financial reports with the data from the Labour Department.
In order to avoid value added tax, trade enterprises avoid registration of their sales in the bookkeeping.Therefore, the registered sale in the financial reports is underreported. Adjustments of the sales of merchandiseare based on total supply and demand of goods, which pass through trade channels. On the value of adjustedsales an appropriate trade margin is applied. The difference between the derived gross output and gross outputfor trade activity calculated from the financial reports is the value of adjustment.
Estimating the output value regarding the construction of residential units and other facilities, performed onbuildings under private ownership, is based on the data from the Department of construction.
Adjustment for non-registered employees is made when analysing the data from the annual financial reportsand based on comparisons of the data on the registered number of employees from the annual financial reportsand the data on the number of employees from the Labour Force Sources (LFS).
Exhaustiveness adjustments when estimating data on unincorporated enterprises concerning the notregistered self-employed and employed persons are made on the basis of analysing the relevant data from theHousehold sector, from various sources, and by analysing LFS data for which it is assumed that are more reliableon the higher level.
Due to the adjusted number of employees and the output/intermediate consumption adjustments,adjustments are also made to value added.
Estimations for achieving exhaustiveness of GDP are done for business entities belonging to the sectorNon-Financial Corporations, the Household sector and the Government sector.
Calculations of GDP at annual level at constant prices according to the production approachIn the calculations of GDP at constant prices a movable base year is used, which means that each previous
year is a base year.Within the calculations of the data on GDP, the following methods are used: the method of single extrapolation
method of double extrapolation and the method of single deflation.In the method of single and double extrapolation, part of volume indices used are calculated from the
business statistics, while part of them are calculated in the appropriate division of the National Accounts Sector.
Corresponding price indices are used for the method of single deflations.In some economic activities employee’s indices are used as an indicator for those activities.
GROS DOMESTIC PRODUCT (EXPENDITURE APPROACH)
Calculation of GDP according to the expenditure approach at current prices
Sources and methods of data gatheringThe main data sources used for the calculation of GDP expenditure aggregates can be classified into the
folowing groups:Statistical surveys conducted in the State Statistical OfficeAdministrative data sourcesData from the National Bank of the Republic of MacedoniaData from the Ministry of FinanceDefinitions of the basic categoriesGross domestic product-expenditure methodThe expenditure method of GDP measures final uses categories, i.e. consumption of final goods and
services produced in the domestic economy, for final use, gross capital formation and net export of goods andservices.
GDP = Final consumption expenditure + gross investment + export - import
19Statistical review 3.4.10.01/649
Final consumption expenditureFinal consumption expenditure consists of expenditure incurred by resident institutional units on goods or
services that are used for the direct satisfaction of individual needs or wants or the collective needs of membersof the community. Final consumption expenditure may take place on the domestic territory or abroad.
Final consumption expenditure= Household final consumption + Final consumption of NPISHs + Government final consumptionFinal consumption expenditure of households is the procurement of goods and services by a household,
intended for satisfying the needs of the household members. Household final consumption is calculated for residenthouseholds and represents the final consumption of households according to the national concept. The consumptionis adjusted to direct procurement by resident households abroad and direct procurement by non-resident householdson the domestic market.
When calculating the Household final consumption expenditure the COICOP classification (Classificationof Individual consumption by purpose) is used.
Data sources are: the household budget survey, the annual financial accounts of educational, health careand social welfare services producers, data from the National Bank of the Republic of Macedonia, other statisticalsurveys that are conducted in the State Statistical Office and internal documents of a large number of enterprises.
Government final consumption expenditure consists of the expenditure, including imputed expenditure,incurred by general government on both individual consumption goods and services and collective consumptionservices.
This expenditure is divided into:- Government expenditure on individual consumption goods and services;- Government expenditure on collective consumption servicesIndividual government expenditure comprises payments for non-market government services (education,
health, social care, culture, sport etc.) and market goods and services (pharmaceutical and therapeutic productsetc.)
Collective government expenditure consists of expenditure on administrative, defense, economic, R&Dand other non-market government services.
Final consumption expenditure of Non-profit institutions serving households (NPISHs) consists ofthe expenditure, including imputed expenditure, incurred by resident NPISHs on individual consumption of goodsand services.
Gross capital formationGross fixed capital formationGross fixed capital formation is measured by the total value of producer acquisitions, less disposals of fixed
assets during the accounting period, plus certain additions to the value of non produced assets realized by theproductive activity of the institutional unit.
For calculation of the investments in machinery and equipment the commodity flow method is used. Thismethod uses data from foreign trade statistics (import and export of machinery and equipment) and domesticindustrial production. The data on construction investment, as well as the data on other investments were takenfrom the statistical survey conducted by the State Statistical Office.
Change in inventoriesChange in inventories is considered to be the value of total inventory inputted, reduced by the value of
discharged inventories and the value of all periodical losses of goods that are held in stock. Products that enter orleave inventories are implicitly treated as sold or procured from stocks and are valued according to the prices ofactual sales or purchases that take place at the same time.
Export of goods and servicesExport of goods and services means barter or gift of goods and services, by residents to non-residents.
Import of goods and servicesImports of goods and services are sale, barter or gift of goods and services, to residents by non-residents.Data on export of goods and import of goods are valuated by FOB principle.
20 Statisti~ki pregled 3.4.10.01/649
Non-resident purchasesNon-resident purchases in the country cover the purchases by international organizations, embassies
and diplomatic missions, and tourism purchases by non-residents. Non-resident consumption is calculated on thebasis of data from the Non-resident consumption survey that is conducted by the State Statistical Office. Datarepresent the difference between Balance of Payments data on tourism flows and the additional calculationsmade by the State Statistical Office.
Annual calculation of GDP according to the expenditure approach at constant prices
Calculations of Expenditure Aggregates of GDP (final consumption expenditure, gross capital formation,export-import of goods and services) at constant prices are made with the deflation method by using appropriatedeflators (prices indices), for each aggregate of gross domestic product use.
For general government consumption at constant prices, besides the method of deflation, the method ofextrapolation is used as well, in order to harmonize the calculations with the corresponding divisions of GDPcalculated by production method at constant prices.
The deflated values of the aggregate expenditures of the gross domestic product, calculated according tothe expenditure method, are used for calculation of the volume indices, which serve for extrapolation of the valuesof expenditure aggregates from the reference year.
21Statistical review 3.4.10.01/649
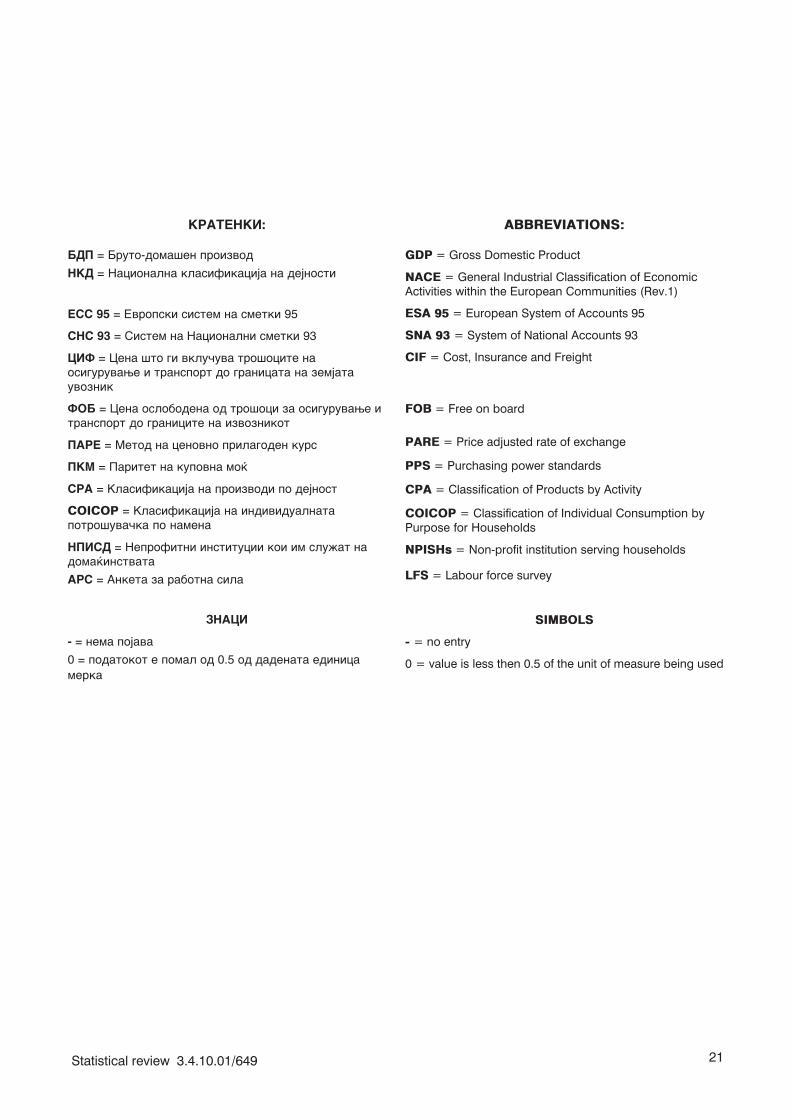
KRATENKI:
BDP = Bruto-doma{en proizvod
NKD = Nacionalna klasifikacija na dejnosti
ESS 95 = Evropski sistem na smetki 95
SNS 93 = Sistem na Nacionalni smetki 93
CIF = Cena {to gi vklu~uva tro{ocite naosiguruvawe i transport do granicata na zemjatauvoznik
FOB = Cena oslobodena od tro{oci za osiguruvawe itransport do granicite na izvoznikot
PARE = Metod na cenovno prilagoden kurs
PKM = Paritet na kupovna mo}
SRA = Klasifikacija na proizvodi po dejnost
COICOP = Klasifikacija na individualnatapotro{uva~ka po namena
NPISD = Neprofitni institucii koi im slu`at nadoma}instvata
ARS = Anketa za rabotna sila
ZNACI
- = nema pojava
0 = podatokot e pomal od 0.5 od dadenata edinicamerka
ABBREVIATIONS:
GDP = Gross Domestic Product
NACE = General Industrial Classification of EconomicActivities within the European Communities (Rev.1)
ESA 95 = European System of Accounts 95
SNA 93 = System of National Accounts 93
CIF = Cost, Insurance and Freight
FOB = Free on board
PARE = Price adjusted rate of exchange
PPS = Purchasing power standards
CPA = Classification of Products by Activity
COICOP = Classification of Individual Consumption byPurpose for Households
NPISHs = Non-profit institution serving households
LFS = Labour force survey
SIMBOLS
- = no entry
0 = value is less then 0.5 of the unit of measure being used

22 Statisti~ki pregled 3.4.10.01/649
23Statistical review 3.4.10.01/649
SERIJA M - Makroekonomski tabeli
SERIES M - Macroeconomic tables
24 Statisti~ki pregled 3.4.10.01/649
Makroekonomski tabeli Macroeconomic tables
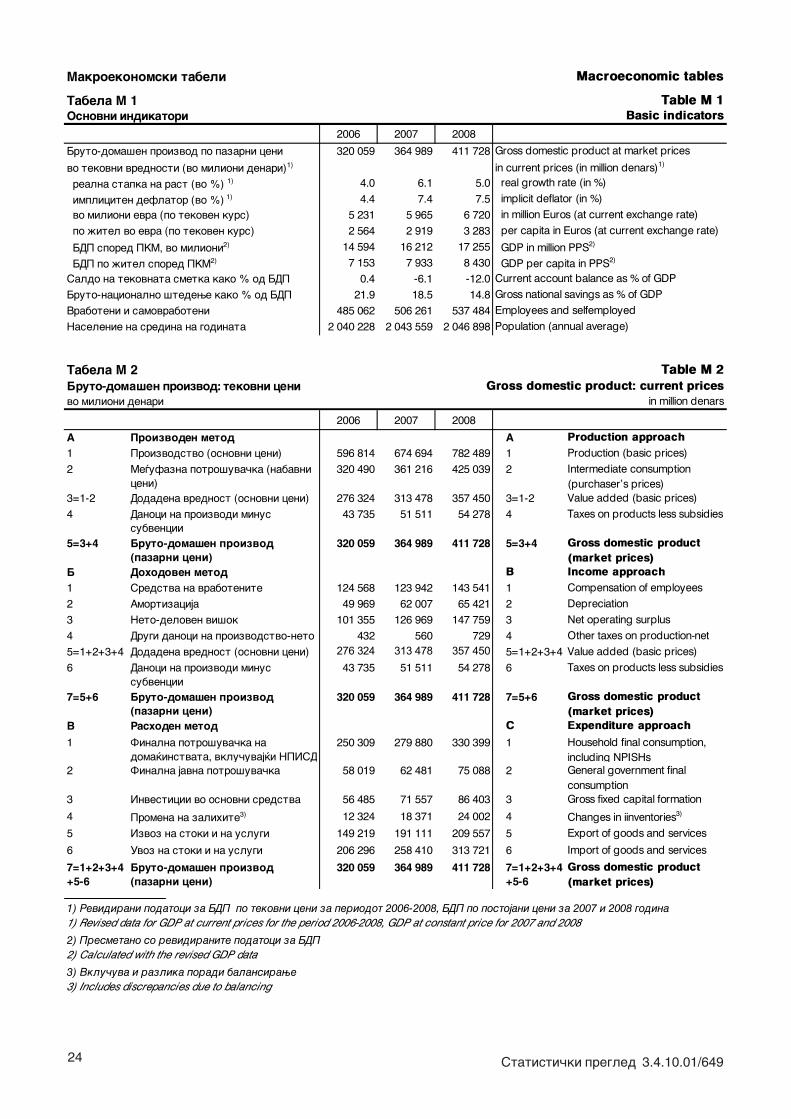
Tabela M 1 Table M 1Osnovni indikatori Basic indicators
2006 2007 2008
Bruto-doma{en proizvod po pazarni ceni 320 059 364 989 411 728
vo tekovni vrednosti (vo milioni denari)1)
realna stapka na rast (vo %) 1) 4.0 6.1 5.0 real growth rate (in %)
impliciten deflator (vo %) 1) 4.4 7.4 7.5 implicit deflator (in %)
vo milioni evra (po tekoven kurs) 5 231 5 965 6 720 in million Euros (at current exchange rate)
po `itel vo evra (po tekoven kurs) 2 564 2 919 3 283 per capita in Euros (at current exchange rate)
14 594 16 212 17 255
7 153 7 933 8 430
Saldo na tekovnata smetka kako % od BDP 0.4 -6.1 -12.0 Current account balance as % of GDP
Bruto-nacionalno {tedewe kako % od BDP 21.9 18.5 14.8 Gross national savings as % of GDP
Vraboteni i samovraboteni 485 062 506 261 537 484 Employees and selfemployed
Naselenie na sredina na godinata 2 040 228 2 043 559 2 046 898 Population (annual average)
Tabela M 2 Table M 2Bruto-doma{en proizvod: tekovni ceni Gross domestic product: current pricesvo milioni denari in million denars
2006 2007 2008
A Proizvoden metod A Production approach1 Proizvodstvo (osnovni ceni) 596 814 674 694 782 489 1 Production (basic prices)2 Me|ufazna potro{uva~ka (nabavni
ceni) 320 490 361 216 425 039 2 Intermediate consumption
(purchaser's prices)3=1-2 Dodadena vrednost (osnovni ceni) 276 324 313 478 357 450 3=1-2 Value added (basic prices)4 Danoci na proizvodi minus
subvencii 43 735 51 511 54 278 4 Taxes on products less subsidies
5=3+4 Bruto-doma{en proizvod (pazarni ceni)
320 059 364 989 411 728 5=3+4 Gross domestic product (market prices)
B Dohodoven metod B Income approach1 Sredstva na vrabotenite 124 568 123 942 143 541 1 Compensation of employees2 Amortizacija 49 969 62 007 65 421 2 Depreciation3 Neto-deloven vi{ok 101 355 126 969 147 759 3 Net operating surplus4 Drugi danoci na proizvodstvo-neto 432 560 729 4 Other taxes on production-net5=1+2+3+4 Dodadena vrednost (osnovni ceni) 276 324 313 478 357 450 5=1+2+3+4 Value added (basic prices)6 Danoci na proizvodi minus
subvencii 43 735 51 511 54 278 6 Taxes on products less subsidies
7=5+6 Bruto-doma{en proizvod (pazarni ceni)
320 059 364 989 411 728 7=5+6 Gross domestic product (market prices)
V Rashoden metod C Expenditure approach
1 Finalna potro{uva~ka na doma}instvata, vklu~uvaj}i NPISD
250 309 279 880 330 399 1 Household final consumption, including NPISHs
2 Finalna javna potro{uva~ka 58 019 62 481 75 088 2 General government final consumption
3 Investicii vo osnovni sredstva 56 485 71 557 86 403 3 Gross fixed capital formation
4 Promena na zalihite3) 12 324 18 371 24 002 4 Changes in iinventories3)
5 Izvoz na stoki i na uslugi 149 219 191 111 209 557 5 Export of goods and services
6 Uvoz na stoki i na uslugi 206 296 258 410 313 721 6 Import of goods and services
7=1+2+3+4+5-6
Bruto-doma{en proizvod (pazarni ceni)
320 059 364 989 411 728 7=1+2+3+4+5-6
Gross domestic product (market prices)
1) Revidirani podatoci za BDP po tekovni ceni za periodot 2006-2008, BDP po postojani ceni za 2007 i 2008 godina
2) Presmetano so revidiranite podatoci za BDP2) Calculated with the revised GDP data
Gross domestic product at market prices
in current prices (in million denars)1)
BDP spored PKM, vo milioni2) GDP in million PPS2)
3) Includes discrepancies due to balancing
GDP per capita in PPS2) BDP po `itel spored PKM2)
1) Revised data for GDP at current prices for the period 2006-2008, GDP at constant price for 2007 and 2008
3) Vklu~uva i razlika poradi balansirawe
25Statistical review 3.4.10.01/649
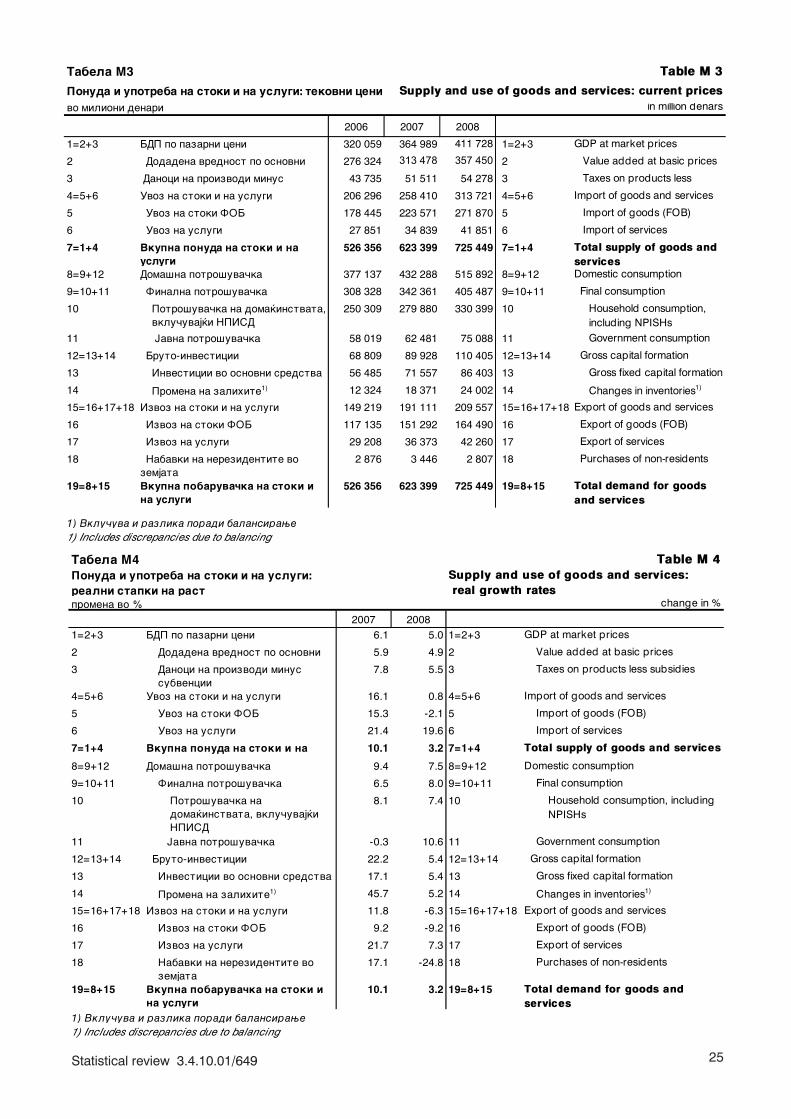
Table M 3
Ponuda i upotreba na stoki i na uslugi: tekovni ceni Supply and use of goods and services: current pricesin million denars
2006 2007 2008
1=2+3 BDP po pazarni ceni 320 059 364 989 411 728 1=2+3 GDP at market prices
2 Dodadena vrednost po osnovni 276 324 313 478 357 450 2 Value added at basic prices
3 Danoci na proizvodi minus 43 735 51 511 54 278 3 Taxes on products less
4=5+6 Uvoz na stoki i na uslugi 206 296 258 410 313 721 4=5+6 Import of goods and services
5 Uvoz na stoki FOB 178 445 223 571 271 870 5 Import of goods (FOB)
6 Uvoz na uslugi 27 851 34 839 41 851 6 Import of services
7=1+4 Vkupna ponuda na stoki i na uslugi
526 356 623 399 725 449 7=1+4 Total supply of goods and services
8=9+12 Doma{na potro{uva~ka 377 137 432 288 515 892 8=9+12 Domestic consumption
9=10+11 Finalna potro{uva~ka 308 328 342 361 405 487 9=10+11 Final consumption
10 Potro{uva~ka na doma}instvata, vklu~uvaj}i NPISD
250 309 279 880 330 399 10 Household consumption, including NPISHs
11 Javna potro{uva~ka 58 019 62 481 75 088 11 Government consumption
12=13+14 Bruto-investicii 68 809 89 928 110 405 12=13+14 Gross capital formation
13 Investicii vo osnovni sredstva 56 485 71 557 86 403 13 Gross fixed capital formation
14 Promena na zalihite1) 12 324 18 371 24 002 14 Changes in inventories1)
15=16+17+18 Izvoz na stoki i na uslugi 149 219 191 111 209 557 15=16+17+18 Export of goods and services
16 Izvoz na stoki FOB 117 135 151 292 164 490 16 Export of goods (FOB)
17 Izvoz na uslugi 29 208 36 373 42 260 17 Export of services
18 Nabavki na nerezidentite vo zemjata
2 876 3 446 2 807 18 Purchases of non-residents
19=8+15 Vkupna pobaruva~ka na stoki i na uslugi
526 356 623 399 725 449 19=8+15 Total demand for goods and services
Tabela M3
vo milioni denari
1) Vklu~uva i razlika poradi balansirawe1) Includes discrepancies due to balancing
Tabela M4 Table M 4
promena vo % change in %
2007 2008
1=2+3 BDP po pazarni ceni 6.1 5.0 1=2+3 GDP at market prices
2 Dodadena vrednost po osnovni 5.9 4.9 2 Value added at basic prices
3 Danoci na proizvodi minus subvencii
7.8 5.5 3 Taxes on products less subsidies
4=5+6 Uvoz na stoki i na uslugi 16.1 0.8 4=5+6 Import of goods and services
5 Uvoz na stoki FOB 15.3 -2.1 5 Import of goods (FOB)
6 Uvoz na uslugi 21.4 19.6 6 Import of services
7=1+4 Vkupna ponuda na stoki i na 10.1 3.2 7=1+4 Total supply of goods and services
8=9+12 Doma{na potro{uva~ka 9.4 7.5 8=9+12 Domestic consumption
9=10+11 Finalna potro{uva~ka 6.5 8.0 9=10+11 Final consumption
10 Potro{uva~ka na doma}instvata, vklu~uvaj}i NPISD
8.1 7.4 10 Household consumption, including NPISHs
11 Javna potro{uva~ka -0.3 10.6 11 Government consumption
12=13+14 Bruto-investicii 22.2 5.4 12=13+14 Gross capital formation
13 Investicii vo osnovni sredstva 17.1 5.4 13 Gross fixed capital formation
14 Promena na zalihite1) 45.7 5.2 14 Changes in inventories1)
15=16+17+18 Izvoz na stoki i na uslugi 11.8 -6.3 15=16+17+18 Export of goods and services
16 Izvoz na stoki FOB 9.2 -9.2 16 Export of goods (FOB)
17 Izvoz na uslugi 21.7 7.3 17 Export of services
18 Nabavki na nerezidentite vo zemjata
17.1 -24.8 18 Purchases of non-residents
19=8+15 Vkupna pobaruva~ka na stoki i na uslugi
10.1 3.2 19=8+15 Total demand for goods and services
Ponuda i upotreba na stoki i na uslugi: realni stapki na rast
Supply and use of goods and services: real growth rates
1) Vklu~uva i razlika poradi balansirawe1) Includes discrepancies due to balancing
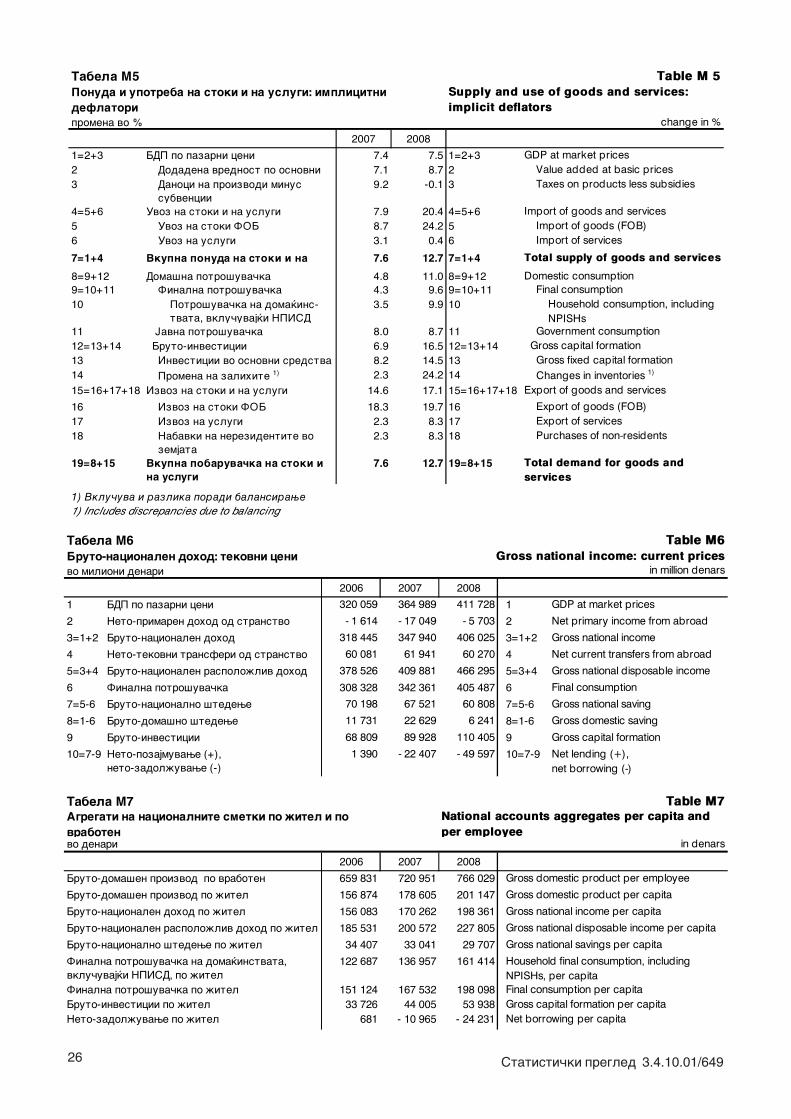
26 Statisti~ki pregled 3.4.10.01/649
Tabela M6 Table M6Bruto-nacionalen dohod: tekovni cenivo milioni denari in million denars
2006 2007 2008
1 BDP po pazarni ceni 320 059 364 989 411 728 1 GDP at market prices
2 Neto-primaren dohod od stranstvo - 1 614 - 17 049 - 5 703 2 Net primary income from abroad
3=1+2 Bruto-nacionalen dohod 318 445 347 940 406 025 3=1+2 Gross national income
4 Neto-tekovni transferi od stranstvo 60 081 61 941 60 270 4 Net current transfers from abroad
5=3+4 Bruto-nacionalen raspolo`liv dohod 378 526 409 881 466 295 5=3+4 Gross national disposable income
6 Finalna potro{uva~ka 308 328 342 361 405 487 6 Final consumption
7=5-6 Bruto-nacionalno {tedewe 70 198 67 521 60 808 7=5-6 Gross national saving
8=1-6 Bruto-doma{no {tedewe 11 731 22 629 6 241 8=1-6 Gross domestic saving
9 Bruto-investicii 68 809 89 928 110 405 9 Gross capital formation
10=7-9 Neto-pozajmuvawe (+), neto-zadol`uvawe (-)
1 390 - 22 407 - 49 597 10=7-9 Net lending (+), net borrowing (-)
Tabela M7 Table M7
vo denari in denars
2006 2007 2008
Bruto-doma{en proizvod po vraboten 659 831 720 951 766 029 Gross domestic product per employee
Bruto-doma{en proizvod po `itel 156 874 178 605 201 147 Gross domestic product per capita
Bruto-nacionalen dohod po `itel 156 083 170 262 198 361 Gross national income per capita
Bruto-nacionalen raspolo`liv dohod po `itel 185 531 200 572 227 805 Gross national disposable income per capita
Bruto-nacionalno {tedewe po `itel 34 407 33 041 29 707 Gross national savings per capita
122 687 136 957 161 414
Finalna potro{uva~ka po `itel 151 124 167 532 198 098 Final consumption per capitaBruto-investicii po `itel 33 726 44 005 53 938 Gross capital formation per capitaNeto-zadol`uvawe po `itel 681 - 10 965 - 24 231 Net borrowing per capita
Finalna potro{uva~ka na doma}instvata, vklu~uvaj}i NPISD, po `itel
Agregati na nacionalnite smetki po `itel i po vraboten
Gross national income: current prices
National accounts aggregates per capita and per employee
Household final consumption, including NPISHs, per capita
Tabela M5 Table M 5
promena vo % change in %
2007 2008
1=2+3 BDP po pazarni ceni 7.4 7.5 1=2+3 GDP at market prices2 Dodadena vrednost po osnovni 7.1 8.7 2 Value added at basic prices3 Danoci na proizvodi minus
subvencii9.2 -0.1 3 Taxes on products less subsidies
4=5+6 Uvoz na stoki i na uslugi 7.9 20.4 4=5+6 Import of goods and services5 Uvoz na stoki FOB 8.7 24.2 5 Import of goods (FOB)6 Uvoz na uslugi 3.1 0.4 6 Import of services
7=1+4 Vkupna ponuda na stoki i na 7.6 12.7 7=1+4 Total supply of goods and services
8=9+12 Doma{na potro{uva~ka 4.8 11.0 8=9+12 Domestic consumption9=10+11 Finalna potro{uva~ka 4.3 9.6 9=10+11 Final consumption10 Potro{uva~ka na doma}ins-
tvata, vklu~uvaj}i NPISD3.5 9.9 10 Household consumption, including
NPISHs11 Javna potro{uva~ka 8.0 8.7 11 Government consumption12=13+14 Bruto-investicii 6.9 16.5 12=13+14 Gross capital formation13 Investicii vo osnovni sredstva 8.2 14.5 13 Gross fixed capital formation14 Promena na zalihite 1) 2.3 24.2 14 Changes in inventories 1)
15=16+17+18 Izvoz na stoki i na uslugi 14.6 17.1 15=16+17+18 Export of goods and services
16 Izvoz na stoki FOB 18.3 19.7 16 Export of goods (FOB)17 Izvoz na uslugi 2.3 8.3 17 Export of services18 Nabavki na nerezidentite vo
zemjata2.3 8.3 18 Purchases of non-residents
19=8+15 Vkupna pobaruva~ka na stoki i na uslugi
7.6 12.7 19=8+15 Total demand for goods and services
1) Vklu~uva i razlika poradi balansirawe
Ponuda i upotreba na stoki i na uslugi: implicitni deflatori
Supply and use of goods and services: implicit deflators
1) Includes discrepancies due to balancing
27Statistical review 3.4.10.01/649
SERIJA P - Proizvodstvo na stoki i na uslugi
SERIES P - Goods and services production
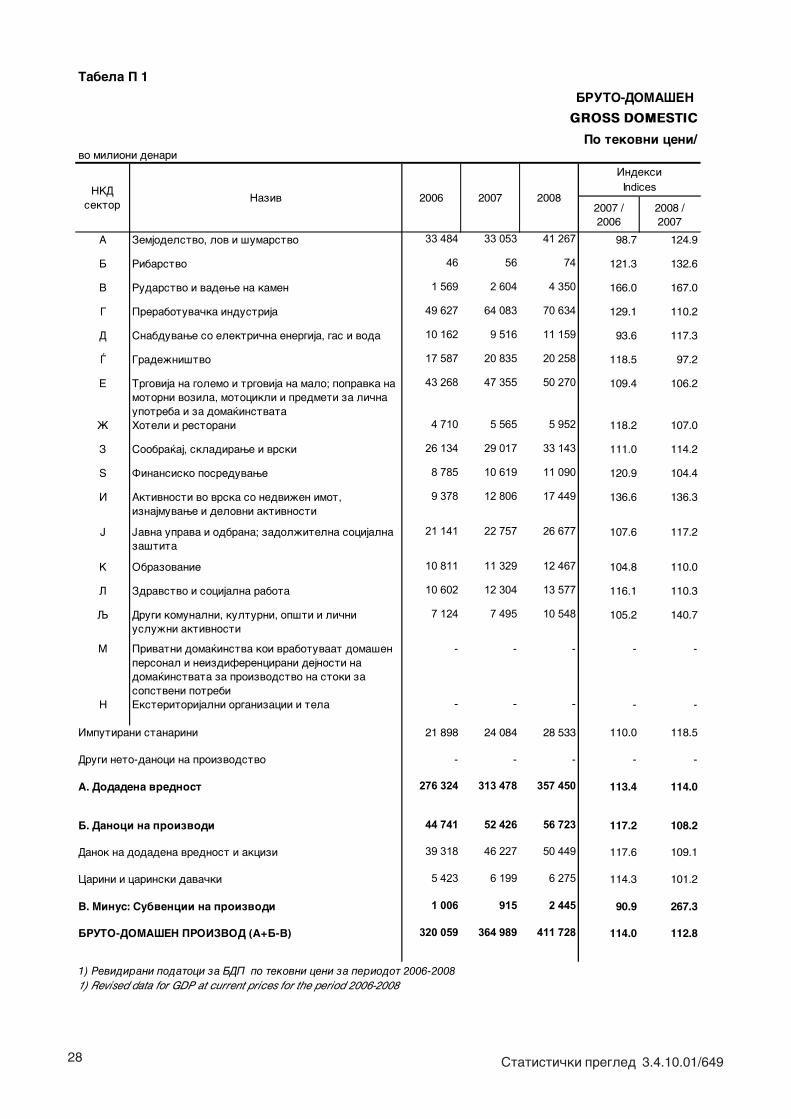
28 Statisti~ki pregled 3.4.10.01/649
BRUTO-DOMA[EN
GROSS DOMESTIC
Po tekovni ceni/vo milioni denari
2007 / 2006
2008 / 2007
A Zemjodelstvo, lov i {umarstvo 33 484 33 053 41 267 98.7 124.9
B Ribarstvo 46 56 74 121.3 132.6
V Rudarstvo i vadewe na kamen 1 569 2 604 4 350 166.0 167.0
G Prerabotuva~ka industrija 49 627 64 083 70 634 129.1 110.2
D Snabduvawe so elektri~na energija, gas i voda 10 162 9 516 11 159 93.6 117.3
\ Grade`ni{tvo 17 587 20 835 20 258 118.5 97.2
E Trgovija na golemo i trgovija na malo; popravka na motorni vozila, motocikli i predmeti za li~na upotreba i za doma}instvata
43 268 47 355 50 270 109.4 106.2
@ Hoteli i restorani 4 710 5 565 5 952 118.2 107.0
Z Soobra}aj, skladirawe i vrski 26 134 29 017 33 143 111.0 114.2
Y Finansisko posreduvawe 8 785 10 619 11 090 120.9 104.4
I Aktivnosti vo vrska so nedvi`en imot, iznajmuvawe i delovni aktivnosti
9 378 12 806 17 449 136.6 136.3
J Javna uprava i odbrana; zadol`itelna socijalna za{tita
21 141 22 757 26 677 107.6 117.2
K Obrazovanie 10 811 11 329 12 467 104.8 110.0
L Zdravstvo i socijalna rabota 10 602 12 304 13 577 116.1 110.3
Q Drugi komunalni, kulturni, op{ti i li~ni uslu`ni aktivnosti
7 124 7 495 10 548 105.2 140.7
M Privatni doma}instva koi vrabotuvaat doma{en personal i neizdiferencirani dejnosti na doma}instvata za proizvodstvo na stoki za sopstveni potrebi
- - - - -
N Eksteritorijalni organizacii i tela - - - - -
Imputirani stanarini 21 898 24 084 28 533 110.0 118.5
- - - - -
276 324 313 478 357 450 113.4 114.0
44 741 52 426 56 723 117.2 108.2
39 318 46 227 50 449 117.6 109.1
5 423 6 199 6 275 114.3 101.2
1 006 915 2 445 90.9 267.3
320 059 364 989 411 728 114.0 112.8
1) Revidirani podatoci za BDP po tekovni ceni za periodot 2006-20081) Revised data for GDP at current prices for the period 2006-2008
BRUTO-DOMA[EN PROIZVOD (A+B-V)
V. Minus: Subvencii na proizvodi
B. Danoci na proizvodi
Danok na dodadena vrednost i akcizi
Carini i carinski dava~ki
A. Dodadena vrednost
Tabela P 1
NKD sektor
Naziv
Drugi neto-danoci na proizvodstvo
2006Indices
2007 2008
Indeksi
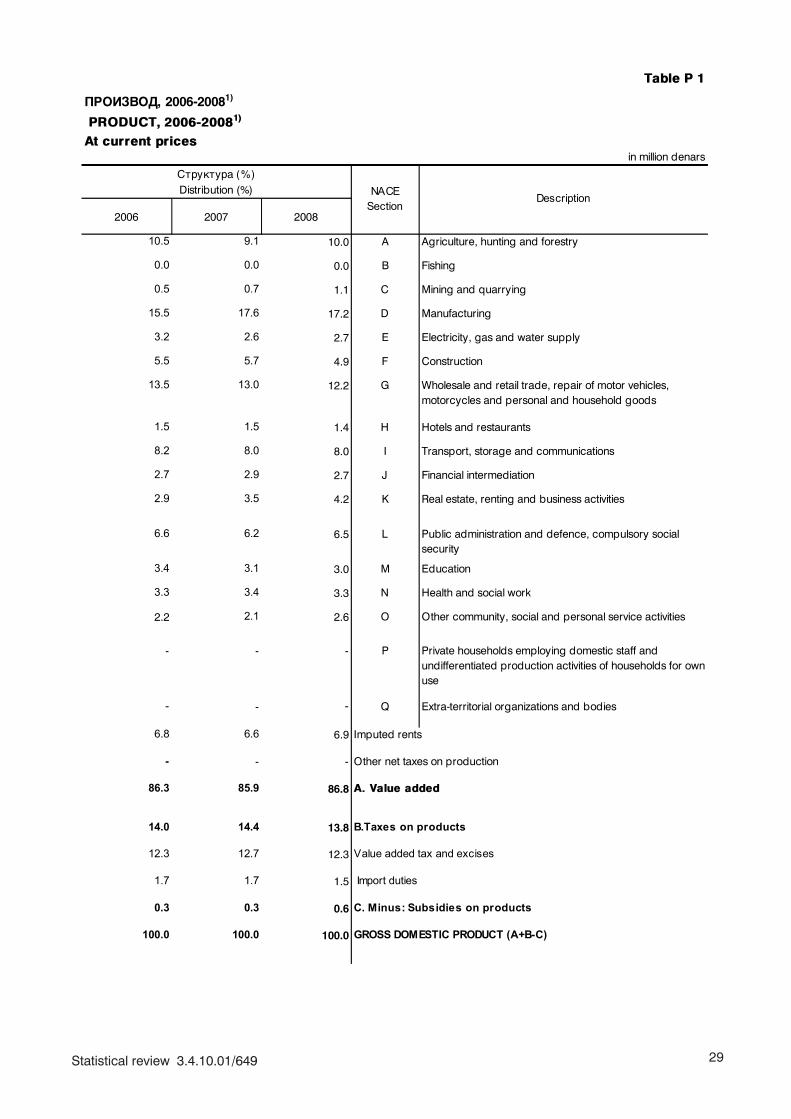
29Statistical review 3.4.10.01/649
Table P 1
PROIZVOD, 2006-20081)
PRODUCT, 2006-20081)
At current pricesin million denars
2006 2007 2008
10.5 9.1 10.0 A Agriculture, hunting and forestry
0.0 0.0 0.0 B Fishing
0.5 0.7 1.1 C Mining and quarrying
15.5 17.6 17.2 D Manufacturing
3.2 2.6 2.7 E Electricity, gas and water supply
5.5 5.7 4.9 F Construction
13.5 13.0 12.2 G Wholesale and retail trade, repair of motor vehicles, motorcycles and personal and household goods
1.5 1.5 1.4 H Hotels and restaurants
8.2 8.0 8.0 I Transport, storage and communications
2.7 2.9 2.7 J Financial intermediation
2.9 3.5 4.2 K Real estate, renting and business activities
6.6 6.2 6.5 L Public administration and defence, compulsory social security
3.4 3.1 3.0 M Education
3.3 3.4 3.3 N Health and social work
2.2 2.1 2.6 O Other community, social and personal service activities
- - - P Private households employing domestic staff and undifferentiated production activities of households for own use
- - - Q Extra-territorial organizations and bodies
6.8 6.6 6.9 Imputed rents
- - -
86.3 85.9 86.8 A. Value added
14.0 14.4 13.8
12.3 12.7 12.3
1.7 1.7 1.5
0.3 0.3 0.6
100.0 100.0 100.0 GROSS DOMESTIC PRODUCT (A+B-C)
Other net taxes on production
B.Taxes on products
Value added tax and excises
Import duties
C. Minus: Subsidies on products
NACE Section
DescriptionDistribution (%)Struktura (%)
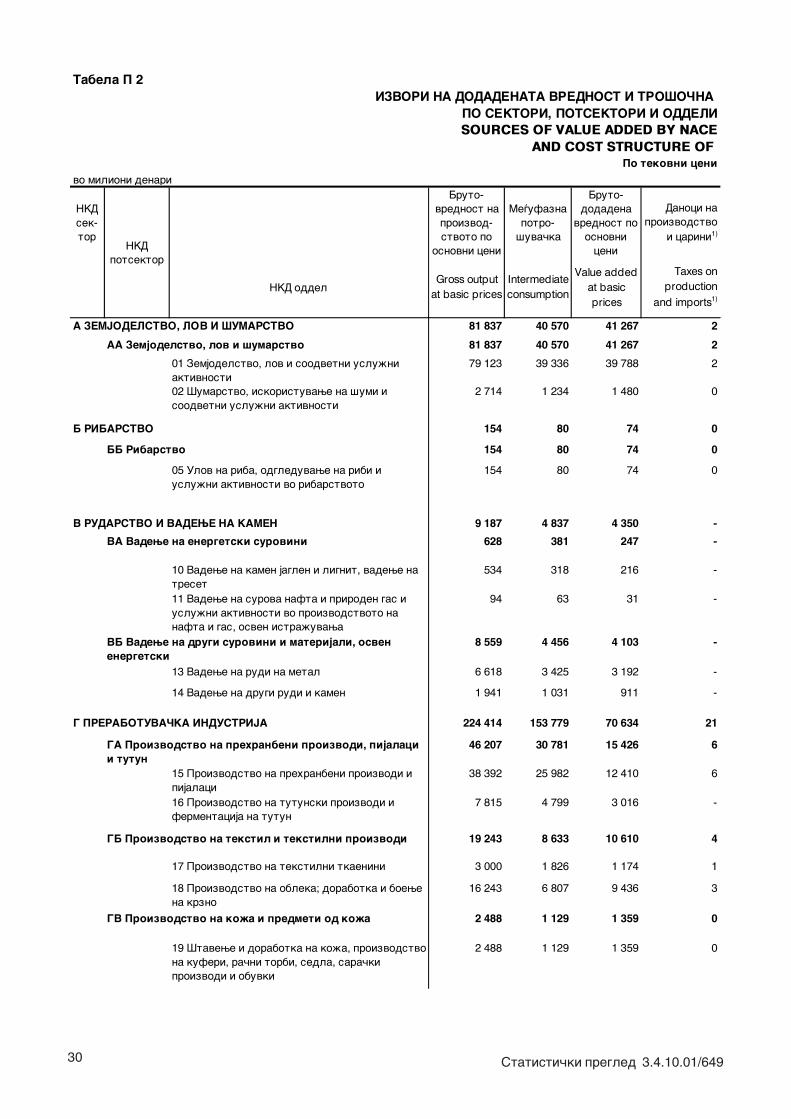
30 Statisti~ki pregled 3.4.10.01/649
IZVORI NA DODADENATA VREDNOST I TRO[O^NA PO SEKTORI, POTSEKTORI I ODDELISOURCES OF VALUE ADDED BY NACE
AND COST STRUCTURE OF Po tekovni ceni
NKD sek-tor
Bruto-vrednost na proizvod- stvoto po
osnovni ceni
Me|ufazna potro-
{uva~ka
Bruto-dodadena
vrednost po osnovni
ceni
Danoci na proizvodstvo
i carini1)
NKD oddelGross output
at basic pricesIntermediate consumption
Value added at basic prices
Taxes on production
and imports1)
81 837 40 570 41 267 2
81 837 40 570 41 267 2
01 Zemjodelstvo, lov i soodvetni uslu`ni aktivnosti
79 123 39 336 39 788 2
02 [umarstvo, iskoristuvawe na {umi i soodvetni uslu`ni aktivnosti
2 714 1 234 1 480 0
B RIBARSTVO 154 80 74 0
BB Ribarstvo 154 80 74 0
05 Ulov na riba, odgleduvawe na ribi i uslu`ni aktivnosti vo ribarstvoto
154 80 74 0
9 187 4 837 4 350 -
628 381 247 -
10 Vadewe na kamen jaglen i lignit, vadewe na treset
534 318 216 -
11 Vadewe na surova nafta i priroden gas i uslu`ni aktivnosti vo proizvodstvoto na nafta i gas, osven istra`uvawa
94 63 31 -
8 559 4 456 4 103 -
13 Vadewe na rudi na metal 6 618 3 425 3 192 -
14 Vadewe na drugi rudi i kamen 1 941 1 031 911 -
224 414 153 779 70 634 21
46 207 30 781 15 426 6
15 Proizvodstvo na prehranbeni proizvodi i pijalaci
38 392 25 982 12 410 6
16 Proizvodstvo na tutunski proizvodi i fermentacija na tutun
7 815 4 799 3 016 -
19 243 8 633 10 610 4
17 Proizvodstvo na tekstilni tkaenini 3 000 1 826 1 174 1
18 Proizvodstvo na obleka; dorabotka i boewe na krzno
16 243 6 807 9 436 3
2 488 1 129 1 359 0
19 [tavewe i dorabotka na ko`a, proizvodstvo na kuferi, ra~ni torbi, sedla, sara~ki proizvodi i obuvki
2 488 1 129 1 359 0
GV Proizvodstvo na ko`a i predmeti od ko`a
G PRERABOTUVA^KA INDUSTRIJA
GA Proizvodstvo na prehranbeni proizvodi, pijalaci i tutun
GB Proizvodstvo na tekstil i tekstilni proizvodi
vo milioni denari
NKD potsektor
A ZEMJODELSTVO, LOV I [UMARSTVO
AA Zemjodelstvo, lov i {umarstvo
V RUDARSTVO I VADEWE NA KAMEN
VA Vadewe na energetski surovini
VB Vadewe na drugi surovini i materijali, osven energetski
Tabela P 2
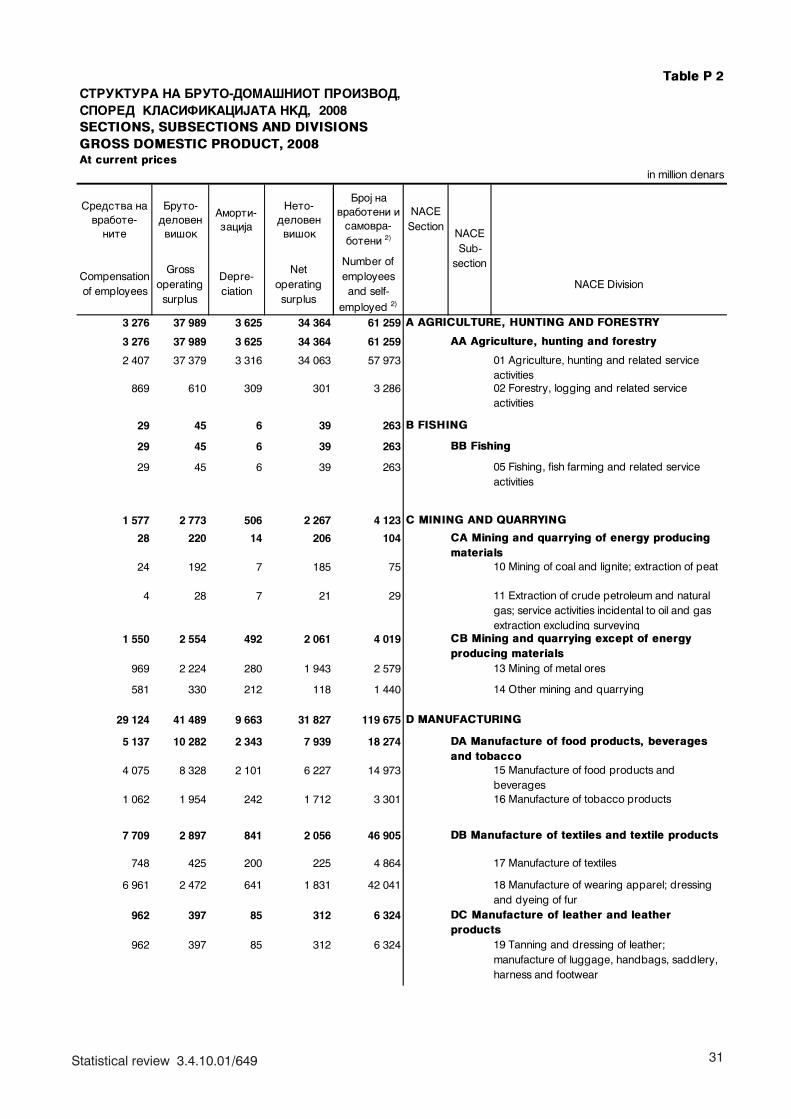
31Statistical review 3.4.10.01/649
Table P 2STRUKTURA NA BRUTO-DOMA[NIOT PROIZVOD, SPORED KLASIFIKACIJATA NKD, 2008SECTIONS, SUBSECTIONS AND DIVISIONS GROSS DOMESTIC PRODUCT, 2008At current prices
in million denars
Sredstva na vrabote-
nite
Bruto-deloven vi{ok
Amorti-zacija
Neto-deloven vi{ok
Broj na vraboteni i
samovra-boteni 2)
NACE Section
Compensation of employees
Gross operating
surplus
Depre-ciation
Net operating surplus
Number of employees and self-
employed 2)
NACE Division
3 276 37 989 3 625 34 364 61 259
3 276 37 989 3 625 34 364 61 259
2 407 37 379 3 316 34 063 57 973 01 Agriculture, hunting and related service activities
869 610 309 301 3 286 02 Forestry, logging and related service activities
29 45 6 39 263
29 45 6 39 263
29 45 6 39 263 05 Fishing, fish farming and related service activities
1 577 2 773 506 2 267 4 123
28 220 14 206 104
24 192 7 185 75 10 Mining of coal and lignite; extraction of peat
4 28 7 21 29 11 Extraction of crude petroleum and natural gas; service activities incidental to oil and gas extraction excluding surveying
1 550 2 554 492 2 061 4 019
969 2 224 280 1 943 2 579 13 Mining of metal ores
581 330 212 118 1 440 14 Other mining and quarrying
29 124 41 489 9 663 31 827 119 675
5 137 10 282 2 343 7 939 18 274
4 075 8 328 2 101 6 227 14 973 15 Manufacture of food products and beverages
1 062 1 954 242 1 712 3 301 16 Manufacture of tobacco products
7 709 2 897 841 2 056 46 905
748 425 200 225 4 864 17 Manufacture of textiles
6 961 2 472 641 1 831 42 041 18 Manufacture of wearing apparel; dressing and dyeing of fur
962 397 85 312 6 324
962 397 85 312 6 324 19 Tanning and dressing of leather; manufacture of luggage, handbags, saddlery, harness and footwear
D MANUFACTURING
DB Manufacture of textiles and textile products
DC Manufacture of leather and leather products
DA Manufacture of food products, beverages and tobacco
B FISHING
NACE Sub-
section
A AGRICULTURE, HUNTING AND FORESTRY
AA Agriculture, hunting and forestry
BB Fishing
CA Mining and quarrying of energy producing materials
C MINING AND QUARRYING
CB Mining and quarrying except of energy producing materials
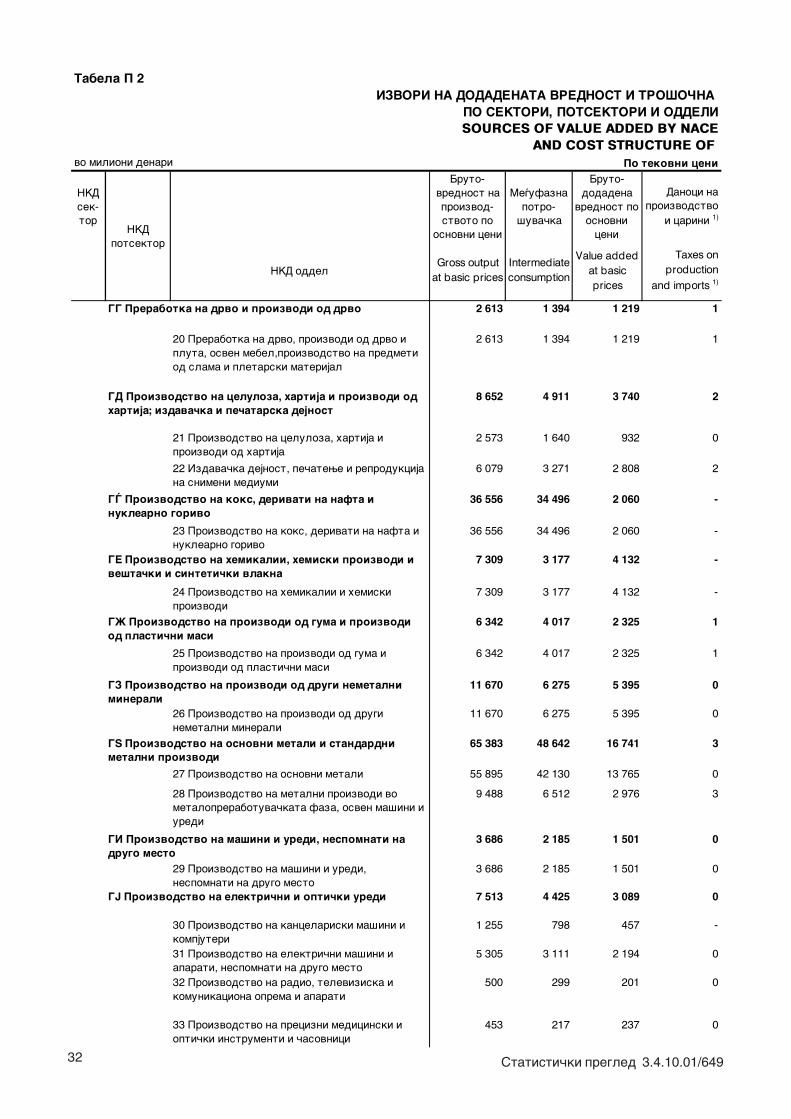
32 Statisti~ki pregled 3.4.10.01/649
IZVORI NA DODADENATA VREDNOST I TRO[O^NA PO SEKTORI, POTSEKTORI I ODDELISOURCES OF VALUE ADDED BY NACE
AND COST STRUCTURE OF Po tekovni ceni
NKD sek-tor
Bruto-vrednost na proizvod- stvoto po
osnovni ceni
Me|ufazna potro-
{uva~ka
Bruto-dodadena
vrednost po osnovni
ceni
Danoci na proizvodstvo
i carini 1)
NKD oddelGross output
at basic pricesIntermediate consumption
Value added at basic prices
Taxes on production
and imports 1)
2 613 1 394 1 219 1
20 Prerabotka na drvo, proizvodi od drvo i pluta, osven mebel,proizvodstvo na predmeti od slama i pletarski materijal
2 613 1 394 1 219 1
8 652 4 911 3 740 2
21 Proizvodstvo na celuloza, hartija i proizvodi od hartija
2 573 1 640 932 0
22 Izdava~ka dejnost, pe~atewe i reprodukcija na snimeni mediumi
6 079 3 271 2 808 2
36 556 34 496 2 060 -
23 Proizvodstvo na koks, derivati na nafta i nuklearno gorivo
36 556 34 496 2 060 -
7 309 3 177 4 132 -
24 Proizvodstvo na hemikalii i hemiski proizvodi
7 309 3 177 4 132 -
6 342 4 017 2 325 1
25 Proizvodstvo na proizvodi od guma i proizvodi od plasti~ni masi
6 342 4 017 2 325 1
11 670 6 275 5 395 0
26 Proizvodstvo na proizvodi od drugi nemetalni minerali
11 670 6 275 5 395 0
65 383 48 642 16 741 3
27 Proizvodstvo na osnovni metali 55 895 42 130 13 765 0
28 Proizvodstvo na metalni proizvodi vo metaloprerabotuva~kata faza, osven ma{ini i uredi
9 488 6 512 2 976 3
3 686 2 185 1 501 0
29 Proizvodstvo na ma{ini i uredi, nespomnati na drugo mesto
3 686 2 185 1 501 0
7 513 4 425 3 089 0
30 Proizvodstvo na kancelariski ma{ini i kompjuteri
1 255 798 457 -
31 Proizvodstvo na elektri~ni ma{ini i aparati, nespomnati na drugo mesto
5 305 3 111 2 194 0
32 Proizvodstvo na radio, televiziska i komunikaciona oprema i aparati
500 299 201 0
33 Proizvodstvo na precizni medicinski i opti~ki instrumenti i ~asovnici
453 217 237 0
GG Prerabotka na drvo i proizvodi od drvo
NKD potsektor
GD Proizvodstvo na celuloza, hartija i proizvodi od hartija; izdava~ka i pe~atarska dejnost
G\ Proizvodstvo na koks, derivati na nafta i nuklearno gorivo
GE Proizvodstvo na hemikalii, hemiski proizvodi i ve{ta~ki i sinteti~ki vlakna
GY Proizvodstvo na osnovni metali i standardni metalni proizvodi
Tabela P 2
vo milioni denari
G@ Proizvodstvo na proizvodi od guma i proizvodi od plasti~ni masi
GZ Proizvodstvo na proizvodi od drugi nemetalni minerali
GI Proizvodstvo na ma{ini i uredi, nespomnati na drugo mesto
GJ Proizvodstvo na elektri~ni i opti~ki uredi
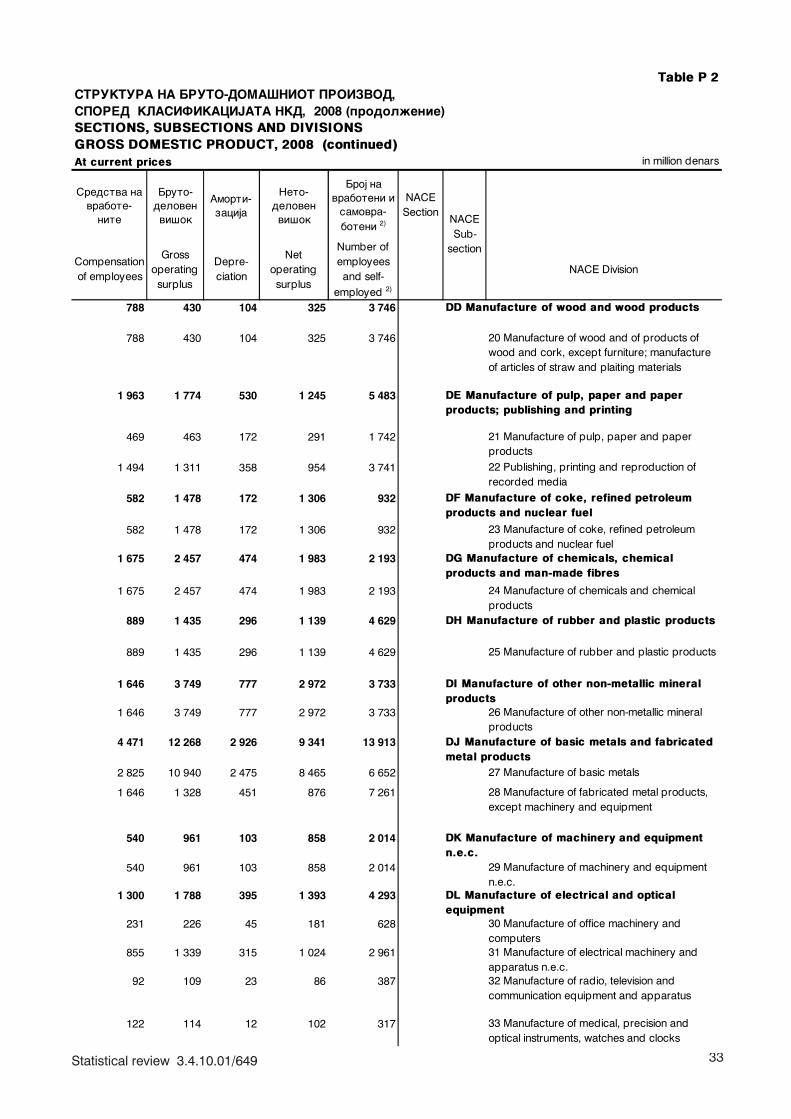
33Statistical review 3.4.10.01/649
Table P 2STRUKTURA NA BRUTO-DOMA[NIOT PROIZVOD, SPORED KLASIFIKACIJATA NKD, 2008 (prodol`enie)SECTIONS, SUBSECTIONS AND DIVISIONS GROSS DOMESTIC PRODUCT, 2008 (continued)At current prices in million denars
Sredstva na vrabote-
nite
Bruto-deloven vi{ok
Amorti-zacija
Neto-deloven
vi{ok
Broj na vraboteni i
samovra-boteni 2)
NACE Section
Compensation of employees
Gross operating
surplus
Depre-ciation
Net operating surplus
Number of employees and self-
employed 2)
NACE Division
788 430 104 325 3 746
788 430 104 325 3 746 20 Manufacture of wood and of products of wood and cork, except furniture; manufacture of articles of straw and plaiting materials
1 963 1 774 530 1 245 5 483
469 463 172 291 1 742 21 Manufacture of pulp, paper and paper products
1 494 1 311 358 954 3 741 22 Publishing, printing and reproduction of recorded media
582 1 478 172 1 306 932
582 1 478 172 1 306 932 23 Manufacture of coke, refined petroleum products and nuclear fuel
1 675 2 457 474 1 983 2 193
1 675 2 457 474 1 983 2 193 24 Manufacture of chemicals and chemical products
889 1 435 296 1 139 4 629
889 1 435 296 1 139 4 629 25 Manufacture of rubber and plastic products
1 646 3 749 777 2 972 3 733
1 646 3 749 777 2 972 3 733 26 Manufacture of other non-metallic mineral products
4 471 12 268 2 926 9 341 13 913
2 825 10 940 2 475 8 465 6 652 27 Manufacture of basic metals
1 646 1 328 451 876 7 261 28 Manufacture of fabricated metal products, except machinery and equipment
540 961 103 858 2 014
540 961 103 858 2 014 29 Manufacture of machinery and equipment n.e.c.
1 300 1 788 395 1 393 4 293
231 226 45 181 628 30 Manufacture of office machinery and computers
855 1 339 315 1 024 2 961 31 Manufacture of electrical machinery and apparatus n.e.c.
92 109 23 86 387 32 Manufacture of radio, television and communication equipment and apparatus
122 114 12 102 317 33 Manufacture of medical, precision and optical instruments, watches and clocks
DJ Manufacture of basic metals and fabricated metal products
DK Manufacture of machinery and equipment n.e.c.
DL Manufacture of electrical and optical equipment
NACE Sub-
section
DD Manufacture of wood and wood products
DE Manufacture of pulp, paper and paper products; publishing and printing
DF Manufacture of coke, refined petroleum products and nuclear fuel
DG Manufacture of chemicals, chemical products and man-made fibres
DH Manufacture of rubber and plastic products
DI Manufacture of other non-metallic mineral products
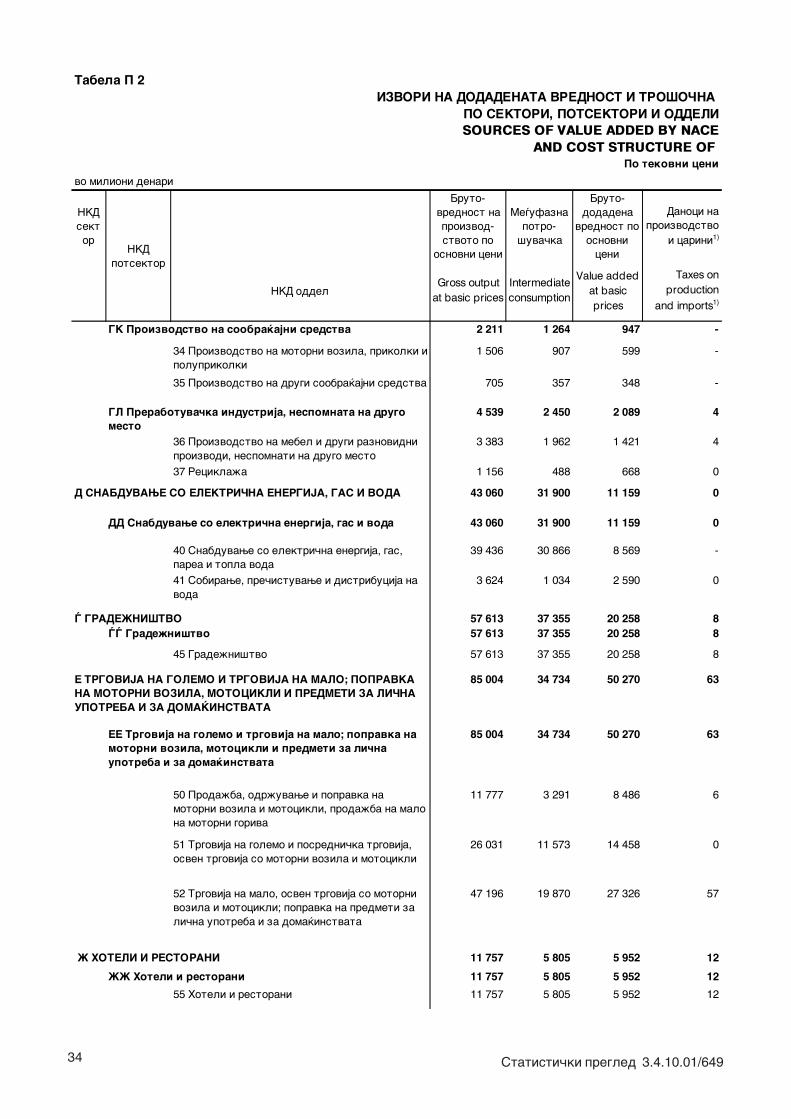
34 Statisti~ki pregled 3.4.10.01/649
Tabela P 2IZVORI NA DODADENATA VREDNOST I TRO[O^NA
PO SEKTORI, POTSEKTORI I ODDELISOURCES OF VALUE ADDED BY NACE
AND COST STRUCTURE OF Po tekovni ceni
NKD sektor
Bruto-vrednost na proizvod- stvoto po
osnovni ceni
Me|ufazna potro-
{uva~ka
Bruto-dodadena
vrednost po osnovni
ceni
Danoci na proizvodstvo
i carini1)
NKD oddelGross output
at basic pricesIntermediate consumption
Value added at basic prices
Taxes on production
and imports1)
2 211 1 264 947 -
34 Proizvodstvo na motorni vozila, prikolki i poluprikolki
1 506 907 599 -
35 Proizvodstvo na drugi soobra}ajni sredstva 705 357 348 -
4 539 2 450 2 089 4
36 Proizvodstvo na mebel i drugi raznovidni proizvodi, nespomnati na drugo mesto
3 383 1 962 1 421 4
37 Recikla`a 1 156 488 668 0
43 060 31 900 11 159 0
43 060 31 900 11 159 0
40 Snabduvawe so elektri~na energija, gas, parea i topla voda
39 436 30 866 8 569 -
41 Sobirawe, pre~istuvawe i distribucija na voda
3 624 1 034 2 590 0
57 613 37 355 20 258 8 57 613 37 355 20 258 8
45 Grade`ni{tvo 57 613 37 355 20 258 8
85 004 34 734 50 270 63
85 004 34 734 50 270 63
50 Proda`ba, odr`uvawe i popravka na motorni vozila i motocikli, proda`ba na malo na motorni goriva
11 777 3 291 8 486 6
51 Trgovija na golemo i posredni~ka trgovija, osven trgovija so motorni vozila i motocikli
26 031 11 573 14 458 0
52 Trgovija na malo, osven trgovija so motorni vozila i motocikli; popravka na predmeti za li~na upotreba i za doma}instvata
47 196 19 870 27 326 57
11 757 5 805 5 952 12
11 757 5 805 5 952 12
55 Hoteli i restorani 11 757 5 805 5 952 12
@@ Hoteli i restorani
@ HOTELI I RESTORANI
E TRGOVIJA NA GOLEMO I TRGOVIJA NA MALO; POPRAVKA NA MOTORNI VOZILA, MOTOCIKLI I PREDMETI ZA LI^NA UPOTREBA I ZA DOMA]INSTVATA
EE Trgovija na golemo i trgovija na malo; popravka na motorni vozila, motocikli i predmeti za li~na upotreba i za doma}instvata
\ GRADE@NI[TVO\\ Grade`ni{tvo
DD Snabduvawe so elektri~na energija, gas i voda
D SNABDUVAWE SO ELEKTRI^NA ENERGIJA, GAS I VODA
vo milioni denari
GK Proizvodstvo na soobra}ajni sredstva
GL Prerabotuva~ka industrija, nespomnata na drugo mesto
NKD potsektor
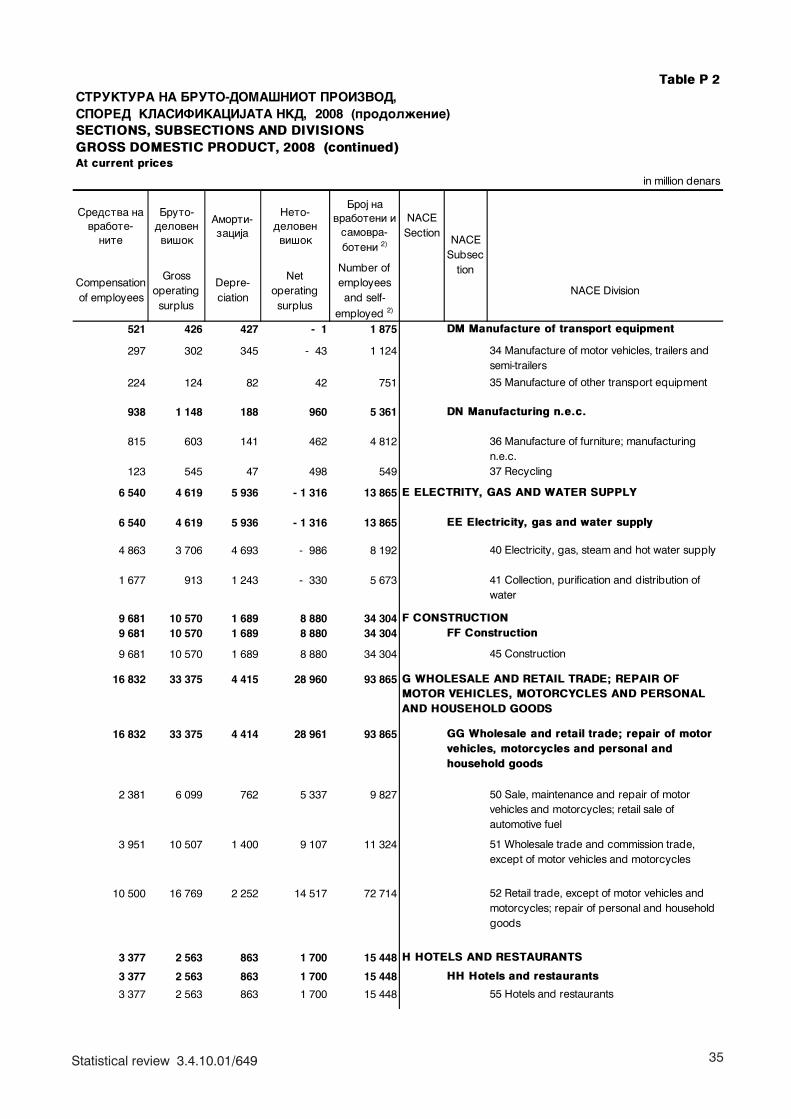
35Statistical review 3.4.10.01/649
Table P 2STRUKTURA NA BRUTO-DOMA[NIOT PROIZVOD, SPORED KLASIFIKACIJATA NKD, 2008 (prodol`enie)SECTIONS, SUBSECTIONS AND DIVISIONS GROSS DOMESTIC PRODUCT, 2008 (continued)At current prices
in million denars
Sredstva na vrabote-
nite
Bruto-deloven vi{ok
Amorti-zacija
Neto-deloven vi{ok
Broj na vraboteni i
samovra-boteni 2)
NACE Section
Compensation of employees
Gross operating
surplus
Depre-ciation
Net operating surplus
Number of employees and self-
employed 2)
NACE Division
521 426 427 - 1 1 875
297 302 345 - 43 1 124 34 Manufacture of motor vehicles, trailers and semi-trailers
224 124 82 42 751 35 Manufacture of other transport equipment
938 1 148 188 960 5 361
815 603 141 462 4 812 36 Manufacture of furniture; manufacturing n.e.c.
123 545 47 498 549 37 Recycling
6 540 4 619 5 936 - 1 316 13 865
6 540 4 619 5 936 - 1 316 13 865
4 863 3 706 4 693 - 986 8 192 40 Electricity, gas, steam and hot water supply
1 677 913 1 243 - 330 5 673 41 Collection, purification and distribution of water
9 681 10 570 1 689 8 880 34 304 9 681 10 570 1 689 8 880 34 304
9 681 10 570 1 689 8 880 34 304 45 Construction
16 832 33 375 4 415 28 960 93 865
16 832 33 375 4 414 28 961 93 865
2 381 6 099 762 5 337 9 827 50 Sale, maintenance and repair of motor vehicles and motorcycles; retail sale of automotive fuel
3 951 10 507 1 400 9 107 11 324 51 Wholesale trade and commission trade, except of motor vehicles and motorcycles
10 500 16 769 2 252 14 517 72 714 52 Retail trade, except of motor vehicles and motorcycles; repair of personal and household goods
3 377 2 563 863 1 700 15 448
3 377 2 563 863 1 700 15 448
3 377 2 563 863 1 700 15 448 55 Hotels and restaurants
HH Hotels and restaurants
H HOTELS AND RESTAURANTS
G WHOLESALE AND RETAIL TRADE; REPAIR OF MOTOR VEHICLES, MOTORCYCLES AND PERSONAL AND HOUSEHOLD GOODS
GG Wholesale and retail trade; repair of motor vehicles, motorcycles and personal and household goods
EE Electricity, gas and water supply
DM Manufacture of transport equipment
DN Manufacturing n.e.c.
E ELECTRITY, GAS AND WATER SUPPLY
NACE Subsec
tion
FF ConstructionF CONSTRUCTION
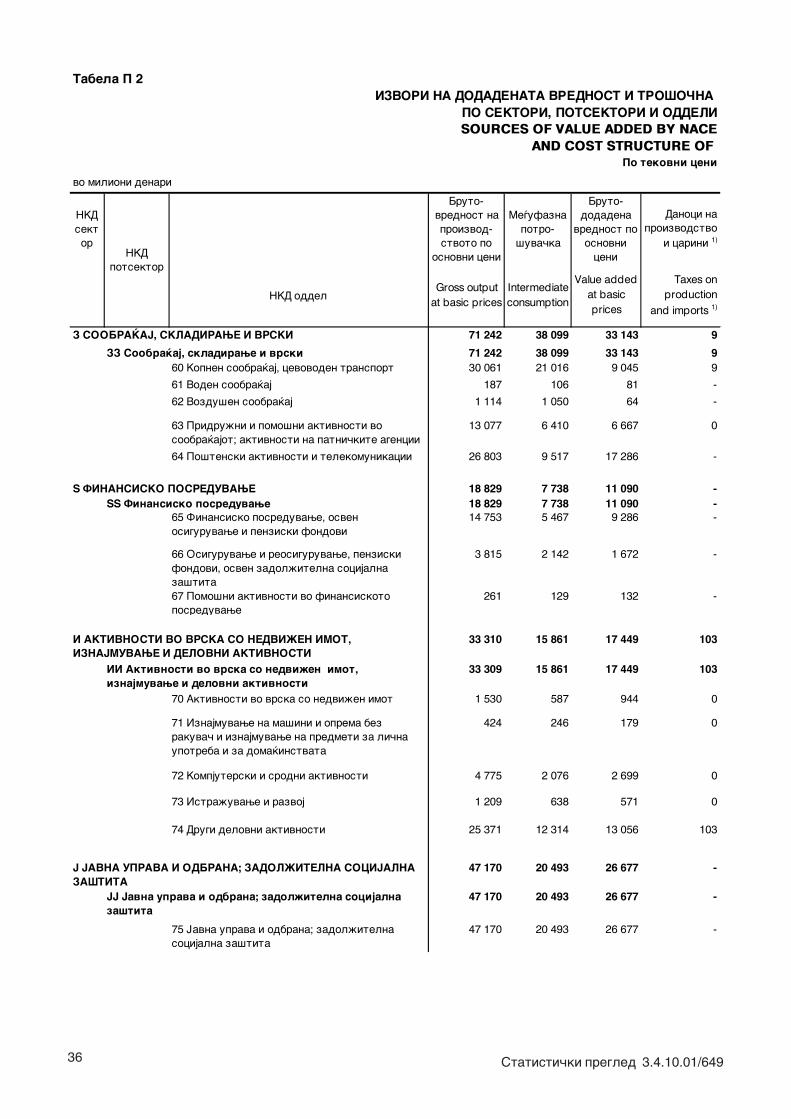
36 Statisti~ki pregled 3.4.10.01/649
IZVORI NA DODADENATA VREDNOST I TRO[O^NA PO SEKTORI, POTSEKTORI I ODDELISOURCES OF VALUE ADDED BY NACE
AND COST STRUCTURE OF Po tekovni ceni
NKD sektor
Bruto-vrednost na proizvod- stvoto po
osnovni ceni
Me|ufazna potro-
{uva~ka
Bruto-dodadena
vrednost po osnovni
ceni
Danoci na proizvodstvo
i carini 1)
NKD oddelGross output
at basic pricesIntermediate consumption
Value added at basic prices
Taxes on production
and imports 1)
71 242 38 099 33 143 9
71 242 38 099 33 143 960 Kopnen soobra}aj, cevovoden transport 30 061 21 016 9 045 9
61 Voden soobra}aj 187 106 81 -
62 Vozdu{en soobra}aj 1 114 1 050 64 -
63 Pridru`ni i pomo{ni aktivnosti vo soobra}ajot; aktivnosti na patni~kite agencii
13 077 6 410 6 667 0
64 Po{tenski aktivnosti i telekomunikacii 26 803 9 517 17 286 -
18 829 7 738 11 090 - 18 829 7 738 11 090 -
65 Finansisko posreduvawe, osven osiguruvawe i penziski fondovi
14 753 5 467 9 286 -
66 Osiguruvawe i reosiguruvawe, penziski fondovi, osven zadol`itelna socijalna za{tita
3 815 2 142 1 672 -
67 Pomo{ni aktivnosti vo finansiskoto posreduvawe
261 129 132 -
33 310 15 861 17 449 103
33 309 15 861 17 449 103
70 Aktivnosti vo vrska so nedvi`en imot 1 530 587 944 0
71 Iznajmuvawe na ma{ini i oprema bez rakuva~ i iznajmuvawe na predmeti za li~na upotreba i za doma}instvata
424 246 179 0
72 Kompjuterski i srodni aktivnosti 4 775 2 076 2 699 0
73 Istra`uvawe i razvoj 1 209 638 571 0
74 Drugi delovni aktivnosti 25 371 12 314 13 056 103
47 170 20 493 26 677 -
47 170 20 493 26 677 -
75 Javna uprava i odbrana; zadol`itelna socijalna za{tita
47 170 20 493 26 677 -
Y FINANSISKO POSREDUVAWEYY Finansisko posreduvawe
vo milioni denari
Z SOOBRA]AJ, SKLADIRAWE I VRSKI
NKD potsektor
ZZ Soobra}aj, skladirawe i vrski
I AKTIVNOSTI VO VRSKA SO NEDVI@EN IMOT, IZNAJMUVAWE I DELOVNI AKTIVNOSTI
II Aktivnosti vo vrska so nedvi`en imot, iznajmuvawe i delovni aktivnosti
J JAVNA UPRAVA I ODBRANA; ZADOL@ITELNA SOCIJALNA ZA[TITA
JJ Javna uprava i odbrana; zadol`itelna socijalna za{tita
Tabela P 2
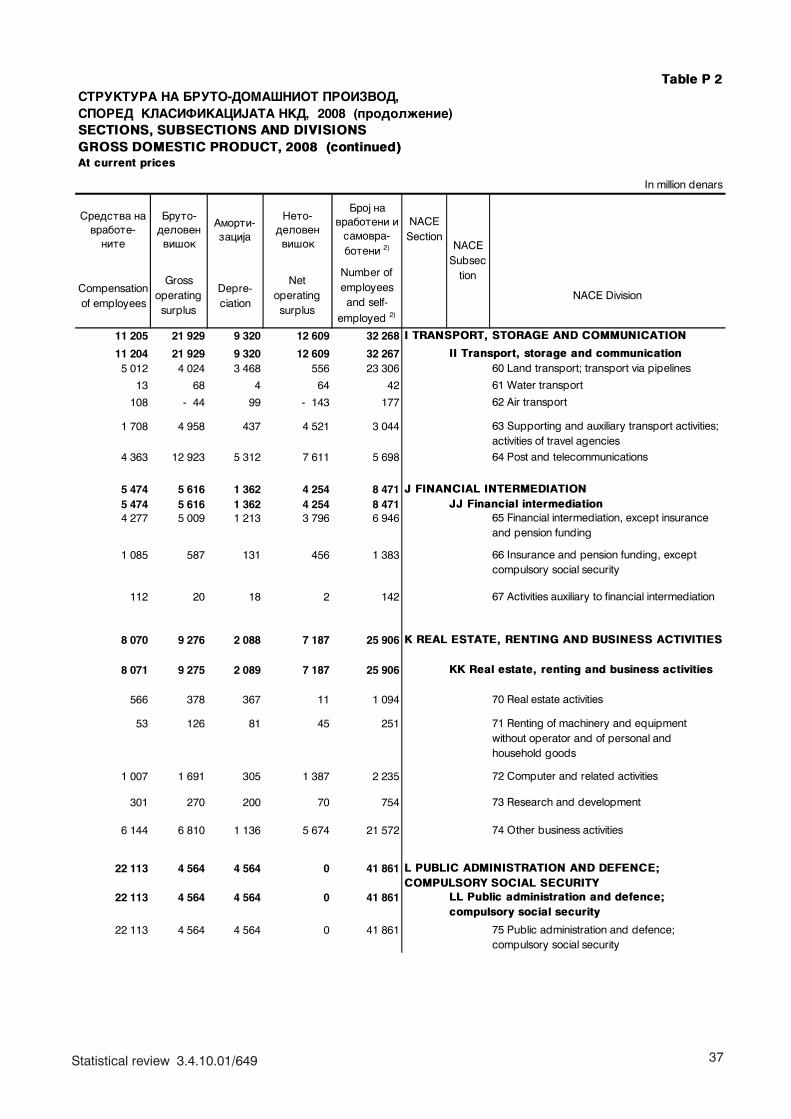
37Statistical review 3.4.10.01/649
Table P 2STRUKTURA NA BRUTO-DOMA[NIOT PROIZVOD, SPORED KLASIFIKACIJATA NKD, 2008 (prodol`enie)SECTIONS, SUBSECTIONS AND DIVISIONS GROSS DOMESTIC PRODUCT, 2008 (continued)At current prices
In million denars
Sredstva na vrabote-
nite
Bruto-deloven vi{ok
Amorti-zacija
Neto-deloven vi{ok
Broj na vraboteni i
samovra-boteni 2)
NACE Section
Compensation of employees
Gross operating
surplus
Depre-ciation
Net operating surplus
Number of employees and self-
employed 2)
NACE Division
11 205 21 929 9 320 12 609 32 268
11 204 21 929 9 320 12 609 32 267 5 012 4 024 3 468 556 23 306 60 Land transport; transport via pipelines
13 68 4 64 42 61 Water transport
108 - 44 99 - 143 177 62 Air transport
1 708 4 958 437 4 521 3 044 63 Supporting and auxiliary transport activities; activities of travel agencies
4 363 12 923 5 312 7 611 5 698 64 Post and telecommunications
5 474 5 616 1 362 4 254 8 471 5 474 5 616 1 362 4 254 8 471 4 277 5 009 1 213 3 796 6 946 65 Financial intermediation, except insurance
and pension funding
1 085 587 131 456 1 383 66 Insurance and pension funding, except compulsory social security
112 20 18 2 142 67 Activities auxiliary to financial intermediation
8 070 9 276 2 088 7 187 25 906
8 071 9 275 2 089 7 187 25 906
566 378 367 11 1 094 70 Real estate activities
53 126 81 45 251 71 Renting of machinery and equipment without operator and of personal and household goods
1 007 1 691 305 1 387 2 235 72 Computer and related activities
301 270 200 70 754 73 Research and development
6 144 6 810 1 136 5 674 21 572 74 Other business activities
22 113 4 564 4 564 0 41 861
22 113 4 564 4 564 0 41 861
22 113 4 564 4 564 0 41 861 75 Public administration and defence; compulsory social security
J FINANCIAL INTERMEDIATIONJJ Financial intermediation
K REAL ESTATE, RENTING AND BUSINESS ACTIVITIES
KK Real estate, renting and business activities
NACE Subsec
tion
LL Public administration and defence; compulsory social security
L PUBLIC ADMINISTRATION AND DEFENCE; COMPULSORY SOCIAL SECURITY
I TRANSPORT, STORAGE AND COMMUNICATION
II Transport, storage and communication
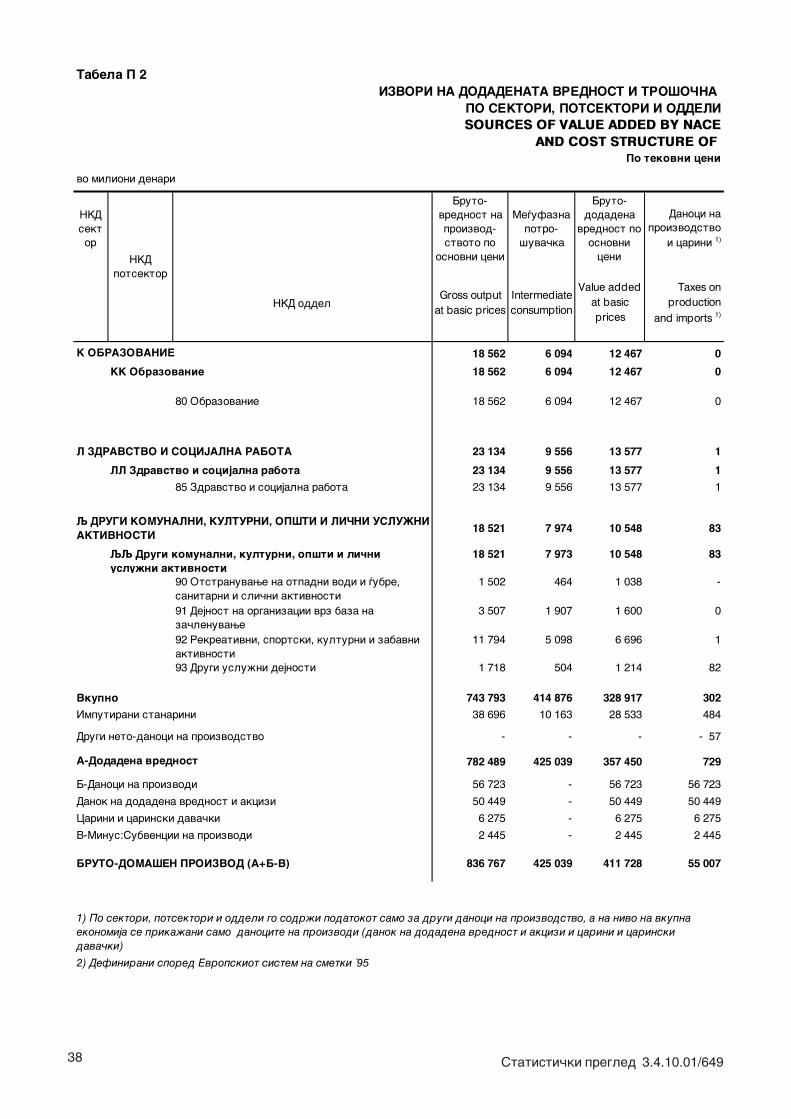
38 Statisti~ki pregled 3.4.10.01/649
IZVORI NA DODADENATA VREDNOST I TRO[O^NA PO SEKTORI, POTSEKTORI I ODDELISOURCES OF VALUE ADDED BY NACE
AND COST STRUCTURE OF Po tekovni ceni
NKD sektor
Bruto-vrednost na proizvod- stvoto po
osnovni ceni
Me|ufazna potro-
{uva~ka
Bruto-dodadena
vrednost po osnovni
ceni
Danoci na proizvodstvo
i carini 1)
NKD oddelGross output
at basic pricesIntermediate consumption
Value added at basic prices
Taxes on production
and imports 1)
18 562 6 094 12 467 0
18 562 6 094 12 467 0
80 Obrazovanie 18 562 6 094 12 467 0
23 134 9 556 13 577 1
23 134 9 556 13 577 1
85 Zdravstvo i socijalna rabota 23 134 9 556 13 577 1
18 521 7 974 10 548 83
18 521 7 973 10 548 83
90 Otstranuvawe na otpadni vodi i |ubre, sanitarni i sli~ni aktivnosti
1 502 464 1 038 -
91 Dejnost na organizacii vrz baza na za~lenuvawe
3 507 1 907 1 600 0
92 Rekreativni, sportski, kulturni i zabavni aktivnosti
11 794 5 098 6 696 1
93 Drugi uslu`ni dejnosti 1 718 504 1 214 82
743 793 414 876 328 917 302
38 696 10 163 28 533 484
- - - - 57
782 489 425 039 357 450 729
56 723 - 56 723 56 723
50 449 - 50 449 50 449
6 275 - 6 275 6 275
2 445 - 2 445 2 445
836 767 425 039 411 728 55 007
2) Definirani spored Evropskiot sistem na smetki '95
Danok na dodadena vrednost i akcizi
V-Minus:Subvencii na proizvodi
1) Po sektori, potsektori i oddeli go sodr`i podatokot samo za drugi danoci na proizvodstvo, a na nivo na vkupna ekonomija se prika`ani samo danocite na proizvodi (danok na dodadena vrednost i akcizi i carini i carinski dava~ki)
BRUTO-DOMA[EN PROIZVOD (A+B-V)
A-Dodadena vrednost
Imputirani stanarini
Carini i carinski dava~ki
Drugi neto-danoci na proizvodstvo
B-Danoci na proizvodi
NKD potsektor
Tabela P 2
vo milioni denari
LL Zdravstvo i socijalna rabota
K OBRAZOVANIE
KK Obrazovanie
L ZDRAVSTVO I SOCIJALNA RABOTA
Vkupno
QQ Drugi komunalni, kulturni, op{ti i li~ni uslu`ni aktivnosti
Q DRUGI KOMUNALNI, KULTURNI, OP[TI I LI^NI USLU@NI AKTIVNOSTI
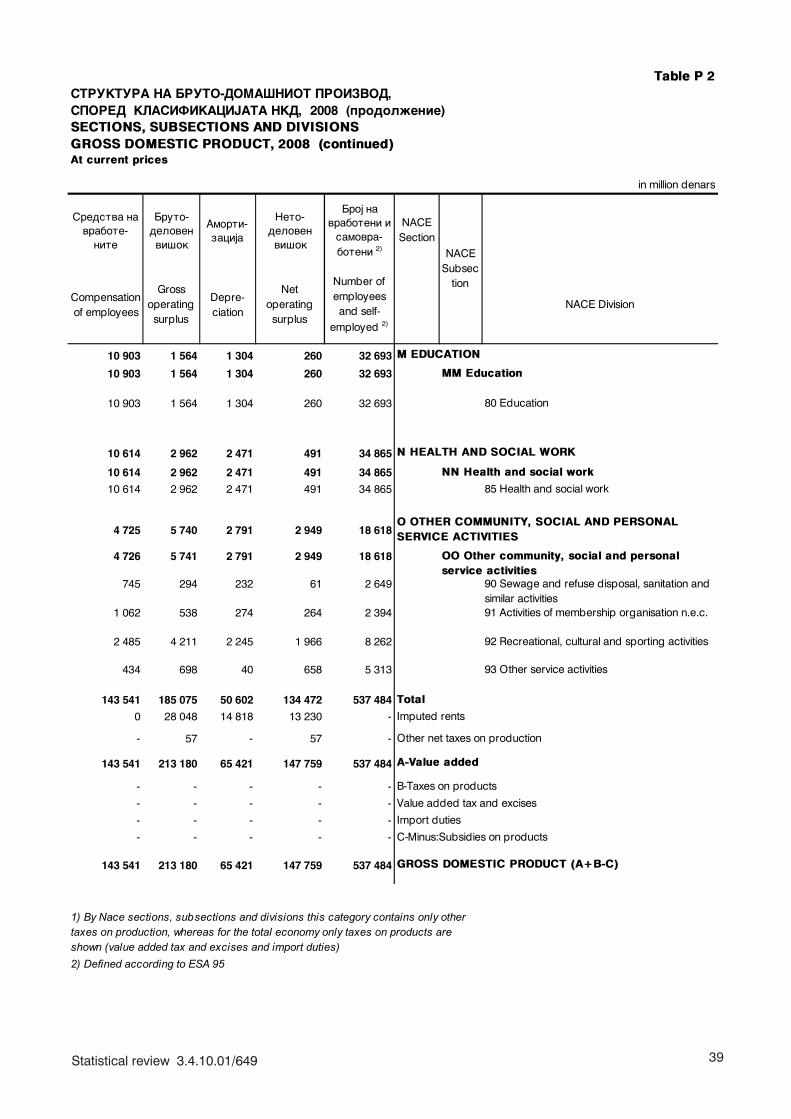
39Statistical review 3.4.10.01/649
Table P 2STRUKTURA NA BRUTO-DOMA[NIOT PROIZVOD, SPORED KLASIFIKACIJATA NKD, 2008 (prodol`enie)SECTIONS, SUBSECTIONS AND DIVISIONS GROSS DOMESTIC PRODUCT, 2008 (continued)At current prices
in million denars
Sredstva na vrabote-
nite
Bruto-deloven vi{ok
Amorti-zacija
Neto-deloven vi{ok
Broj na vraboteni i
samovra-boteni 2)
NACE Section
Compensation of employees
Gross operating
surplus
Depre-ciation
Net operating surplus
Number of employees and self-
employed 2)
NACE Division
10 903 1 564 1 304 260 32 693
10 903 1 564 1 304 260 32 693
10 903 1 564 1 304 260 32 693 80 Education
10 614 2 962 2 471 491 34 865
10 614 2 962 2 471 491 34 865
10 614 2 962 2 471 491 34 865 85 Health and social work
4 725 5 740 2 791 2 949 18 618
4 726 5 741 2 791 2 949 18 618
745 294 232 61 2 649 90 Sewage and refuse disposal, sanitation and similar activities
1 062 538 274 264 2 394 91 Activities of membership organisation n.e.c.
2 485 4 211 2 245 1 966 8 262 92 Recreational, cultural and sporting activities
434 698 40 658 5 313 93 Other service activities
143 541 185 075 50 602 134 472 537 484
0 28 048 14 818 13 230 -
- 57 - 57 -
143 541 213 180 65 421 147 759 537 484
- - - - -
- - - - -
- - - - -
- - - - -
143 541 213 180 65 421 147 759 537 484
2) Defined according to ESA 95
Total
O OTHER COMMUNITY, SOCIAL AND PERSONAL SERVICE ACTIVITIES
OO Other community, social and personal service activities
Imputed rents
C-Minus:Subsidies on products
Value added tax and excises
Import duties
Other net taxes on production
A-Value added
NACE Subsec
tion
N HEALTH AND SOCIAL WORK
M EDUCATION
MM Education
NN Health and social work
GROSS DOMESTIC PRODUCT (A+B-C)
1) By Nace sections, subsections and divisions this category contains only other taxes on production, whereas for the total economy only taxes on products are shown (value added tax and excises and import duties)
B-Taxes on products
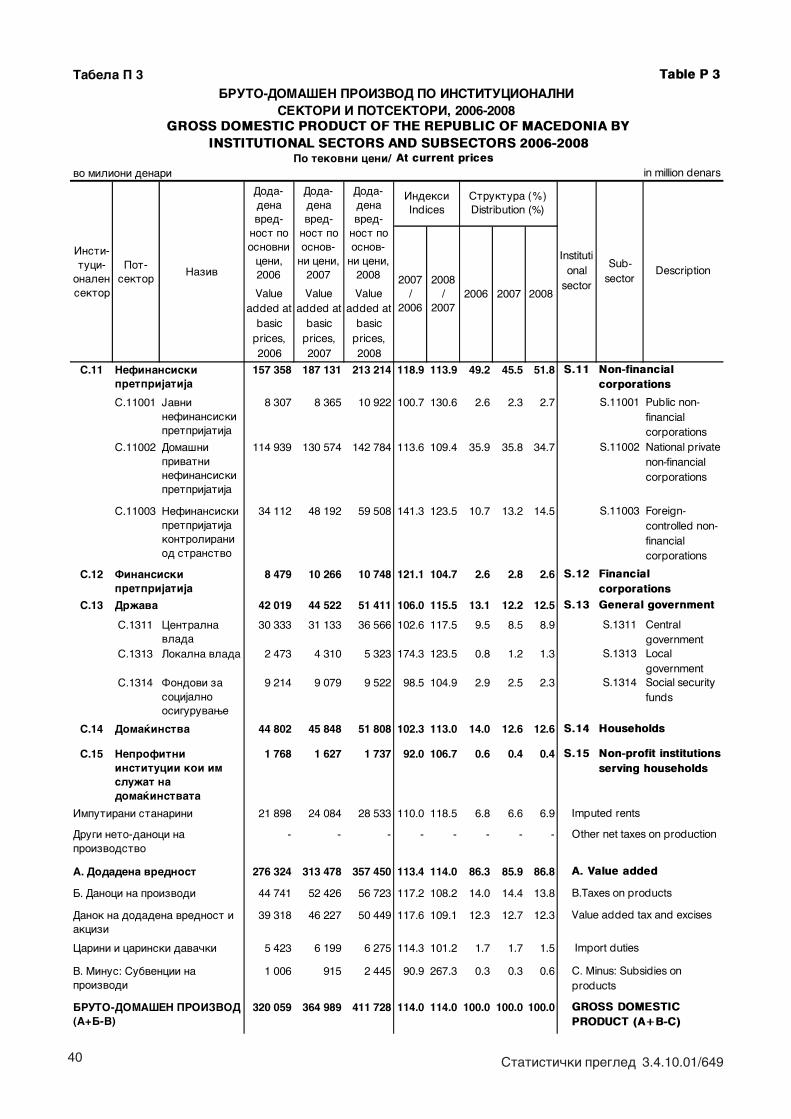
40 Statisti~ki pregled 3.4.10.01/649
Tabela P 3 Table P 3
vo milioni denari in million denars
Value added at
basic prices, 2006
Value added at
basic prices, 2007
Value added at
basic prices, 2008
S.11 157 358 187 131 213 214 118.9 113.9 49.2 45.5 51.8
S.11001 Javni nefinansiski pretprijatija
8 307 8 365 10 922 100.7 130.6 2.6 2.3 2.7 S.11001 Public non-financial corporations
S.11002 Doma{ni privatni nefinansiski pretprijatija
114 939 130 574 142 784 113.6 109.4 35.9 35.8 34.7 S.11002 National private non-financial corporations
S.11003 Nefinansiski pretprijatija kontrolirani od stranstvo
34 112 48 192 59 508 141.3 123.5 10.7 13.2 14.5 S.11003 Foreign-controlled non-financial corporations
S.12 8 479 10 266 10 748 121.1 104.7 2.6 2.8 2.6
S.13 42 019 44 522 51 411 106.0 115.5 13.1 12.2 12.5
S.1311 Centralna vlada
30 333 31 133 36 566 102.6 117.5 9.5 8.5 8.9 S.1311 Central government
S.1313 Lokalna vlada 2 473 4 310 5 323 174.3 123.5 0.8 1.2 1.3 S.1313 Local government
S.1314 Fondovi za socijalno osiguruvawe
9 214 9 079 9 522 98.5 104.9 2.9 2.5 2.3 S.1314 Social security funds
S.14 44 802 45 848 51 808 102.3 113.0 14.0 12.6 12.6
S.15 1 768 1 627 1 737 92.0 106.7 0.6 0.4 0.4
21 898 24 084 28 533 110.0 118.5 6.8 6.6 6.9 Imputed rents
- - - - - - - - Other net taxes on production
276 324 313 478 357 450 113.4 114.0 86.3 85.9 86.8 A. Value added
44 741 52 426 56 723 117.2 108.2 14.0 14.4 13.8 B.Taxes on products
39 318 46 227 50 449 117.6 109.1 12.3 12.7 12.3 Value added tax and excises
5 423 6 199 6 275 114.3 101.2 1.7 1.7 1.5 Import duties
1 006 915 2 445 90.9 267.3 0.3 0.3 0.6
320 059 364 989 411 728 114.0 114.0 100.0 100.0 100.0
Drugi neto-danoci na proizvodstvo
GROSS DOMESTIC PRODUCT (A+B-C)
B. Danoci na proizvodi
Danok na dodadena vrednost i akcizi
Carini i carinski dava~ki
V. Minus: Subvencii na proizvodi
BRUTO-DOMA[EN PROIZVOD (A+B-V)
A. Dodadena vrednost
C. Minus: Subsidies on products
Imputirani stanarini
Doma}instva
Neprofitni institucii koi im slu`at na doma}instvata
Doda-dena vred-
nost po osnovni
ceni, 2006
Nefinansiski pretprijatija
BRUTO-DOMA[EN PROIZVOD PO INSTITUCIONALNI SEKTORI I POTSEKTORI, 2006-2008
S.12
S.11
S.13
Institutional
sector
Insti-tuci-
onalen sektor 2008
Description
Finansiski pretprijatija
Dr`ava
S.15
S.14
Financial corporationsGeneral government
Non-profit institutions serving households
Households
Non-financial corporations
NazivPot-
sektorSub-
sector20072006
2008 /
2007
2007 /
2006
GROSS DOMESTIC PRODUCT OF THE REPUBLIC OF MACEDONIA BY INSTITUTIONAL SECTORS AND SUBSECTORS 2006-2008
Doda-dena vred-
nost po osnov-
ni ceni, 2007
Doda-dena vred-
nost po osnov-
ni ceni, 2008
Struktura (%) Distribution (%)
Indeksi Indices
Po tekovni ceni/ At current prices
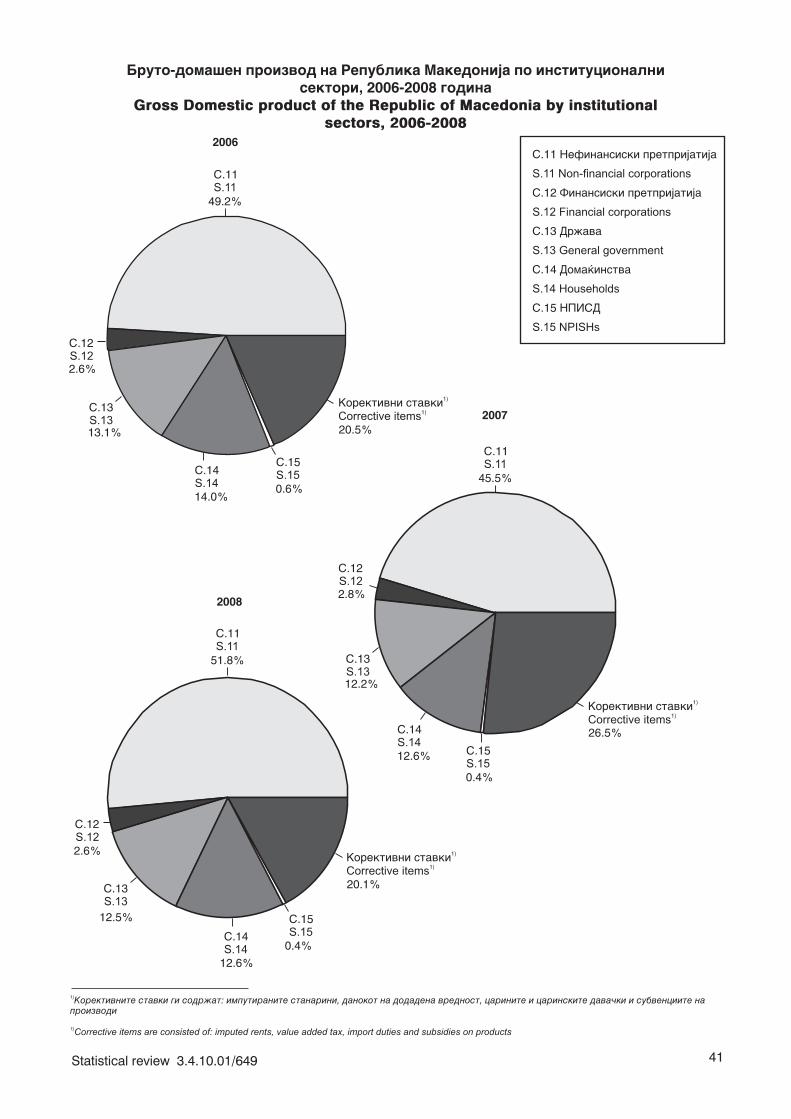
41Statistical review 3.4.10.01/649
Bruto-doma{en proizvod na Republika Makedonija po institucionalnisektori, 2006-2008 godina
Gross Domestic product of the Republic of Macedonia by institutionalsectors, 2006-2008
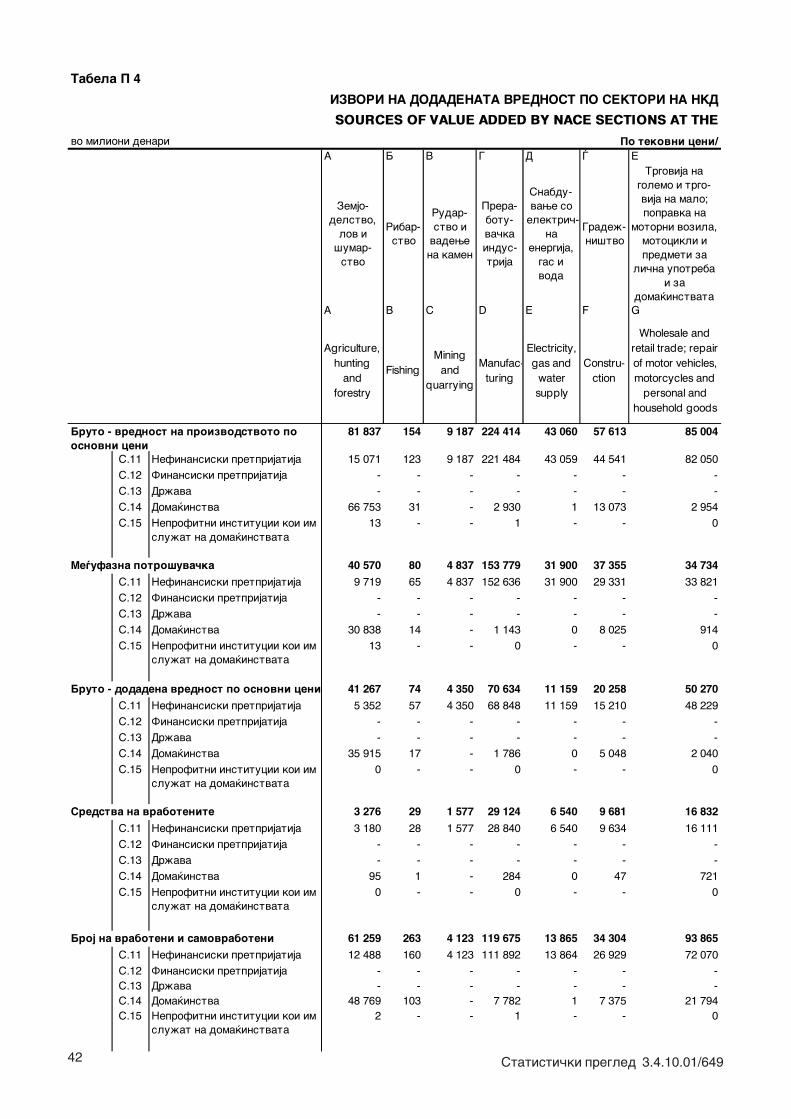
42 Statisti~ki pregled 3.4.10.01/649
Tabela P 4
SOURCES OF VALUE ADDED BY NACE SECTIONS AT THE
Po tekovni ceni/A B V G D \ E
Zemjo- delstvo,
lov i {umar-
stvo
Ribar- stvo
Rudar-stvo i
vadewe na kamen
Prera- botu- va~ka indus- trija
Snabdu- vawe so
elektri~-na
energija, gas i voda
Grade`- ni{tvo
Trgovija na golemo i trgo- vija na malo; popravka na
motorni vozila, motocikli i predmeti za
li~na upotreba i za
doma}instvataA B C D E F G
Agriculture, hunting
and forestry
FishingMining
and quarrying
Manufac-turing
Electricity, gas and
water supply
Constru- ction
Wholesale and retail trade; repair of motor vehicles, motorcycles and
personal and household goods
81 837 154 9 187 224 414 43 060 57 613 85 004
S.11 Nefinansiski pretprijatija 15 071 123 9 187 221 484 43 059 44 541 82 050
S.12 Finansiski pretprijatija - - - - - - -
S.13 Dr`ava - - - - - - -
S.14 Doma}instva 66 753 31 - 2 930 1 13 073 2 954
S.15 Neprofitni institucii koi im slu`at na doma}instvata
13 - - 1 - - 0
40 570 80 4 837 153 779 31 900 37 355 34 734
S.11 Nefinansiski pretprijatija 9 719 65 4 837 152 636 31 900 29 331 33 821
S.12 Finansiski pretprijatija - - - - - - -
S.13 Dr`ava - - - - - - -
S.14 Doma}instva 30 838 14 - 1 143 0 8 025 914
S.15 Neprofitni institucii koi im slu`at na doma}instvata
13 - - 0 - - 0
41 267 74 4 350 70 634 11 159 20 258 50 270
S.11 Nefinansiski pretprijatija 5 352 57 4 350 68 848 11 159 15 210 48 229
S.12 Finansiski pretprijatija - - - - - - -
S.13 Dr`ava - - - - - - -
S.14 Doma}instva 35 915 17 - 1 786 0 5 048 2 040
S.15 Neprofitni institucii koi im slu`at na doma}instvata
0 - - 0 - - 0
3 276 29 1 577 29 124 6 540 9 681 16 832
S.11 Nefinansiski pretprijatija 3 180 28 1 577 28 840 6 540 9 634 16 111
S.12 Finansiski pretprijatija - - - - - - -
S.13 Dr`ava - - - - - - -
S.14 Doma}instva 95 1 - 284 0 47 721
S.15 Neprofitni institucii koi im slu`at na doma}instvata
0 - - 0 - - 0
61 259 263 4 123 119 675 13 865 34 304 93 865
S.11 Nefinansiski pretprijatija 12 488 160 4 123 111 892 13 864 26 929 72 070
S.12 Finansiski pretprijatija - - - - - - -S.13 Dr`ava - - - - - - -S.14 Doma}instva 48 769 103 - 7 782 1 7 375 21 794S.15 Neprofitni institucii koi im
slu`at na doma}instvata 2 - - 1 - - 0
Bruto - dodadena vrednost po osnovni ceni
Sredstva na vrabotenite
Broj na vraboteni i samovraboteni
IZVORI NA DODADENATA VREDNOST PO SEKTORI NA NKD
Bruto - vrednost na proizvodstvoto po osnovni ceni
Me|ufazna potro{uva~ka
vo milioni denari
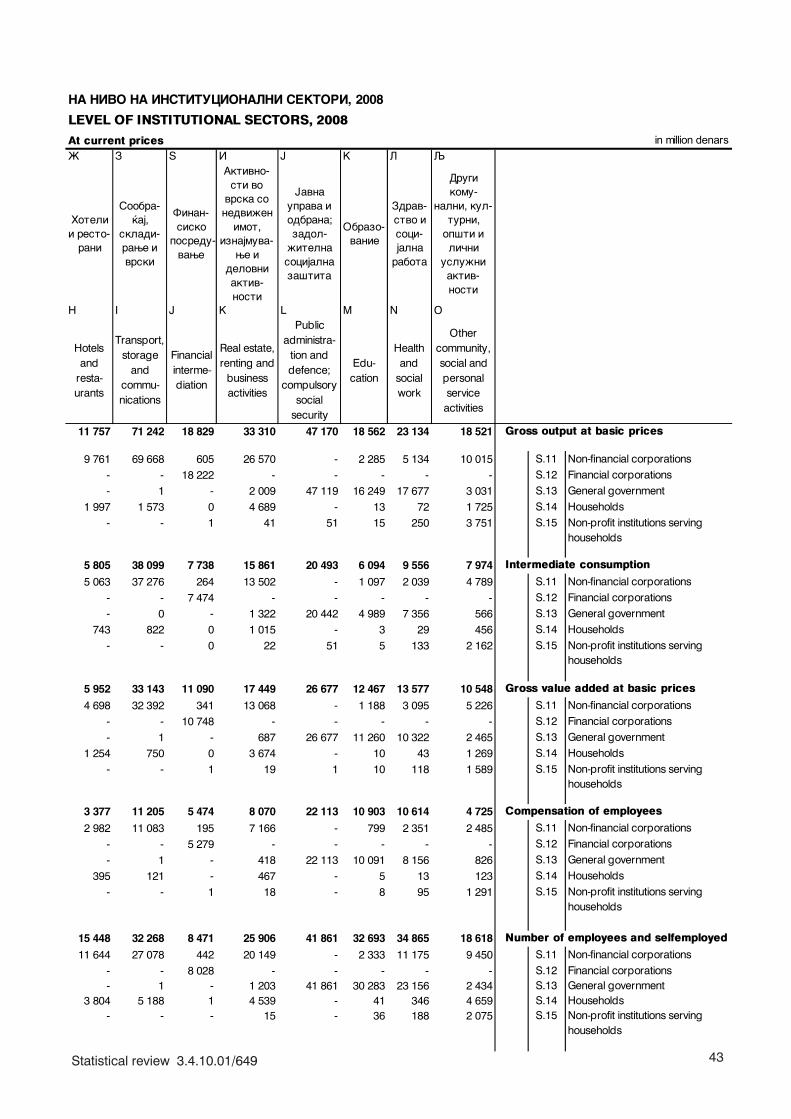
43Statistical review 3.4.10.01/649
LEVEL OF INSTITUTIONAL SECTORS, 2008
At current prices in million denars@ Z Y I J K L Q
Hoteli i resto-
rani
Soobra-}aj,
skladi-rawe i vrski
Finan- sisko
posredu- vawe
Aktivno-sti vo
vrska so nedvi`en
imot, iznajmuva-
we i delovni aktiv-nosti
Javna uprava i odbrana; zadol-
`itelna socijalna za{tita
Obrazo- vanie
Zdrav-stvo i soci-jalna
rabota
Drugi komu-
nalni, kul-turni,
op{ti i li~ni
uslu`ni aktiv-nosti
H I J K L M N O
Hotels and
resta-urants
Transport, storage
and commu-nications
Financial interme-diation
Real estate, renting and
business activities
Public administra-
tion and defence;
compulsory social
security
Edu-cation
Health and
social work
Other community, social and personal service
activities
11 757 71 242 18 829 33 310 47 170 18 562 23 134 18 521
9 761 69 668 605 26 570 - 2 285 5 134 10 015 S.11 Non-financial corporations- - 18 222 - - - - - S.12 Financial corporations- 1 - 2 009 47 119 16 249 17 677 3 031 S.13 General government
1 997 1 573 0 4 689 - 13 72 1 725 S.14 Households- - 1 41 51 15 250 3 751 S.15 Non-profit institutions serving
households
5 805 38 099 7 738 15 861 20 493 6 094 9 556 7 974
5 063 37 276 264 13 502 - 1 097 2 039 4 789 S.11 Non-financial corporations- - 7 474 - - - - - S.12 Financial corporations- 0 - 1 322 20 442 4 989 7 356 566 S.13 General government
743 822 0 1 015 - 3 29 456 S.14 Households- - 0 22 51 5 133 2 162 S.15 Non-profit institutions serving
households
5 952 33 143 11 090 17 449 26 677 12 467 13 577 10 548
4 698 32 392 341 13 068 - 1 188 3 095 5 226 S.11 Non-financial corporations- - 10 748 - - - - - S.12 Financial corporations- 1 - 687 26 677 11 260 10 322 2 465 S.13 General government
1 254 750 0 3 674 - 10 43 1 269 S.14 Households- - 1 19 1 10 118 1 589 S.15 Non-profit institutions serving
households
3 377 11 205 5 474 8 070 22 113 10 903 10 614 4 725
2 982 11 083 195 7 166 - 799 2 351 2 485 S.11 Non-financial corporations
- - 5 279 - - - - - S.12 Financial corporations
- 1 - 418 22 113 10 091 8 156 826 S.13 General government
395 121 - 467 - 5 13 123 S.14 Households
- - 1 18 - 8 95 1 291 S.15 Non-profit institutions serving households
15 448 32 268 8 471 25 906 41 861 32 693 34 865 18 618
11 644 27 078 442 20 149 - 2 333 11 175 9 450 S.11 Non-financial corporations- - 8 028 - - - - - S.12 Financial corporations- 1 - 1 203 41 861 30 283 23 156 2 434 S.13 General government
3 804 5 188 1 4 539 - 41 346 4 659 S.14 Households- - - 15 - 36 188 2 075 S.15 Non-profit institutions serving
households
Number of employees and selfemployed
Gross output at basic prices
Intermediate consumption
Gross value added at basic prices
Compensation of employees
NA NIVO NA INSTITUCIONALNI SEKTORI, 2008
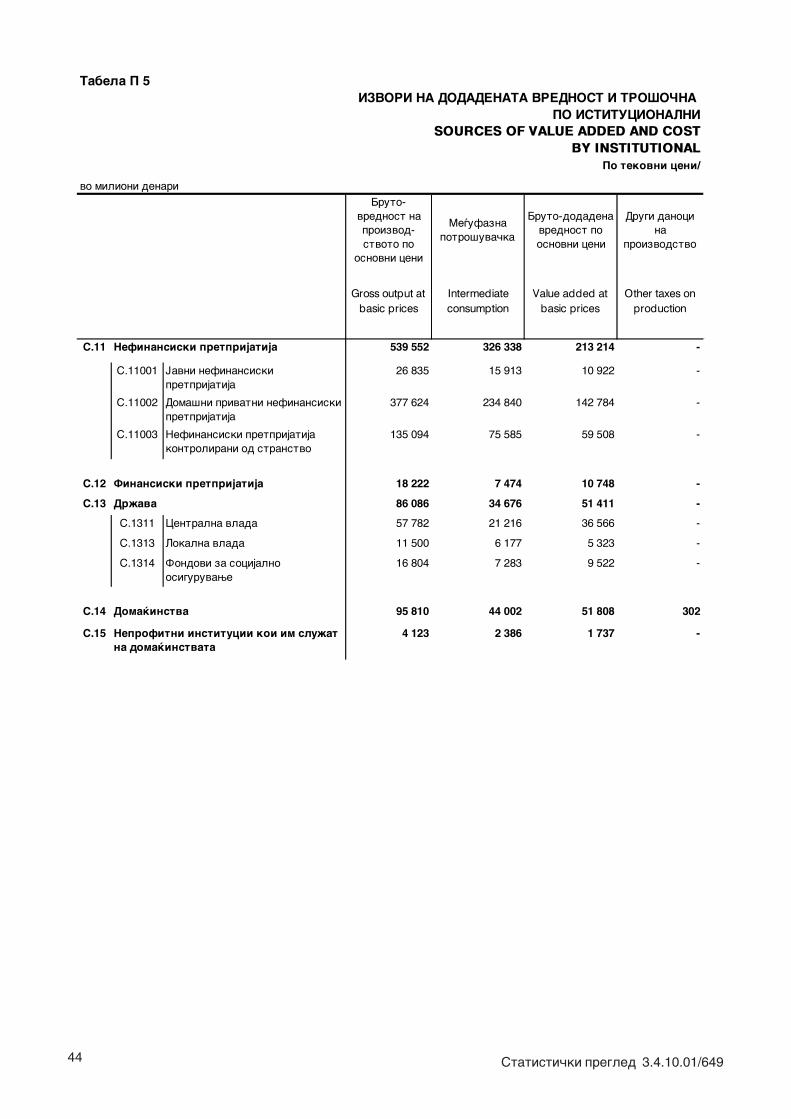
44 Statisti~ki pregled 3.4.10.01/649
IZVORI NA DODADENATA VREDNOST I TRO[O^NA PO ISTITUCIONALNI
SOURCES OF VALUE ADDED AND COSTBY INSTITUTIONAL
Po tekovni ceni/
Bruto-vrednost na proizvod- stvoto po
osnovni ceni
Me|ufazna potro{uva~ka
Bruto-dodadena vrednost po osnovni ceni
Drugi danoci na
proizvodstvo
Gross output at basic prices
Intermediate consumption
Value added at basic prices
Other taxes on production
S.11 539 552 326 338 213 214 -
S.11001 Javni nefinansiski pretprijatija
26 835 15 913 10 922 -
S.11002 Doma{ni privatni nefinansiski pretprijatija
377 624 234 840 142 784 -
S.11003 Nefinansiski pretprijatija kontrolirani od stranstvo
135 094 75 585 59 508 -
S.12 18 222 7 474 10 748 -
S.13 86 086 34 676 51 411 -
S.1311 Centralna vlada 57 782 21 216 36 566 -
S.1313 Lokalna vlada 11 500 6 177 5 323 -
S.1314 Fondovi za socijalno osiguruvawe
16 804 7 283 9 522 -
S.14 95 810 44 002 51 808 302
S.15 4 123 2 386 1 737 -Neprofitni institucii koi im slu`at na doma}instvata
Tabela P 5
Nefinansiski pretprijatija
Finansiski pretprijatija
Dr`ava
Doma}instva
vo milioni denari
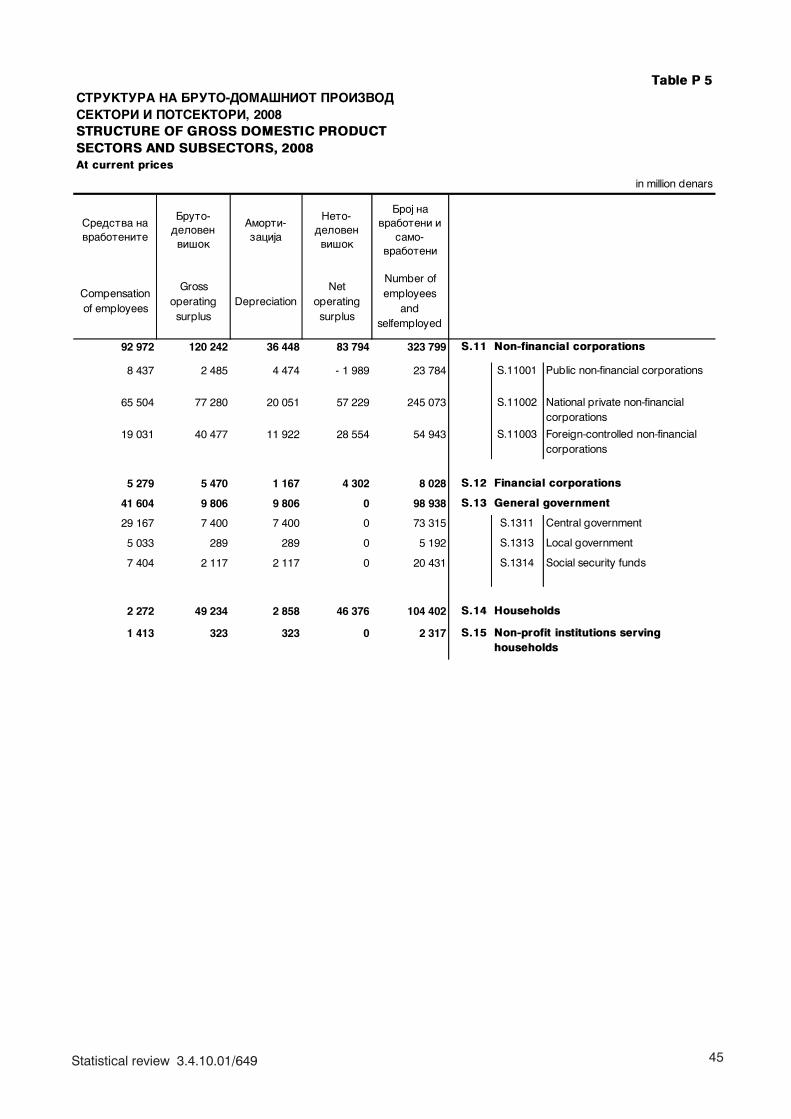
45Statistical review 3.4.10.01/649
Table P 5STRUKTURA NA BRUTO-DOMA[NIOT PROIZVOD SEKTORI I POTSEKTORI, 2008STRUCTURE OF GROSS DOMESTIC PRODUCTSECTORS AND SUBSECTORS, 2008At current prices
in million denars
Sredstva na vrabotenite
Bruto-deloven vi{ok
Amorti-zacija
Neto-deloven vi{ok
Broj na vraboteni i
samo-vraboteni
Compensation of employees
Gross operating
surplusDepreciation
Net operating surplus
Number of employees
and selfemployed
92 972 120 242 36 448 83 794 323 799 S.11
8 437 2 485 4 474 - 1 989 23 784 S.11001 Public non-financial corporations
65 504 77 280 20 051 57 229 245 073 S.11002 National private non-financial corporations
19 031 40 477 11 922 28 554 54 943 S.11003 Foreign-controlled non-financial corporations
5 279 5 470 1 167 4 302 8 028 S.12
41 604 9 806 9 806 0 98 938 S.13
29 167 7 400 7 400 0 73 315 S.1311 Central government
5 033 289 289 0 5 192 S.1313 Local government
7 404 2 117 2 117 0 20 431 S.1314 Social security funds
2 272 49 234 2 858 46 376 104 402 S.14
1 413 323 323 0 2 317 S.15
Non-financial corporations
Financial corporations
General government
Households
Non-profit institutions serving households
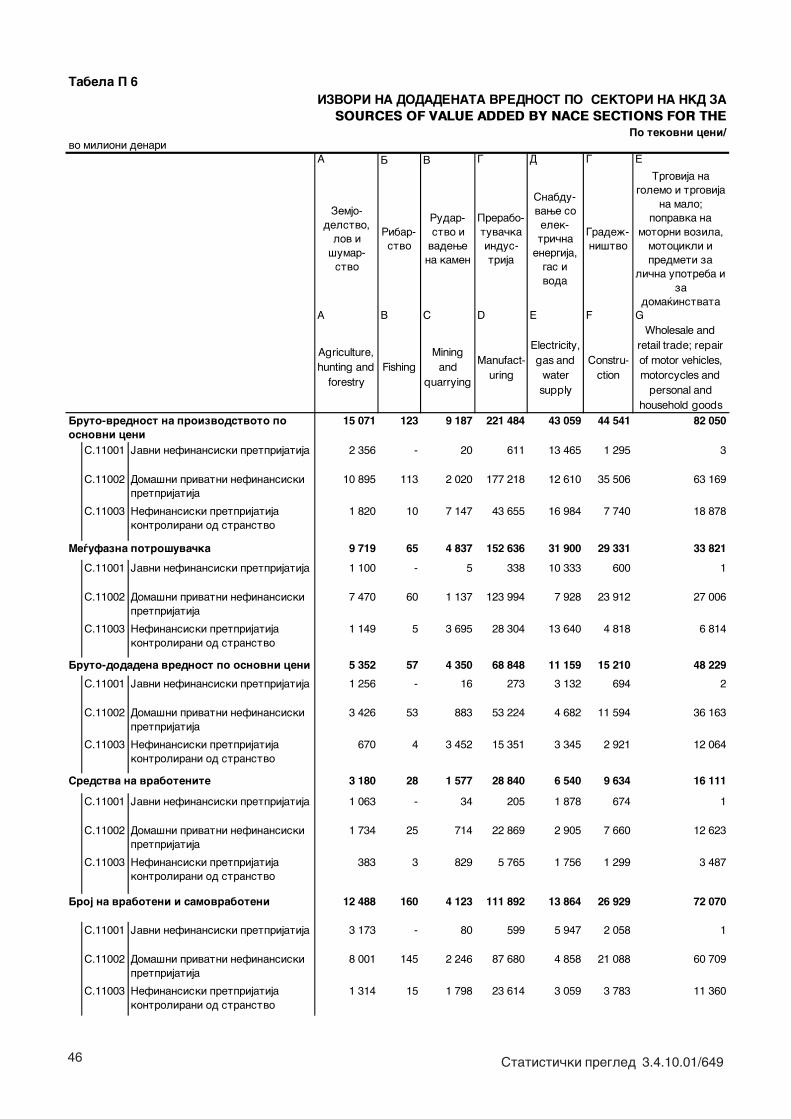
46 Statisti~ki pregled 3.4.10.01/649
A B V G D \ E
Zemjo- delstvo,
lov i {umar-
stvo
Ribar- stvo
Rudar-stvo i
vadewe na kamen
Prerabo- tuva~ka indus- trija
Snabdu- vawe so elek-tri~na
energija, gas i voda
Grade`- ni{tvo
Trgovija na golemo i trgovija
na malo; popravka na
motorni vozila, motocikli i predmeti za
li~na upotreba i za
doma}instvataA B C D E F G
Agriculture, hunting and
forestryFishing
Mining and
quarrying
Manufact-uring
Electricity, gas and
water supply
Constru-ction
Wholesale and retail trade; repair of motor vehicles, motorcycles and
personal and household goods
15 071 123 9 187 221 484 43 059 44 541 82 050
S.11001 Javni nefinansiski pretprijatija 2 356 - 20 611 13 465 1 295 3
S.11002 Doma{ni privatni nefinansiski pretprijatija
10 895 113 2 020 177 218 12 610 35 506 63 169
S.11003 Nefinansiski pretprijatija kontrolirani od stranstvo
1 820 10 7 147 43 655 16 984 7 740 18 878
9 719 65 4 837 152 636 31 900 29 331 33 821
S.11001 Javni nefinansiski pretprijatija 1 100 - 5 338 10 333 600 1
S.11002 Doma{ni privatni nefinansiski pretprijatija
7 470 60 1 137 123 994 7 928 23 912 27 006
S.11003 Nefinansiski pretprijatija kontrolirani od stranstvo
1 149 5 3 695 28 304 13 640 4 818 6 814
5 352 57 4 350 68 848 11 159 15 210 48 229
S.11001 Javni nefinansiski pretprijatija 1 256 - 16 273 3 132 694 2
S.11002 Doma{ni privatni nefinansiski pretprijatija
3 426 53 883 53 224 4 682 11 594 36 163
S.11003 Nefinansiski pretprijatija kontrolirani od stranstvo
670 4 3 452 15 351 3 345 2 921 12 064
3 180 28 1 577 28 840 6 540 9 634 16 111
S.11001 Javni nefinansiski pretprijatija 1 063 - 34 205 1 878 674 1
S.11002 Doma{ni privatni nefinansiski pretprijatija
1 734 25 714 22 869 2 905 7 660 12 623
S.11003 Nefinansiski pretprijatija kontrolirani od stranstvo
383 3 829 5 765 1 756 1 299 3 487
12 488 160 4 123 111 892 13 864 26 929 72 070
S.11001 Javni nefinansiski pretprijatija 3 173 - 80 599 5 947 2 058 1
S.11002 Doma{ni privatni nefinansiski pretprijatija
8 001 145 2 246 87 680 4 858 21 088 60 709
S.11003 Nefinansiski pretprijatija kontrolirani od stranstvo
1 314 15 1 798 23 614 3 059 3 783 11 360
Bruto-vrednost na proizvodstvoto po osnovni ceni
Me|ufazna potro{uva~ka
Broj na vraboteni i samovraboteni
Bruto-dodadena vrednost po osnovni ceni
Sredstva na vrabotenite
SOURCES OF VALUE ADDED BY NACE SECTIONS FOR THE
vo milioni denari
Tabela P 6IZVORI NA DODADENATA VREDNOST PO SEKTORI NA NKD ZA
Po tekovni ceni/
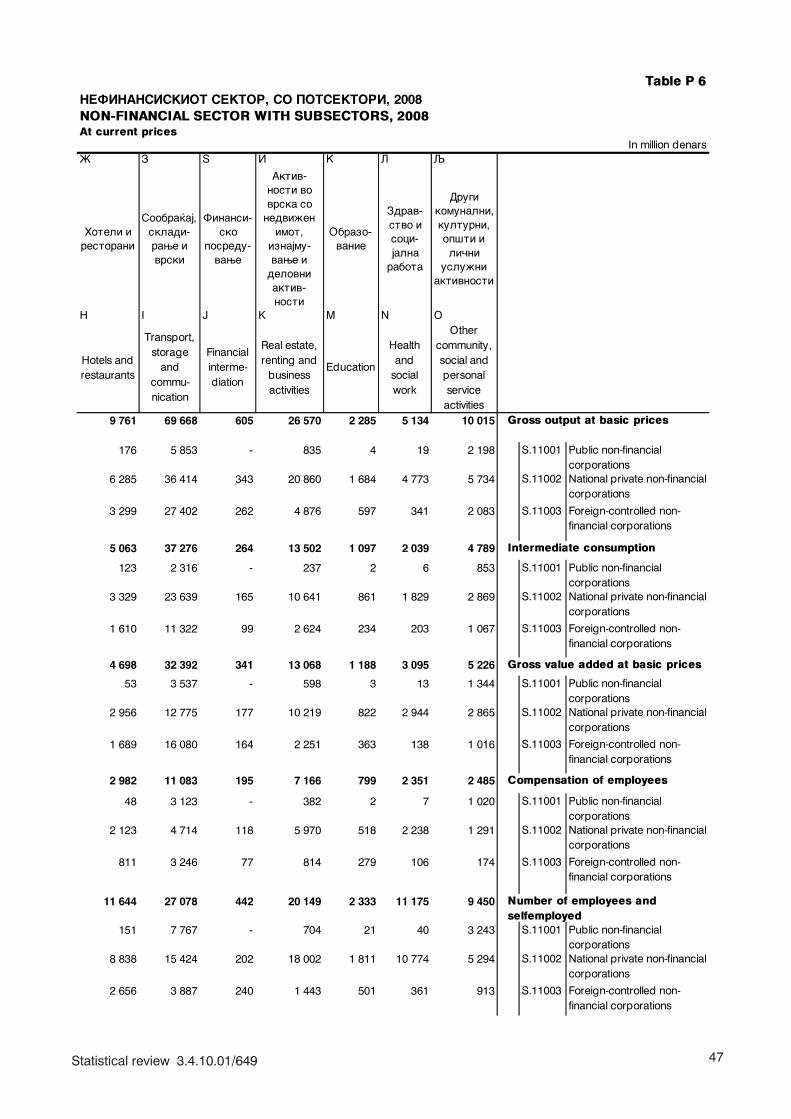
47Statistical review 3.4.10.01/649
Table P 6NEFINANSISKIOT SEKTOR, SO POTSEKTORI, 2008NON-FINANCIAL SECTOR WITH SUBSECTORS, 2008
In million denars@ Z Y I K L Q
Hoteli i restorani
Soobra}aj, skladi-rawe i vrski
Finansi-sko
posredu-vawe
Aktiv-nosti vo vrska so
nedvi`en imot,
iznajmu-vawe i
delovni aktiv-nosti
Obrazo- vanie
Zdrav-stvo i soci-jalna
rabota
Drugi komunalni, kulturni, op{ti i li~ni
uslu`ni aktivnosti
H I J K M N O
Hotels and restaurants
Transport, storage
and commu-nication
Financial interme-diation
Real estate, renting and
business activities
Education
Health and
social work
Other community, social and personal service
activities 9 761 69 668 605 26 570 2 285 5 134 10 015 Gross output at basic prices
176 5 853 - 835 4 19 2 198 S.11001 Public non-financial corporations
6 285 36 414 343 20 860 1 684 4 773 5 734 S.11002 National private non-financial corporations
3 299 27 402 262 4 876 597 341 2 083 S.11003 Foreign-controlled non-financial corporations
5 063 37 276 264 13 502 1 097 2 039 4 789
123 2 316 - 237 2 6 853 S.11001 Public non-financial corporations
3 329 23 639 165 10 641 861 1 829 2 869 S.11002 National private non-financial corporations
1 610 11 322 99 2 624 234 203 1 067 S.11003 Foreign-controlled non-financial corporations
4 698 32 392 341 13 068 1 188 3 095 5 226 Gross value added at basic prices
53 3 537 - 598 3 13 1 344 S.11001 Public non-financial corporations
2 956 12 775 177 10 219 822 2 944 2 865 S.11002 National private non-financial corporations
1 689 16 080 164 2 251 363 138 1 016 S.11003 Foreign-controlled non-financial corporations
2 982 11 083 195 7 166 799 2 351 2 485 Compensation of employees
48 3 123 - 382 2 7 1 020 S.11001 Public non-financial corporations
2 123 4 714 118 5 970 518 2 238 1 291 S.11002 National private non-financial corporations
811 3 246 77 814 279 106 174 S.11003 Foreign-controlled non-financial corporations
11 644 27 078 442 20 149 2 333 11 175 9 450
151 7 767 - 704 21 40 3 243 S.11001 Public non-financial corporations
8 838 15 424 202 18 002 1 811 10 774 5 294 S.11002 National private non-financial corporations
2 656 3 887 240 1 443 501 361 913 S.11003 Foreign-controlled non-financial corporations
Intermediate consumption
Number of employees and selfemployed
At current prices
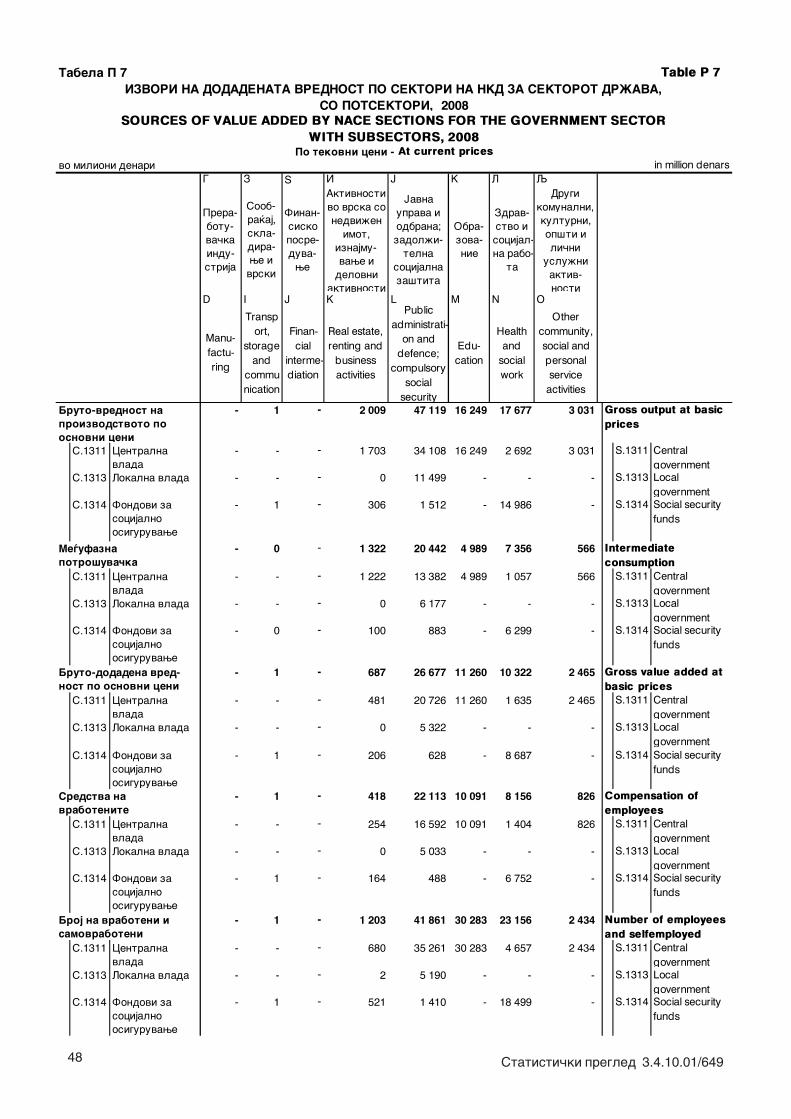
48 Statisti~ki pregled 3.4.10.01/649
Tabela P 7 Table P 7
in million denarsG Z Y I J K L Q
Prera-botu-va~ka indu-strija
Soob-ra}aj, skla-dira-we i
vrski
Finan- sisko posre- duva-
we
Aktivnosti vo vrska so nedvi`en
imot, iznajmu- vawe i
delovni aktivnosti
Javna uprava i odbrana; zadol`i-
telna socijalna za{tita
Obra-zova-nie
Zdrav- stvo i socijal-na rabo-
ta
Drugi komunalni, kulturni, op{ti i li~ni
uslu`ni aktiv-nosti
D I J K L M N O
Manu-factu-ring
Transport,
storage and
communication
Finan-cial
interme- diation
Real estate, renting and
business activities
Public administrati-
on and defence;
compulsory social
security
Edu- cation
Health and
social work
Other community, social and personal service
activities
- 1 - 2 009 47 119 16 249 17 677 3 031
S.1311 Centralna vlada
- - - 1 703 34 108 16 249 2 692 3 031 S.1311 Central government
S.1313 Lokalna vlada - - - 0 11 499 - - - S.1313 Local government
S.1314 Fondovi za socijalno osiguruvawe
- 1 - 306 1 512 - 14 986 - S.1314 Social security funds
- 0 - 1 322 20 442 4 989 7 356 566
S.1311 Centralna vlada
- - - 1 222 13 382 4 989 1 057 566 S.1311 Central government
S.1313 Lokalna vlada - - - 0 6 177 - - - S.1313 Local government
S.1314 Fondovi za socijalno osiguruvawe
- 0 - 100 883 - 6 299 - S.1314 Social security funds
- 1 - 687 26 677 11 260 10 322 2 465
S.1311 Centralna vlada
- - - 481 20 726 11 260 1 635 2 465 S.1311 Central government
S.1313 Lokalna vlada - - - 0 5 322 - - - S.1313 Local government
S.1314 Fondovi za socijalno osiguruvawe
- 1 - 206 628 - 8 687 - S.1314 Social security funds
- 1 - 418 22 113 10 091 8 156 826
S.1311 Centralna vlada
- - - 254 16 592 10 091 1 404 826 S.1311 Central government
S.1313 Lokalna vlada - - - 0 5 033 - - - S.1313 Local government
S.1314 Fondovi za socijalno osiguruvawe
- 1 - 164 488 - 6 752 - S.1314 Social security funds
- 1 - 1 203 41 861 30 283 23 156 2 434
S.1311 Centralna vlada
- - - 680 35 261 30 283 4 657 2 434 S.1311 Central government
S.1313 Lokalna vlada - - - 2 5 190 - - - S.1313 Local government
S.1314 Fondovi za socijalno osiguruvawe
- 1 - 521 1 410 - 18 499 - S.1314 Social security funds
vo milioni denari
SOURCES OF VALUE ADDED BY NACE SECTIONS FOR THE GOVERNMENT SECTOR WITH SUBSECTORS, 2008
IZVORI NA DODADENATA VREDNOST PO SEKTORI NA NKD ZA SEKTOROT DR@AVA, SO POTSEKTORI, 2008
Po tekovni ceni - At current prices
Number of employees and selfemployed
Gross value added at basic prices
Bruto-vrednost na proizvodstvoto po osnovni ceni
Me|ufazna potro{uva~ka
Bruto-dodadena vred- nost po osnovni ceni
Sredstva na vrabotenite
Broj na vraboteni i samovraboteni
Gross output at basic prices
Intermediate consumption
Compensation of employees
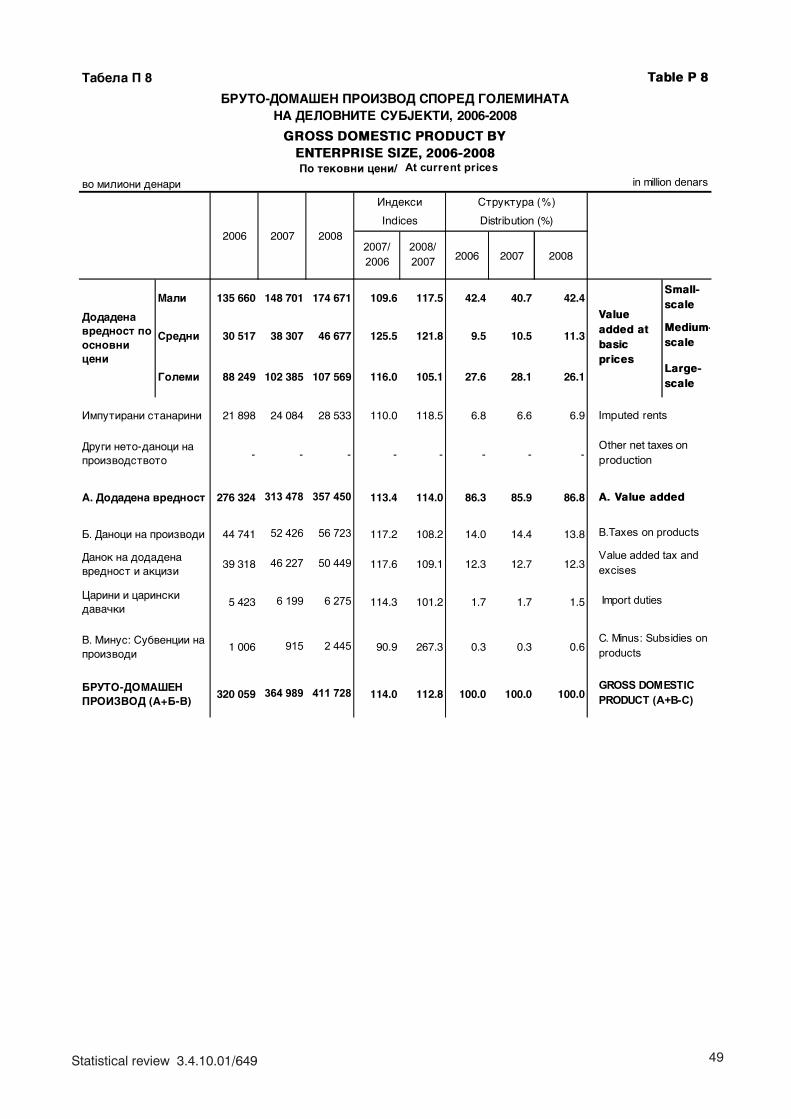
49Statistical review 3.4.10.01/649
Tabela P 8 Table P 8
Po tekovni ceni/
vo milioni denari
2007/ 2006
2008/ 2007 2006 2007 2008
Mali 135 660 148 701 174 671 109.6 117.5 42.4 40.7 42.4Small-scale
Sredni 30 517 38 307 46 677 125.5 121.8 9.5 10.5 11.3Medium-scale
Golemi 88 249 102 385 107 569 116.0 105.1 27.6 28.1 26.1Large-scale
Imputirani stanarini 21 898 24 084 28 533 110.0 118.5 6.8 6.6 6.9 Imputed rents
- - - - - - - -
276 324 313 478 357 450 113.4 114.0 86.3 85.9 86.8 A. Value added
44 741 52 426 56 723 117.2 108.2 14.0 14.4 13.8
39 318 46 227 50 449 117.6 109.1 12.3 12.7 12.3
5 423 6 199 6 275 114.3 101.2 1.7 1.7 1.5
1 006 915 2 445 90.9 267.3 0.3 0.3 0.6
320 059 364 989 411 728 114.0 112.8 100.0 100.0 100.0BRUTO-DOMA[EN PROIZVOD (A+B-V)
B.Taxes on products
C. Minus: Subsidies on products
GROSS DOMESTIC PRODUCT (A+B-C)
Value added tax and excises
Import duties
B. Danoci na proizvodi
Danok na dodadena vrednost i akcizi
Carini i carinski dava~ki
V. Minus: Subvencii na proizvodi
BRUTO-DOMA[EN PROIZVOD SPORED GOLEMINATA NA DELOVNITE SUBJEKTI, 2006-2008
GROSS DOMESTIC PRODUCT BY ENTERPRISE SIZE, 2006-2008
2006
in million denars
20082007
Indeksi
At current prices
Value added at basic prices
Drugi neto-danoci na proizvodstvoto
A. Dodadena vrednost
Other net taxes on production
Struktura (%)
Indices Distribution (%)
Dodadena vrednost po osnovni ceni
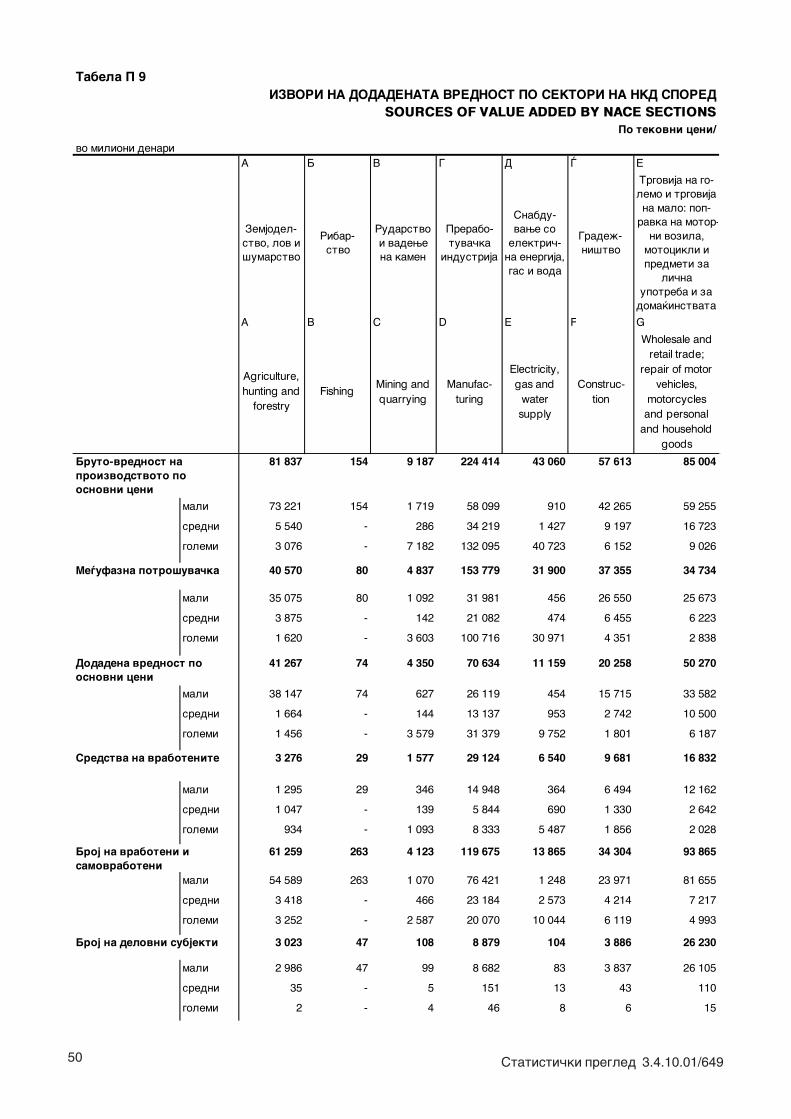
50 Statisti~ki pregled 3.4.10.01/649
Tabela P 9
vo milioni denariA B V G D \ E
Zemjodel- stvo, lov i {umarstvo
Ribar- stvo
Rudarstvo i vadewe na kamen
Prerabo- tuva~ka
industrija
Snabdu- vawe so
elektri~- na energija, gas i voda
Grade`- ni{tvo
Trgovija na go- lemo i trgovija na malo: pop-
ravka na motor-ni vozila,
motocikli i predmeti za
li~na upotreba i za
doma}instvata
A B C D E F G
Agriculture, hunting and
forestryFishing
Mining and quarrying
Manufac- turing
Electricity, gas and
water supply
Construc- tion
Wholesale and retail trade;
repair of motor vehicles,
motorcycles and personal
and household goods
81 837 154 9 187 224 414 43 060 57 613 85 004
mali 73 221 154 1 719 58 099 910 42 265 59 255
sredni 5 540 - 286 34 219 1 427 9 197 16 723
golemi 3 076 - 7 182 132 095 40 723 6 152 9 026
40 570 80 4 837 153 779 31 900 37 355 34 734
mali 35 075 80 1 092 31 981 456 26 550 25 673
sredni 3 875 - 142 21 082 474 6 455 6 223
golemi 1 620 - 3 603 100 716 30 971 4 351 2 838
41 267 74 4 350 70 634 11 159 20 258 50 270
mali 38 147 74 627 26 119 454 15 715 33 582
sredni 1 664 - 144 13 137 953 2 742 10 500
golemi 1 456 - 3 579 31 379 9 752 1 801 6 187
3 276 29 1 577 29 124 6 540 9 681 16 832
mali 1 295 29 346 14 948 364 6 494 12 162
sredni 1 047 - 139 5 844 690 1 330 2 642
golemi 934 - 1 093 8 333 5 487 1 856 2 028
61 259 263 4 123 119 675 13 865 34 304 93 865
mali 54 589 263 1 070 76 421 1 248 23 971 81 655
sredni 3 418 - 466 23 184 2 573 4 214 7 217
golemi 3 252 - 2 587 20 070 10 044 6 119 4 993
3 023 47 108 8 879 104 3 886 26 230
mali 2 986 47 99 8 682 83 3 837 26 105
sredni 35 - 5 151 13 43 110
golemi 2 - 4 46 8 6 15
Po tekovni ceni/
Broj na delovni subjekti
Me|ufazna potro{uva~ka
Broj na vraboteni i samovraboteni
Dodadena vrednost po osnovni ceni
Sredstva na vrabotenite
IZVORI NA DODADENATA VREDNOST PO SEKTORI NA NKD SPORED
Bruto-vrednost na proizvodstvoto po osnovni ceni
SOURCES OF VALUE ADDED BY NACE SECTIONS
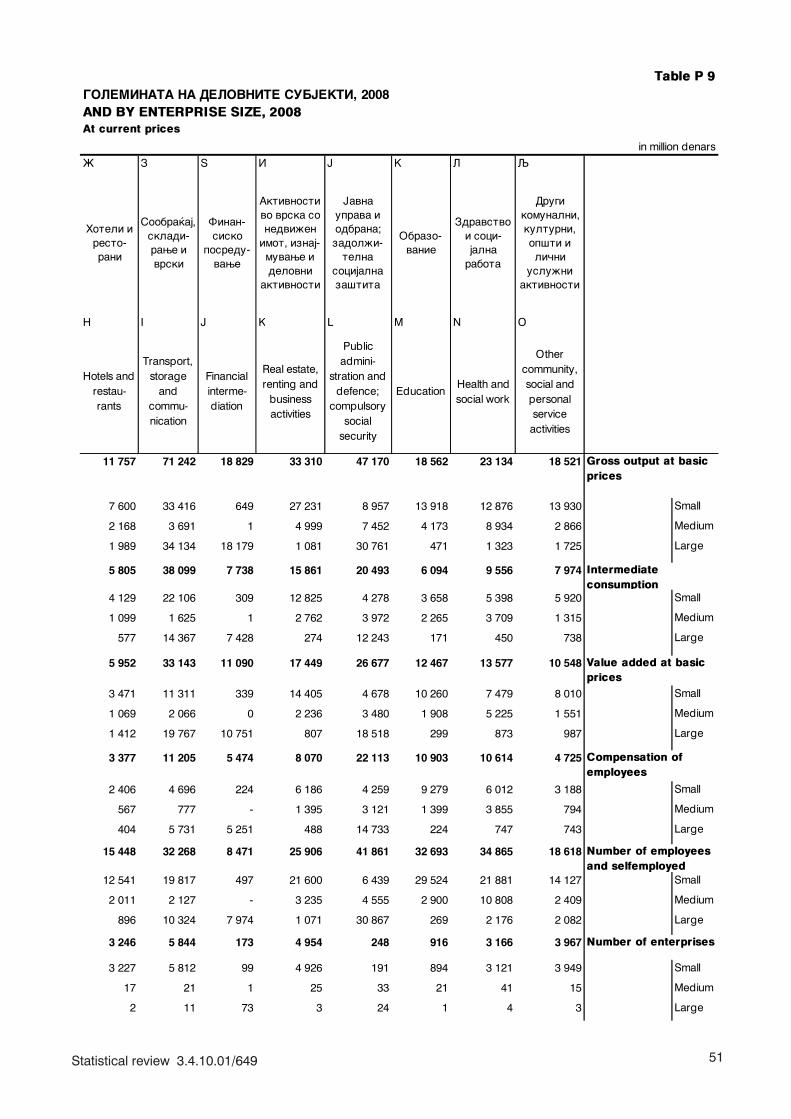
51Statistical review 3.4.10.01/649
Table P 9
in million denars
@ Z Y I J K L Q
Hoteli i resto- rani
Soobra}aj, skladi-rawe i vrski
Finan-sisko
posredu- vawe
Aktivnosti vo vrska so nedvi`en
imot, iznaj- muvawe i delovni
aktivnosti
Javna uprava i odbrana; zadol`i-
telna socijalna za{tita
Obrazo- vanie
Zdravstvo i soci- jalna
rabota
Drugi komunalni, kulturni, op{ti i li~ni
uslu`ni aktivnosti
H I J K L M N O
Hotels and restau- rants
Transport, storage
and commu- nication
Financial interme- diation
Real estate, renting and
business activities
Public admini-
stration and defence;
compulsory social
security
EducationHealth and social work
Other community, social and personal service
activities
11 757 71 242 18 829 33 310 47 170 18 562 23 134 18 521
7 600 33 416 649 27 231 8 957 13 918 12 876 13 930 Small
2 168 3 691 1 4 999 7 452 4 173 8 934 2 866 Medium
1 989 34 134 18 179 1 081 30 761 471 1 323 1 725 Large
5 805 38 099 7 738 15 861 20 493 6 094 9 556 7 974
4 129 22 106 309 12 825 4 278 3 658 5 398 5 920 Small
1 099 1 625 1 2 762 3 972 2 265 3 709 1 315 Medium
577 14 367 7 428 274 12 243 171 450 738 Large
5 952 33 143 11 090 17 449 26 677 12 467 13 577 10 548
3 471 11 311 339 14 405 4 678 10 260 7 479 8 010 Small
1 069 2 066 0 2 236 3 480 1 908 5 225 1 551 Medium
1 412 19 767 10 751 807 18 518 299 873 987 Large
3 377 11 205 5 474 8 070 22 113 10 903 10 614 4 725
2 406 4 696 224 6 186 4 259 9 279 6 012 3 188 Small
567 777 - 1 395 3 121 1 399 3 855 794 Medium
404 5 731 5 251 488 14 733 224 747 743 Large
15 448 32 268 8 471 25 906 41 861 32 693 34 865 18 618
12 541 19 817 497 21 600 6 439 29 524 21 881 14 127 Small
2 011 2 127 - 3 235 4 555 2 900 10 808 2 409 Medium
896 10 324 7 974 1 071 30 867 269 2 176 2 082 Large
3 246 5 844 173 4 954 248 916 3 166 3 967
3 227 5 812 99 4 926 191 894 3 121 3 949 Small
17 21 1 25 33 21 41 15 Medium
2 11 73 3 24 1 4 3 Large
Gross output at basic prices
Intermediate consumption
Compensation of employees
Value added at basic prices
Number of employees and selfemployed
Number of enterprises
AND BY ENTERPRISE SIZE, 2008GOLEMINATA NA DELOVNITE SUBJEKTI, 2008
At current prices
52 Statisti~ki pregled 3.4.10.01/649
SERIJA U - Upotreba na stoki i na uslugi
SERIES U - Use of goods and services
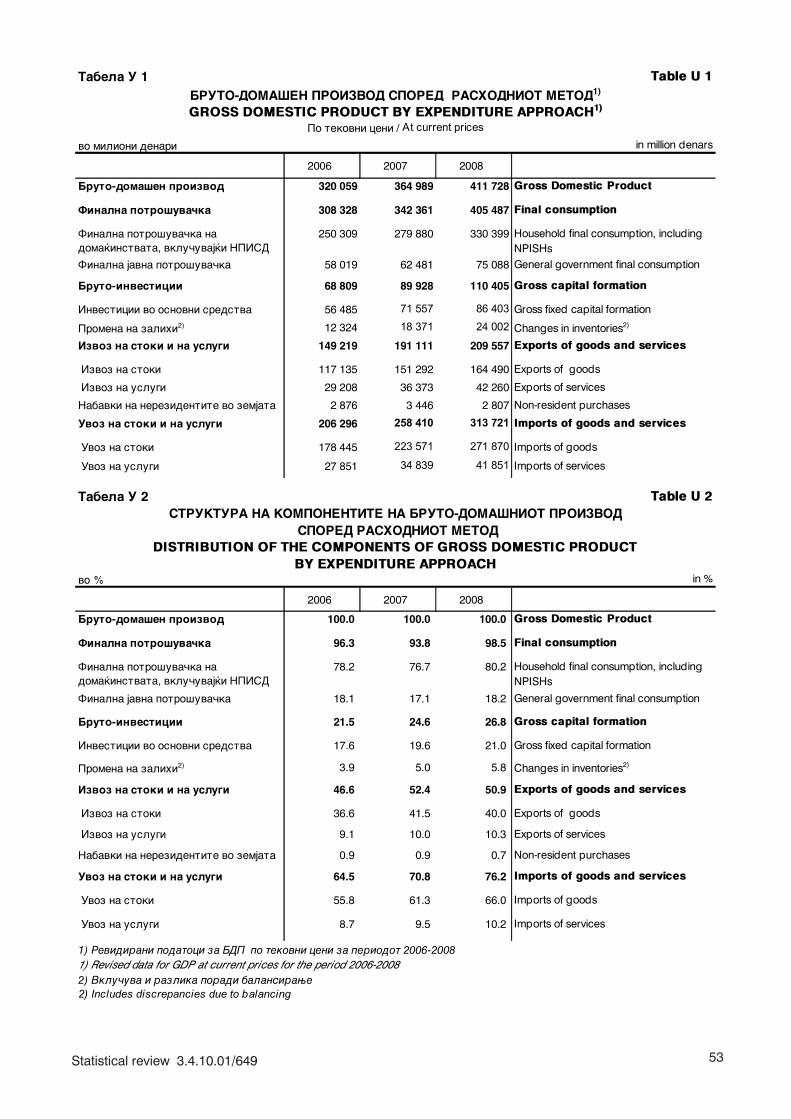
53Statistical review 3.4.10.01/649
Tabela U 1 Table U 1
vo milioni denari in million denars
2006 2007 2008
Bruto-doma{en proizvod 320 059 364 989 411 728 Gross Domestic Product
Finalna potro{uva~ka 308 328 342 361 405 487 Final consumption
Finalna potro{uva~ka na doma}instvata, vklu~uvaj}i NPISD
250 309 279 880 330 399 Household final consumption, including NPISHs
Finalna javna potro{uva~ka 58 019 62 481 75 088 General government final consumption
Bruto-investicii 68 809 89 928 110 405 Gross capital formation
Investicii vo osnovni sredstva 56 485 71 557 86 403 Gross fixed capital formation
Promena na zalihi2) 12 324 18 371 24 002 Changes in inventories2)
Izvoz na stoki i na uslugi 149 219 191 111 209 557 Exports of goods and services
Izvoz na stoki 117 135 151 292 164 490 Exports of goods
Izvoz na uslugi 29 208 36 373 42 260 Exports of services
Nabavki na nerezidentite vo zemjata 2 876 3 446 2 807 Non-resident purchases
Uvoz na stoki i na uslugi 206 296 258 410 313 721 Imports of goods and services
Uvoz na stoki 178 445 223 571 271 870 Imports of goods
Uvoz na uslugi 27 851 34 839 41 851 Imports of services
Tabela U 2 Table U 2
vo % in %
2006 2007 2008
Bruto-doma{en proizvod 100.0 100.0 100.0 Gross Domestic Product
Finalna potro{uva~ka 96.3 93.8 98.5 Final consumption
Finalna potro{uva~ka na doma}instvata, vklu~uvaj}i NPISD
78.2 76.7 80.2 Household final consumption, including NPISHs
Finalna javna potro{uva~ka 18.1 17.1 18.2 General government final consumption
Bruto-investicii 21.5 24.6 26.8 Gross capital formation
Investicii vo osnovni sredstva 17.6 19.6 21.0 Gross fixed capital formation
Promena na zalihi2) 3.9 5.0 5.8 Changes in inventories2)
Izvoz na stoki i na uslugi 46.6 52.4 50.9 Exports of goods and services
Izvoz na stoki 36.6 41.5 40.0 Exports of goods
Izvoz na uslugi 9.1 10.0 10.3 Exports of services
Nabavki na nerezidentite vo zemjata 0.9 0.9 0.7 Non-resident purchases
Uvoz na stoki i na uslugi 64.5 70.8 76.2 Imports of goods and services
Uvoz na stoki 55.8 61.3 66.0 Imports of goods
Uvoz na uslugi 8.7 9.5 10.2 Imports of services
1) Revidirani podatoci za BDP po tekovni ceni za periodot 2006-2008
2) Vklu~uva i razlika poradi balansirawe2) Includes discrepancies due to balancing
DISTRIBUTION OF THE COMPONENTS OF GROSS DOMESTIC PRODUCT BY EXPENDITURE APPROACH
BRUTO-DOMA[EN PROIZVOD SPORED RASHODNIOT METOD1)
GROSS DOMESTIC PRODUCT BY EXPENDITURE APPROACH1)
Po tekovni ceni / At current prices
STRUKTURA NA KOMPONENTITE NA BRUTO-DOMA[NIOT PROIZVOD SPORED RASHODNIOT METOD
1) Revised data for GDP at current prices for the period 2006-2008
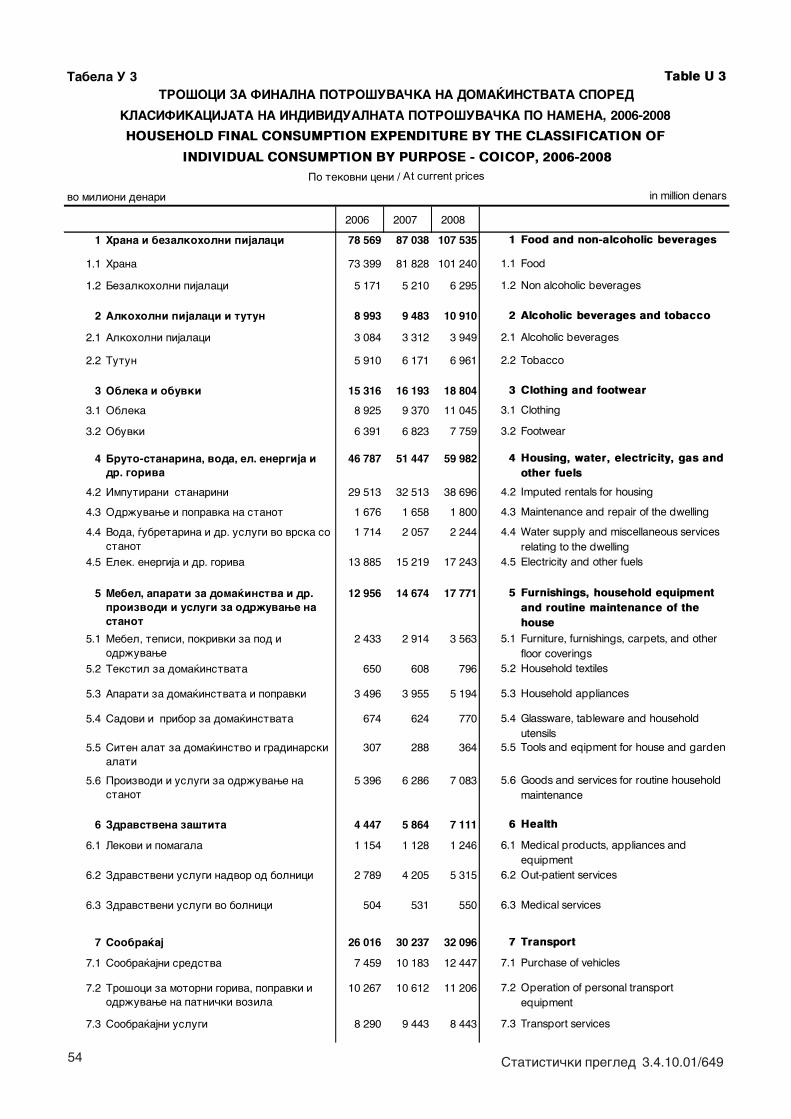
54 Statisti~ki pregled 3.4.10.01/649
Tabela U 3 Table U 3
vo milioni denari in million denars
2006 2007 2008
1 Hrana i bezalkoholni pijalaci 78 569 87 038 107 535 1 Food and non-alcoholic beverages
1.1 Hrana 73 399 81 828 101 240 1.1 Food
1.2 Bezalkoholni pijalaci 5 171 5 210 6 295 1.2 Non alcoholic beverages
2 Alkoholni pijalaci i tutun 8 993 9 483 10 910 2 Alcoholic beverages and tobacco
2.1 Alkoholni pijalaci 3 084 3 312 3 949 2.1 Alcoholic beverages
2.2 Tutun 5 910 6 171 6 961 2.2 Tobacco
3 Obleka i obuvki 15 316 16 193 18 804 3 Clothing and footwear
3.1 Obleka 8 925 9 370 11 045 3.1 Clothing
3.2 Obuvki 6 391 6 823 7 759 3.2 Footwear
4 Bruto-stanarina, voda, el. energija i dr. goriva
46 787 51 447 59 982 4 Housing, water, electricity, gas and other fuels
4.2 Imputirani stanarini 29 513 32 513 38 696 4.2 Imputed rentals for housing
4.3 Odr`uvawe i popravka na stanot 1 676 1 658 1 800 4.3 Maintenance and repair of the dwelling
4.4 Voda, |ubretarina i dr. uslugi vo vrska so stanot
1 714 2 057 2 244 4.4 Water supply and miscellaneous services relating to the dwelling
4.5 Elek. energija i dr. goriva 13 885 15 219 17 243 4.5 Electricity and other fuels
5 Mebel, aparati za doma}instva i dr. proizvodi i uslugi za odr`uvawe na stanot
12 956 14 674 17 771 5 Furnishings, household equipment and routine maintenance of the house
5.1 Mebel, tepisi, pokrivki za pod i odr`uvawe
2 433 2 914 3 563 5.1 Furniture, furnishings, carpets, and other floor coverings
5.2 Tekstil za doma}instvata 650 608 796 5.2 Household textiles
5.3 Aparati za doma}instvata i popravki 3 496 3 955 5 194 5.3 Household appliances
5.4 Sadovi i pribor za doma}instvata 674 624 770 5.4 Glassware, tableware and household utensils
5.5 Siten alat za doma}instvo i gradinarski alati
307 288 364 5.5 Tools and eqipment for house and garden
5.6 Proizvodi i uslugi za odr`uvawe na stanot
5 396 6 286 7 083 5.6 Goods and services for routine household maintenance
6 Zdravstvena za{tita 4 447 5 864 7 111 6 Health
6.1 Lekovi i pomagala 1 154 1 128 1 246 6.1 Medical products, appliances and equipment
6.2 Zdravstveni uslugi nadvor od bolnici 2 789 4 205 5 315 6.2 Out-patient services
6.3 Zdravstveni uslugi vo bolnici 504 531 550 6.3 Medical services
7 Soobra}aj 26 016 30 237 32 096 7 Transport
7.1 Soobra}ajni sredstva 7 459 10 183 12 447 7.1 Purchase of vehicles
7.2 Tro{oci za motorni goriva, popravki i odr`uvawe na patni~ki vozila
10 267 10 612 11 206 7.2 Operation of personal transport equipment
7.3 Soobra}ajni uslugi 8 290 9 443 8 443 7.3 Transport services
TRO[OCI ZA FINALNA POTRO[UVA^KA NA DOMA]INSTVATA SPORED
KLASIFIKACIJATA NA INDIVIDUALNATA POTRO[UVA^KA PO NAMENA, 2006-2008
HOUSEHOLD FINAL CONSUMPTION EXPENDITURE BY THE CLASSIFICATION OF
INDIVIDUAL CONSUMPTION BY PURPOSE - COICOP, 2006-2008Po tekovni ceni / At current prices
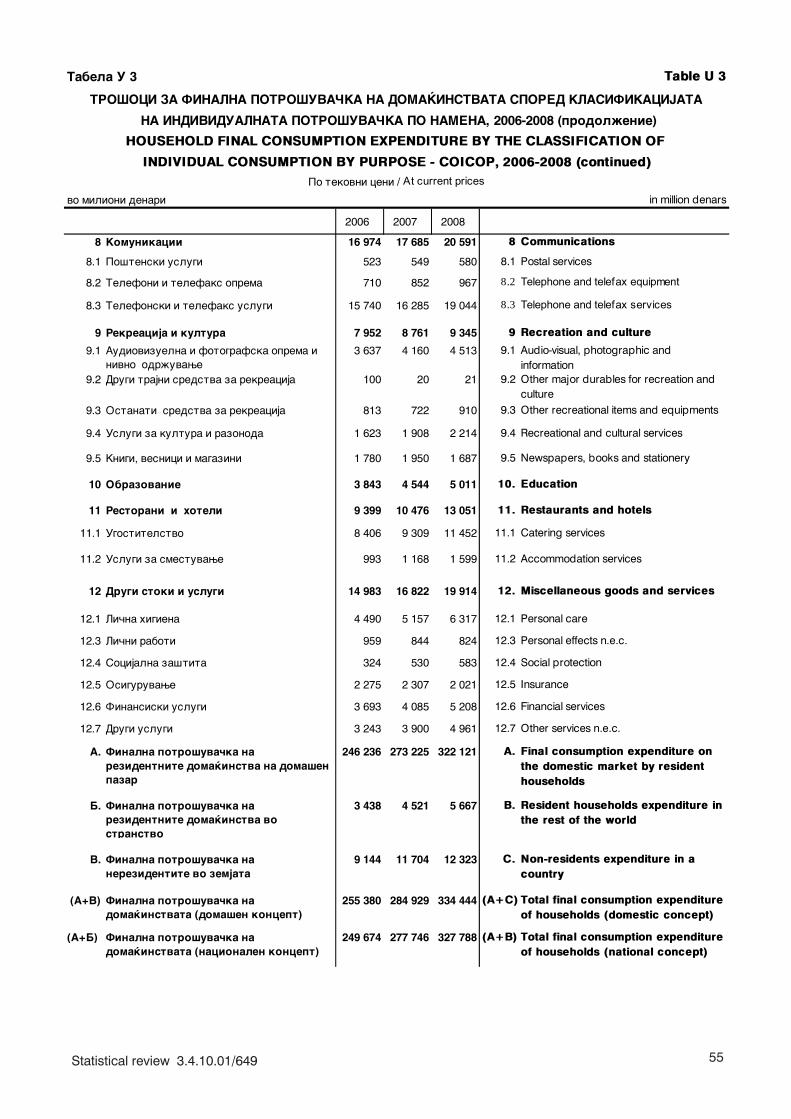
55Statistical review 3.4.10.01/649
Tabela U 3 Table U 3
vo milioni denari in million denars
2006 2007 2008
8 Komunikacii 16 974 17 685 20 591 8 Communications
8.1 Po{tenski uslugi 523 549 580 8.1 Postal services
8.2 Telefoni i telefaks oprema 710 852 967 8.2 Telephone and telefax equipment
8.3 Telefonski i telefaks uslugi 15 740 16 285 19 044 8.3 Telephone and telefax services
9 Rekreacija i kultura 7 952 8 761 9 345 9 Recreation and culture
9.1 Audiovizuelna i fotografska oprema i nivno odr`uvawe
3 637 4 160 4 513 9.1 Audio-visual, photographic and information
9.2 Drugi trajni sredstva za rekreacija 100 20 21 9.2 Other major durables for recreation and culture
9.3 Ostanati sredstva za rekreacija 813 722 910 9.3 Other recreational items and equipments
9.4 Uslugi za kultura i razonoda 1 623 1 908 2 214 9.4 Recreational and cultural services
9.5 Knigi, vesnici i magazini 1 780 1 950 1 687 9.5 Newspapers, books and stationery
10 Obrazovanie 3 843 4 544 5 011 10. Education
11 Restorani i hoteli 9 399 10 476 13 051 11. Restaurants and hotels
11.1 Ugostitelstvo 8 406 9 309 11 452 11.1 Catering services
11.2 Uslugi za smestuvawe 993 1 168 1 599 11.2 Accommodation services
12 Drugi stoki i uslugi 14 983 16 822 19 914 12. Miscellaneous goods and services
12.1 Li~na higiena 4 490 5 157 6 317 12.1 Personal care
12.3 Li~ni raboti 959 844 824 12.3 Personal effects n.e.c.
12.4 Socijalna za{tita 324 530 583 12.4 Social protection
12.5 Osiguruvawe 2 275 2 307 2 021 12.5 Insurance
12.6 Finansiski uslugi 3 693 4 085 5 208 12.6 Financial services
12.7 Drugi uslugi 3 243 3 900 4 961 12.7 Other services n.e.c.
A. Finalna potro{uva~ka na rezidentnite doma}instva na doma{en pazar
246 236 273 225 322 121 A. Final consumption expenditure on the domestic market by resident households
B. Finalna potro{uva~ka na rezidentnite doma}instva vo stranstvo
3 438 4 521 5 667 B. Resident households expenditure in the rest of the world
V. Finalna potro{uva~ka na nerezidentite vo zemjata
9 144 11 704 12 323 C. Non-residents expenditure in a country
(A+V) Finalna potro{uva~ka na doma}instvata (doma{en koncept)
255 380 284 929 334 444 (A+C) Total final consumption expenditure of households (domestic concept)
(A+B) Finalna potro{uva~ka na doma}instvata (nacionalen koncept)
249 674 277 746 327 788 (A+B) Total final consumption expenditure of households (national concept)
TRO[OCI ZA FINALNA POTRO[UVA^KA NA DOMA]INSTVATA SPORED KLASIFIKACIJATA
NA INDIVIDUALNATA POTRO[UVA^KA PO NAMENA, 2006-2008 (prodol`enie)
HOUSEHOLD FINAL CONSUMPTION EXPENDITURE BY THE CLASSIFICATION OF
INDIVIDUAL CONSUMPTION BY PURPOSE - COICOP, 2006-2008 (continued)Po tekovni ceni / At current prices

56 Statisti~ki pregled 3.4.10.01/649
Tabela U 4 Table U 4
vo % in %
2006 2007 2008
1 Hrana i bezalkoholni pijalaci 31.9 31.9 33.4 1 Food and non-alcoholic beverages
1.1 Hrana 29.8 29.9 31.4 1.1 Food
1.2 Bezalkoholni pijalaci 2.1 1.9 2.0 1.2 Non alcoholic beverages
2 Alkoholni pijalaci i tutun 3.7 3.5 3.4 2 Alcoholic beverages and tobacco
2.1 Alkoholni pijalaci 1.3 1.2 1.2 2.1 Alcoholic beverages
2.2 Tutun 2.4 2.3 2.2 2.2 Tobacco
3 Obleka i obuvki 6.2 5.9 5.8 3 Clothing and footwear
3.1 Obleka 3.6 3.4 3.4 3.1 Clothing
3.2 Obuvki 2.6 2.5 2.4 3.2 Footwear
4 Bruto-stanarina,voda, el. energija i dr.goriva
19.0 18.8 18.6 4 Housing, water, electricity, gas and other fuels
4.2 Imputirani stanarini 12.0 11.9 12.0 4.2 Imputed rentals for housing
4.3 Odr`uvawe i popravka na stanot 0.7 0.6 0.6 4.3 Maintenance and repair of the dwelling
4.4 Voda, |ubretarina i dr. uslugi vo vrska so stanot
0.7 0.8 0.7 4.4 Water supply and miscellaneous services relating to the dwelling
4.5 Elek. energija i dr. goriva 5.6 5.6 5.4 4.5 Electricity and other fuels
5 Mebel, aparati za doma}instva i dr. proizvodi i uslugi za odr`uvawe na stanot
5.3 5.4 5.5 5 Furnishings, household equipment and routine maintenance of the house
5.1 Mebel, tepisi, pokrivki za pod i odr`uvawe
1.0 1.1 1.1 5.1 Furniture, furnishings, carpets, and other floor coverings
5.2 Tekstil za doma}instvata 0.3 0.2 0.2 5.2 Household textiles
5.3 Aparati za doma}instvata i popravki 1.4 1.4 1.6 5.3 Household appliances
5.4 Sadovi i pribor za doma}instvata 0.3 0.2 0.2 5.4 Glassware, tableware and household utensils
5.5 Siten alat za doma}instvo i gradinarski alati
0.1 0.1 0.1 5.5 Tools and eqipment for house and garden
5.6 Proizvodi i uslugi za odr`uvawe na stanot
2.2 2.3 2.2 5.6 Goods and services for routine household maintenance
6 Zdravstvena za{tita 1.8 2.1 2.2 6 Health
6.1 Lekovi i pomagala 0.5 0.4 0.4 6.1 Medical products, appliances and equipment
6.2 Zdravstveni uslugi nadvor od bolnici 1.1 1.5 1.7 6.2 Out-patient services
6.3 Zdravstveni uslugi vo bolnici 0.2 0.2 0.2 6.3 Medical services
7 Soobra}aj 10.6 11.1 10.0 7 Transport
7.1 Soobra}ajni sredstva 3.0 3.7 3.9 7.1 Purchase of vehicles
7.2 Tro{oci za motorni goriva , popravki i odr`uvawe na patni~ki vozila
4.2 3.9 3.5 7.2 Operation of personal transport equipment
7.3 Soobra}ajni uslugi 3.4 3.5 2.6 7.3 Transport services
KLASIFIKACIJATA NA INDIVIDUALNATA POTRO[UVA^KA PO NAMENA, 2006-2008 STRUCTURE OF HOUSEHOLD FINAL CONSUMPTION EXPENDITURE
BY COICOP, 2006-2008
STRUKTURA NA FINALNATA POTRO[UVA^KA NA DOMA]INSTVATA SPORED
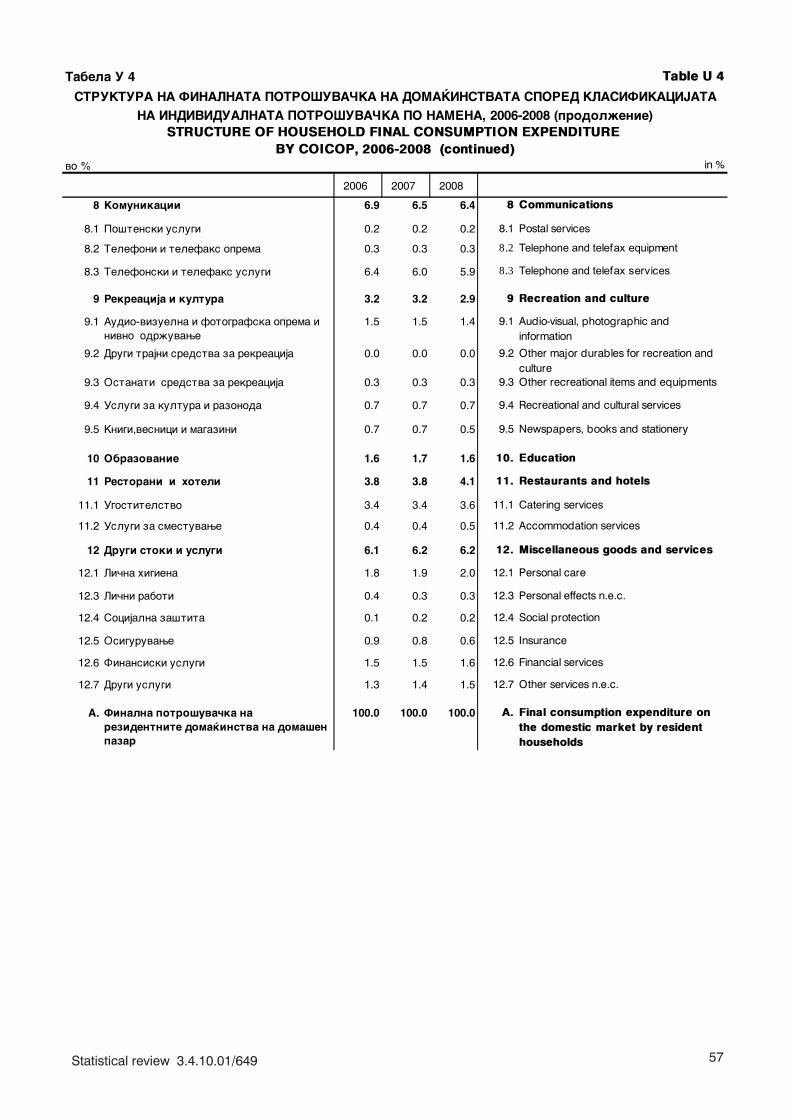
57Statistical review 3.4.10.01/649
Tabela U 4 Table U 4
vo % in %
2006 2007 2008
8 Komunikacii 6.9 6.5 6.4 8 Communications
8.1 Po{tenski uslugi 0.2 0.2 0.2 8.1 Postal services
8.2 Telefoni i telefaks oprema 0.3 0.3 0.3 8.2 Telephone and telefax equipment
8.3 Telefonski i telefaks uslugi 6.4 6.0 5.9 8.3 Telephone and telefax services
9 Rekreacija i kultura 3.2 3.2 2.9 9 Recreation and culture
9.1 Audio-vizuelna i fotografska oprema i nivno odr`uvawe
1.5 1.5 1.4 9.1 Audio-visual, photographic and information
9.2 Drugi trajni sredstva za rekreacija 0.0 0.0 0.0 9.2 Other major durables for recreation and culture
9.3 Ostanati sredstva za rekreacija 0.3 0.3 0.3 9.3 Other recreational items and equipments
9.4 Uslugi za kultura i razonoda 0.7 0.7 0.7 9.4 Recreational and cultural services
9.5 Knigi,vesnici i magazini 0.7 0.7 0.5 9.5 Newspapers, books and stationery
10 Obrazovanie 1.6 1.7 1.6 10. Education
11 Restorani i hoteli 3.8 3.8 4.1 11. Restaurants and hotels
11.1 Ugostitelstvo 3.4 3.4 3.6 11.1 Catering services
11.2 Uslugi za smestuvawe 0.4 0.4 0.5 11.2 Accommodation services
12 Drugi stoki i uslugi 6.1 6.2 6.2 12. Miscellaneous goods and services
12.1 Li~na higiena 1.8 1.9 2.0 12.1 Personal care
12.3 Li~ni raboti 0.4 0.3 0.3 12.3 Personal effects n.e.c.
12.4 Socijalna za{tita 0.1 0.2 0.2 12.4 Social protection
12.5 Osiguruvawe 0.9 0.8 0.6 12.5 Insurance
12.6 Finansiski uslugi 1.5 1.5 1.6 12.6 Financial services
12.7 Drugi uslugi 1.3 1.4 1.5 12.7 Other services n.e.c.
A. Finalna potro{uva~ka na rezidentnite doma}instva na doma{en pazar
100.0 100.0 100.0 A. Final consumption expenditure on the domestic market by resident households
BY COICOP, 2006-2008 (continued)
STRUKTURA NA FINALNATA POTRO[UVA^KA NA DOMA]INSTVATA SPORED KLASIFIKACIJATA
NA INDIVIDUALNATA POTRO[UVA^KA PO NAMENA, 2006-2008 (prodol`enie) STRUCTURE OF HOUSEHOLD FINAL CONSUMPTION EXPENDITURE
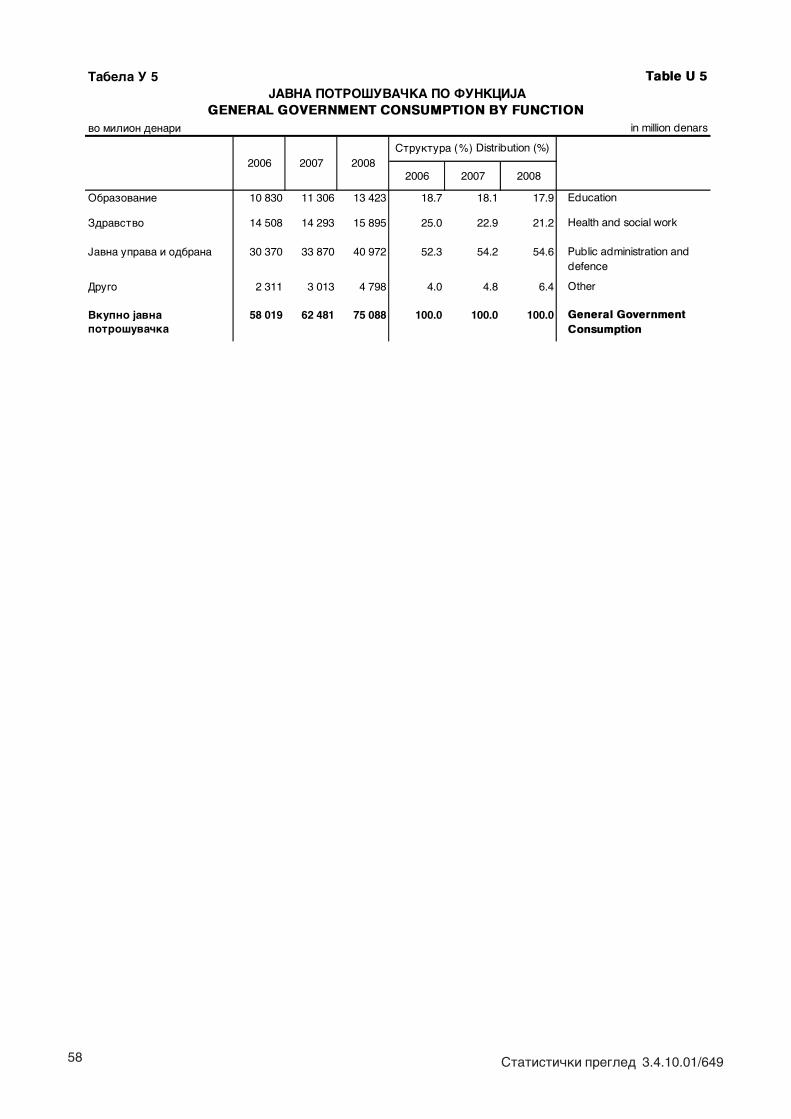
58 Statisti~ki pregled 3.4.10.01/649
Tabela U 5 Table U 5
vo milion denari in million denars
2006 2007 2008
Obrazovanie 10 830 11 306 13 423 18.7 18.1 17.9 Education
Zdravstvo 14 508 14 293 15 895 25.0 22.9 21.2 Health and social work
Javna uprava i odbrana 30 370 33 870 40 972 52.3 54.2 54.6 Public administration and defence
Drugo 2 311 3 013 4 798 4.0 4.8 6.4 Other
Vkupno javna potro{uva~ka
58 019 62 481 75 088 100.0 100.0 100.0 General Government Consumption
JAVNA POTRO[UVA^KA PO FUNKCIJA GENERAL GOVERNMENT CONSUMPTION BY FUNCTION
2006 2007Struktura (%) Distribution (%)
2008
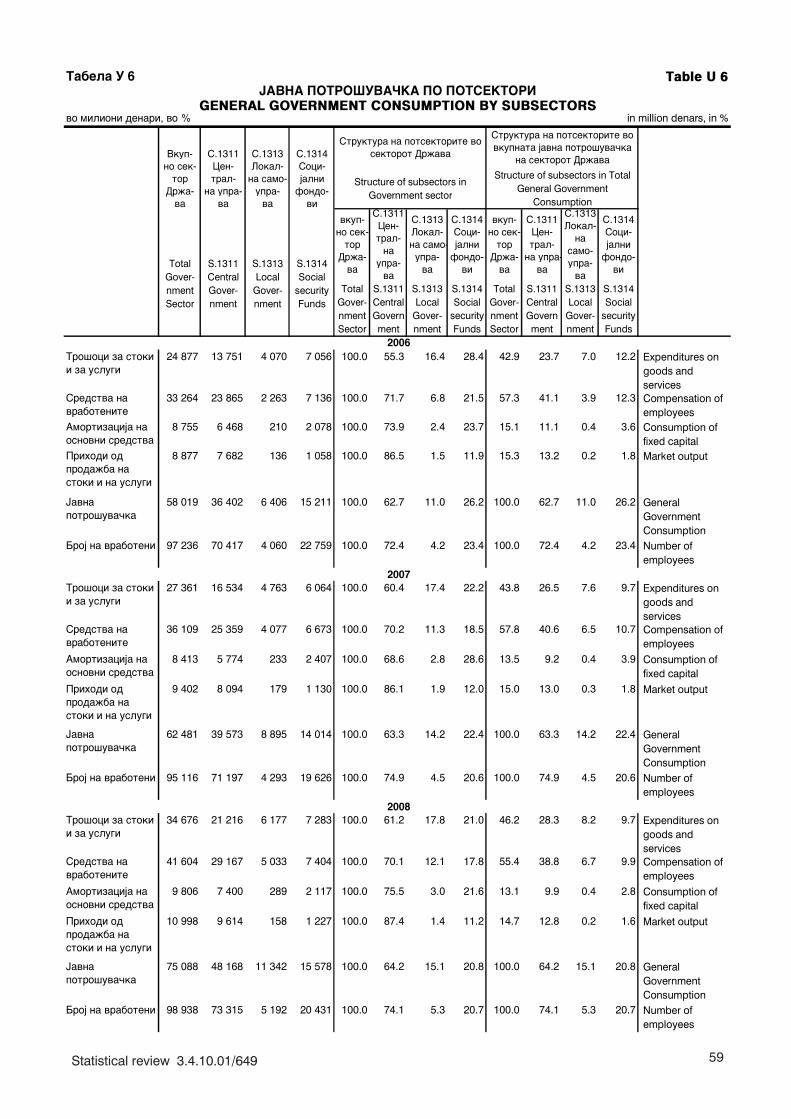
59Statistical review 3.4.10.01/649
Tabela U 6 Table U 6
in million denars, in %
Total Gover- nment Sector
S.1311 Central Government
S.1313 Local
Gover- nment
S.1314 Social
security Funds
Total Gover- nment Sector
S.1311 Central Government
S.1313 Local
Gover- nment
S.1314 Social
security Funds
Tro{oci za stoki i za uslugi
24 877 13 751 4 070 7 056 100.0 55.3 16.4 28.4 42.9 23.7 7.0 12.2 Expenditures on goods and services
Sredstva na vrabotenite
33 264 23 865 2 263 7 136 100.0 71.7 6.8 21.5 57.3 41.1 3.9 12.3 Compensation of employees
Amortizacija na osnovni sredstva
8 755 6 468 210 2 078 100.0 73.9 2.4 23.7 15.1 11.1 0.4 3.6 Consumption of fixed capital
Prihodi od proda`ba na stoki i na uslugi
8 877 7 682 136 1 058 100.0 86.5 1.5 11.9 15.3 13.2 0.2 1.8 Market output
Javna potro{uva~ka
58 019 36 402 6 406 15 211 100.0 62.7 11.0 26.2 100.0 62.7 11.0 26.2 General Government Consumption
Broj na vraboteni 97 236 70 417 4 060 22 759 100.0 72.4 4.2 23.4 100.0 72.4 4.2 23.4 Number of employees
Tro{oci za stoki i za uslugi
27 361 16 534 4 763 6 064 100.0 60.4 17.4 22.2 43.8 26.5 7.6 9.7 Expenditures on goods and services
Sredstva na vrabotenite
36 109 25 359 4 077 6 673 100.0 70.2 11.3 18.5 57.8 40.6 6.5 10.7 Compensation of employees
Amortizacija na osnovni sredstva
8 413 5 774 233 2 407 100.0 68.6 2.8 28.6 13.5 9.2 0.4 3.9 Consumption of fixed capital
Prihodi od proda`ba na stoki i na uslugi
9 402 8 094 179 1 130 100.0 86.1 1.9 12.0 15.0 13.0 0.3 1.8 Market output
Javna potro{uva~ka
62 481 39 573 8 895 14 014 100.0 63.3 14.2 22.4 100.0 63.3 14.2 22.4 General Government Consumption
Broj na vraboteni 95 116 71 197 4 293 19 626 100.0 74.9 4.5 20.6 100.0 74.9 4.5 20.6 Number of employees
Tro{oci za stoki i za uslugi
34 676 21 216 6 177 7 283 100.0 61.2 17.8 21.0 46.2 28.3 8.2 9.7 Expenditures on goods and services
Sredstva na vrabotenite
41 604 29 167 5 033 7 404 100.0 70.1 12.1 17.8 55.4 38.8 6.7 9.9 Compensation of employees
Amortizacija na osnovni sredstva
9 806 7 400 289 2 117 100.0 75.5 3.0 21.6 13.1 9.9 0.4 2.8 Consumption of fixed capital
Prihodi od proda`ba na stoki i na uslugi
10 998 9 614 158 1 227 100.0 87.4 1.4 11.2 14.7 12.8 0.2 1.6 Market output
Javna potro{uva~ka
75 088 48 168 11 342 15 578 100.0 64.2 15.1 20.8 100.0 64.2 15.1 20.8 General Government Consumption
Broj na vraboteni 98 938 73 315 5 192 20 431 100.0 74.1 5.3 20.7 100.0 74.1 5.3 20.7 Number of employees
2006
S.1313 Lokal-
na samo- upra-
vaTotal
Gover- nment Sector
S.1311 Central Gover-nment
vkup- no sek-
tor Dr`a-
va
S.1311 Cen- tral-
na upra-va
JAVNA POTRO[UVA^KA PO POTSEKTORI GENERAL GOVERNMENT CONSUMPTION BY SUBSECTORS
S.1313 Local
Gover-nment
S.1314 Social
security Funds
Structure of subsectors in Government sector
Structure of subsectors in Total General Government
Consumption
Vkup- no sek-
tor Dr`a-
va
S.1311 Cen- tral-
na upra- va
S.1313 Lokal-
na samo- upra-
va
S.1314 Soci- jalni
fondo- vi
2008
vo milioni denari, vo %
Struktura na potsektorite vo sektorot Dr`ava
S.1314 Soci- jalni
fondo- vi
S.1314 Soci- jalni
fondo- vi
Struktura na potsektorite vo vkupnata javna potro{uva~ka
na sektorot Dr`ava
vkup- no sek-
tor Dr`a-
va
S.1311 Cen- tral-
na upra-
va
S.1313 Lokal- na samo-
upra- va
2007

60 Statisti~ki pregled 3.4.10.01/649
Tabela U 7 Table U 7
vo milioni denari in million denars
[ifra Naziv 2006 2007 2008 Code Description
01+02+05 Kultivirani sredstva (osnovno stado, po{umuvawe, dolgogodi{ni nasadi)
379 316 537 01+02+05 Products of agriculture, forestry, fisheries and aquaculture
---------- Ma{ini i oprema 21 476 28 912 37 805 --------------- Machinery and Equipment
28-33+36 Metalni proizvodi i ma{ini 16 069 22 260 27 852 28-33+36 Metal products and Machinery
34+35 Transportni sredstva 5 407 6 652 9 953 34+35 Transport equpment
45 Grade`ni raboti 33 247 39 088 44 104 45 Construction
del od 45 Grade`ni raboti-stanbena izgradba
13 594 15 455 12 884 subset of 45 Construction - housing
del od 45 Ostanati grade`ni raboti 19 653 23 633 31 221 subset of 45 Construction - other construction
Ostanati oddeli
Drugi proizvodi 1 383 3 241 3 957 Remaining divisions
Other products
INVESTICII VO OSNOVNI SREDSTVA 56 485 71 557 86 403 GROSS FIXED CAPITAL FORMATION
Promena na zalihi1) 12 324 18 371 24 002 Changes in inventories1)
68 809 89 928 110 405 GROSS CAPITAL FORMATION
1) Includes discrepancies due to balancing
BRUTO-INVESTICII - Po tekovni ceniGROSS CAPITAL FORMATION - At current prices
BRUTO-INVESTICII
1) Vklu~uva i razlika poradi balansirawe
61Statistical review 3.4.10.01/649
SERIJA S - Volumenski indeksi i implicitni deflatori
SERIES C - Volume indices and implicit deflators
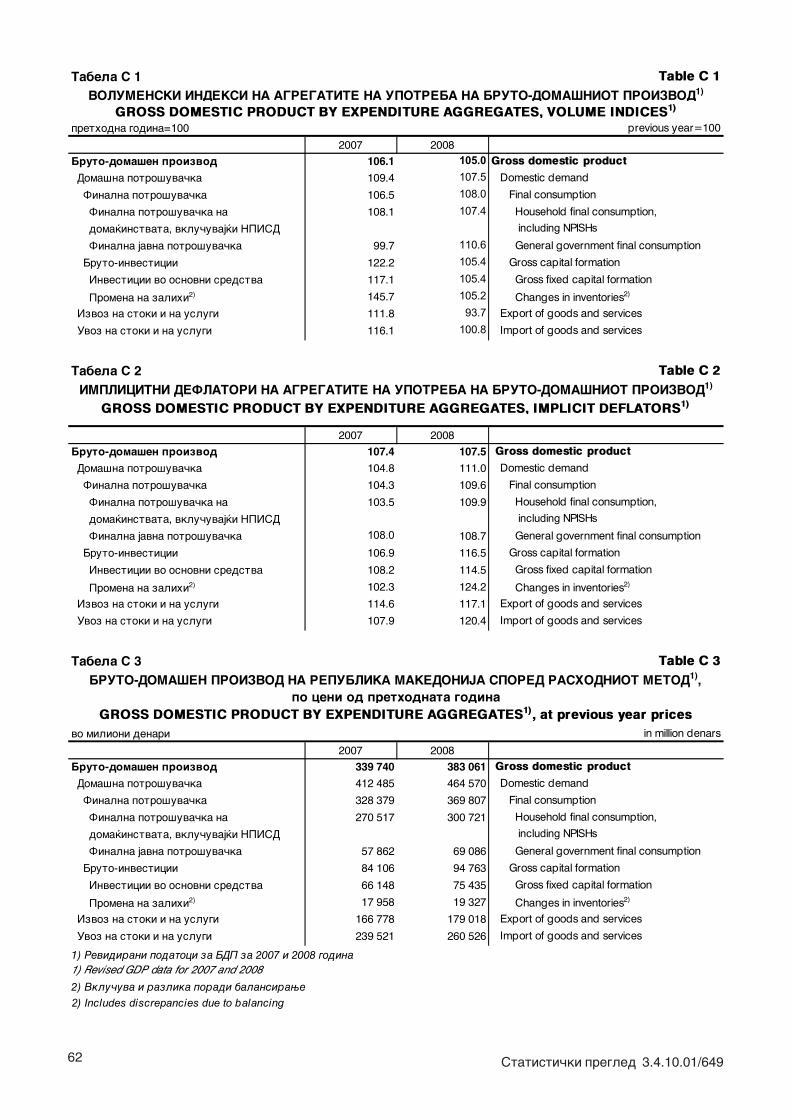
62 Statisti~ki pregled 3.4.10.01/649
Tabela S 1 Table C 1
prethodna godina=100 previous year=100
2007 2008
Bruto-doma{en proizvod 106.1 105.0 Gross domestic product
Doma{na potro{uva~ka 109.4 107.5 Domestic demand
Finalna potro{uva~ka 106.5 108.0 Final consumption
Finalna potro{uva~ka na 108.1 107.4 Household final consumption,
doma}instvata, vklu~uvaj}i NPISD including NPISHs Finalna javna potro{uva~ka 99.7 110.6 General government final consumption
Bruto-investicii 122.2 105.4 Gross capital formation
Investicii vo osnovni sredstva 117.1 105.4 Gross fixed capital formation
Promena na zalihi2) 145.7 105.2 Changes in inventories2)
Izvoz na stoki i na uslugi 111.8 93.7 Export of goods and services
Uvoz na stoki i na uslugi 116.1 100.8 Import of goods and services
Tabela S 2 Table C 2
2007 2008
Bruto-doma{en proizvod 107.4 107.5 Gross domestic product
Doma{na potro{uva~ka 104.8 111.0 Domestic demand
Finalna potro{uva~ka 104.3 109.6 Final consumption
Finalna potro{uva~ka na 103.5 109.9 Household final consumption,
doma}instvata, vklu~uvaj}i NPISD including NPISHs Finalna javna potro{uva~ka 108.0 108.7 General government final consumption
Bruto-investicii 106.9 116.5 Gross capital formation
Investicii vo osnovni sredstva 108.2 114.5 Gross fixed capital formation
Promena na zalihi2) 102.3 124.2 Changes in inventories2)
Izvoz na stoki i na uslugi 114.6 117.1 Export of goods and services
Uvoz na stoki i na uslugi 107.9 120.4 Import of goods and services
Tabela S 3 Table C 3
vo milioni denari in million denars
2007 2008
Bruto-doma{en proizvod 339 740 383 061 Gross domestic product
Doma{na potro{uva~ka 412 485 464 570 Domestic demand
Finalna potro{uva~ka 328 379 369 807 Final consumption
Finalna potro{uva~ka na 270 517 300 721 Household final consumption,
doma}instvata, vklu~uvaj}i NPISD including NPISHs Finalna javna potro{uva~ka 57 862 69 086 General government final consumption
Bruto-investicii 84 106 94 763 Gross capital formation
Investicii vo osnovni sredstva 66 148 75 435 Gross fixed capital formation
Promena na zalihi2) 17 958 19 327 Changes in inventories2)
Izvoz na stoki i na uslugi 166 778 179 018 Export of goods and services
Uvoz na stoki i na uslugi 239 521 260 526 Import of goods and services
1) Revidirani podatoci za BDP za 2007 i 2008 godina
BRUTO-DOMA[EN PROIZVOD NA REPUBLIKA MAKEDONIJA SPORED RASHODNIOT METOD1), po ceni od prethodnata godina
GROSS DOMESTIC PRODUCT BY EXPENDITURE AGGREGATES1), at previous year prices
1) Revised GDP data for 2007 and 2008
2) Vklu~uva i razlika poradi balansirawe
2) Includes discrepancies due to balancing
VOLUMENSKI INDEKSI NA AGREGATITE NA UPOTREBA NA BRUTO-DOMA[NIOT PROIZVOD1)
GROSS DOMESTIC PRODUCT BY EXPENDITURE AGGREGATES, VOLUME INDICES1)
IMPLICITNI DEFLATORI NA AGREGATITE NA UPOTREBA NA BRUTO-DOMA[NIOT PROIZVOD1)
GROSS DOMESTIC PRODUCT BY EXPENDITURE AGGREGATES, IMPLICIT DEFLATORS1)
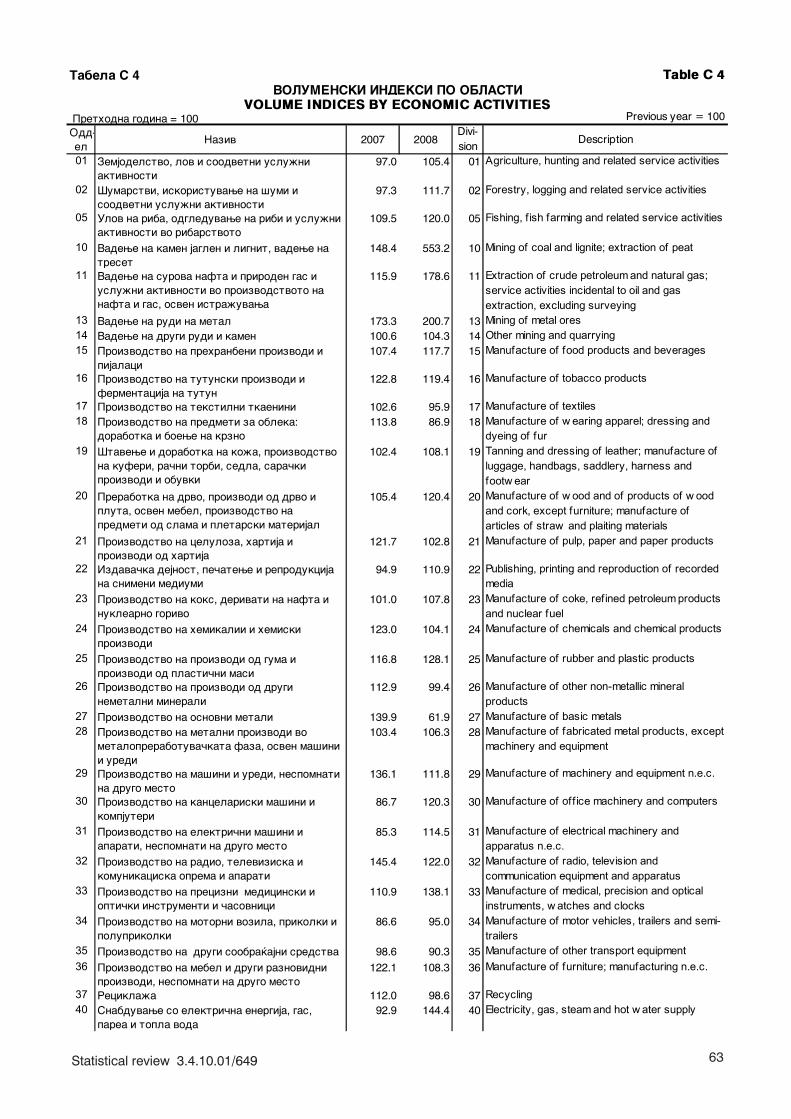
63Statistical review 3.4.10.01/649
Tabela S 4 Table C 4
Prethodna godina = 100 Previous year = 100Odd-el
Naziv 2007 2008 Description
01 Zemjodelstvo, lov i soodvetni uslu`ni aktivnosti
97.0 105.4 01 Agriculture, hunting and related service activities
02 [umarstvi, iskoristuvawe na {umi i soodvetni uslu`ni aktivnosti
97.3 111.7 02 Forestry, logging and related service activities
05 Ulov na riba, odgleduvawe na ribi i uslu`ni aktivnosti vo ribarstvoto
109.5 120.0 05 Fishing, f ish farming and related service activities
10 Vadewe na kamen jaglen i lignit, vadewe na treset
148.4 553.2 10 Mining of coal and lignite; extraction of peat
11 Vadewe na surova nafta i priroden gas i uslu`ni aktivnosti vo proizvodstvoto na nafta i gas, osven istra`uvawa
115.9 178.6 11 Extraction of crude petroleum and natural gas; service activities incidental to oil and gas extraction, excluding surveying
13 Vadewe na rudi na metal 173.3 200.7 13 Mining of metal ores14 Vadewe na drugi rudi i kamen 100.6 104.3 14 Other mining and quarrying15 Proizvodstvo na prehranbeni proizvodi i
pijalaci107.4 117.7 15 Manufacture of food products and beverages
16 Proizvodstvo na tutunski proizvodi i fermentacija na tutun
122.8 119.4 16 Manufacture of tobacco products
17 Proizvodstvo na tekstilni tkaenini 102.6 95.9 17 Manufacture of textiles18 Proizvodstvo na predmeti za obleka:
dorabotka i boewe na krzno113.8 86.9 18 Manufacture of w earing apparel; dressing and
dyeing of fur19 [tavewe i dorabotka na ko`a, proizvodstvo
na kuferi, ra~ni torbi, sedla, sara~ki proizvodi i obuvki
102.4 108.1 19 Tanning and dressing of leather; manufacture of luggage, handbags, saddlery, harness and footw ear
20 Prerabotka na drvo, proizvodi od drvo i pluta, osven mebel, proizvodstvo na predmeti od slama i pletarski materijal
105.4 120.4 20 Manufacture of w ood and of products of w ood and cork, except furniture; manufacture of articles of straw and plaiting materials
21 Proizvodstvo na celuloza, hartija i proizvodi od hartija
121.7 102.8 21 Manufacture of pulp, paper and paper products
22 Izdava~ka dejnost, pe~atewe i reprodukcija na snimeni mediumi
94.9 110.9 22 Publishing, printing and reproduction of recorded media
23 Proizvodstvo na koks, derivati na nafta i nuklearno gorivo
101.0 107.8 23 Manufacture of coke, refined petroleum products and nuclear fuel
24 Proizvodstvo na hemikalii i hemiski proizvodi
123.0 104.1 24 Manufacture of chemicals and chemical products
25 Proizvodstvo na proizvodi od guma i proizvodi od plasti~ni masi
116.8 128.1 25 Manufacture of rubber and plastic products
26 Proizvodstvo na proizvodi od drugi nemetalni minerali
112.9 99.4 26 Manufacture of other non-metallic mineral products
27 Proizvodstvo na osnovni metali 139.9 61.9 27 Manufacture of basic metals28 Proizvodstvo na metalni proizvodi vo
metaloprerabotuva~kata faza, osven ma{ini i uredi
103.4 106.3 28 Manufacture of fabricated metal products, except machinery and equipment
29 Proizvodstvo na ma{ini i uredi, nespomnati na drugo mesto
136.1 111.8 29 Manufacture of machinery and equipment n.e.c.
30 Proizvodstvo na kancelariski ma{ini i kompjuteri
86.7 120.3 30 Manufacture of off ice machinery and computers
31 Proizvodstvo na elektri~ni ma{ini i aparati, nespomnati na drugo mesto
85.3 114.5 31 Manufacture of electrical machinery and apparatus n.e.c.
32 Proizvodstvo na radio, televiziska i komunikaciska oprema i aparati
145.4 122.0 32 Manufacture of radio, television and communication equipment and apparatus
33 Proizvodstvo na precizni medicinski i opti~ki instrumenti i ~asovnici
110.9 138.1 33 Manufacture of medical, precision and optical instruments, w atches and clocks
34 Proizvodstvo na motorni vozila, prikolki i poluprikolki
86.6 95.0 34 Manufacture of motor vehicles, trailers and semi-trailers
35 Proizvodstvo na drugi soobra}ajni sredstva 98.6 90.3 35 Manufacture of other transport equipment36 Proizvodstvo na mebel i drugi raznovidni
proizvodi, nespomnati na drugo mesto122.1 108.3 36 Manufacture of furniture; manufacturing n.e.c.
37 Recikla`a 112.0 98.6 37 Recycling40 Snabduvawe so elektri~na energija, gas,
parea i topla voda92.9 144.4 40 Electricity, gas, steam and hot w ater supply
VOLUMENSKI INDEKSI PO OBLASTIVOLUME INDICES BY ECONOMIC ACTIVITIES
Divi-sion
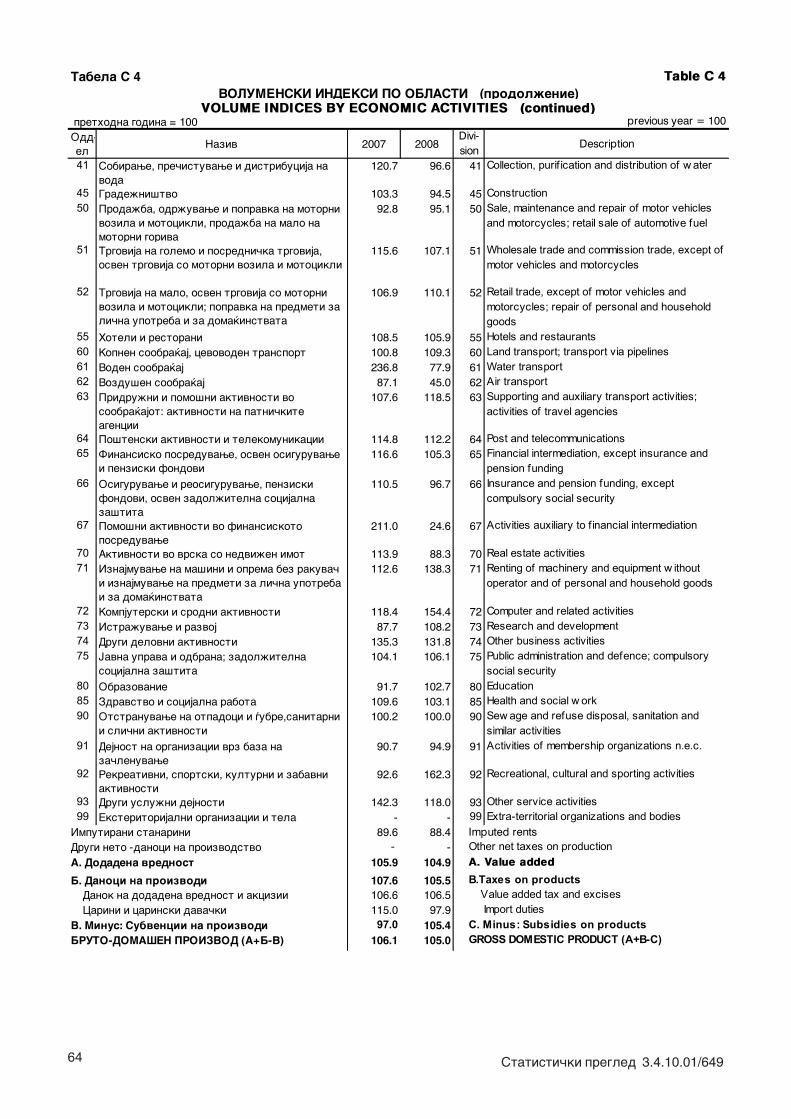
64 Statisti~ki pregled 3.4.10.01/649
Tabela S 4 Table C 4
prethodna godina = 100 previous year = 100Odd-el
Naziv 2007 2008 Description
41 Sobirawe, pre~istuvawe i distribucija na voda
120.7 96.6 41 Collection, purif ication and distribution of w ater
45 Grade`ni{tvo 103.3 94.5 45 Construction50 Proda`ba, odr`uvawe i popravka na motorni
vozila i motocikli, proda`ba na malo na motorni goriva
92.8 95.1 50 Sale, maintenance and repair of motor vehicles and motorcycles; retail sale of automotive fuel
51 Trgovija na golemo i posredni~ka trgovija, osven trgovija so motorni vozila i motocikli
115.6 107.1 51 Wholesale trade and commission trade, except of motor vehicles and motorcycles
52 Trgovija na malo, osven trgovija so motorni vozila i motocikli; popravka na predmeti za li~na upotreba i za doma}instvata
106.9 110.1 52 Retail trade, except of motor vehicles and motorcycles; repair of personal and household goods
55 Hoteli i restorani 108.5 105.9 55 Hotels and restaurants60 Kopnen soobra}aj, cevovoden transport 100.8 109.3 60 Land transport; transport via pipelines61 Voden soobra}aj 236.8 77.9 61 Water transport62 Vozdu{en soobra}aj 87.1 45.0 62 Air transport63 Pridru`ni i pomo{ni aktivnosti vo
soobra}ajot: aktivnosti na patni~kite agencii
107.6 118.5 63 Supporting and auxiliary transport activities; activities of travel agencies
64 Po{tenski aktivnosti i telekomunikacii 114.8 112.2 64 Post and telecommunications65 Finansisko posreduvawe, osven osiguruvawe
i penziski fondovi116.6 105.3 65 Financial intermediation, except insurance and
pension funding66 Osiguruvawe i reosiguruvawe, penziski
fondovi, osven zadol`itelna socijalna za{tita
110.5 96.7 66 Insurance and pension funding, except compulsory social security
67 Pomo{ni aktivnosti vo finansiskoto posreduvawe
211.0 24.6 67 Activities auxiliary to f inancial intermediation
70 Aktivnosti vo vrska so nedvi`en imot 113.9 88.3 70 Real estate activities71 Iznajmuvawe na ma{ini i oprema bez rakuva~
i iznajmuvawe na predmeti za li~na upotreba i za doma}instvata
112.6 138.3 71 Renting of machinery and equipment w ithout operator and of personal and household goods
72 Kompjuterski i srodni aktivnosti 118.4 154.4 72 Computer and related activities73 Istra`uvawe i razvoj 87.7 108.2 73 Research and development74 Drugi delovni aktivnosti 135.3 131.8 74 Other business activities75 Javna uprava i odbrana; zadol`itelna
socijalna za{tita104.1 106.1 75 Public administration and defence; compulsory
social security80 Obrazovanie 91.7 102.7 80 Education85 Zdravstvo i socijalna rabota 109.6 103.1 85 Health and social w ork90 Otstranuvawe na otpadoci i |ubre,sanitarni
i sli~ni aktivnosti100.2 100.0 90 Sew age and refuse disposal, sanitation and
similar activities91 Dejnost na organizacii vrz baza na
za~lenuvawe90.7 94.9 91 Activities of membership organizations n.e.c.
92 Rekreativni, sportski, kulturni i zabavni aktivnosti
92.6 162.3 92 Recreational, cultural and sporting activities
93 Drugi uslu`ni dejnosti 142.3 118.0 93 Other service activities99 Eksteritorijalni organizacii i tela - - 99 Extra-territorial organizations and bodies
Imputirani stanarini 89.6 88.4 Imputed rentsDrugi neto -danoci na proizvodstvo - - Other net taxes on productionA. Dodadena vrednost 105.9 104.9 A. Value added
B. Danoci na proizvodi 107.6 105.5 Danok na dodadena vrednost i akcizii 106.6 106.5 Carini i carinski dava~ki 115.0 97.9V. Minus: Subvencii na proizvodi 97.0 105.4BRUTO-DOMA[EN PROIZVOD (A+B-V) 106.1 105.0
B.Taxes on productsValue added tax and excises Import duties
C. Minus: Subsidies on productsGROSS DOMESTIC PRODUCT (A+B-C)
VOLUME INDICES BY ECONOMIC ACTIVITIES (continued)
Divi-sion
VOLUMENSKI INDEKSI PO OBLASTI (prodol`enie)
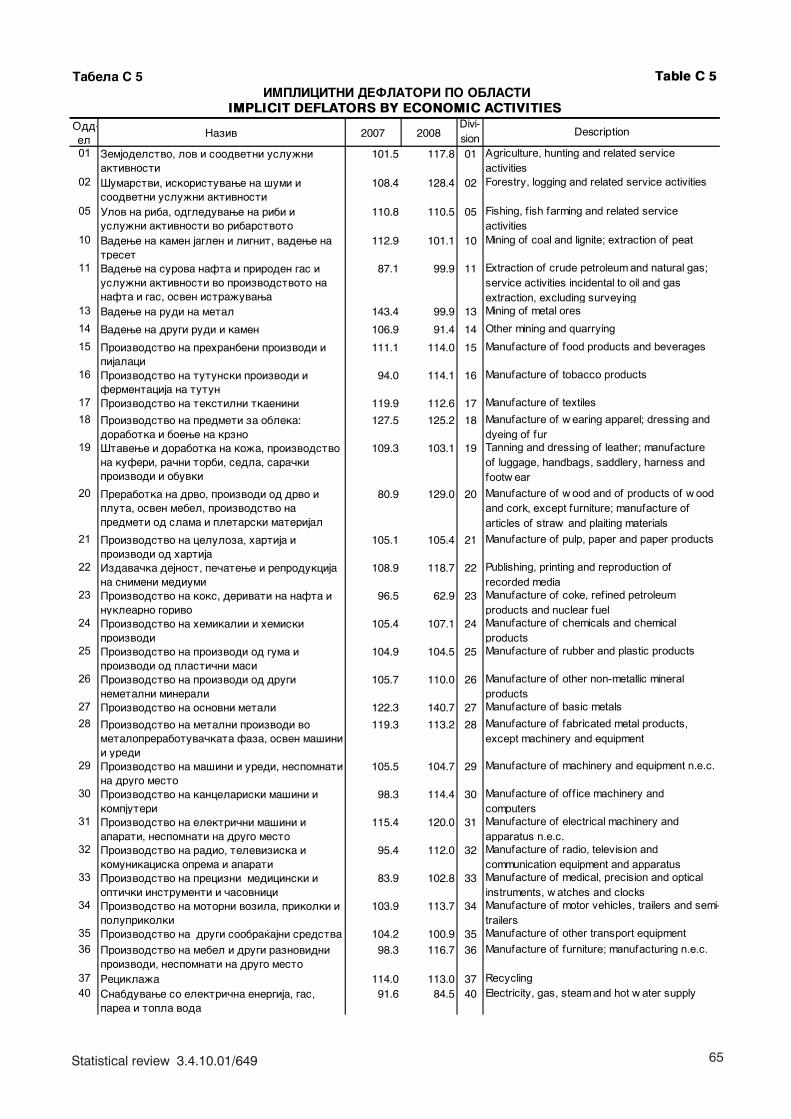
65Statistical review 3.4.10.01/649
Tabela S 5 Table C 5
Odd-el
Naziv 2007 2008Divi-sion
Description
01 Zemjodelstvo, lov i soodvetni uslu`ni aktivnosti
101.5 117.8 01 Agriculture, hunting and related service activities
02 [umarstvi, iskoristuvawe na {umi i soodvetni uslu`ni aktivnosti
108.4 128.4 02 Forestry, logging and related service activities
05 Ulov na riba, odgleduvawe na ribi i uslu`ni aktivnosti vo ribarstvoto
110.8 110.5 05 Fishing, f ish farming and related service activities
10 Vadewe na kamen jaglen i lignit, vadewe na treset
112.9 101.1 10 Mining of coal and lignite; extraction of peat
11 Vadewe na surova nafta i priroden gas i uslu`ni aktivnosti vo proizvodstvoto na nafta i gas, osven istra`uvawa
87.1 99.9 11 Extraction of crude petroleum and natural gas; service activities incidental to oil and gas extraction, excluding surveying
13 Vadewe na rudi na metal 143.4 99.9 13 Mining of metal ores14 Vadewe na drugi rudi i kamen 106.9 91.4 14 Other mining and quarrying15 Proizvodstvo na prehranbeni proizvodi i
pijalaci111.1 114.0 15 Manufacture of food products and beverages
16 Proizvodstvo na tutunski proizvodi i fermentacija na tutun
94.0 114.1 16 Manufacture of tobacco products
17 Proizvodstvo na tekstilni tkaenini 119.9 112.6 17 Manufacture of textiles18 Proizvodstvo na predmeti za obleka:
dorabotka i boewe na krzno127.5 125.2 18 Manufacture of w earing apparel; dressing and
dyeing of fur19 [tavewe i dorabotka na ko`a, proizvodstvo
na kuferi, ra~ni torbi, sedla, sara~ki proizvodi i obuvki
109.3 103.1 19 Tanning and dressing of leather; manufacture of luggage, handbags, saddlery, harness and footw ear
20 Prerabotka na drvo, proizvodi od drvo i pluta, osven mebel, proizvodstvo na predmeti od slama i pletarski materijal
80.9 129.0 20 Manufacture of w ood and of products of w ood and cork, except furniture; manufacture of articles of straw and plaiting materials
21 Proizvodstvo na celuloza, hartija i proizvodi od hartija
105.1 105.4 21 Manufacture of pulp, paper and paper products
22 Izdava~ka dejnost, pe~atewe i reprodukcija na snimeni mediumi
108.9 118.7 22 Publishing, printing and reproduction of recorded media
23 Proizvodstvo na koks, derivati na nafta i nuklearno gorivo
96.5 62.9 23 Manufacture of coke, refined petroleum products and nuclear fuel
24 Proizvodstvo na hemikalii i hemiski proizvodi
105.4 107.1 24 Manufacture of chemicals and chemical products
25 Proizvodstvo na proizvodi od guma i proizvodi od plasti~ni masi
104.9 104.5 25 Manufacture of rubber and plastic products
26 Proizvodstvo na proizvodi od drugi nemetalni minerali
105.7 110.0 26 Manufacture of other non-metallic mineral products
27 Proizvodstvo na osnovni metali 122.3 140.7 27 Manufacture of basic metals28 Proizvodstvo na metalni proizvodi vo
metaloprerabotuva~kata faza, osven ma{ini i uredi
119.3 113.2 28 Manufacture of fabricated metal products, except machinery and equipment
29 Proizvodstvo na ma{ini i uredi, nespomnati na drugo mesto
105.5 104.7 29 Manufacture of machinery and equipment n.e.c.
30 Proizvodstvo na kancelariski ma{ini i kompjuteri
98.3 114.4 30 Manufacture of off ice machinery and computers
31 Proizvodstvo na elektri~ni ma{ini i aparati, nespomnati na drugo mesto
115.4 120.0 31 Manufacture of electrical machinery and apparatus n.e.c.
32 Proizvodstvo na radio, televiziska i komunikaciska oprema i aparati
95.4 112.0 32 Manufacture of radio, television and communication equipment and apparatus
33 Proizvodstvo na precizni medicinski i opti~ki instrumenti i ~asovnici
83.9 102.8 33 Manufacture of medical, precision and optical instruments, w atches and clocks
34 Proizvodstvo na motorni vozila, prikolki i poluprikolki
103.9 113.7 34 Manufacture of motor vehicles, trailers and semi-trailers
35 Proizvodstvo na drugi soobra}ajni sredstva 104.2 100.9 35 Manufacture of other transport equipment36 Proizvodstvo na mebel i drugi raznovidni
proizvodi, nespomnati na drugo mesto98.3 116.7 36 Manufacture of furniture; manufacturing n.e.c.
37 Recikla`a 114.0 113.0 37 Recycling40 Snabduvawe so elektri~na energija, gas,
parea i topla voda91.6 84.5 40 Electricity, gas, steam and hot w ater supply
IMPLICITNI DEFLATORI PO OBLASTIIMPLICIT DEFLATORS BY ECONOMIC ACTIVITIES
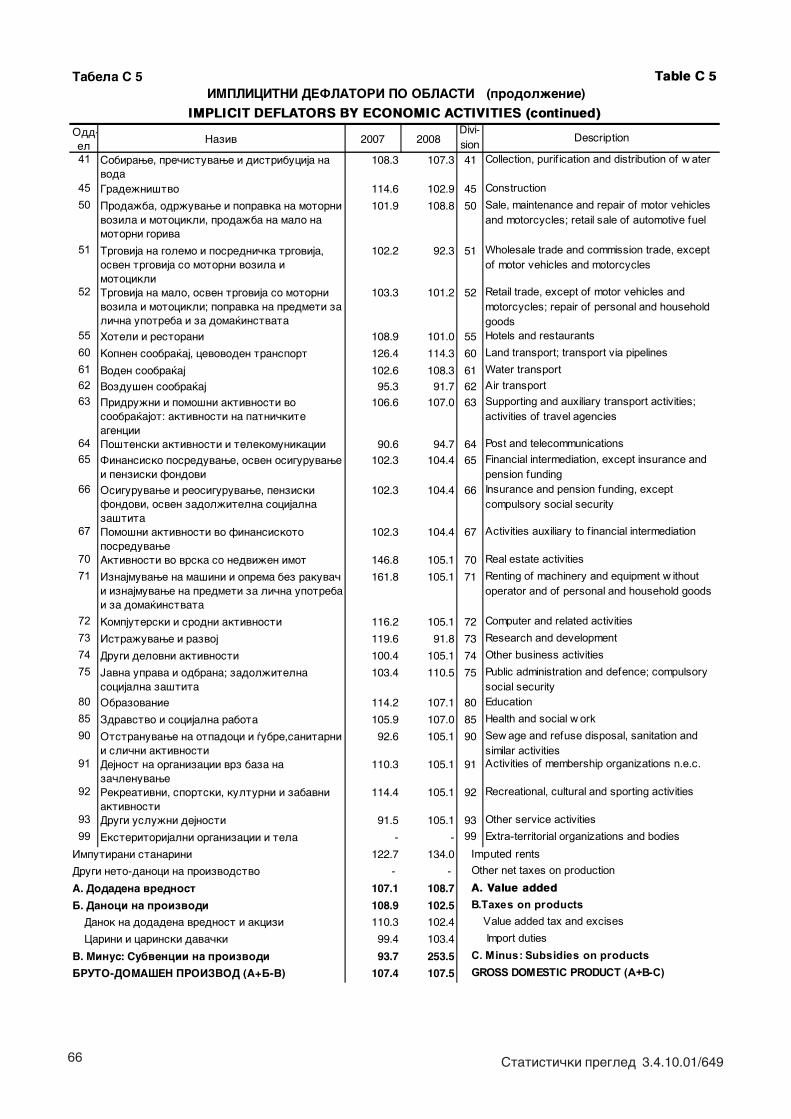
66 Statisti~ki pregled 3.4.10.01/649
Tabela S 5 Table C 5
Odd-el
Naziv 2007 2008Divi-sion
Description
41 Sobirawe, pre~istuvawe i distribucija na voda
108.3 107.3 41 Collection, purif ication and distribution of w ater
45 Grade`ni{tvo 114.6 102.9 45 Construction50 Proda`ba, odr`uvawe i popravka na motorni
vozila i motocikli, proda`ba na malo na motorni goriva
101.9 108.8 50 Sale, maintenance and repair of motor vehicles and motorcycles; retail sale of automotive fuel
51 Trgovija na golemo i posredni~ka trgovija, osven trgovija so motorni vozila i motocikli
102.2 92.3 51 Wholesale trade and commission trade, except of motor vehicles and motorcycles
52 Trgovija na malo, osven trgovija so motorni vozila i motocikli; popravka na predmeti za li~na upotreba i za doma}instvata
103.3 101.2 52 Retail trade, except of motor vehicles and motorcycles; repair of personal and household goods
55 Hoteli i restorani 108.9 101.0 55 Hotels and restaurants60 Kopnen soobra}aj, cevovoden transport 126.4 114.3 60 Land transport; transport via pipelines61 Voden soobra}aj 102.6 108.3 61 Water transport62 Vozdu{en soobra}aj 95.3 91.7 62 Air transport63 Pridru`ni i pomo{ni aktivnosti vo
soobra}ajot: aktivnosti na patni~kite agencii
106.6 107.0 63 Supporting and auxiliary transport activities; activities of travel agencies
64 Po{tenski aktivnosti i telekomunikacii 90.6 94.7 64 Post and telecommunications65 Finansisko posreduvawe, osven osiguruvawe
i penziski fondovi102.3 104.4 65 Financial intermediation, except insurance and
pension funding66 Osiguruvawe i reosiguruvawe, penziski
fondovi, osven zadol`itelna socijalna za{tita
102.3 104.4 66 Insurance and pension funding, except compulsory social security
67 Pomo{ni aktivnosti vo finansiskoto posreduvawe
102.3 104.4 67 Activities auxiliary to f inancial intermediation
70 Aktivnosti vo vrska so nedvi`en imot 146.8 105.1 70 Real estate activities71 Iznajmuvawe na ma{ini i oprema bez rakuva~
i iznajmuvawe na predmeti za li~na upotreba i za doma}instvata
161.8 105.1 71 Renting of machinery and equipment w ithout operator and of personal and household goods
72 Kompjuterski i srodni aktivnosti 116.2 105.1 72 Computer and related activities73 Istra`uvawe i razvoj 119.6 91.8 73 Research and development74 Drugi delovni aktivnosti 100.4 105.1 74 Other business activities75 Javna uprava i odbrana; zadol`itelna
socijalna za{tita103.4 110.5 75 Public administration and defence; compulsory
social security80 Obrazovanie 114.2 107.1 80 Education85 Zdravstvo i socijalna rabota 105.9 107.0 85 Health and social w ork90 Otstranuvawe na otpadoci i |ubre,sanitarni
i sli~ni aktivnosti92.6 105.1 90 Sew age and refuse disposal, sanitation and
similar activities91 Dejnost na organizacii vrz baza na
za~lenuvawe110.3 105.1 91 Activities of membership organizations n.e.c.
92 Rekreativni, sportski, kulturni i zabavni aktivnosti
114.4 105.1 92 Recreational, cultural and sporting activities
93 Drugi uslu`ni dejnosti 91.5 105.1 93 Other service activities99 Eksteritorijalni organizacii i tela - - 99 Extra-territorial organizations and bodies
Imputirani stanarini 122.7 134.0 Imputed rents
Drugi neto-danoci na proizvodstvo - - Other net taxes on productionA. Dodadena vrednost 107.1 108.7 A. Value added
B. Danoci na proizvodi 108.9 102.5 B.Taxes on productsDanok na dodadena vrednost i akcizi 110.3 102.4 Value added tax and excisesCarini i carinski dava~ki 99.4 103.4 Import duties
V. Minus: Subvencii na proizvodi 93.7 253.5 C. Minus: Subsidies on productsBRUTO-DOMA[EN PROIZVOD (A+B-V) 107.4 107.5 GROSS DOMESTIC PRODUCT (A+B-C)
IMPLICIT DEFLATORS BY ECONOMIC ACTIVITIES (continued)
IMPLICITNI DEFLATORI PO OBLASTI (prodol`enie)
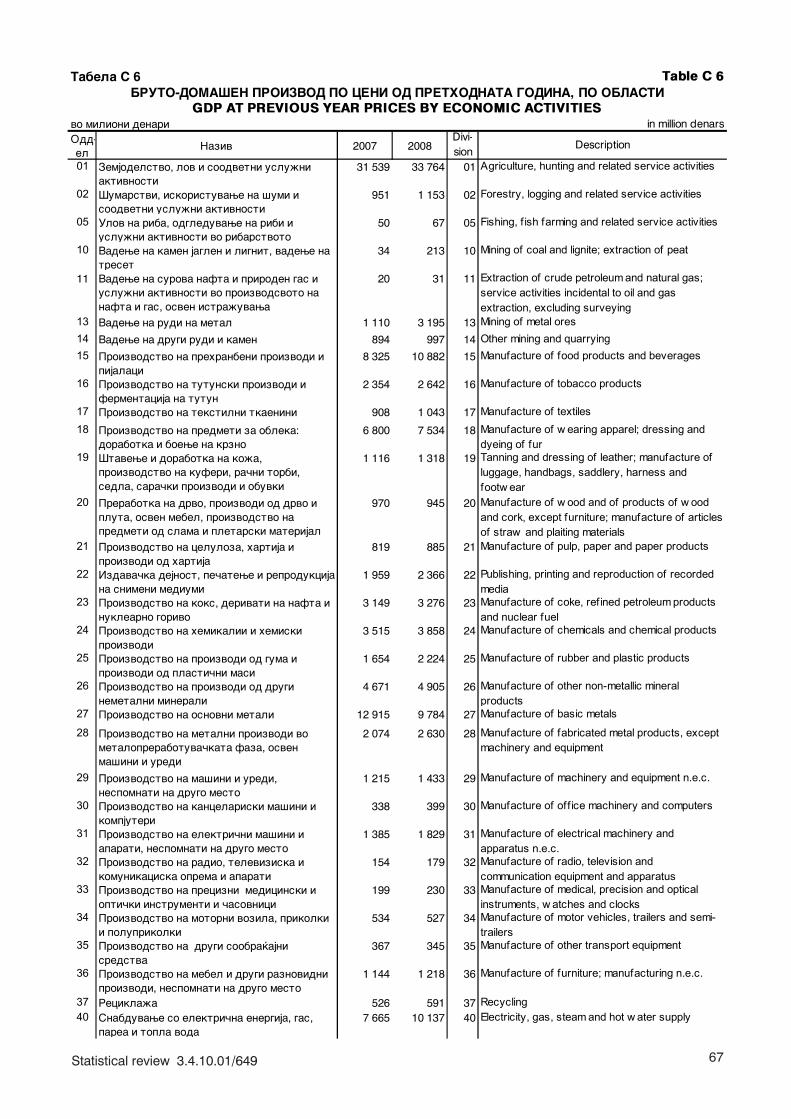
67Statistical review 3.4.10.01/649
Tabela S 6 Table C 6
vo milioni denari in million denarsOdd-el
Naziv 2007 2008 Description
01 Zemjodelstvo, lov i soodvetni uslu`ni aktivnosti
31 539 33 764 01 Agriculture, hunting and related service activities
02 [umarstvi, iskoristuvawe na {umi i soodvetni uslu`ni aktivnosti
951 1 153 02 Forestry, logging and related service activities
05 Ulov na riba, odgleduvawe na ribi i uslu`ni aktivnosti vo ribarstvoto
50 67 05 Fishing, f ish farming and related service activities
10 Vadewe na kamen jaglen i lignit, vadewe na treset
34 213 10 Mining of coal and lignite; extraction of peat
11 Vadewe na surova nafta i priroden gas i uslu`ni aktivnosti vo proizvodsvoto na nafta i gas, osven istra`uvawa
20 31 11 Extraction of crude petroleum and natural gas; service activities incidental to oil and gas extraction, excluding surveying
13 Vadewe na rudi na metal 1 110 3 195 13 Mining of metal ores14 Vadewe na drugi rudi i kamen 894 997 14 Other mining and quarrying15 Proizvodstvo na prehranbeni proizvodi i
pijalaci 8 325 10 882 15 Manufacture of food products and beverages
16 Proizvodstvo na tutunski proizvodi i fermentacija na tutun
2 354 2 642 16 Manufacture of tobacco products
17 Proizvodstvo na tekstilni tkaenini 908 1 043 17 Manufacture of textiles18 Proizvodstvo na predmeti za obleka:
dorabotka i boewe na krzno 6 800 7 534 18 Manufacture of w earing apparel; dressing and
dyeing of fur19 [tavewe i dorabotka na ko`a,
proizvodstvo na kuferi, ra~ni torbi, sedla, sara~ki proizvodi i obuvki
1 116 1 318 19 Tanning and dressing of leather; manufacture of luggage, handbags, saddlery, harness and footw ear
20 Prerabotka na drvo, proizvodi od drvo i pluta, osven mebel, proizvodstvo na predmeti od slama i pletarski materijal
970 945 20 Manufacture of w ood and of products of w ood and cork, except furniture; manufacture of articles of straw and plaiting materials
21 Proizvodstvo na celuloza, hartija i proizvodi od hartija
819 885 21 Manufacture of pulp, paper and paper products
22 Izdava~ka dejnost, pe~atewe i reprodukcija na snimeni mediumi
1 959 2 366 22 Publishing, printing and reproduction of recorded media
23 Proizvodstvo na koks, derivati na nafta i nuklearno gorivo
3 149 3 276 23 Manufacture of coke, refined petroleum products and nuclear fuel
24 Proizvodstvo na hemikalii i hemiski proizvodi
3 515 3 858 24 Manufacture of chemicals and chemical products
25 Proizvodstvo na proizvodi od guma i proizvodi od plasti~ni masi
1 654 2 224 25 Manufacture of rubber and plastic products
26 Proizvodstvo na proizvodi od drugi nemetalni minerali
4 671 4 905 26 Manufacture of other non-metallic mineral products
27 Proizvodstvo na osnovni metali 12 915 9 784 27 Manufacture of basic metals
28 Proizvodstvo na metalni proizvodi vo metaloprerabotuva~kata faza, osven ma{ini i uredi
2 074 2 630 28 Manufacture of fabricated metal products, except machinery and equipment
29 Proizvodstvo na ma{ini i uredi, nespomnati na drugo mesto
1 215 1 433 29 Manufacture of machinery and equipment n.e.c.
30 Proizvodstvo na kancelariski ma{ini i kompjuteri
338 399 30 Manufacture of off ice machinery and computers
31 Proizvodstvo na elektri~ni ma{ini i aparati, nespomnati na drugo mesto
1 385 1 829 31 Manufacture of electrical machinery and apparatus n.e.c.
32 Proizvodstvo na radio, televiziska i komunikaciska oprema i aparati
154 179 32 Manufacture of radio, television and communication equipment and apparatus
33 Proizvodstvo na precizni medicinski i opti~ki instrumenti i ~asovnici
199 230 33 Manufacture of medical, precision and optical instruments, w atches and clocks
34 Proizvodstvo na motorni vozila, prikolki i poluprikolki
534 527 34 Manufacture of motor vehicles, trailers and semi-trailers
35 Proizvodstvo na drugi soobra}ajni sredstva
367 345 35 Manufacture of other transport equipment
36 Proizvodstvo na mebel i drugi raznovidni proizvodi, nespomnati na drugo mesto
1 144 1 218 36 Manufacture of furniture; manufacturing n.e.c.
37 Recikla`a 526 591 37 Recycling40 Snabduvawe so elektri~na energija, gas,
parea i topla voda 7 665 10 137 40 Electricity, gas, steam and hot w ater supply
BRUTO-DOMA[EN PROIZVOD PO CENI OD PRETHODNATA GODINA, PO OBLASTIGDP AT PREVIOUS YEAR PRICES BY ECONOMIC ACTIVITIES
Divi-sion
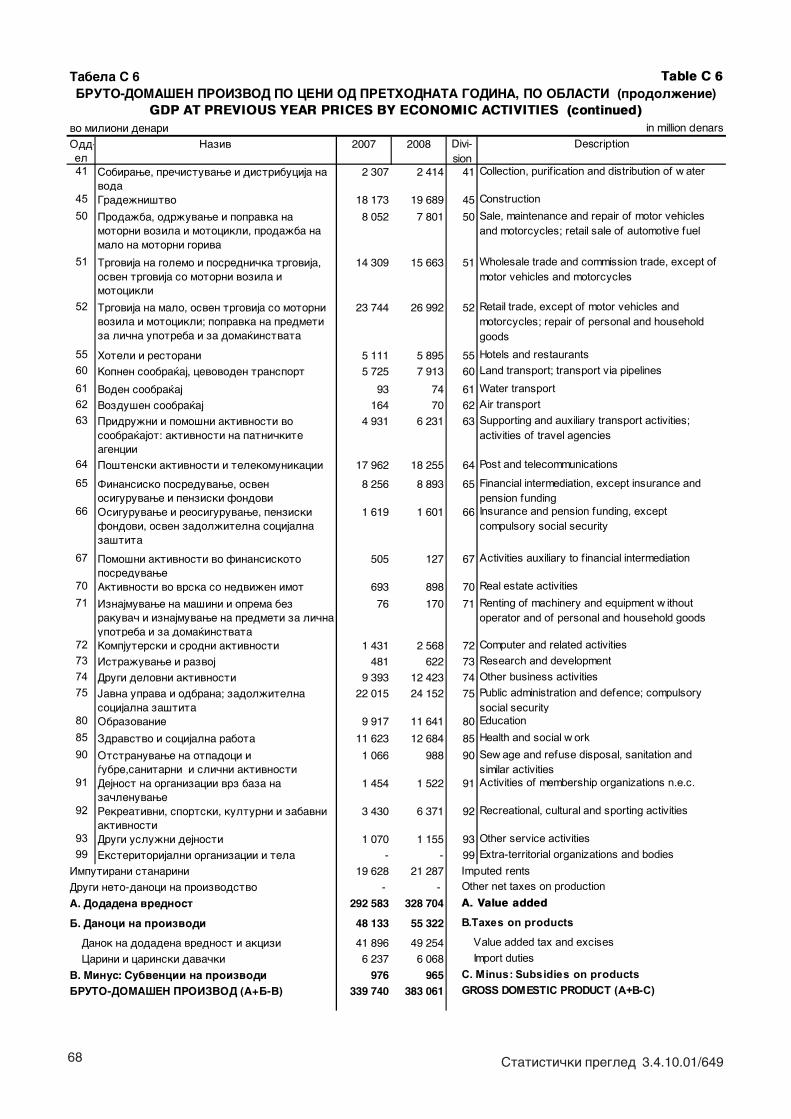
68 Statisti~ki pregled 3.4.10.01/649
Tabela S 6 Table C 6
vo milioni denari in million denarsOdd-el
Naziv 2007 2008 Description
41 Sobirawe, pre~istuvawe i distribucija na voda
2 307 2 414 41 Collection, purif ication and distribution of w ater
45 Grade`ni{tvo 18 173 19 689 45 Construction50 Proda`ba, odr`uvawe i popravka na
motorni vozila i motocikli, proda`ba na malo na motorni goriva
8 052 7 801 50 Sale, maintenance and repair of motor vehicles and motorcycles; retail sale of automotive fuel
51 Trgovija na golemo i posredni~ka trgovija, osven trgovija so motorni vozila i motocikli
14 309 15 663 51 Wholesale trade and commission trade, except of motor vehicles and motorcycles
52 Trgovija na malo, osven trgovija so motorni vozila i motocikli; popravka na predmeti za li~na upotreba i za doma}instvata
23 744 26 992 52 Retail trade, except of motor vehicles and motorcycles; repair of personal and household goods
55 Hoteli i restorani 5 111 5 895 55 Hotels and restaurants60 Kopnen soobra}aj, cevovoden transport 5 725 7 913 60 Land transport; transport via pipelines61 Voden soobra}aj 93 74 61 Water transport62 Vozdu{en soobra}aj 164 70 62 Air transport63 Pridru`ni i pomo{ni aktivnosti vo
soobra}ajot: aktivnosti na patni~kite agencii
4 931 6 231 63 Supporting and auxiliary transport activities; activities of travel agencies
64 Po{tenski aktivnosti i telekomunikacii 17 962 18 255 64 Post and telecommunications
65 Finansisko posreduvawe, osven osiguruvawe i penziski fondovi
8 256 8 893 65 Financial intermediation, except insurance and pension funding
66 Osiguruvawe i reosiguruvawe, penziski fondovi, osven zadol`itelna socijalna za{tita
1 619 1 601 66 Insurance and pension funding, except compulsory social security
67 Pomo{ni aktivnosti vo finansiskoto posreduvawe
505 127 67 Activities auxiliary to f inancial intermediation
70 Aktivnosti vo vrska so nedvi`en imot 693 898 70 Real estate activities71 Iznajmuvawe na ma{ini i oprema bez
rakuva~ i iznajmuvawe na predmeti za li~na upotreba i za doma}instvata
76 170 71 Renting of machinery and equipment w ithout operator and of personal and household goods
72 Kompjuterski i srodni aktivnosti 1 431 2 568 72 Computer and related activities73 Istra`uvawe i razvoj 481 622 73 Research and development74 Drugi delovni aktivnosti 9 393 12 423 74 Other business activities75 Javna uprava i odbrana; zadol`itelna
socijalna za{tita 22 015 24 152 75 Public administration and defence; compulsory
social security80 Obrazovanie 9 917 11 641 80 Education85 Zdravstvo i socijalna rabota 11 623 12 684 85 Health and social w ork90 Otstranuvawe na otpadoci i
|ubre,sanitarni i sli~ni aktivnosti 1 066 988 90 Sew age and refuse disposal, sanitation and
similar activities91 Dejnost na organizacii vrz baza na
za~lenuvawe 1 454 1 522 91 Activities of membership organizations n.e.c.
92 Rekreativni, sportski, kulturni i zabavni aktivnosti
3 430 6 371 92 Recreational, cultural and sporting activities
93 Drugi uslu`ni dejnosti 1 070 1 155 93 Other service activities99 Eksteritorijalni organizacii i tela - - 99 Extra-territorial organizations and bodies
19 628 21 287 Imputed rents- - Other net taxes on production
292 583 328 704 A. Value added
48 133 55 322
41 896 49 254
6 237 6 068
976 965
339 740 383 061
V. Minus: Subvencii na proizvodi
BRUTO-DOMA[EN PROIZVOD (A+B-V)
Imputirani stanarini
Drugi neto-danoci na proizvodstvo
A. Dodadena vrednost
B.Taxes on products
Value added tax and excisesImport duties
C. Minus: Subsidies on productsGROSS DOMESTIC PRODUCT (A+B-C)
B. Danoci na proizvodi
Danok na dodadena vrednost i akcizi
Carini i carinski dava~ki
GDP AT PREVIOUS YEAR PRICES BY ECONOMIC ACTIVITIES (continued)
Divi-sion
BRUTO-DOMA[EN PROIZVOD PO CENI OD PRETHODNATA GODINA, PO OBLASTI (prodol`enie)

69Statistical review 3.4.10.01/649
Table C 7
previous year=100
[ifra Naziv 2007 2008 Code Description
1 Hrana i bezalkoholni pijalaci 106.8 107.8 1 Food and non-alcoholic beverages
1.1 Hrana 107.3 107.1 1.1 Food
1.2 Bezalkoholni pijalaci 99.4 118.2 1.2 Non alcoholic beverages
2 Alkoholni pijalaci i tutun 103.2 110.2 2 Alcoholic beverages and tobacco
2.1 Alkoholni pijalaci 106.4 107.3 2.1 Alcoholic beverages
2.2 Tutun 101.5 111.7 2.2 Tobacco
3 Obleka i obuvki 103.7 114.0 3 Clothing and footwear
3.1 Obleka 105.2 118.1 3.1 Clothing
3.2 Obuvki 101.6 108.5 3.2 Footwear
4 Bruto-stanarina, voda, el. energija i dr.goriva
95.0 95.5 4 Housing, water, electricity, gas and other fuels
4.2 Imputirani stanarini 89.8 88.8 4.2 Imputed rentals for housing
4.3 Odr`uvawe i popravka na stanot 95.6 105.8 4.3 Maintenance and repair of the dwelling
4.4 Voda, |ubretarina i dr. uslugi vo vrska so stanot
108.3 106.7 4.4 Water supply and miscellaneous services relating to the dwelling
4.5 Elek. energija i dr. goriva 104.4 107.2 4.5 Electricity and other fuels
5 Mebel, aparati za doma}instva i dr. proizvodi i uslugi za odr`uvawe na stanot
113.1 117.9 5 Furnishings, household equipment and routine maintenance of the house
5.1 Mebel, tepisi, pokrivki za pod i odr`uvawe
119.0 120.8 5.1 Furniture, furnishings, carpets, and other floor coverings
5.2 Tekstil za doma}instvata 97.4 128.6 5.2 Household textiles
5.3 Aparati za doma}instvata i popravki 114.0 130.7 5.3 Household appliances
5.4 Sadovi i pribor za doma}instvata 93.7 119.0 5.4 Glassware, tableware and household utensils
5.5 Siten alat za doma}instvo i gradinarski alati
96.6 124.1 5.5 Tools and eqipment for house and garden
5.6 Proizvodi i uslugi za odr`uvawe na stanot
115.1 106.9 5.6 Goods and services for routine household maintenance
6 Zdravstvena za{tita 131.3 110.3 6 Health
6.1 Lekovi i pomagala 98.8 123.0 6.1 Medical products, appliances and equipment
6.2, 6.3 Zdravstveni uslugi (vo bolnici i nadvor od bolnici)
142.7 107.3 6.2, 6.3 Medical services
7 Soobra}aj 115.1 99.8 7 Transport
7.1 Soobra}ajni sredstva 133.7 115.9 7.1 Purchase of vehicles
7.2 Tro{oci za motorni goriva , popravki i odr`uvawe na patni~ki vozila
102.1 93.5 7.2 Operation of personal transport equipment
7.3 Soobra}ajni uslugi 114.5 89.6 7.3 Transport services
8 Komunikacii 115.7 122.6 8 Communications
8.1 Po{tenski uslugi 106.4 105.6 8.1 Postal services
8.2 Telefoni i telefaks oprema 101.2 115.2 8.2 Telephone and telefax equipment
8.3 Telefonski i telefaks uslugi 116.7 123.5 8.3 Telephone and telefax services
Tabela S 7
prethodna godina=100
TRO[OCI ZA FINALNA POTRO[UVA^KA NA DOMA]INSTVATA SPORED KLASIFIKACIJATA NA INDIVIDUALNATA POTRO[UVA^KA, PO NAMENA,
volumenski indeksi HOUSEHOLD FINAL CONSUMPTION EXPENDITURE BY THE CLASSIFICATION OF INDIVIDUAL
CONSUMPTION BY PURPOSE - COICOP, volume indices
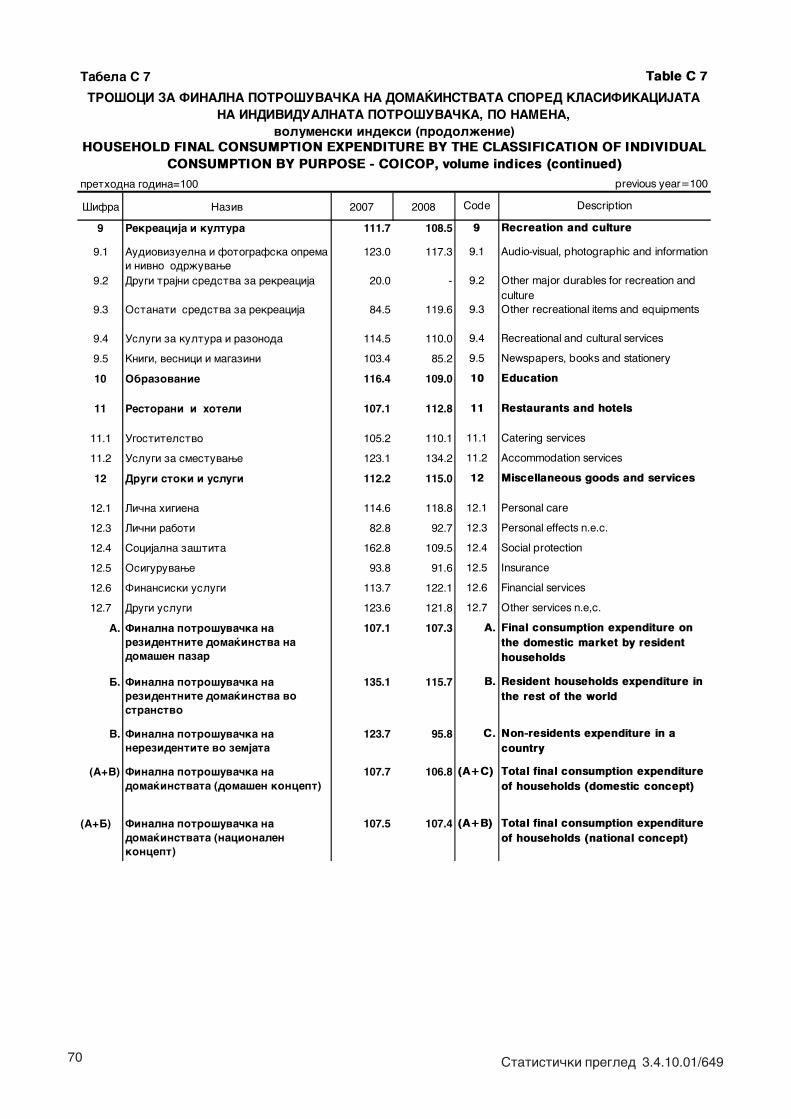
70 Statisti~ki pregled 3.4.10.01/649
Tabela S 7 Table C 7
previous year=100
[ifra Naziv 2007 2008 Code Description
9 Rekreacija i kultura 111.7 108.5 9 Recreation and culture
9.1 Audiovizuelna i fotografska oprema i nivno odr`uvawe
123.0 117.3 9.1 Audio-visual, photographic and information
9.2 Drugi trajni sredstva za rekreacija 20.0 - 9.2 Other major durables for recreation and culture
9.3 Ostanati sredstva za rekreacija 84.5 119.6 9.3 Other recreational items and equipments
9.4 Uslugi za kultura i razonoda 114.5 110.0 9.4 Recreational and cultural services
9.5 Knigi, vesnici i magazini 103.4 85.2 9.5 Newspapers, books and stationery
10 Obrazovanie 116.4 109.0 10 Education
11 Restorani i hoteli 107.1 112.8 11 Restaurants and hotels
11.1 Ugostitelstvo 105.2 110.1 11.1 Catering services
11.2 Uslugi za smestuvawe 123.1 134.2 11.2 Accommodation services
12 Drugi stoki i uslugi 112.2 115.0 12 Miscellaneous goods and services
12.1 Li~na higiena 114.6 118.8 12.1 Personal care
12.3 Li~ni raboti 82.8 92.7 12.3 Personal effects n.e.c.
12.4 Socijalna za{tita 162.8 109.5 12.4 Social protection
12.5 Osiguruvawe 93.8 91.6 12.5 Insurance
12.6 Finansiski uslugi 113.7 122.1 12.6 Financial services
12.7 Drugi uslugi 123.6 121.8 12.7 Other services n.e,c.
A. Finalna potro{uva~ka na rezidentnite doma}instva na doma{en pazar
107.1 107.3 A. Final consumption expenditure on the domestic market by resident households
B. Finalna potro{uva~ka na rezidentnite doma}instva vo stranstvo
135.1 115.7 B. Resident households expenditure in the rest of the world
V. Finalna potro{uva~ka na nerezidentite vo zemjata
123.7 95.8 C. Non-residents expenditure in a country
(A+V) Finalna potro{uva~ka na doma}instvata (doma{en koncept)
107.7 106.8 (A+C) Total final consumption expenditure of households (domestic concept)
(A+B) Finalna potro{uva~ka na doma}instvata (nacionalen koncept)
107.5 107.4 (A+B) Total final consumption expenditure of households (national concept)
TRO[OCI ZA FINALNA POTRO[UVA^KA NA DOMA]INSTVATA SPORED KLASIFIKACIJATA NA INDIVIDUALNATA POTRO[UVA^KA, PO NAMENA,
volumenski indeksi (prodol`enie)
prethodna godina=100
HOUSEHOLD FINAL CONSUMPTION EXPENDITURE BY THE CLASSIFICATION OF INDIVIDUAL CONSUMPTION BY PURPOSE - COICOP, volume indices (continued)
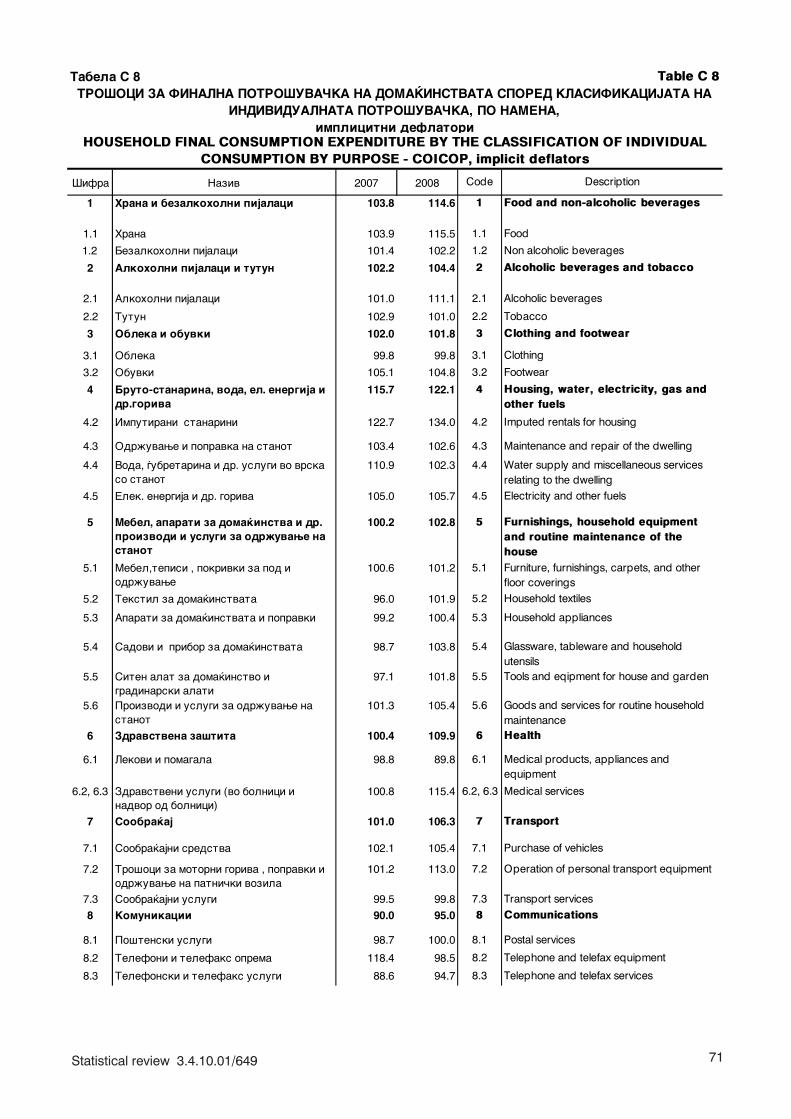
71Statistical review 3.4.10.01/649
Table C 8
[ifra Naziv 2007 2008 Code Description
1 Hrana i bezalkoholni pijalaci 103.8 114.6 1 Food and non-alcoholic beverages
1.1 Hrana 103.9 115.5 1.1 Food
1.2 Bezalkoholni pijalaci 101.4 102.2 1.2 Non alcoholic beverages
2 Alkoholni pijalaci i tutun 102.2 104.4 2 Alcoholic beverages and tobacco
2.1 Alkoholni pijalaci 101.0 111.1 2.1 Alcoholic beverages
2.2 Tutun 102.9 101.0 2.2 Tobacco
3 Obleka i obuvki 102.0 101.8 3 Clothing and footwear
3.1 Obleka 99.8 99.8 3.1 Clothing
3.2 Obuvki 105.1 104.8 3.2 Footwear
4 Bruto-stanarina, voda, el. energija i dr.goriva
115.7 122.1 4 Housing, water, electricity, gas and other fuels
4.2 Imputirani stanarini 122.7 134.0 4.2 Imputed rentals for housing
4.3 Odr`uvawe i popravka na stanot 103.4 102.6 4.3 Maintenance and repair of the dwelling
4.4 Voda, |ubretarina i dr. uslugi vo vrska so stanot
110.9 102.3 4.4 Water supply and miscellaneous services relating to the dwelling
4.5 Elek. energija i dr. goriva 105.0 105.7 4.5 Electricity and other fuels
5 Mebel, aparati za doma}instva i dr. proizvodi i uslugi za odr`uvawe na stanot
100.2 102.8 5 Furnishings, household equipment and routine maintenance of the house
5.1 Mebel,tepisi , pokrivki za pod i odr`uvawe
100.6 101.2 5.1 Furniture, furnishings, carpets, and other floor coverings
5.2 Tekstil za doma}instvata 96.0 101.9 5.2 Household textiles
5.3 Aparati za doma}instvata i popravki 99.2 100.4 5.3 Household appliances
5.4 Sadovi i pribor za doma}instvata 98.7 103.8 5.4 Glassware, tableware and household utensils
5.5 Siten alat za doma}instvo i gradinarski alati
97.1 101.8 5.5 Tools and eqipment for house and garden
5.6 Proizvodi i uslugi za odr`uvawe na stanot
101.3 105.4 5.6 Goods and services for routine household maintenance
6 Zdravstvena za{tita 100.4 109.9 6 Health
6.1 Lekovi i pomagala 98.8 89.8 6.1 Medical products, appliances and equipment
6.2, 6.3 Zdravstveni uslugi (vo bolnici i nadvor od bolnici)
100.8 115.4 6.2, 6.3 Medical services
7 Soobra}aj 101.0 106.3 7 Transport
7.1 Soobra}ajni sredstva 102.1 105.4 7.1 Purchase of vehicles
7.2 Tro{oci za motorni goriva , popravki i odr`uvawe na patni~ki vozila
101.2 113.0 7.2 Operation of personal transport equipment
7.3 Soobra}ajni uslugi 99.5 99.8 7.3 Transport services
8 Komunikacii 90.0 95.0 8 Communications
8.1 Po{tenski uslugi 98.7 100.0 8.1 Postal services
8.2 Telefoni i telefaks oprema 118.4 98.5 8.2 Telephone and telefax equipment
8.3 Telefonski i telefaks uslugi 88.6 94.7 8.3 Telephone and telefax services
Tabela S 8TRO[OCI ZA FINALNA POTRO[UVA^KA NA DOMA]INSTVATA SPORED KLASIFIKACIJATA NA
INDIVIDUALNATA POTRO[UVA^KA, PO NAMENA, implicitni deflatori
HOUSEHOLD FINAL CONSUMPTION EXPENDITURE BY THE CLASSIFICATION OF INDIVIDUAL CONSUMPTION BY PURPOSE - COICOP, implicit deflators
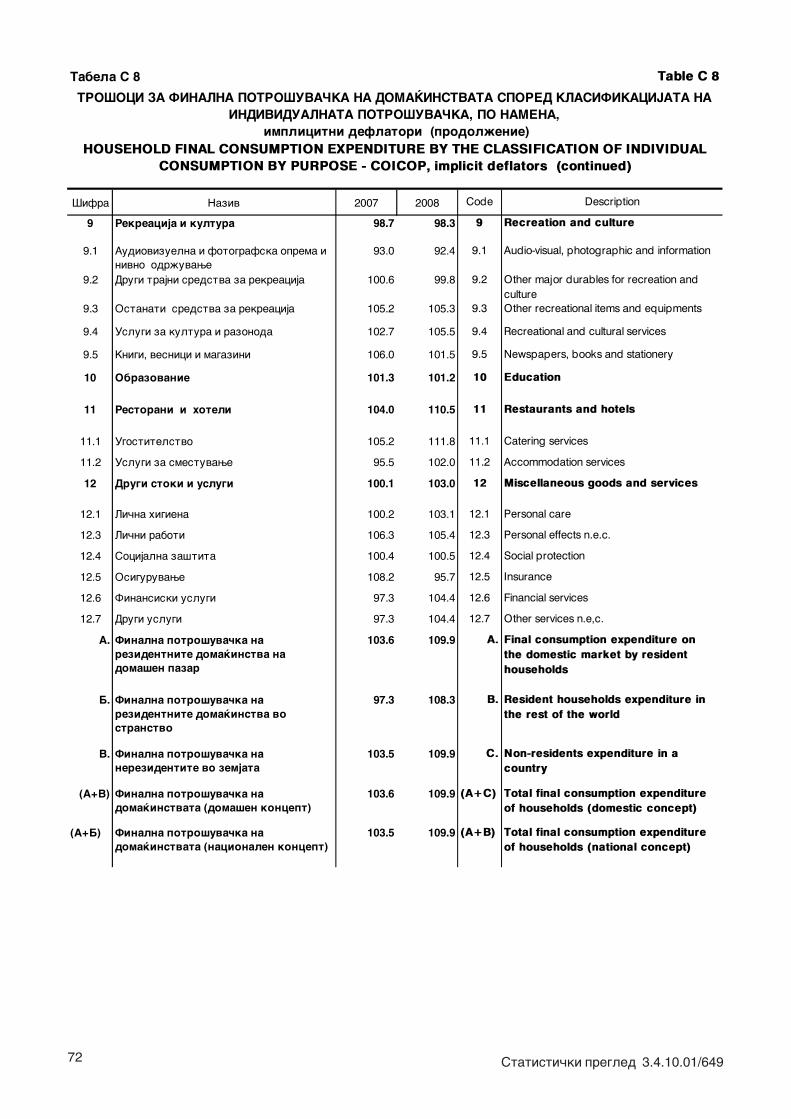
72 Statisti~ki pregled 3.4.10.01/649
Tabela S 8 Table C 8
[ifra Naziv 2007 2008 Code Description
9 Rekreacija i kultura 98.7 98.3 9 Recreation and culture
9.1 Audiovizuelna i fotografska oprema i nivno odr`uvawe
93.0 92.4 9.1 Audio-visual, photographic and information
9.2 Drugi trajni sredstva za rekreacija 100.6 99.8 9.2 Other major durables for recreation and culture
9.3 Ostanati sredstva za rekreacija 105.2 105.3 9.3 Other recreational items and equipments
9.4 Uslugi za kultura i razonoda 102.7 105.5 9.4 Recreational and cultural services
9.5 Knigi, vesnici i magazini 106.0 101.5 9.5 Newspapers, books and stationery
10 Obrazovanie 101.3 101.2 10 Education
11 Restorani i hoteli 104.0 110.5 11 Restaurants and hotels
11.1 Ugostitelstvo 105.2 111.8 11.1 Catering services
11.2 Uslugi za smestuvawe 95.5 102.0 11.2 Accommodation services
12 Drugi stoki i uslugi 100.1 103.0 12 Miscellaneous goods and services
12.1 Li~na higiena 100.2 103.1 12.1 Personal care
12.3 Li~ni raboti 106.3 105.4 12.3 Personal effects n.e.c.
12.4 Socijalna za{tita 100.4 100.5 12.4 Social protection
12.5 Osiguruvawe 108.2 95.7 12.5 Insurance
12.6 Finansiski uslugi 97.3 104.4 12.6 Financial services
12.7 Drugi uslugi 97.3 104.4 12.7 Other services n.e,c.
A. Finalna potro{uva~ka na rezidentnite doma}instva na doma{en pazar
103.6 109.9 A. Final consumption expenditure on the domestic market by resident households
B. Finalna potro{uva~ka na rezidentnite doma}instva vo stranstvo
97.3 108.3 B. Resident households expenditure in the rest of the world
V. Finalna potro{uva~ka na nerezidentite vo zemjata
103.5 109.9 C. Non-residents expenditure in a country
(A+V) Finalna potro{uva~ka na doma}instvata (doma{en koncept)
103.6 109.9 (A+C) Total final consumption expenditure of households (domestic concept)
(A+B) Finalna potro{uva~ka na doma}instvata (nacionalen koncept)
103.5 109.9 (A+B) Total final consumption expenditure of households (national concept)
HOUSEHOLD FINAL CONSUMPTION EXPENDITURE BY THE CLASSIFICATION OF INDIVIDUAL CONSUMPTION BY PURPOSE - COICOP, implicit deflators (continued)
TRO[OCI ZA FINALNA POTRO[UVA^KA NA DOMA]INSTVATA SPORED KLASIFIKACIJATA NA INDIVIDUALNATA POTRO[UVA^KA, PO NAMENA,
implicitni deflatori (prodol`enie)
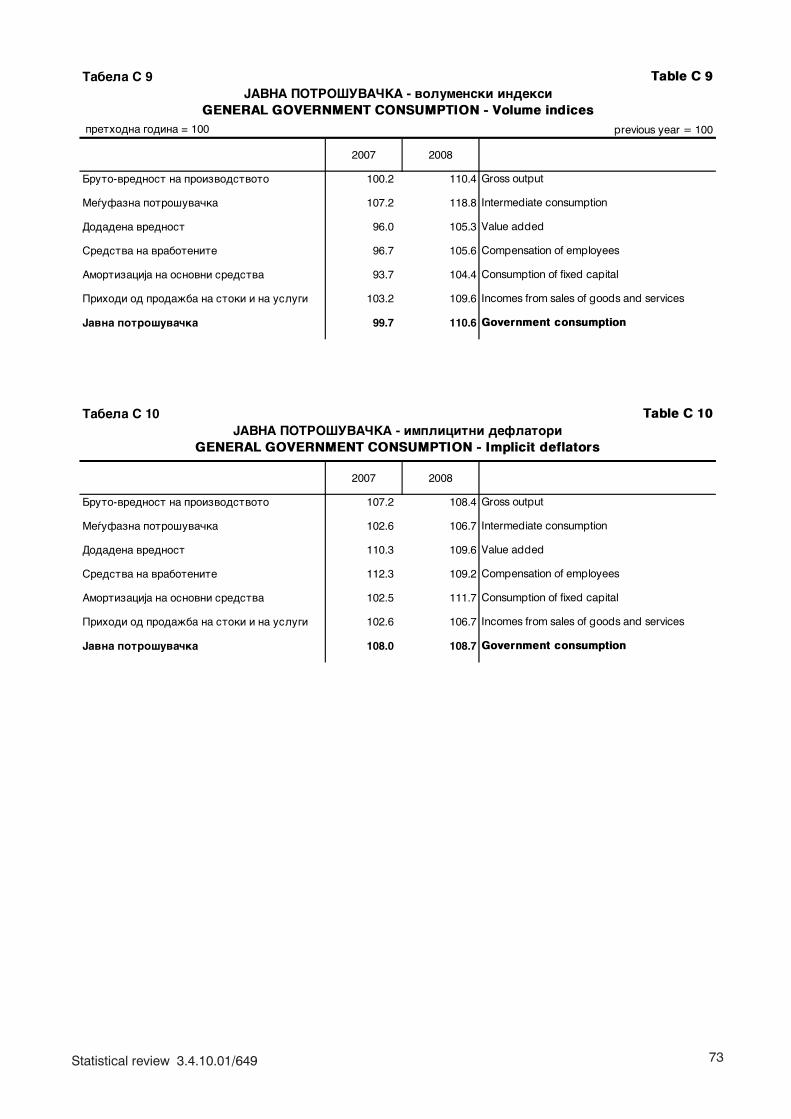
73Statistical review 3.4.10.01/649
Tabela S 9 Table C 9
prethodna godina = 100 previous year = 100
2007 2008
Bruto-vrednost na proizvodstvoto 100.2 110.4 Gross output
Me|ufazna potro{uva~ka 107.2 118.8 Intermediate consumption
Dodadena vrednost 96.0 105.3 Value added
Sredstva na vrabotenite 96.7 105.6 Compensation of employees
Amortizacija na osnovni sredstva 93.7 104.4 Consumption of fixed capital
Prihodi od proda`ba na stoki i na uslugi 103.2 109.6 Incomes from sales of goods and services
Javna potro{uva~ka 99.7 110.6 Government consumption
Tabela S 10 Table C 10
2007 2008
Bruto-vrednost na proizvodstvoto 107.2 108.4 Gross output
Me|ufazna potro{uva~ka 102.6 106.7 Intermediate consumption
Dodadena vrednost 110.3 109.6 Value added
Sredstva na vrabotenite 112.3 109.2 Compensation of employees
Amortizacija na osnovni sredstva 102.5 111.7 Consumption of fixed capital
Prihodi od proda`ba na stoki i na uslugi 102.6 106.7 Incomes from sales of goods and services
Javna potro{uva~ka 108.0 108.7 Government consumption
JAVNA POTRO[UVA^KA - volumenski indeksiGENERAL GOVERNMENT CONSUMPTION - Volume indices
JAVNA POTRO[UVA^KA - implicitni deflatoriGENERAL GOVERNMENT CONSUMPTION - Implicit deflators
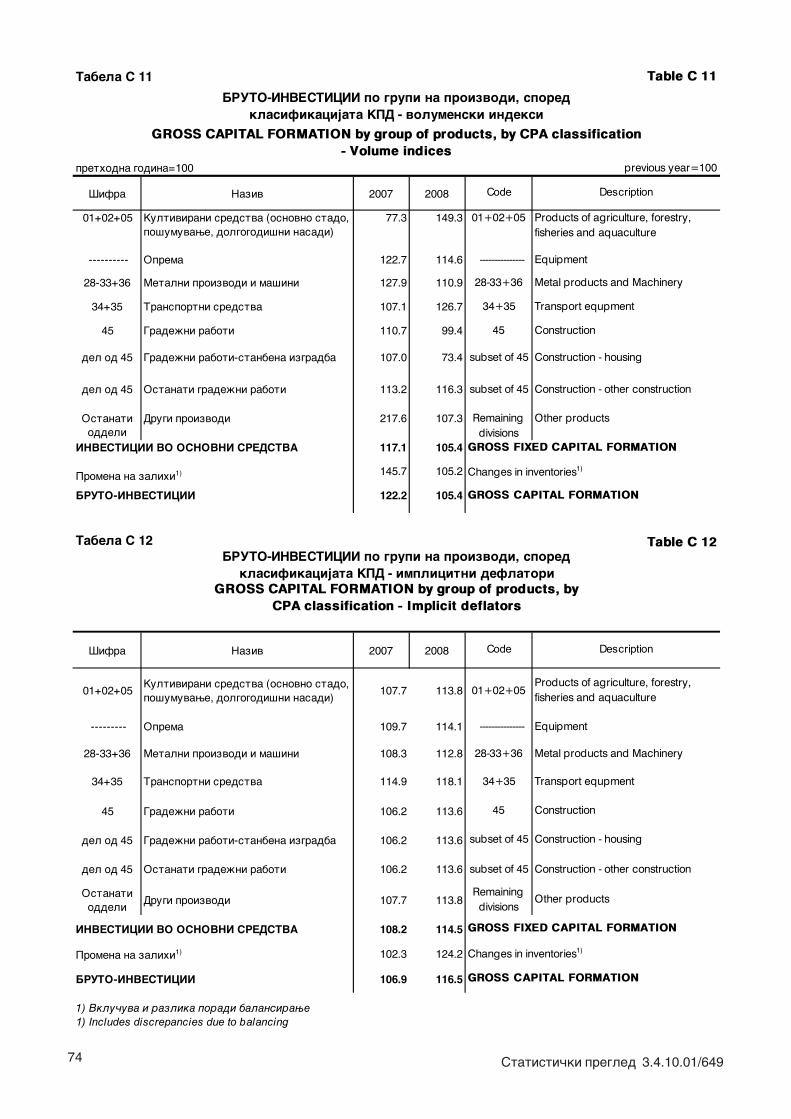
74 Statisti~ki pregled 3.4.10.01/649
Tabela S 11 Table C 11
prethodna godina=100 previous year=100
[ifra Naziv 2007 2008 Code Description
01+02+05 Kultivirani sredstva (osnovno stado, po{umuvawe, dolgogodi{ni nasadi)
77.3 149.3 01+02+05 Products of agriculture, forestry, fisheries and aquaculture
---------- Oprema 122.7 114.6 --------------- Equipment
28-33+36 Metalni proizvodi i ma{ini 127.9 110.9 28-33+36 Metal products and Machinery
34+35 Transportni sredstva 107.1 126.7 34+35 Transport equpment
45 Grade`ni raboti 110.7 99.4 45 Construction
del od 45 Grade`ni raboti-stanbena izgradba 107.0 73.4 subset of 45 Construction - housing
del od 45 Ostanati grade`ni raboti 113.2 116.3 subset of 45 Construction - other construction
Ostanati oddeli
Drugi proizvodi 217.6 107.3 Remaining divisions
Other products
INVESTICII VO OSNOVNI SREDSTVA 117.1 105.4 GROSS FIXED CAPITAL FORMATION
Promena na zalihi1) 145.7 105.2 Changes in inventories1)
122.2 105.4 GROSS CAPITAL FORMATION
Tabela S 12 Table C 12
[ifra Naziv 2007 2008 Code Description
01+02+05Kultivirani sredstva (osnovno stado, po{umuvawe, dolgogodi{ni nasadi)
107.7 113.8 01+02+05Products of agriculture, forestry, fisheries and aquaculture
--------- Oprema 109.7 114.1 --------------- Equipment
28-33+36 Metalni proizvodi i ma{ini 108.3 112.8 28-33+36 Metal products and Machinery
34+35 Transportni sredstva 114.9 118.1 34+35 Transport equpment
45 Grade`ni raboti 106.2 113.6 45 Construction
del od 45 Grade`ni raboti-stanbena izgradba 106.2 113.6 subset of 45 Construction - housing
del od 45 Ostanati grade`ni raboti 106.2 113.6 subset of 45 Construction - other construction
Ostanati oddeli
Drugi proizvodi 107.7 113.8Remaining
divisionsOther products
INVESTICII VO OSNOVNI SREDSTVA 108.2 114.5
Promena na zalihi1) 102.3 124.2
BRUTO-INVESTICII 106.9 116.5
1) Vklu~uva i razlika poradi balansirawe1) Includes discrepancies due to balancing
BRUTO-INVESTICII po grupi na proizvodi, spored klasifikacijata KPD - volumenski indeksi
GROSS CAPITAL FORMATION by group of products, by CPA classification - Volume indices
BRUTO-INVESTICII
BRUTO-INVESTICII po grupi na proizvodi, spored klasifikacijata KPD - implicitni deflatori
GROSS CAPITAL FORMATION by group of products, by CPA classification - Implicit deflators
GROSS FIXED CAPITAL FORMATION
Changes in inventories1)
GROSS CAPITAL FORMATION
75Statistical review 3.4.10.01/649
SERIJA E - Postignuvawe na seopfatnost na BDP
SERIES E - Achieving the exhaustiveness of GDP

76 Statisti~ki pregled 3.4.10.01/649
Tabela E1
vo milioni denari
Н1 Н2 Н3 Н4 Н5 Н6 Н7
N1 N2 N3 N4 N5 N6 N7
a 1 2 3 4 5 6 7Нефинансиски претпријатија - - - - 35 037 -
Финансиски претпријатија - - - - - -
Држава - - - - - 8 413
Домаќинства 4 933 7 977 - 1 463 - 215 -
Непрофитни институции кои им служат на домаќинствата
- - - - - -
Zemjodelstvo, lov i {umarstvo 1 102 29 - - - 384 -
Ribarstvo 0 - - - 18 -
Rudarstvo i vadewe na kamen - - - - 116 -
Prerabotuva~ka industrija 808 307 - - 7 747 -
Snabduvawe so elektri~na energija, gas i voda
- 0 - - - 80 -
Grade`ni{tvo 165 6 614 - - 4 678 -
Trgovija na golemo i trgovija na malo; popravka na motorni vozila, motocikli i predmeti za li~na upotreba i za doma}instvata
300 341 - - 16 495 -
Hoteli i restorani 430 235 - - 983 -
Soobra}aj, skladirawe i vrski 1 301 18 - - 3 875 0
Finansisko posreduvawe 0 - - - - 65 -
Aktivnosti vo vrska so nedvi`en imot, iznajmuvawe i delovni aktivnosti
357 11 - 1 463 0 256
Javna uprava i odbrana; zadol`itelna socijalna za{tita
- - - - 540 4 016
Obrazovanie 4 - - - 584 979
Zdravstvo i socijalna rabota 75 - - - 37 2 461
Drugi komunalni, kulturni, op{ti i li~ni uslu`ni aktivnosti
389 422 - - 278 700
ВКУПНО 4 933 7 977 - 1 463 34 822 8 413
% од vkupnata корекција 8.6 13.8 - 2.5 60.4 14.6
1) НОЕ, Неопфатена економија1) NOE, Non observed economy
КОРЕКЦИЈА НА ДОДАДЕНАТА
Корекција на бруто-додаденатa вредност по типови
SUMMARY OF GVA ADJUSTMENTS
Сектори/НКД Групи
Summary of GVA Adjustments by types
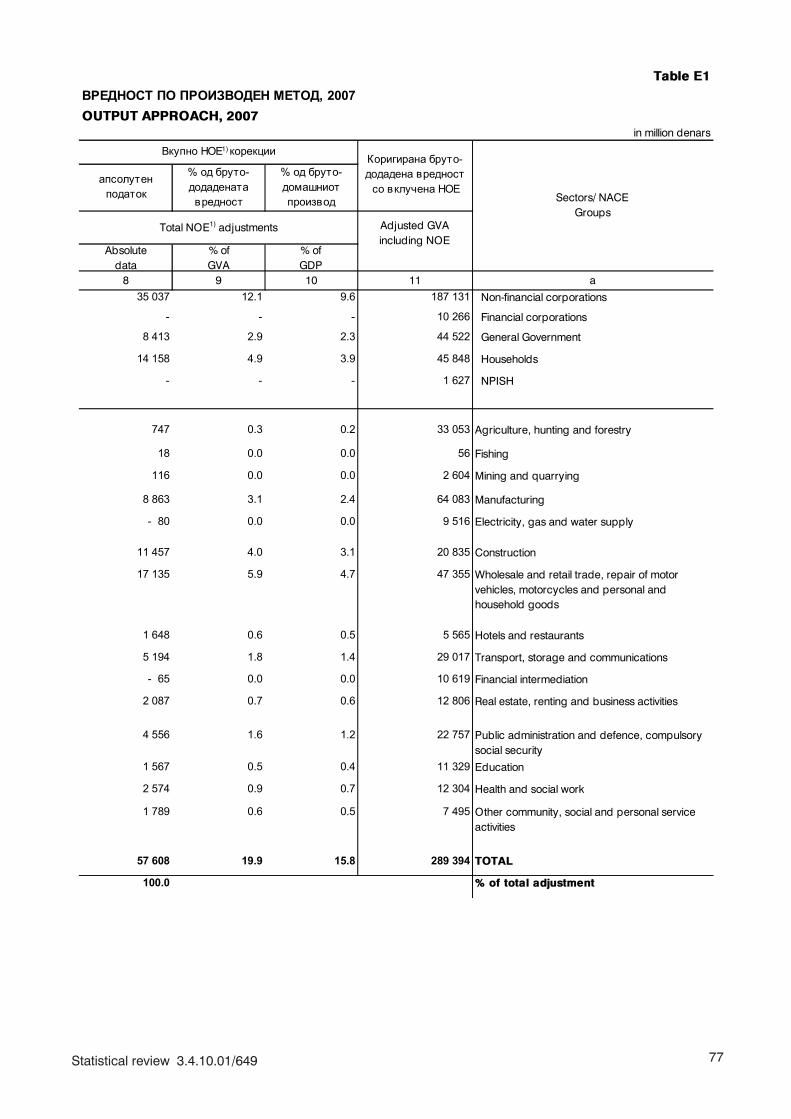
77Statistical review 3.4.10.01/649
Table E1
in million denars
aпсолутен податок
% од бруто-додаденатa вредност
% од бруто-домашниот производ
Absolutedata
% ofGVA
% ofGDP
8 9 10 11 a 35 037 12.1 9.6 187 131 Non-financial corporations
- - - 10 266 Financial corporations
8 413 2.9 2.3 44 522 General Government
14 158 4.9 3.9 45 848 Households
- - - 1 627 NPISH
747 0.3 0.2 33 053 Agriculture, hunting and forestry
18 0.0 0.0 56 Fishing
116 0.0 0.0 2 604 Mining and quarrying
8 863 3.1 2.4 64 083 Manufacturing
- 80 0.0 0.0 9 516 Electricity, gas and water supply
11 457 4.0 3.1 20 835 Construction
17 135 5.9 4.7 47 355 Wholesale and retail trade, repair of motor vehicles, motorcycles and personal and household goods
1 648 0.6 0.5 5 565 Hotels and restaurants
5 194 1.8 1.4 29 017 Transport, storage and communications
- 65 0.0 0.0 10 619 Financial intermediation
2 087 0.7 0.6 12 806 Real estate, renting and business activities
4 556 1.6 1.2 22 757 Public administration and defence, compulsory social security
1 567 0.5 0.4 11 329 Education
2 574 0.9 0.7 12 304 Health and social work
1 789 0.6 0.5 7 495 Other community, social and personal service activities
57 608 19.9 15.8 289 394 TOTAL
100.0 % of total adjustment
Total NOE1) adjustments
Коригирана бруто-додадена вредност со вклучена НОЕ
ВРЕДНОСТ ПО ПРОИЗВОДЕН МЕТОД, 2007
Sectors/ NACE Groups
Вкупно НОЕ1) корекции
OUTPUT APPROACH, 2007
Adjusted GVA including NOE
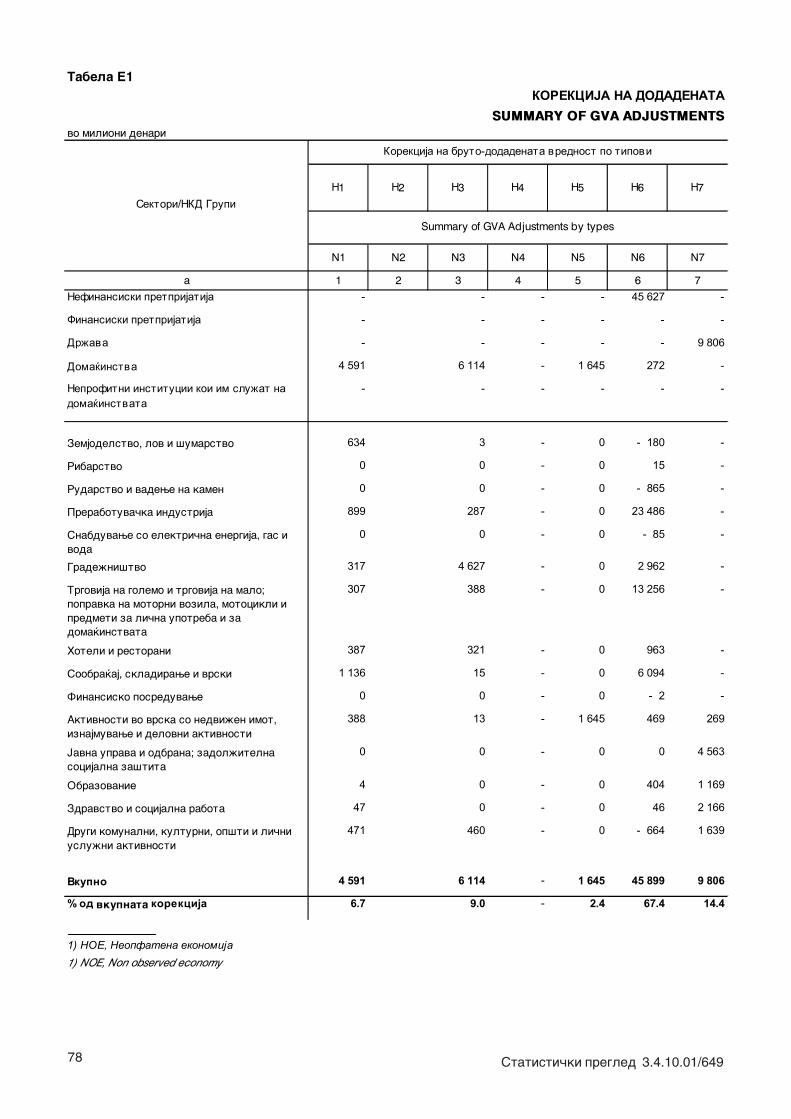
78 Statisti~ki pregled 3.4.10.01/649
Tabela E1
vo milioni denari
Н1 Н2 Н3 Н4 Н5 Н6 Н7
N1 N2 N3 N4 N5 N6 N7
a 1 2 3 4 5 6 7Нефинансиски претпријатија - - - - 45 627 -
Финансиски претпријатија - - - - - -
Држава - - - - - 9 806
Домаќинства 4 591 6 114 - 1 645 272 -
Непрофитни институции кои им служат на домаќинствата
- - - - - -
Zemjodelstvo, lov i {umarstvo 634 3 - 0 - 180 -
Ribarstvo 0 0 - 0 15 -
Rudarstvo i vadewe na kamen 0 0 - 0 - 865 -
Prerabotuva~ka industrija 899 287 - 0 23 486 -
Snabduvawe so elektri~na energija, gas i voda
0 0 - 0 - 85 -
Grade`ni{tvo 317 4 627 - 0 2 962 -
Trgovija na golemo i trgovija na malo; popravka na motorni vozila, motocikli i predmeti za li~na upotreba i za doma}instvata
307 388 - 0 13 256 -
Hoteli i restorani 387 321 - 0 963 -
Soobra}aj, skladirawe i vrski 1 136 15 - 0 6 094 -
Finansisko posreduvawe 0 0 - 0 - 2 -
Aktivnosti vo vrska so nedvi`en imot, iznajmuvawe i delovni aktivnosti
388 13 - 1 645 469 269
Javna uprava i odbrana; zadol`itelna socijalna za{tita
0 0 - 0 0 4 563
Obrazovanie 4 0 - 0 404 1 169
Zdravstvo i socijalna rabota 47 0 - 0 46 2 166
Drugi komunalni, kulturni, op{ti i li~ni uslu`ni aktivnosti
471 460 - 0 - 664 1 639
Вкупно 4 591 6 114 - 1 645 45 899 9 806
% од vkupnata корекција 6.7 9.0 - 2.4 67.4 14.4
1) НОЕ, Неопфатена економија1) NOE, Non observed economy
Summary of GVA Adjustments by types
Сектори/НКД Групи
Корекција на бруто-додаденатa вредност по типови
КОРЕКЦИЈА НА ДОДАДЕНАТА SUMMARY OF GVA ADJUSTMENTS
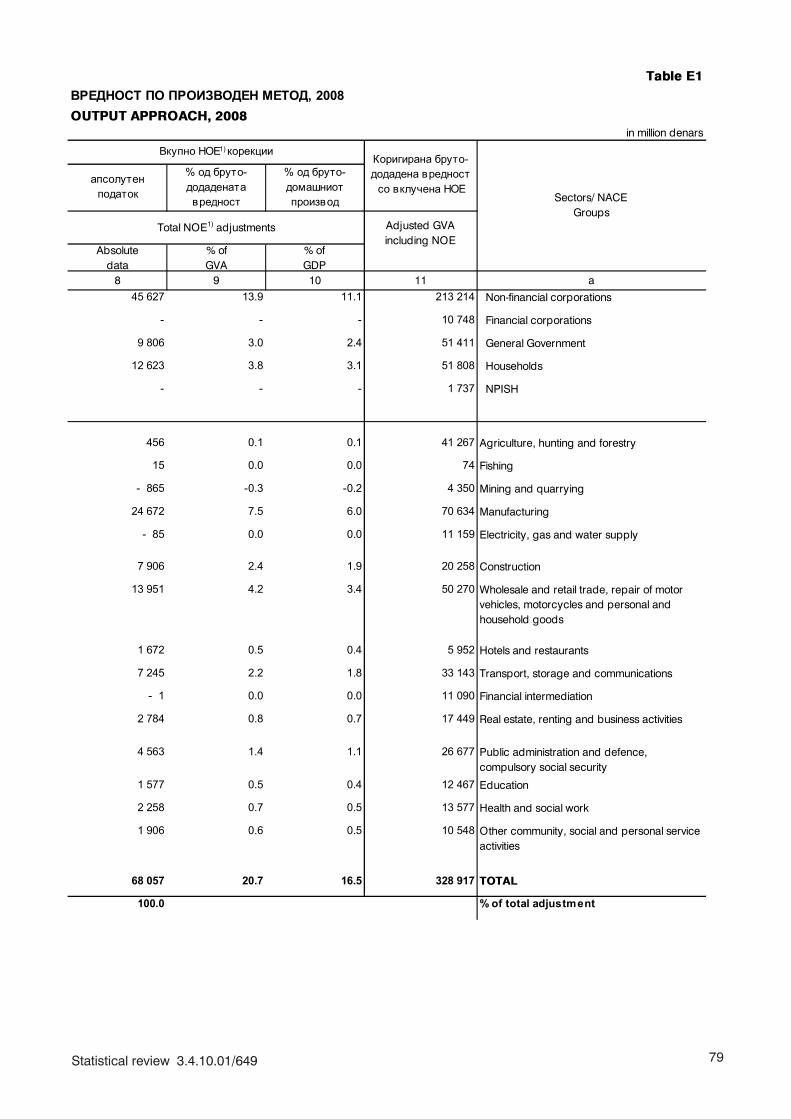
79Statistical review 3.4.10.01/649
Table E1
in million denars
aпсолутен податок
% од бруто-додаденатa вредност
% од бруто-домашниот производ
Absolutedata
% ofGVA
% ofGDP
8 9 10 11 a 45 627 13.9 11.1 213 214 Non-financial corporations
- - - 10 748 Financial corporations
9 806 3.0 2.4 51 411 General Government
12 623 3.8 3.1 51 808 Households
- - - 1 737 NPISH
456 0.1 0.1 41 267 Agriculture, hunting and forestry
15 0.0 0.0 74 Fishing
- 865 -0.3 -0.2 4 350 Mining and quarrying
24 672 7.5 6.0 70 634 Manufacturing
- 85 0.0 0.0 11 159 Electricity, gas and water supply
7 906 2.4 1.9 20 258 Construction
13 951 4.2 3.4 50 270 Wholesale and retail trade, repair of motor vehicles, motorcycles and personal and household goods
1 672 0.5 0.4 5 952 Hotels and restaurants
7 245 2.2 1.8 33 143 Transport, storage and communications
- 1 0.0 0.0 11 090 Financial intermediation
2 784 0.8 0.7 17 449 Real estate, renting and business activities
4 563 1.4 1.1 26 677 Public administration and defence, compulsory social security
1 577 0.5 0.4 12 467 Education
2 258 0.7 0.5 13 577 Health and social work
1 906 0.6 0.5 10 548 Other community, social and personal service activities
68 057 20.7 16.5 328 917 TOTAL
100.0 % of total adjustment
Sectors/ NACE Groups
Total NOE1) adjustments Adjusted GVA including NOE
Вкупно НОЕ1) корекцииКоригирана бруто-додадена вредност со вклучена НОЕ
ВРЕДНОСТ ПО ПРОИЗВОДЕН МЕТОД, 2008OUTPUT APPROACH, 2008
Redakciona komisija:
m-r Mira Todorova (pretsedatel)m-r Verka Panova - Grozdanovska (zamenik na pretsedatelot)Mirjana Bo{wakLidija KralevskaDijana Krstevska (sekretar)
Editorial board:
M.Sc Mira Todorova (president)M.Sc Verka Panova - Grozdanovska (Vice president)Mirjana BoshnjakLidija KralevskaDijana Krstevska (secretary)
Lektor na makedonski jazik: Jasmina \or|ieva
Language Editor for the Macedonian Language: Jasmina Gjorgieva
Lektor na angliski jazik: Milan Vasilev
Language Editor for the English Language: Milan Vasilev
Tehni~ki urednik: Quben IlievskiTechnical Editor: Ljuben Ilievski
Statisti~ki pregled: Nacionalna ekonomija i finansii - ISSN 1409-7036:
Bruto - doma{en proizvod, 2008 godina - ISBN 978-9989-197-92-5
Statistical review: National Economy and Finances - ISSN 1409-7036:
Gross domestic product, 2008 - ISBN 978-9989-197-92-5
Izleguva edna{ godi{noAnnual review
Tira`/Number of copies printed: 60
Stranici/Pages: 80
Pe~ateno vo: Pe~atnicata na Slu`bata za op{ti i zaedni~ki raboti pri Vladata na Republika Makedonija
Printed In the Printing House of the Agency for Common and General Affairsof the Government of the Republic of Macedonia